Genetics & mutations (every thing about DNA & Genes &Mutations )

IAEA-TECDOC-1010
Application ofDNA based marker mutations
for improvement of cereals andother sexually reproduced crop plants
Proceedings of a final Research Co-ordination Meetingorganized by the
Joint FAO/IAEA Division of Nuclear Techniques in Food and Agricultureand held in Vienna, 4-8 November 1996
INTERNATIONAL ATOMIC ENERGY AGENCY

The IAEA does not normally maintain stocks of reports in this series.However, microfiche copies of these reports can be obtained from
IN IS ClearinghouseInternational Atomic Energy AgencyWagramerstrasse 5P.O. Box 100A-1400 Vienna, Austria
Orders should be accompanied by prepayment of Austrian Schillings 100,-in the form of a cheque or in the form of IAEA microfiche service couponswhich may be ordered separately from the INIS Clearinghouse.
The originating Section of this publication in the IAEA was:
Plant Breeding and Genetics SectionJoint FAO/IAEA Division
International Atomic Energy AgencyWagramer Strasse 5
P.O. Box 100A-1400 Vienna, Austria
APPLICATION OF DNA BASED MARKER MUTATIONS FOR IMPROVEMENT OFCEREALS AND OTHER SEXUALLY REPRODUCED CROP PLANTS
IAEA, VIENNA, 1998IAEA-TECDOC-1010
ISSN 1011-4289
©IAEA, 1998
Printed by the IAEA in AustriaMarch 1998

FOREWORD
Since the beginning of crop domestication, visual markers have played a role in plantselection for improved yield, adaptation and quality. However, the number of such markersis limited and they are based on phenotype and not genotype which often makes visualmarker-based selection difficult. Fifteen years ago a new set of markers was developed which,for the first time, allowed the practical detection of genetic variation in the DNA, themolecule carrying the genetic information. These molecular markers offered the opportunityto analyse the genetic basis of changes in plants caused by induced mutations, whetherthrough ionizing radiation or chemicals. Perhaps the greatest potential for application of thesenew markers may be in the developing countries, for local and under-investigated crops withlittle genetic information.
The Co-ordinated Research Programme (CRP) on the Application of DNA BasedMarker Mutations for Improvement of Cereals and Other Sexually Reproduced Crop Plantsrepresents the first of three CRPs dealing with the application of molecular markers tomutations and plant breeding and was implemented between 1992 and 1996. A secondcompanion CRP entitled Use of Novel DNA Fingerprinting Techniques for the Detection andCharacterization of Genetic Variation in Vegetatively Propagated Crops devoted to theapplication of molecular markers in vegetatively propagated crops species was implementedbetween 1993 and 1997. One positive consequence of these two CRPs has been theimplementation of a third CRP entitled Radioactively Labeled DNA Probes for CropImprovement, which began in 1995 and aims to provide enabling technologies, in the formof probes and primers, to laboratories in developing countries. The rapid development ofmolecular marker technologies has also resulted in a dramatic increase in requests fromdeveloping Member States for technical co-operation projects utilizing molecular markers toimprove local varieties for biotic and abiotic stresses and other traits of relevance. With theintensified use of induced mutations in genetic studies, it will be important to continue theimportant work of understanding induced mutations at the molecular level.
Evidence of the progress made in implementing molecular marker technologies inlaboratories around the world is presented in this publication, which contains the resultspresented by the participants at the fourth and final Research Co-ordination Meeting of theCRP held in Vienna, 4-8 November 1996. The FAO and the IAEA wish to express theirsincere appreciation to the participants of the meeting for their work during the project periodresulting in the summary and scientific reports presented in this publication.
The officers responsible for this publication are E. Week and A. Ashri of the JointFAO/IAEA Division of Nuclear Techniques in Food and Agriculture.

EDITORIAL NOTE
In preparing this publication for press, staff of the IAEA have made up the pages from theoriginal manuscripts as submitted by the authors. The views expressed do not necessarily reflect thoseof the IAEA, the governments of the nominating Member States or the nominating organizations.
Throughout the text names of Member States are retained as they were when the text wascompiled.
The use of particular designations of countries or territories does not imply any judgementby the publisher, the IAEA, as to the legal status of such countries or territories, of their authoritiesand institutions or of the delimitation of their boundaries.
The mention of names of specific companies or products (whether or not indicated asregistered) does not imply any intention to infringe proprietary rights, nor should it be construed asan endorsement or recommendation on the part of the IAEA.
The authors are responsible for having obtained the necessary permission for the IAEA toreproduce, translate or use material from sources already protected by copyrights.

CONTENTS
Summary of the Co-ordinated Research Programme . . . . . . . . . . . . . . . . . . . . . . . . 1
Investigation of the somaclonal and mutagen induced variability in barley by theapplication of protein and DNA markers . . . . . . . . . . . . . . . . . . . . . . . . . . . . . 21A. Atanassov, E. Todorovska, A. Trifonova, M. Petrova, E. Marinova,M. Gramatikova, D. Valcheva, S. Zaprianov, N. Mersinkov
Searching for RPLP markers to identify genes for aluminum tolerance in maize . . . . . 33E. Paiva, M.A. Lopes, S.N. Parentoni, P.R. Martins, G.A. Torres
Determination of molecular markers associated with anthesis-silking intervalin maize . . . . . . . . . . . . . . . . . . . . . . . . . . . . . . . . . . . . . . . . . . . . . . . . . . . 41/ Simpson
Incorporation of conventional genetic markers and RAPD markers into an RFLPbased map in maize . . . . . . . . . . . . . . . . . . . . . . . . . . . . . . . . . . . . . . . . . . . 47E.H. Coe, Jr., M.D. McMullen, M. Polacco, G.L. Davis, S. Chao
Tagging of blast resistance gene(s) to DNA markers and marker-assisted selection (MAS)in rice improvement . . . . . . . . . . . . . . . . . . . . . . . . . . . . . . . . . . . . . . . . . . . 55J.Y. Zhuang, J. Lu, H.R. Qian, H.X. Lin, K.L. Zheng
RAPD tagging of a salt tolerance gene in rice . . . . . . . . . . . . . . . . . . . . . . . . . . . . 63H. Ding, G. Zhang, Y. Quo, S. Chen, S. Chen
Rice genome mapping and its application in rice genetics and breeding . . . . . . . . . . 67M.Y. Eun, Y.G. Cho, J.H. Hahn, U.K. Yoon, B.Y. Yi, T.Y. Chung
Detection of genetic variability in basmati and non-basmati rice varieties andtheir radiation induced mutants through Random Amplified PolymorphicDNA (RAPD) . . . . . . . . . . . . . . . . . . . . . . . . . . . . . . . . . . . . . . . . . . . . . . . 85S. Farooq, N. Iqbal, M. Arif
Application of DNA RFLP procedures in interspecific gene transfer: The Lrl9translocation of wheat . . . . . . . . . . . . . . . . . . . . . . . . . . . . . . . . . . . . . . . . . . 97R. Prins, G.F. Marais, A.S. Marais, Z.A. Pretorius, B.J.H. Janse
Microsatellites in wheat and their applications . . . . . . . . . . . . . . . . . . . . . . . . . . . . 103P. Stephenson, G.J. Bryan, J. Kirby, M.D. Gale
Advances in sorghum genetic mapping with implications for sorghum improvement . . 1 1 1M. Lee
Comparative genome analysis and resistance gene mapping in grain legumes . . . . . . . 119N.D. Young
List of Participants . . . . . . . . . . . . . . . . . . . . . . . . . . . . . . . . . . . . . . . . . . . . . . . 125

SUMMARY OF THE CO-ORDINATED RESEARCH PROGRAMME
1. BACKGROUND
The use of genetic markers to enhance the efficiency of crop improvement, by bothconventional and mutation breeding, has long been recognized. In the early nineties, molecularmarker-mediated systems were in use in a few of the more advanced wheat, barley, maize andrice breeding programmes and were proving very useful. Therefore, it was deemed veryimportant to expand the use of these marker systems to include developing countries and theircrops. In fact, it was expected that the impact of marker assisted selection would be greaterin less advanced breeding programmes. In order to achieve this impact, it was clear that itwould be necessary to transfer technology from the most advanced laboratories to laboratoriesin developing countries using induced mutations in their breeding programmes. For thisreason, in 1992, a CRP entitled The Application of DNA Based Marker Mutations forImprovement of Cereals and Other Sexually Reproduced Crop Plants was initiated.
At the inception of this CRP, DNA-based genetic maps had been developed for arange of crop plant species. These maps were mainly based on restriction fragment lengthpolymorphism (RFLP) markers. By the time the CRP was implemented, newer markersystems based on the polymerase chain reaction (PCR), including randomly amplifiedpolymorphic DNA (RAPD) markers, were also becoming available. Since this time, additionalmarker systems have been developed and have been incorporated into the research of thisCRP. This is evidenced in this summary and the reports which follow.
Independent of the specific system selected for application in plant breeding, molecularmarkers provide a host of new opportunities for improving breeding efficiency. Specificapplications include analysis of breeding systems, screening of segregating populations, purityassessment, genetic distance measurements between potential parent varieties, and improvedefficiency of backcross programmes. Levels of heterozygosity can be accurately measuredand employed for optimizing Fl hybrid programmes. Knowledge of marker linkages facilitatesthe efficient introgression of chromosome segments carrying economically important allelesfrom wild relatives to cultivated crops. The development of detailed genetic maps also allowsmarker assisted juvenile selection, analysis and selection for genetic regions responsible forquantitative traits, and the possibility of employing DNA markers as entry points for DNA-walking to linked genes with a view to their cloning for transformation of other genotypesor species.
The goals of this CRP were to develop ways to accelerate plant breeding programmesand to make them more efficient, particularly those employing induced mutations. Morespecifically:• to foster the development of bilateral links between breeders and molecular geneticists
for development of appropriate genetic stocks and transfer of techniques for the useof markers in local breeding programmes;
• to establish the nature of spontaneous and irradiation induced DNA polymorphismwith a view to exploitation by targeted probes and primers;
• to facilitate information exchange to enhance the awareness of breeders, particularlyin developing countries, of the possibilities provided by DNA marker-mediatedsystems and provide advice on the availability of appropriate DNA probes and PCRprimers and their use;
• to investigate the relative efficacy of radioactive and non-radioactive detectionsystems.

During the period of this CRP, the development and application of molecular markertechniques in plant breeding and genetics programmes around the world has been tremendous.This has resulted in an enormous increase in basic knowledge which has created the demandfor increasing numbers of induced mutations to aid in the understanding of basic plant biologyprocesses which have direct implications for practical applications in plant breeding. Thechallenges for the future remain the practical and cost effective deployment of this technologyto solve problems of importance in Member States. The renewed growth in the use of inducedmutations, when combined with molecular genetics, offers powerful tools for designing thesolutions for ever more effective plant breeding in the future.
2. SPECIFIC RESULTS OF THIS CRP
This CRP has laid the foundation for a better understanding of induced mutations atthe molecular level. Population analyses have established marker associations for traits ofagronomic interest allowing marker assisted selection with radioactive and non-radioactiveprobes. A brief summary of the achievements of the participants during the duration of thisCRP follows.
Atannasov, Bulgaria (7233/RB): Irradiation in barley proved important for regeneration andmay have created specific DNA-level alterations, as measured by ribosomal DNA markers.Molecular markers, including protein, RFLPs, and RAPDs, were used to characteriseBulgarian barley cultivars and the their regenerants.
Paiva, Brazil (6998/RB): RFLP markers were compared with information about aluminumtolerance in maize. These results suggest that on chromosome 8 in maize there is a regionrelated to aluminum tolerance.
Simpson, Mexico (7071/RB): Maize lines contrasting in anthesis-silking interval (ASI), a traitstrongly linked to drought tolerance, have been analyzed under different water stressconditions in the field and with molecular markers. Correlation of markers with field data hasrevealed molecular markers strongly associated with flowering time and yield.
Davis, USA (7007/CF): Terminal radiation-induced chromosome deficiencies, were used tomap terminal markers in maize. Integration of classical genetic markers, in particular mutants,onto the maize RFLP map will provide the tools necessary to further our understanding ofplant development and of complex traits. Placement of mutants and cDNAs into bins (shortregions of each chromosome) using a standard or core set of markers provides a necessaryresource for the identification of gene functions in maize.
Zhuang, CPR (6999/RB): Two, or more, blast resistance genes in rice were associated withDNA markers in two F3 populations. One resistance gene was located in the vicinity of RG81in both populations. Crosses were made between elite varieties and blast resistance donors todevelop populations for DNA marker-assisted selection of blast resistance. In addition, blastresistance donors and 48 varieties currently in wide use in rice breeding were analysed forDNA polymorphisms to produce a database for future MAS program.
Chen, CPR (7070/RB): A salt tolerant rice mutant was obtained through EMS inductionfollowed by selection in vitro. A molecular marker was identified whose genetic distance froma salt tolerance gene is about 16.4 cM.
Eun, Rep. of Korea (7001/CF): The isozyme marker, EstI-2, and two RFLP markers, RG109and RG220, were linked at a distance of less than 1 cM with the semidwarf (sd-1) locus onchromosome 1 in rice. These markers could be used for precise in vitro selection ofindividuals carrying the semidwarf gene using single seeds or leaf tissue of very youngseedlings, before this character is fully expressed in the mature plant. Appropriate applicationof marker-assisted selection, using EstI-2 and RFLP markers for the semidwarf character, incombination with other markers linked to genes of agronomic importance in rice, holdspromise for improving the efficiency of breeding, and the high-resolution genetic and physicalmapping near sd-1, aimed at ultimately cloning this valuable gene.
Farooq, Pakistan (7002/RB): A population survey identified RAPD marker differencesbetween Basmati and non-Basmati rice types.
Prins, R. South Africa (7003/CF): Gamma radiation was used to characterize and fine-mapregions of a leaf rust resistance chromosome segment introduced into wheat.
Gale/Stephenson, UK (7004/TC): A landmark report showed marker comparisons whichrecognized the similarity of the cereal genomes (synteny) offering the intriguing possibilityof mapping or cloning a gene in one species as a path to mapping or cloning the gene inrelated genera. The development of microsatellite markers from wheat has resulted in 150primer pairs which have been tested for genetic polymorphism using a panel of ten wheatvarieties. The microsatellites show high levels of genetic polymorphism and an average 3.5alleles per locus with an average polymorphism information content (PIC) value of 0.5.
Lee, USA (7008/CF): A genetic map based on restriction fragment length polymorphisms wasconstructed in sorghum. Comparison of sorghum and maize RFLP maps on the basis ofcommon sets of DNA probes revealed a high degree of conservation as reflected byhomology, copy number, and collinearity. Examples of conserved and rearranged locus orderswere observed. The same population was used to map genetic factors (mutants andquantitative trait loci, QTL) for several traits including vegetative and reproductivemorphology, maturity, insect and disease resistance. Of the six QTLs detected for plant heightin sorghum (an important character for sorghum adaptation in temperate latitudes for grainproduction) four seemed to be orthologous in maize. RFLP data seem to portray geneticrelationships more accurately than the methods based exclusively on the coancestrycoefficient. Thirty-two SSR loci have been mapped throughout the sorghum genome.
Young, USA (7009/CF): Multiple generations and populations were used to map soybean cystnematode resistance. Using DNA markers, genome organization and several important diseaseresistance genes have been analyzed in mungbean, cowpea, common bean, and soybean. Thereis significant conservation of DNA marker order, though the conserved blocks in soybean aremuch shorter than in the others. DNA mapping results also indicate that a gene for seedweight may be conserved between mungbean and cowpea. Using the linkage maps, genes thatcontrol bruchid and powdery mildew resistance in mungbean, aphid resistance in cowpea, andcyst nematode resistance in soybean have all been mapped and characterized. For some ofthese traits resistance was found to be oligogenic as evidenced by DNA mapping.
The high quality of the research results achieved in this CRP suggests that it hassuccesfully linked scientists in developing and developed countries. This approach should becontinued in order to ensure that scientists in developing countries actively participate in thelatest molecular genetic developments and use them for the benefit of their agriculture,farmers and food security.

3. MARKERS, MAPPING, AND GENETICS
The use of DNA markers has had an enormous impact on understanding the basicbiology underlying the breeding of sexually reproduced crops. Since their introduction in theearly 1980s, a variety of DNA markers have been developed, some hybridization-based andsome PCR-based. The use of DNA markers has made it possible to: (a) "fingerprint"genotypes precisely, (b) verify F, hybrids, (c) estimate genetic distance and forecast heteroticgroups, (d) select the best individuals for breeding, (e) to discover breaks of undesirablelinkages flanking genes of interest and recover the recurrent parent's genotype, (f) undertakegenetic analysis for QTL, and (g) clone genes of economic importance. It is certain that DNAmarkers will radically alter the practice of plant breeding in the years to come.
3.1. Types of molecular markers
The most commonly used DNA markers are RFLPs and RAPDs. RFLPs were the firstto be developed and they remain widely employed today. However, the RFLP procedure istime-consuming and requires radioactivity or complex visualization procedures. RAPDs, whichare PCR-based markers, are much simpler to use, but are not co-dominant, are less predictablyportable from one population to another, and also suffer from difficulties with reproducibility.The practical application of these marker systems in breeding situations may also be limitedby the inadequate frequency of polymorphic loci. Another marker technology is known asVariable Number of Tandem Repeats (VNTRs) or "microsatellites". They have many desirablefeatures, including the use of a PCR reaction instead of a blotting procedure, show co-dominant inheritance usually, and have genome specificity in polyploids. However, they areexpensive and time consuming to develop because generation of DNA sequence informationis required. Consequently, it will be a long time before maps of microsatellites are developedeven for the most widely cultivated crops.
Yet another new marker technique has recently become popular, namely AmplifiedFragment Length Polymorphism (AFLP) [1]. The AFLP technique is based on the selectivePCR amplification of restriction fragments from a total digest of genomic DNA. Althoughexpensive and technically more demanding than the previously mentioned techniques, AFLPgenerally produces many informative bands per sample. AFLP offers special promise inidentifying markers tightly linked to deletion mutations induced with some mutagens [2] andin genomic regions tagged by bulked segregant analysis of nearly isogenic lines. The newesttype of DNA marker, the "biochip", which will most likely open many new possibilities inresearch and application, is still in the development stages.
3.2. Considerations and limitations in the use of molecular markers
In deciding which marker system is best for a given application, several key factorsshould be considered. Among the most important are: the use of radioactive compounds, thenumber of samples to be processed, the need to transfer the data from one population toanother (or one species to another), the level of molecular polymorphism differences betweenthe parents, the amount of tissue sample available, and what sorts of genomic resources arealready available in the crop systems. The information is summarized in Table I for the mostwidely used marker types.
There are certain limitations for some or all types of molecular markers. DNAisolation and purification remain a time consuming process, especially for large numbers ofsamples. Any marker system that requires acrylamide gel electrophoresis is technicallychallenging. Managing the data generated by a molecular marker project is also very

demanding. Capturing, proofreading, and organizing molecular marker data requires carefulplanning and execution. This is complicated further when the data are shared among differentlaboratories with distinct mapping or breeding populations, or different crop species.
3.3. Types of genetic markers
Integration of linkage information derived from various types of markers hassignificantly improved the resolution of crop genome structure and created opportunities forimproved interpretation of the genetic basis of crop improvement. Prior to the availability ofDNA markers, the available maps provided few opportunities for identifying suitable sourcesof germplasm with genetic variation for traits desired by plant breeders. Likewise, the mapsbased solely on mutations identified by alleles with large phenotypic effects and cytologicalmarkers, have created very few opportunities for geneticists and molecular biologists to assessthe agricultural significance of certain genes; much less, devise directed strategies for locatingand characterizing genes presumed to be highly significant. Currently, considerable efforts aredevoted to integration of crop genetic maps and to relate genetic data derived from DNAmarkers, mutations, cytogenetic markers, and QTL. This resource will provide, for the firsttime, the essential context for objective dialogue between plant breeding and many branchesof basic science.
One of the initial stages of recent map integration has involved cytological and DNAmarkers. Where adequate cytogenetic stocks have been available, combining the informationwith DNA markers has significantly enhanced our knowledge of genome organization forcrops such as tomato and potato [3], maize [4], wheat [5], and barley and rye [6]. Theseinvestigations have revealed patterns of genome duplication, recombination, andcytogenetic/genetic distances along the chromosomes. This information is essential forefficient deployment of a wide spectrum of genetic technologies from targeted cloning ofimportant genes through introgression of useful genes from exotic germ plasm into cultivatedcrops [7].
Another phase of map integration involves DNA markers and structural mutations.Reports of genetic linkage between DNA markers and deletions have increased at a seeminglyexponential rate. To the extent that such alleles have been used in breeding programmes, thesereports comprise a considerable array of expanded opportunities for using markers as indirectselection criteria. An area of potentially more pervasive significance for crop improvementhas been integrative mapping of partly-sequenced cDNA clones in crops such as maize [8].Maps rich in deletions provide many opportunities for matching mutants, collected andcharacterised over several decades, with specific DNA molecules (across taxa). Eventually,this process will provide a basis for determining the biophysical basis of genetic variation andphenotypic expression for many traits. To the extent that functions and DNA sequences havebeen conserved across plant taxa [9], integrated maps and their markers may represent a veryimportant plant genetic resource for crop breeding.
The third, and least complete, phase of integrative mapping involves polygenes or QTL[10]. Despite the inherent ambiguities of the process, QTL mapping provides vital informationfor basic and applied aspects of crop improvement. QTL mapping allows a pangenomicassessment of gene location and action for potentially any phenotype (i.e. trait).

TABLE I. COMPARISON OF DIFFERENT MARKER SYSTEMS
PRINCIPLE
TECHNOLOGY
Type of polymorphism
Genomic abundance
Level of polymorphism
Dominance
Amount of DNA required
Sequence informationrequired'
Radioactive detection required9
Gel system
IMPLEMENTATION
Development costs
Start up costs
Portability Lab/Crop
SUITABLE APPLICATIONS
RFLP
Endonuclease restrictionSouthern blottingHybridization
Single base changesInsertionsDeletions
High
Medium
Co dominant
2-10ug
No
Yes/no
Agarose
Medium
Medium/High
High/High
Comparative MappingFramewoik mapping
RAPD
DNA amplification withrandom primers
Single base changesInsertionsDeletions
Very high
Medium
Dominant
10-25ng
No
No
Agarose
Low
Low
Medium/Nil
Vanetal /hybrid identificationMarker assisted selection
Microsatellites
PCR of simple sequencerepeats
Changes in repeat length
Medium
High
Co dominant
50 lOOng
Yes
No/yes
Acrylamide/agarose
High
High
High/Low
Framework/region specificmapping FingerprintingMarkei assisted selection
SCARS/CAPS
Polymorphic PCR products orendonuclease restriction ofPCR products
Single base changesInsertionsDeletions
High
Medium
Codommant
50 lOOng
Yes
No
Agarose
Medium/high
High
High/Low
Framework mapping Markerassisted selection Can beconverted to allele specificprobes
AFLP
Endonuclease restrictionfollowed by selective PCRamplification
Single base changesInsertionsDeletions
Very high
Very high*
Dominant/Co dominant
SOOug*
No
Yes
Acrylamide
Medium/High
Medium/High
High/Nil
Fingerprinting Veiy fastmapping Region specificmarker saturation
Because this technique leads to multiple mfomative DNA bands per sample, the geneiahzations in the table are based on lesults typically achieved with an entire sample (rather than individual bands)

Several aspects of QTL mapping make this approach especially powerful for addingimportant genes and regions to maps. First, DNA markers provide relatively comprehensivecoverage of the genome. Second, the choice of mapping parents is extensive so adequateDNA polymorphism may be detected. Therefore, important genetic regions may be added tomaps in a directed manner, depending on the ability to assess genetic diversity and variationfor the trait(s). Unlike mapping deletions, this approach may provide a more sensitive surveyof the genome because it does not require fortuitous observation and recovery of alleles withhighly qualitative effects on the trait(s) of interest.
Analysis of nearly isogenic lines and subsequent QTL mapping in maize haveidentified regions with major effects on components of maturity (e.g. days to flowering andnumber of internodes) [11, 12]; and tissue culture response [13] on chromosomes 8 and 9,respectively. Of course the identified QTLs cannot usually be located on the maps with thesame precision and accuracy as other markers. However, the limitations created by thepositional ambiguities may often be insignificant relative to the value of identifying thecontrolling chromosome regions for the first time.
The benefits of integrated maps have been realized in a few investigations. Mappingwith chromosome translocations has provided independent verification of QTLs in maize forresistance to an insect [14], a virus [15], and a fungal pathogen [16]. Comparisons of geneticpositions of QTLs and loci defined by previously identified mutations [17] have supportedthe hypothesis that quantitative and qualitative genetic variation may often originate fromalleles at common loci [18]. Positive tests of allelism between a QTL and a mutant allele [19]and sequence analysis of alleles at the Sh locus [20] in maize have provided additionalevidence in support of this hypothesis. In these situations, the supporting evidence wasgathered in a very directed manner due to the availability of an integrated map.
3.4. Development of integrated maps
Genetic maps have previously provided few advantages to plant breeding and cropimprovement programmes even for crops with relatively well-developed maps, such as maizeand tomato. The primary problems with the practical utilization of genetic maps have beenthe lack of informative markers in the germ plasm used by breeders, the predominant typesof markers used to create maps (chromosomal markers), the poor integration of maps eachbased on a different type of marker, and the polyploid nature of many crop genomes. Thecurrent and future generations of maps alleviate these problems in significant ways.
The advent of DNA markers has enhanced the relevance of genetic maps for plantbreeding and improved the prospects of using linkage information as an important elementin crop improvement schemes. The maps have provided a new source of information and rawmaterials (genes) for plant breeding as well as an impetus for modifying some plant breedingprocedures.
As better genetic maps have been constructed using molecular markers, some withthousands of loci, the need for better genomic informatic resources has grown. Recently,genome databases for many major crop systems (see below) have been developed and mostcan be accessed through the World Wide Web. A suitable site for accessing these databasescan be found on the USDA-National Agricultural Library Web page (address:http://probe.nalusda.gov:8300/plant/index.html). The following list includes examples of thedatabases included and the crops they cover:

AAtDB— A rabidopsisAlfagenes-alfalfa (Medicago saliva)BeanGenes—Phaseolus and VignaChlamyDB—Chlamydomonas reinhardtiiCoolGenes—cool season food legumesCottonDB—Gossypium hirsutumGrainGenes—wheat, barley, rye and relativesMaizeDB—maizeMilletGenes-pearl milletPathoGenes-fungal pathogens of small-grain cerealsRiceGenes-riceSolGenes—SolanaceaeSorghumDB—Sorghum bicolorSoyBase—soybeansTreeGenes-forest trees
3.5. Comparative mapping
The use of common sets of DNA probes to detect and map homologous sequencesacross sexually isolated species has revealed a surprisingly high degree of conservation interms of copy number and homology of low copy probes, linkage, and locus order.Recognition of the considerable conservation of these features within groups of plants suchas rice, wheat, and maize [21]; sorghum and maize [22]; wheat, barley, and rye [7]; tomato,potato, and pepper [3, 23]; Arabidopsis and Brassica [24] has inspired the suggestion ofconsidering such groups as single genetic systems [9, 25].
This concept should have considerable merit and mutual advantages for breeders andgeneticists. Often, the genome size of one member of the group is several fold smaller thanthat of other members. The smaller genome size should accelerate positional cloning of someorthologous genes [26]. For example, a rust resistance gene has been cloned in barley throughparallel chromosome landing in rice. Once the gene in the source species has been cloned andsequenced, this information may be used to quickly isolate the orthologous gene in the targetspecies as demonstrated by the isolation of the gene for chalcone flavanone isomerase inmaize using sequence information from Petunia, snapdragon, and bean [27]. Recently,Resistance Gene Analogs (RGAs) have been isolated from soybean by using DNA sequencedata of resistance genes isolated from several unrelated dicots. However, the repertoire andnumber of mapped and characterized genes may vary considerably between members of agroup (e.g. tomato vs. potato, maize vs. sorghum). In these instances, map information fromthe "gene rich" species may provide important clues about a map region's genetic content inthe "gene poor" species and vice versa. Comparisons of locus order and distribution ofrecombination events may also elucidate barriers and suggest strategies to incorporate germplasm in wide crosses [7]. For plant-breeding programs, this information represents anopportunity for a considerable and directed expansion and improved definition of variouscrops' gene pools.
Comparative mapping of DNA clones has provided the basis for parallel investigationsof other markers. For example, a region containing a locus that conditions the absence ofligules has been conserved in rice, wheat and maize [21]. Similar inspections of linkage dataof other taxa should reveal many other examples such as the parallel linkage between genesfor resistance to leaf rust (Puccinia spp.) and prolamines in oats, wheat, and maize [28].Recently, the pattern of conserved linkage and function has been extended to include QTLs.

The initial report of orthologous QTLs noted that the RFLP loci with the greatest effects onseed weight in mung bean and cowpea were detected by the same clones [29]. In a similarmanner, comparative mapping in maize and sorghum has revealed three putatively orthologousregions for plant height [30]. In sorghum, each region has a major effect on that trait and ona unique suite of other traits (e.g. tillering, panicle dimensions, leaf length and width) muchlike some of the dw loci in sorghum. Interestingly, plant height mutants at maize genetic lociin related regions have pleiotropic effects on some of the same combinations of traits as thesorghum QTLs and the candidate dw loci.
An essential resource for comparative studies will be the organization and integrationof information about mutants, physical or cytological events, QTLs, and molecular markersinto defined sections of the chromosomes, both within and across species. For example,information is currently catalogued in the Maize Genome Database by 20 cM intervals forapproximately 5000 variants in maize with future links to other species envisioned.
3.6. Molecular analysis of induced mutations
The application of X rays and other physical mutagens to plant breeding in the pastseventy years has been influential in increasing variability for practical breeding applications.The combination of new molecular technologies including, molecular markers, subtractioncloning methods and differential display analysis, with induced mutagenesis promises toradically improve our fundamental understanding of plant genetics and physiology. Practicalapproaches, using all available technologies, are crucial to meeting the increasing demandsfor food production around the globe.
Induced mutations are important in plant breeding especially when the existing geneticvariation in the adapted germplasm is limited, when a single or a few genes are involved inthe trait, when it is easy to screen for the trait and large populations can be tested, and whenone is attempting to obtain a desirable trait without disrupting other traits. Theseconsiderations can give a selective advantage to the use of induced mutations for achievingplant breeding goals.
A broad range of plant traits have been successfully mutated through the use ofradiations; some were induced by chemicals, mainly ethyl methane-sulphonate (EMS), N-methyl-N-nitroso urea (MNH), N-ethyl-N-nitroso urea (ENH), ethyleneimine (El), andethylene oxide (EO). Traits improved in released varieties of various crops include growthhabit, earliness, short stature, lodging resistance, stem stiffness, oil composition; leaf, flowerand fruit characters, and disease resistance.
Induced mutations can be useful in gene cloning approaches by offering an additionalsource of variability for locating genes of interest. Chemical mutagens tend to produce smallalterations from point mutations up 50 bp deletions, whereas physical mutagens (radiations)tend to produce larger ones. Physical mutagens have been shown by molecular evidence toproduce deletions from 17 bp up to 20 cM in length. In addition to simple deletions, physicalmutagens are capable of creating more complex inversions, translations and otheralterations. The creation of large deletions may facilitate gene isolation from stocks containingradiation-induced mutations via subtractive hybridization or representational differencesanalysis.
The possibility of finding induced mutations directly via RFLP, PCR or DNAfingerprint screening has been investigated by a number of groups. For example, nine
independent mutations in downy mildew resistance genes (Dm) were induced with fastneutrons in lettuce [2]. A linear order of deletion breakpoints and molecular markers wasestablished along the chromosome. The region surrounding Dm3 was stable through manygenerations of breeding and the deletion breakpoints provided greater genetic resolution thanmeiotic recombinants. There was no evidence at the molecular marker level of chromosomalrearrangements associated with these deletions. On the other hand, a study in Arabidopsisutilized radiation-induced mutations in two genes, chalcone flavanone isomerase (CHI) anddihydroflavonol 4-reductase (DFR): one CHI allele, generated by fast neutron irradiationcontained a 1.4 kb inversion within the gene as well as a 272 bp insertion adjacent to aninversion which was transferred from 38 cM away on the same chromosome; a DFR allele,induced by X-rays, contained a 72 bp deletion and a 7.4 kb deletion which flank a 2.8 cMinversion. These complicated alterations associated with physical mutagens suggest that somecaution may be required before cloning genes known only by phenotype.
The cellular mechanisms that contribute to these types of rearrangement are still poorlyunderstood. Mutations involving large deletions have only rarely been identified in plants.Even in other organisms, only limited analysis of these types of lesions has been performedthus far. The molecular biological tools available today make it possible to isolate inducedmutations at known gene loci in a relatively short period of time and to facilitate improvedrecovery of desired induced mutants.
3.7. Benefits for crop improvement
The benefits of comparative and integrated maps for plant breeding programs aresubstantial for the short and long terms; they may be summarized as follows: 1) to the extentthat mutations are utilized by breeders, integrated maps increase opportunities for indirectselection methods; 2) the ability to share genetic information between sexually isolatedspecies should accelerate isolation of targeted genes; 3) the definition of crop gene poolsshould become broader and more precise for specific genes; 4) understanding of the biologicalbasis of complex traits should improve by providing a common language for various branchesof biology; 5) important genes may be localized by a variety of increasingly complementarymethods for potential use in transgenesis projects; and 6) an element of objective hypothesistesting has become available for plant breeding.
There is so much to learn about so many shared sequences that comparative andintegrative mapping is easily justified. However, this approach has some limitations. Onelimitation may relate to the observation that 10-20% of the low copy DNA clones from onespecies seem to be specific, or at least much more homologous to the source species [22, 29].That could represent a substantial number of genes. At least some of those genes might conferunique or neomorphic functions in the source species. Undoubtedly there will be manyexamples of species-specific low copy sequences that turn out to be very important genes.
3.8. Map-based cloning
In the long-run, the most powerful use of molecular markers in plant breeding maybe the ability to clone genes known only by phenotype. In the past, cloning such genes wasdifficult or impossible. With the advent of molecular marker technology, transposon or T-DNA tagging [31-33], and large scale sequencing projects, important genes have now becomeaccessible to molecular cloning. Briefly, molecular markers provide the essential startingpoints for physical isolation of genomic regions containing a gene of interest. Often, the same
10

efforts that are involved in tagging a gene as part of a marker-assisted selection program haveside-benefits in uncovering the starting points for genomic isolation. In crops wheretransposon or T-DNA mutagenesis are not feasible, physically induced variants combined withmolecular marker analysis provide an important alternative to clone genes [2]. As newtechnologies emerge, such as differential display, they may be used in conjunction withcurrent technologies to speed gene isolation [34, 35]. As economically important genes arecloned, the capacity to understand their basic function, modify genes, create new phenotypes,and transfer them to unrelated species will become more feasible.
Earlier strategies of gene cloning relied upon knowing the gene product (RNA orprotein) in order to isolate cDNAs and genes of interest. This meant that genes for manyimportant traits such as disease resistance or developmental control, for which nothing wasknown at the molecular level, were impossible to isolate. Now with the availability ofnumerous public databanks containing sequence information from a variety of organisms,assessment of consensus motifs in orthologous or homologous gene sequences is possible andfunctionality can often be deduced by comparison of these motifs. Recent evidence suggeststhat a candidate gene approach may be useful in associating functions with phenotypes [36].Many of the original cloning strategies were restricted to a single crop. Knowledge ofcollinearity across genomes of related organisms has opened the possibility of cross-speciescloning strategies facilitated by comparative molecular maps.
The four necessary components of any map-based cloning strategy are: a geneticmapping resource, a physical mapping resource, an economical, high-throughput screeningtechnique, and appropriate assays for complementation. Genetic mapping resources includehigh-density molecular maps, comparative maps, and sequenced cDNA (EST) libraries. Manytechniques are available for developing high-density molecular maps as discussed previously.Choice of technique is dependent on a combination of biological and economic factorsincluding laboratory infrastructure, genome size, level of polymorphism, and availability ofmarker systems. Anchor or core marker sets for each species are being used to determinerelative alignments of molecular maps. These alignments will facilitate sharing of ESTinformation across species as discussed above. Physical mapping resources include librariesin bacterial artificial chromosomes (BACs), yeast artificial chromosomes (YACs), andcosmids, or chromosome-specific libraries, and radiation-induced deletion lines. Most assaysfor complementation require some form of transformation. However, efficient transformationsystems which are suitable for this purpose have been developed so far for some major crops,but not for all.
3.8.1. Tagging strategies
Types of cloning strategies such as transposon tagging, that directly mark sites, relyon efficient transposon activity in the species of interest. They have worked well in maize andtomato, but this approach may be inapplicable generally. Agrobacterium mediatedtransformation is being utilized in a number of crop species but its applicability is limited tocrops where efficient transformation and regeneration, and efficient means of screening forthe desired mutants are available. In recalcitrant species, e.g. many legumes, this strategy maybe impractical. Newer techniques, such as differential display, which do not require directmarking of genes can be utilized in species where transformation, regeneration, or transposonsare not available. When utilized in materials containing small deletions such as thosegenerated by some forms of physical mutagenesis, differential display offers a potential toolfor focusing on the genomic region of interest.
11

Projects orientated towards map-based or site-tagged cloning require substantialfinancial support in addition to a sophisticated laboratory set up. Therefore, the goals are oftenbeyond the specific use of cloned genes in breeding or even genetic engineering strategies;they are aimed at answering basic biological questions as those regarding the nature of theevents occurring during the infection process, the basis of resistance and indeed of avirulenceor the processes which occur at the molecular level during symbiosis between the plant andnitrogen fixing bacteria, problems difficult to investigate by other means. The costs involvedin time and resources demonstrate that groups undertaking such work are very committed tothe study of a particular system or to the isolation of agronomically very important genes.
3.8.2. Transgenie approaches
The end result of identification of genes of economic interest is their application inproduction of commercial materials. Transformation utilizing genes of economic interest isa reality for many crops. Molecular marker technology provides the foundation for isolationof genes involved in quantitative, costly, or difficult to score traits. The bottleneck inorganisms which have a good transformation system in place are appropriate genes ofagronomic interest. Limitations to widespread use of transformation in crop improvementinclude lack of efficient transformation systems for many organisms and a means to transformmultiple gene traits. One forthcoming possibility for transformation of multiple gene traits isthe use of plant artificial chromosomes. An additional concern for transgenic plants is whetheradequate guidelines for release of genetically altered organisms are in place. A potential useof physical mutagenesis is to delete unwanted selective markers in the later stages oftransgenic line evaluations.
4. PRACTICAL MARKER APPLICATIONS
The potential utility of DNA markers has been recognized and established in manyplant breeding programs. Indeed, the primary obstacles to widespread use of markers are thelack of facile marker systems and the resources required to support their use. The advantagesprovided by markers are many but they depend on numerous variables such as crop biology,trait(s) undergoing selection, resources, and type of cultivar. However, it has become clearthat markers should be considered as an option under many circumstances and aspects of cropimprovement.
4.1. Diagnostics and DNA fingerprinting
Monoclonal and polyclonal antibodies, which assess the presence of proteins, havebeen used routinely for strain identification of viruses. This has assisted artificial selection byverifying the presence of the virus in the absence of symptoms in the host plant. It helps inthe assessment of the homogeneity and stability of the pathogen population, introduction ofnew strains and purity of inoculum. However, there are limitations to extending thesetechniques to other pathogens (fungi, bacteria, nematodes) and parasitic plants, e.g. Striga,Orobanche and Cuscuta. The development of PCR based DNA markers would ameliorate thissituation and make important contributions to crop improvement by clarifying the geneticarchitecture and repertoire of the pathogen populations.
One of the simplest and most widely applicable uses of DNA markers in plants isDNA fingerprinting. Depending on the resolution required, selected RFLPs or RAPD markersmay be very suitable as "fingerprinting" markers. Microsatellites and AFLPs are very wellsuited for fingerprinting because of their high level of polymorphism. An obvious
12
fingerprinting application would be to ensure that an accession in a breeding program isuniform genetically and that crosses presumed to be made with this accession were, indeed,carried out with the correct material. Eventually, DNA fingerprinting may also play animportant role in developing "core" sets of accessions for screening, as maintained ingermplasm collections.
Fingerprinting can also be used to identify and monitor germplasm after it has beenreleased or commercialized. Seed companies and national cultivar registration agencies havean interest in DNA fingerprinting because the technology can be used to protect intellectualproperty, establish identity, and assess purity. The same principles may be used to determinethe contributions of raw germplasm (obtained from developing countries) in breedingprogrammes in developed countries. Fingerprinting can also be used in the grain trade toprevent adulteration, e.g. blending in rice shipments.
4.2. Verifying crosses and parentage
This application of DNA markers, which is very similar to the one mentioned in thesection of DNA fingerprinting, can and does have an enormous practical impact. Manybreeding programs begin with a cross between dissimilar parents. Sometimes, visual markersare available to ensure that the presumed F! is, indeed, the result of a cross and not a self.When visual markers are not available, DNA markers offer a simple and convenient methodto ascertain that a presumed F, is indeed such, and not a self or an unintended outcross.
4.3. Genetic distance, heterotic groups and heterosis
In crop species where hybrids are used, DNA markers may enhance breeders' abilitiesto select the best combinations of parents. DNA markers can estimate combinations of parentsthat are genetically most dissimilar from one another (which might indicate potential hybridvigor). Moreover, DNA markers that definitely place accessions into a specific heterotic groupcould be used to assign unknown genotypes without the need for extensive field trials. Suchinformation would be extremely valuable in the organization of breeding programmesintended to produce hybrid cultivars for crops previously unexposed to hybrid breedingschemes [37].
4.4. Marker-assisted selection
Along with the use of markers to recover recurrent parent genotype, marker-assistedselection (MAS) is probably the broadest and most far-reaching application of DNA markersin plant breeding. Whenever a trait is difficult or expensive to assess, markers can potentiallysimplify and expedite the selection process. Moreover, the use of markers offers theopportunity to select individuals that carry the best possible genotype. This is based on theability to select positively for the trait of interest (selection at two tightly and flanking DNAmarkers) and to select against marker alleles linked to undesirable loci.
In the simplest case, marker-assisted backcross breeding might be targeted on a singlelocus trait (such as a disease resistance or stress tolerance character) coming from a wildrelative. In fact, almost any transgene undergoes MAS because the most elite germplasm isusually not yet available or amenable to cell culture regimes used to produce transgenicplants. Typically, a suitable segregating population would be generated and DNA extractedfrom all individuals. Markers flanking the gene of interest would then be tested and used toidentify individuals that have retained the target gene. This would be followed by a marker
13
analysis of polymorphic loci throughout the remainder of the genome for those individualsthat most resemble the cultivated parent. In the process, rare recombination events around thegene of interest would be uncovered, potentially eliminating undesirable trait loci that mightbe "dragged" along in a backcross program. These markers can also be useful for predictingthe adult phenotype at the seedling stage [38], thus reducing population sizes and costs. Inany case, the goal would be to develop a new, and superior, cultivar faster and moreefficiently than by conventional breeding alone. A similar, but expanded strategy could beutilized to pyramid together many marked genes into a single cultivar. This approach has beendeployed to develop cultivars for several crops [37].
There is a potential 'downside' to MAS backcross breeding that routinely invokesselection against presumably unwanted regions of the donor genome. It has been wellestablished that the donor parents often contribute favourable alleles for traits other than theone being transferred to the recurrent parent [10, 37]. In such cases, MAS could produceinferior cultivars relative to those produced by backcrossing (BC) without MAS. At the outsetof the BC program, it will be important to determine the necessity of maximizing the recoveryof the recurrent parent genome, as is the case when maintaining many quality factors in thefinal product, e.g. rice, malting barley, soybeans.
A modified form of MAS BC might be more appropriate for most other circumstances.The modification involves MAS BC only for the marked single gene, or a few QTL, andmore relaxed selection, not using markers in other regions of map, for that population. Sucha scheme would then allow breeders more opportunities to select on those unmarked regions[37].
Often, traits of interest must first be mapped and analyzed with DNA markers beforemarker-assisted selection can begin. Mapping is often a time-consuming and difficult process.Occasionally DNA fingerprinting sets of consanguineous lineages may substitute forconventional cosegregation analysis. Even when a trait is well-characterized in terms ofmarkers in one population, it is not entirely clear how transferable this type of informationwill be to other breeding populations. Interactions with the environment and geneticbackground continue to be important in plant breeding. If a new mapping initiative needs tobe mounted for each new set of parents, marker-assisted breeding will be more expensive andmore difficult than anticipated.
4.5. Mapping QTLs
While many important traits in plant breeding are controlled by single major loci, themajority of agriculturally important characters are multigenic, strongly influenced by theenvironment and expensive to evaluate directly. Before the advent of DNA markers, suchtraits could only be analyzed and manipulated by statistical analyses of the phenotypes. Ofcourse, enormous progress has been made by this approach, but the inability to describe andselect for specific QTLs may limit the breeders' ability to make progress in the future.
With DNA markers, complex traits have been resolved into discrete QTLs andmodified through MAS [37]. The individual effects of QTLs, their interactions, and theirusefulness in breeding can all be evaluated. Then, once QTLs of interest are well-defined interms of DNA markers, the strategy of marker-assisted selection described earlier can beimplemented. Traits as genetically complex as yield or nutritional value are amenable to MASof favourable QTLs. However, it should be understood that genetic inferences may be limitedto specific reference populations because of genetic heterogeneity for the trait(s), epistatic
14

gene action (vastly underestimated by present mapping programs), and unknown geneticconstitution among potential parents at the QTL 'regions'.
It has been recognized that QTL mapping may be a very deceptive enterprise becauseone should expect to detect evidence of putative QTL merely due to random chance [17, 37].QTL detection is affected by several factors such as the sample size of the mappingpopulation, quality of the trait data, marker density of the map, sampling of the environment,and sampling schemes of the population (e.g. tails vs. unselected progeny). Mappingalgorithms, and user awareness have advanced from single point analysis, to interval mapping(MAPMAKER-QTL), to composite interval mapping (e.g. QTL Cartographer, PLABQTL) sothat QTL detection has become more precise and reliable provided the raw data were of highquality. Wisely used, all mapping methods may produce reliable information suitable forMAS.
Implementation of this approach in plant breeding does however, require relativelysophisticated statistical techniques, routine access to DNA marker information and additionalhuman resources skilled in DNA technology, mapping methods, interpretation of statistics, andproper experimental design.
4.6. Cultivar development
Tools of molecular biology and mutagenesis have been used efficiently for thedevelopment of superior and novel cultivars in various economic plants including maize,soybean, cotton, squash, tomato, and rapeseed. All of these were available by 1996. Giventhe rather recent development of the array of enabling technologies, it should be appreciatedthat adoption and implementation have been very rapid. Many other cultivars will bedeveloped through these methods for traits such as quality (starch properties, oil quality,protein quality), disease resistance, insect resistance, and exploitation of heterosis (throughengineered nuclear male sterility). These methods not only facilitate the production of novelcultivars, but also the production of cultivars in far less time.
However, many challenges remain to be met to deal with complex, multigenic,characters such as drought-, cold- and salt-tolerance, and yield. Considerable progress hasbeen made using DNA markers to tag agronomically valuable genes in many crop species andthus the foundation has been established for using those markers and mutations for more rapidcultivar development, also in species largely ignored by the private sector. Virtually all phasesof plant breeding i.e. parents' selection, prediction of progeny performance, progeny selectionand varietal identification, have been affected by these tools. The prospects are very good formarkers to positively affect the rate of genetic gain. The critical component then, will bemaintenance and creation of genetic variation through the various methods.
4.7. Overall perspectives
DNA markers have already revolutionized the genetic analysis of agriculturallyimportant traits. Still, there has been a great deal of effort to utilize marker technology inplant breeding, while practical examples of success remain few. In part this may be due tothe fact that economically important traits really are complex (perhaps more geneticallycomplex than expected). However, the biggest constraint to the use of DNA markers in plantbreeding remains their relatively high cost and complexity. Classical breeders are accustomedto screening thousands of plants during a growing season and selecting the best ones foradvancement in a matter of weeks. Numbers like these are still out of the question with DNA
15

marker technology in most developing countries. The development of faster DNA extractionmethods, highly polymorphic microsatellite markers, multiplexed analysis (which can assaymany marker loci at once), and rapid data entry into computer software programs mayeventually produce the increase in throughput necessary to enable DNA markers to reach theirpotential in plant breeding.
5. RECOMMENDATIONS
5.1. Mutants and molecular markers
It is recommended that the development of new marker methodologies for the geneticimprovement of seed propagated species and their adaptation to the needs of plant breedersin developing countries should be continued, especially the following:
1. Induction of more mutants; at present the ability to understand and exploit geneticvariation and the relationships among mutants, molecules, and phenotypes is justbeginning to attain the power necessary for their analysis in complex biologicalsystems in general, and in plants in particular.
2. Comparison of the uses of radioactive and non-radioactive methods for molecularmarkers and DNA sequencing.
3. Identification of genetic regions responsible for traits of breeding importance andcomparisons across species.
4. Selection for desirable traits, in breeding materials of interest, through the markerassociations observed in the initial populations and parental analyses.
5.2. Markers and crop improvement
DNA markers are very useful in many situations in crop improvement, in sexually-and asexually-propagated plants. The application of molecular markers should be expanded,as follows:
1. Markers are an important tool for plant breeding programmes; when used judiciouslythey can expedite genetic gain and make breeding projects more efficient and reliable.
2. More applications and opportunities are envisioned as breeders become more familiarwith the various marker systems, with their appropriate applications and with otherbreeders' experience.
3. More markers are needed (to cover map gaps, loss or low polymorphism) and bettersystems are required for use in plant breeding programmes (better, low cost, highthroughput, non-gel systems).
5.3. Future activities
1. Projects aimed at developing publicly available resources of molecular markers andconstructs for the benefit of all countries should be emphasized.
2. Future projects should take advantage of the resources available in other species bycomparative map alignments, in order to enhance efficiency and reduce costs.
16

3. Coordination and sharing of information and resources among researchers and groupsshould be a priority of future projects.
4. Goals, strategies, possible collaboration and costs should be carefully evaluated beforeinitiating a map-based cloning project.
5. Appropriate strategies for map-based cloning should be determined individually byavailability of resources and expertise.
5.4. Training and education needs
It should be recognized that some aspects of developing and using DNA markermethods and MAS are recent and rather dynamic. Therefore, there is a clear need for trainingand education at a various of levels and in different techniques. Thus, most plant breederstoday have received their most advanced education prior to the development of technologiesthat have enabled MAS.
Furthermore, application of DNA markers in developing countries is hampered bydistance from laboratories developing the techniques and information, difficulties inexchanging materials and importing chemicals, lack of adequate equipment, insufficient staffand limited budgets.
Therefore, training programmes which emphasize judicious design, analysis andinterpretation of projects involving molecular markers, QTL mapping and the subsequentdecisions if and when to use such information in MAS are much needed.
REFERENCES
[ 1 ] VOS, P., ROGERS, R., BLEEKER, M., REIJANS, M., VAN DE LEE, T., HORNES,M., FRIJTERS, A., POT, J., PELEMAN, J., KUIPER, M., ZABEAU, M., AFLP: anew technique for DNA fingerprinting, Nucleic Acids Res. 23 (1995) 4407-4414.
[2] ANDERSON, P.A., OKUBARA, P.A., ARROYO-GARCIA, R., MEYERS, B.C.,MICHELMORE, R.W., Molecular analysis of irradiation-induced and spontaneousdeletion mutants at a disease resistance locus in Lactuca sativa, Mol. Gen. Genet. 251(1996) 316-325.
[3] TANKSLEY, S.D., GANAL, M.W., PRINCE, J.P., de VICENTE, M.C.,BONIERBALE, M.W., BROUN, P., FULTON, T.M., GIOBANNONI, J.J.,GRANDILLO, S., MARTIN, G.B., MESSEGEUR, R., MILLER, J.C., MILLER, L.,PATTERSON, A.H., PINEDA, O., ROEDER, M.S., WING, R.A., WU, W., YOUNG,N.D., High density molecular linkage maps of the tomato and potato genomes,Genetics 132 (1992) 1141-1160.
[4] WEBER, D., HELENTJARIS, T., Mapping RFLP loci in maize using B-Atranslocations, Genetics 121 (1989) 583-590.
[5] WERNER, J.E., ENDO, T.R., GILL, B.S., Toward a cytogenetically based physicalmap of the wheat genome, Proc. Natl. Acad. Sci. USA 89 (1992) 11307-11311.
[6] DEVOS, K.M., MILLAN, T., GALE, M.D., Comparative RFLP maps of thehomeologous group-2 chromosomes of wheat, rye and barley, Theor. Appl. Genet. 85(1993) 784-92.
17

[7] DEVOS, K.M., ATKINSON, M.D., CHINOY, C.N., FRANCIS, H.A., HARCOURT,R.L., KOEBNER, R.M.D., LIU, C.J., MASOJC, P., XIE, D.X., GALE, M.D.,Chromosomal rearrangements in the rye genome relative to that of wheat, Theor.Appl. Genet. 85 (1993) 673-680.
[8] CHAO, S., BAYSDORFER, C, HEREDIA-DIAZ, O., MUSKET, T., XU, G., COE,E.H., Jr., RFLP mapping of partially sequenced leaf cDNA clones in maize, Theor.Appl. Genet. 88 (1994) 717-21.
[9] HELENTJARIS, T., Implications for conserved genomic structure among plantspecies, Proc. Natl. Acad. Sci. USA 90 (1993) 8308-8309.
[10] TANKSLEY, S.D., Mapping polygenes, Ann. Rev. Genet. 27 (1993) 205-233.[11] KIM, T.S., PHILLIPS, R.L., EUN, M.Y., "Identification of genomic regions
controlling maturity in maize (Zea mays L.)", Crop Production and ImprovementTechnology in Asia, Korean Society of Crop Science, Rep. of Korea (1993) 379-397.
[ 12] PHILLIPS, R.L., KIM, T.-S., KAEPPLER, S.M., PARENTONI, S.N., SHAVER, D.L.,STUCKER, R.E., OPENSHAW, S.J., "Genetic dissection of maturity using RFLPs",Proc. 47th Annual Corn and Sorghum Industry Research Conference (WILKINSON,D., Ed.) Am. Seed Trade Assoc., Washington, DC (1992) 135-150.
[13] ARMSTRONG, C.L., ROMERO-SEVERSON, J., HODGES, T.K., Improved tissueculture response of elite maize inbreds through backcross breeding, and identificationof chromosomal regions responsible for regeneration by RFLP analysis, Theor. Appl.Genet. 84 (1992) 755-762.
[14] SCHOEN, C.C., LEE, M., MELCHINGER, A.E., GUTHRIE, W.D., WOODMAN,W.L., Mapping and characterisation of quantitative trait loci affecting resistanceagainst second generation European corn borer in maize with the aid of RFLPs,Heredity 70 (1993) 648-659.
[15] McMULLEN, M.D., LOUIE, R., The linkage of molecular markers to a genecontrolling the symptom response in maize to maize dwarf mosaic virus, Mol. Plant-Microbe Interact. 2 (1989) 309-314.
[16] FREYMARK, P.J., LEE, M., WOODMAN, W.L., MARTINSON, C.A., Quantitativeand qualitative trait loci affecting host plant response to Exserohilum turcicum inmaize (Zea mays L.), Theor. Appl. Genet. 87 (1993) 527-544.
[ 17] BEAVIS, W.D., GRANT, D., ALBERTSEN, M., FINCHER, R., Quantitative trait locifor plant height in four maize populations and their associations with qualitativegenetic loci, Theor. Appl. Genet. 83 (1991) 141-145.
[18] ROBERTSON, D.S., A possible technique for isolating genie DNA for quantitativetraits in plants, J. Theor. Biol. 117 (1985) 1-10.
[19] DOEBLEY, J., STEC, A., Teosinte branched! and the origin of maize, Maize Genet.Coop. Newsl. 68 (1994) 88-89.
[20] ALREFAI, R., OROZCO, B., ROCHEFORD, T., Detection and sequencing of thetransposable element ILS-1 in the Illinois long-term selection maize strains, PlantPhysiol. 106 (1994) 803-804.
[21] AHN, S., ANDERSON, J.A., SORRELLS, M.E., TANKSLEY, S.D., Homeologousrelationships in rice, wheat and maize chromosomes, Mol. Gen. Genet. 241 (1993)483-900.
[22] PEREIRA, M.G., LEE, M., BRAMEL-COX, P., WOODMAN, W., DOEBLEY, J.,WHITKUS, R., Construction of an RFLP map in sorghum and comparative mappingin maize, Genome 37 (1994) 236-43.
[23] TANKSLEY, S.D., BERNATZKY, R., LAPITAN, N.L., PRINCE, J.P., Conservationof gene repertoire but not gene order in pepper and tomato, Proc. Natl. Acad. Sci.USA 85 (1988) 6419-6423.
18

[24] TEUTONICO, R.A., OSBORN, T.C., Mapping of RFLP and quantitative trait loci inBrassica rapa and comparison to the linkage maps of B. napus, B. oleracea, andArabidopsis thaliana, Theor. Appl. Genet. 89 (1994) 885-893.
[25] BENNETZEN, J.L., FREELING, M, Grasses as a single genetic system: genomecomposition, colinearity and compatibility, Trends Genet. 9 (1993) 259-61.
[26] MOORE, G., FOOTE, T., HELENTJARIS, T., DEVOS, K.M., KURATA, N., GALE,M.D., Was there a single ancestral cereal chromosome?,Trend Genet. 11 (1995) 81 -82.
[27] GROTEWALD, E., PETERSON, T., Isolation and characterization of a maize geneencoding chalcone flavanone isomerase, Mol. Gen. Genet. 242 (1994) 1-8.
[28] RAYAPATI, P.J., PORTYANKO, V.A., LEE, M., Placement of loci for avenins andresistance to Puccinia coronata to a common linkage group in A vena strigosa. Genome37 (1994) 900-903.
[29] FATOKUN, C.A., MENANCIO-HAUTEA, D.I., DANESH, D., YOUNG, N.D.,Evidence for orthologous seed weight genes in cowpea and mung bean based on RFLPmapping, Genetics 132 (1992) 841-846.
[30] PEREIRA, M.G., LEE, M., Identification of genomic regions affecting plant heightin sorghum and maize, Theor. Appl. Genet. 90 (1995) 380-388.
[31 ] JONES, D.A, THOMAS, C.M., HAMMOND-KOSACK, K.E., BALINT-KURTI, P.J.,JONES, J.D.G., Isolation of the tomato Cf-9 gene for resistance to Cladosporiumfulvum by transposon tagging, Science 266 (1994) 789-792.
[32] FELDMANN, K.A., "The utility of insertion mutagenesis in Arabidopsis for cropimprovement", FAO/IAEA Int. Symp. Use of Induced Mutations and MolecularTechniques for Crop Improvement, IAEA, Vienna (1995).
[33] WALDEN, R., HARLING, H., MIKLASHEVICS, E., LUBENOW, H., SCHELL, J.,"Activation tagging and the molecular dissection of complex biological pathways",FAO/IAEA Int. Symp. Use of Induced Mutations and Molecular Techniques for CropImprovement, IAEA, Vienna (1995).
[34] LIANG, P., PARDEE, A.B., Differential display of eukaryotic messenger RNA bymeans of the polymerase chain reaction, Science 257 (1992) 967-971.
[35] LIANG, P., AVERBOUKH, L., PARDEE, A.B., Distribution and cloning ofeukaryotic mRNAs by means of differential display: refinements and optimization.Nucl. Acids Res. 21 (1993) 3275-3279.
[36] BYRNE, P.P., McMULLEN, M.D., SNOOK, M.E., MUSKET, T., THEURI, J.M.,WIDSTROM, N.W., WISEMAN, B.R., COE, E.H., Jr., Quantitative trait loci andmetabolic pathways: Genetic control of the concentration of maysin, a corn earwormresistance factor, in maize silks, Proc. Natl. Acad. Sci. USA 93 (1996) 8820-8825.
[37] LEE, M., "Integrated genetic maps of DNA markers and mutations and their utility forimprovement of sorghum and other grasses", FAO/IAEA Int. Symp. Use of InducedMutations and Molecular Techniques for Crop Improvement, IAEA, Vienna (1995).
[38] CHO, Y.G., EUN, M.Y., KIM, Y.K., CHUNG, T.Y., CHAE, Y.A., The semi-dwarfgene, sd-1, of rice (Oryza saliva L.) II. Molecular mapping and marker-assistedselection, Theor. Appl. Genet. 89 (1994) 54-59.
(TflEXT PAGE(S)J left BLANK
19

INVESTIGATION OF THE SOMACLONAL AND MUTAGEN XA9846993INDUCED VARIABILITY IN BARLEY BY THE APPLICATIONOF PROTEIN AND DNA MARKERS
A. ATANASSOV, E. TODOROVSKA, A. TRIFONOVA, M. PETROVAInstitute of Genetic Engineering,Kostinbrod, Bulgaria
E. MARINOVANorman Borlaug Research Centre,Kostinbrod, Bulgaria
M. GRAMATIKOVA, D. VALCHEVA, S. ZAPRIANOV, N. MERSINKOVInstitute of Barley,Karnobat, Bulgaria
Abstract
Barley, Hordeum vulgare L., is one of the most important crop species for Bulgaria The characterisationof the genetic pool is of great necessity for the Bulgarian barley breeding programme which is directed towardimproving quantitative and qualitative traits.
The regenerants from four Bulgarian varieties Ruen, Jubiley, Obzor (two-rowed, brewery) and Karnobat(six-rowed, forage) have been obtained by using a previously developed regeneration procedure [1] Themutagenic agents, gamma rays and NaN3, were applied to the initial material from cultivar Ruen The influenceof the mutagens on callus formation and plant regeneration was observed A dose of 200 Gy was considered asstimulating regeneration The mutation frequency increased but the spectrum of genetic changes was similar tothe control In order to assess genetic variability among the regenerated plants, multiple analytic tools have beenemployed Field evaluation of the individual regenerants and those derived after mutagen treatment was carriedout. A number of plants with valuable agronomic performance traits have been selected
Molecular markers [protein, restriction fragment length polymorphisms (RFLP) and randomly amplifiedpolymorphic DNA (RAPD)] have been applied to characterise the Bulgarian barley cultivars and theirregenerants. The changes in DNA loci coding for 26S, 5.8S and 18S rRNA repeats, C hordein locus andmitochondrial DNA organisation have been investigated. The potential for nbosomal DNA length polymorphismin Bulgarian barley cultivars appear to be limited to three different repeat lengths (10 2, 9 5 and 9 Okb) and threeplant rDNA phenotypes. Polymorphism was not observed in nbosomal DNA repeat units in somaclonal variantsVariation concerning C hordein electrophoretic pattern was observed in one line from cultivar Jubiley Analysisof the Horl locus reveals RFLPs in sequences coding for C hordems in this line Mitochondria! molecularmarkers are convenient for detection of DNA polymorphisms in the variant germplasm as well as for thesomaclonal variants derived from it. Two lines from Ruen revealed polymorphic bands after hybridisation withmitochondnal DNA probe RAPD assays have been carried out by using 20 different 10-mer primers Hentablepolymorphism in several tissue culture derived (TCD) lines was observed RAPD assay is a sensitive andrepresentative approach to distinguish the variability created by tissue culture and mutagenesis
1. INTRODUCTION
Plant tissue culture instability has been documented in several cereal plant species.Somaclonal variation has been studied intensively also in barley [2-5]. The results obtainedtill now are contradictory. No significant morphological variation was detected in tested tissueculture derived (TCD) lines [6] or only small variation was observed when TCD lines fromfour barley cultivars were tested in three locations [7]. On the other hand, in a study of 18cultivars and breeding lines morphological variation was observed [8].
Mutagen treatment of in vitro plants increases variability in cereals [9, 10]. Theapplication of mutagens (gamma rays and NaN3) influences callus formation and the rate ofregeneration [Karadimova, personal communication].
21

Molecular markers [isozymes, restriction fragment length polymorphism (RFLP) andrandomly amplified polymorphic DNA (RAPD)] have been applied to study the geneticchanges in nuclear, mitochondrial and chloroplast genomes. Molecular studies on somaclonalvariation in wheat and barley [2, 3] have demonstrated that the nucleolus organizer (NOR)loci, coding for rRNA and the electrophoretic pattern of storage proteins could be useful forassessing somaclonal variation.
The plant mitochondrial genome has been proven to be a proper model forinvestigation of somaclonal variation. Mitochondrial DNA rearrangements in regeneratedwheat plants has been reported [11]. A relatively high genetic stability was observed amongthe 50 regenerated H. marinum plants tested [4].
The RAPD technique utilises arbitrary 10 -mer oligonucleotide sequences as primers[12]. Primers hybridise to two nearby sites in the template DNA that are complementary tothe primer sequence. Deletions or insertions in the amplified regions or base changes alteringprimer binding sites will result in polymorphisms. RAPD markers have been applied widelyfor cultivar identification in barley H. spontaneum [13] and for analysing the genetic stabilityof tissue - cultured plants [14].
In this study we assessed the induced variability in barley tissue culture derived linesand those derived from in vitro mutagenesis. The aim was to distinguish reproducibly thelevel of variation between the donor material and the induced genetic changes at the level ofregenerant progeny by utilisation of protein, RFLP and RAPD methods.
2. MATERIALS AND METHODS
2.1. Plant material
The regenerants from four Bulgarian varieties Ruen, Jubiley, Obzor (two-rowed,brewery) and Karnobat (six-rowed, forage) have been obtained by using a previouslydeveloped regeneration procedure [1]. Mutagenic agents, gamma rays (100 and 200Gy) andNaN3 (K! = 5 x lO^M and x2 = 5 x 10"3M) were applied to the initial seed material fromcultivar (cv.) Ruen. Vigorous, green RO regenerants were propagated and advanced to the R5generation. Plants were evaluated in R3-R5 generations. A number of TCD lines originatingfrom individual regenerants have been evaluated for their agronomically valuablecharacteristics: 12 lines from cv. Karnobat, 21 lines from cv. Jubiley, 21 lines from cv. Ruenand 5 lines from cv. Obzor. The following number of plants were evaluated in the in vitromutagenesis experiment: regenerants (R)-25; regenerants after treatment with 100 Gy (R-10)-36; regenerants after treatment 200 Gy (R-20)-30; regenerants after treatment with NaN3x,concentration (R-x^-29; and regenerants treated with NaN3x2 concentration (R-x2)-26.
2.2. Hordein assay
Single seeds (20) from ten independent spikes per line were used for hordeinextraction. Fractionation of hordeins was achieved by sodium dodecyl sulfate polyacrylamidegel electrophoresis (SDS-PAGE) according to [15].
2.3. DNA extraction, endonuclease digestion and Southern blot hybridisation
DNA was extracted according to Saghai-Maroof et al. [16], with some modifications.The DNA was digested with the following restriction enzymes: EcoRI, EcoRl and BamHl,Sacl, Taql, and HindSL.
22

2.4. RAPD assay
Twenty different 10-mer primers (kit A, OPERON) were used for the amplificationof genomic DNA from 23 plants which originated from single seeds of each line. PCRs werecarried out in a 20ul reaction solution containing 15 ng of genomic DNA template, 7.5 pmolof each primer, 200mM of each of dATP, dCTP, dGTP and dTTP;lx PCR buffer (Pharmacia)and 0.8 units Taq DNA polymerase (Boehringer Mannheim). The amplification was performedin a Hybaid Omnigene Thermal Cycler.
The PCR conditions for RAPD analysis were as follows: for pre-denaturation 1 minat 94°C followed by 35 cycles of polymerisation reaction each consisting of a denaturationstep for 5 sec at 94°C, an annealing step for 30 sec at 36°C and an extension step for 1 minat 72°C. The last cycle was followed by a pause of 10 min at 72°C to ensure that primerextension reaction proceeded to completion. Amplified DNA fragments were run in 2.0%agarose gels (in IxTAE running buffer). Each gel was stained with ethidium bromide(0.5 mg/ml), visualised under illumination with UV light and photographed.
3. RESULTS
3.1. Field evaluation
Most of the observed morphological abnormalities in the primary regenerants are likelyto be epigenetic and disappear in the progeny generations. Sterile, chlorotic and very weakplants were eliminated in the RQ generation. Fasciation, shortened internodes, and seedmalformations were already reported [1]. Plants were advanced and propagated to R3generation. A range of deviations has been observed. They concern agronomically importanttraits such as: grain yield, lodging, height, days to heading, percentage of plump kernels, testweight and cold tolerance.
TABLE I. CLONES USED FOR ASSESSMENT OF THE NUCLEAR ANDMITOCHONDRIAL GENOME ORGANISATION OF H. vulgare REGENERATED PLANTS
Probe
Nuclear
Plasmiddesignation
pTA71
Contents ofplasmid
18S, 5.8S and
Vector
pUC18
Cloningsite
EcoRI
Sequenceorigin
wheat
pTA 630pCp387
Mitochondrial ATP A
26S andnontranscribedspacer of rDNASSrRNAcDNA of Chordeinsubunit A ofATPase
pBR322pUC18
BamHIHindHI
wheatbarley
pBN121 Hindm sunflower
The variation between TCD lines is significant and strongly genotype dependent. Finalevaluation shows that three TCD lines from Jubiley have increased grain yield, one possessesa shorter stem and one heads two days earlier. Four TCD lines from cv. Ruen show betteryield, one is earlier, one has a shorter stem and the other is taller (Table II).
23

TABLE n. FIELD TESTING OF SC3 PROGENY OF SELECTED BARLEY TISSUECULTURE DERIVED LINES
Cultivar
Ruen
Obzor
Kamobat
Jubiley
SelectedlinesNo.
Control1934781038189Control309313Control3944Control607057
Grainyield,t/ha
6.516.286.95**7.017_23***6.39*6.81*6.926.306.806.726.116.055.305.77**5.90**5.95***
Headingdate
13.0511.0509.0508.0510.0412.0513.0516.0513.0515.0506.0508.0507.0508.0505.0508.0804.05
Heightcm.
8580807875***75***70*7595***98***10496981009410495
Proteincontentmg/g
12.8012.6212.8811.93*13.3013.3812.3112.3012.5012.8812.3013.4013.5012.5011.4012.5010.30*
Weight/1 000ao
46.048.5**45.040.545.54646.538.540.3*39.833.435.036.0**50.052.0*54.0*52.0*
Plumpkernels%
85.693.0***89.5**82.690 9***87.5*88.6**77.882.8**80.5**
80.285.4***912***83.2**
**, *** = significant at the 0.05, 0.01 and 0.001 levels, respectively.
3.2. Analysis of ribosomal DNA spacer length polymorphism
The £coRI restriction enzyme defines two main rDNA repeat unit lengths, 9.0 and10.2 kb, detected in the both control material (cv. Ruen, cv. Jubiley) and their TCD lines and9.5 and 10.2 kb in cv. Obzor, cv. Kamobat and their TCD lines (Fig. 1).
9-Oicfc
1 IFig. 1. Southern blot hybridisation analysis of EcoRI digested barley genomic DNA with
probe pTA 71. Lane 1 - cv. Obsor; lane 2 - cv. Kamobat; lane 3 - som. 44; lane 4 -cv. Ruen; lane 5 - som. 89; lane 6 - cv. Jubiley; lane 7 - som. 70.
24

Double EcoRl-BamHI digestion of barley DNA results in a range of fragmentshybridising with clone pTA 71. No variation in the fragment length or relative intensity ofhybridisation bands of BamHI sites in rDNA units was observed among the regenerated plantsfrom cv. Karnobat, cv. Jubiley, cv. Ruen and cv. Obzor (Fig. 2).
_3-6« u^gf
1 E 5 4 5 6Fig. 2. EcoRI-BeanHI pattern of genomic DNA hybridised with 9.0 kb. fragment of clone
pTA 71. Line 1 - cv. Obzor; line 2 - som. 309; line 3 - som. 313; line 4 - cv.Karnobat; line 5 - som. 44; line 6 - som. 39.
In vitro mutagen treatment influences the efficiency of callus formation and plantregeneration (data not shown). Mutation frequency was increased but the spectrum of geneticchanges was similar to the control (data not shown). Several mutant lines have been selectedin R3 progeny, showing valuable agronomic performance (Table in).
TABLE III. SELECTED LINES AFTER TISSUE CULTURE AND MUTAGEN TREATMENT
Selectedlines
Control126 R157 R139-R-10152-R-20153-R-20145-R-2012-5-(-Xl166-2-R-xl307-R-x2
Stemheightcm9895.793.590.0**92.0*90.0**94.087,0***90.0**92.0*
TillersNo.
15.019.018.530.0***19.825.5**30.0***12.319.7526.9**
Internode SpikeNo. length
cm4.85.65.9*5.55.65.7*5.55.15.25.3
8.99.810.3**10.9**9.89.010.9**10.1**10.4**9.8
Seed Seednumber/ weight/spike spike23.026.225.930.9**25.825.226.326.027.726.8
.19
.29
.68**71***y^##*
.49
.48
.5
.31
.5
Yieldt/ha
5.865.806.106.405.865.895.736.905.536.70
* **, *** = significant at the 0.05, 0.01 and 0.001 levels, respectively.
25
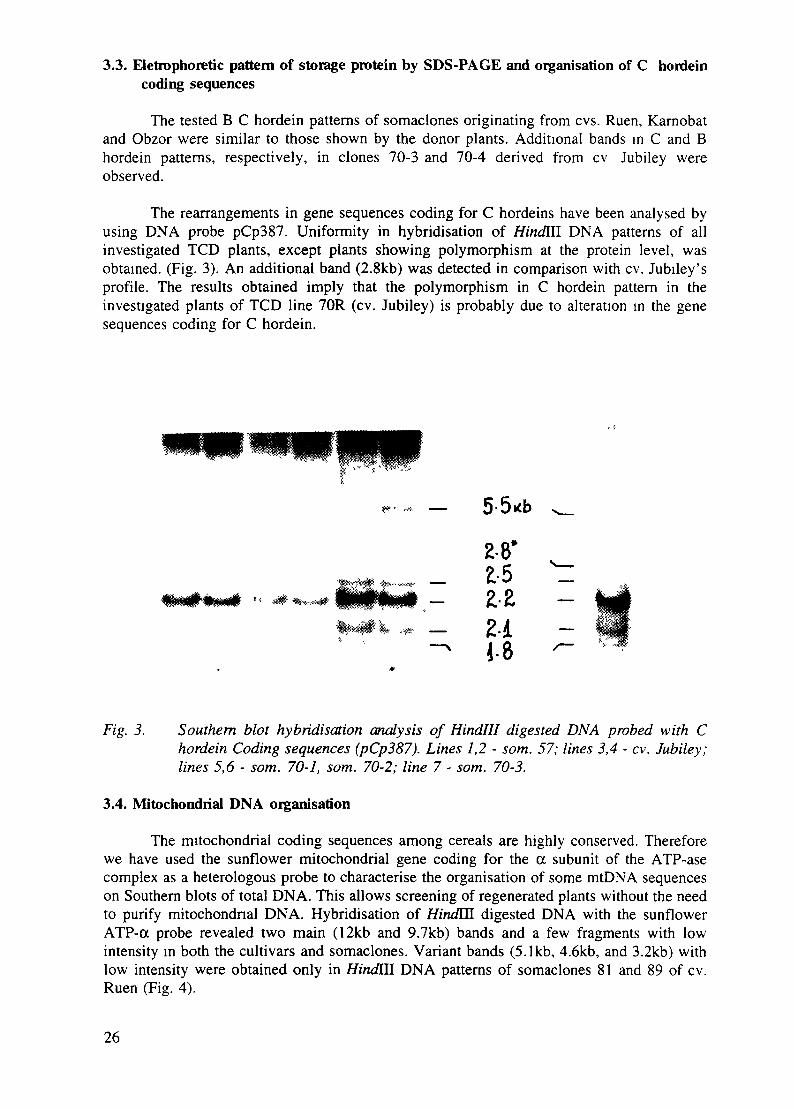
3.3. Eletrophoretic pattern of storage protein by SDS-PAGE and organisation of C hordeincoding sequences
The tested B C hordein patterns of somaclones originating from cvs. Ruen, Karnobatand Obzor were similar to those shown by the donor plants. Additional bands in C and Bhordein patterns, respectively, in clones 70-3 and 70-4 derived from cv Jubiley wereobserved.
The rearrangements in gene sequences coding for C hordeins have been analysed byusing DNA probe pCp387. Uniformity in hybridisation of Hindlll DNA patterns of allinvestigated TCD plants, except plants showing polymorphism at the protein level, wasobtained. (Fig. 3). An additional band (2.8kb) was detected in comparison with cv. Jubiley'sprofile. The results obtained imply that the polymorphism in C hordein pattern in theinvestigated plants of TCD line 70R (cv. Jubiley) is probably due to alteration in the genesequences coding for C hordein.
— 5-5«b
2-8'£-5 "=
Fig. 3. Southern blot hybridisation analysis of Hindlll digested DNA probed with Chordein Coding sequences (pCp387). Lines 1,2 - som. 57; lines 3,4 - cv. Jubiley;lines 5,6 - som. 70-1, som. 70-2; line 7 - som. 70-3.
3.4. Mitochondnal DNA organisation
The mitochondrial coding sequences among cereals are highly conserved. Thereforewe have used the sunflower mitochondrial gene coding for the a subunit of the ATP-asecomplex as a heterologous probe to characterise the organisation of some mtDNA sequenceson Southern blots of total DNA. This allows screening of regenerated plants without the needto purify mitochondnal DNA. Hybridisation of Hindis, digested DNA with the sunflowerATP-a probe revealed two main (12kb and 9.7kb) bands and a few fragments with lowintensity in both the cultivars and somaclones. Variant bands (5.1kb, 4.6kb, and 3.2kb) withlow intensity were obtained only in Hindm DNA patterns of somaclones 81 and 89 of cv.Ruen (Fig. 4).
26

- 2-03
Fig. 4. Southern blot hybridisation analysis of HindlH digested barley genomic DNA withmitochondria!probe ATP-A. Lane 1 - cv. Ruen; lane 2 - som. 78; lane 3 - som. 81;lane 4 - som. 89.
3.5. RAPD analysis of tissue culture derived lines
A few primers providing DNA polymorphism in somaclones were selected. Theamplification was repeated twice by using the DNA templates from the same lines of the nextgeneration (RC5) in order to investigate the reproducibility of the generated polymorphismsin RAPD profiles of these somaclones. Our study shows that primers OPA 08 and OPA 17produce reproducible polymorphic bands in RAPD profiles (Figs 5 and 6).
Fig. 5. RAPD patterns generated with primer OPA 08. Lane 1 - marker A*"; lane 2 - cv.Ruen; lane 3 - som. 103; lane 4 - som. 78; lane 5 - som. 34; lane 6 - som. 19; lane7 - cv. Obzor; lane 8 - cv. 468; lane 9 - cv. Kamobat; lane 10 - som. 44; lane 11 -som. 39; lane 12 - marker Aftr/.
27

Fig. 6. RAPD patterns generated with primer OPA 17. Lane 1 - marker Aft"; lane 2 - cv.Ruen; lane 3 - som. 103; lane 4 - som. 78; lane 5 - som. 34; lane 6 - som. 19; lane7 - cv. Obzor; lane 8 - cv. 468; lane 9 - cv. Kamobat; lane 10 - som. 44; lane 11 -som. 39; lane 12 - marker JT".
Somaclones 39 and 44 derived from cv. Karnobat are characterised with an additionalband (1.2 kb) and three missing fragments (1.65 kb, 1.49 kb, and 0.975 kb) in RAPD profilesgenerated with OPA O8 when compared to the control material. Two additional bands (1.2kb and 0.975 kb) were observed in somaclone 78 comparing to cv. Ruen and the othersomaclones 103, 34, 19.
Primer OPA 17 produced polymorphism in somaclones 34 and 19 (a 1.75 kb fragment)which is not observed in the other two somaclones 103 and 78. An additional band with thesame length was present in the RAPD pattern of somaclone 39 in comparison to the control(cv. Karnobat).
Few out of 10 tested primers (OPERON Kit A) showed polymorphism in RAPDprofiles in several mutant lines. Lines 95 (in vivo NaN3 10~3M) and 307 (in vitro NaN, 10~3M)reveal the absence of DNA fragments in RAPD profiles generated with primer OPA 01 incomparison to the control material and other mutant lines (Fig. 7).
Fig. 7. RAPD patterns generated with primer OPA 01. Line 1 - marker Aft"; line 2 - cv.Ruen; line 3 - som. 90 (in vivo 10 kRad); line 4 - som. 139 (in vitro 10 kRad); line5 - som. 78 (in vivo 20 kRad); line 6 - som. 152 (in vitro 20 kRad); line 7 - 87 (invivo NaN3 105); line 8 -12-5 (in vitro Na N3 105); line 9 - 215 (in vivo NaN3 103);line 11 - 307 (in vitro Na N3 103); line 12 - marker Aftr/.
28

4. DISCUSSION
The presented data suggest that in vitro cultivation induces variability and that themajority of barley plants recovered by callus culture possess both negative and positivechanges. While a lower degree of heritable variation among regenerants was reported by Karpet al. [17] our results confirm previous findings in barley [5, 8]. The application of mutagenicagents affects the rate of regeneration. A stimulating effect of 200 Gy gamma ray irradiationwas observed. Gross genetic changes were not found in the regenerants. Probably a strongdiplontic selection takes place during plant regeneration.
Field tests show that some of the deviations disappear in later progenies. The yielddiffers over years and it is difficult to use it as a test for detecting somaclonal variation.Probably in vitro regeneration influences some characteristics associated with stress factorswhich are reflected in productivity. Somaclonal variation is not the result of gross geneticchanges and field evaluation is not precise enough to detect deviations.
Molecular markers have been used for the estimation of genetic variability inducedafter regeneration via callus culture in barley [3, 4]. Our data suggest that by using clonepTA71 carrying genes for 26S, 18S and 5.8S rRNA any qualitative or quantitative differenceswere not detected in the non-transcribed spacer of rDNA of parental and regenerated barleyplants. Similar results were reported for wheat by Rode et al. [18]. The results demonstraterelatively high genetic stability in respect to highly repetitive domain of the ribosomal genes.
The in vitro culture manipulations may induce qualitative and quantitative variationin the mitochondrial DNA of calli and cell suspensions as described by Shirzadegan et al.[19]. In our investigation two TCD lines had some changes in mtDNA. Those variations inhybridisation patterns could be attributed to somaclonal variation. It is assumed that thealterations occurred in noncoding sequences of the mitochondrial genome [4] and therearrangements which occur in barley mitochondrial DNA during the tissue culture are rarelytransferred to the progenies of the regenerants [3]. In our case the variation was detected inRC3 progeny which indicates the stable heritable nature of the changes in the barley genomeas a result of tissue culture regeneration.
RFLP analysis of the Horl locus was performed as a complement to the proteinanalysis. The observed differences in mobility and number of fragments corresponding to Cand B hordeins in some somaclones were not dependent on the changes in the organisationof the coding sequences [2]. Breiman et al. [3] interpreted the lack of relationship betweenprotein and RFLP as a result of post-transcriptional events affecting the level of expressionof hordeins or of the rearrangements occurring outside the coding sequences. In our case theobserved variation in C hordein SDS-PAGE patterns in one TCD line of cv. Jubiley wasconfirmed by using RFLP analysis.
Recently, Song and Henry [13] applied RAPD markers to assess the genetic variationwithin and between wild barley populations (H. spontanewn). To our knowledge, RAPDanalysis has not yet been reported for the detection of somaclonal variation in barley. Wesucceeded in finding several polymorphisms in TCD barley lines by using 10-mer primers.They were stable and were inherited in the progeny.
In our studies, 15 families out of 64 TCD lines have been analysed by molecularmarkers for differentiating the genetic variation induced by tissue culture. Selection of thelines was made on the basis of field evaluation. This could be one of the reasons for finding
29

only limited variation on the basis of DNA analyses. The second reason could be that thenumber of the molecular markers used may not be sufficient to screen for somaclonalvariation unless sufficient probes are used to saturate the entire genome [20].
The results described here show that somaclonal variation is induced by tissue culturein barley by using a particular regeneration procedure (mutagenic effect of 2,4D - data notshown) and genotypes which may affect the genetic stability in both positive and negativedirections. The selected TCD lines show valuable agronomic changes. Tissue culture mayinduce rearrangements in any part of the entire plant genome. In this respect RAPD markersshowing heritable polymorphism are more representative than the limited number of theapplied RFLP probes use for detection of somaclonal variation in barley.
REFERENCES
[I] VITANOVA, Z., VITANOV, V., TRIFONOVA, A., SAVOVA, D., ATANASSOV,A., Effect of 2,4-D precultivation on regeneration capacity of cultivated barley, PlantCellRpt. 14(1995)437-441.
[2] KARP, A., STEEL, S.H., PARMAR, S., JONES, M.G.K., SHEWRY, P.R.,BREYMAN, A., Relative stability among barley plants regenerated from culturedimmature embryos, Genome 29 (1987) 405-412.
[3] BREIMAN, A., ROTEM-ABARBANELL, D., KARP, A., SHASKIN H., Heritablesomaclonal variation in wild barley (Hordeum spontaneum), Theor. Appl. Genet. 74(1987) 104-112.
[4] SHIMRON-ABARBANELL, D., BREIMAN, A., Comprehensive molecularcharacterization of tissue-culture-derived Hordeum marinum plants, Theor. Appl.Genet. 83 (1991)71-80.
[5] BREGITZER, P., POULSON, M., Agronomic performance of barley lines derivedfrom tissue culture, Crop Sci. 35 (1995) 1144-1148.
[6] LUCKETT, D.J., ROSE, D., KNIGHTS, E., Paucity of somaclonal variation fromimmature embryo culture of barley, Australian J. Agric. Res. 40 (1989) 1155-1159.
[7] BAHJLffi, A.M.R., ROSSNAGEL, E.G., KARTHA, K.K., Field evaluation of barley(Hordeum vulgare) genotypes derived from tissue culture, Can. J. Plant Sci. 72 (1992)725-733.
[8] ULLRICH, S.E., EDMISTON, J.M., KLEINHOFS, A., KUDRNA, D.S.,MAATOUGUI, M.E.H., Evaluation of Somaclonal variation in barley, Cereal Res.Commun. 19 (1991) 254-260.
[9] GALIBA, G., SUTKA, J., Frost resistance of somaclones derived from Triticumaestivum L. winter wheat calli, Plant Breeding 102 (1989) 101-104.
[10] MALUSZYNSKI, M., SZAREJKO, I., MADAJEWSKI, R., FUGLEWICZ, A.,KUCHARSKA, M., Semi-dwarf mutants and heterosis in barley. I. The use of barleysd-mutants for hybrid breeding, In: Semi-Dwarf Cered Mutants and Their Use inCross-Breeding III, Vienna: IAEA-TECDOC 455 (1988) 193-206.
[ I I ] KARADIMOVA, M. FILEV, K., DJAMBOVA, G., Calusogenesis and plantregeneration from gamma-irradiated cultures of durum wheat (Triticum durum).Second International Symposium. Experimental Mutagenesis in Plants. Plovdiv,Bulgaria (1987) 265-268.
[12] HARTMANN, C, RECIPON, H., JUBIER, M., VALON, C, DELCHER-BESIN, E.,HENRY, Y., DE-BUSER, J., LEJEUNE, B., RODE, A., Mitochondrial DNAvariability in a single wheat regenerant involves a rare recombination event across ashort repeat, Curr. Genet 25 (1994) 456-464.
30

[13] WILLIAMS, J.G.K., KUBELIK, A.R., LIVAK, K.J., RAFALSKI, J.A., TINGEY,S.V., DNA polymorphisms amplified by arbitrary primers are useful as geneticmarkers. Nucleic Acids Res. 18 (1990) 6531-6535.
[14] SONG, W., HENRY, R., Molecular analysis of the DNA polymorphism of wild barley(H.spontaneum) germplasm using the polymerase chain reaction, Genet. Res. and CropEvol. 42 (1995) 273-281.
[15] TAYLOR, P.W.J., GEIJSKES, H.L., KO., T.A., FRASER, R.J., HENRY, BIRCH,R.G., Sensitivity of random amplified polymorphic DNA analysis to detect geneticchanges in sugarcane during tissue culture. Theor. Appl. Genet. 90 (1995) 1169-1173.
[16] SMITH, D.B., PAYNE, P.I., A procedure for the routine determination ofelectrophoretic band patterns of barley and malt endosperm proteins, J. Natl. Inst.Agric. Bot. 16 (1984) 487-498.
[ 17] SAGHAI-MAROOF, M.A., SOLIMAN, K.M., JORGENSEN, R.A., ALLARD, R.W.,Ribosomal DNA spacer-length polymorphisms in barley: Mendelian inheritance,chromosomal location and population dynamics, Proc. Natl. Acad. Sci. USA 81 (1984)8014-8018.
[18] KARP, A., Somaclonal variation as a tool for crop improvement, Euphytica 85 (1995)1-3.
[19] RODE, A., HARTMANN, C, BENSLIMANE, A., PECARD, E., QUETIER, F.,Gametoclonal variation detected in the nuclear ribosomal DNA from double haploidlines of spring wheat, Theor. Appl. Genet. 74 (1987) 31-37.
[20] SHIRZADEGAN, M., CHRISTEY, M., EARLE, E.D., PALMER, J.D.,Rearrangements, amplification and assortment of mitochondria! DNA molecules incultured cells of Brassica campestris, Theor. Appl. Genet. 77 (1989) 17-25.
NEXT PAGE(S) IEeft BLANK I
• 31

SEARCHING FOR RFLP MARKERS TO IDENTIFY GENESFOR ALUMINUM TOLERANCE IN MAIZE
E. PAIVA, M.A. LOPES, S.N. PARENTONICentre Nacional de Pesquisa de Milho e Sorgo (CNPMS/EBRAPA),Sete Lagoas, MG, Brazil
P.R. MARTINSCNPMS / CNPq / RHAE,Sete Lagoas, MG, Brazil
G.A. TORRESUniversidade Federal de Lavras,Lavras, MG, Brazil
Abstract
The objective of this study was to identify restriction fragment length polymorphism (RFLP) markerslinked to Quantitative Trait Loci (QTL) that control aluminum (Al) tolerance in maize The strategy used wasbulked segregant analysis (BSA) and the genetic materials utilized were the F,, F, and F4 populations derivedfrom a cross between the Al-susceptible inbred line L53 and Al-tolerant inbred line LI327 The populations wereevaluated in a nutrient solution containing a toxic concentration of Al (6 ppm) and relative seminal root length(RSRL) was used as a phenotypic measure of tolerance The RSRL frequency distribution of the F, populationwas continuous, but skewed towards Al-susceptible individuals Seedlings of the F2 population with the highestand lowest RSRL values were transplanted to the field and subsequently selfed to obtain F3 and F4 families Theefficiency of the phenotypic index for selection was found to be greater when mean values were used instead ofindividual RSRL values F3 and F4 families were then evaluated in nutrient solution to identify those that werenot segregating Based on average RSRL values, F3 and F4 families were chosen to construct the bulks Onehundred and thirteen probes, with an average interval of 30 cM, covenng the 10 maize chromosomes were testedfor their ability to discriminate the parental lines. Fifty four of these probes were polymorphic with 46 showingcodommance These probes were hybndized with DNA from two F3 contrasting bulks and three probes onchromosome 8 were found to be able distinguish the F3 contrasting bulks on the basis of band position andintensity DNA of families from the F3 bulks hybndized with these probes showed the presence of heterozygousindividuals These three selected probes were also hybridized with DNA from F: individuals Two of themshowed a significant regression coefficient with the character However, each of these probes explained only about10% of the phenotypic variance observed in 70 F2 individuals One of the probes UMC 103 was hybndized withDNA from 168 F4 families and the regression analysis of RFLP data showed a significant regression coefficientwith a determination coefficient of 4 7% These results suggest that on chromosome 8 in maize there is a regionrelated to aluminum tolerance
1. INTRODUCTION
A major constraint to maize production in the tropics is the excessive acidity in thesoils In Brazil, acid savannas with low cation exchange capacity and high saturation of toxicaluminum cover 205 million ha. of which 112 million ha are suitable for agriculturalproduction [1]. In most of this area, deficiencies of P, Ca, Mg and Zn are common andsaturation of toxic Al and fixation of P by soil particles are usually high [2].
Although technology for topsoil acidity correction is widely used in the tropics, thereis no easy way to remove the effects of toxic aluminum in the subsoil. Therefore, to exploitthe soil in aluminum-rich areas it is important to develop breeding programs aimed atgenerating aluminum tolerant cultivars [3]. Maize breeders have identified genetic variabilityfor aluminum tolerance and germplasm suitable for selection is available [4-7].
33

Several techniques based on evaluations under field conditions and in nutrient solutionshave been developed to screen for aluminum tolerance in maize [8]. Although maize breedershave traditionally relied on evaluations in soils with high aluminum saturation, the use ofnutrient solutions with high aluminum concentrations has proven to be an effective way tocomplement field tests. The nutrient solution technique is rapid, allows screening of manyprogenies in small areas and allows better control of environmental variations, which is moredifficult to achieve under field conditions. Among the several criteria utilized to evaluatemaize aluminum tolerance in nutrient solutions, seminal root growth seems to be the mostreliable [7, 9, 11]. Using this criterion, several authors have shown that the trait isquantitatively inherited, with predominanly additive genetic effects [6, 7, 11]. However, dueto its high heritability, the character is expected to be controlled by a small number ofgenes [12].
Quantitative trait loci (QTL) controlling several important agronomic characters havebeen successfully studied through the use of molecular markers, utilizing techniques such asRestriction Fragment Length Polymorphism (RFLP) and random amplified polymorphic DNA(RAPD) [13-16]. However, the commonly used strategies to map QTLs are laborious, timeconsuming and require large number of individuals. Bulked segregant analysis (BSA) wasdeveloped as an efficient technique to score molecular markers to specific regions of thegenome [17]. This methodology has been shown to be very efficient in studying traitscontrolled by a small number of genes, and may also be utilized to study major QTLs withlarge effects on the phenotype [18]. Considering the evidence that aluminum tolerance inmaize is a quantitatively inherited trait possibly controlled by a small number of genes, theobjective of this work was to identify RFLP markers linked to QTLs affecting this trait byusing bulked segregant analysis.
2. MATERIALS AND METHODS
2.1. Phenotypic evaluation
The genetic materials utilized in this study consisted of F2, F3 and F4 populationsderived from a cross between the maize inbred lines, L53 and LI327, developed by the maizebreeding program of the National Maize and Sorghum Research Center, CNPMS/EMBRAPA,Brazil. These two lines have undergone more than ten generations of selfing. The aluminumsusceptible line (inbred L53) was derived from the open pollinated variety CMS11 (pool 21)and the aluminum tolerant parent (inbred LI327) was derived from Cateto Colombia.
The seeds were germinated for seven days in rolled paper towels moistened with tapwater. After measurements of the initial lengths of the seminal roots (ISRL), the seedlingswere transferred to plastic plates (49 seedlings per plate) and grown in a greenhouse for sevendays in eight liters of aerated nutrient solution containing 6 ppm of aluminum in the form ofKA1 (SO4)2 [7]. On each plate there were three seedlings from each of the parental inbredlines. During harvesting, final seminal root length (FRSL) was measured and the plantstransferred back to the nutrient solution. ISRL and FSRL were used to calculate the indexvalue for relative seminal root length (RSRL), where RSRL = (FSRL - ISRL)/ISRL.
In order to check the efficiency of the phenotypic index (RSRL), four inbred lines, twoAl-tolerant and two Al-susceptible were evaluated in nutrient solution containing toxicaluminum.
34

The seedlings with the greatest RSRL values (Al-tolerant) and the seedlings with thesmallest RSRL values (Al-susceptible) were transplanted from the nutrient solution to fieldconditions, grown and then selfed to obtain F3 families. F3 and F4 families were also grownin nutrient solution using the same procedure describe above. The objective was to identifyF3 and F4 families breeding true for the selected trait (Al-susceptibility at one end of thedistribution and Al-tolerance at the other end) for bulking and to eliminate the heterozygousones.
To obtain a phenotypic index based on average values of RSRL, 168 F4 families werealso evaluated in nutrient solution.
2.2. RFLP detection
The set of 113 RFLP markers used in this study corresponds to Pstl-digested genomicDNA cloned into pUC19 plasmids, obtained from David Hoisington (International Maize andWheat Improvement Center, CIMMYT, Mexico) and from Theresa Musket (University ofMissouri, Columbia). These markers have been previously shown to identify polymorphismin maize and are available with a linkage map data as a public set of maize RFLP probes. Onehundred and thirteen probes were selected at an average interval of 30 cM in such a way asto cover all the maize genome. These probes were then tested for their ability to identifyRFLPs between the parental inbred lines (L53 and LI 327) when their DNAs were digestedwith EcoRI, BamHl or Hindm.
The probes were labeled via amplification by the polymerase chain reaction usingdigoxigenin-11-dUTP (Boehringer Mannheim).
DNA was purified from lyophilized leaf tissue using the method described by Saghai-Maroof [19]. The DNA was quantified visually on 0.8% agarose gels by comparison withstandards of known concentration, and dissolved again to a concentration of Ijag/ial in TE(lOmM Tris pH 8.0; ImM EDTA). Approximately 30ug of genomic DNA was digested witheach of the three restriction enzymes using 2.5U of enzyme per ug of DNA for 18 hours at37°C. Digested DNA was loaded onto 0.8% agarose gels prepared with Ix TAB buffer (40mMTris acetate pH 8.0; lOmM EDTA) and electrophoresed overnight at 50V.
2.3. Bulk analysis
To construct the bulks, DNA was pooled from individuals from each selected F, or F4family. The DNAs were extracted, quantified and bulked in a such way that in each bulk allindividuals were equally represented.
Fifty four RFLP markers previously chosen for their ability to distinguish the parentalinbred lines and their F,s were used to identify polymorphism between the contrasting bulks.
3. RESULTS AND DISCUSSION
3.1. Phenotypic response to Al stress
The RSRL value frequency distribution obtained for the F2 population is shown inFigure 1. The mean RSRL values of the parental inbred lines (L53 and LI327) were 0.15 ±0.005 and 0.75 ± 0.028 respectively. The F2 population showed an average RSRL of 0.43 ±0.006 and variance of 0.058. Figure 1 shows a continuous distribution, which is typical of
35

quantitatively inherited traits, with a tendency toward more susceptible individuals. However,the recovery of parental phenotypes suggest that the aluminum tolerance may not be acomplex trait and is in agreement with past evidence that tolerance to aluminum is aquantitatively inherited trait controlled by a small number of genes [12].
1,6
Fig. 1. Histogram of RSRL values frequency distribution obtained from the F2 populationgrown in nutrient solution containing toxic concentration of aluminum. 95%confidence intervals are: 0.15 ± 0.01 (L53) and 0.75 ± 0.06 (L1327).
In order to check the efficiency of the phenotypic index (RSRL) four inbred lines, twoAl-tolerant and two Al-susceptible, were evaluated in the nutrient solution containing toxicaluminum. The phenotypic index obtained from the tolerant and susceptible inbred linesshowed that the index efficiency was greater when mean values were used instead ofindividuals RSRL values (Fig. 2).
-=-CMS36(X=0.62a)•*- L1143(X=a53b)— L53(X=0.25c)— L19(X=0.10d)
0,08 0,24 0/41 0,57 0,73
FBJOTYPIC CLASSES (RSRL)
1,06 1,22
Fig. 2. Frequency distribution of RSRL values of Al-susceptible inbred lines (LI 9 andL53) and A l-tolerant inbred lines (LI 143 and CMS36). Means followed by thesame letters are not statistically different at 5% significance level by the Tukeytest.
36

3.2. RFLP analysis
Of the 113 selected probes, 54 were able to distinguish the parental lines and their F,,with 46 probes showing codominance and eight showing a more complex pattern. Someprobes were polymorphic with more than one enzyme, thus a total of 73 RFLP marker lociwere identified. This number of polymorphic probes was not sufficient to provide the desiredgenome coverage since they were not uniformly distributed along the 10 maize chromosomes.
From the 54 markers used to analyze the contrasting bulks three markers onchromosome 8 (UMC48, UMC103 and CSU 155) revealed polymorphisms between them, asa result of differences in band position and intensity as shown in Figure 3.
M 1 2 3 4 5
UMC103
CSU155
UMC48
56.3 cM
88.7 cM
135 cM
Fig. 3. Southern blots of parental and bulked DNA samples digested with EcoRI and probedwith UMC103 (A), CSU 155 (B) and UMC48 (C). Lane 1, L53 (Al-susceptibleparent);lane 2, LI327 (Al-tolerantparent); lane 3, F,; lane 4 (Al-susceptible bulk); lane 5 (Al-tolerant bulk), lane M molecular weight marker. (<—) Arrows indicate the polymorphicregions. (D) Schematic representaiton of polymorphic markers location on chromosome8 [20].
Hybridization of DNA from individual members of the F3 bulks with the 3polymorphic markers showed that about 50% of the members in each bulk were heterozygousas shown in Figure 4. In the Al-susceptible bulk, the individuals 1 and 4 were consistentlyhomozygous for the 3 markers, the individuals 3, 5 and 6 were heterozygous and theindividual 4 varied. In the Al-tolerant bulk, individual 7 did not present a good resolution forinterpretation and therefore was not used. Individuals 9 and 10 were consistently homozygous;individual 11 was heterozygous for the three markers and the individual 8 varied from onemarker to another.
37

BS BT 1 2 345 67 8 9 10 11 M
B
Fzg. 4. Southern blots of bulked DNA samples and individual members of the bulks digestedwith EcoRI and probed with UMC103 (A), CSU155 (B) and UMC48 (C). SB, Al-susceptible bulk; TB, Al-tolerant bulk; 1 to 6, Al-susceptible individuals; 7 to 11, Al-tolerant individuals; M, molecular weight marker. (<—) Arrows indicate thepolymorphic regions.
Explanations for the presence of heterozygous individuals in the bulks could be thatthe phenotypic evaluation has not been efficient in identifying contrasting homozygousindividuals because of the trait complexity, failures in the methodology or both. Otherpossibilities are the occurrence of recombination between the QTL(s) and the region wherethe markers are located.
To confirm that these three probes were linked to the character, an RFLP analysis of70 F2 individuals was carried out as shown in Figure 5. Two of the selected probes showeda significant regression coefficient with the character. However, the determination coefficientfor each probe was low, explaining only about 10% of the phenotypic variance observed inthe 70 F2 individuals evaluated.
A further analysis using the probe UMC 103 hybridized with DNA of 168 F4 families,digested with EcoRI, showed a significant regression coefficient (P=0.5%) and a determinationcoefficient of 4.7%.
Although the F3 and F4 bulks identified heterozygous individuals, as shown in Figures4 and 6, the regression analysis of F2 individuals and F4 families showed that the UMC 103marker on chromosome 8 is associated with the trait. These results agree with the findings ofReiter et al. [14] who reported that there is a region on chromosome 8 that is highly correlatedwith root growth when maize is subjected to low-phosphorus stress.
38

RFLP ANALYSIS OF F2INDIVIDUALS
5 Southern blots of bulked DNA from Al-susceptible (BS) and Al-tolerant (BT) R3families and from 18 F2 individuals with lowest and highest RSRL values. The DNAwas digested with EcoRI and probed UMC103. Numbers above the lanes refer toRSRL values of the F2 individuals.
Fig. 6 Southern blots of DNA from parentals genotypes, (Susceptible - PS, Tolerant - PT),bulked DNA from F4 families (Susceptible bulk - BS and Tolerant Bulk - BT) andDNA from 16 F4 families with lowest RSRL means and 16 with highest RSRL means.DNA was digested with EcoRI and probed with UMC103. Numbers above the lanesrefer to RSRL mean values of the F4 families.
39

REFERENCES
[I] OLMOS, I.J.L., CAMARGO, M.N., Ocorrencia de Al toxico nos solos do Brasil, suacaracterizac.ao e distribuigao. Cienc. e Cult. 28 (1976) 171-180.
[2] LOPES, A.S., COX, F.R.A., Survey of the fertility status of surface soil under"cerrado" vegetation in Brazil. Soil Soc. Am. J. 41 (1977) 743-747.
[3] GOEDERT, W.J., LOBATO, E., WAGNER, E., Potencial agrfcola do cerradobrasileiro. Pesq. Agrop. Bras. 15 (1980) 1-17.
[4] RHUE, R.D., GROGAN, C.O., STOCKMEYER, E.W., EVERETT, H.L., Geneticcontrol of aluminum tolerance in corn. Crop. Sci. 18 (1978) 1063-1067.
[5] FURLANI, P.R., LIMA, M., MIRANDA, L.T., MIRANDA, L.E.C., SAWASAKI, E.,MAGNAVACA, R., Avaliagao de linhagens, materiais comerciais e duas popula9oesde milho para tolerancia ao alummio. Pesq. Agrop. Bras. 21 (1986) 655-660.
[6] LOPES, M.A., MAGNAVACA, R., BAHIA FILHO, A.F.C., GAMA, E.E.G.,Avalia9§o de populagoes de milho e seus cruzamentos para tolerancia a toxidez dealuminio em solucao nutritiva. Pesq. Agrop. Bras. 22 (1987) 257-263.
[7] MAGNAVACA, R., Genetic variability and inheritance of aluminum tolerance inmaize. Doctoral thesis, University of Nebraska, Lincoln, NE (1982).
[8] HOWELER, R.H., Identifying plants adaptable to low pH conditions. In: Plant SoilInteractions at Low pH (Wright, R.J., ed.). Netherlands (1991) pp. 885-904.
[9] RHUE, R.D., GROGAN, C.O., Screening corn for Al tolerance using different Ca andMg concentrations. A gron. J. 69 (1977) 775-760.
[10] GARCIA Jr., O., DA SILVA, W.J., MASSEI, M.A.S., An efficient method forscreening maize inbreds for aluminum tolerance. Maydica. 24 (1979) 75-82.
[ I I ] SAWASAKI, E., FURLANI, P.R., Genetica da tolerancia a toxidez do aluminio emlinhagens de milho cateto. Bragantia 46 (1987) 269-278.
[12] PRIOLI, A.J., Analise genetica da tolerancia a toxidez do aluminio em milho (Zeamays L.). Doctoral thesis, Universidade de Campinas, Campinas, SP. (1987).
[13] NIENHUIS, J., HELENTJARIS, T., SLOCUM, M., RUGGERO, B., SCHAEFER, A.,Restriction fragment length polymorphism analysis of loci associated with insectresistance in tomato. Crop. Sci. 27 (1987) 797-803.
[14] REITER, R.S., COORS, J.G., SUSSMAN, M.R., GABELMAN, W.H., Geneticanalysis of tolerance to low-phosphorus stress in maize using restriction fragmentlength polymorphisms. Theor. Appl. Genet. 82 (1991) 561-568.
[15] DIERS, B.W., KEIM, P., FEHR, W.R., SHOEMAKER, R.C., RFLP analysis ofsoybean seed protein and oil content. Theor. Appl. Genet. 83 (1992) 608-612.
[16] EDWARDS, M.D., HELENTJARIS, T., WRIGHT, S., STUBER, C.W., Molecular-marker-facilitated investigation of quantitative trait loci in maize. Theo. Appl. Genet.83 (1992) 765-774.
[17] MICHELMORE, R.W., PARAN, I., KESSELI, R.V., Identification of markers linkedto disease-resistance genes by bulked segregant analysis: a rapid method to detectmarkers in specific genomic regions by using segregating populations. Proc. Natl.Acad. Sci. USA. 88 (1991) 9828-9832.
[18] WANG, G.L., PATERSON, A.H., Assessment of DNA pooling strategies for mappingof QTLs. Theor. Appl. Genet. 88 (1994) 355-361.
[ 19] SAGHAI-MAROOF, M.A., SOLIMAN, K.M., JORGENSEN, R.A., ALLARD, R.W.,Ribosomal DNA spacer length polymorphisms in barley: Mendelian inheritance,chromosomal location and population dynamics. Proc. Natl. Acad. Sci. USA. 81 (1984)8014-8018.
[20] CHAO, S., BAYSDORFER, C., HEREDIA-DIAZ, O., MUSKET, T., XU, G., COE,E.H., RFLP mapping of partially sequenced leaf cDNA clones in maize. Theor. Appl.Genet. 88 (1994)717-721.
40

DETERMINATION OF MOLECULAR MARKERS ASSOCIATED WITHANTHESIS-SILKING INTERVAL IN MAIZE
J. SIMPSON XA9846995Centre de Investigaciones y Estudios Avanzados (CINVESTAV),Irapuato, Mexico
Abstract
Maize lines contrasting in anthesis-silking interval (ASI), a trait strongly linked to drought tolerance,have been analyzed under different water stress conditions in the field and with molecular markers. Correlationof marker and field data has revealed molecular markers strongly associated with flowering and yield traits.
1. INTRODUCTION
Drought is a severe problem in Mexico, where around 83% of the country is classifiedas arid or semi-arid [1]. Half the surface area depends on a growing season of less than 90days for annual crops [2]. Drought affects more than 7 million hectares sown with maize,which represents almost 88% of the total area of this cereal grown annually in Mexico. Lossesmainly due to water shortage have made it necessary for Mexico to import about 3 milliontons of maize annually.
During the growing season, maize requires between 500-800 mm of rainfall dependingmainly upon the particular climate, soil and method of management. These values areconsidered optimal in order to obtain acceptable yields under irrigation. Yields vary fromabout 6,000 kg/ha to 10,600 kg/ha, suggesting that approximately 750 kg of water are requiredfor each kg of grain produced. However, when irregularities occur in the distribution of watereasily obtained by the plant during the growth cycle, severe reductions in grain yield areobserved. Many reports indicate that flowering is the most sensitive stage for water shortage[3, 4, 5]. If only 83% of necessary water is provided during flowering, losses of up to 43%can be produced. Reduction in yield under drought stress is due to a combination of effectsthe direct result of which is the production of reduced numbers of grains per ear [3, 4, 6, 7,8, 9, 10]. Due to low water potential, growth of stigmas is inhibited, producing asynchronybetween anthesis and silking and consequently low levels of pollination.
Another phenomenon associated with low water potentials, is the inhibition of grainfilling leading to abortion of grain production. This was thought to be due to lack of transportof photosynthate to the grains but there is also evidence that there is a general lack ofphotosynthate under drought stress conditions and that transport is not the only effect. Thissuggests that the early stages of grain filling are dependent on a continuous supply ofcarbohydrates. Recently it has been shown that the number of grains is closely related to therate of photosymthesis before water stress rather than to photosynthetic reserves accumulatedbefore flowering [5, 11, 12]. This is in agreement with results obtained following 8 cycles ofselection for drought tolerance where reduction in the anthesis-silking interval (ASI) observedwas due to a greater accumulation of dry matter per spikelet. Therefore, the most efficientstrategy for obtaining drought tolerant plants would be to select plants with eithersynchronized flowering or early female flowering. ASI is a quantitative trait and short ASIunder water stress conditions is related to an increase in yield. Due to the complex nature ofthe trait and the difficulties in carrying out field experiments under water stress conditions,the determination of molecular markers associated with ASI and yield should provide anadvantage in selection of drought tolerant materials within a breeding program.
41

2. MATERIALS AND METHODS
2.1. Plant materials
S6 lines derived by single seed descent from an S3 population H-353 which wasformed from the cross Tuxpeno X Celaya.
2.2. Field conditions
Celaya, Guanajuato, Mexico,- Spring/Summer cycle 1994. The parental H-l (long ASI)and H-2 (short ASI) lines and the segregating F2 population, were sown at INIFAP's fieldstation in Celaya under six water stress regimes as indicated in Table I. The site at Celaya hasclay soils and is 1,680 meters above sea level. In this season precipitation is zero andtemperatures range from 15°C minimum to 32°C maximum. Plants were grown at a densityof 75,000/hectare.
The arrangement of treatments was in split plots where the main plots were the waterregimes and the sub-plots were the genetic materials. The different arrangements of treatmentswere distributed under a random block design with 4 replications. Evaluation of the dynamicsof soil humidity was carried out using a neutron disperser for depths of 0-15, 15-30 and 30-60cm pre-flowering and 0-15, 15-30, 30-60 and 60-90 cm post-flowering.
TABLE I. CORRELATION OF MARKERS AND TRAITS OF INTEREST USINGPOPULATION TAILS (TRAIT)
MARKER ANTHESIS SILKING ASI No. GRAINS W100G YIELD
UMC4UMC 14A27A36A86A87A140A152A155A158
0.30**0.44***
-0.22*-0.20*-0.38***-0.40***
0.26*0.40**0.52***
-0.27**-0.34***-0.44***-0.48***
0.34**0.33**0.33**
-0.40***-0.31**-0.35**-0.39**
-0.34**
-0.30**-0.56**0.27**0.22**0.46***0.51***0.41***0.24*
-0.29*-0.21*
-0.46***0.32**0.29**0.20*0.36***0.47***0.29**
-0.28
0.26*-0.50***0.38***0.25***0.42**0.44***
0.40**0.26**
*,**, *** - significant at P=0.05, 0.01, and 0.001 levels respectively.No. Grains = No. / ear, W100G = Weight of 100 kernels.
42

2.3. Southern blot analysis
Approximately 2.5 g of fresh tissue was used for DNA extraction by the method ofDellaporta et al. [13]. Following purification, DNA was digested with Hind III restrictionenzyme, according to the manufacturers instructions, and fragments were separated on 0.8%agarose gels. Gels were blotted to Hybond N+ nylon membrane (Amersham) by standardtechniques and fixed. Digoxigen labeled probes were prepared either by random priming [14]or by standard PCR techniques using digoxigen-11-dUTP. Prehybridization was carried outfor at least 30 minutes at 65°C, then hybridized at 65°C with gentle shaking overnight.Following hybridizaion the membranes were washed and exposed overnight to Dupont CronexX-ray film.
2.4. AFLP analysis
AFLP analysis was carried out with the permission and using a protocol provided byKeygene, Holland [15, 16].
2.5. Statistical analysis
Statistical analysis involved ANOVA, GLM, correlation and regression analysis using SASprograms and Mapmaker QTL [17] for molecular marker correlations.
3. RESULTS AND DISCUSSIONAnalysis of data from the field experiment showed that in general terms this
experiment was successful; adequate stress conditions were applied during the period up toand including the flowering stage, whereas during the grain filling period, plants wereunstressed. Although the average ASI was higher in most severely stressed environments,genotype rather than environment was shown to correlate with these differences as can be seenin Tables II and m.
In terms of yield, short ASI was correlated with higher yield. The F2 genotype showedthe highest yield suggesting that certain components of the long ASI genotype contributed tothe increase in yield observed in the F2 as compared to the short ASI genotype.
TABLE H. FIELD EVALUATION (MEAN ASI/GENOTYPE)
Population N Mean SD
1 Long ASI2 Short ASI3F24F35 BC- PI6 BC-P2
242424242424
10.568.318.158.379.367.90
1.121.191.010.952.551.22
43
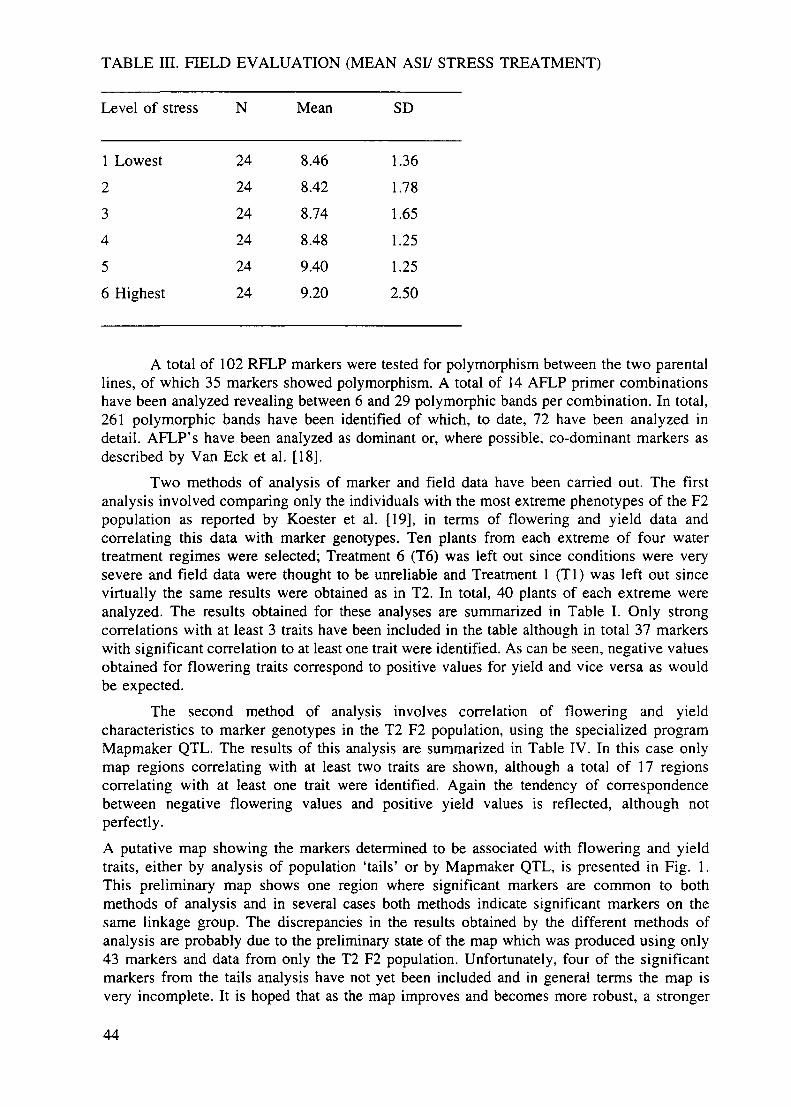
TABLE III. FIELD EVALUATION (MEAN ASI/ STRESS TREATMENT)
Level of stress N Mean SD
1 Lowest2
34
5
6 Highest
2424
2424
24
24
8.468.428.748.489.409.20
1.361.781.651.251.252.50
A total of 102 RFLP markers were tested for polymorphism between the two parentallines, of which 35 markers showed polymorphism. A total of 14 AFLP primer combinationshave been analyzed revealing between 6 and 29 polymorphic bands per combination. In total,261 polymorphic bands have been identified of which, to date, 72 have been analyzed indetail. AFLP's have been analyzed as dominant or, where possible, co-dominant markers asdescribed by Van Eck et al. [18].
Two methods of analysis of marker and field data have been carried out. The firstanalysis involved comparing only the individuals with the most extreme phenotypes of the F2population as reported by Koester et al. [19], in terms of flowering and yield data andcorrelating this data with marker genotypes. Ten plants from each extreme of four watertreatment regimes were selected; Treatment 6 (T6) was left out since conditions were verysevere and field data were thought to be unreliable and Treatment 1 (Tl) was left out sincevirtually the same results were obtained as in T2. In total, 40 plants of each extreme wereanalyzed. The results obtained for these analyses are summarized in Table I. Only strongcorrelations with at least 3 traits have been included in the table although in total 37 markerswith significant correlation to at least one trait were identified. As can be seen, negative valuesobtained for flowering traits correspond to positive values for yield and vice versa as wouldbe expected.
The second method of analysis involves correlation of flowering and yieldcharacteristics to marker genotypes in the T2 F2 population, using the specialized programMapmaker QTL. The results of this analysis are summarized in Table IV. In this case onlymap regions correlating with at least two traits are shown, although a total of 17 regionscorrelating with at least one trait were identified. Again the tendency of correspondencebetween negative flowering values and positive yield values is reflected, although notperfectly.A putative map showing the markers determined to be associated with flowering and yieldtraits, either by analysis of population 'tails' or by Mapmaker QTL, is presented in Fig. 1.This preliminary map shows one region where significant markers are common to bothmethods of analysis and in several cases both methods indicate significant markers on thesame linkage group. The discrepancies in the results obtained by the different methods ofanalysis are probably due to the preliminary state of the map which was produced using only43 markers and data from only the T2 F2 population. Unfortunately, four of the significantmarkers from the tails analysis have not yet been included and in general terms the map isvery incomplete. It is hoped that as the map improves and becomes more robust, a stronger
44

correlation between significant markers identified by the different methods of analysis will beobserved.
TABLE IV. CORRELATION OF MARKERS AND TRAITS IN WHOLE T2, F2
POPULATION (USING MAPMAKER QTL, LOD 2) (TRAIT)
MARKER ANTHESIS SILKING ASI No. GRAINS YIELD
A24-A271A60-A101A95-A158A156-A95
A140
A275
A192
A86
Ml
A92
A60
A226
A231
A1861
A16S
A155
A1S6
A95
A158
A24i1
A271
A31
A69
A258|1
A98 I1
A96 1A26 I
A242A243
A265
I J
A260|
|
A57| A54 • A 2 7 J A260|
ASS I A" I I A261
I A230I A66 IA56"
A101
A238A270
A18S
Fig. 1. Putative map showing markers related to flowering and yield traits.Numbers indicate markers, numbers underlined and in bold, indicate markerssignificant in 'tails'analysis. Vertical lines show regions where significant QTL's werefound in Mapmaker analysis.
4. CONCLUSIONS/PERSPECTIVES
The project has in general terms been successful, the field experiment and a largeproportion of the laboratory work have been completed. We plan to finish the molecularmarker analysis of the T2 population and then proceed with analysis of the T5 population forwhich all molecular marker information is already available as raw data. Inclusion of the T5population should help to improve the map and will allow a comparison of markers found tobe significant under conditions of low (T2) and high (T5) stress. The final goal of the projectis to use the marker information in an ongoing program for selection of drought tolerantmaterials.
45
REFERENCES
[I] FREGOSO, T.L.E., Efecto de la labranza y captation de lluvia sobre la estructura yalgunas propiedades hidrofisicas del suelo e indices fisiotecnicos de maiz (Zea maysL.), Tesis de grade M.C., Colegio de Posgraduados, Chapingo, Mexico (1991) 233 pp.
[2] ORTIZ, S.C., Evaluation de la aptitud de las tierras de Mexico para la production demaiz, frijol y sorgo en condiciones de temporal, Tech. Bull., Soil Science Dept.,Colegio de Posgraduados, Chapingo, Mexico (1984).
[3] DENMEAD, O.T., SHAW, H.R., Effects of soil moisture stress at different stages ofgrowth on the development and yield of corn, Agron. J. 52 (1960) 272-274.
[4] ECK, V.H., Effects of water deficits on yield, yield components, and water useefficiency of irrigated corn, Agronomy J. 78 (1986) 1035-1040.
[5] HERRERO, M.P., JOHNSON, R.R., Drought stress and its effects on maizereproductive systems, Crop Sci. 21 (1981) 105-110.
[6] BLUMP, A., Genotypic responses in sorghum to drought stress; I. Response to soilmoisture stress, Crop Sci. 14 (1974) 361-364.
[7] BOYLE, M.G., BOYER, J.S., MORGAN, P.W., Stem infusion of liquid culturemedium prevents reproductive failure of maize at low water potential, Crop Sci. 31(1991) 1246-1252.
[8] EDMEADES, G.O., BOLANOS, J., HERNANDEZ, M., BELLO, S., Causes for silkdelay in a lowland tropical maize population, Crop Sci. 33 (1993) 1029-1035.
[9] JURGENS, S.K., JOHNSON, R.R., BOYER, J.S., Dry matter production andtranslocation in maize subjected to drought during grain filling, Agron.J. 70 (1978)678-682.
[10] SCHUSSLER, J.R., WESTGATE, M.E., Increasing assimilate reserves does notprevent kernel abortion at low water potential in maize, Crop Sci. 27 (1994) 639-648.
[ I I ] BASSETTI, P., WESTGATE, M.E., Emergence, elongation and senescence of maizesilks, Crop Sci. 33 (1993) 271-275.
[12] WESTGATE, M.E., BOYER, J.S., Reproduction at low silk and pollen water potentialsin maize, Crop Sci. 26 (1986) 951-956.
[13] DELLAPORTA, S.L., WOOD, J., HICKS, J.B., A plant DNA minipreparation: VersionII, Plant Mol. Biol. Reporter 1 (1983) 19-21.
[14] FEINBERG, A.P., VOGELSTEIN, B., A technique for radiolabelling DNA restrictionfragment length polymorphisms to high specific activity, Annal. Biochem., 132 (1983)6-13.
[15] LIN, J.J., KUO, J., AFLP™. A novel PCR-based assay for plant and bacterial DNAfingerprinting, Focus 17 (1995) 66-70.
[16] ZABEAU, M., Selective restriction fragment amplification, European PatentApplication, Number 92402629.7, Europea Patent Office (1993).
[17] LANDER, E.S., BOTSTEIN, D., Mapping Mendelian factors underlying quantitativetraits using RFLP linkage maps, Genetics 121 (1989) 185-199.
[18] VAN ECK, H.J., ROUPPE VAN DER VOORT, J., DRAAISTRA, J., VANZANDVORT, P., VAN ENCKEVOORT, E., SEGERS, B., PELEMAN, J.,JACOBSEN, E., HELDER, J., BAKKER, J., The inheritance and chromosomallocalization of AFLP markers in a non-inbred potato offspring, Mol. Breeding, 1(1995) 397-410.
[19] KOESTER, R.P., SISCO, P.H., STUBER, C.W., Identification of quantitative trait locicontrolling days to flowering and plant height in two near isogenic lines of maize,Crop Sci. 33 (1993) 1209-1216.
46

INCORPORATION OF CONVENTIONAL GENETIC MARKERS XA9846996AND RAPD MARKERS INTO AN RFLP BASED MAP IN MAIZE
E.H. COE, Jr., M.D. McMULLEN, M. POLACCOUSDA-ARS, Plant Genetics Research Unit,Columbia, Missouri, United States of America
G.L. DA VISUSDA-ARS, Corn Host Plant Resistance Research Unit,Mississippi State University, Mississippi, United States of America
S. CHAOInstitute of Botany,Academia Sinica,Nankang, Taipei, Taiwan
Abstract
Integration of classical genetic markers, in particular mutants, onto the maize Restriction FragmentLength Polymorphism (RFLP) map will provide the tools necessary to further our understanding of plantdevelopment and of complex traits. Initially integration was accomplished by visual alignment or commonmarkers and sometimes involved the use of information from several different molecular maps to determine therelative placement of a single mutant. The maize core marker set was designed to provide a common set otmarkers which could be used for integration of map data. We have completed the mapping of 56 mutants onchromosome one relative to the core marker set. Phenotypes included whole plant, seedling, and kernel effectsand represented a variety of biological processes. Since these mutants were previously located to chromosomearm, mapping required the use of only seven markers per mutant to define the correct bin location Two mistakesin marker order relative to the classical map were identified, as well as, six groups of mutants which requireallehsm testing Placement of mutants and cDNAs into bins using the core markers provides a necessary resourcefor identification of gene function in maize.
1. INTRODUCTION
Genetic and molecular maps in maize have been available for 61 and 11 years,respectively [1, 2]. Integration of the two will help us towards the goal of understandingcomplex traits. Establishment of a set of "core" markers which evenly divide the genome hasprovided the necessary bridge to accomplish integration of them [3, 4]. Through these markersany mutant mapped using publicly available clones can be placed on the maize bin map(http:\\www.teosinte.agron.missouri.edu). Individual bins comprise approximately 20 cMintervals along the chromosome. In addition to Restriction Fragment Length Polymorphism(RFLP) markers and mutants, Quantitative Trait Loci (QTLs) can also be assigned to bins.The most informative RFLP markers for studying complex traits are sequenced cDNAs(expressed sequence tags; ESTs) because of their potential to mark sites of known function.Randomly Amplified Polymorphic DNA (RAPD) markers, while more economical, presenta less desirable alternative to cDNAs because they provide no potential information onfunction at the site they mark.
Given the myriad of mutants which have been identified in maize and the currenttechnologies available for large scale sequencing, we are focusing our efforts in two areas:mapping of mutants relative to molecular markers and mapping of ESTs, with the goal ofproviding a resource of molecularly or functionally defined genes catalogued by location. Ourspecific objectives were to define a set of publicly available core markers for use inintegrating mapping data and to use these markers to map maize mutants onto the bin map.
47

2. MATERIALS AND METHODS
2.1. Core markers
Potential core markers were chosen initially based on simple fragment pattern and evendistribution at approximately 20 cM intervals on the chromosomes. Markers not among theprevious core marker set identified by Gardiner et al. [3] were screened against inbreds A619,A632, B73, Mol7, CO159, and Tx303 using EcoRl, HindHL, EcoRV, BamW, £>ral, Xbd,fig/II, and Sstl and the polymorphism rate was assessed. A marker was designated acceptableif it was polymorphic with a minimum of three of the eight enzymes with a majority of theinbred lines. A number of substitutions were made compared to the previous core marker setdue to low levels of polymorphism or high fragment pattern complexity. Final choices weremade based on even spacing, simple fragment pattern, high degree of polymorphism, andpublic availability. Markers meeting these criteria that had insert sizes less than 1000 basepairs were given preference to facilitate single-pass sequencing.
Core markers were prepared for sequencing using the alkaline lysis method. DNAquality was assessed using 0.8% agarose gels containing cut and uncut DNA. Quantity wasdetermined using a spectrophotometer. Sequencing was performed either by dideoxy-termination reactions labeled with 35S a-dCTP according to manufacturer recommendationsfor the T7 Sequenase Kit (US Biochem) or by PCR incorporation of fluorescently labelledbases followed by sample processing on the ABI sequencer. Results of the manual sequencingwere entered into DNA to determine overlap. BLASTX searching was conducted against thenonredundant database of GenBank. All matches were evaluated using the MOTIFS programto determine whether homology occurred in a conserved protein domain.
2.2. Mutant mapping
Mutants used for this study were previously mapped to chromosome arm by geneticexperiments involving other mutants or by cytogenetic tests. The mutants used represent wholeplant, seedling and kernel defects and include a variety of biological processes. A list ofmutants and phenotypes is provided in Table I. More detailed phenotypic descriptions arepresented for the mutants which have been given gene designations.
One to four F2 mapping populations were derived for each individual mutant where thenonmutant parent was one of the following inbreds, A619, A632, B73, or Mol7. Attemptswere made to produce four segregating populations for each mutant to maximize the chanceof obtaining polymorphisms for each of the core markers evaluated and to allow futureevaluation of potential modifiers of trait expression.
Forty kernels per F2 family were planted in the field. For mutants expressed in theseedling or adult plants, families were scored for presence of the mutant and individuals self-pollinated. Kernel phenotypes were scored on F2 ears prior to planting in the field and againon F3 ears. In families with seedling phenotypes, forty F3 seed from each ear were evaluatedin the sandbench to determine the genotype of each F2 individual. In families with adult plantphenotypes, forty F3 seed from each ear were evaluated in the field the following season todetermine genotypes for each F2 individual.
Tissue for RFLP analysis was collected from either field grown individuals or sandbenchbulked F3 progeny rows. 100 mg. of lyophilized tissue was extracted for each individual using
48

an ammonium acetate extraction technique. Extractions were divided into two aliquots anddigested with EcoRI and HindUI. Southern analysis of EcoRI and HindlLl digested DNA foreach F2 family was performed according to standard laboratory procedures [5]
TABLE I MUTANTS AND THEIR ASSOCIATED PHENOTYPES
Mutant1 Phenotype
ad* adherent seedlingadl adherent 1--seedling leaves, tassel branches, and occasionally top leaves adherean 1 anther ear-andromonoecious dwarf of intermediate statureblh* bleached seedlingBlhl bleached 1—dominant plants have pale green midvems and base in the upper leaves ot the
plantbnk* brown kernelbr* brachytic plantcp* collapsed kernelct2 compact plant 2—plant is semi-dwarfed with a club tasseld* dwarfdcr* defective crownde* defective kerneldnt* dentet* etchedhcfSl high chlorophyll fluorescence 31-yellow/green seedlings lacking chlorophyll a/b binding
protein1* luteus116 luteus 16~yellow green leaves with patches that bleach to paler yellow11s 1 lethal leaf spot l--chlorotic to necrotic lesions similar to those of Helmmthosponum
carbonum infected plantsnee* necrotic seedlingpg* pale greenpgl5 pale green 15—light yellow green seedling with patches bleaching to whiters2 rough sheath 2—short, zigzag plants with wart-like distorted leaves and sheathsSink* small kernelspc2 speckled 2--green seedlings containing light green specklesspc* speckled seedlingsrl striate 1— leaves contain many white stripestlr* tillered plantty* tiny plantv* virescent leafVgl vestigial glume 1-glumes very small leaving cob and anthers exposed, upper leaves alsohave scant hgulesvp* viviparousvp5 viviparous 5~embryo fails to become dormant, white endosperm and seedling, encodes
phytoene C-11,12 desaturasevp8 viviparous 8—embryo doesn't become dormant, produces small, pointed-leaved seedlingsw* white seedlingwl* white luteus seedlingwlu5 white luteus 5—cream colored seedlingzb4 zebra crossbands 4—alternating bands of green, yellow-green, and white, more pronounced
in cooler temperatureszb7 zebra crossbands 7-alternatmg bands of green and pale green on glossy seedlingszll zygotic lethal 1-homozygous recessive zygotes do not develop
' Mutant designations followed by an astencks have not yet been designated as distinct genes pending turtherinformation regarding map locations and allehsm tests
49
Hybridizations were carried out using 32P cc-dCTP labelled probes in bulk lots of 40membranes corresponding to a chromosome arm using each of the individual core markers forthat arm. The hybridization mixture was reused the following day for a second set of 40membranes. Prehybridization and hybridization protocols followed the standard laboratoryprocedures [5]. Following washing, the radioactive membranes were exposed to Kodak X-OMAT film in the presence of a Cronex-type intensifying screen at -80 C. Marker bnl8.29 wassubstituted for umc!61 as umcl61 was not polymorphic in these materials.
Mapscores were aligned in core marker order in a spreadsheet and mutants weretentatively placed to an interval by minimizing the number of double-crossover events. Maplocations were confirmed using Mapmaker for Macintosh version 2.0. A second confirmationbased on concurrent map locations of the same mutant mapped in different F2 backgroundswas also used as a check.
3. RESULTS
3.1. Core markers
A set of ninety maize core markers were identified that best met the selection criteria.Table II lists the core markers, their bin number, and homology information. The averagedistance between core markers is 18 cM. Information regarding polymorphisms for the inbredsand enzymes tested is to be made available through the Maize Genome Database. Core markersets are available through the probe request form of the database or by contacting the labdirectly. The set consists of 75 genomic and 15 cDNA markers. Homology to genes of knownfunction was identified by BLASTX searching of the nonredundant Genbank database for 20of the 90 core markers with functionality of an additional 4 clones identified by targetedcloning experiments. Twenty-four percent of the genomic cores and 20% of the cDNA coresderived by non-targetted cloning had homology to genes with known function.
3.2. Mutant mapping
56 mutants were mapped to bins on maize chromosome 1 (Table III). Prior to thisstudy, 44 of the mutants were known only to be located to chromosome arm, 21 on the shortarm and 23 on the long arm. No mutants were mapped in bin 1.06 which is believed tocontain the centromere based on translocation studies. The map order of v5 relative to srl andzb4 relative to pi was found to be reversed on the classical genetic map. Six groups of mutantswith similar phenotype were identified based on bin assignment which are candidates forallelism testing. They are zll, et*-0634C, vp5, and cp*-W78A; ry*-0780A and bnk*-1519C;wl*-1930 and wl*-144; wlu5, w*-1890, wl*-47, wl*-56, and wl*-60; l*-129 and l*-544; andspc*-370, spc2, and blh*-43. One group, ty*-0780A and bnk*-1519C, was identified when itwas noticed that some plants in the family segregating for brown kernel were also dwarf.Subsequent analysis revealed that these were the brown kernel individuals.
4. DISCUSSION
A fast, easy, cost-effective strategy for mapping a large number of mutants has beendeveloped. Approximately 400 samples can be isolated by one individual in a day at a costof one cent each. A maximum of seven probes are required to place a mutant into its correctbin. Three additional probes for a total of ten will place it in a five centiMorgan interval. Bygrouping the mutants into bins prior to testing for allelism, the number of crosses needed todetermine allelic relationships is greatly reduced.
50

TABLE II. UNIVERSITY OF MISSOURI - COLUMBIA (UMC) MAIZE CORE MARKERSINCLUDING BIN ASSIGNMENTS AND HOMOLOGY INFORMATION
Marker name
p-tublp-umc!57p-umc76p-asg45p-csu3p-umc67p-asg62p-umc!28p-csu!64p-umcl07p-umc!61p-bn!6.32p-bnl8 45p-umc53p-umc6p-umc34p-umcl31p-umc255p-umc5p-asg20p-umc49p-php20581p-umc32p-csu32p-asg24p-asg48p-umc!02p-bnl5.37p-bn!6 16p-umc!7p-umc63p-csu25p-agr rl!5p-php20725p-umc3 1p-npi386p-agr r37p-umc!56p-umc66p-umc!27p-umc52p-php20608p-umc!69p-npi409p-umc90p-tub4p-bnl4.36p-csu93p-umc!26p-umcl08p-bnl5.24p-phpl0017
Bin'
1 01.02.03040506.07.08
1.091.101.111.122.012.022.032.042.052.062.072.082.092.103.013.023.033.043.053.063.073.083.093.104.014.024.034.044.054.064.074.084.094.104.115.015.025.035.045.055065.075.085.09
Homology information
(3-tubuhnno matchno matchprotein kinase, U26746, Brassica napusno matchno matchno matchno matchno matchDNA-binding protein; transcription factor U39361 humanno matchno matchno matchno matchno matchno matchpistil-specific extensin Z 140 19 Arabidopsis thalianano matchno matchno matchno matchextensms Z46674 tomatono matchno matchglutamyl-tRNA synthetase, Z91787 Lupmus luteusno matchno matchno matchvarious different proteinsno matchno matchP450; U3907 ratnot sequencedno matchno matchvarious proteins containing polyprolme runsno matchno matchplant transposon; X52387 potatono matchextensin; X55681 tomatono matchextensin; X55686 tomatono matchno match(3-tubuhnnot sequencedno matchno matchvarious different proteinsno matchno match
51

TABLE II (cont)
Marker name Bin1 Homology information
p-umc85p-umc59p-npi393p-umc65p-umc21p-umc38p-umc!32p-asg7p-asg8p-asg34
p-asg49p-umc254p-umc245p-umc!68p-npi220p-bn!9 1 1p-umc!24p-bn!7 08p-bn!2 369p-csu31p-npi268p-npi414p-agr r21p-umcl09p-umc!92p-umc25p-csu!47p-umc95p-csu61p-asg!2p-csu54p-php20075p-npi285p-umcl30p-umc64p-umc259p-umc44p-bn!7 49
601602603604605606607608701702
7037047057068018028038048058068078088099019029039049059069079081001100210031004100510061007
no matchno matchno matchno matchno matchno matchno matchno matchmyb related proteins, XI 3294 human A-myb proteinmethylmalonate-semialdehyde dehydrogenase M84911,Pseudomonas aerugmosano matchno matchno matchno matchno matchleucyl-tRNA synthetase, M88581, Bacillus subtilischohne kinase active site, U62317 humanno matchnot sequencedno matchno matchno matchnot sequencedConstans protein, U62317, Arabidopsis thalianabronze 1waxy 1no matchno matchno matchno matchno matchgibberellin (and auxin) stimulated proteins X63093, tomatovarious calcium channel proteins, L29346 mouseno matchno matchno matchno matchhomeobox domain, U34743 orchid
'Bins are defined as the interval between two adjacent core markers starting with the first (upper) core markerand continuing until just before the second (lower) core marker
52

TABLE III. BIN ASSIGNMENTS OF 56 MAIZE MUTANTS
Mutant
illet*-0634Cv/,5Blhldcr*-I176Acp*-1078Anec*-0495BPKiStrlSmk*-f!45B\p*-1136BU2hcf31Hi!de*-I345Bpg*-484Bde*-I081116t\ *-0780Azb4bnk*-15I9Cde*-1390Awt*-1930r?2wl*-144de* I057Bwlu5v, "-1R90wl*-47wl*-56wl*-60Vglan]ad)w*-1802Mutantcp*-0948Abr*de*-IO!6Ade*-1420d* 1352Bl*-129dnt*-1185AI* 544tir*-2245d*-0998Btpc"-370v*-55zb7ad*-582blh*-43de*-1061Atpc2pS'-343\ "-245\p8
Bin assignement1
I 01101I 01l 01101-1021 01-1021 01-1 021021021 02-1 031 02-1 041 031031 031031031 03-1 041 041041 041 041 041 051051 051051 071071071 071071 071081081 08-1 09Bin assignment11 08-1 091 08-1 091 08-1 091 08-1 091 091 091 091 091 09-1 111 101 101 101 101 101 101 10-1 111 10-1 111 10-1 111 111 11
1 Mutants listed with a range of bin assignments are the result of lack of polymorphism for the interveningcore marker and could be assigned to an individual bin using additional markers
53

The maize RFLP and genetic maps can be aligned based on the framework establishedby the core markers. The current UMC (University of Missouri, Columbia) Maize RFLP mapcontains 982 loci, 49% of which have sequence information and 29% of which correspond togenes of known function [4]. Additional ESTs from the Brookhaven and INRA maps can beassigned to bins enhancing the number of loci with information about function [6, 7]. Thecurrent bin map maintained and updated in the Maize Genome Database contains 3516 binnedloci including RFLPs, mutants, and cytological events. Combination of sequence and functioninformation either as ESTs or phenotypic mutants provides the resource necessary for genediscovery in maize. Cataloguing the loci into bins enables identification of potentialassociations of functions with phenotypes including quantitative trait loci which warrantfurther investigation.
REFERENCES
[1] EMERSON, R.A., BEADLE, G.W., FRASER, A.C., A summary of linkage studies inmaize, Cornell Univ. Agric. Exp. Stn. Memoir 180 (1935) 1-83.
[2] HELENTJARIS, R., SLOCUM, M., WRIGHT, S., SCHAEFER, A., NEINHUIS, J.,Construction of genetic linkage maps in maize and tomato using restriction fragmentlength polymorphisms. Theor. Appl. Genet. 72 (1986) 761-769.
[3] GARDINER, J.M., COE, E.H., Jr., MELIA-HANCOCK, S., HOISINGTON, D.A.,CHAO, S., Development of a core RFLP map in maize using an immortalized F2population, Genetics 134 (1993) 917-930.
[4] YERK-DAVIS, G.L., McMULLEN, M.D., GRANT, D., MUSKET, T.,BAYSDORFER, C, STAEBELL, M., XU, G., POLACCO, M., KOSTER, L.,HOUCfflNS, K., CHAO, S., COE, E.H., Jr., An improved maize map standard: ESTsand sequenced core markers in a 982-point map. (in preparation for submission toGenetics).
[5] RFLP Procedures Manual. Maize RFLP Laboratory. University of Missouri-Columbia,44p.
[6] MATZ, E.G., BURR, F.A., BURR, B., Molecular maps based on TxCM and CoxTxrecombinant inbred families, MNL 69 (1995) 257-267.
[7] CAUSSE, M., SANTONI, S., DAMERVAL, C., MAURICE, A., CHARCOSSET, A.,DEATRICK, J., DEVIENNE, D., A composite map of expressed sequences in maize,Genome 39 (1996) 418-432.
54

TAGGING OF BLAST RESISTANCE GENE(S) TO DNA MARKERS ANDMARKER-ASSISTED SELECTION (MAS) IN RICE IMPROVEMENT
J.Y. ZHUANG, J. LU, H.R. QIAN, H.X. LIN, K.L. ZHENGDepartment of Biotechnology, XA9846997China National Rice Research Institute,Hangzhou, China
Abstract
This paper reports progress made on the tagging of blast resistance gene(s) to DNA markers and on theinitiation of marker-assisted selection (MAS) for blast resistance in rice improvement
A pair of near isogenic lines, K80R and K79S, were developed using a Chinese landrace Hong-jiao-zhanas the resistance donor. Ten putatively positive markers were identified by screening 177 mapped DNA markersUsing the F2 population of 143 plants and the derived F3 lines, three Restriction Fragment Length Polymorphism(RFLP) markers (RG81, RG869 and RZ397) on chromosome 12 of nee were identified to be closely linked tothe blast resistance gene Pi-12(t). The genetic distance between Pi-12(t) and the closest marker RG869 was 5 1cM. By employing the bulk segregant analysis (BSA) procedure, six of 199 arbitrary primers were found toproduce positive Randomly Amplifiedl Polymorphic DNA (RAPD) bands Tight linkage between Pi-I2(t) andthree RAPD bands, each from a different pnmer, was confirmed after amplification of DNA of all F2 individualsTwo fragments were cloned and sequenced, and two sequence characterised amplified region (SCAR) markerswere established.
In two other F3 populations, Xian-feng 1/Tetep and Xian-feng 1/Hong-jiao-zhan, the blast resistance wasfound to be controlled by interactions of two or more genes One resistance gene was located in the vicinity ofRG81 in both populations. Work to identify other gene(s) is currently under way.
Marker assisted selection for blast resistance was initiated Crosses were made between elite varietiesand blast resistance donors to develop populations for DNA marker-assisted selection of blast resistance Inaddition, 48 varieties widely used in current rice breeding programs were provided by rice breeders DNA marker-based polymorphism among these varieties and resistance donors were analysed to produce a database for futureMAS program.
1. INTRODUCTION
Rice blast, caused by Pyricularia oryzae Cav., is generally considered as the mostimportant disease of rice because of its world-wide distribution and because of the severelosses in yield it may cause. Growing resistant varieties has been the most economical andeffective way of controlling this disease. Unfortunately, blast resistance in rice varieties canbe lost soon after large scale cultivation due to the development of new races or pathotypesof the pathogen. Breeding varieties with multiple resistance genes or a series of near isogeniclines (NILs) with different resistance genes (i.e. multi-lines) has been suggested as a solutionto this problem [1, 2]. However, the reaction of different resistance genes to races of thepathogen may be similar, and the identification of blast resistance through inoculation withthe fungus can be greatly limited by plant developmental stages and environmental factors.Conventional ways of host resistance identification would not always be helpful for neebreeders to determine whether different resistance genes have been integrated into a given lineor a series of multi-lines.
On the other hand, indirect selection based on tightly linked genetic markers seems tobe more promising in pyramiding the resistance genes and in the development of multi-lines.This relies on the exploitation of the tightly linked markers and the establishment ofconvenient and low cost detection procedures. The development of DNA restriction fragmentlength polymorphism (RFLP) and random amplified polymorphic DNA (RAPD) techniqueshas provided powerful tools for mapping genes of the interest [3, 4]. This paper reports ourprogress on the identification of DNA markers closely linked to a blast resistance gene, on the
55

studies of the interaction of different blast resistance genes, and on the initiation of DNAmarker-assisted selection (MAS) for blast resistance.
2. MATERIALS AND METHODS
2.1. Tagging of a blast resistance gene to DNA maikeis
A pair of NILs, K80R (resistant to the rice blast) and K79S (susceptible) weredeveloped [5]. The resistance donor used was a local Chinese indica cultivar Hong-jiao-zhan,which is well-known for its wide-spectrum and durable resistance to blast. The recurrentparent is an indica variety IR24.
An F2 population of K80R/K79S consisting of 150 plants was grown at China NationalRice Research Institute (CNRRI) in 1992. Blast resistance was evaluated by inoculation of therace ZB1 of Pyricularia oryzae Cav to each F2 individual, and verified by inoculation to 12plants of each F3 line. DNAs of each F2 individual as well as the four parental lines wereextracted and subjected to RFLP analysis following methods described previously [6, 7].
Of 177 probes used, probe/enzyme combinations detecting polymorphisms between thedonor and recurrent parents were used for the analysis of the NILs. Putatively positive resultswith a probe were examined further to see if the probe pattern co-segregated with blastresistance in the F2 population. The computer program MAPMAKER [8] was used for linkageanalysis. Distances between markers were presented in centimorgons (cM) derived using theKosambi function [9].
To fine map the resistance gene with additional DNA markers, the bulk segregantanalysis (BSA) procedure was employed. Equal quantities of DNAs from 10 homozygousresistant F2 individuals were mixed to construct a resistant pool (R pool), and equal quantitiesof DNAs from 10 homozygous susceptible F2 individuals were mixed to construct asusceptible pool (S pool). RAPD analysis of the pools was performed as describedpreviously [5].
Primers generating polymorphic RAPD bands between the two pools were used toanalyse their co-segregation with blast resistance in the F2 population. RAPD fragments whichco-segregated with blast resistance were cloned and sequenced. Two pairs of primers weresynthesised for specific amplification.
2.2. Studies of gene interactions
Two F3 populations were constructed, using a susceptible indica variety Xian-feng 1as the common female parent, and blast resistance cultivars Tetep and Hong-jiao-zhan as themale parents, respectively. The three parental lines were inoculated with each of 20 blastraces. The race ZC13 was selected to inoculate 161 F3 lines of Xian-feng 1/Tetep and 175 F-,lines of Xian-feng 1/Hong-jiao-zhan. Eighteen individuals of each line were inoculated. DNAswere extracted from bulked samples of 12 F3 individuals of each line. RFLP analysis andspecific amplifications were conducted by using DNA markers in the vicinity of mappedresistance genes on chromosome 12. BSA was then employed to identify RAPD markerslinked to other resistance genes.
56
2.3. Initiation of MAS for blast resistance
Crosses were made between elite varieties and blast resistance donors in HainanProvince in the winter of 1995. The F, was grown in CNRRI in 1996 and backcrossed withelite varieties. A polymorphism survey was conducted using DNA markers linked to resistancegenes.
Forty-eight varieties which were widely used in current rice breeding programs wereprovided by rice breeders. DNA marker-based polymorphism among the 48 varieties andresistance donors are being surveyed.
3. RESULTS AND DISCUSSION
3.1. Tagging of a blast resistance gene to DNA markers
Of the 177 RFLP probes tested, 75 were polymorphic between the donor and recurrentparents. They were then used to search for polymorphisms between the two NILs. When aprobe produced an identical pattern for the donor parent and the resistant NIL, and producedan identical pattern for the recurrent parent and the susceptible NIL, this probe would likelybe linked to a resistance gene(s). Ten probes of this class were found and termed putativelypositive markers.
Most of the F2 plants showed extreme responses to inoculation with conidialsuspensions. One-hundred and ten plants were scored 0 or 1 (highly resistant) and 33 plantsscored 7 or 9 (highly susceptible) to the race ZB1, fitting an expected ratio of 3:1 when theresistance was controlled by a single dominant gene (x2=0.33, P=0.50-0.75). Co-segregationof the blast resistance with putatively positive markers was then tested using the 143 plants.
Of the ten putatively positive markers, only three probes, RG81, RG869 and RZ 397,on chromosome 12 of rice, were found to be linked to the blast resistance gene.
The resistance genotypes of the F2 individual were identified using the F? population,but of the 143 total, only 85 were verified. Map distances were estimated based on data fromthe 85 individuals. RG869 was most closely linked to the resistance gene, with a map distanceof 5.1 cM. The gene for resistance to race ZB1 of Pyriculcuia oryzae Cav. was first tentativelynamed as Pi-ll(t), but later revised as Pi-12(t) [10].
Of the 199 10-mer arbitrary primers screened, 6 fragments, each generated by adifferent primer, were found to be polymorphic between the two pools (present in the R pooland absent in the S pool). After amplification of DNA from the two isolines and a subset ofF2 individuals, linkage between the resistance gene and three RAPD bands (1.3 Kb fragmentproduced by primer P622; 0.56 Kb fragment by primer P265, P265-560; and 0.35 Kb fragmentby primer P286, P286-350) were confirmed. Complete co-segregation of the RAPD markersand blast resistance was detected against all the 143 F2 individuals, indicating tight linkageof these three markers and the blast resistance gene.
The three fragments were cloned and used as probes to analyse RFLPs of the F2individuals. The 1.3-Kb and 560-bp fragments were found to contain repeat sequences. The350-bp fragment was found to contain single copy sequence and detect a null allele in thesusceptible individuals. The results of RFLP analysis using the clone of the 350-bp fragmentare in agreement with those of RAPD analysis.
57

TABLE I. TWO SCAR MARKERS TIGHTLY LINKED TO Pi-12(t)
Marker Sequence
P265-560 CAGCTGTTCAGTCGTTTGCAGCTGTTCATACAAGAAAT
P286-350 GCTCCGCATTAACGGGAAGAGCCGGCTCCGGAGGTGA
Clones of the 560-bp and 350-bp fragments were sequenced. Specific primers weresynthesised for an establishment of (Sequence Characterised Amplification Region) SCARmarkers (Table I). Specific amplifications of DNA from the two isolines and all the 143 F2individuals were made for P265-560. A 560-bp fragment was observed for all the resistantindividuals but none of the susceptible ones, matching the result of RAPD analysis. For P286-350, polymorphism between K80R and K79S was detected only after digestion of the PCRproducts with 4 cutters. The 350 bp fragment was observed for all the resistant individuals butnone of the susceptible individuals.
3.2. Gene interactions3.2.1. Gene interactions in the population of Xian-feng 1/Tetep
In both populations, three types of F3 lines were observed in terms of their resistancesegregation patterns, i.e. all individuals resistant to the race ZC13, segregation for resistance,and all individuals susceptible. They were referred as resistant lines, segregating lines andsusceptible lines, respectively.
Of the total 161 F3 lines of Xian-feng 1/Tetep, the number of resistant lines, segregatedlines and susceptible lines were 68, 78 and 15, respectively. This fitted the expected ratio of7:8:1 (P=0.275), when the resistance was controlled by duplicate interaction of two dominancegenes (Table II). Of 1402 individuals in the 78 segregated F3 lines, the numbers of resistantand susceptible plants were 1188 and 214, respectively. This was in good agreement with theexpected ratio of 27:5 (P=0.710).
It was already known that a blast resistance gene Pi-ta in Tetep was closely linked toRFLP marker RZ397 on chromosome 12 [11]. In this study, RZ397 did not detectpolymorphism between Xian-feng 1 and Tetep. Another linked marker RG81 was able todetect polymorphism between the two parents. Preliminary co-segregation analysis of RG81and blast resistance indicated a gene for the resistance difference between Xian-feng 1 andTetep was closely linked to RG81 (data not shown).
In order to detect the other resistance gene which was not linked to RG81, equalquantities of DNAs from 10 homozygous resistant F2 individuals were mixed to construct aresistant pool (R pool), while those from 10 homozygous susceptible F2 individuals weremixed to construct a susceptible pool (S pool). RAPD analysis of the pools was performed.Primers generating polymorphic RAPD bands between two pools were used to analyse theirco-segregation with blast resistance. Thus far, three RAPD markers have been found to co-segregate with blast resistance, of which two were linked to RG81 and one was not linked toRG81. Mapping of the latter RAPD marker is underway using other mapping populations inour laboratory. After the marker is mapped, verification of the location of the two resistancegenes will be conducted using F6 or F7 recombinant inbred lines of Xian-feng 1/Tetep.
58

TABLE II. GENETIC MODEL OF DUPLICATE INTERACTIONOF TWO DOMINANT GENES FOR THE CONTROL OF BLASTRESISTANCE IN XIAN-FENG I/ TETEP POPULATION
F3 Phenotype F2 Genotype Expected ratio
All plants were resistant
Segregation
All plants were susceptibleTotal
R1RIR2R2RjR^/2r,riR2R2R,R,R2r2R,r[R2R2R,r,R2r2R,r,r2r2rlrlR2r2rir,r2r2
111224(15R:lS)a
2 (3R:1S)2 (3R:1S)1
16
aThe numbers before ( ) refer to expected ratios for the number of F, lines, andthose within ( ) refer to that for the number of individuals within each F, line,respectively. R= resistant; S= susceptible.
3.2.2. Gene interactions in the population of Xian-feng 1/Hong-jiao-zhan
Of the total 175 F3 lines of Xian-feng 1/Hong-jiao-zhan, the number of resistant lines,segregating lines and susceptible lines were 31, 113, and 31, respectively. This ratio fittednone of single-gene or two-gene models, indicating the resistance difference between Xian-feng 1 and Hong-jiao-zhan may be controlled by three or more genes.
Supposing that the resistance is controlled by three genes while the joint effect of twohomozygous susceptible genes resulted in susceptibility, the expected ratio of the numbers ofresistant lines, segregating lines and susceptible lines would be 10:44:10 (Table 3). This ratiowas well fitted by the observed data (P=0.491). Following the three gene controllinghypothesis, the expected ratio of the number of resistant and susceptible individuals in the 113segregated lines was 135:41. This was also fitted by the observed data of 1545:488 (P=0.450),providing additional evidence for the hypothesis.
As described previously, a blast resistance gene Pi-12(t), derived from Hong-jiao-zhan,was tightly linked to SCAR markers P265-560 and P286-350. By using P265-560, a 560-bpfragment was detected for Hong-jiao-zhan, and no fragment was detected for Xian-feng 1.After amplification of a subset of F2 DNAs from bulked F3 samples, the observed segregationof the 560-bp fragment was tested against the expectation (Table 4). The result (P=0.719)supported the hypothesis.
As the genetic control of the blast resistance in the population of Xian-feng 1/Hong-jiao-zhan seems to be rather complicated, identification of resistance genes other than Pi-12(t)will not be conducted until the two resistance genes in the population of Xian-feng 1/Tetepare mapped more precisely.
59

TABLE HI. HYPOTHESIS OF THREE-GENE INTERACTION FOR THE BLASTRESISTANCE IN XIAN-FENG 1/HONG-JIAO-ZHAN POPULATION
F3 Phenotype
All plants resistant
All plants susceptible
Segregation
Total
Condition
Homozygosity for resistancealleles at two or allthree loci
Homozygosity for susceptiblealleles at two or allthree loci
All the others
F2 Genotype Expected ratio4"
R,R,R,R,R,R,~ri
r,r,r,r,R,-R,r,R,r,R,r,R,R,R,r,R,r,r,r.r,r,r,r,R,R,
ix^Ix^ I\.7iX'«
R2R; -r3-r2 R3R,R D D D
2lv2 **3**M
r ,r , r,r2r2r2 r,~r2- r3r3r2r2 r3r3
R r 1? r2*2 *^iM
K.2rT •^3*^1R2R2 R3r,R r Or2r2 K,r3R2r, r3r3r2r2 R,r-R2r, R,r,R2r2 R3R3R2R2 R3r3r2r, R,r3
1333r,r, 13338 (27R:5S)a
4 (15R:1S)4 (15R:1S)4 (15R:1S)4 (9R.7S)4 (9R.7S)4 (9R:7S)4 (3R.1S)4 (3R.1S)4 (3R-1S)(A
JThe number before () refer to expected ratios for the number of F3 lines, and those within ( ) refer to that forthe number of individuals within each F3 line, respectively R= resistance; S= susceptible.
TABLE IV. THE NUMBER OF F2 INDIVIDUAL WITH PRESENCE OR ABSENCE OF THE560-BP FRAGMENT IN XIAN-FENG 1/HONG-JIAO-ZHAN
Resistance pattern Observed numberpresence absence
Expected ratio(presence : absence)
Px2
ResistanceSegregationSusceptibleTotal
5205
30
07
1017
932
3
: 1: 12
7
0.4560.8750.7780.719
From the above results, it can be seen that the mode of gene interactions for blastresistance may vary greatly across populations. Using classical approaches, the mode of geneinteractions can only be deduced statistically. When tightly linked markers become available,it should be possible to verify the genetic mode of action.
2.3. Initiation of DNA marker-assisted selection
Crosses were made between elite varieties and blast resistance donors in HainanProvince in the winter of 1995. Elite varieties used included an early indica variety Zhong156 and several parental lines of commercial FL hybrids, and blast resistance donors usedincluding Hong-jiao-zhan, C101A51 (Pi-2) and C101PKT (Pi-4). The F,s was grown inCNRRI in 1996 and backcrossed with elite varieties. A polymorphism survey was conductedusing DNA markers linked to resistance genes. In the following years, DNA marker-assistedselection for blast resistance will be employed.
60

Forty-eight varieties which were widely used in current rice breeding programs wereprovided by rice breeders. Polymorphism among the 48 varieties and resistance donors arebein* surveyed by using STS (Sequence Tagged Site) and RFLP markers. More than 40 STSmarkers have been used, and data are being collected. Based on five STSs linked to diseaseresistances (rice blast or bacterial leaf blight), pair-wise comparisons indicated that thepolymorphism frequency was 13-52%. After digestion of the PCR products with 4 cutters, thefrequency was 28-66%. When the data are all collected, they will be distributed to the ricebreeders who provided the varieties. It is expected the database will be helpful to breedersfor making appropriate decisions whenever they are interested in transferring resistance genesto their materials.
ACKNOWLEDGEMENTS
This research was supported by grants from the Rockefeller Foundation RiceBiotechnology Program, the International Atomic Energy Agency and the State Science andTechnology Commission of China. The authors would like to thank Professors Shen Z. andH Zuhua for providing rice seeds of NILs K80R and K79S, and other rice breeders inZhejiancr and Guangdong provinces for providing rice seeds for the establishment of thedatabase professors Yang C. and Chai R. for screening the blast resistance, and Shen B. forhelp during the early stages of this research. Thanks also due to Dr. Tanksley's laboratory atCornell University, Ithaca, USA, for providing DNA clones. Mention should be made of thefact that part of the RFLP analysis was conducted in Dr. Kochert's laboratory at GeorgiaUniversity, Atlanta, USA.
REFERENCES
[I] OU, S.H. Rice Disease, Commonwealth Agricultural Bureaux, Farham Royal (1985)109-200.
[2] BROWING, J.A. and FREY, KJ. Multiline cultivars as a mean of disease control,Annu. Rev/Phytopathol. 7 (1969) 355-382.
[3] TANKSLEY, S. et cd. RFLP mapping in plant breeding - new tools for an old science,Biotechnology 7 (1989) 257-264.
[4] WILLIAMS, G.K. et d. DNA polymorphisms amplified by arbitrary primers areuseful as genetic marker, Nucleic Acids Res. 18 (1990) 22: 6531-6530.
[5] ZHENG, K.L. et al. Identification of DNA markers linked to a blast resistance genein rice Induced mutations and molecular techniques for crop improvement, Proceedingof an International Symposium on the Use of Induced Mutations and MolecularTechniques for Crop Improvement, Vienna, 19-23 June 1995, (1995) pp 253-261.
[6] ZHENG, K.L. et d. Restriction fragment length polymorphism in rice, Chin. J. Rice.Sci. 4 (1990) 4: 145-149.
[7] LIU, Y.J. and ZHENG, K.L. A simple method for extraction of DNA in rice, Chin.J. Rice Sci. 6(1992) 1:47-48.
[8] LANDER, E.S. et d. MAPMAKER: An interactive computer package constructingprimary genetic linkage maps of experimental and natural populations, Genomics 1(1987) 174-181.
[9] KOSAMBI, D.D. The estimation of map distances from recombination values. Ann.Eugen. 12 (1944) 172-175.
[10] ZHENG, K.L. et d. PCR-based marker-assisted selection in nee improvement. 1KK1Discussion Paper Series No. 12. International Rice Research Institute, P.O. Box 933,Manila, the Philippines (1995).
[ I I ] Yu, Z. et d. Tagging genes for blast resistance in rice via- linkage to RFLP markers.Theor. Appl. Genet. 81 (1991) 471-476.
I NEXT PAGE(S) I 61left BLANK I

RAPD TAGGING OF A SALT TOLERANCE GENE IN RICE XA9846998
H. DING, G. ZHANG, Y. GUO, S. CHEN, S. CHENPlant Biotechnology Laboratory,Institute of Genetics,Academia Sinica,Beijing, China
Abstract
Salinity, which is critical in determining the growth and development of plants, is a major problemaffecting ever-increasing areas throughout the world. A salt tolerant rice mutant (M-20) was obtained fromaccession 77-170 (Oryza saliva) through EMS mutagenesis and selection in vitro [1,4]. The use of 220 10-merRAPD primers allowed the identification of a new molecular marker, whose genetic distance from a salttolerance gene is about 16.4 cM.
1. INTRODUCTION
Salinity is a major problem affecting ever-increasing areas throughout the world, s.Research on plant osmoregulation through molecular biology is accompanied by crop breedingprogrammes including marker-assisted selection and genetic engineering. It is currently anarea of active investigation seeking salt tolerance-relevant genes and their linked molecularmarker(s). A salt tolerant rice mutant (M-20) was obtained from rice accession 77-170 (Oryzasativa) through EMS mutagenesis and selection in vitro [1, 4]. Inheritance analysisdemonstrated that a major salt tolerance gene was present in these materials, and that it wasassociated with a single copy RFLP probe, RG4. The genetic distance between the trait andthe marker was shown to be 7.0 +/- 2.9cM [2, 3, 4]. The use of 220 10-mer RAPD primersallowed the identification of a new molecular marker, whose genetic distance from a salttolerance gene is about 16.4 cM.
2. MATERIALS AND METHODS
2.1. Plant materials
Anthers of rice 77-170 (Oryza sativa) were used to obtain calli on N6 medium, whichwere then mutagenized with EMS. The selection of NaCl-tolerant mutants was carried out onN6 medium containing 1 % NaCl. After continuous selection, five mutant lines were obtained,the salt tolerance of which has been stably inherited over nine generations [1].
2.2. Evaluation of salt tolerance
The F, hybrids of 77-170 X M-20 were planted under normal conditions. Since it ispossible to split rice into two parts in the seedling stage, one part of each F2 plant was plantedunder normal conditions and the other part was planted in the saline pool containing 0.5%NaCl.
2.3. Rice DNA extraction
Three to five grams of rice leaf tissue were ground into a fine powder in liquidnitrogen, to which was added 16 ml of a 65°C preheated extraction solution (100 ml Tris-HCl,pHS.O; 50 mM EDTA; 500 mM NaCl; 1.25% SDS(w/v), add 0.38g Na2SO4 per 100 ml justbefore use), mixed well by inverting the tube and incubated at 65°C for 20 minutes. To thiswas added 5 ml of 5M KAc, followed by gentle mixing and incubation on ice for 20 minutes.
63

This was centrifuged and the supernatant transferred to a new tube to which an equal volumeof chloroform: isoamyl (24:1) was added to remove protein and pigment. To this, 2/3 volumeof isopropanol was added to the upper layer to precipitate DNA. RNase was added to dissolvethe RNA. The DNA was resuspended in TE buffer (50 mM Tris-HCl, pHS.O; 10 mM EDTA).
2.4. Construction of DNA pools
Pure resistant and pure sensitive individuals of the F2 generation were selected toconstruct two DNA pools, a salt tolerant pool (+) and a salt sensitive pool (-). The "+" poolwas composed of 10 highly salt tolerant individuals A31, A34, A44, A57, A60, A64, A84,A89, A106 and A107, while the "-" pool contained 7 salt sensitive individuals A26, A38,A43, A46, A82, A88 and A93.
2.5. RAPD primers
All of the 10-mer RAPD primers were purchased from OPERONTECHNOLOGY INC.
2.6. RAPD analysis
The reaction mixture (25microl/tube) included template DNA (30ng), 1 microl.2.5 mM dNTPs each, 2 microl. 10-mer RAPD primer (50 pmol), 2.5 microl. 10X reactionbuffer (500 mM Tris-HCl, pH 8.3: 500 mM KC1; 15 mM MgCl2; 0.01% Gelatin), 0.9 unit ofTaq DNA polymerase (Institute for Genetics laboratory). The mixture was overlaid with 25microl. of paraffin oil.
Amplification was performed on a Perkin Elmer DNA Thermal Cycler 480. Afterinitial denaturation (five cycles for 1 min at 94°C, 1 min at 36°C, 2 min at 72°C) the reactionwas then continued for another 40 cycles with the following procedure: 94°C for 20 s, 36°Cfor 1 min, and 72°C for 2 min. Finally, the procedure ended at 72°C for 10 min.Amplification products were electrophoresed in 1.5% agarose gel (containing Imicrog./mlEB). The results were observed under UV light and recorded by photography.
3. RESULTS
Backcrosses of the llth generation of salt tolerant mutant line and the original F,generation line were planted under normal conditions in the field. Individuals selected fromthe F2 generation (100) were split into two parts; one planted under normal conditions and theother in a saline pool containing 0.5% NaCl. There was no obvious segregation amongdifferent individuals of the F2 under normal conditions. In the saline pool, 72 and 78individuals set seed, when M-20 and 77-170 were the respective maternal plants. Thesegregation ratio is about 3:1 (Table I). The same results were obtained from reciprocalcrosses indicating that the mutation is controlled by nuclear genes and there exists a majorgene enabling seed setting under saline conditions.
The two DNA pools were used as templates to perform RAPD amplifications. Threeprimers, OPS-12, OPS-04, and OPO-09, showed polymorphism between the "+" and the "-"pools. The base sequences of these primers are listed in Table EL Figure 1 shows some resultsof the RAPD screening.
64
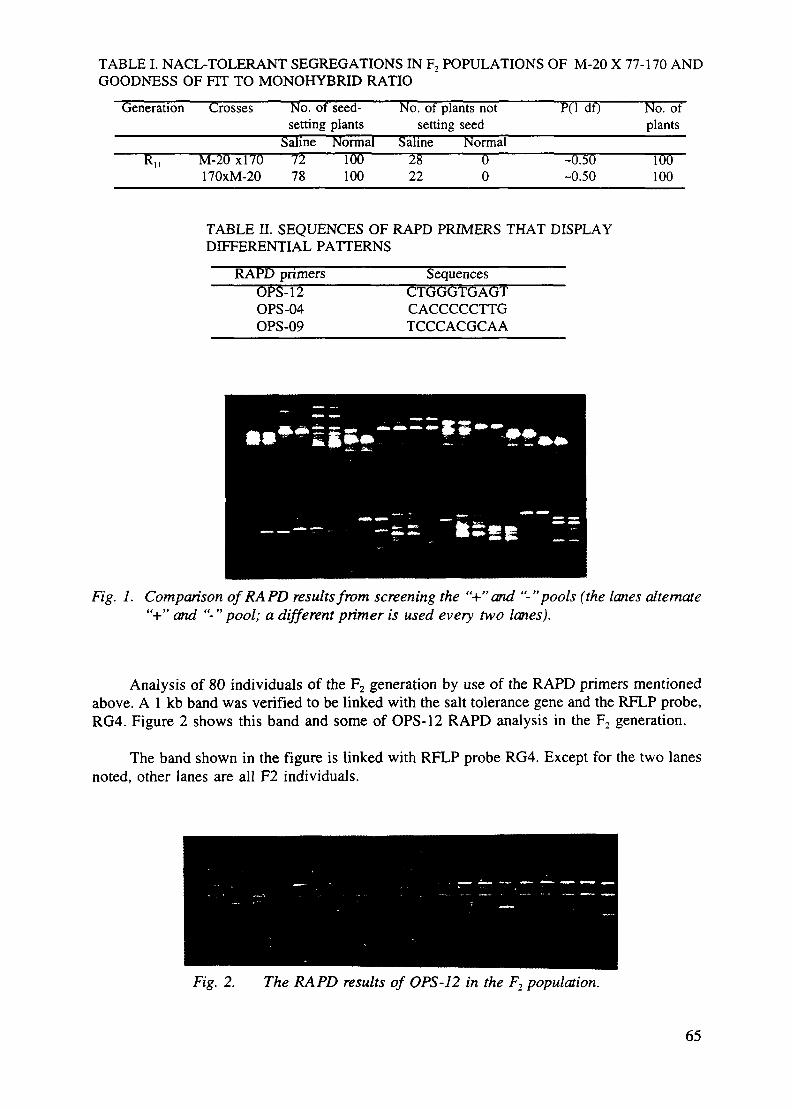
TABLE I. NACL-TOLERANT SEGREGATIONS IN F2 POPULATIONS OF M-20 X 77-170 ANDGOODNESS OF FIT TO MONOHYBRID RATIO
Generation
RI,
Crosses
M-20 x!70170xM-20
No. of seed-setting plants
Saline Normal72 10078 100
No. of plants notsetting seed
Saline Normal28 022 0
P(l df)
-0.50-0.50
No. ofplants
100100
TABLE II. SEQUENCES OF RAPD PRIMERS THAT DISPLAYDIFFERENTIAL PATTERNS
RAPD primers SequencesOPS^lZOPS-04OPS-09
CTGGGTGAGTCACCCCCTTGTCCCACGCAA
Fig. 1. Comparison of RAPD results from screening the "+" and "-"pools (the lanes alternate"+" and "-"pool; a different primer is used every two lanes).
Analysis of 80 individuals of the F2 generation by use of the RAPD primers mentionedabove. A 1 kb band was verified to be linked with the salt tolerance gene and the RFLP probe,RG4. Figure 2 shows this band and some of OPS-12 RAPD analysis in the F, generation.
The band shown in the figure is linked with RFLP probe RG4. Except for the two lanesnoted, other lanes are all F2 individuals.
Fig. 2. The RAPD results of OPS-12 in the F2 population.
65

The linkage between the RAPD marker, the RFLP probe RG4 and the locus relevant tosalt tolerance was calculated with the program MAPMAKER. The result is shown in Figure 3.The genetic distance between the RAPD marker and RG4 is 5.0 cM, and between the RAPDmarker and salt tolerance gene it is 16.4 cM.
Rec Dist MarkerFrac. cM Id Name_________
(1) p (Salt tolerant gene)(11.2%) 11.4
(2) RFLP (RG4)(3) RAPD1
Fig. 3. The linkage between two probes and the locus relevant to salt tolerance.
3. DISCUSSION
Salt tolerance is a character controlled by multiple genes, and it has continuousphenotypic distribution. For this reason, it is regarded as a quantitative character. Despite this,there may exist a major gene responsible for a large part of the genetic variance for salttolerance. In the F2 generation of our materials, the ratio of salt tolerant to salt sensitive plantswas about 3:1, where salt tolerance was evaluated on the ability to set seeds. This resultindicated that salt tolerance is controlled by a major gene and modified by some other minorgenes. Zhang et al. [3] tagged the major gene by a single copy probe, RG4, which is locatedon chromosome 7, at a genetic distance of 7.0 +/- 2.9 cM. We found a new marker near RG4,thus enhancing the possibility of mapping salt tolerance genes.
Although RAPD has some merits such as efficiency, simplicity and saving time, it stillhas a few shortcomings. Spurious bands often appear so that the amplification must beperformed under specific conditions. The template DNA, polymerase concentration and therenaturation temperature should be kept in a suitable range. Moreover, we use individuals ofpure character to construct the pools so as to diminish other factors irrelevant to salt tolerance.
We have to identify the phenotype of the F2 by other criteria because of thenonexistence of an F3 generation. It brings some uncertainty to our research and it is necessaryfor us to pay attention to DNA contamination and other sources of error. In the right part ofFig. 2, the pattern of the 6th lane is obviously different from others. It is suspected to be theresult of DNA contamination.
REFERENCES
[1] CHEN, S.-L., Expression of M13 plant of NaCl-tolerant pollen plant in rice, In:Genetic Manipulation in Crops, Inst. of Genet. Chinese Acad. Sci., Beijing (1988) 85-86.
[2] CHEN, S., ZHU, L.-H., HONG, J., CHEN, S.-L., Molecular biological identificationof a rice salt-tolerant line, Acta Bot. Sinica 33 (1991) 569-573.
[3] ZHANG, G.-Y., GUO, Y., CHEN, S.-L., CHEN, S.-Y., RFLP tagging of a salttolerance gene in rice, Plant Sci. 110 (1995) 227-234.
[4] GUO, Y., CHEN S.-L., ZHANG, G.Y., CHEN. S., Salt-tolerance rice mutant linescontrolled by a major effect gene were obtained by cell engineering technique, 24(1997) 122- 126 [In Chinese, English Abst.].
66

RICE GENOME MAPPING AND ITS APPLICATION XA9846999IN RICE GENETICS AND BREEDING
M.Y. EUN, Y.G. CHO, J.H. HAHN, U.H. YOON, B.Y. YI, T.Y. CHUNGNational Institute of Agricultural Science and Technology, RDASuwon, Republic of Korea
Abstract
An 'MG' recombmant inbred population which consists of 164 F,3 lines has been developed from across between a Tongil type variety Milyang 23 and a Japomca type Gihobyeo by single seed descent ARestriction Fragment Length Polymorphism (RFLP) framework map using this population has been constructedMorphological markers, isozyme loci, microsatellites, Amplified Fragment Length Polymorphisms (AFLP), andnew complementary DNA (cDNA) markers are being integrated in the framework map for a highly saturatedcomprehensive map. So far, 207 RFLPs, 89 microsatellites, 5 isozymes, 232 AFLPs, and 2 morphological markershave been mapped through international collaboration. The map contains 1,826 cM with an average interval sizeof 4 5 cM on the framework map and 3.4 cM overall (as of 29 October 1996)
The framework map is being used for analyzing quantitative trait loci (QTL) of agronomic charactersand some physico-chemical properties relating to rice quality. The number of significant QTLs affecting each traitranged from one to five, and 38 QTLs were detected for 17 traits The percentage of variance explained by eachQTL ranged from 5 6 to 66.9%.
The isozyme marker, EstI-2, and two RFLP markers, RG109 and RG220, were linked most tightly ata distance less than 1 cM with the semidwarf (sd-I) gene on chromosome 1. These markers could be used forprecise in vitro selection of individuals carrying the semidwarf gene using single seeds or very young leaf tissue,before this character is fully expressed
Appropriate application of marker-assisted selection, using EstI-2 and RFLP markers for the semidwarfcharacter, in combination with other markers linked to genes of agronomic importance in nee, holds promise forimproving the efficiency of breeding, and the high-resolution genetic and physical mapping near sd-1, aimed atultimately cloning this valuable gene.
The Korea Rice Genome World Wide Web (WWW) Server was constructed to distribute the neeresearch and genomic information around world The Korea Rice Genome WWW Server and a mirror WWW sitefor Rice Genes are maintained at the National Institute of Agricultural Science and Technology, RDA(http //sun20.asti.re kr) and Department of Biological Science, Myongji University (http //bioserver myongji ac kr)
1. INTRODUCTION
Plant genomics has emerged as one of today's most important tools for studying plantbiology. Genomics is the science of investigating genomes, both globally and locally, for thestudy of genome organization and evolution, physical mapping, and gene cloning using thetools of molecular biology. Historically, genomics received wide attention in the early 80'swith the discovery that genetic maps could be made with molecular markers, such asrestriction fragment length polymorphisms (RFLPs) [1]. Molecular markers on genetic mapsserve as landmarks along chromosomes, and serve as entry points for gene cloning andphysical mapping.
Rice, a staple food crop in Korea, is grown widely in every corner of the country. Ricebreeding which is one of the most significant accomplishments in Korea became the focalpoint of the agricultural research and development. With the rapid population increase, thereis still much current interest in breeding for consistent yields and resistance to diseases andinsects, and environmental stresses.
In recent years, the National Institute of Agricultural Science and Technology (NIAST)has developed long-term research projects on rice genome mapping and its applications ingenetics and practical breeding in the Korea Rice Genome Research Program (KRGRP). Acomprehensive gene map has been constructed using a recombinant inbred population
67

developed at NIAST. Gene tagging experiments based on linkages between morphologicalcharacters and molecular markers have been carried out with intensive cooperation betweenscientists in the fields of biotechnology and breeding for the early utilization of these newlyemerging high-technologies in practical breeding.
2. DEVELOPMENT OF A RECOMBINANT INBRED LINE AS A PERMANENT MAPPINGPOPULATION
The use of a recombinant inbred (RI) population as the basis for mapping provides aneternal mapping resource [2]. This means that obtaining DNA is not a limiting factor, andgenetically pure seed can be reliably reproduced from each line. RI populations are especiallyadvantageous for genetic analysis of quantitative traits because experiments can be replicatedover years and environments using identical genotypes. If the parental combination selectedfor RI population development is of direct interest in a breeding program, the use of molecularmarker-assisted breeding will be greatly facilitated.
An eternal RI population consisting of 164 F13 lines was developed from a crossbetween Milyang 23, (an Indica/Japonica derivative known as the Tongil type), and Gihobyeo(Japonica type) (hereafter the MG RI population) at NIAST. The parents were crossed in 1988and F2 seeds were selfed, with generations progressing via single seed descent (selectedrandomly) until the F6 generation. F7 seeds were planted in single rows in the field and therecombinant inbred lines were cultivated by row via single seed decent until the FI3 generation(selected one major-plant type) (Table I).
TABLE I. DEVELOPMENT OF MILYANG 23/GfflOBYEO RECOMBINANT INBRED LINED FORHIGHLY SATURATED MOLECULAR MAPPING IN RICE BY SINGLE SEED DESCENT
Milyang 23/Gihobyeo Recombinant Inbred Populationfor Highly Saturated Molecular Mapping
Generation : Fi3 seeds harvested < '96 Fall)Method : Single Seed DescentPopulation size : 164 linesCharacteristics :
- Excellent Population StrUCtllie (AhimAmt S<v»H anH Vasy tn Propagate)- Sufficient Population Siyg fnr Fin* Mapping of Target GenfiS- High Level of Polymorphism- Immediate Availability of Pure Lines-Many Agronomically Valuable Characteristics were Embodied
by These Varieties (Especially for QTL mapping)- Will be Available as "International Reference Mapping Population"
Milyang 23, the maternal parent, was selected from a cross between Suwon 232 andIR24 and released in 1976. Milyang 23 has many favorable genes and has been frequentlyused as a parent in rice breeding programs and a number of rice varieties have been developedfrom these progenies. Gihobyeo, the paternal parent, was developed and released in 1983 froma cross between Fuji 280 and BL 1. These two parents represent genetically divergent types,providing ample segregation of both molecular marker alleles and agronomically importantgenes and quantitative trait loci (QTL).
68

The MG RI population offers good resolution for the development of a highlysaturated map of rice. The fact that individual RI genotypes are selfed and can be propagatedindefinitely by seed makes this population especially useful for replicated experiments tolocalize and fine map genes and QTLs. The fact that both parental genotypes areagronomically acceptable makes it useful for near isogenic line development and marker-aidedselection. The population and the associated molecular marker dataset are publicly availableand it is therefore envisioned that it will be useful as an international mapping resource forrice.
3. CONSTRUCTION OF A MOLECULAR MAP
The construction of truly saturated maps requires the analysis of large numbers of DNAmarkers capable of sampling all regions of the genome. A combination of molecular markerscapable of sampling all types of sequence configurations will provide the best genomecoverage. RFLP markers generally represent single and low copy sequences, due to the natureof Southern analysis. Microsatellites or simple sequence repeats (SSR) are derived fromrepetitive DNA, but can be detected as individual loci because of the unique sequencesflanking the microsatellite motifs [3]. Amplified fragment length polymorphism (AFLP)analysis complements other marker systems in that these markers may be derived from anyportion of the genome that can be digested with restriction enzymes.
The recently developed AFLP technique complements other marker systems andefficiently detects abundant polymorphism. The principle of the AFLP method is basicallyquite simple. DNA is cut with restriction enzymes, and ds adapters are ligated to the end ofthe DNA-fragments. In this way, the sequence of the adjacent restriction site and the adaptersserve as primer binding sites for subsequent amplification of the restriction fragments [4].Selective nucleotides are added to the 3' ends of the PCR primers, which recognize only asubset of the restriction sites. Only restriction fragments in which the nucleotides flanking therestriction site match the selective nucleotides are amplified. Substitution of the silver stainingmethod in the AFLP technique gives rise to better resolution and convenience of handling overthe use of radioisotopes [5]. This approach to molecular mapping promises great efficiencybecause of the ability to screen large numbers of DNA fragments in a single lane of apolyacrylamide gel, thus increasing the possibility of identifying polymorphisms and expeditingthe construction of high density linkage maps.
An AFLP map of rice has been constructed with the Fu recombinant inbred (RI)population. The mapping population was developed by a single seed descent method from anintercross between Milyang23 (M) (Tongil type) and Gihobyeo (G) (japonica type) andconsists of 164 lines [17]. The polymorphism between parents was about 80 percent. A subsetof the RFLP markers previously mapped by Causse et al. [6] and Kurata et cd. [7], andmicrosatellite markers [8] were used to construct a framework map. We then integratedmicrosatellite and AFLP markers into the RFLP map, aiming to fill gaps and enhance the levelof saturation [17]. With the five EcoRI+2 and MseI+3 primers, 10 different primercombinations could be analyzed with the parents and 164 RI lines. Each primer combinationgenerated a range of 73-134 bands visible on polyacrylamide gels, with a mean of 101 and anaverage of 27 polymorphic bands (Fig. 1), which are greater than those of AFLP map in barley[9, 10]. Of the 1 Oil AFLP bands from 10 primer combinations, 269 (26.6%) werepolymorphic in the MG RI population. The best two combinations are E13/M59 and E26/M47,which showed over 30% polymorphism. So far, 232 AFLP markers have been integrated ontothe RFLP map. The enzyme combination EcoKUMsel was good for small-genome crops suchas rice (Fig. 1). It generated more bands and polymorphisms than the Pstl and Msel
69

combination in DH population, which showed 945 AFLP bands from 20 primer combinationsand 208 (21.8%) polymorphic bands [10]. The polymorphism rate with AFLP markers in thebarley mapping population was 11.3% [9]. The polymorphism rate of AFLP markers is muchsmaller than RFLP markers, but they are extremely efficient because they allow thesimultaneous analysis of a large number of bands per gel.
A total of 207 RFLP markers, 232 AFLP markers, 89 microsatelhtes and 5 isozymeloci and 2 morphological markers were integrated into the MG map. All marker types werewell distributed throughout the 12 chromosomes. The integrated map covered 1,826 cM, andh ad an average interval size of 4.5 cM on the framework map, or 3.4 cM overall (as ofOct.29, 1996) (Fig. 2).
9-30610 -X~1 -COS
2 -OK-22-01523-C2T24-0123-0^J..CC27- 02'28-32.
J--03I33 -03*
F/g. 7. Autoradiognan obtained with El3/M59 primer combination. In the left margin of theimage the marker names and alignment bands are indicated. In the right margin thetemplate identity is given. 10BL indicated the 10-base ladder; PI and P2 indicate theparents, next are the original numbers from the MG RI population.
70
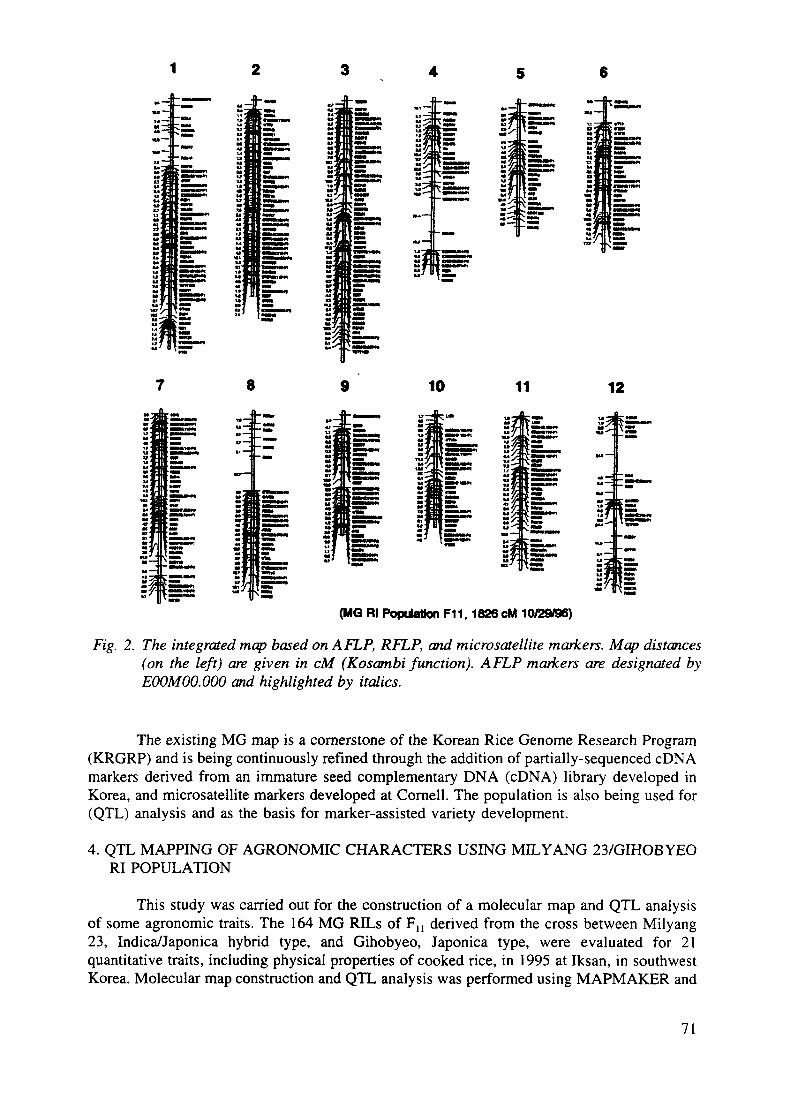
6
8 9 10 11
S? 15ss~ £/, Js
(MG Rl Population F11.1826 cM 10/29/96)
2. The integrated map based on AFLP, RFLP, and microsatellite markers. Map distances(on the left) are given in cM (Kosambi function). AFLP markers are designated byEOOMOO.OOO and highlighted by italics.
The existing MG map is a cornerstone of the Korean Rice Genome Research Program(KRGRP) and is being continuously refined through the addition of partially-sequenced cDNAmarkers derived from an immature seed complementary DNA (cDNA) library developed inKorea, and microsatellite markers developed at Cornell. The population is also being used for(QTL) analysis and as the basis for marker-assisted variety development.
4. QTL MAPPING OF AGRONOMIC CHARACTERS USING MIL YANG 23/GIHOBYEORI POPULATION
This study was carried out for the construction of a molecular map and QTL analysisof some agronomic traits. The 164 MG RILs of Fu derived from the cross between Milyang23, Indica/Japonica hybrid type, and Gihobyeo, Japonica type, were evaluated for 21quantitative traits, including physical properties of cooked rice, in 1995 at Iksan, in southwestKorea. Molecular map construction and QTL analysis was performed using MAPMAKER and
71

MAPMAKER-QTL programs. All traits examined fitted approximately a normal distributionand transgressive segregants were observed. The total genome size of the molecular map was1,290.2 cM and 132 RFLP markers were located on twelve chromosomes, so the meandistance between markers was 9.8 cM. The number of significant QTL(s) (LOD2.0) affectingeach trait ranged from one to five; a total of 38 QTLs were detected for 17 traits However,panicle length and hardness, cohesiveness and elasticity of cooked rice yielded no detectableQTL. The percentage of variance explained by each QTL ranged from 5.6% to 66.9%.
Four QTLs significantly affecting days to heading were detected and the percentageof phenotypic variance explained by each QTL ranged from 7.3 to 11.3%. Fitting the fourQTLs simultaneously, 39.7% of the phenotypic variation could be accounted for. Only oneQTL which significantly influenced culm length was identified, located on chromosome 1; itaccounted for 59.0% of total phenotypic variation. Two QTLs were mapped for both thenumber of panicles per hill and the number of spikelets per panicle. The simultaneous fit ofthe two QTLs explained 17.1% and 26.4% of the total phenotypic variation, respectively.Three QTLs significantly affected 1,000-grain weight and they accounted for 7.4% of the totalphenotypic variation. Only one QTL was mapped for both percent of ripened grains andbrown/rough nee ratio and, each QTL accounted for 12.6% and 5.6% of the total phenotypicvariation, respectively. Two significant QTLs, on chromosomes 8 and 9, showed associationwith gram yield. Cumulatively, the two QTLs explained 25.7% of the total phenotypicvariation (Table II).
TABLE II. CHARACTERISTICS OF QTLS DETECTED FOR YIELD AND YIELD COMPONENTSIN MILYANG 23/GIHOBYEO RECOMBINANT INBRED ('MG' RI) POPULATION
Trait QTL Ch no Markers bordering Total QTL Peak % Var * Phenotypicthe QTL length POS LOD effect*51
No ofpaniclesper hill
No ofspikeletsperpanicle
Percent ofripenedgram
1,000grainweight
Brown/roughrice ratio
NPH 1
NPH 2
NSP 1
NSP 2
PRO 1
GWT 1GWT2GWT 3
BR 1
1
12
1
3
1
128
4
RG636-RG1028
RG869-RZ816
G1184A-RG140
RZ142-RZ319
RG458-RG655
RG317-RG462RZ53-C601
C825-KCD379
RZ590-RG161
87
36.7
39.0
16.2
29
20312.37.0
1.5
60
340
300
140
00
2004040
00
270
276
408
2 19
479
2 124 18321
203
8 1
90
196
68
126
8512.297
56
1 06
1 16
-2555
-15.01
732
-1 401 68
-1 50
-074
Yield YD 1YD 2
RG885-RG598 869 340 218 169 -6265RG662-RG451 145 100 275 88 -5396
Percentage of variance explained by each QTL.The signs, +(omitted) and -, preceding phenotypic effect, represent that the J alleles in homozygous state hadhigher phenotypic effects than the respective M alleles in homozygous state, and that the J alleles inhomozygous state had lower phenotypic effects than the respective M alleles in homozygous state, respectively
72

Five QTLs, the highest number of QTLs among the investigated traits, affected grainlength, and three QTLs affected grain width. When fitted simultaneously, the five QTLs ingrain length explained 53.8% and three QTLs for grain width explained 38.8% of the totalphenotypic variation. Two QTLs significantly affected grain thickness, and they explained16.2% of the total phenotypic variation. Three significant QTLs were identified in both grainwhite core and white belly. They explained 35.1% and 91.6% of the total phenotypic variation,respectively. QTLs detected in grain white belly showed the highest percentage of varianceexplained among the evaluated traits. Three QTLs affected alkali digestion value, and theyexplained 32.4% of the total phenotypic variation when fitted simultaneously. Only one QTLwas detected in adhesiveness, gumminess, and chewiness of cooked rice, and each QTLexplained 14.6, 7.6 and 7.6% of the total phenotypic variation, respectively (Fig. 3, Table III).
TABLE m. NUMBER OF QTLS, CHROMOSOME NUMBER, TOTAL PERCENTAGE OFVARIANCE EXPLAINED BY QTLS (% VAR.), AND HERTTABILITY (H2) OF EACHTRAIT
Trait No. of QTLs Chromosome No. Var. h:
Days to heading (DOTH)Culm length (CL)No. of panicles per hill (NPH)No. spikelets per panicle (NSP)% of ripened grain (PRO)1 ,000 grain weight (GWT)Brown/rough rice (BR)Yield (YD)
Grain length (GL)Grain width (G)Grain thickness (GT)White core (WC)White belly (WB)Alkali digestion value (ADV)
Adhesiveness (ADH)Gumminess (GUM)Chewiness (CHE)
41221312
532333
111
, 3, 6, 7
, 12, 3
, 2, 848,9
1, 3, 5, 10, 122, 8, 122, 104 ,6 ,82 ,7 ,83,7, 8
144
39.759.017.126.412.630.45.6
25.7
53.838.816.235.691.632.4
14.67.67.6
-0.9630.4970.9140.5960.9760.3140.536
0.9200.8790.382
---
0.9350.7940.703
QTLs for eight investigated traits were located on chromosome number 1. Other QTLswere found on all the other chromosomes in the complement (n = 12) but no significant QTLwas found on chromosome number 11 (Table HI). The relationships between heritability andpercentage of variance explained by QTLs were very significant (Fig. 4).
5. LINKAGE OF SEMIDWARF GENE (sd-1) WITH AN ESTERASE LOCUS, Est 1-2
The semidwarf gene (sd-1) in rice (Oryza saliva L.) is one of the most important singlegenes in the history of rice improvement. It was first identified in the Chinese variety Dee-geo-woo-gen (DGWG), and was first released in the Taiwanese variety Taichung Native 1 (TN-1)in 1956 [11]. This recessive allele causes reduced culm length and has been widely used toconfer lodging resistance, high harvest index, responsiveness to nitrogen fertilizer, and favorableplant type in the breeding of high-yielding rice varieties [11].
73

Days to Heading
Khi.te belly Kb±t:e core
CU!M length
iMBiT T-—* ""*'''* m '•••* "• ' ** ' •• M- n THI
Yield
Fig. 3. QTL Likelihood plots indicating LOD scores and chromosome numbers for days toheading, white belly, white core, culm length, and yield. The left of each figurerepresents for LOD scores based on MAPMAKER-QTL and the top-right representschromosome number. The RFLP linkage map used in the analysis is presented alongthe abscissa, in centiMorgan (cM) according to Kosambi (1944).
74
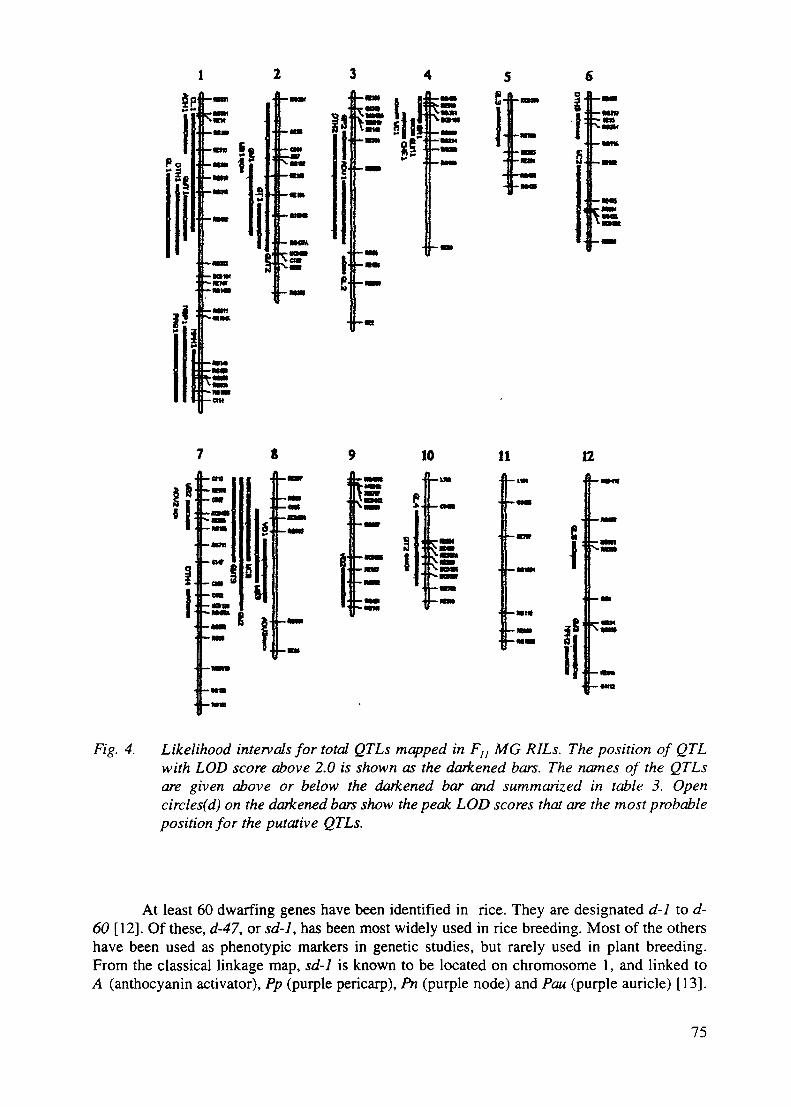
1 2 3 4 5_._ &
., ^SL tl I |2£ I "*" I -MIB$ V5» fifli x«»» I I: ~o»j tsr gjj| __ i j —~—• Jf:r= * _ _ „
I— - • — ;r '• —
• >•cw I. __.•• I "*„ s- —
10
lliiiS. _
BSf__ KM
H
tFig. 4. Likelihood intervals for total QTLs mapped in Fn MG RILs. The position of QTL
with LOD score above 2.0 is shown as the darkened bars. The names of the QTLsare given above or below the darkened bar and summarized in table 3. Opencircles(d) on the darkened bars show the peak LOD scores that are the most probableposition for the putative QTLs.
At least 60 dwarfing genes have been identified in rice. They are designated d-1 to d-60 [12]. Of these, d-47, or sd-1, has been most widely used in rice breeding. Most of the othershave been used as phenotypic markers in genetic studies, but rarely used in plant breeding.From the classical linkage map, sd-1 is known to be located on chromosome 1, and linked toA (anthocyanin activator), Pp (purple pericarp), Pn (purple node) and Pau (purple auricle) [13].
75

EstI-2
Culmlength : T a e 9 S S T sag T T a a g
Fzg. 5. Migration pattern of alleles at the EstI-2 locus in semidwarf and tall testers, a,semidwarf allele from Shiokari (sd-1), Taichung 65 (sd-1), andMilyang 23; b, tall allelefrom Shiokari and Taichung 65 (A, Pn, Pau). Segregation of EstI-2 alleles with culmlengths in F3 families of Shiokari/Shiokari (sd-1); T, tall; S, short; seg, segregating fortall and short.
oz
80 100 120 140 40
Culm length (cm)
60 80 100 120 140
Fig. 6. The distributions of semidwarf and tall culm lengths and EstI-2 alleles in F2 and F3families of (a) Shiokari/Shiokari (sd-1), (b) Taichung 65 (A, Pn, Pau)/Taichung 65 (sd-1), and (c) Milyang 23/Kasalath. I. Segregation of EstI-2 alleles in relation to culmlength in F2 populations. II. Segregation of EstI-2 alleles and culm lengths in F3families.
76

The linkage relationship between the semidwarf gene, sd-1, and the isozyme locus, Estl-2, was elucidated using segregating populations derived from crosses between severalsemidwarf testers and tall rice varieties. Bimodal distributions for culm length were observedin F2 populations of three cross combinations, including Shiokari/Shiokari (sd-1), Taichung 65(A, Pn, PoM)/Taichung 65 (sd-1), and Milyang 23/Kasalath. Taking the valley of the distributioncurves as the dividing point, two height classes were apparent with a segregation ratio of 3 tall: 1 short, demonstrating this character to be under the control of a single recessive gene (Figs5 and 6).
An inheritance study of esterase isozymes, based on isoelectric focusing (IEF), showedthat the Estl-2 locus had two active allozymes of monomeric structure and one null form, whichwere designated "a", "b", and "n", respectively [14]. Semidwarf testers such as Shiokari (sd-1),Taichung 65 (sd-1) and Milyang 23 have an active allozyme designated as EstI-2"\ while thetall parents, Shiokari and Taichung 65 (A, Pn, Pau), have the active allozyme, Estl-2bb, andKasalath has a null form of the allozyme, Estl-2nn. By dividing F2 populations based on Estl-2allozyme patterns, culm length distributions exhibited trimodal curves. Most of the short plantshad the homozygous Estl-2™ pattern of the short parents, most of the tall plants had thehomozygous pattern, Estl-2bb or Estl-2nn, and most of the intermediate plants had theheterozygous Estl-2ab or Estl-2?" banding pattern. Linkage analysis indicated that sd-1 and Estl-2were tightly linked (Fig. 6). These findings were also confirmed by segregation analyses in F^progenies. No recombinants were found among 171 F3 families from the Shiokari/Shiokari(sd-./)combination, five recombinants were found among 267 F3 families from Taichung 65 (A, Pn,Pow)/Taichung 65 (sd-1), and only two recombinants were found out of 237 F^ families fromMilyang 23/Kasalath. The recombination values were 0, 1.87 and 0.8%, respectively (Table IV).
TABLE IV. LINKAGE RELATIONSHIPS BETWEEN ESTI-2 AND SD-1 IN F, FAMILIES OF (A)SHIOKARI/SHIOKARI (SD-I), (B) TAICHUNG 65 (A,PN, PA £/)/TAICHUNG 65 (SD-I) AND (C)MILYANG 23/KASALATH
Culm length Estl-2 allozymes in F3 Total LX: Recombination Value (%)aa ab b
A: Shiokan/Shiokari (sd-1)
TTTtttTotal
00
4444
0800
80
4700
47
4780 351.0**44
171
0
B: Taichung 65 (A, Pn, Pau) Taichung 65 (sd-1)
TT 0 0 66 66Tt 1 133 1 135 504.5** 1.87tt 63 3 0 66Total 6 136 67 267
C: Milyang 23/Kasalath
TT 0 0 67 67Tt 0 124 2 126 4634** 08tt 44 0 0 44Total 4 124 69 237
77

6. MOLECULAR MAPPING OF SEMIDWARF GENE (sd-1)
To establish the location of the semidwarf gene, sd-1, the anthocyanin activator (A), purplenode (Pn), purple auricle (Paw), and the isozyme locus, EstI-2, in relation to DNA markers onthe molecular linkage map of rice, 20 RFLP markers, previously mapped to the central regionof chromosome 1 [15], were mapped onto an F2 population derived from the cross Taichung65 (A, Pn, Pow)/Taichung 65 (sd-1). The sd-1 and EstI-2 were determined to be linked mosttightly to RFLP markers RG109 and RG220, which cosegregated with each other (Fig. 7). Thedistance between these RFLP markers and sd-1 was estimated to be 0.8 cM, based on anobserved recombination value of 0.8%. The order of genes and markers in this region ofchromosome 1 was determined to be sd-l-(EstI-2-RG220-RG109)-RG381-A-Pn-Pau (Fig. 8).
RG22Q
Cirfm length
1 3 1 1 1 1 1 2 2 3 2 2 3 3 3 3 3 A/Hindi I I
1 3{Pt)(P2)
1 1 1 1 2 2 2 2 2 3 3 3 3 3
Fig. 7. Cosegregation of the sd-1 gene and the RFLP marker RG220 in the F3 families derivedfrom the cross Taichung 65 (A, Pn, Pau)/Taichung 65 (sd-1). Xbal-digested DNAs wereblotted onto the filter. Genotypes: 1, homozygous for Taichung 65 (sd-1) (PI) allele;2, heterozygous; 3, homozygous for Taichung 65 (A, Pn, Pau)(P2) allele; *recombinant individual.
33.6
Pau
Fig. 8. Linkage map of rice chromosome 1 based on F2 segregation of Taichung 65 (A, Pn,Pau)/Taichung 65 (sd-1). Kosambi cM to the left of the chromosome line; markerdesignations to the right of the chromosome line.
78

7. MARKER-ASSISTED SELECTION OF SEMIDWARF (sd-1) CHARACTER
Selection of a specific genotype from a segregating population is the main bottleneckin conventional breeding procedures. The utility of molecular markers in plant breeding is basedon finding tight linkages between markers and genes of interest. Such linkages permit one toselect indirectly for the presence of a desirable genotype by assaying for the molecular marker[16] and could significantly shorten the breeding cycle by their simplicity and reproductibility.In cases where a gene has been introduced into a wide array of germplasm from a single donorvariety, markers identified in one population are likely to be useful in other populations thatsegregate for the gene.
The semidwarf phenotype cannot be clearly identified at the young seedling stage inrice. In addition, plant height is controlled by a variety of genes and is often normallydistributed in breeding populations, making it difficult to unambiguously identify plantscarrying the recessive sd-1 gene. The efficiency of a breeding program would be increased ifa reliable marker-assisted selection strategy could be used early in the life of the plants.
To test the efficacy of selection for sd-1 based on the linked markers, RG109 andRG220, and the isozyme locus, EstI-2, 203 50-day-old F2 seedlings derived from the crossMilyang 23/Gihobyeo were analyzed for marker genotype. At this age, the semidwarf charactercould not be clearly detected based on phenotype. In addition, plant height was normallydistributed in this population, making it difficult to unambiguously identify plants carrying sd-1.Thirteen seedlings homozygous for the ^/-./-associated allele at EstI-2, RG220 and RG109, and13 seedlings homozygous for the Sd-1-associated allele at all three marker loci were selectedfor further genetic analysis.
At 20 days after heading, the culm lengths of these 26 plants were measured and theexpected phenotype was confirmed in every case. These 26 plants were then selfed for fourgenerations and F6 lines were evaluated to determine whether any recombination among thethree molecular markers, or between these markers and the sd-1 gene, could be detected. Norecombinants were identified, confirming the tight linkage of these loci and the usefulness ofmarker assisted genotypic selection for this recessive semidwarf character before it ismanifested phenotypically (Fig. 9).
Sequence Tagged Sites (STSs) are an alternative to cloned sequences as mappingmarkers. PCR allows the selective amplification of a region of DNA, providing that thesequence of a 20-30 nucleotide area flanking the area of interest is known. After end-sequencing the RGI09 insert at both ends, PCR primers were designed (Fig. 10), and used toamplify the specific region (Fig. 11). The DNA product amplified by PCR had one band andit was cut into two bands by EcoR V in Milyang 23, but was not cut in Gihobyeo. This PCRpattern was the same as the RFLP pattern of RG 109 in segregating lines; it was cut into twobands in semidwarf progenies, one band in tall ones, and incompletely cut showing three bandsin heterozygotes which segregated in the next generation. Thus it could be used as a CAPS(cleaved amplified polymorphic sequence) marker for efficient selection of sd-1 genotypes invitro.
79

ioo
CD
«
o
Estl-2
RG220
RG109
-1-3
S.s 80100
F6 Progenies
{ I . ' ' .
•I 1• - ! -
I I I I11 13 M G 14 16
Individual plants18 20 22 24 26
Fig. 9. Effect of in-vitro selection of plants at early stages, using molecular markers EstI-2,RG220, RG109, on culm length at late stages of the F2 generation and that of progeniesin the F6 generation of Milyang 23/Gihobyeo. F6 plants were grown under greenhousecondition during the winter ('91/'92).
f TCiaxac TQBrretn ocwaasc CMCKTCK TOMOCK oaaoggcu
xraucaen TMuMdA umoaa. aitir
•araaaa auaasa MCCWIIM nsnutoi ranuac imauac
raaaOK coc t
(aruai
nor TO: rona ICT «w «c «r camm
Fig. 10. Nucleotide sequence of RG 109 and locations of primers designed for the PCRamplificaiton of RG 109 region of chromosome 1.
80
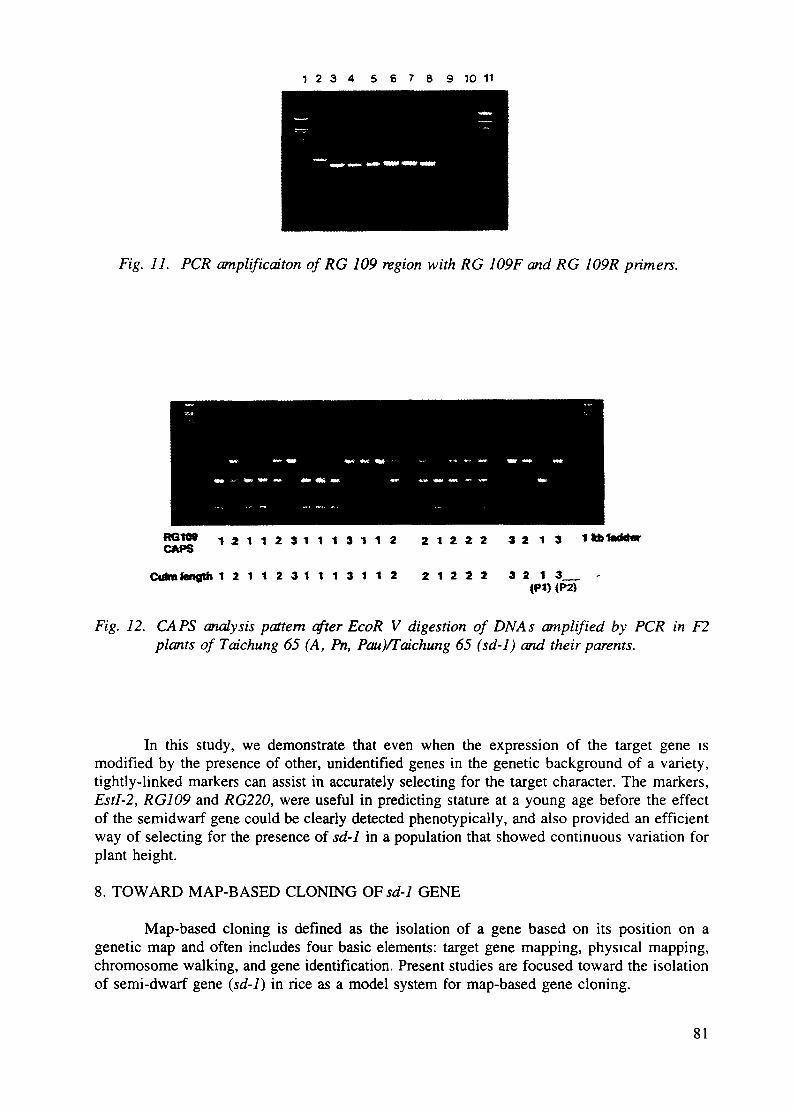
1 2 3 4 5 6 7 8 9 1 0 1 1
Fig. 11. PCR amplificcdton of RG 109 region with RG 109F and RG 109R primers.
RG1W 1 2 1 1 2 3 1 1 1 3 1 1 2 2 1 2 2 2 3 2 1 3
Culm length 1 2 1 1 2 3 1 1 1 3 1 1 2 2 1 2 2 2 3 2 1 3 _ _ -(PI) <P2>
Fig. 12. CAPS analysis pattern after EcoR V digestion of DNAs amplified by PCR in F2plants of Taichung 65 (A, Pn, Pau)/Taichung 65 (sd-1) and their parents.
In this study, we demonstrate that even when the expression of the target gene ismodified by the presence of other, unidentified genes in the genetic background of a variety,tightly-linked markers can assist in accurately selecting for the target character. The markers,EstI-2, RG109 and RG220, were useful in predicting stature at a young age before the effectof the semidwarf gene could be clearly detected phenotypically, and also provided an efficientway of selecting for the presence of sd-1 in a population that showed continuous variation forplant height.
8. TOWARD MAP-BASED CLONING OF sd-1 GENE
Map-based cloning is defined as the isolation of a gene based on its position on agenetic map and often includes four basic elements: target gene mapping, physical mapping,chromosome walking, and gene identification. Present studies are focused toward the isolationof semi-dwarf gene (sd-1) in rice as a model system for map-based gene cloning.
81

One recent advance that promises to greatly aid in the construction of contig maps isthe development of new vectors for cloning large DNA fragments. They are yeast artificialchromosomes (YAC) and bacterial artificial chromosome (BAG) We have constructed riceYAC and BAG libraries for physical mapping and chromosome walking around the region ofthe sd-1 gene; approximately 15,000 YACs with an average insert size of 150 kb (Fig. 13) and5,000 BACs with an average insert size of 100 kb have been constructed.
The DNA probe RG109, the one most tightly linked to the sd-1 gene, was used toscreen the BAG libraries by colony hybridization and at least five overlapping BAG cloneswere isolated, ranging from 45 to 145 kb in insert size. To extend the BAG contigs toward thesd-1 locus and to isolate suitable makers for the next step of the chromosome walk, the endsof BACs were isolated by using plasmid rescue and PCR methods (Fig. 14).
9. THE DEVELOPMENT OF THE KOREA RICE GENOME NETWORK ANDRiceMac
The Korea Rice Genome WWW Server was constructed to distribute the rice researchand economic information around the world. The Network provides EST sequences and theirhomology analysis results from rice immature seed cDNA which was performed by the KoreaRice Genome Research Group. The Network also supports the access to Rice Genes which isa nee specific Unix Database covering world wide rice research and genomic information. Forthe personal use of Rice Genes, RiceMac was developed.
1 2 3 4 5 6 7 8 91011121314
-145
-4E5
Fig. 13. Pulsed field gel separation of YACs and identification by Southern blot. The 1%agarose gel was run at 200V using ramped pulse times from 12.6 to 44.7 sec. for 24hours in 0.5X TBE. The gel DNA was transferred onto nylon membrane. As probe,pBR322 labeled with 32[P]dCTP was used.
82

RZ7» RG2» Srf-7 KG109 ErtM
Ell-2
£41-1 EMBL3£54-1
B1WB 5K» ? f IT f f T? BLM l«Cg Mkh
f IT y f —— ? BXQM04 1451*
Pi If —— P BTQ27N23 45U> HAC«
f -
P BTQ3«W« J6U>N:N«1 S-.U1
Fig. 74. 5fe/?5 involved in map-based cloning of semidwarf (sd-1) gene of rice.
The first version, RiceMac 4.1.1, contains the 120 phenotypic images of marker mutantspublished by Dr. M. H. Hue along with the data of Rice genes 4.1.1. The RiceMac containsthe rice research information such as authors, papers, abstracts, germplasm, mapping data,sequence, and probes information. The database also shows graphical presentation of molecularand morphological maps marked with probes according to their loci which are linked to theirmapping data and blot images showing polymorphism. The database program can perform theDNA sequence analysis such as 3 frame translation, restriction analysis, codon usage analysisand splicing. The Korea Rice Genome WWW Server and the WWW mirror site of Rice Genesare maintained at the BioServer http://bioserver.myongji.ac.kr) of the Dept. of BiologicalScience, Myongji University and the Unix Server (http://sun20.asti.re.kr) of National Instituteof Agricultural Science and Technology, RDA. The RiceMac (120 MB) is available as acompressed self-extracted file at the ftp archive (file://probe.nalusda.gov/pub/ricegenes) ofAgricultural Genome Information Service(AGIS), National Agricultural Library (NAL), USDA.Also the CD-ROM version of RiceMac is available upon written request for those who do nothave direct access to internet.
83

REFERENCES
[I] BOTSTEIN, D., WHITE, R.L., SKOLNCK, M., DA VIS, R.W., Construction of agenetic linkage map in man using restriction fragment length polymorphisms, Am. J.Hum. Genet. 32 (1980) 314-331.
[2] BURR, B., BURR, F.A., THOMPSON, K.H., ALBERTSEN, M.C., STUBER, C.W.,Gene mapping with recombinant inbreds in maize, Genetics 118 (1988) 519-526.
[3] WEBER, J.L., MAY, P.E., Abundant class of human DNA polymorphism which canbe typed using the polymerase chain reaction, Am. J. Hum. Genet. 44 (1989) 388-396.
[4] VOS, P., HOGERS, R., BLEEKER, M., REIIANS, M., VAN DE LEE, T., HORNES,M., FREITERS, A., POT, I., PELEMAN, J., KUIPER, M., ZABEAU, M., AFLP: a newconcept for DNA fingerprinting. Nucleic Acids Res. 23 (1995) 4407-4414.
[5] CHO, Y.G., BLAIR, M.W., PANAUD, O., McCOUCH, S.R., Cloning and mapping ofvariety-specific rice genomic sequences:amplified fragment length polymorphisms(AFLP) from silver-stained polyacrylamide gels, Genome 39 (1996) 373-378.
[6] CAUSSE, M.A., FULTON, T.M., CHO, Y.G., AHN, S.N., CHUNWONGSE, J., WU,K., XIAO, J., YU, Z., RONALD, P.C., HARRINGTON, S.E., SECOND, G.,McCOUCH, S.R., TANKSLEY, S.D., Saturated molecular map of the rice genomebased on an interspecific backcross population, Genetics 138 (1994) 1251-1274.
[7] KURATA, N., NAGAMURA, Y., YAMAMOTO, K., A 300 kilobase interval geneticmap of rice including 883 expressed sequences. Nature Genet. 8 (1994) 365-372.
[8] CHEN, X., TEMNYKH, S., XU, Y., CHO, Y.G., McCOUCH, S.R., (Development ofa microsatellite map providing genome-wide coverage in rice (Oryza saliva L.), Theor.Appl. Genet. (1997) (in press).
[9] BECKER, J., VOS, P., KUIPER, M., SALAMINI, F., HEUN, M., Combined mappingof AFLP and RFLP markers in barley, MoL Gen. Genet. 249 (1995) 65-73.
[10] MAHESWARAN, M., SUBUDHI, P.K., NANDI, S., XU, J.C., PARCO, A., YANG,D.C., HUANG, N., Polymorphism, distribution, and segregation of AFLP markers ina doubled haploid rice population, Theor. Appl. Genet. 94 (1996) 39-45.
[ I I ] AQUINO, R.C., JENNINGS, P.R., Inheritance and significance of dwarfism in an indicarice variety, Crop Sci. 6 (1966) 551-554.
[ 12] KJNOSHTTA, T., Report of the committee on gene symbolization, nomenclature andlinkage groups, Rice Genet. Newslet. 7 (1990) 16-50.
[13] SUH, H.S., HEU, M.H., The segregation mode of plant height in the cross of ricevarieties. II. Linkage analysis of the semidwarfness of rice variety "Tongil", Korean J.Breed. 10 (1978) 1-6.
[14] EUN, M.Y., KIM, Y.K., CHO, Y.G., CHUNG, T.Y., Inheritance of esterase isozymesin rice by isoelectric focusing, Korean J. Breed. 22 (1990) 252-259.
[15] McCOUCH, S.R., KOCHERT, G., YU, Z.H., WANG, Z.Y., KHUSH, G.S., COFFMAN,W.R., TANKSLEY, S.D., Molecular mapping of rice chromosomes, Theor. Appl. Genet76 (1988) 815-829.
[16] TANKSLEY, S.D., YOUNG, N.D., PATERSON, A.H., BONIERBALE, M.W., RFLPmapping in plant breeding: new tools for an old science. Biotech. 7 (1989) 257-264.
[17] CHO, Y.G., McCOUCH, S.R., KUIPER, M., POT, J., KANG, M.R., GROENEN,J.T.M., EUN, M.Y., Integration of AFLP and RFLP markers using recombinant inbredpopulation of rice (Oryza saliva L.). Theor. Appl. Genet. (1997) (in press).
84

DETECTION OF GENETIC VARIABILITY IN BASMATI AND NON-BASMATIRICE VARIETIES AND THEIR RADIATION INDUCED MUTANTS THROUGHRANDOM AMPLIFIED POLYMORPHIC DNA (RAPD)
S. FAROOQ, N. IQBAL, M. ARIFNuclear Institute for Agriculture and Biology (NIAB),Faisalabad, Pakistan
Abstract
Random Amplified Polymorphic DNA (RAPDs) markers were utilized to detect polymorphism betweenpure lines and commercially available Basmatl nee varieties to assess variation which may be helpful in qualitycontrol and varietal identification (Basmati-370 and derived radiation induced mutants), differentiation of mutantsand parents, and identification of RAPD markers co-segregating with important agronomic traits including plantheight, days to flower and grain quality. Basmatl varieties were distinguished from non-Basmati varieties withthe help of five diagnostic markers which will be useful for detecting mixing of non-Basmati and Basmatl rices,currently a serious marketing problem. Different Basmatl cultivars were identified with the help of diagnosticRAPD markers which can be used in quality control as well as for "fingerprinting" of cultivars Differentradiation induced mutants were also successfully distinguished from the parents on the basis of variety specificand mutant specific markers which will be useful for varietal identification In addition to this, other markerswere also identified which can differentiate mutants from each other and are being used for the fingerprintingof different mutants, particularly the dwarf mutants having similar appearance but different parentage Foridentification of RAPD markers co-segregating with plant height and days to flower, 50 F, plants and four F,families were studied from a reciprocal cross made between Kashmir Basmatl (tall and early) and Basmatl-198(dwarf and late). Segregating bands were observed within these populations, and indicating the possible use ofRAPD markers for tagging gene(s) of agronomic importance in rice
1. INTRODUCTION
The Nuclear Institute for Agriculture and Biology (NIAB) is undertaking research onthe creation of genetic variability in rice, wheat, chickpea, cotton and mungbean throughinduced mutations, tissue culture and wide hybridization. The mutants of rice are being usedas germplasm in crossbreeding programs aimed at improvement of plant type, early maturityand aroma [1]. Since most of these characters are polygemc and quantitatively inherited [2],selection of desirable plants through conventional breeding is difficult. Besides, most of thesecharacters are highly influenced by the environment and often defy phenotypic identificationdue to the complex genotype x environment interactions that may affect the trait of interest.Under such circumstances, the true genetic potential of the plants might not be detected andit would be difficult to decide which plants should be selected and/or crossed to getrecombinants of interest.
Utilization of molecular markers such as Random Amplified Polymorphic DNA(RAPD) [3] in breeding and selection programmes may circumvent some of these problems;RAPD markers have frequently been used in rice breeding programmes. For example,Fukuoka et al. [4] used RAPD markers to characterize different rice accessions. Munthali etal. [5] used RAPDs to fingerprint rice cultivars. Ronald et al.[6] used 895 random primers and123 DNA markers to reference the gene that confers resistance to the pathogen Xanthomonasoryzae. Ashikawa et al. [7] determined a range of polymorphism in the rice genome by RAPDmethod. Yamazaki et al. [8] determined region-specific molecular marker using bulkedsegregant RAPD analysis. Antonio et al. [9] reported 1100 DNA markers consisting ofgenomic clones, complementary DNA (cDNA) clones and RAPD markers on the RestrictionFragment Length Polymorphism (RFLP) linkage map of rice. RAPD markers have also beenused to characterize the rice blast fungus Pyrcularia grisea [10]. Yu and Nguyen [11]compared 9 upland and 4 lowland rice cultivars with the help of 42 random primers. They
85
obtained 260 PCR products, of which 80% were polymorphic. They concluded that RAPDanalysis is a useful tool in determining genetic relationships among rice cultivars. Mohan etal. [12] used RFLP and RAPD markers to map the rice GM2 gene that confers resistance tobiotype 1 of gall midge. Farooq et al. [13] used RAPD markers to characterize different wildand cultivated, salt tolerant and resistant rice species/varieties and identified genome specific,species specific and cultivar specific RAPD markers. Identification of species specific andcultivar specific RAPD markers in intergeneric F, hybrids of rice has also been made [14];it was observed that the appearance of RAPD markers in interspecific F, hybrids is primerdependent. All these reports support the usefulness of RAPD markers in detecting geneticvariability in rice. The goals of the current project were therefore, to utilize RAPD markersto detect polymorphism in pure lines, commercially available Basmati rice varieties (as ameans to determine within variety variations which may be helpful in quality control andvarietal identification), and their radiation induced mutants. A further goal was to identifyRAPD markers co-segregating with plant height, days to flower and grain quality. Successin this programme would help to accelerate the identification, selection, characterization andutilization of mutants and identification of RAPD markers that can be used to acceleratebreeding programmes.
2. MATERIALS AND METHODS
Traditional Basmati cultivars, their different radiation induced mutants and differentnon-Basmati rice varieties as described in Table I were collected from the rice breeding groupof NIAB. Seedlings were raised in a rice nursery in the field and leaves were collected forDNA extraction. One month old nursery plants were transplanted to the field plots with aninter- and intra-row spacing of 20 cm. Agronomic practices were the same as reported byCheema and Awan [15]. Leaf samples were again collected at the active tillering stage.Collected samples were dipped immediately in liquid nitrogen and stored at -85°C for furtheruse.
Reciprocal crosses were made between Kashmir Basmati (tall and early) and Basmati-198 (dwarf and late) in the summer of 1993. Fj seeds were selfed in 1994 and the segregatingF2 plants were planted in 1995, spaced as above. Selections were made from 500 individualplants on the basis of the plant type of Kashmir Basmati (10-15% reduction in plant height)and the plant type of Basmati-198 (flowers 3-4 weeks earlier). One F2 individual, whichshowed 11-12% reduction in plant height, was selected from the cross between KashmirBasmati and Basmati 198 and planted to create an F3 population, 40 of which were selectedat random on the basis of characters mentioned in Table II. Similarly, one individual, whichshowed a 6% increase in plant height and 5 week earlier flowering was selected from thereciprocal cross between Basmati 198 and Kashmir Basmati and planted to create an F3population, 40 of which were selected at random on the basis of characters mentioned inTable HI.
Based on the same criteria, five individual plants from each cross direction were alsoselected for comparison in the F3 (Tables II and HI). Days to flowers were taken as the time,in days, from sowing to the appearance of the first panicle. Data with respect to plant heightand heading date were recorded and leaf samples were collected for individual plants both inF2 and F3 generations.
Genomic DNAs from the leaves of all the test materials were extracted by using aCTAB method [16]. The concentration and quality of the DNAs, composition of reactionmixture, kind and source of primers and amplification conditions were similar to those used
86
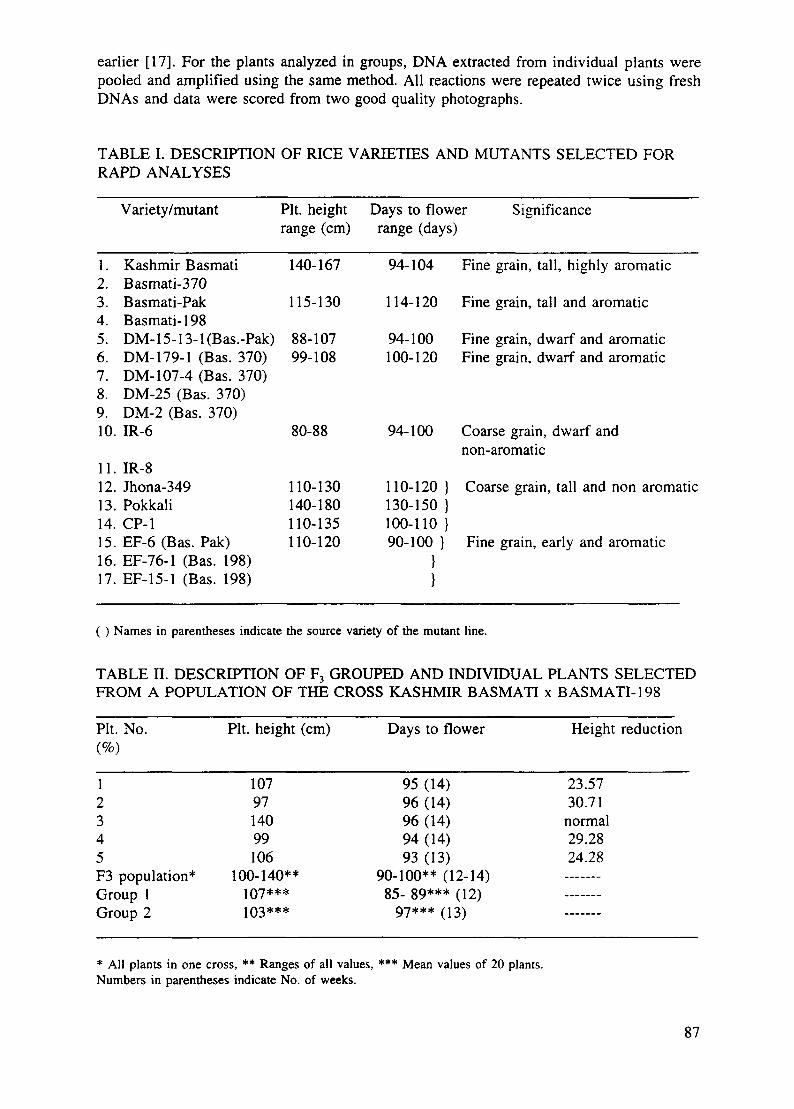
earlier [17]. For the plants analyzed in groups, DNA extracted from individual plants werepooled and amplified using the same method. All reactions were repeated twice using freshDNAs and data were scored from two good quality photographs.
TABLE I. DESCRIPTION OF RICE VARIETIES AND MUTANTS SELECTED FORRAPD ANALYSES
Variety/mutant Pit. height Days to flowerrange (cm) range (days)
Significance
1.2.3.4.5.6.7.8.9.
Kashmir Basmati 140-167Basmati-370Basmati-Pak 115-130Basmati- 198DM-15-13-l(Bas.-Pak) 88-107DM- 179-1 (Bas. 370) 99-108DM-107-4 (Bas. 370)DM-25 (Bas. 370)DM-2 (Bas. 370)
94-104 Fine grain, tall, highly aromatic
114-120 Fine grain, tall and aromatic
94-100 Fine grain, dwarf and aromatic1 00- 1 20 Fine grain, dwarf and aromatic
10. IR-6
11. IR-812. Jhona-34913. Pokkali14. CP-115. EF-6(Bas. Pak)16. EF-76-1 (Bas. 198)17. EF-15-1 (Bas. 198)
80-88 94-100 Coarse grain, dwarf andnon-aromatic
110-130 110-120 } Coarse grain, tall and non aromatic140-180 130-150 }110-135 100-110 }110-120 90-100} Fine grain, early and aromatic
( ) Names in parentheses indicate the source variety of the mutant line.
TABLE II. DESCRIPTION OF F3 GROUPED AND INDIVIDUAL PLANTS SELECTEDFROM A POPULATION OF THE CROSS KASHMIR BASMATI x BASMATI-198
Pit. No. Pit. height (cm) Days to flower Height reduction
12345F3 population*Group 1Group 2
1079714099106
100-140**107***103***
95 (14)96 (14)96 (14)94 (14)93 (13)
90-100** (12-14)85- 89*** (12)
97*** (13)
23.5730.71
normal29.2824.28
* All plants in one cross, ** Ranges of all values, *** Mean values of 20 plants.Numbers in parentheses indicate No. of weeks.
87

TABLE HI. DESCRIPTION OF F3 AND INDIVIDUAL PLANTS SELECTEDPOPULATION OF THE CROSS BASMATI-198 x KASHMIR BASMATI
Pit. No. Pit. height (cm) Days to flower Induced earliness
12345F3 population*Group 1Group 2
10394
100110105
90-110**95***100***
98 (14)97 (14)87 (12)99 (14)91 (13)
86-100 (12-14)90*** (13, 4 weeks early)97*** (14^ 3 weeks early)
1 week1 week3 weeks1 week2 weeks
* All plants in one cross, ** Ranges of all values, *** Mean values of 20 plants.Numbers in parentheses indicate No. of weeks.
3. RESULTS
Three primers (S-13, S-19 and S-18) successfully identified Basmati from non-Basmatirice varieties by 5 RAPD fragments of which 2 each were specific for Jhona-349 and IR-6and 1 fragment was specific for Basmati-Pak (Figs 1 and 2). Primer S-13 was used to amplifythe mixture of Jhona-349 and Basmati-Pak which showed different relative intensities offragments (Fig. 3). No fragments could be identified for the non-Basmati rice variety Pokkali,possibly indicating a lack of DNA. Four primers (S-13, R-15, R-17 and R-18) differentiatedBasmati-Pak, Basmati 198, Kashmir Basmati and Basmati-370 from each other.
Fig. 1. Amplification profile produced by primer S-19 distinguishing non-Basmativarieties (lanes 3 and 12) and Basmati varieties (lanesS, 5, 6, 7 and 11).
88

Fig. 2. Amplification profile produced by primer S-18 distinguishing non-Basmativarieties (lanes 2,11) from Basmati varieties (lanesS, 4, 5, 6).
1. Marker
2. Bas-198
3. Bas-Pak
4. Bas-198 + IR-6
6. Jhona 349 + Bas-Pak
Fig. 3. A mplification profile produced by primer S-13 indicating reproducibility of majorDNA fragments in Bas-Pak (lanes 3 and 8) and a different profile for a mixtureof Bas-Pak (lane 6).
89

Comparisons of radiation-induced variants and Basmati parent varieties are shown in Figs4 and 5. Three primers (R-15, R-17 and S-13) produced fragments which could be used todifferentiate the mutants from their parents. DM-2, DM-25, DM-107-4 and Kashmir Basmatiare mutants of Basmati-370 and showed band pattern differences. DM-15-13-1 and EF-6 aremutants of Basmati-Pak and showed band pattern differences. EF-76-1 is a mutant ofBasmati-198 and showed band pattern differences.
Comparison of progeny and parents with primer R-08 showed segregating fragments(Fig. 6). Two plants showed 11-12% reduction in plant height (Fig. 6, lanes 4 and 5). Twoplants showed 6-7% increase in plant height (Fig. 6, lanes 10 and 11). One plant showed 6%increase in plant height and 5 week earliness (Fig. 6, lane 8). The variation in phenotypictraits did not seem to correlate with band pattern differences.
Fig. 4. Amplification profile produced by primer R-18 distinguishing Basmati varietiesfrom each other (lanes 1,2,6 and 9).
90

Fig. 5. Amplification profile produced by primer S-13 distinguishing Basmati varieties(lanes 2,3,7 and 10) and radiation induced mutations (lanes 4,5,6,8,9 and 11) (seeTable I).
Fig. 6.
1.K. Bas
2.K. BasxBas-198
3. K. BasxBas-198
4. K. BasxBas-198
5. K. BasxBas-198
6. K. BasxBas-198
7. Bas-198
8. Bas-198xK. Bas
9. Bas-198 xK. Bas
10. Bas-198 xK. Bas
11.Bas-198xK.Bas
12. Bas-198 xK. Bas
13. Marker
Amplification profile produced by primer R-08 comparing parents (lane 1 and 7)and selected progeny from reciprocal crosses of Kashmir Basmati and Basmati-198 (lanes 2-6 and 8-12).
91

4. DISCUSSION
Molecular markers such as RFLP [18] and RAPDs [3] are capable of producing uniqueband patterns that can be used in rice breeding programs for different purposes [19]. SinceRAPD markers are technically simple, quick to perform with small amount of DNA and donot require radioactive labelling [20] they are preferred over RFLP and are widely used, e.g.in lettuce [20], broccoli and cauliflower [21], Anabidopsis thaliana [22], maize [23], wheat[17] and apples [24]. In addition to this, RAPDs are also being used for detection of geneticpolymorphism in cereals [25], gene introgression [26], identification of different fish species[27], estimation of the number of full sibling families of mosquitoes [28] identification ofmutants [29, 30] and characterization of pathogens [31].
In the present project, we used RAPD markers for three main purposes: 1)identification of different Basmati cultivars, 2) comparison of mutants with their parents and3) comparison of DNA fragments and trait segregation in Basmati rices.
Basmati rice cultivars, especially Basmati-370 which is considered the finest qualityrice in the world, grows predominantly in Pakistan and about 40-45% of its production isbeing exported. Mixing low quality rice with Basmati rice affects the international consumermarket which results in a loss of foreign exchange earnings. The problem could be avoidedif strict quality control measures would be taken. Markers specific for Basmati cultivars canhelp identify any kind of mixing in the pure Basmati varieties and it has been shown in thepresent study that RAPD markers can be used for this purpose. Additional RAPD markershave also been identified which can discriminate between all the Basmati cultivars. Thesemarkers are reproducible and appear only in the specific Basmati variety and can serve asdiagnostic markers for that particular variety and for its fingerprinting which is essentiallyrequired for varietal registration.
Mutation breeding is a supplementary approach for crop improvement and has playeda productive role in sustainable agriculture. About 1790 different mutants have been listed inthe database; many of them have been used for general cultivation and quite a large numberhave served as germplasm sources in breeding programmes[32]. Mutations represent changesat the DNA level and can be detected through the use of molecular markers. In the presentstudy we have detected a number of band pattern differences which may be useful fordistinguishing different mutants of Basmati varieties from their parents. Ultimately, markersspecific for dwarf mutants would useful as probes for selection and/or induction of dwarfismin the rice breeding programmes, in addition to identification of dwarf mutants of similarappearance but different parentage.
RAPD markers have also been used for tagging disease resistance gene(s) in cropsincluding stem rust [33] and crown rust resistant genes in oats [34], rust resistance genes incommon bean [35] and vf gene for scab resistance in apple [36]. In the present study effortshave been made to identify RAPD markers co-segregating with plant height and days tomaturity. Unfortunately, it was not possible to establish any correlations with the limitednumber of primers utilized here.
Plant height, days to maturity, aroma and other quality parameters are all quantitativelyinherited traits [37, 38] and are governed by more than two sets of genes. The co-segregationof DNA fragments with a specific reduction in plant height, or early or delayed floweringmay also co-segregate with other QTLs. The most important consideration in analysis andinterpretation of QTL data is the threshold employed for inferring that a QTL is statistically
92

significant. Although, the present study was made on 50 F2 plants and four F3 families, theRAPD analyses presented are not based on the full set data but rather on plants selected onphenotypic extremes or which represent the best available estimates of the portion of the totalphenotype and thus could be biased. The variance calculated on such data would beconsidered as overestimated compared to the calculations made on the full data set. Thepresent study however, can serve as an index to compare the importance of different DNAfragments (markers) and their co-segregation with particular character(s). It could be inferredfrom the present study that tagging gene(s) with RAPD markers can produce more meaningfulresults if the analysis is made on the full data set, work which is currently in progress.
REFERENCES
[I] Twenty Years of NIAB. Fourth 5 years Report. NIAB, Faisalabad, Pakistan (1992)1-9.
[2] AW AN, M.A., CHEEMA, A.A., TAfflR, G.R., The exploitation of induced geneticvariability for the improvement of Basmati rice (Qryza saliva L). In: New GeneticalApproaches for Crop Improvement. (Siddiqui, K.A., Faruqui, A.M. Eds., PIDCPrinting Press (PVT) LTD. Karachi, (1982) 203-212.
[3] RAFALSKI, J.A., TIGNEY, S.V., WILLIAMS, J.G.K., RAPD markers: a newtechnology for genetic mapping and plant breeding. Ag. Biotech. News. Inf. 3 (1991)646-648.
[4] FUKUOKA, S., HOSAKA, K., KAMLTIMA, O., Use of Random AmplifiedPolymorphic DNAs (RAPD) for identification of rice accessions. Jap. J. Genet. 67(1992) 243-252.
[5] MUNTHALI, M., FORD-LLOYD, B.V., NEWBURY, H.J., The random amplificationof polymorphic DNA for fingerprinting of plants. PCR Methods Appl. 1 (1992) 274-276.
[6] RONALD, P.C., ALBANO, B., TABffiN, R., ANENES, L., WU, K.S., McCOUCH,S., TANKSLEY, S.D., DNA markers in plant improvement. Genetic and physicalanalysis of the rice bacterial blight disease resistance locus XA21. Mol. Gen. Genet.236 (1992) 113-120.
[7] ASHIKAWA, L, FUKUOKA, S., INOUE, T., MIYAO, A., MONNA, L., ZHONG, S.,SASAKI, T., Polymorphism analysis of rice genome by PCR. Rice Genome 2 (1992)6-7.
[8] YAMAZAKI, M., MIYAO, A., MONNA, L., ZHONG, H.S., TSUJI, T., TOUYAMA,T., SASAKI, T., Search RAPD markers for the brown plant hopper resistance geneBph 1. Rice Genome 3 (1994) 3.
[9] ANTONIO, B.A., YAMANOTO, K., HARUSfflM, Y., SUE, N., SHOMURA, A.,LIN, S.Y., INOUE, T., FUKUDA, A., SfflMANO, T., HAYASAKA, H., KUBOKI,Y., ZUNGSONTION, S., YANO, M., KURATA, N., NAGAMURA, N., More thanone thousand markers mapped by RFLP. Rice Genome 2 (1993) 3-8.
|0] BERNARDO, M.A., NAQVI, N., LEUNG, H., ZEIGLER, R.S., NELSON, R.J., Arapid method for DNA fingerprinting of the rice blast fungus, Pyricularia grisea. Int.Rice Res. Notes 18 (1993) 8-50.
[ I I ] YU, L.X., NGUYEN, H.T., Genetic variation detected with RAPD markers amongupland and lowland rice cultivars (Qryza saliva L.). Theor. Appl. Genet. 87 (1994)668-672.
[12] MOHAN, M., NAIR, S., BENTURE, J.S., RAO, U.P., BENNETT, J., RFLP andRAPD mapping of the rice GM2 gene that confers resistance to biotype 1 gall midge(Oreseolia oryzae). Theor. Appl. Genet. 87 (1994) 782-788.
93
[13] FAROOQ, S., SHAH, T.M., ARIF, M, IQBAL, N., Utilization of RAPD markers forthe identification of cultivated and wild rice species. Pak. J. Bot. 27 (1995) 127-138.
[14] FAROOQ, S., SHAH, T.M., ARIF, M., IQBAL, N., Inheritance of RAPD markers inthe F, interspecific hybrids of rice. Pak. J. Bot. 28 (1996) 51-59.
[ 15] CHEEMA, A.A., AW AN, M.A., Mode of reduction of internode length in a semidwarfmutant of indica rice cultivar, Basmati-370. Pak. J. Agric. Res. 3 (1982) 208-210.
[16] ROGERS, S.O., BENDICH, A.J., Extraction of DNA from plant tissues. Plant Mol.Bio. Manual. A6 (1988) 1-10.
[17] FAROOQ, S., SHAH, T.M., ASKARI, E., ZAIDI, A.A., ARIF, M., IQBAL, N.,Identification of different wheat genotypes through polymorphism based on RandomAmplified Polymorphic DNA (RAPDs). Pak. J. Bot. 26 (1994) 373-382.
[18] JAFFREYS, A.J., WILSON, V., THIEN, S.L., Individual specific "fingerprints" ofhuman DNA. Nature 316 (1985) 76-79.
[19] McCOUCH, S.R., TANKSLEY, S.D., Development and use of Restriction FragmentLength Polymorphism in rice breeding and genetics. In: Rice Biotechnology, C.A.B.Int. Wallingford, Oxon, UK (1991) 109-133.
[20] MICHELMORE, R.W., PARAN, I., KESSELI, R.V., Identification of markers linkedto disease resistance genes by bulked segregant analysis: A rapid method to detectmarkers in specific genomic regions by using segregating populations. Proc. Natl.Acad. Sci. USA 88 (1991) 9828-9832.
[21 ] HU, J., QUIROS, C.F., Identification of broccoli and cauliflower cultivars with RAPDmarkers. Plant Cell Reports 10 (1991) 505-511.
[22] REITER, R.S., WILLIAMS, J.G.K., FELDMANN, K.A., RAFALSKI, J.A., TIGNEY,S.V., SCOLINKS, P.A., Global and local genome mapping in A rabidopsis thaliana byusing inbred lines and Random Amplified Polymorphic DNA. Proc. Natl. Acad. Sci.USA, 89 (1992) 1477-1481.
[23] HEUN, M., HELENTJARIS, T., Inheritance of RAPD markers in F, hybrids of corn.Theor. Appl. Genet. 85 (1993) 961-968.
[24] LANDRY, B.S., LI, R.Q., CHEUNG, W.Y., GRANGER, R.L., Phylogeny analysis of25 apple root stocks using RAPD markers and tactical gene tagging. Theor. Appl.Genet. 89 (1994) 830-847.
[25] WANG, G., CASTINGLIONE, S., ZHANG, J., FU, R.Z., MA, J.S., LI, W.B., SUN,Y.R., SALA, F., Hybrid rice (Oryza saliva L.) identification and parentagedetermination by RAPD fingerprinting. Plant Cell Reports. 14 (1994) 2-3.
[26] DURHAM, E.R., KOREAN, S.S., Evidence of gene introgression in apple usingRAPD markers. Euphytica 79 (1994) 109-114.
[27] BARDAKCI, F., SKIBINSKI, D.O.F., Application of the RAPD technique in Tilapiafish: species and subspecies identification. Heredity 73 (1994) 117-123.
[28] APOSTOL, B.L., BLACK, W.C., MILLER, B.R., REITER, P., BEATY, B.J.,Estimation of the number of full sibling families at an oviposition site using RAPD-PCR markers: Applications to the mosquito Aedes aegypti. Theor. Appl. Genet. 86(1993) 991-1000.
[29] YANG, H.Y., SCHMIDT, H., Selection of a mutant from adventitious shoots formedin X-ray treated cherry leaves and differentiation of standard and mutant with RAPDs.Euphytica 7 (1994) 88-99.
[30] DENG, Z.N., GENTIL, A., NICOLOSI, E., DOMINA, F., VARDI, A., TRIBULATO,E., Identification of in vivo and in vitro lemon mutants by RAPD markers. J. Hort.Sci. 70(1995) 117-126.
[31] CROWHURST, R.N., KING, F.Y., HAWTHORNE, B.T., SANDERSON, F.R.,CHOIPHENG, Y., RAPD characterization ofFusarium oxysporum associated with wiltof angsans (Pterocarpus indicus) in Singapore. Mycological Res. 99 (1995) 14-18.
94

[32] MALUSZYNSKI, M, VAN ZANTEN, L., ASHRI, A., BRUNNER, H.,AHLOOWALIA, B.S., ZAPATA, J.F., WECK, E., Mutation techniques in plantbreeding. In: Induced Mutations and Molecular Techniques for Crop Improvement,IAEA, Vienna (1995) 489-504.
[33] PENNER, G.A., CHONG, J., LEVESQUE LEMAY, M., MOLNER, S.J., FEDAK, G.,Identification of a RAPD marker linked to the oat stem rust gene Pg 3. Theor. Appl.Genet. 85 (1993) 902-905.
[34] PENNER, G.A., CHONG, J., WIGHT, C.P., MOLER, S.J., FEDAK, G., Identificationof a RAPD marker for the crown rust resistance gene PC 68 in oats. Genome 36(1993) 818-820.
[35] HALEY, S.D., MIKLAS, P.N., STAVELY, J.R., BYRUM, J., KELLY, J.D.,Identification of RAPD markers linked to a major rust resistance gene block incommon bean. Theor. Appl. Genet. 86 (1993) 505-512.
[36] YANG, H.Y., KRUGER, J., Identification of RAPD marker linked to the vf gene forscab resistance in apples. Euphytica 77 (1994) 83-88.
[37] KOESTER, R.P., SISCO, P.O.H., STUBER, C.W., Identification of quantitative traitloci controlling days to flowering and plant height in near isogenic lines of maize.Crop Sci. 33 (1994) 1209-1216.
[38] PATERSON, A.H., DEVERNA, J.W., LANINI, B., TANKSLEY, S.D., Fine mappingof quantitative trait loci using selected overlapping recombinant chromosomes in aninterspecific cross of tomato. Genetics 124 (1990) 735-742.
NEXT PAQE(S) Ileft BLANK I
1 95

APPLICATION OF DNA RFLP PROCEDURES IN INTERSPECIFICGENE TRANSFER: THE Lrl9 TRANSLOCATION OF WHEAT
R. PRINSAgricultural Research Council (Small Grain Institute), XA9847001Department of Genetics,University of Stellenbosch,Stellenbosch, South AfricaG.F. MARAIS, A.S. MARAISDepartment of GeneticsUniversity of StellenboschStellenbosch, South Africa
Z.A. PRETORIUSDepartment of Plant Pathology,University of the Orange Free State,Bloemfontein, South Africa
B.J.H. JANSEDepartment of Microbiology,University of Stellenbosch,Stellenbosch, South Africa
Abstract
Twenty-nine lines with deletions in the Lrl9 ('Indis') translocated chromosome segment were used tophysically map Thinopyrum Restriction Fragment Length Polymorphism (RFLP) loci as well as the Sr25 andSdl loci. The relative distances between marker loci on the translocation were then calculated. The informationwas then used as an aid to characterize several recombined forms of the translocation. The data confirmed thereported homoeology between the Lrl9 segment and chromosome arm 7DL of wheat. Also, it seems that theLrl9 translocation in 'Indis' is very similar to the Lrl9 segment in the T4 source and that the former may notderive from Thinopyrum distichum. Near-isogenic lines of the recombined segments were derived and used tostudy their expression of leaf rust resistance. It became evident that only one potentially useful recombinant wasobtained in an earlier attempt to induce aJlosyndetic pairing between the Lrl9 translocation and 7DL of wheat.
1. INTRODUCTION
The Lrl9 translocation of wheat carries a leaf rust resistance gene which providesexcellent leaf rust resistance world-wide. Unfortunately, in many countries Lrl9 cannot beused for breeding bread wheats as the translocated segment also carries a gene(s) that codesfor yellow endosperm pigmentation [1-3]. Other known loci on the segment include: Ep-Dl(endopeptidase), Wsp-Dl (water-soluble protein), Sr25 (stem rust resistance) and Sdl(segregation distortion) [4-6].
There are two sources of the Lrl9 translocation, the Thinopyrum ponticum derivedLrl9 or T4 [7] translocation and the 'Indis' translocation that was selected in the Dept. ofGenetics, Stellenbosch in the backcross progeny of the 'Inia 66'(whea.i)/Thinopyrum distichumcross in the early eighties. The origin of the 'Indis' translocation has, however, remainedsuspect as Thinopyrum distichum, as well as its amphiploid with common wheat are highlysusceptible to local pathotypes of leaf and stem rust. The Thinopyrum segment (that hasreplaced a large portion of chromosome 7DL of wheat) does not pair with homoeologouswheat segments during meiosis, complicating attempts to recombine its genes or to studylinkage relationships.
97

Following irradiation, Marais [5] derived 29 deletion mutants, each homozygous fora different deletion of the translocation. In an attempt to break the linkage between the leafrust resistance and yellow endosperm loci, Marais [8] made use of pairing inhibitor (phlb,ph2b) mutants in wheat ('CS') to induce allosyndetic pairing and crossovers between the Lrl9segment and homoeologous areas of the wheat genome.
Four suspected recombinants giving white endosperm, three giving partially whiteendosperm, and one producing yellow endosperm but sometimes showing self-elimination,were recovered. The resistance in the four white selections was found to be associated withchromosomes other than 7D [9]. Knowledge of the relative positions of marker genes wasrequired to characterize and select the most promising recombined forms. The deletion lineswere used to determine the linear sequence of three marker genes on the translocated 7DLarm as: centromere-Lr/9-Ws/?-.D./-y [5]. They were used to characterize the suspectedrecombinants [8]. However, more markers were needed.
The aims of the present study were to: determine through deletion mapping the relativepositions of further marker loci (especially DNA markers) on the 'Indis' translocation; usethis knowledge to better characterize the suspected recombinants; study the expression of theleaf rust resistance of the original and apparently recombined forms; and determine whetherthe 'Indis' translocation could have been derived from Thinopyrum distichum.
2. MATERIALS AND METHODS
The deletion mutant lines were used to physically map three Thinopyrum RFLP loci,as well as the Sr25 and Sdl loci. The eight suspected recombinants were also tested for thepresence of the various marker loci. The original translocation and apparently recombinedLrl9 segments were incorporated through backcrossing into four common wheat backgrounds.These near-isogenic lines were compared for their resistance to five leaf rust pathotypes.
3. RESULTS AND DISCUSSION
The deletion map results obtained by Marais [5] were integrated with the present dataand are presented in Table I [10]. The mutants were ordered to reflect the sequence of markergenes studied. It can be assumed that irradiation induced random breaks on the translocationthat resulted in these deletions. The frequencies with which the different mutants wereobtained will, therefore, reflect the physical distances (arbitrary units) between loci. While themutations were mostly caused by terminal deletions, at least two intercalary deletions mayhave occurred.
Three mutants had partially white endosperm which could suggest the presence ofmore than one Y locus or modified expression of a single locus. Similar phenotypes wererecovered amongst the apparently recombined forms [8]. However, in view of the limiteddata, we chose to treat Y as being a single locus. Two mutants expressed stem rust resistancesimilar to that produced by Sr25, yet each has lost Thinopyrum chromatin on both sides ofSr25. It was assumed that the resistance does not derive from Sr25 in these mutants.
Physical mapping of Sdl was problematic. Due to the complexity of the gametocidalinteraction it was not possible to unequivocally distinguish genotypes showing complete,impaired or no gametocidal activity. The Sdl gene in translocation heterozygotes causes maleand female gametes not carrying it to abort, and the severity of the effect depends on wheatresponder genes in the genetic background [6]. Our results confirm the finding of Zhang &
98

Dvorak [11] that Sdl is situated between Lrl9 and the centromere. The absence of theXpsrlOS and Xpsrl65 loci in three mutants, which have apparently lost all the marker loci,but still cause preferential transmission, normal transmission or self-elimination suggests thatSdl is situated proximal to these loci. The segregation distortion effects of 21 of the mutantswere clearly different from that observed in crosses involving 'Indis' and 'Inia 66' and self-elimination occurred regularly. This would suggest that at least one further gametocidal genemay be involved. The gene probably has a distal location and was lost in the mutantsdescribed. It appears to enhance or to supplement the effect of Sdl.
TABLE I. DELETION MAP DATA100* 1"! 1 26 7rr~r ¥> 6 6 7 6 7
Mutan t : Sdl Xpsr Xpsr Xpsr Lrl9165 105 129
87M23-14587M23-19889M1-5187M23-189M2-32787M23-17887M23-22787M23-27389M1-2589M1-6989M1-7887M23-31487M23-387M23-2787M23-10887M23-11587M23-11887M23-12889M2-41687M23-21989M2-4087M23-17589M2-3987M23-10389M2-24587M23-22589M2-42689M1-1887M23-266
aabbaacaadaaaddaadbdccccdddba
_
---144-4-44-4-+4-4-4-4-+4-+4-4-4-
-<•'++++++4
_
----44->--t44-+4- 4-4- 4-4- 4-4- 4-+ ++ +
.<•' ++ +4- 4-
4- 4-+ +4 44- 4-+ +4- 4-4- 4-4 4-
-
-- - - ---------
4/#.--.. . . .
'. '. '. j.K-rf
--
4 -" if '-4+ - ! - - -4 4 - -4 4 4 +f,X4 t -I 4
Percentage break points.* Preferential/ normal transmission and self-elimination.* Only self-elimination observed.' Apparently normal segregation ratios, but low seed set.d Only preferential transmission observed."^ Based on segregation of the mutated translocation in different full sib families.' Intercalary deletion.! Dubious classifications, see text (not considered in the calculation of physical distances).* Intermediate phenotypes suggesting the possibility of more than one locus.
99

A total of 30 probable break points were recognized and used to estimate the physicaldistances between genes as indicated in this physical map. Most of the current maps for thissegment simply show the markers as occurring within a linkage block. This is the first mapdepicting the linear sequence and estimated distances for the markers studied on this segment(7el,). This also contradicts the results obtained by Kim et al. [12] that Xpsrl29 is situateddistal to Lrl9. The data confirmed the reported homoeology between the Lrl9 segment andchromosome arm 7DL of wheat.
The recombinants were also characterized and rough physical maps of the apparentlyrecombined Lrl9 segments were constructed as illustrated in Table II [13]. The selectionswere found to fall into two groups: those that retained large Thinopyrum segments, produceyellow or partially white endosperm and remained on chromosome 7D; and those that occuron different chromosomes and are not associated with yellow flour pigments. With respectto the first group, more distally located markers should be studied to determine if the distalparts of the three partially white selections have indeed been exchanged with wheatchromatin. The four promising white endosperm recombinants were initially selected on thebasis of leaf rust resistance (one pathotype, UVPrtS) and absence of yellow endospermpigmentation. Three of these selections (87M70-63, 88M22-157, 88M22-184) do not exhibitany of the Thinopyrum marker phenotypes except for having strong leaf rust resistance(unknown gene, LrT) against one of five predominant pathotypes (UVPrtS). The latterselections have an altered resistance that could have resulted from the unintentional selectionof a 'contaminating' resistance gene in the progeny following the induction of allosyndeticpairing. As will be discussed, the pedigree of 'Indis' is suspect and could have contributedsuch a gene.
The white endosperm recombinant 88M22-149 retained the Thinopyrum alleles of theXpsrl29 and Wsp-Dl loci, each of which can serve as a marker of its presence. It has alsolost the Xpsrl29 locus on 7BL and regained the 7DL locus which would suggest that it wasrelocated to chromsome arm 7BL. Both the wheat (Wsp-BJ) and Thinopyrum-derived (Wsp-Dl) loci are expressed in this recombinant. This would imply that an unequal crossover eventoccurred which created a duplicated region. This recombinant has probably lost Sdl and hasa very consistent tendency to self-eliminate. It is not clear from the results whether the strongself-elimination stems from the disruption of a complex of Sd genes or whether it is due to(or enhanced by) a disruptive chromosome duplication that occurred during recombination.It is the only true white endosperm recombinant that has retained the Lrl9 resistance andwhich provides complete resistance to the five pathotypes tested.
It seems likely that the 'Indis' translocation is simply a derivative of the T4translocation. A comparison of the RFLPs obtained with a ditelosomic lel^-Thinopyrumponticum addition line (W743), 'Indis' and the T4 translocation, confirmed that the 'Indis'and T4 translocations and chromosome 7el[ of T. ponticum produce identical bands.Fragments corresponding to the polymorphisms in the translocation could not be detected inDNA extracts of two accessions of Thinopyrum distichum or its amphiploid with wheat.
The physical map of the Lrl9 segment enabled us to characterize the eight suspectedrecombinants. This led to the identification of only one true recombinant from the fouroriginally suspected white recombinants. Should the Lrl9 resistance in this recombinant proveto be stable and not to be associated with any negative agronomic effects, it will be the onlyuseful white endosperm recombinant that has been obtained following the use of the phmutants. This illustrates that much effort is needed in tailoring the alien translocations for usein wheat breeding.
100

TABLE II. POLYMORPHISMS FOR MARKER LOCI IN SELECTIONS SUSPECTED TO HAVERECOMBINED LR19 TRANSLOCATED SEGMENTS (T: the THINOPYRUM allele; W: thecommon wheat allele: the alternative form which is a null condition or an allele that could not bepositively identified, ?: unknown)
• DC100 13"! 26 7 166 6 7 6 7 '
Line No:
Translocation
87M70-34888M22-4288M22-9888M22-103Unmodified
Sdl Xpsr165
on chromosome
? T7 VV0 -]
? T.T T
Xpsr105
a- A my-1)2
arm 7DL: yellow
TV\TTT
.W
-
Xpsr129
4 ——
Lrl9
and partially
TTTTT
TTTTT
Wsp-Dl Sr25 Y
E/>-Dlb
white endosperm
TriTT
1rTT
T
Tc
Tc
T
Resistance not associated with chromosome 7D: white endosperm
87M70-6388M22-15788M22-18488M22-149
WWWW
WWWW
WWWW
w iryw z./-?f
W L/-?f1\ 1*T ' T
wwwT d
wwww
Physical deletion map constructed by Pnns et al 1996aMapped within this region by Chao et al 1989
c Partially white recombmants (see text)Retained the Thinopyrum locus and regained the wheat 7DL locus
c Lost the wheat 7BL locusUnknown resistance gene (Z-''?)
ACKNOWLEDGEMENTS
We wish to thank the South African Wheat Board for financing the project. The cDNAclones were generously supplied by Dr. M.D. Gale, Institute of Plant Science Research,Cambridge Laboratory, Colney Lane, Norwich. UK. We also want to thank the JointFAO/IAEA Division of Nuclear Techniques in Food and Agriculture for making theattendance of this meeting possible.
101

REFERENCES
[I] KNOTT, D.R., Mutation of a gene for yellow pigment linked to Lrl9 in wheat, Can.J. Genet. 22 (1980) 651-654.
[2] KNOTT, D.R., The effect of transfers of alien genes for leaf rust resistance on theagronomic and quality characteristics of wheat, Euphytica 441 (1989) 65-72.
[3] MARAIS, G.F., ROUX, H.S., PRETORIUS, Z.A., PIENAAR, R. de V., Resistanceto leaf rust of wheat derived from Thinopyrum distichum (Thunb.) Love. Proc. 7thInt. Wheat Genet. Symp., Cambridge, 1988 (Miller, T.E., Koebner R.M.D., Eds) IPSR,Cambridge (1988) 369-849.
[4] MARAIS, G.F., MARAIS, A.S., The assignment of a Thinopyrum distichum (Thunb.)Love-derived translocation to the long arm of wheat chromosome 7D usingendopeptidase polymorphisms, Theor. Appl. Genet. 79 (1990) 182-186.
[5] MARAIS, G.F., Gamma irradiation induced deletions in an alien chromosome segmentof the wheat 'Indis' and their use in gene mapping, Genome 35 (1992) 225-229.
[6] MARAIS, G.F., Genetic control of a response to the segregation distortion allele, Sd-Id, in the common wheat line 'Indis', Euphytica, 60 (1992) 89-95.
[7] SHARMA, D., KNOTT, D.R., The transfer of leaf rust resistance from Agropyron toTriticum by irradiation, Can. J. Genet. Cytol. 8 (1966) 137-143.
[8] MARAIS, G.F., The modification of a common wheat-Thinopyrum distichumtranslocated chromosome with a locus homoeoallelic to Lrl9, Theor. Appl. Genet. 85(1992) 73-78.
[9] MARAIS, G.F., Characterization of modified forms of a Lrl9 translocation. Proc. 8thInt. Wheat Genet. Symp., Beijing, 1993, Li, Z.S., Xin, Z.Y. Eds., China Agric.Scientech Press, Beijing (1993) 937-941.
[10] PRINS, R., MARAIS, G.F., JANSE, B.J.H., PRETORIUS, Z.A., MARAIS, A.S., Aphysical map of the Thinopyrum-deri\ed Lrl9 translocation, Genome 39 (1996) 1013-1019.
[ I I ] ZHANG, H.B., DVORAK, J., Characterization and distribution of an interspersedrepeated nucleotide sequence from Lophopyrum elongatum and mapping of asegregation distortion factor with it, Genome 33 (1990) 927-936.
[12] KIM, N.-S., ARMSTRONG, K., KNOTT, D.R., Molecular detection of Lophopyrumchromatin in whtat-Lophopyrum recombinants and their use in the physical mappingof chromosome 7D, Theor. Appl. Genet. 85 (1993) 561-567.
[13] PRINS, R., MARAIS, G.F., PRETORIUS, Z.A., JANSE, B.J.H, MARAIS, A.S., Astudy of modified forms of the Lrl9 translocation of common wheat. Theor. Appl.Genet. (1997) (in press).
[14] CHAO, S., SHARP, P.J., WORLAND, A.J., WARHAM, E.J., KOEBNER, R.M.D.,GALE, M.D., RFLP-based genetic maps of wheat homoeologous group-7chromosomes. Theor. Appl. Genet. 78 (1989) 495-504.
102

MICROSATELLITES IN WHEAT AND THEIR APPLICATIONS XA9847002
P. STEPHENSON, G.J. DRY AN*, J. KIRBY, M.D. GALEJohn Innes Centre,Norwich Research Park,Norwich, United Kingdom
Abstract
The development of large panels of simply analyzable genetic markers for diversity studies and taggingagronomically important genes in hexaploid bread wheat is an important goal in applied cereal genetic research.We have isolated and sequenced over two-hundred clones containing microsatellites from the wheat genome, andhave tested 150 primer pairs for genetic polymorphism using a panel of ten wheat varieties, including the parentsof our main mapping cross. A total of 125 loci were detected by 82 primer pairs, of which 105 loci from 63primer pairs can be unequivocally allocated to one of the wheat chromosomes. A relatively low frequency of theloci detected are from the D-genome (24%). Generally, the microsatellites show high levels of geneticpolymorphism and an average 3.5 alleles per locus with an average polymorphism information content (PIC)value of 0.5. The observed levels of polymorphism are positively correlated with the length of the microsatelliterepeats. A high proportion, approximately one half, of primer pairs designed to detect simple sequence repeat(SSR) variation in wheat do not generate the expected amplificauon products and, more significantly, oftengenerate unresolvable Polymerase Chain Reaction (PCR) products. In general our results agree closely with thoseobtained from other recent studies using microsatellites in plants.
1. INTRODUCTION
In recent years the use of genetic mapping techniques based upon Polymerase ChainReaction (PCR) methodology using simple sequence repeat (SSR) markers has begun tosupersede the use of Restriction Fragment Length Polymorphisms (RFLP). A recent mousemap contains over 4000 microsatellite markers [1]. However, microsatellite markers have beendeveloped less rapidly in plants. Plant chromosomes carry microsatellites at relatively lowfrequencies when compared to mammals [2]. The relatively slow adoption of microsatellitetechnology is due to the high development cost of SSR markers. Nevertheless, microsatellitesare ubiquitous and have the potential to provide extremely polymorphic, codominant markersystems in plants [3, 4, 5]. Previous studies suggest that microsatellites occur at high enoughfrequencies to allow their isolation in relatively large numbers from plant genomes.
Hexaploid bread wheat shows relatively low levels of RFLP, most likely a result ofits narrow genetic base [6]. The formation of hexaploid wheat, in all likelihood, traces backto a single fortuitous hybrid only 10 000 years ago [7]. This lack of marker polymorphismin hexaploid wheat necessitates the use of very wide crosses for efficient map generation.RFLPs also show a considerable degree of clustering on the genetic map, and it is possiblethat other types of marker may show different patterns of genetic distribution across cerealgenomes. There is an unquestionable need for more highly polymorphic genetic markersystems than RFLPs can provide, particularly in crosses and breeding schemes using adaptedvarieties. Simple sequence repeats have previously been shown to be useful as geneticmarkers in wheat [8, 9]. In order to develop markers for genetic mapping and diversity studiesin hexaploid wheat and related species using microsatellites, we have isolated differentmicrosatellite repeats from the wheat genome by hybridization screens of small-insert genomiclibraries. We have isolated a substantial number of SSRs and have screened them for geneticpolymorphism using a panel of wheat varieties. Where possible, these markers have beenassigned to particular wheat chromosomes using aneuploid analysis. There are some problems
*Current address: Scottish Crop Research Institute, Invergowrie, Dundee, United Kingdom.
103
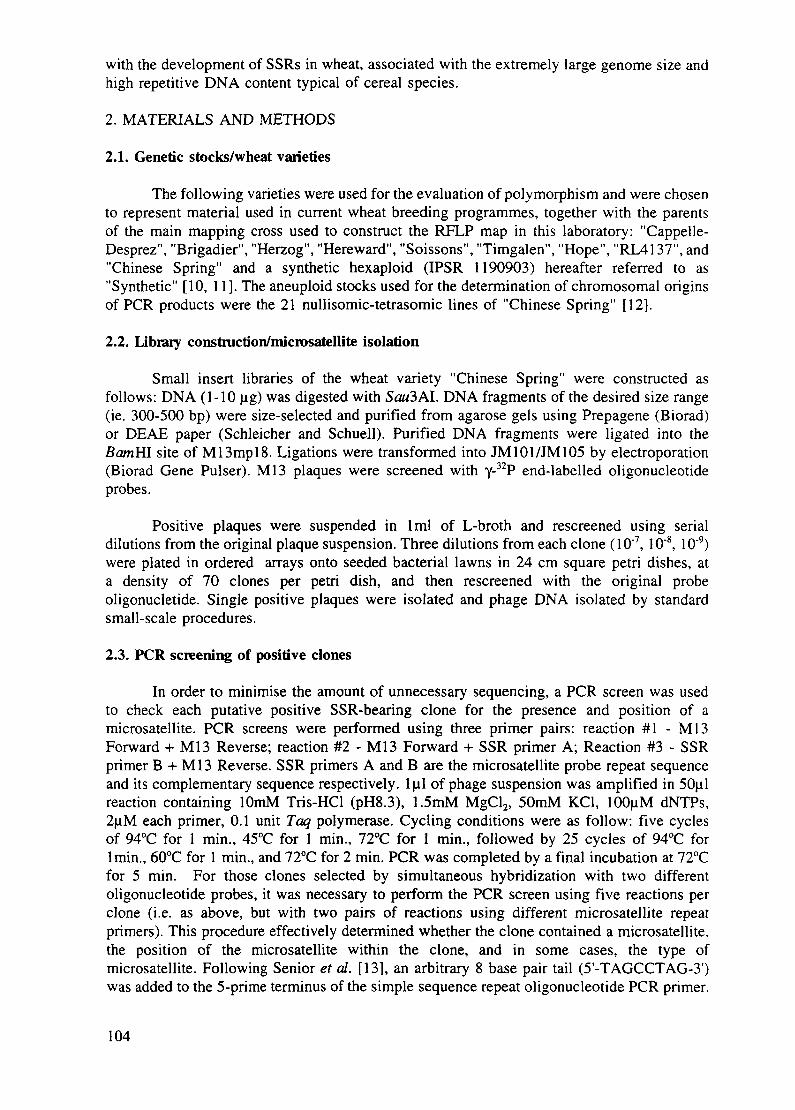
with the development of SSRs in wheat, associated with the extremely large genome size andhigh repetitive DNA content typical of cereal species.
2. MATERIALS AND METHODS
2.1. Genetic stocks/wheat varieties
The following varieties were used for the evaluation of polymorphism and were chosento represent material used in current wheat breeding programmes, together with the parentsof the main mapping cross used to construct the RFLP map in this laboratory: "Cappelle-Desprez", "Brigadier", "Herzog", "Hereward", "Soissons", "Timgalen", "Hope", "RL4137", and"Chinese Spring" and a synthetic hexaploid (IPSR 1190903) hereafter referred to as"Synthetic" [10, 11]. The aneuploid stocks used for the determination of chromosomal originsof PCR products were the 21 nullisomic-tetrasomic lines of "Chinese Spring" [12].
2.2. Library construction/microsatellite isolation
Small insert libraries of the wheat variety "Chinese Spring" were constructed asfollows: DNA (1-10 ug) was digested with SowSAI. DNA fragments of the desired size range(ie. 300-500 bp) were size-selected and purified from agarose gels using Prepagene (Biorad)or DEAE paper (Schleicher and Schuell). Purified DNA fragments were ligated into theBomHI site of M13mpl8. Ligations were transformed into JM101/JM105 by electroporation(Biorad Gene Pulser). Ml3 plaques were screened with y-32P end-labelled oligonucleotideprobes.
Positive plaques were suspended in 1ml of L-broth and rescreened using serialdilutions from the original plaque suspension. Three dilutions from each clone (10~7, 10"8, 10"9)were plated in ordered arrays onto seeded bacterial lawns in 24 cm square petri dishes, ata density of 70 clones per petri dish, and then rescreened with the original probeoligonucletide. Single positive plaques were isolated and phage DNA isolated by standardsmall-scale procedures.
2.3. PCR screening of positive clones
In order to minimise the amount of unnecessary sequencing, a PCR screen was usedto check each putative positive SSR-bearing clone for the presence and position of amicrosatellite. PCR screens were performed using three primer pairs: reaction #1 - Ml3Forward + Ml3 Reverse; reaction #2 - Ml3 Forward + SSR primer A; Reaction #3 - SSRprimer B + Ml3 Reverse. SSR primers A and B are the microsatellite probe repeat sequenceand its complementary sequence respectively, lul of phage suspension was amplified in 50|alreaction containing lOmM Tris-HCl (pH8.3), l.SmM MgCl2, 50mM KC1, lOOuM dNTPs,2|jM each primer, 0.1 unit Taq polymerase. Cycling conditions were as follow: five cyclesof 94°C for 1 min., 45°C for 1 min., 72°C for 1 min., followed by 25 cycles of 94°C forImin., 60°C for 1 min., and 72°C for 2 min. PCR was completed by a final incubation at 72°Cfor 5 min. For those clones selected by simultaneous hybridization with two differentoligonucleotide probes, it was necessary to perform the PCR screen using five reactions perclone (i.e. as above, but with two pairs of reactions using different microsatellite repeatprimers). This procedure effectively determined whether the clone contained a microsatellite,the position of the microsatellite within the clone, and in some cases, the type ofmicrosatellite. Following Senior et al. [13], an arbitrary 8 base pair tail (5'-TAGCCTAG-3')was added to the 5-prime terminus of the simple sequence repeat oligonucleotide PCR primer.
104

2.4. Sequencing of microsatellite containing clones
Phage DNA was isolated by standard small-scale procedures and DNA sequencing wasperformed with the AutoRead Sequencing kit (Pharmacia) analyzed with an Automated LaserFluorescence (ALF) DNA sequencer (Pharmacia)
2.5. PCR amplification and product analysis
DNA was extracted from fresh or freeze-dried plant tissue as described by Sharp etal. [14]. PCR primers were designed from the microsatellite flanking sequences either byinspection or by analysis using the 'oligo' primer analysis software (National Biosciences Inc.).Primers were chosen to have annealing temperatures in the range 58-65°C. DNA (100 ng) wasPCR amplified in 30 |al reactions containing: 10 mM Tris-HCl, pH 8.3, 2.5 mM MgCl2, 10mM KC1, 200nM of each primer, 200 uM of each dNTP, and 2.5 units of Taq DNApolymerase (Stoffel fragment, Perkin-Elmer). Cycling conditions were as follows: an initialdenaturation step of 4 min at 94°C, followed by 30 cycles of 30 sec at 95°C, 1 min at 61°C,and 1 min at 73°C. After cycling the reactions were incubated for 5 min at 73°C. PCRproducts were analyzed on standard denaturing sequencing gels (6% polyacrylamide (19:1Acrylamide:Bis), 8M urea). Products were visualised by silver staining (Promega Inc.), or bythe use of autoradiography where y-33P-labelled oligos were used as primers.
2.6. Estimation of polymorphism information content
We have estimated the polymorphism information content (PIC), assuminghomozygosity of wheat varieties, following Anderson et al. [15]:
PJC, =!-
where py is the frequency of theyth pattern for marker i and the sum is made over n patterns.
2.7. Chromosome assignment of SSRs
PCR amplifications were performed with DNA from a set of 21 nullisomic-tetrasomiclines of "Chinese Spring". The microsatellite loci were assigned to chromosomescorresponding to the nullisomic-tetrasomic template for which either no PCR product wasobtained, or one of the PCR products was missing, provided that the templates for all of theother twenty lines generated the relevant amplification product.
3. RESULTS
3.1. Cloning data and frequency of microsatellites in libraries
The M13 libraries were probed with six different microsatellite sequences: (CA)16,(GA)16, (CAA)10, (GAA)10, (ACG)10, (CAG)10. Approximately 2000 positive plaques werepicked from the primary screens of approximately 700,000 Ml 3 clones. Of these, 1500positive clones were re-screened and, wherever possible, single plaques isolated. From thesehybridizations, it was possible to plaque purify approximately 700 Ml 3 clones. These plaqueswere then screened by PCR to check the presence, nature, and position of the microsatelliteswithin the clones. The addition of an 8bp tail to the microsatellite repeat primer appears tohelp anchor the SSR PCR primer and to restrict slippage of the SSR primer along themicrosatellite array, resulting in more discrete PCR products. Only positive clones with asatisfactory location of the SSR were selected for DNA sequencing.
105

3.2. Sequencing data
Of 277 Ml3 clones sequenced, 222 were found to contain a microsatellite in thesequenced portion of the clone. Use of the PCR screen obviated the need for sequencing afurther 430 clones. Flanking primers from 150 sequences were synthesized. The majority ofmicrosatellite sequences contain either a (CA)n or a (GA)n repeat (-80%), which indicates that,as might be expected, the frequency of these types of dinucleotide repeats is significantlyhigher than the selected trinucleotide repeats in the wheat genome. Approximately 15% ofclones contained more than one type of microsatellite repeat and usually, the different repeattypes are adjacent, or very nearly so, in the clones.
3.3. PCR results and levels of genetic polymorphism
Primers from 82 of the 150 clones amplify a PCR product of the predicted size fromthe variety Chinese Spring, the source of the Ml3 clones. Primers from 63 of these clonesamplify products which can be assigned to a chromosome. The remaining 68 primers eitherproduce no detectable PCR products, incorrectly sized PCR products or a larger number ofbands which cannot be genetically analyzed with ease. Several clones contain more than onetype of microsatellite repeat (Table I).
TABLE I. FREQUENCY OF MICROSATELLITE MOTIFS
Repeat type Number found Frequency Sub-totals GA CA
GACACA/GACA/GTCA/CTCA/TAGA/TACAAGAAOther 3bp
5840
72743
1379
38.66%26.66% 65.33%4.66%1.33%4.66%2.66%2.00% 15.33%8.66%4.66%6.00% 19.33%
38.66%
4.66%
4.66%
2.00%
26.66%4.66%1.33%4.66%2.66%
Total 150 49.98% 39.97%
3.4. Localization of microsatellites to chromosomes
The distribution of chromosomal locations of microsatellite loci is shown in Table II.For several of the SSR primer pairs, it has been possible to identify the chromosomal originof more than one PCR product. These loci are spread across the three wheat genomes asfollows: A genome: 38 loci (36%), B genome: 42 loci (40%), D genome: 25 loci (24%).
In only four cases does one of the additional loci appear to originate from ahomoeologous chromosome but these are not polymorphic and so homeology cannot beproven. In 11 cases more than one PCR product appear to originate from the samechromosome, suggesting the possibility of duplicated chromosome specific sequences
106

containing microsatellites. Only two of these multiple products have been mapped and theymap to the same locus. In 27 cases, in which the primers amplified discrete product, the PCRproducts are not absent in any of the NT lines, suggesting amplification from a duplicatedsequence at two or more chromosomal locations in the wheat genome, in all cases these lociare not polymorphic.
TABLE II. DISTRIBUTION OF MICROSATELLITE LOCI BY GENOMES
B D Total
Chromosome 1Chromosome 2Chromosome 3Chromosome 4Chromosome 5Chromosome 6Chromosome 7
Total
%PIC all loci
PICpolymorphicloci
4757267
38
36%
0.4
0.49
15
118737
42
40%
0.4
0.53
3316318
25
24%
0.38
0.43
8151721121022
105
7.6%14.4%16.2%
20%11.4%9.5%21%
4. DISCUSSION
4.1. Identification of useful microsatellite loci
In this report we describe the isolation of a substantial number of microsatellites fromthe wheat genome. During our SSR isolation procedure, over 50% of putative positive cloneswere discarded during the secondary screening/plaque-purification process. Approximately60% of the plaque-purified clones were rejected following the PCR screen, obviating the needfor the sequencing of over 400 clones. Of 277 clones sequenced, 127 were deemed unsuitablefor primer synthesis. Therefore, as a proportion of the number of positive clones from the firstscreen, only 10% of the isolated SSRs were selected for primer synthesis. Owing to ourstringent selection criteria, we have been able to make PCR primers against a high proportionof the sequenced clones.
Given our experience of large attrition rates of positive clones, it may be advisable infuture, to opt for efficient SSR enrichment strategies to reduce expenditure of time andresources in clone purification [16, 17]. Future SSR isolation programmes should combine anefficient enrichment strategy, with one that avoids the cloning of highly repetitive flankingsequences from the wheat genome. The use of methylation-sensitive restriction enzymes, such
107

as Pstl and HpcUl, during the enrichment and cloning processes could possibly be used toaddress this problem [18].
4.2. SSR polymorphism
Based on a set of ten varieties, our microsatellites show an average PIC value of 0.51.However, given the large difference in microsatellite length, the average PIC values are verysimilar, suggesting that, beyond a critical length, the level of polymorphism exhibited bySSRs does not increase dramatically. The mean number of alleles seen in this study of tengenotypes is 3.6. We have tested a few of our SSRs on larger sets of more diverse materialand larger numbers of alleles have been detected. The level of polymorphism seen in thisstudy is considerably higher than that shown by RFLPs, although we do not have an estimatebased on the same set of varieties used in this study. The data of Chao et al. [6], whensubjected to a PIC analysis, gives an average figure of 0.06.
No effect on levels of polymorphism due to the different types of microsatellite canbe seen from our data. The PIC values of polymorphic (CA)n repeats average 0.5, (GA)nrepeats average 0.55, chimeric repeats average 0.65 and the 3 base pair repeats average 0.37.
4.3. Additional products generated by microsatellite primers
The SSR primers generally detect additional loci. The additional loci show lowerlevels of polymorphism (average PIC of 0.36, 2.4 alleles per locus). Sometimes the observedsize difference between PCR products from different loci exceeds the length of themicrosatellite in Chinese Spring, which implies that the microsatellite may be absent or thatthe flanking sequence has been deleted or rearranged. We feel that it is important to analyzethe DNA sequences of these additional products, in order to understand the basis ofmultilocus microsatellite amplification in hexaploid wheat. A common problem when usinga set of unrelated material for the analysis of microsatellites, is the unequivocal identificationof alleles for the same locus for primers detecting multiple loci, especially where the productsfrom the different loci are of very similar size.
In this study, a number of the 150 synthesised primer pairs gave rise to a largernumber of PCR products than can be resolved or analyzed with ease. In several cases theseproducts were observed as smears or stuttered ladder patterns on polyacrylamide gels.Obviously, with the high levels of repetitive sequences present in the wheat genome, it islikely that a relatively large number of microsatellites will be within DNA sequences that arethemselves repetitive sequences. During the isolation of SSRs, we have isolated clones whichappear to contain short repetitive motifs in the flanking DNA. It is important to establish theproportion of wheat microsatellites which are embedded in repetitive flanking DNA and tosee if such microsatellites can be rendered useful by judicious primer selection. Howeveragain, the use of methylation sensitive restriction digests for the initial library constructionmay reduce the proportion of non-useful amplification products.
4.4. Primer transportability
We have seen very little evidence of homoeologous amplification in this analysis. Itis not yet known if SSRs isolated from wheat represent homoeologous sequences, and whetherthe failure of primers to amplify across the three wheat genomes is due to polymorphism intheir flanking DNA. There are important questions concerning the transportability of PCRprimers raised against genomic sequences, across the three wheat genomes and beyond, into
108

other grass genomes. The data of Roder et al. [9] suggest that these types of PCR marker maynot transfer well to other species, in the way that RFLPs have been shown to do veryeffectively. Our results also show a low level of transportability across the three wheatgenomes and to other cereal genomes.
TABLE III. TRANSPORTABILITY OF MICROSATELLITES
Wheat
Diploid
Rye
Barley
Maize
Rice
Number transported
44 tested
34 (77%)
24 (55%)
18 (40%)
7 (16%)
5 (11%)
Number polymorphic26 ********
3 (1 dominant)
3 (1 dominant)
2 (0 dominant)
1 (0 dominant)
These results contrast greatly with results obtained using PCR primers raised againstcDNAs, which exhibit very high levels of transportability across cereal genomes [19]. Thisalso contrasts with data from mammalian microsatellite studies, whereby primers raisedagainst one species, often work on others [20]. This question of marker transfer betweenspecies is assuming an ever increasing level of significance in genetic studies in grasses andother organisms, given the current level of investment in comparative genetic mapping. Thedevelopment of these expensive PCR-based markers with the ability to transcend speciesbarriers in grasses is likely to be an important area of marker development in the comingyears.
REFERENCES
[1] DIETRICH, W.F., MILLER, J.C., STEEN, R.G., MERCHANT, M., DAMRON, D.,NAHF, R., GROSS, A., JOYCE, D.C., WESSEL, M., DREDGE, R.D., MARQUIS,A., STEIN, L.D., GOODMAN, N., PAGE, D.C., LANDER, E.S., A genetic-map ofthe mouse with 4,006 simple sequence length polymorphisms, Nature Genet. 7 (1994)220-245.
[2] LAGERCRANTZ, U., ELLENGREN, H., ANDERSSON, L., The abundance ofvarious polymorphic microsatellite motifs differs between plants and vertebrates,Nucleic Acids Res. 21 (1993) 1111-1115.
[3] AKKAYA, M.S., BHAGWAT, A.A., CREGAN, P.B., Length polymorphisms ofsimple sequence repeat DNA in soybean, Genetics 132 (1992) 1131-1139.
[4] MORGANTE, M., OLIVIERI, A.M., PCR-amplified microsatellites as markers inplant genetics, Plant I. 3 (1993) 175-182.
[5] WU, K-S., TANKSLEY, S.D., Abundance, polymorphisms and genetic mapping ofmicrosatellites in rice, Mol. Gen. Genet. 241 (1993) 225-235.
[6] CHAO, S., SHARP, P.J., WORLAND, A.J., WARHAM, E.J., KOEBNER, R.M.D.,GALE, M.D., RFLP-based genetic maps of wheat homoelogous group 7 chromosomes,Theor. Appl. Genet. 78 (1989) 495-504.
[7] HILLMAN, G.C., The plant remains from Tell Abu Hureyra: a preliminary report,Proc. Prehistoric Soc. 41 (1975) 306-322.
109
[8] DEVOS, K.M., BRYAN, G.J., COLONS, A.J., STEPHENSON, P., GALE, M.D.,Application of two microsatellite sequences in wheat storage proteins as molecularmarkers, Theor. Appl. Genet. 90 (1995) 247-252.
[9] RODER, M.S., PLASHKE, J., KONIG, S.U., BORNER, A., SORRELLS, M.E.,TANKSLEY, S.D., GANAL, M.W., Abundance, variability and chromosomal locationof microsatellites in wheat, Mol. Gen. Genet. 246 (1995) 327-333 .
[10] MCFADDEN, E.S., SEARS, E.R., The origin of Triticum spelta and its freethreshinghexaploid relatives, J. Hered. 37 (1946) 81-89.
[11] SEARS, E.R., A synthetic hexaploid wheat with fragile rachis, Wheat Inf. Serv. 41-42(1976) 31-32.
[12] SEARS, E.R., The aneuploids of common wheat, Missouri Agric. Exp. Stn. Res. Bull.572 (1954) 1-59.
[13] SENIOR, M.L., HEUN, M., Mapping maize microsatellites and polymerase chainreaction confirmation of the targeted repeats using a CT primer, Genome 36 (1993)884-889.
[14] SHARP, P.J., KREIS, M., SHEWRY, P., GALE, M.D., Location of beta-amylasesequence in wheat and it's relatives, Theor. Appl. Genet. 75 (1988) 289-290.
[15] ANDERSON, J.A., TANKSLEY, S.D., SORRELLS, M.E., Optimizing parentalselection for genetic linkage maps, Genome 36 (1993) 181-186.
[ 16] KARAGYOSOV, L., KALCHEVE, I.D., CHAPMAN, V.M., Construction of randomsmall-insert genomic libraries enriched for simple sequence repeats, Nucleic AcidsRes. 21 (1993)3911-3912.
[17] KANDPAL, R.P., KANDPAL, G., WEISSMAN, S.M., Construction of librariesenriched for sequence repeats and jumping clones, and hybridization selection forregion specific markers, Proc. Natl. Acad. Sci. USA 91 (1994) 88-92.
[18] CHEUNG, W.Y., MOORE, G., MONEY, T.A., GALE, M.D., HpdR library indicates'methylation-free islands' in wheat and barley, Theor. Appl. Genet. 84 (1992) 739-746.
[19] BRYAN, G.J., STEPHENSON, P., COLLINS, A., SMITH, J.B., GALE, M.D.,Isolation and characterisation of microsatellites from hexaploid bread wheat, Theor.Appl. Genet. 94 (1997) 557-563.
[20] SCHLOETTERER, C., AMOS, W., TAUTZ, D., Conservation of polymorphic simplesequence loci in Cetacean species, Nature 354 (1991) 63-65.
110

ADVANCES IN SORGHUM GENETIC MAPPING WITHIMPLICATIONS FOR SORGHUM IMPROVEMENT XA9847003
M. LEEDepartment of Agronomy,Iowa State University,Ames, Iowa, United States of America
Abstract
DNA markers and genetic maps have become important tools for direct investigations of several facetsof crop improvement and will provide vital links between plant breeding and basic plant biology The markersand maps will become more important for increased crop production because plant genetics will be required toextend or replace extant management practices such as chemical fertilizers, pesticides, and irrigation [1] Despitethe importance of the sorghum crop, comprehensive genetic characterization has been limited Therefore, theprimary goal of this research program was to develop basic genetic tools to facilitate research in the genetics andbreeding of sorghum The first phase of this project consisted of constructing a genetic map based on restrictionfragment length polymorphisms (RFLPs) The ISU sorghum map was created through linkage analysis of 78 F2plants of an intraspecific cross between inbred CK60 and accession PI229828 [2] Subsequent mapping effortsin several labs have enriched the sorghum map to the point where it now contains over 1,500 loci defined byRFLPs and many others defined by mutant phenotypes and QTLs The ISU map consists of 201 loci distributedamong 10 linkage groups covering 1299 cM Comparison of sorghum and maize RFLP maps on the basis ofcommon sets of DNA probes revealed a high degree of conservation as reflected by homology, copy number,and cohnearity Examples of conserved and rearranged locus orders were observed
The same sorghum population was used to map genetic factors (mutants and QTLs) for several traitsincluding vegetative and reproductive morphology, maturity, insect, and disease resistance Four QTLs for plantheight, an important character for sorghum adaptation in temperate latitudes for grain production, were identifiedm a sample of 152 F2 plants [3] whereas 6 QTLs were detected among their F3 progeny These observationsand assessments of other traits at 4 QTLs common to F2 plants and their F3 progeny indicate some of theseregions correspond to loci (dw) previously identified on the basis of alleles with highly qualitative effects Fourof the six sorghum plant height QTLs seem to be orthologous to plant height QTLs in maize Other possibleinstances of orthologous QTLs included regions for maturity and tillering These observations suggest that theconservation of the maize and sorghum genomes encompasses sequence homology. cohnearity, and function
The genetic information and technology developed on the basis of DNA markers could be used inseveral facets of breeding, genetics, and other basic biological investigations In addition, DNA markers havebeen used to survey large collections of elite sorghum germ plasm to determine the degree of geneticrelationships and genetic diversity [4] RFLP data seem to portray genetic relationships more accurately than themethods based exclusively on the coancestry coefficient This information provides the basis for more accurateperceptions of genetic relationships and diversity. Recently, PCR-based markers (microsatelhtes, simple sequencerepeats, SSRs) have become available for sorghum Thirty-two SSR loci have been mapped throughout thesorghum genome More SSR loci will be developed so that a rapid, reliable, and non-radioactive genetic markersystem will be available for sorghum research in the near future
1. INTRODUCTION
Knowledge of a crop's genetic architecture will become more important for increasedcrop production because plant genetics will be required to extend or replace extantmanagement practices such as chemical fertilizers, pesticides, and imgation Such knowledgewill include more detailed descriptions of genome organization, the crop's gene pools, andgenes and pathways controlling important phenotypes. In many instances, DNA markers andgenetic maps will be important tools for direct investigations of these areas and will providevital links between plant breeding and basic plant biology [1].
Many of the limitations of plant breeding methods have been rooted in the status ofthe technical infrastructure for conducting genetic analyses. Breeders and geneticists of allcrops have lacked an informative and integrated genetic context to aid interpretation and
111
conciliation of perspectives provided by seemingly different approaches to geneticimprovement. The result has been a situation resembling the Tower of Babel with breeders,geneticists, cytogeneticists, taxonomists, molecular biologists, plant pathologists, and otherfactions contributing to the confusion. A key component of the infrastructure and context offuture plant breeding programs will be genetic maps. The maps, when fully integrated, willhave several roles: 1) provide a focal point and hub for data derived from the perspectivesof myriad disciplines for each crop; 2) constitute a vital two-way avenue connecting plantbreeding and basic plant biology; 3) contribute essential information for positional cloning ofgenes; 4) facilitate a considerable and directed expansion of a crop's gene pool throughcomparative mapping of related and unrelated taxa; 5) accelerate identification andincorporation of useful genes into cultivars; and 6) contribute important clues towardunderstanding the biological basis of complex traits and phenomena important to cropimprovement. The significance of these and other roles and their implementation will varywith the repertoire of genetic technologies available to the crop, breeding methods and goals,and the nature of the crop's nuclear genome. However, the foundation provided by the mapshave had, and will have a positive impact on the genetic improvement of crop species inmany instances.
2. DEVELOPMENT OF A GENETIC MAP FOR SORGHUM AND COMPARATIVEMAPPING WITH MAIZE
In terms of cultivated area, sorghum (Sorghum bicolor L. Moench) is the world's fifthleading cereal [5]. Despite the importance of the sorghum crop, comprehensive geneticcharacterization has been limited. Therefore, the primary goal of this research program wasto develop basic genetic tools to facilitate research in the genetics and breeding of sorghum.The specific objectives were to 1) develop a complete genetic linkage map for sorghum basedon DNA markers, 2) identify the genetic locations of genes of interest to sorghum breedingprograms, 3) integrate the sorghum genetic map(s) with maps of allied grass species, and 4)assess the genetic diversity and relationships of sorghum germ plasm.
In sorghum, several maps have been developed for various objectives by differentresearch groups. These maps are being compared and integrated on the basis of probesexchanged among various laboratories (G. Hart, 1996 personal communication). The RFLPlinkage map produced at ISU (Iowa State University) was created through linkage analysisof 78 F2 plants of an intraspecific cross between inbred CK60 and accession PI229828 [2].These parents were selected to produce the mapping population for several reasons; 1)adequate DNA polymorphism, 2) parental difference for resistance to an important insect pest,the aphid, Schizapus graminum (greenbug, race E), 3) parental difference for resistance to thefungal pathogen, Peronsclerospora sorghi, the causal agent of downy mildew, 4) parentaldivergence for numerous morphological and developmental traits (e.g. plant height, flowering,and tillering), 5) no known chromosomal polymorphisms and 6) presumably, rates andpatterns of recombination more representative of other intraspecific crosses. Selection of thispopulation and use of maize DNA probes to detect RFLPs permitted rather efficient collectionof extensive genetic information for sorghum and the means of relating the information to thatof maize and other grasses.
The map consists of 201 loci distributed among 10 linkage groups covering 1299 cM.Presumably the number of linkage groups correspond to the basic chromosome complementof sorghum (n=10). The RFLP loci were detected through hybridizations with probes of maizegenomic (52), maize cDNA (124), and sorghum genomic (10) clones. Most probes detecteda single RFLP locus (172) but there was evidence of genomic duplication as many probes
112

(76) detected more than one band with a strong signal. However, in this population theadditional bands were usually monomorphic. Segregation data at 95% of the loci fit expectedratios for an F2 generation of a cross between two homozygous parents. Loci with deviantratios were located predominantly to one region of linkage group B. All features of this initialmap have been verified in a second and larger sample from this F2 population used formapping quantitative trait loci (QTL [3]).
Recently, a collaboration among my lab, the University of Milan, Italy (E. Pe and G.Taramino) and the USDA/ARS (S. Kresovich, Griffin, GA, USA) has identified genetic lociusing simple sequence repeats (SSRs or microsatellites). Genomic DNA clones or theirsequences containing di-, tri- or tetra-nucleotide repeats were selected from either Genbanksequences or specially constructed libraries. Flanking sequences were then used to constructprimers of 25-30 base pairs. PCR amplification of sorghum genomic DNA with these primerstypically amplifies one predominant DNA fragment that is easily observed on agarose (4%Metaphor) gels stained with ethidium bromide. The first report of this collaboration identifiedseven SSR loci in the CK60/PI229828 mapping population [6]. Mapping with SSR primersdeveloped by the USDA/ARS (S. Kresovich) will bring the total number of loci to 32 [7].Additional efforts to develop primers for detecting SSRs in sorghum have been recentlyinitiated (G. Hart, 1996, personal communication). Based on rather limited assessments andefforts, the utility of the primers has been limited to sorghum. In sorghum, however, SSRsdo detect more DNA polymorphisms than RFLPs (M. Lee, unpublished). Therefore, this DNAmarker system offers several advantages for breeding and genetics programs.
The maize DNA clones used to construct maize RFLP maps, and subsequent mappingof new maize cDNA clones, permitted comparative linkage analysis. Maize and sorghum areboth diploid (2n=2x=20) but the maize nuclear genome is 3-4 times larger than the sorghumgenome. Comparison of sorghum and maize RFLP maps revealed a high degree ofconservation as reflected by homology, copy number, and colinearity. Over 60% of the maizeclones, genomic and cDNA, produce strong hybridizations signals with sorghum. Many of theloci linked in maize (45 of 55 tested) were also linked in this sorghum population. Examplesof conserved and rearranged locus orders were observed.
3. MAPPING MUTANTS AND QTL'S IN SORGHUM AND MAIZE
The same sorghum population was used to map genetic factors (mutants and QTLs)for several traits including vegetative and reproductive morphology, maturity, insect, anddisease resistance. This presentation will emphasize analysis of genetic factors affecting plantheight, an important character for sorghum adaptation in temperate latitudes for grainproduction. Evaluations of the traits were conducted with 152 F2 plants [3] and their F3progeny (Ahnert, D.A., Pereira, M.G. and Lee, M. unpublished). Analysis of the F2 plantsdetected 4 unlinked QTLs for plant height accounting for 63% of the variation. The QTLswere located to linkage groups A, B, E, and H. Positive, additive genetic effects wereestimated at 15-32 cm and alleles for increased stature were derived from the tall parent,PI229828. Tallness was dominant or overdominant at 3 QTLs whereas short stature wasdominant at the fourth on linkage group H. Epistasis was evident for one pair of QTLs onlinkage groups A and E. Analysis of F3 progeny verified all features of the QTLs detectedin F2 plants and detected 2 additional QTLs for plant height in two other linkage groups, Dand F.
Analysis of other traits identified several QTLs linked and unlinked to the plant heightQTLs. Two QTLs for maturity (number of heat units to flowering) were identified as being
113

linked to two plant height QTLs. Regions initially identified as plant height QTLs wereassociated with several other traits (from 1 to 10). Only the QTL on linkage group E wasspecific for plant height. Collectively, these data and assessments of other traits at the 4 QTLscommon to the F2 plants and F3 progeny indicate some of these regions correspond to loci(dw) previously identified on the basis of alleles with highly qualitative effects. Theseobservations and linkage relationships will be assessed with sets of near isogenic lines foreach to the 4 dw loci.
4. COMPARATIVE QTL MAPPING
On the basis of integrated RFLP maps, the positions and effects of sorghum and maizeplant height QTLs were compared. Four of the six sorghum plant height QTLs seem to beorthologous to plant height QTLs in maize. The putative orthologous regions are (sorghumlinkage group and maize chromosome) as follows: A & long arm of chromosome 1, D &chromosome 5, E & long arm of chromosome 6, and H and chromosome 9. The regions ofthe maize plant height QTLs also contain genetic loci defined by mutants with qualitativeeffects on stature such as brl and anl on chromosome 1, nal and tdl on chromosome 5, pylon chromosome 6, and d3 on chromosome 9. The effects of some of these maize mutantsstrongly resemble those of the sorghum plant height QTLs and dw loci. At least 3 of thosemaize loci, anl, brl, and d3 have been tagged with transposons or cloned by variouslaboratories. These sequences could be used to isolate the related gene from sorghum andfurther assess the degree and nature of conservation between these two genomes.
Comparative QTL analysis identified evidence for several other orthologous regions.For example, a region of linkage group A (isu033-isu!23) was strongly associated withtillering and production of lateral branches. The LOD values were 2.8 and 8.7 in F2 plantsand F3 families. As indicated by comparative mapping with RFLP loci and QTLs for plantheight, this region of the sorghum genome is most closely related to the long arm ofchromosome 1 of maize. This region of the maize genome is the site of a genetic locus, tbl.The mutant phenotype at that locus is characterized by the production of many tillers andlateral branches in a manner strongly resembling the tillering QTL in sorghum. Other possibleinstances of orthologous QTLs included regions for maturity. These observations suggest thatthe conservation of the maize and sorghum genomes encompasses sequence homology,colinearity, and function despite their divergence millions of years ago and subsequentevolution in different hemispheres with contrasting ecogeographical conditions.
5. SORGHUM BREEDING AND GENETICS WITH DNA MARKERS
The genetic information and technology developed on the basis of DNA markers couldbe used in several facets of breeding, genetics, and other basic biological investigations ofsorghum. For example, sorghum breeders in temperate regions routinely transfer short statureand photoperiod insensitivity from adapted temperate inbred lines into exotic (tropical) germplasm through several generations of backcrossing. The goal of the backcross breeding is tomaximize the recovery of the tropical germplasm with a growth habit adapted to temperatelatitudes and mechanized harvesting. Once the traits necessary for temperate adaptation havebeen adequately recovered, the converted tropical germ plasm may be evaluated in temperateregions for traits. Similar programs are conducted for many crops (e.g. rice, maize, andwheat), traits (e.g. resistance to diseases and insects, grain quality, male sterility), and fordiversifying and enhancing gene pools (e.g. adapting temperate germplasm to tropicalenvironments and vice versa).
114

The U.S. Sorghum Conversion Program [8] has used a backcrossing scheme tointroduce genes for short stature and photoperiod insensitivity from temperate, adapted parentto the tropical, unadapted parent. According to that scheme, adapted segregants are selectedon the basis of stature and ability to flower at the temperate latitude. Self-pollinated seed fromsuch segregants is selected and used to backcross to the recurrent, tropical parent in a tropicalenvironment. That backcross generation is self-pollinated in the tropical location and selfedseed is sown in the temperate location to identify segregants of appropriate stature andflowering response. Typically, 4 or more cycles of backcrossing, selfing, and selection areused to convert a tropical parent.
In this instance, DNA markers could be used to eliminate generations of backcrossingand to ensure that the tropical germplasm was indeed transferred. For example, DNAfingerprints of adapted segregants could be determined and used as a selection criteria priorto backcrossing. This should be especially effective for expediting recovery of chromosomeregions from the tropical parent unlinked to the genes needed for adaptation to the temperatelatitudes. For example, Pereira and Lee [3] identified short-statured, adapted F2 plants withRFLP genotypes closely resembling (60-75% similarity over 111 loci) the tall or short parent.By selecting the short plants with the greatest degree of resemblance to the tall parent, thebackcross conversion could be completed in fewer generations. In addition, DNA marker locicould be used to minimize linkage drag from the adapted, donor parent in the vicinity of thegenes affecting adaptation. Through such a scheme, the conservation and conversion of thetropical germ plasm would be optimized. Also, breeders would have the greatest opportunityto identify new and valuable genes from exotic germ plasm.
6. ASSESSING GENETIC DIVERSITY IN SORGHUM BREEDING PROGRAMS
One consequence of modern agricultural practices, which generally emphasizesmaximum productivity with acceptable quality and uniformity, has been a reduction of geneticdiversity of the primary gene pool under cultivation with similar fates for the secondary andtertiary gene pools of most major crops. That trend may be exacerbated in crops such assorghum in which Fl hybrid seed is produced using cytoplasmic male sterility. Even thoughthe extent of the reduction may be largely unquantifiable, it is generally assumed that valuableand irreplaceable genes have been lost or ignored, plant genetic resources have been shrinkingat accelerated rates, and crop-based agriculture has become more vulnerable to the vagariesof climate and associated biotic and abiotic stresses. Undoubtedly there is considerable merit,validity, and controversy associated with each point. Facts and anecdotes aside, theconsequences of a narrow genetic base of major crops have been experienced sporadicallythroughout recent history often with significant human and economic costs. Therefore, anawareness of genetic diversity and management of crop genetic resources has been animportant component of plant improvement programs.
The prospects of utilizing DNA marker technology for managing germ plasmcollections has been the subject of a recent and comprehensive review [9]. How do plantbreeders assess genetic diversity and relationships among elite germ plasm? Many of themethods used by germ-plasm managers have been used by plant breeders (e.g. morphologyand ecogeographical data). In addition, plant breeders often have access to pedigreeinformation, performance records (e.g. combining ability, progeny evaluation, selection andbreeding history), and inferences gleaned from various mating designs. The strength of someof the methods is that they are often based on direct assessments of what the breeder needsto know about the germ plasm. Such methods will be extremely difficult to improve.However, some methods and concepts have relied on weak genetic foundations, if any. For
115
some plant breeding practices, that may constitute a weakness which reduces their efficiency.At least some of these deficiencies may be satisfied in part by DNA markers.
One of the most pervasive measures of genetic relationships in elite crop germ plasmhas been Malecot's coefficient of coancestry (/), which provides an estimate of the degree ofgenetic similarity between two individuals [10]. This measure estimates the probability thattwo randomly drawn, homologous genes (alleles) from each of two individuals are identicalby descent. The measure has been based on Mendelian inheritance and probability and hasbeen calculated under several assumptions: 1) absence of selection, mutation, migration, anddrift; 2) regular diploid meiosis; and 3) no relationship (f= 0) for individuals without verifiedcommon ancestors [10]. Several common features of plant breeding programs haverepresented departures from these assumptions: 1) intense selection, 2) drift due to smallsample sizes, 3) irregular nondiploid meiosis for some crops, and 4) unknown or incorrectpedigree records. Nevertheless, this method of estimating the degree of similarity will createinformation each generation and has been used by crop breeding programs.
DNA markers have been used to assess large collections of elite sorghum germ plasmto determine the degree of genetic relationships and genetic diversity [4]. A set of 58 R lines,mostly from Kafir, and 47 B lines, mostly from Zera-zera or Feterita were surveyed with 104DNA probes. The RFLP data clearly identify two different gene groups of inbred lines (pollenvs. seed parents of Fl hybrids; R and B lines, respectively) and document the high degree ofgenetic similarity among members of certain gene pools (e.g. B lines). On average, 3.6 RFLP-band patterns per probe were observed for R lines whereas only 3 were detected for B lines.Estimates of genetic similarity based on RFLP fingerprints were 0.67 and 0.76 for R and Blines. Cluster analysis of RFLP data further divided R lines into 2 distinct groups representingderivatives from Feterita and Zera-zera.
Similar assessments may be made without DNA markers but the methods requireextensive pedigree records and generations of breeding. This requires generations of carefulrecord keeping and is based on several assumptions mentioned previously. However, therewas only a modest positive correlation between estimates of genetic similarity based on RFLPdata and those based on the coancestry coefficient (r=0.46 and 0.43 for related sets of R andB lines). In this instance, information derived from DNA markers is substituting for theconsiderable time and records needed for traditional analysis of pedigrees and lineages. Also,RFLP data seem to portray genetic relationships more accurately than the methods basedexclusively on the coancestry coefficient.
7. SUMMARY AND CONCLUSIONS
The state of sorghum genetics has changed dramatically within the last five years. In1990, the sorghum genetic map consisted of nine linkage groups with each group containing2-9 loci. Most of the 260 identified genes had not been mapped. Less than six years later,there are several genetic maps of sorghum each with ten well defined linkage groups basedon RFLPs and PCR-based maps are under development. Exchange of DNA clones andmapping information has facilitated map development to the point where the genetic mapcontains at least 1,500 RFLP loci. Mapping resources have also improved with thedevelopment of several populations of recombinant inbred lines (RILs) suitable for mappingfactors controlling resistance to biotic and abiotic stress and other important attributes. TheRILs are usually available to any research group in the world. Thus, a powerful and practicalmeans of collecting and compiling genetic information for sorghum has been established. TheRFLP, QTL and genetic (mutant) maps of sorghum are now being integrated with those of
116

other grasses such as maize and rice. These connections should create many opportunities totransfer information, technology and materials among research groups working with thesespecies. In many regards, in the last five years, there has been more advancement in the basicinfrastructure needed for sorghum improvement than there has been in the previous fiftyyears.
REFERENCES
[1] LEE, M., DNA Markers and plant breeding programs. Adv. Agron. 55 (1995) 265-343.
[2] PEREIRA, M.G., LEE, M., BRAMEL-COX, P., WOODMAN, W., DOEBLEY, J.,WHITKUS, R., Construction of an RFLP map in sorghum and comparative mappingin maize. Genome 37 (1994) 236-243.
[3] PEREIRA, M.G., LEE, M., Identification of genomic regions affecting plant heightin sorghum and maize, Theor. Appl. Genet. 90 (1995) 380-388.
[4] AHNERT, D., AUSTIN, D., LEE, M., LIVINI, C, OPENSHAW, S.J., SMITH, J.S.C., PORTER, K., DALTON, G., Genetic diversity among elite sorghum inbred linesassessed with DNA markers and pedigree information. Crop Sci. 36 (1996) 1385-1392.
[5] DOGGET, H., Sorghum, Longmans, Green & Co, London (1988).[6] TARAMINO, G., TARCHTNI, R., FERRARIO, S., LEE, M., PE, E., Characterization
and mapping of simple sequence repeats (SSRs) in Sorghum bicolor. Theor. Appl.Genet. (1997).
[7] BROWN, S.M., HOPKINS, M.S., MITCHELL, S.E., SENIOR, M.L., WANG, T.Y.,DUNCAN, D.D., GONZALEZ-CANDELAS, F., KRESOVICH, S., Multiple methodsfor the identification of polymorphic simple sequence repeats (SSRs) in sorghum(Sorghum bicolor L. Moench), Theor.Appl.Genet. 93 (1996) 190-198.
[8] DUNCAN, R., BRAMEL-COX, P., MILLER, F.R., Contributions of introducedsorghum germplasm to hybrid development in the USA. In: Use of Plant Introductionsin Cultivar Development-Part 1. (H.L Shands, L.E. Weisner, Eds.), Special Publ. No.17, Crop Sci. Soc. Am., Madison, WI, USA (1991) 69-101.
[9] BRETTING, P.K., WIDRLECHNER, M.P., Genetic markers and plant geneticresource management, Plant Breeding Revs. 13 (1995) 11-86.
[10] MELCHTNGER, A.E., Use of RFLP markers for analysis of genetic relationshipsamong breeding materials and prediction of hybrid performance, (Proc. Int. Crop Sci.Symp. Ames, IA, USA, 1992), (BUXTON, D.R., SHIBLES, R., FORSBERG, R.A.,BLAD, B.L., ASAY, K.H., PAULSEN, G.M., WILSON, R.F., Eds), Crop Sci. Soc.Am., Madison, WI, USA (1993) 621-628.
NEXT PAGE(S)left BLANK
COMPARATIVE GENOME ANALYSIS AND RESISTANCE 847004GENE MAPPING IN GRAIN LEGUMES
N.D. YOUNGDepartment of Plant Pathology,University of Minnesota,St. Paul, Minnesota, United States of America
Abstract
Using DNA markers and genome organization, several important disease resistance genes have beenanalyzed in mungbean (Vigna radiata), cowpea (Vigna unguiculata), common bean (Phaseolus vulgans), andsoybean (Glycine max) In the process, medium-density linkage maps consisting of restriction fragment lengthpolymorphism (RFLP) markers were constructed for both mungbean and cowpea Comparisons between thesemaps, as well as the maps of soybean and common bean, indicate that there is significant conservation of DNAmarker order, though the conserved blocks in soybean are much shorter than in the others DNA mapping resultsalso indicate that a gene for seed weight may be conserved between mungbean and cowpea Using the linkagemaps, genes that control bruchid (genus Callosobruchus) and powdery mildew (Erysiphe polygom) resistancein mungbean, aphid resistance in cowpea (Aphis cracavoru), and cyst nematode (Hetemderaglycmes) resistancein soybean have all been mapped and characterized. For some of these traits resistance was found to beohgogenic and DNA mapping uncovered multiple genes involved in the phenotype
1. INTRODUCTION
DNA marker technology has profoundly transformed plant genetics and breeding.Using DNA markers, highly saturated linkage maps of important crop species can be quicklyconstructed and used to characterize genome organization, locate genes of interest, and carryout marker-assisted selection for traits of economic importance. Two areas that have beenespecially fruitful are comparisons between the genomes of related, but sexually incompatibletaxa, and the mapping of genes that underlie disease resistance phenotypes. Significantly,DNA markers can be used to identify and characterize genes involved in both monogenic andpolygenic traits. This has been especially useful in the analysis of quantitative diseaseresistance characters in plants.
2. RESULTS AND DISCUSSION
2.1. Construction of DNA marker maps for mungbean and cowpea
A genetic linkage map of mungbean consisting of 172 markers including 151 randomgenomic DNA and 20 cDNA RFLP loci and one pest (Callosobruchus) resistance locus wasconstructed [1]. All but six markers were assigned to 11 coherent linkage groups, plus threesmall groups with four markers or less. The linked loci covered 1570 centiMorgans (cM) withan average distance of 9 cM. A majority of the mapped loci (121 out of 171) correspondedto single- and low-copy sequences as previously defined. Markers detecting more than onelocus, exhibiting aberrant ratios and dominant/null phenotypes were detected as well in thecurrent map. Although the number of linkage groups in the present map does not coincide yetwith the 11 known chromosomes of mungbean, the overall appearance of the 11 coherentlinkage groups in the map corresponds closely to the karyotype description reportedpreviously.
A genetic linkage map for cowpea was constructed using 58 plants from an F2population derived from a cross between an elite cowpea line (IT2246-2) and a non-cultivatedwild relative (TVn 1963) [2]. These two lines share the same primary gene pool, although the
119

Fl hybrid between them showed partial pollen fertility. Between these two genotypes,restriction fragment length polymorphisms (RFLPs) were detected by about 22% of thegenomic clones from various sources. Seed coat texture and pod shattering were also scoredon the F2 plants. Eighty three loci (comprising 79 genomic, 5 RAPDs, 4 cDNA and1 morphological trait) were distributed on 10 linkage groups which span 680 cM.
2.2. Comparative genome analysis between mungbean and cowpea
Genome relationships between mungbean and cowpea based on the linkagearrangement of RFLP markers were investigated [3]. A common set of probes derived fromcowpea, common bean (P. vulgaris), mungbean, and soybean (G. max} Pst I genomic librarieswere used to construct the genetic linkage maps. In both species, a single F2 population froma cross between an improved cultivar and a putative wild progenitor species was used tofollow the segregation of the RFLP markers. Approximately 90% of the probes hybridizedto both mungbean and cowpea DNA, indicating a high degree of similarity in the nucleotidesequences among these species. A higher level of polymorphism was detected in themungbean population compared to the cowpea population. Loci exhibiting duplications, nullphenotypes and distorted segregation ratios were detected in both populations. The mungbeanand cowpea genomes were compared based on the copy number and linkage arrangement of53 markers mapped in common between the two species. Results indicate that nucleotidesequences are conserved, but variation in copy number were detected and somerearrangements in linkage order appeared to have occurred since the divergence of the twospecies. Entire linkage groups were not conserved but several large linkage blocks weremaintained in both genomes.
2.3. Comparative genome mapping among grain legumes
A set of 219 DNA clones derived from mungbean, cowpea, common bean, andsoybean was used to generate comparative linkage maps among mungbean, common bean,and soybean [4]. The maps allowed an assessment of linkage conservation and colinearityamong the three genomes. Mungbean and common bean, both of the subtribe Phaseolinae,exhibited a high degree of linkage conservation and preservation of marker order. Mostlinkage groups of mungbean consisted of only one or two linkage blocks from common bean(and vice versa). The situation was significantly different with soybean, a member of thesubtribe, Glycininae. Mungbean and common bean linkage groups were generally mosaics ofshort soybean linkage blocks, each only a few centiMorgans in length. These results suggestthat it would be fruitful to join maps of mungbean and common bean, while knowledge ofconserved genomic blocks would be useful in increasing marker density in specific genomicregions for all three genera. These comparative maps may also contribute to enhancedunderstanding of legume evolution.
2.4. Orthologous seed weight genes in cowpea and mungbean
Using genetic maps of mungbean and cowpea, we located major quantitative trait loci(QTL) for seed weight in both species [5]. Two unlinked genomic regions in cowpeacontained QTLs for seed weight accounting for 52.7% of the variation for seed weight. Inmungbean there were four unlinked genomic regions accounting for 49.7% of the variation.In both cowpea and mungbean the genomic region with the greatest effect on seed weightspanned the same RFLP markers in the same linkage order. This suggests that the QTL in this
120

genomic region have remained conserved through evolution. This inference is supported bythe observation that a significant interaction (i.e. epistasis) was detected between the QTL inthe conserved region and the same unlinked RFLP marker locus in both species.
2.5. Bruchid resistance in mungbean
Bruchids (genus Cdlosobruchus) are among the most destructive insect pests ofmungbeans and other members of the genus,Vigna Genetic resistance to bruchids waspreviously identified in a wild mungbean relative, TC1966. To analyze the underlyinggenetics, accelerate breeding, and provide a basis for map-based cloning of this gene, wemapped the TC1966 bruchid resistance gene using restriction fragment length polymorphism(RFLP) markers [6J. Fifty-eight F2 progeny from a cross between TC1966 and a susceptiblemungbean cultivar were analyzed with 153 RFLP markers. Resistance mapped to a singlelocus on linkage group VIII, approximately 3.6 centiMorgans from the nearest RFLP marker.Because the genome of mungbean is relatively small (estimated to be between 470 and 560million base pairs), this RFLP marker may be suitable as a starting point for chromosomewalking.
2.6. Powdery mildew resistance in mungbean
We used RFLPs to map genes in mungbean that confer oligogenic resistance to thepowdery mildew fungus, Erysiphe polygoni [7]. DNA genotypes for 172 RFLPs spanning1570 centiMorgans of the mungbean genome were assayed in a population of 58 F2 plants.This population was derived from a cross between a moderately powdery mildew resistant(VC3890A) and a susceptible (TC1966) mungbean parent. F3 lines derived from these F2plants were then assayed in the field for powdery mildew response and the results werecompared to the RFLP genotype data, thereby identifying loci associated with powderymildew response. Three genomic regions were found to have an effect on powdery mildewresponse, together explaining 58% of the total variation. At 65 days after planting, twogenomic regions on linkage groups 3 and 7 were significantly associated with powderymildew resistance. In both cases, the allele from VC3890A was associated with increasedresistance. At 85 days, a third genomic region on linkage group 8 was also associated withpowdery mildew response. In this case, the allele from the susceptible parent (TC1966) wasthe one associated with higher levels of powdery mildew resistance.
2.7. Aphid resistance in cowpea
A cross between an aphid (Aphis craccivord) resistant, cultivated cowpea, IT84S-2246-4, and an aphid susceptible wild cowpea, NI 963, was screened for both aphid phenotype andRFLP marker segregation [8]. One RFLP marker, bg4D9b, was found to be tightly linked tothe aphid resistance gene (Pad) and several flanking markers in the same linkage group(linkage group 1) were also identified. The close association of Roci and RFLP bg4D9bpresents a potential for positional cloning of this insect resistance gene.
2.8. Cyst nematode resistance in soybean
Several sources of soybean cyst nematode (Heterodem glycines; SCN) resistance havebeen identified in soybean. This study was conducted to identify quantitative trait loci thatcontrol disease response in three commonly used sources of SCN resistance [9]. Using geneticmarkers, we analyzed three segregating soybean F2 populations ['Evans' X 'Peking', Evans XPlant Introduction (PI) 90763, and Evans X PI 88788] and compared the results with those
121

of a previous study involving PI 209332 [10, 11]. In each case, multiple races of thenematode were tested. To uncover putative resistance loci, F2 DNA marker genotypes atbetween 63 and 99 loci in each population were contrasted with cyst indices averaged from12 F2:3 progeny individuals. Four independent partial SCN resistance loci were uncoveredat P < 0.0002 (probability per locus). One of these loci, located at the top of linkage group'G' near RFLP locus C006V, was significant at P < 0.0001 in all populations and races tested.Other significant loci included one near RFLP A378H at the opposite end of linkage group'G' from C006V, another on linkage group T near marker B032V-1, and a fourth on linkagegroup 'N' near marker A280Hae-l. Comparisons between different SCN races indicated thatsome of the putative resistance loci behave in a race-specific manner. These results may serveas a resource for SCN researchers and soybean breeders by summarizing a wide range ofgenetic data on the soybean-SCN interaction.
ACKNOWLEDGEMENTS
The author gratefully acknowledges collaboration in the research described in thispaper with: D. Menancio-Hautea, University of the Philippines, Los Banos, Philippines, andC. Fatokun, International Institute of Tropical Agriculture, Lagos, Nigeria (Sections 2.1, 2.2and 2.4); S. Boutin, University of Minnesota, St. Paul, MN, USA, R. Shoemaker, USDA-ARS, Iowa State University, Ames, IA, USA, and E. Vallejos, University of Florida,Gainesville, FL, USA (Section 2.3); Doo-Hwan Kim, Asian Vegetable Research andDevelopment Center, Shanhua, Taiwan (Section 2.5); D. Danesh, University of Minnesota,St. Paul, MN, USA (Section 2.6); G. Myers, Louisiana State University, Baton Rouge, LA,USA, and C. Fatokun, International Institute of Tropical Agriculture, Lagos, Nigeria (Section2.7); V. Concibido, University of Minnesota, St. Paul, MN, USA, and J. Orf, University ofMinnesota, St. Paul, MN, USA (Section 2.8).
This research was also assisted by technical support of: R. Denny, L. Kumar, D.Lange, T. Olson, N. Talekar, Z.-H. Yu, and S. Shanmugasundarum. The research wassupported by grants from the International Atomic Energy Agency, the RockefellerFoundation, the Minnesota Soybean Research and Promotion Council and the MinnesotaAgricultural Experiment Station.
REFERENCES
[ 1 ] MENANCIO-HAUTEA, D., KUMAR, L., DANESH, D., YOUNG, N., RFLP linkagemap for mungbean (Vigna radiataL. Wilczek), in: Genetic Maps, 1992. S.J. O'Brien,ed. Cold Spring Harbor Press, Cold Spring Harbor, NY (1993) pp. 6.259-6.260.
[2] FATOKUN, C., DANESH, D., YOUNG, N., RFLP linkage map for cowpea (Vignaunguiculata L. Walp.), in: Genetic Maps, 1992. S.J. O'Brien, ed. Cold Spring HarborPress, Cold Spring Harbor, NY, pp. (1993) 6.256-6.258.
[3] MENANCIO-HAUTEA, D., FATOKUN, C., KUMAR, L., DANESH, D., YOUNG,N., Comparative genome analysis of mungbean (Vigna radiata L. Wilczek) andcowpea (V. unguiculata L. Walpers) using RFLP mapping data, Theor. Appl. Genet.86 (1993) 797-810.
[4] BOUTIN, S., YOUNG, N., OLSON, T., YU, Z.-H., SHOEMAKER, R., VALLEJOS,C., Genome conservation among three legume genera detected with DNA markers,Genome 38 (1995) 928-937.
122

[5] FATOKUN, C., MENANCIO-HAUTEA, D., DANESH, D., YOUNG, N., Evidencefor orthologous seed weight genes in cowpea and mungbean based on RFLPs,Genetics 132 (1992) 841-846.
[6] YOUNG, N., KUMAR, L., MENANCIO-HAUTEA, D., DANESH, D., TALEKAR,N., SHANMUGASUNDARUM, S., KIM, D., RFLP mapping of a major bruchidresistance gene in mungbean (Vigna radiata, L. Wilczek), Theor. Appl. Genet. 84(1992) 839-844.
[7] YOUNG, N., DANESH, D., MENANCIO-HAUTEA, D., KUMAR, L., Mappingoligogenic resistance to powdery mildew in mungbean with RFLPs., Theor. Appl.Genet. 87 (1993) 243-249.
[8] MYERS, G., FATOKUN, C., YOUNG, N., RFLP mapping of an aphid resistance genein cowpea (Vigna unguiculataL. Walp.), Euphytica 91 (1996) 181-187.
[9] CONCIBIDO, V.C., LANGE, D.A., DENNY, R.L., ORF, J.H., YOUNG, N.D.,Genome mapping of soybean cyst nematode resistance loci in 'Peking', PI 90763, andPI 88788 using DNA markers. Crop Sci. 37 (1997) 258-264.
[10] CONCIBIDO, V.C., DENNY, R.L., LANGE, D.A., ORF, J.H., YOUNG, N.D., RFLPmapping and marker-assisted selection of soybean cyst nematode resistance in PI209332, Crop Sci. 36 (1996) 1643-1650.
[11] CONCIBIDO, V., YOUNG, N., LANGE, D., DENNY, R., DANESH, D., ORF, J.,Targeted comparative genome analysis and qualitative mapping of a major partialresistance gene to soybean cyst nematode, Theor. Appl. Genet. 93 (1996) 234-241.
NEXT PAGE(S)left BLANK
123
LIST OF PARTICIPANTS
Atanassov, A.
Chen, Sh.
Davis, G.
Eun, M.Y.
Farooq, S.
Lee, M.
Prins, R.
Simpson, J.
Stephenson, P.
Week, E.(Scientific Secretary)
Young, N.D.
Zhuang, J.Y.
Institute of Genetic Engineering,2232 Kostinbrod 2, Bulgaria
Institute of Genetics, Academia Sinica,Datum Road, Beijing 100101, China
USDA-ARS, Corn Host Plant Resistance Research Unit,Mississippi State University, MS, USA
National Institute of Agricultural Science and Technology, RDA,Suwon, 441-707, Republic of Korea
Nuclear Institute for Agriculture and Biology (NIAB)Jhang Road, Faisalabad, Pakistan
Department of Agronomy,Iowa State University, Ames, IA, USA
Agricultural Research Council (Small Grain Institute),P/a Department of Genetics, University of Stellenbosch,7600 Stellenbosch, South Africa
Centre de Investigaciones y Estudios Avanzados (CINVESTAV),Irapuato, Mexico
John Innes Centre, Norwich Research Park,Norwich, NR4 7UH, United Kingdom
Plant Breeding and Genetics Section,Joint FAO/IAEA Division,International Atomic Energy Agency,P.O. Box 100,A-1400 Vienna, Austria
Department of Plant Pathology, University of Minnesota,St. Paul, MN 55108, USA
Department of Biotechnology, China National Rice Research Institute,Hangzhou, 310006, China
125