Application of data clustering to railway delay pattern...
45
General rights Copyright and moral rights for the publications made accessible in the public portal are retained by the authors and/or other copyright owners and it is a condition of accessing publications that users recognise and abide by the legal requirements associated with these rights. Users may download and print one copy of any publication from the public portal for the purpose of private study or research. You may not further distribute the material or use it for any profit-making activity or commercial gain You may freely distribute the URL identifying the publication in the public portal If you believe that this document breaches copyright please contact us providing details, and we will remove access to the work immediately and investigate your claim. Downloaded from orbit.dtu.dk on: Feb 04, 2019 Application of data clustering to railway delay pattern recognition Cerreto, Fabrizio; Nielsen, Bo Friis; Nielsen, Otto Anker; Harrod, Steven Published in: Journal of Advanced Transportation Link to article, DOI: 10.1155/2018/6164534 Publication date: 2018 Document Version Peer reviewed version Link back to DTU Orbit Citation (APA): Cerreto, F., Nielsen, B. F., Nielsen, O. A., & Harrod, S. (2018). Application of data clustering to railway delay pattern recognition. Journal of Advanced Transportation, 2018, [6164534]. DOI: 10.1155/2018/6164534
Transcript of Application of data clustering to railway delay pattern...

General rights Copyright and moral rights for the publications made accessible in the public portal are retained by the authors and/or other copyright owners and it is a condition of accessing publications that users recognise and abide by the legal requirements associated with these rights.
Users may download and print one copy of any publication from the public portal for the purpose of private study or research.
You may not further distribute the material or use it for any profit-making activity or commercial gain
You may freely distribute the URL identifying the publication in the public portal If you believe that this document breaches copyright please contact us providing details, and we will remove access to the work immediately and investigate your claim.
Downloaded from orbit.dtu.dk on: Feb 04, 2019
Application of data clustering to railway delay pattern recognition
Cerreto, Fabrizio; Nielsen, Bo Friis; Nielsen, Otto Anker; Harrod, Steven
Published in:Journal of Advanced Transportation
Link to article, DOI:10.1155/2018/6164534
Publication date:2018
Document VersionPeer reviewed version
Link back to DTU Orbit
Citation (APA):Cerreto, F., Nielsen, B. F., Nielsen, O. A., & Harrod, S. (2018). Application of data clustering to railway delaypattern recognition. Journal of Advanced Transportation, 2018, [6164534]. DOI: 10.1155/2018/6164534

1
Fabrizio Cerretoa*, Bo Friis Nielsenb, Otto Anker Nielsena, Steven S. Harroda.
aDepartment of Management Engineering, Technical University of Denmark, 2800 Kgs. Lyngby, Denmark
bDepartment of Applied Mathematics and Computer Science, Technical University of Denmark, 2800 Kgs.
Lyngby, Denmark
* Corresponding author: [email protected]
The authors declare that there is no conflict of interest regarding the publication of this paper.
Application of data clustering to railway delay
pattern recognition

2
ABSTRACT
K-means clustering is employed to identify recurrent delay patterns on a high traffic railway line
north of Copenhagen, Denmark. The clusters identify behavioral patterns in the very large (“big data”) data
sets generated automatically and continuously by the railway signal system. The results reveal where
corrective actions are necessary, showing where recurrent delay patterns take place. Delay profiles and
delay-change profiles are generated from timestamps to compare different train runs, and to partition the
set of observations into groups of similar elements. K-means clustering can identify and discriminate
different patterns affecting the same stations, which is otherwise difficult in previous approaches based on
visual inspection. Classical methods of univariate analysis do not reveal these patterns. The demonstrated
methodology is scalable and can be applied to any system of transport.
Keywords
Railway Delay; Big Data; K-means clustering; Historical data mining

3
1 INTRODUCTION
Operations analysis is the collection and review of performance data, such as punctuality and
process cycle time. It is a key step in the continuous improvement of transport services, and several methods
exist to collect and analyze data from operations. The increasing availability of automated data sources is
offering new ways to analyze operations, providing deeper insight and more reliable information. Railway
management is very accepting of these new possibilities, and considerable effort is made by operators and
institutions to use operations analysis in feedback loops for improving the timetabling process [1–4]. A
better understanding of the development of delays in railways, and in transportation in general, provides
the opportunity to improve the processes and identify the factors affecting reliability. For example, causes
of delays might be identified in misallocation of supplements and buffers in timetables, structural conflicts
that require mitigation actions, suboptimal design of station processes, and inefficient procedures for
preparing a train for departure. This paper demonstrates a data-mining technique based on k-means
clustering to identify recurrent delay patterns in transportation, identify the main reason for cluster
membership, and provide managerial insight to improve timetables and processes.
Prior studies propose several methods that are currently in use for operation analysis, deploying
sources of automatic data collection. These approaches can be divided into traditional statistical methods
and big data techniques, which differ in both the use of data and in the output provided. Traditional methods
tend to aggregate and summarize information, so these can provide a general picture or detailed information
on specific stations or trains. These are typically proposed in the form of multiple univariate distribution
analysis, where the occurrence of different delay patterns at the same station is not visible. Big data
techniques can be used to investigate recurring patterns, or internal structures in operations. These
approaches are expanding, thanks to the growing availability of large amounts of data, and several
techniques have been deployed to identify recurrences of delays and describe or predict delays. Advanced
techniques such as neural networks, succession rules, Bayesian networks, and various methods of
regression, have been developed mainly to predict delays real-time in railways, as described in §2.

4
However, train delays are necessarily correlated over the progression of a complete journey, and these data
relations both along the journey of a train and among adjacent train paths have not received as much
attention in the literature.
This paper presents a big-data technique to identify recurring delay patterns in railway operations.
Big data refer to information assets characterized by high volume, velocity and variety, which value is
extrapolated by analytical methods [5]. In this application, the absolute delay and delay change are tracked
for individual train paths along a railway line, resulting in absolute delay and delay change profiles. In the
papers based on univariate statistics, systematic delays in these profiles are identified through visual
inspection. The manual search for similarities suffers from subjective interpretation from the operator, and
is easily biased by common artefacts of the representation. The technique presented in this paper applies k-
means clustering to find recurrent patterns in train delay progression, so that management may identify
processes for improvement or correction. In this way it is possible to support continuous quality
improvement.
In the next section, §2, a literature survey of contemporary data analysis methods is offered. §3
presents the k-means cluster method and the structure of the data to be studied. §4 presents results from the
study of a high density Danish railway line. The effectiveness of k-means clustering for this application is
discussed in §5, with particular regards of its novelty compared to existing literature, while conclusions of
this paper are presented in §6.
2 LITERATURE SURVEY
Operations analysis is fundamental in the continuous improvement process to manage and modify
railway operations. Data collected from real operations, or from simulation models, has been used in the
feedback loop to design and improve railway timetables for decades. Typically, even if timetables may
change over time, some of the fundamental infrastructure and service behaviors will not be modified.
Timetables are often the result of only minor modifications to the previous editions and need to consider
5
problems discovered in earlier timetables. For example, after a structural change in the Danish railway
timetable in 1998, after the opening of the Great Belt fixed link, the service structure remained largely
unchanged until 2016 [6].
Data collection systems have proliferated in railway networks since 2000, and very large amounts
of data are available today. Widespread systems to collect data increased both volume and variety of data,
which are often collected by different systems at the same time. The methods to elaborate and interpret
information from past operations evolved together with the amount and quality of data, starting from
descriptive and inferential statistic and moving towards big-data techniques. For example, delay probability
density functions can be extrapolated from historical data, and integrated in analytical models to estimate
service reliability before operation [7]. Goverde et al. [8] performs extensive statistical analysis and
distribution fitting of data from the Dutch railway network. Goverde et al. fits different distributions for
arrival and departure delays and finds that no general distribution fits all groups of recorded arrival delays.
Primary delay distributions derived from operational data are also often employed as input in
simulation models to evaluate the propagation of delays. Sipilä [9] explores the effect of modified running
time supplements in railway schedules through microsimulation of a Swedish railway line. The author
identifies different strategies for running time supplement allocation by verifying the significance of the
change in punctuality recorded in 1600 simulations of selected scenarios. Olov Lindfeldt [10] describes a
method to aggregate delay data from real records and isolate distributions of primary delays. These
distributions are then used to formulate microsimulation models. The data consists of manual records from
dispatchers, who assign a delay cause code to every record greater than 4 minutes of delay on the Swedish
railways. In absence of other sources of data, the reliability of manual record cannot be validated, although
the whole simulation model and its results rely on the derived distributions. Studies from other countries
show that manual input can be indeed unreliable [11,12]. The same method to extract primary delay
distributions is later used by Anders Lindfeldt and Sipilä [13] in a simulation model to assess the effect of
allowing freight trains to travel outside their assigned path. The authors demonstrate that the realized travel

6
times of freight trains could be shortened considerably without affecting the performance of other trains.
The reduction of unnecessary waits for traffic management, and the permission to depart before schedule
reduces the average travel time on one side, but increases its variability on the other.
Historical data also provides insight on the factors that influence service reliability. Olsson and
Haugland [14] apply regression analysis on the Norwegian railway network and identify the most relevant
factors for punctuality, such as absolute passenger flow and passenger occupation ratio. Gorman [15] uses
regression analysis on data from American single-tracked freight railways to identify the factors that
contribute the most in prolongation of railway running times. Gorman predicts congestion delay based on
meets and passes scheduled as a consequence of speed heterogeneity. Again in simulation, Shih et al. [16]
applies an approach similar to Gorman’s to determine the best capacity expansion strategy in terms of
reduction of average prolongation of running time for freight trains. Shih et al. identifies functional
relationships, through regression of simulation results, between average delay per train-mile and several
factors, such as the relative length of the doubled-tracked section of a railway line. Anders Lindfeldt [17]
applies multilinear regression with special focus on F-statistics to investigate factors generating delays on
the Swedish railway network. Lindfeldt measures delay changes over selected routes and analyzes their
distributions. In particular, the response variables are the share of trains with a delay increase, the median
change in delay, and its standard deviation on the route. Statistically significant explanatory variables are
found in the traffic volume for both passenger and freight trains. Among passenger trains the most
significant variables are average speed and traffic heterogeneity, and for freight trains it is the number of
stations on the route with at least three tracks.
Time stamps and recorded deviations from schedule can be integrated with information from other
sources. For example, incident reports may be compiled in case of larger disruptions. Such reports include
information about the typology of the incident, the train affected by the primary delay, other trains involved,
the secondary delays generated, and the recovery plans taken by the dispatchers. Schittenhelm and Richter
[1] describes the reporting system in the Danish railways (the same system in service at the time of this

7
study), and introduces a quantile-based approach to depict the development of train delays en-route. The
plots confirm the general understanding of delays from experienced operators and can be used to quantify
the magnitude of expected disruption. The quantile-based approach, though, describes operations as a
whole, and it is not able to distinguish systematic delays occurring at individual stations, but with different
origins, so analysis of individual train services is necessary to identify peculiar delay patterns. Richter [18]
introduces new metrics to identify improvement actions, based on data from automatic detection systems.
Richter sorts the trains according to recorded delay and identifies the worst in a percentile approach,
associated with recorded delay causes. A similar approach is adopted with regards to change in deviation,
or delay jump, recorded on line sections, so that most critical geographical areas are identified. Lastly,
Richter proposes a tabular representation of the median delay of individual trains recorded at station, sorted
by scheduled time and geographical location. In this way, the analyst can identify which specific trains
typically suffer from primary delays, also characterized by geographical location, and which are the trains
typically affected.
Similarly, Peterson [4] studies the on-time performance along the path of specific train services,
using the rolling average delay of the last three timing points. Such on-time performance is plotted for all
the repetitions of a specific train service over a time period, and compared to the average, standard
deviation, and 75th percentile. Peterson identifies empty areas in the pool of plotted delay profiles, and
interprets these as recurrent delay patterns given by discrete dispatching choices along the train path.
Peterson also interprets recurrent increases or decreases of vehicle delay as segments of insufficient or
excess running time supplement, respectively. Reliability of service is described by the standard deviation
of recorded delays. Peterson used the mentioned measures in a feedback loop to redistribute the running
time supplement in train paths according to the recorded performance.
Andersson et al. [19] assesses the effectiveness of running time supplement in railway schedules
from empirical data collected on a Swedish railway line. The study plots the recorded delays over the train
itinerary overlapped with scheduled running time supplement, and compares pairwise the stacked plots

8
from different railway services, stopping patterns or directions. The identification of misallocation of
running time supplement is based on visual search for recurrent delay patterns, and a few different
dispatching tactics are identified in clusters of similar delay profiles. Andersson et al. highlights the
existence of a threshold value of delay that triggers prioritization of other trains that are traveling on
schedule. The observations are clustered in groups and show recurrent delay patterns, and the analysis is
supported by detailed analysis of possible conflicts among individual train itineraries. Noticeably, the
authors demonstrate that the measures of punctuality currently in use on the Swedish network hide the
effects of running time supplement misallocation and delays developed en-route. Even though the
punctuality at the final destination is a measure of railway performance very common among railway
operators, it does not express how trains increase or recover from delays along their journey. Schittenhelm
[20] provides a sample of similar measuring approaches in the European railway industry. In a later study,
Andersson et al. [21] underlines the relevance of critical points for network robustness by plotting delay
profiles, and showing that the profiles cluster around critical points according to different dispatching
strategies. Advanced clustering techniques may support the identification of different strategies to compute
the effects on robustness.
Lastly, van Oort et al. [22] evaluates data collected automatically on public transport services with
a combination of statistical methods and visual representation. The study represents delay data similarly to
Peterson [4], Andersson [19,21], and Schittenhelm [1], plotting the recorded delay over individual
repetitions of the same service path, and adds the plot of relevant delay percentiles over the stations. The
shape of the percentile-based delay profiles highlights recurrent patterns in the deviation from schedule.
The representative delay profiles appear different depending on the percentile they represent. Patterns found
included the presence of typical early arrival at stations in bus services, followed by waiting time until the
scheduled departure time, or recurrent delay drops or increases at specific stations. The delay plots are
combined with the measured headway from the previous vehicle. While the delay plots would suggest
allocating more running time supplements at systematic increases of delay, structural delays that cannot be

9
compensated by timetable slack are highlighted in the plots of headways, were service unreliability
corresponds to scattered recorded headways. A percentile approach was also presented by van Oort et al.
to characterize and sort the stations according to performance, similarly to previous literature.
The statistical analyses presented above are suitable for general description of the system
performance, but lack specific insight on recurrent delay patterns that occur in operation, and on the
relationships between delays at different locations. The literature presented in this survey focuses on the
univariate analysis of selected measures, such as delays at single stations. Traditional metrics common in
the railway industry, such as punctuality, have also been found unrepresentative of the actual service
reliability. The methods that include the multidimensional aspect of the problem mostly deal with delay
profiles, the sequences of delays recorded on individual train itineraries. The quality of these analyses often
relies on visual inspection of plotted data, and the observer-operated search for matching delay profiles.
This search lacks a standardized methodology, and is influenced by the plotting layout and the subjective
interpretation, which is based on personal experience.
Big data techniques have arisen recently, and seek to make use of the very large amount of
information that is provided by automatic data collection systems, overcoming the mentioned issues of
traditional methods. The term big data is rather broad and includes different techniques that serve specific
purpose. The common characteristics of these techniques are Volume, Velocity and Variety, meaning large
amounts of data, generated at high speed, possibly by different sources with different or no structure [5].
As opposed to standard statistical analyses, where hypotheses are formulated and tested, big data techniques
search for internal structures directly in the data. Data generated by automatic sources typically fit into the
big-data criteria. In railways, several data mining techniques were developed in the last years, following
different approaches and searching for different types of information. The interest in these techniques is
rising, together with the increasing availability of structured data. Industrial applications of these techniques
are spreading, and new approaches are being studied also among public institutions [2].

10
Event mining is a technique based on time sorted logs, where relations between different events are
found based on their coincidences. Hansen et al. [23] combines an event mining tool and standard statistics
to predict the actual running times of trains to the next station, given all the recorded current delays.
Dependencies between pairs of events are found or “mined” in timed event graphs created from the time
stamps of individual trains, which correspond to events of occupation and release of blocking sections. The
process times between events are inspected by standard statistics, resulting in conditional probabilities of
process times, given the recorded delays of all relevant trains in the system. Such a model, though, relies
considerably on very detailed knowledge about the infrastructure and requires data which is not commonly
available from railway infrastructure managers.
Goverde and Meng [11] uses the same information source and similar technique to identify and
analyze route conflicts and identify delay chains. Infrastructure data and operation data are integrated so
that it is possible to identify a train that is occupying a blocking section linked to a signal at danger for
another train. Delay trees are built and traced backwards to identify the primary causes, so individual delays
can be classified automatically into primary and secondary, and the correct attribution of delay causes can
be verified. Interestingly, the authors verify that more than half of the delay cause records were assigned
wrongly by the dispatchers, stating that, in the Netherlands, this type of manual input is not reliable and
objective enough to be deployed in data analysis.
Kecman and Goverde [24] extends the model to include non-logged line sections, where it is not
possible to distinguish delays due to signaling impositions and delays due to primary causes. Delay chains
are also traced in less detailed data by Sørensen et al. [12]. Based on the time sequences at stations
experiencing disturbed operations, the authors identify the trains generating the conflicts and the trains
suffering from the conflicts. The analysis is used to identify primary delays, describe single days of
operation, identify frequent trains originating, or subject to, delay chains, and identify point stations where
most of the primary or secondary delays are generated. In a comparison with manually recorded delay
causes, the study finds relevant inconsistencies with the primary delays traced in the delay chains, in

11
accordance with Goverde and Meng [11]. The method described, though, is only valid for single track lines,
and does not identify multiple primary delays.
Cule et al. [25] introduces association rules to identify delays recurring often together, and sets up
an episode mining framework to highlight frequent delay patterns from train timestamps at stations.
However, association rules can highlight common recurrences, but cannot explain relations of causality
between two events, so primary and secondary delays cannot be distinguished. Similarly, Wallander and
Mäkitalo [26] identifies delay chains according to the manual delay cause records from the dispatchers, and
based on timestamps at stations with granularity of 1 minute. The succession rules used are very similar to
association rules, but consider the time dependencies, so that events taking place earlier can be assumed to
be the cause of events happening later under the same circumstances. Trains are characterized by the
number and magnitude of conflicts they generate so that improvement actions can be concentrated.
Association rules have also been adopted to evaluate the effectiveness of delay prevention actions on
Japanese suburban networks by Yabuki et al. [27]. Yabuki et al. compares the association among occurrence
of delays of different trains, change in delays, extension of running and dwelling times and realized
headway in before/after scenario comparison. The downside of such models is that association rules can be
set between binary variables, so the development of delays depicted does not include its magnitude. Further,
the number of associations to be analyzed grows exponentially with the number of potential pairs of events,
so the analyses must be limited to short time frames of operation.
Neural networks are a big-data method that learns from historical records and uses the relations
identified among variables to predict an output, given unseen values of the input variables. This technique
is particularly suited to delay prediction and has been deployed in multiple studies. Neural networks look
for dependencies in the data, as opposed to simulation models, which are based on interaction rules between
objects defined initially. Malavasi and Ricci [28] uses neural networks to predict the total experienced delay
on a railway line, given its geometrical and technological characteristics, and its scheduled utilization over
time. In comparison to simulation, Malavasi and Ricci find neural networks more robust against extreme-

12
valued input, which implicates more likely case-overfitting with simulation. Kecman et al. [29] proposes a
Bayesian network delay prediction model. In this case, input includes the timetable and recorded delays at
all stations. Each delay is assumed to depend only on direct connections in a timed event graph, meaning
the recorded delay for the same train at a previous station, and for the previous train at the same station.
Conditional delay distributions are assumed Gaussian, and the parameters are derived through recursive
Generalized Linear Models. Chapuis [30] deploys the same assumed delay dependency in a neural network
model, where input includes delay of the previous train and at the previous station, and distance to the next
station. Such a model can predict the delay of a train at the next station. Independent of the actual
infrastructure, this model is generic and can be applied at any station of the railway network. The downside
of neural networks, though, is the risk of data overfitting, reducing the prediction capability, although this
risk is lower in neural networks than in simulation models.
In respone, Marković et al. [31] introduces Support Vector Regression (SVR) to establish a
functional relationship between characteristics of the railway system and train delays. Train category,
scheduled time, infrastructure, and share of journey completed are identified as most influencing factors to
predict the train delay at one station. The authors show that SVR generalizes better than an artificial neural
network, which seeks to minimize error of prediction in the historical dataset. Interestingly, the authors
assume that the performance of delay prediction can be improved by grouping delays by magnitude, as
factors generating smaller delays differ from factors that generate larger disturbances.
Kecman and Goverde [32] applies big data techniques to predict running and dwelling times from
actual operation data, based on records from block sections occupations. The study uses random forests of
tree-based models, to predict non-linear relations between input variables and process times, with sufficient
robustness to outliers in the data, lowered risk of overfitting, and with focus on real time application.
Running time predictors are calculated for every block section, and dwelling time predictors are calculated
for every station platform. Among the interesting findings, the running times are longer if the headway to
the preceding train is short, meaning that the succeeding trains tend to slow down to smoothen the trip and
13
reduce the risk of encountering a yellow signal. Moreover, the authors find no evidence to support the
hypothesis that trains run faster when delayed. All the trains were found to run at approximately the
maximum performance in any condition. The authors suggest that, in case of insufficient prediction
accuracy, new variables might be included in the model, such as platform shape for dwelling times.
Big data techniques focus mainly in the prediction of delays and running times, or in the
identification of delay chains and realized delay propagation among trains. New applications of these
techniques would support the analysis of the realized development of delays along the path of individual
train delays. As shown by statistical analysis and visual search for patterns presented by Schittenhelm and
Richter [1,18], Peterson [4], Andersson et al. [19,21] and van Oort et al. [22], this type of data contains a
great deal of information yet to be explored, which would provide insight on the effectiveness of running
time supplements, and on the presence of structural issues that generate delay in transport operation. In this
paper we present a clustering technique to identify recurrent delay patterns among train services, based on
readily available data, and which leaves room for inference on the factors that generate specific delay
patterns. The result shows that, within comparable train trajectories and stopping patterns, different train
services accumulate delay at different stations, and that recovery shapes differently according to the route
direction. Inferences on the cluster composition show the most frequent service characteristics in each
cluster. Such information could inform the allocation of correction measures to improve timetables. Table
1 and Table 2 summarize the literature just reviewed.

14
Table 1: Review of previous uses of univariate statistics in railway operation analysis
Environment Technique
Rea
l o
per
atio
n
Sim
ula
tio
n
Dis
trib
uti
on
Fit
ting
Tes
t si
gnif
ican
ce
Reg
ress
ion
anal
ysi
s
Per
cen
tile
so
rtin
g
Vis
ual
in
spec
tio
n
Purpose
Goverde et al. (2001) X X Distributions of Primary and Secondary delays
Sipilä (2010) X X Comparison running time supplement strategies
O. Lindfeldt (2010) X X X Distributions of Primary delays from real operation for simulation
Olsson and Haugland (2004) X X Factors affecting punctuality
Gorman (2009) X X Factors that generate delays on single track
lines
A. Lindfeldt (2010) X X Factors that increase delays on line segments
A. Lindfeldt and Sipilä (2014) X X Travel times with different operation models,
with/without free freight operation
Shih et al. (2014) X X Factors affecting average delay per train-mile
Schittenhelm and Richter (2009) X X X Visual inspection of quantile-based representation of deviations and change in
deviation
Richter (2010) X X Delay tabular representation and sorting train
service performance
Peterson (2012) X X Rolling average delay for specific train services
Andresson et al. (2011) X X Assessment of effectiveness of running time
supplements
Andresson et al. (2013) X X Identification of critical points for robustness
van Oort et al. (2015) X X Delay profiles, headway profiles

15
Table 2: Review of previous uses of big data techniques in railway operation analysis
Technique
Level of
detail
Ev
ent
min
ing
Ass
oci
atio
n R
ule
s
Su
cces
sion
Rule
s
Neu
ral
Net
wo
rks
Bay
esia
n N
etw
ork
s
Ran
do
m f
ore
sts
Su
ppo
rt V
ecto
r
Reg
ress
ion
Clu
ster
ing
Tra
ck s
ecti
on
s
Sta
tion
Input Purpose
Hansen et al. (2010) X X Current delays of al
trains
Prediction of running
time to next station
Goverde and Meng
(2011) Kecman and
Goverde (2012)
X X Timestamps Delay chains, Actual primary delay causes
Sørensen et al. (2017)
X X Timestamps
Delay chains on single
track lines, actual
primary delay causes
Cule et al. (2011) X X Timestamps Delay patterns
Wallander and
Mäkitalo (2012) X X
Timestamps, delay
causes from dispatchers Delay chains
Yabuki et al. (2015) X X Timestamps Comparison of real
scenarios
Malavasi and Ricci
(2001) X X Physical infrastructure
and utilization ratio
Prediction of total
realized delay on a network
Kecman et al.
(2015)a X X
Current train delay, last
delay at station
Delay prediction at
next stations
Chapuis,(2017) X X Current train delay, last
delay at station, distance
Delay prediction at
next stations
Marković et al.
(2015) X X
Infrastructure and train
journey characteristics
Delay prediction at
next stations
Kecman et al.
(2015)b X X
Current traffic condition, actual train position,
delays of the day
Running time and dwelling time
prediction
Cerreto et al. (2018) (This paper)
X X Timestamps
Recurrent delay
patterns across
stations
3 IDENTIFICATION OF RECURRENT DELAY PATTERNS USING BIG DATA TECHNIQUES
In this paper, a delay profile of a train run is defined as the set of recorded deviations throughout
its path or a part of it, on a specific date. Note that deviation is reported as the time difference between a
scheduled and a realized event, such as arrival, departure, or a nonstop timing point. Even though delay is
often used to refer to positive deviations, a delay profile can include null and negative values. A delay
profile is a powerful representation of operation and the comparison of several delay profiles along the

16
same service path allows the identification of recurrent delay patterns and such a representation method has
already been presented in the literature [1,4,18,19,21,22]. Delay change, also called delay jump, is the
difference in deviation between two consecutive stations, and represents the delay recovery or increase.
Schittenhelm and Richter [1] use this measure to assess delay increases or time gains between stations, and
Goverde and Meng [11] use it to identify delay chains in railway operation. We define a delay change
profile of a train as the set of recorded delay changes along its path or a part of it.
A dataset of delay profiles consists of all the delay profiles recorded in a defined period, stacked
together. Fields, or variables, of the dataset are the events at every station, whereas observations are
individual train runs from a selected service. Such a dataset can refer to a specific train service or to several
services following the same stopping pattern, so that the fields can be aggregated. The first case is intended
for infrequent services, typically long-distance trains, where every single service may have its own
characteristics in terms of planned demand, scheduled rolling stock, or the time of crossing congested
nodes. Suburban and regional railway services are often scheduled in constant stopping patterns at high
frequency, and could, thus, be analyzed together, expecting characteristics of operation to be more
homogenous across services. A dataset of delay change profiles is defined analogously to delay profile
datasets, where the fields contain the change in deviation in place of the absolute deviation.
Previous research presented on delay and delay-change profiles interpret recurrent patterns by
visual search for similarities [1,4,19,21]. The systematic analysis of these two types of datasets through
clustering algorithms allows the identification of patterns that are not necessarily visible, or that could be
wrongly associated by subjective interpretation.
Clustering techniques partition a dataset into a collection of groups of similar observations. In this
study, clustering is used to partition the datasets of delay profiles and identify train services that are
candidates for identification of common causality. Inference on common factors appearing in observations
clustered together facilitates the assessment of delay patterns in association to specific characteristics of a

17
transport service, such as time of the day (peak/off peak), day of the week, or equipment used. The
clustering process is realized through measures of similarity between elements in the same cluster and
dissimilarity between elements from different clusters. Several methods and metrics are available to
accomplish the task, suitable for different uses. Hierarchical algorithms proceed by splitting or merging
observations recursively, and are preferred when a nested structure is assumed in the clusters. In contrast,
partitional algorithms do not impose a hierarchical structure and find all the clusters at the same time. K-
means clustering is a partitional algorithm, and was chosen due to its simplicity and frequent appearance in
the literature [33].
K-means clustering is an iterative clustering process based on the identification of the mean element
in each cluster. Every cluster is represented by its centroid, calculated as the average of the elements of the
cluster, and every observation is assigned to the cluster corresponding to the closest centroid. Given a
number k of initial centroids, the algorithm executes the following steps:
1. assign every element to the cluster with the closest centroid;
2. calculate the new centroids of all the clusters as the mean of the elements;
3. repeat until convergence, which is met when no element changes cluster between consecutive iterations.
This simple method requires three user-specified parameters, which might be hard to determine
beforehand. The distance metric, the number of clusters k, and the cluster initialization. Euclidean distance
is often used to determine the difference between observations, but other metrics are available, such as the
L1 distance [34]. The number of clusters k is the most difficult parameter to estimate, as there is no perfect
mathematical criterion. The parameter k is typically determined according to available knowledge about
the data, or interpreting and evaluating the meaning of several independent partitions realized for different
values of k. The initial centroids might influence the resulting clusters, so the initialization is often chosen
among several independent partitions that result from sampling k initial centroids among the observations.
The influence of initialization, however, generally diminishes with the dimensionality of the dataset [33].

18
A substantial contribution to the simplicity of the method is given by the required structure of the
data. Contrary to observer-operated search, clustering methods rely on the numerical relations between
variable values recorded across single observations. It is, thus, unnecessary for the clustering algorithm to
preprocess the data and sort the recorded delays for every train/observation. In the method proposed in this
paper, k-means clustering is applied to observations of a multidimensional variable, whose size corresponds
to the number of timing points of a fixed stopping pattern, where the fields contain the delays, or delay
changes, respectively, recorded at the individual timing points. Every observation of this multidimensional
variable is a vector, and represents a single train run.
4 CASE STUDY: THE KYSTBANE, COPENHAGEN
The Kystbane (Coast line) is a double-tracked railway in the Copenhagen region. It is one of the
busiest railway lines in the network of Banedanmark, the Danish infrastructure manager, and it is operated
to regional standards, with some international services. It is operated nearly entirely by DSB, the largest
Danish railway undertaking, which runs three different service types. The timetable is cyclic, and the
services operate different stopping patterns during the day, as illustrated in Figure 1.
Co
pe
nh
age
n
Nø
rrep
ort
Øst
erp
ort
He
ller
up
Kla
mp
en
bo
rg
Sko
dsb
org
Ve
db
æk
Ru
ngs
ted
Ky
st
Ko
kke
da
l
Niv
å
Sne
kke
rste
n
He
lsin
gør
ØK
ØP
ØD
To Sweden
Hu
mle
bæ
k
Esp
erg
ærd
e
Figure 1: DSB services and stopping patterns on the Kystbane.

19
• The Øresund trains (“ØK”) run all day every 20 minutes on a limited section of the coast line,
between Copenhagen and Nivå. These trains operate between Denmark and Sweden across the
Øresund bridge, and stop at every station in Danish territory;
• The Regional trains (“ØP”) run all day every 20 minutes as well, but they only operate in Denmark
and run the whole coast line. These trains skip selected stops between Copenhagen and Nivå;
• Additional trains are operated in the morning and afternoon peak hours. The Rush hour trains (“ØD”)
operate every 20 minutes between Copenhagen and Helsingør, skipping other selected stops.
Fewer trains with modified stopping patterns run at night, so only weekday operation between 4:30
and 20:00 is considered in this study. The sections between Copenhagen and Østerport, and between
Snekkersten and Helsingør are shared with other services and operators.
In the resulting charts, stations are identified by a code specified by the infrastructure manager.
Station codes and names are reported in Table 3.
Table 3: Station codes and names on the Kystbane
Station code Station name Distance from
KH [km]
KH København H
(Copenhagen Central Station) 0,0
KN Nørreport 1,5
KK Østerport 3,1
HL Hellerup 7,8
KL Klampenborg 13,3
SÅ Skodsborg 18,8
VB Vedbæk 22,1
RU Rungsted Kyst 26,1
OK Kokkedal 29,1
NI Nivå 32,5
HUM Humlebæk 36,3
GÆ Espergærde 40,0
SQ Snekkersten 42,7
HG Helsingør 46,2

20
Banedanmark provided a set of timestamps that state the scheduled and realized times of the trains
at every timing point from April to December 2014. The records include information about the operation
and about the timing points, such as station name, train ID, train category, scheduled time and recorded
deviation. Banedanmark relies on automatic train detection systems, based on the signaling system
components. Typically, the track circuit boundaries do not correspond exactly to the platforms, and an
offset is generated between the time recorded by the automatic system and the actual time a train arrives at
the platform or departs. This is a rather common problem, and it is also reported in the Netherlands [32]
and Norway [12]. For the Danish network, a correction factor was calculated by Banedanmark using
statistical analyses of GPS positions of train trajectories in collaboration with the main rail operator, DSB.
The method and results are described by Richter et al. [35,36]. Nørreport station is the only station
underground on the line, so GPS correction is not available, which is visible as a saw-tooth pattern common
to all train services in the delay profiles presented below, with a slightly underestimated delay for arrival
records at Nørreport and overestimated for departure records from the same station. Similarly, delay change
records are shifted to negative values for arrivals at Nørreport, and at Østerport, whereas higher positive
values are recorded for delay changes at departures from Nørreport. The bias is systematic and has the same
exact effect on all the trains, therefore its influence on clustering can be neglected.
The train time stamps were rearranged by an automatic algorithm to create datasets as described in
§3, by means of the commercial software SAS 9.4 TS Level 1M4, by SAS Institute Inc., Cary, NC, USA.
Observations corresponded to a realized train on a given date, and the fields contained the recorded delay
at every station. Data from every station was divided in arrival, departure, and pass-through times, where
trains did not stop. Each record is the delay profile or the delay-change of a train on a date, and represents
one observation of the given train. Every variable identifies the station code and the type of timestamp,
which can be entrance to the station, I (“Indkørsel”), exit from the station, U (“Udkørsel”), or pass through
station, G (“Gennemkørsel), which is used where trains do not stop.

21
The analysis is intended to report delay patterns. Consequently, punctual trains are discarded from
the dataset. In Denmark, punctuality measurements are based on a delay threshold of 5 minutes for regional
and long-distance trains, such as the Kystbane. However, for internal management purposes, the
infrastructure manager Banedanmark creates a delay report every time a train reaches at least 3 minutes of
delay, containing information on the delay cause and on possible other trains hindered. Consequently, only
trains with at least one recorded delay greater than or equal to 3 minutes are considered relevant in the
present case study. Delay distributions are known to include large shares of trains with short delays, with
decreasing frequency for larger delays [7,8]. Largely unbalanced clusters are a known issue in clustering
algorithms and are an object of study to reduce the interference of large clusters [37]. In this case, punctual
trains can therefore be considered as a compact cluster derived by prior knowledge, and they can be filtered
out from the cluster analysis. The operation of filtering can be considered noise reduction and improves the
quality of clustering, as the k-means procedure tends to generate spherical clusters of same radius [38].
According to Marković et al. [31], large delays are influenced by different factors other than smaller delays,
which further supports the filtering choice. However, in different contexts, the filtering threshold might be
set equal to a different value, or not be applied at all.
Given the characteristic high frequency of train services on this line, clustering was operated by
stopping patterns rather than by train numbers, so trains were grouped together by direction and service
category. Grouping trains with similar characteristics and same stopping patterns increases data availability
in the comparison and does not disqualify the result. In fact, such grouping was already proposed by
Schittenhelm and Richter [1].
As explained in §3, k-means clustering requires choosing the number of clusters k in advance. To
set the number of clusters, the k-means algorithm was repeated with different values of k, and the best result
was selected using criteria from Jain [33]. The number of clusters k should be large enough to represent
different patterns. At the same time, as k increases, the same delay patterns tend to split in more clusters,
and k should remain small enough to prevent the generation of duplicate clusters. In detail, for every

22
combination of train category, direction, and clustering variable (delay or delay change), k was set as the
highest integer that did not generate duplicate clusters. That is, the univariate distributions of delays, or
delay changes, in every cluster should be different from all the other clusters for at least one station. Since
k is selected independently for all the mentioned cases, the same set of trains might best be represented by
a different number of clusters when the algorithm operates on the delay variables or on the delay change
variables. The L1 distance was used as a clustering metric between observations, as suggested by Kashima
et al. [34].
K-means clustering was performed on the described dataset by the commercial software MATLAB
R2017a, by The MathWorks, Inc.. In the following figures, selected results of application of the method
are reported, clustering on either delay profiles, or on the delay change profiles.
4.1 Clustering results
Figure 2 illustrates the effectiveness of delay profiles clustering on ØK southbound trains, on the
delay variables. Note, after a stop at Copenhagen central station, these trains proceed to Sweden. The charts
show that similar delay profiles are grouped together with low variance around the average centroid of each
cluster, highlighting recurrent patterns. The resulting clusters can be interpreted as follows:
1. Cluster 1: Trains that are punctual on the first section of the line, but suffer delays approaching the most
congested area of Copenhagen, mainly from Klampenborg and from Østerport;
2. Cluster 2: Trains that are punctual throughout the complete journey, which receive delays leaving from
Copenhagen;
3. Cluster 3: Trains that are nearly punctual, or anyway within 5 minutes of delay through the complete
journey, and across Copenhagen central station; from Hellerup, a marginal delay recovery is visible for
these trains;
4. Cluster 4: The most delayed trains, being delayed throughout the whole itinerary, or it largest part;
5. Cluster 5: Punctual trains with slightly, but steadily, increasing delay across stations.

23
–
Figure 2: Resulting clusters in southbound ØK trains, Nivå – Copenhagen.

24
Some clusters present outliers, such as clusters 2 and 3. Even though some delay profiles may
appear considerably different from other profiles in the same clusters, these observations were assigned to
the cluster with the closest centroid. This means that, in selected cases, the delay profiles are the
representation of rather unique events, which may be neglected after more detailed analysis in the
composition of the individual clusters.
Individual clusters are characterized through the mean values of the aforementioned measures. The
following measures were computed for each train run to characterize the individual clusters:
• Average, minimum, and maximum delay across stations;
• Range of delays across stations;
• Standard deviation of delays recorded across stations;
• Initial delay, the delay at first station;
• Final delay, the delay at the last station;
• Overall delay change, difference between final and initial delay. Positive values mean the delay has
increased from first to last station;
• Maximum delay change across stations.
Cluster characteristics are summarized in Table 4:
Table 4: Characterization of delay profile clusters, southbound ØK trains Nivå – Copenhagen
Cluster N.
obs.
Mean
average
delay
[min]
Mean
STD of
delays
[min]
Mean
initial
delay
[min]
Mean
final
delay
[min]
Mean
min
delay
[min]
Mean
max
delay
[min]
Mean
delay
range
[min]
Mean
max
delay
change
[min]
Mean
overall
delay
change
[min]
1 270 2,26 2,78 -0,95 6,14 -1,06 7,72 8,78 4,88 7,09
2 418 0,55 1,47 -1,05 4,71 -1,24 5,27 6,52 4,69 5,76
3 381 3,09 1,12 1,70 1,80 0,53 4,64 4,11 2,69 0,11
4 159 7,65 1,92 4,59 8,03 3,73 10,21 6,47 6,79 3,44
5 395 1,92 1,14 -0,28 2,23 -0,47 4,10 4,57 2,25 2,51
Total 1623 2,46 1,57 0,35 3,99 -0,12 5,73 5,85 3,87 3,64

25
4.2 Comparison with percentile-based approaches on delay profiles
In this section, a comparison is provided between the pooled data and the clusters on the dataset of
delay profiles. The same percentile representation of delay profiles is shown, as proposed by Schittenhelm
and Richter [1], Peterson [4], and van Oort et al. [22]. These authors represented different percentiles. For
the sake of clarity, only the 15th, 50th and 85th percentiles and the average are displayed in the following
diagrams.
Figure 3 shows the distribution of delays of the entire dataset of ØK southbound trains. The only
pattern visible is a slight increase in delay toward Copenhagen, more evident for the more delayed trains,
represented by the 85th percentile. Even though a large portion of punctual trains was discarded from the
dataset, the residual distribution of delays remains positively skewed, as shown by the average constantly
higher than the median value.
The new information revealed by the clustering algorithm is provided in Figure 4. In this figure,
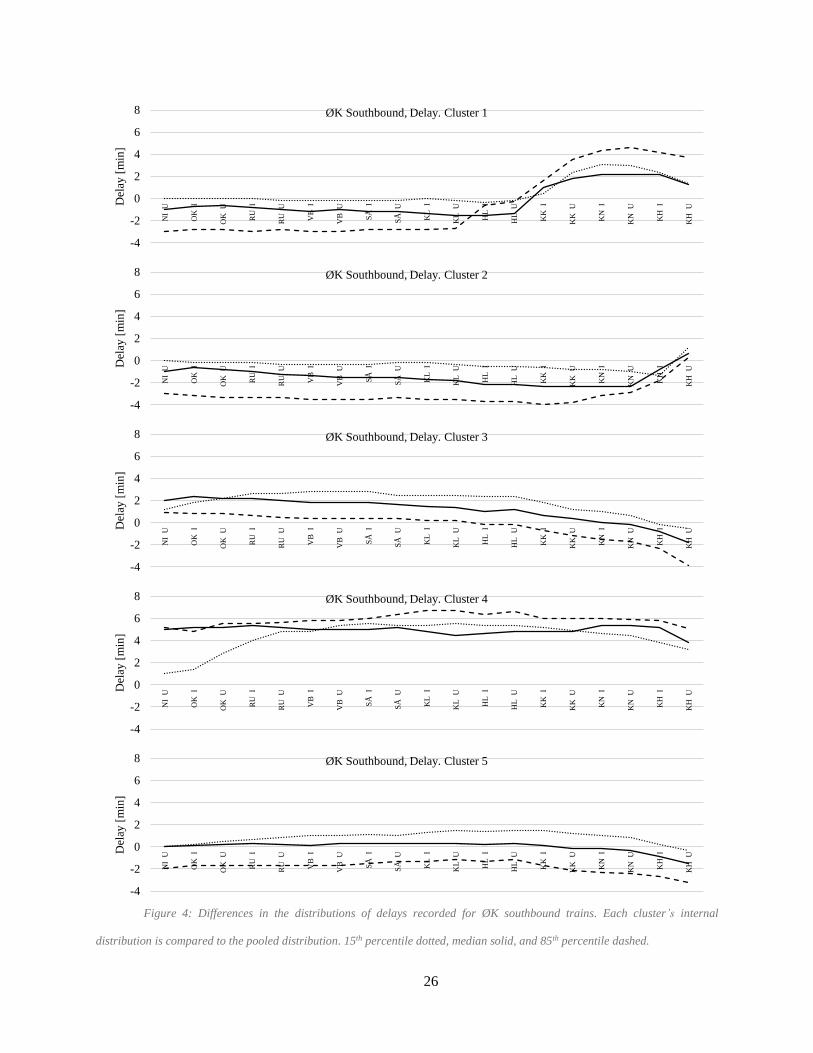
the individual internal distributions of delays are compared to the pooled delay distribution from Figure 3.
Figure 4 shows, for each cluster, the difference between the cluster statistic at each station and the
equivalent pooled statistic from Figure 3.
Figure 3: Delays recorded for ØK southbound trains.15th percentile dotted, median solid black, and 85th percentile
dashed. Average solid gray.
In Figure 4, the 15th and 85th percentiles and the median line of the internal cluster delay profiles
distributions, are compared to the distribution of pooled delay profiles. The clusters where the difference
of 85th percentile from the pooled dataset is lower than the difference of the 15th percentile have tighter
-2
0
2
4
6
8
NI
U
OK
I
OK
U
RU
I
RU
U
VB
I
VB
U
SÅ
I
SÅ
U
KL
I
KL
U
HL
I
HL
U
KK
I
KK
U
KN
I
KN
U
KH
I
KH
U
Del
ay [
min
]
ØK Southbound, Delay. Pooled data
26
Figure 4: Differences in the distributions of delays recorded for ØK southbound trains. Each cluster’s internal
distribution is compared to the pooled distribution. 15th percentile dotted, median solid, and 85th percentile dashed.
-4
-2
0
2
4
6
8
NI
U
OK
I
OK
U
RU
I
RU
U
VB
I
VB
U
SÅ
I
SÅ
U
KL
I
KL
U
HL
I
HL
U
KK
I
KK
U
KN
I
KN
U
KH
I
KH
UD
elay
[m
in]
ØK Southbound, Delay. Cluster 1
-4
-2
0
2
4
6
8
NI
U
OK
I
OK
U
RU
I
RU
U
VB
I
VB
U
SÅ
I
SÅ
U
KL
I
KL
U
HL
I
HL
U
KK
I
KK
U
KN
I
KN
U
KH
I
KH
UD
elay
[m
in]
ØK Southbound, Delay. Cluster 2
-4
-2
0
2
4
6
8
NI
U
OK
I
OK
U
RU
I
RU
U
VB
I
VB
U
SÅ
I
SÅ
U
KL
I
KL
U
HL
I
HL
U
KK
I
KK
U
KN
I
KN
U
KH
I
KH
UD
elay
[m
in]
ØK Southbound, Delay. Cluster 3
-4
-2
0
2
4
6
8
NI
U
OK
I
OK
U
RU
I
RU
U
VB
I
VB
U
SÅ
I
SÅ
U
KL
I
KL
U
HL
I
HL
U
KK
I
KK
U
KN
I
KN
U
KH
I
KH
UD
elay
[m
in]
ØK Southbound, Delay. Cluster 4
-4
-2
0
2
4
6
8
NI
U
OK
I
OK
U
RU
I
RU
U
VB
I
VB
U
SÅ
I
SÅ
U
KL
I
KL
U
HL
I
HL
U
KK
I
KK
U
KN
I
KN
U
KH
I
KH
UD
elay
[m
in]
ØK Southbound, Delay. Cluster 5

27
distributions of delay profiles compared to the pooled dataset, increasing the significance of the identified
pattern. The local deviation present in the clusters represents the information hidden in the pooled dataset,
which is instead brought to light by the clustering.
4.3 Comparison with percentile-based approaches on delay change profiles
In this section, a comparison is provided between the pooled data and the clusters on the dataset of
delay change profiles. The same representation of delay change profiles based on the median is shown, as
proposed by Schittenhelm and Richter [1,18], supplemented with the average, i.e. the cluster centroid.
Figure 5 shows the delay change profiles of the entire dataset of ØD northbound trains. A
generalized positive delay change is visible at the last station. The large changes in delay from location
KN I to KK I are linked to the known deviation in the timestamps at Nørreport.
Figure 5: Delay changes recorded for ØD northbound trains. Median in bright shade, average in dark.
The differences between the pooled median and average delay change profile and the same profiles
from individual clusters are represented in Figure 6. In this case, the information gained by clustering is
more evident. All the clusters remain similar to the pooled data at most stations, except few stations, where
a large difference is recorded in the delay change.
-2
-1
0
1
2
3
KN
I
KN
U
KK
I
KK
U
HL
G
KL
G
SÅ
G
VB
G
RU
I
RU
U
OK
I
OK
U
NI
G
HU
M I
HU
M U
GÆ
I
GÆ
U
SQ
I
SQ
U
HG
I
Del
ay c
han
ge
[min
]
ØD Northbound, Delay change. Pooled Data

28
Figure 6: Delay changes recorded for ØD northbound train, by clusters. Median in bright shade, average in dark.
-2
-1
0
1
2
3
KN
I
KN
U
KK
I
KK
U
HL
G
KL
G
SÅ
G
VB
G
RU
I
RU
U
OK
I
OK
U
NI
G
HU
M I
HU
M U
GÆ
I
GÆ
U
SQ
I
SQ
U
HG
I
Del
ay c
han
ge
[min
]ØD Northbound, Delay change. Cluster 1
-2
-1
0
1
2
3
KN
I
KN
U
KK
I
KK
U
HL
G
KL
G
SÅ
G
VB
G
RU
I
RU
U
OK
I
OK
U
NI
G
HU
M I
HU
M U
GÆ
I
GÆ
U
SQ
I
SQ
U
HG
I
Del
ay c
han
ge
[min
] ØD Northbound, Delay change. Cluster 2
-2
-1
0
1
2
3
KN
I
KN
U
KK
I
KK
U
HL
G
KL
G
SÅ
G
VB
G
RU
I
RU
U
OK
I
OK
U
NI
G
HU
M I
HU
M U
GÆ
I
GÆ
U
SQ
I
SQ
U
HG
I
Del
ay c
han
ge
[min
] ØD Northbound, Delay change. Cluster 3
-2
-1
0
1
2
3
KN
I
KN
U
KK
I
KK
U
HL
G
KL
G
SÅ
G
VB
G
RU
I
RU
U
OK
I
OK
U
NI
G
HU
M I
HU
M U
GÆ
I
GÆ
U
SQ
I
SQ
U
HG
I
Del
ay c
han
ge
[min
] ØD Northbound, Delay change. Cluster 4
-2
-1
0
1
2
3
KN
I
KN
U
KK
I
KK
U
HL
G
KL
G
SÅ
G
VB
G
RU
I
RU
U
OK
I
OK
U
NI
G
HU
M I
HU
M U
GÆ
I
GÆ
U
SQ
I
SQ
U
HG
I
Del
ay c
han
ge
[min
] ØD Northbound, Delay change. Cluster 5
-2
-1
0
1
2
3
4
KN
I
KN
U
KK
I
KK
U
HL
G
KL
G
SÅ
G
VB
G
RU
I
RU
U
OK
I
OK
U
NI
G
HU
M I
HU
M U
GÆ
I
GÆ
U
SQ
I
SQ
U
HG
I
Del
ay c
han
ge
[min
] ØD Northbound, Delay change. Cluster 6

29
Every cluster is characterized by at least one larger delay change at one station, which would be
hidden in the pooled distribution of delay change profiles. Noticeably, the negative effect of different delay
patterns overlapping is evident for KN I records. All the clusters deviate negatively from the pooled data
by around 0,5 minutes, except cluster 2, which deviates positively by around 1,5 minutes from the pooled
profile. This means that the pooled profile was shifted by one single cluster to a central value, hiding both
the frequent delay recovery, and the delay increase specific from cluster 2.
4.4 Inference on the clusters
In this section, results from clustering of delay profiles and delay change profiles are investigated
to identify relations with cluster characteristics, using heuristic classification. For the sake of conciseness,
only cluster centroids are reported in the following figures, and only a sample of the results is reported,
which is ØD northbound trains and ØK southbound trains. Figure 7 shows results from clustering delay
change profiles for ØD trains to Helsingør.
Figure 7: Cluster centroids for northbound ØD trains, delay change.
-3
-2
-1
0
1
2
3
4
KN
I
KN
U
KK
I
KK
U
HL
G
KL
G
SÅ
G
VB
G
RU
I
RU
U
OK
I
OK
U
NI
G
HU
M I
HU
M U
GÆ
I
GÆ
U
SQ
I
SQ
U
HG
I
Del
ay c
han
ge
[min
]
Station
ØD to Helsingør - Delay change
Cluster centroids
1 2 3 4 5 6

30
Clusters can be interpreted as follow:
1. Cluster 1: regular delay increases at the last three stations, where trains become unpunctual;
2. Cluster 2: delay increase arriving at the first stop, Nørreport;
3. Cluster 3: trains that are considerably delayed arriving at the final destination, Helsingør;
4. Cluster 4: trains without remarkable delay changes: these train tend to keep the same delay throughout
the whole journey;
5. Cluster 5: specific delay increases at Humlebæk arrival; trains in this cluster show also smaller recovery
at Skodsborg arrival, compared to other clusters;
6. Cluster 6: these trains accumulate delays passing the stations of Hellerup and Klampenborg; on the
other side, compared to other clusters, the average delay increase at final destination Helsingør is
smaller.
Table 5: Northbound ØD trains. Cluster share by train service ID. The color code compares the individual row’s
distributions among clusters to the overall distribution among clusters reported in the last row. Clusters sorted by size.
Time
band
Departure
time from
KH
Train
number
Cluster
2 6 4 1 3 5
2 –
AM
Pea
k
06:18 4413 18% 25% 14% 14% 18% 11%
06:38 4415 4% 36% 4% 16% 32% 8%
06:58 4417 26% 33% 7% 19% 4% 11%
07:18 4419 6% 22% 8% 31% 8% 25%
4 –
PM
Pea
k
15:18 4467 21% 25% 17% 4% 21% 13%
15:38 4469 19% 30% 7% 12% 23% 9%
15:58 4471 44% 16% 16% 4% 8% 12%
16:18 4473 5% 15% 28% 18% 20% 15%
16:38 4475 43% 13% 21% 13% 10% 2%
16:58 4477 20% 15% 39% 9% 2% 15%
17:18 4479 16% 32% 15% 12% 9% 16%
17:38 4481 31% 14% 19% 19% 5% 12%
17:58 4483 46% 14% 14% 6% 10% 10%
Cluster
share 24% 22% 17% 14% 12% 12%

31
Inference on the cluster population shows that some patterns are specific of selected train services,
identified by their train number. Table 5 shows how every train service ID is spread across clusters. In each
column, the shade represents the difference between individual percentages and the cluster share, where the
brightest colors are associated to the values furthest from the cluster share. Green is positive difference, i.e.
larger percentages than the cluster share, red is negative difference, i.e. smaller percentages than the cluster
share.
Delay change profiles in cluster 1 and 5 represent typical behavior of service 4419, whereas cluster 2 shows
considerably more frequent in services 4471, 4473, and 4483. Cluster 3 is more common among services
4415, three times more frequent than the whole population distribution across clusters, and, 4467, 4469,
4473, which double the average frequencies. Cluster 4 is typical for services 4477, and, lastly. Cluster 6
represents a large share of services 4417 and, again, 4415. Further investigation on other factors may reveal
the causes that rule the train services’ cluster membership.
The analysis of Table 5 shows the existence of a relation between train IDs in a specific time band
and cluster membership. This is shown in detail in Table 6, where cluster membership is aggregated in time
bands. The same color coding as Table 5 is applied.
The timetable is divided in time bands according to the overall service frequency on the line, so
that time bands 2 and 4 are the AM and PM peak periods, respectively, when 9 trains/h per direction are
operated. Time band 1, 3, and 5 are the remaining off-peak periods, when ØD trains are not operated, so
only 6 trains/h occupy the line in each direction, allowing for larger headway buffers between trains. At the
same time, smaller congestion is expected, in off-peak periods, both on the train traffic and on the number
of passengers to board or alight at the stations.

32
Table 6: Northbound ØD trains. Cluster share by time band. The color code compares the individual row’s distributions
among clusters to the overall distribution among clusters reported in the last row. Clusters sorted by size.
Time Type Time band Cluster
2 6 4 1 3 5
6:20 - 8:20 Peak AM 2 13% 28% 9% 21% 15% 15%
15:20 - 18:00 Peak PM 4 27% 20% 19% 12% 11% 11%
Cluster
share 24% 22% 17% 14% 12% 12%
In this case, morning peak shows recurrent delay patterns presented by clusters 1 and 6, whereas
patterns represented by clusters 2 and 4 are rare in this time band. As opposite, the distribution of trains in
the PM peak hour is similar to the overall distribution.
Further inference on the clusters of ØD northbound trains might highlight interferences from other
trains. Lokaltog trains run mostly on a network independent from Banedanmark's, and share with ØD and
ØP trains the line section between Snekkersten and Helsingør. ØD northbound trains are scheduled at a
short headway after Lokaltog trains from Snekkersten to Helsingør. The analysis of timestamps from
Lokaltog trains on this section and of the realized headways between Lokaltog and ØD northbound trains
might suggest that clusters 1 and 3, which increase the delay near Helsingør, are actually the result of delay
propagation from Lokaltog trains to ØD trains.
The clustering results from other service categories, with different stopping patterns, can be related
to the time periods of the day. For example, ØK southbound trains are reported in Figure 8 and Table 7.

33
Figure 8: Cluster centroids for southbound ØK trains, delay change.
Table 7: Southbound ØK trains. Cluster share by time band. The color code compares the individual row’s distributions
among clusters to the overall distribution among clusters reported in the last row. Clusters sorted by size.
Start
time Type Time band
Cluster
2 4 1 5 3 6
04:30 Off peak 1 35% 30% 15% 12% 3% 5%
06:20 Peak AM 2 49% 26% 10% 11% 1% 3%
08:20 Off peak 3 39% 29% 13% 13% 3% 3%
15:20 Peak PM 4 30% 26% 24% 9% 9% 2%
18:00 Off peak 5 40% 29% 18% 9% 3% 1%
Cluster share 40% 28% 15% 12% 3% 2%
Figure 8 represents the centroids of resulting clusters in train category ØK Southbound, according
to delay change. Besides, the distribution of trains across clusters is summarized in Table 7, disaggregated
by time bands, highlighted in the same color code as Table 5 and Table 6. Note that the number of clusters
-2
0
2
4
6
8
10
12
14
OK
I
OK
U
RU
I
RU
U
VB
I
VB
U
SÅ
I
SÅ
U
KL
I
KL
U
HL
I
HL
U
KK
I
KK
U
KN
I
KN
U
KH
I
KH
U
Del
ay c
han
ge[
min
]
Station
ØK to Sweden - Delay change
Cluster centroids
1 2 3 4 5 6

34
in the delay change profiles of ØK southbound trains is different from the number of cluster in delay
profiles. This is not necessarily inconsistent, as the two variables express different aspects of the
development of delays. In this case, the cluster share by time band explains the nature of two clusters. In
particular, cluster 1 is considerably more frequent in the PM peak hour, whereas cluster 2 is more typical
of trains in the AM peak hour. This result can be reasonably interpreted as delays generated by passenger
congestion. In fact, delay increases in the PM peak hour appear at departures from Copenhagen, where a
large number of passengers leave towards Sweden. On the contrary, cluster 2 represents delays increases
collected across stations towards Copenhagen, and a delay recovery departing from Copenhagen, where
fewer passengers are expected to board. The cluster share for clusters 3 to 6 is comparable with the overall
distribution across different time bands, so these delay patterns cannot directly be associated with time of
the day. Further research may reveal factors that rule the cluster membership for these clusters.
More disaggregated analysis of cluster composition according to train number, or service ID, is in
accordance with aggregated time bands. This is valuable especially for time band 3, which is the most
populated time band according to the timetable. Table 8 shows that, even if the overall distribution of trains
in time band 3 across clusters is very similar to the overall distribution, specific train services present
different typical delay patterns. In this case, further analysis of train service characteristics should indicate
a better disaggregation of train services in a specific time band. The same color code as tables Table 5,Table
6 and Table 7 is applied in Table 8.
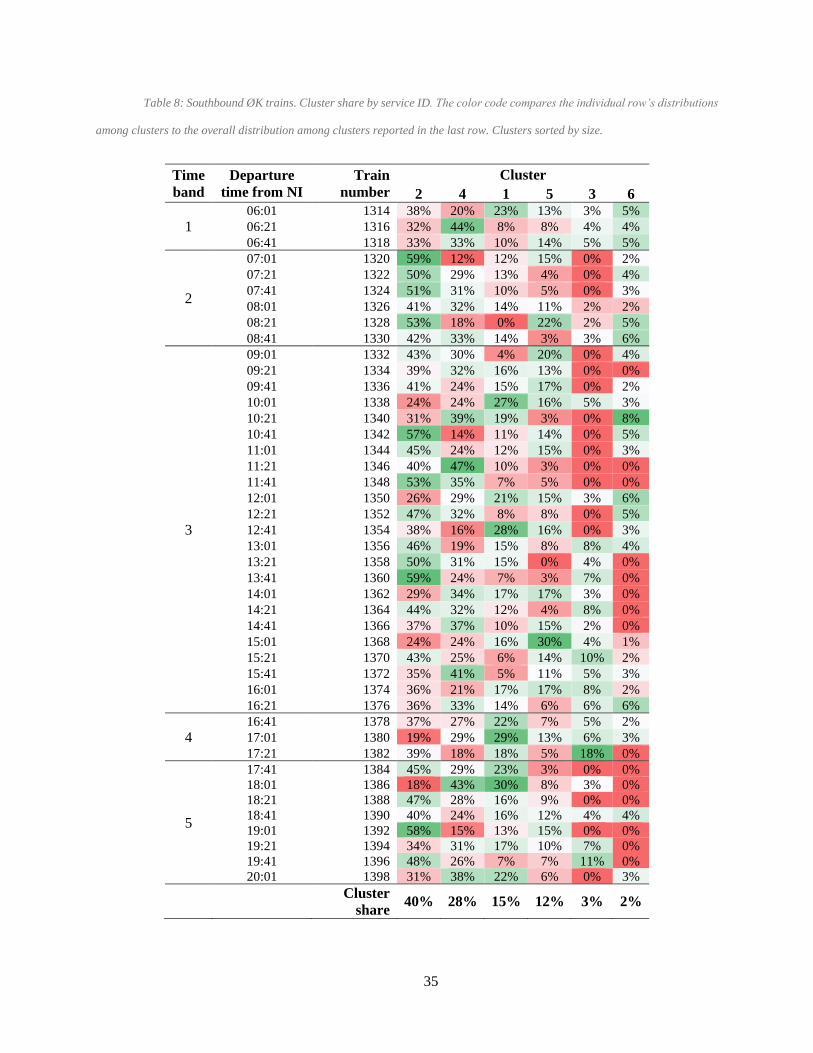
35
Table 8: Southbound ØK trains. Cluster share by service ID. The color code compares the individual row’s distributions
among clusters to the overall distribution among clusters reported in the last row. Clusters sorted by size.
Time
band
Departure
time from NI
Train
number
Cluster
2 4 1 5 3 6
1 06:01 1314 38% 20% 23% 13% 3% 5%
06:21 1316 32% 44% 8% 8% 4% 4%
06:41 1318 33% 33% 10% 14% 5% 5%
2
07:01 1320 59% 12% 12% 15% 0% 2%
07:21 1322 50% 29% 13% 4% 0% 4%
07:41 1324 51% 31% 10% 5% 0% 3%
08:01 1326 41% 32% 14% 11% 2% 2%
08:21 1328 53% 18% 0% 22% 2% 5%
08:41 1330 42% 33% 14% 3% 3% 6%
3
09:01 1332 43% 30% 4% 20% 0% 4%
09:21 1334 39% 32% 16% 13% 0% 0%
09:41 1336 41% 24% 15% 17% 0% 2%
10:01 1338 24% 24% 27% 16% 5% 3%
10:21 1340 31% 39% 19% 3% 0% 8%
10:41 1342 57% 14% 11% 14% 0% 5%
11:01 1344 45% 24% 12% 15% 0% 3%
11:21 1346 40% 47% 10% 3% 0% 0%
11:41 1348 53% 35% 7% 5% 0% 0%
12:01 1350 26% 29% 21% 15% 3% 6%
12:21 1352 47% 32% 8% 8% 0% 5%
12:41 1354 38% 16% 28% 16% 0% 3%
13:01 1356 46% 19% 15% 8% 8% 4%
13:21 1358 50% 31% 15% 0% 4% 0%
13:41 1360 59% 24% 7% 3% 7% 0%
14:01 1362 29% 34% 17% 17% 3% 0%
14:21 1364 44% 32% 12% 4% 8% 0%
14:41 1366 37% 37% 10% 15% 2% 0%
15:01 1368 24% 24% 16% 30% 4% 1%
15:21 1370 43% 25% 6% 14% 10% 2%
15:41 1372 35% 41% 5% 11% 5% 3%
16:01 1374 36% 21% 17% 17% 8% 2%
16:21 1376 36% 33% 14% 6% 6% 6%
4 16:41 1378 37% 27% 22% 7% 5% 2%
17:01 1380 19% 29% 29% 13% 6% 3%
17:21 1382 39% 18% 18% 5% 18% 0%
5
17:41 1384 45% 29% 23% 3% 0% 0%
18:01 1386 18% 43% 30% 8% 3% 0%
18:21 1388 47% 28% 16% 9% 0% 0%
18:41 1390 40% 24% 16% 12% 4% 4%
19:01 1392 58% 15% 13% 15% 0% 0%
19:21 1394 34% 31% 17% 10% 7% 0%
19:41 1396 48% 26% 7% 7% 11% 0%
20:01 1398 31% 38% 22% 6% 0% 3%
Cluster
share 40% 28% 15% 12% 3% 2%

36
Even though recurrent patterns are also clear in the delay profiles dataset, the results could not be explained
by the available variables. Further research might identify relations that guide the clustering of delay
profiles on this line, such as realized headways, weather conditions, passenger counts, and recorded delay
causes.
5 DISCUSSION
The clustering method proposed in this paper finds it strengths in being automatic, unbiased,
flexible, and simple. A comparison to methods presented in the literature is provided in this section.
Previous approaches [1,4,18,19,21,22] extracted information from delay profiles mainly through
observation, occasionally combined with multiple univariate statistical analyses and observation ranking.
In most studies, the complete dataset was plotted in the form of delay profiles, and the identification of
frequent patterns among the observations relied on the observer’s ability. Visual inspection is typically
affected by subjective interpretation, which can differ across analysts, and suffers from low effectiveness
of naked eye to average data represented graphically. In some studies, supporting measures were plotted
with the full dataset, such as average profile, median, and selected percentiles to represent the distributions.
The application of these measures as multiple univariate distributions, though, does not catch the
interdependencies of delays at different stations and does not provide information about the development
of delays along the train journey. The method proposed in this paper allows automatic identification of
delay patterns, removing, thus, the influence of subjective interpretation of delay profiles. Furthermore,
profile clustering allows the identification of similar delay profiles in the entire pool of records. Note that,
even though the clustered delay profiles were plotted in this paper, the observation of the profiles did not
play a role in the identification of similarities. This exact process is indeed performed by the clustering
algorithm, and the results are then plotted for an easier comprehension of the development of delays in the
individual clusters. The metrics provided as 15th, 50th, and 85th percentile would be sufficient to describe
the distributions within individual clusters and might be used in replacement of the cluster plots.

37
Compared to big-data techniques proposed in the literature for other purposes in analysis of
transport operation [11,23,24,32], this method relies on readily available data, and does not need detailed
knowledge on the infrastructure and occupation of individual blocking sections. It can therefore be scaled
to different levels of detail, or transferred to other modes of transportation where delay can be measured at
fixed points on a given path, such as bus networks or air traffic. It is a very common practice of transport
operators to provide live data on delays recorded on their own network, which can be recorded accessing
public websites. Furthermore, the partition of operation into recurrent delay patterns allows inference on
individual clusters, which is not possible with association or succession rules [25–27]. These methods do
not provide causality connection, and can only be used to compare scenarios, e.g. before and after delay
mitigation countermeasures have been implemented. Results from clustering can be inferred with other
mining techniques to identify further connections between specific system factors and delay membership,
so that the causes of specific delays can be identified, and the effects of corrective actions can be estimated
before-hand.
Alongside flexibility, the strength of this method resides in its simplicity. Unsupervised learning
methods, such as clustering, aim at the identification of internal structures of the system. Supervised
learning methods, in contrast, attempt to predict results, based on assumed connections in the input. For
these reasons, neural networks [28,30], Bayesian networks [29], and supporting vector regression methods
[31] require initial assumptions on the factors that have direct effect on the desired output, which can be
cumbersome to identify, and could be hidden. The clustering method proposed here does not require initial
assumptions, so any recurrent delay pattern can be identified. In particular, the k-means algorithm was
selected, being the most common algorithm for partitional clustering. Even though several clustering
methods and algorithms exist in the literature, none of them is clearly preferred from the others [33]. It is
important to stress the fact that the output of clustering algorithms only suggests hypotheses, and that the
interpretation of results plays a more relevant role than seeking the best clustering principle. However,
further research might improve the method. For example, a different choice of the clustering statistic

38
between observations might be explored. In addition, the choice of the parameter k might be supported by
advanced techniques and metrics. In this paper, k was set through statistical analysis of the associated
clusters, but further studies might reveal more efficient methods integrated in the clustering algorithm itself.
Lastly, the clustering results might depend on the punctuality threshold selected to filter out punctual trains,
if applied.
The relations found in inference from resulting clusters can, eventually, be considered and
implemented in the mentioned supervised data mining methods. The use of other sources of information
can be further investigated, e.g. the rolling stock equipment deployed, or information on delay causes
collected by train dispatchers. The clustering algorithm itself cannot provide information on the causes of
delays, but relevant relationships with external variables might be found through the inference on the
clusters. The implementation of information recorded by the dispatchers on primary and secondary delays,
could support the identification of delay propagation. However, previous studies in Europe highlighted the
unreliability of such manually recorded data [11,12]. These procedures are different for each infrastructure
manager and should comply with different national regulations. This input should be analyzed in detail
before being implemented in the inference on clusters. The timestamps might be integrated with data from
other railway undertakings, so that the realized headways could be investigated and included in the cluster
inferences. The effects of delay propagation might be thus investigated, and the dispatching strategies
possibly improved. Passenger counts, or boarding/alighting timings could also reveal that specific localized
delay increases are linked to passenger exchange, and might suggest modifications in the scheduled
dwelling times. Useful information from the railway undertakings might include differences between
planned and realized train compositions, or the use of energy saving strategies. Driving support systems are
spreading among train operators to reduce the energy consumption and thus the operating cost, especially
for diesel-powered railways. The effects of such systematic patterns in the driving style are, in any event,
expected to emerge in the clustering algorithm, especially with more detailed data in the positioning. Further
development of this method might expand its application to other industrial processes or other

39
transportation modes. The service timekeeping could be measured at designated check-points, to build
standard delay profiles and delay change profiles.
6 CONCLUSIONS
In this paper, a new method is presented to analyze railway operations, based on big-data
techniques. Previous studies highlighted the need for tools to analyze railway operation based on data from
automatic data collection sources, and to automatically detect delay patterns [1]. K-means clustering is here
applied to train delay records from automatic train detection systems to identify systematic delays,
rearranged in delay profiles and delay-change profiles. This method is automatic, unbiased, flexible, and
simple.
Both institutions and industry are showing great interest in big-data applications [2]. The method
described in this paper provides a managerial tool to identify recurrent delay patterns that affect the service
reliability. A localized analysis with additional information supports the identification of the causes of
individual patterns, so that specific countermeasures can be designed. For example, dispatching strategies
might be modified when a structural conflict is detected, the boarding and alighting process might be
improved at stations were delay increases recurrently. If the causes of recurrent delays are identified in
frequent conflicts, small modifications to the timetable slack might be a solution to reduce delay
propagation.
The effectiveness of this approach is demonstrated in an application on a Danish regional railway
line. The application shows that it is possible to identify systematic delays at specific stations in a congested
area, and to identify different delay patterns. Furthermore, delay patterns can be conveniently associated to
specific time periods of the day, showing time dependency, reasonably explained by the prevailing
passenger flow direction. Specific delay patterns are demonstrated to be characteristic of individual train
service IDs, which could depend on other service characteristics, such as structural conflicts with other
trains in specific sections of the line, use of specific rolling stock equipment, or connections to other
40
transport services. The implementation of other sources of information might improve the inference on the
clusters, such us weather conditions, passenger counts, information from the dispatchers, or rolling stock
characteristics.
Further development of this method might improve the selection of the number of clusters, identify
new clustering metrics between observations, or integrate additional sources of information to improve the
inference on clusters.
Acknowledgments
This work was funded by a Dean Grant from the Technical University of Denmark (DTU) and by
the Danish Innovation Fund through the IPTOP project (Integrated Public Transport Optimisation and
Planning).
REFERENCES
1. Schittenhelm B, Richter T. Railway Timetabling Based on Systematic Follow-up on Realized
Railway Operations. In: Harry Lahrmann, editor. Proceedings from the Annual Transport
Conference at Aalborg University. Aalborg: Traffic Research Group, Aalborg University; 2009.
2. D’agostino A. Big Data in Railways - Common Occurrence Reporting Programme. 2016.
3. Richter T. En bedre jernbane gennem højere datakvalitet. In: Harry Lahrmann, editor. Trafikdage
på Aalborgs Universitet. Aalborg: Traffic Research Group, Aalborg University; 2008.
4. Peterson A. Towards a robust traffic timetable for the Swedish Southern Mainline. In: Computers
in Railways XIII. New Forest, UK: WIT Transactions on The Built Environment; 2012. p. 473–484.
5. De Mauro A, Greco M, Grimaldi M. A formal definition of Big Data based on its essential features.
Libr Rev 2016;65:122–135.

41
6. Hansen J. Future Railway Development and Performance. In: The Danish Rail Conference.
Copenhagen: The Danish Rail Sector Association; 2015.
7. Carey M. Ex ante heuristic measures of schedule reliability. Transp Res Part B Methodol
1999;33:473–494.
8. Goverde RMP, Hooghiemstra G, Lopuhaä HP. Statistical Analysis of Train Traffic: The Eindhoven
Case. IOS Press, Incorporated; 2001.
9. Sipilä H. Simulation of modified timetables for high speed trains Stockholm – Göteborg. In: Lakušić
S, editor. First International Conference on Road and Rail Infrastructure - CETRA2010. Opatija,
Croatia: University of Zagreb; 2010. p. 1.
10. Lindfeldt O. Evaluation of punctuality on a heavily utilised railway line with mixed traffic. In: WIT
Transactions on the Built Environment. WIT Press; 2010. p. 545–553.
11. Goverde RMP, Meng L. Advanced monitoring and management information of railway operations.
J Rail Transp Plan Manag 2011;1:69–79.
12. Sørensen AØ, Landmark AD, Olsson NOE, Seim AA. Method of analysis for delay propagation in
a single-track network. J Rail Transp Plan Manag 2017;7:77–97.
13. Lindfeldt A, Sipilä H. Simulation of freight train operations with departures ahead of schedule. In:
Sipilä H, editor. WIT Transactions on the Built Environment. WIT Press; 2014. p. 239–249.
14. Olsson NOE, Haugland H. Influencing factors on train punctuality—results from some Norwegian
studies. Transp Policy 2004;11:387–397.
15. Gorman MF. Statistical estimation of railroad congestion delay. Transp Res Part E Logist Transp
Rev 2009;45:446–456.

42
16. Shih M-C, Dick CT, Sogin SL, Barkan CPL. Comparison of Capacity Expansion Strategies for
Single-Track Railway Lines with Sparse Sidings. Transp Res Rec J Transp Res Board
2014;2448:53–61.
17. Lindfeldt A. A study of the performance and utilization of the Swedish railway network. In: Lakušić
S, editor. First International Conference on Road and Rail Infrastructure - CETRA2010. Opatija,
Croatia: University of Zagreb; 2010.
18. Richter T. Systematic analyses of train run deviations from the timetable. In: Computer in Railways
XII. Wit Trans B; 2010. p. 651–662.
19. Andersson E, Peterson A, Törnquist Krasemann J. Robustness in Swedish Railway Traffic
Timetables. In: Ricci S, Hansen IA, Longo GL, Pacciarelli D, Rodriguez J, Wendler E, editors.
Proceedings of the 4th International Seminar on Railway Operations Modelling and Analysis.
Rome: 2011. p. 1–18.
20. Schittenhelm BH. Planning With Timetable Supplements in Railway Timetables. In: Annual
Transport Conference at Aalborg University. Aalborg, DK: trafikdage; 2011.
21. Andersson E, Peterson A, Törnquist Krasemann J. Introducing a New Quantitative Measure of
Railway Timetable Robustness Based on Critical Points. In: Proceedings of 5th International
Seminar on Railway Operations Modelling and Analysis (IAROR): RailCopenhagen2013.
Copenhagen: 2013. p. 1–19.
22. van Oort N, Sparing D, Brands T, Goverde RMP. Data driven improvements in public transport: the
Dutch example. Public Transp 2015;7:369–389.
23. Hansen IA, Goverde RMP, Van Der Meer DJ. Online train delay recognition and running time
prediction. In: IEEE Conference on Intelligent Transportation Systems, Proceedings, ITSC. IEEE;

43
2010. p. 1783–1788.
24. Kecman P, Goverde RMP. Process mining of train describer event data and automatic conflict
identification. In: Computers in Railways XIII. New Forest, UK: WIT Transactions on the Built
Environment; 2012. p. 227–238.
25. Cule B, Goethals B, Tassenoy S, Verboven S. Mining train delays. Lect Notes Comput Sci
(including Subser Lect Notes Artif Intell Lect Notes Bioinformatics) 2011;7014 LNCS:113–124.
26. Wallander J, Mäkitalo M. Data mining in rail transport delay chain analysis. Int J Shipp Transp
Logist 2012;4:269.
27. Yabuki H, Ageishi T, Tomii N. Mining the Cause of Delays in Urban Railways based on Association
Rules. In: CASPT2015. Rotterdam: 2015. p. 1–16.
28. Malavasi G, Ricci S. Simulation of stochastic elements in railway systems using self-learning
processes. Eur J Oper Res 2001;131:262–272.
29. Kecman P, Corman F, Peterson A, Joborn M. Stochastic prediction of train delays in real-time using
Bayesian networks. In: Proceedings of the 13th Conference on Advanced Systems in Public
Transport (CASPT) 2015. Rotterdam (Netherlands): Erasmus University; 2015. p. 18.
30. Chapuis X. Arrival Time Prediction Using Neural Networks. In: Tomii N, Hansen IA, Rodriguez J,
Pellegrini P, Dauzère-Pérès S, De Almeida D, editors. 7th International Conference on Railway
Operations Modelling and Analysis. Lille (France): International Association of Railway Operations
Research; 2017. p. 1500–1510.
31. Marković N, Milinković S, Tikhonov KS, Schonfeld P. Analyzing passenger train arrival delays
with support vector regression. Transp Res Part C Emerg Technol 2015;56:251–262.

44
32. Kecman P, Goverde RMP. Predictive modelling of running and dwell times in railway traffic. Public
Transp 2015;7:295–319.
33. Jain AK. Data clustering: 50 years beyond K-means. Pattern Recognit Lett 2010;31:651–666.
34. Kashima H, Hu J, Ray B, Singh M. K-means clustering of proportional data using L1 distance.
Tampa, FL, USA: IEEE; 2008. p. 1–4.
35. Richter T, Landex A, Andersen JLE. Precise and accurate train run data: Approximation of actual
arrival and departure times. In: WCRR (World Congress Railway Research). Sydney (Australia):
International Association of Railways; 2013.
36. Richter T. Data aggregation for detailed analysis of train delays. In: Brebbia CA, Tomii N, Mera
JM, Ning B, Tzieropoulos P, editors. WIT Transactions on the Built Environment. WITPress; 2012.
p. 239–250.
37. Wu J. Advances in K-means Clustering. Berlin, Heidelberg: Springer Berlin Heidelberg; 2012.
38. Hastie T, Tibshirani R, Friedman J. The Elements of Statistical Learning. 2nd ed. Springer; 2009.