Application of an innovative AEM system for mapping...
9
GeoConvention 2014: FOCUS 1 Application of an innovative AEM system for mapping hazards and water resources in oil and gas fields Scott R. Napier Mira Geoscience Ltd. Bill Brown SkyTEM Canada Inc. Shannon Frey Mira Geoscience Ltd. Summary Mira Geoscience has collaborated with SkyTEM Canada Inc. to produce this case study using public Airborne Electromagnetic (AEM) data collected by Geoscience BC in partnership with members of the Horn River Basin Producers Group. The objective of the AEM survey at the outset was to delineate possible sources of near surface groundwater thought to be contained in quaternary paleochanels. Modelling and interpretation of the data has resulted in imaging of subsurface resistivity features thought to represent these paleochannels. Throughout the course of the project other applications of the dataset have become apparent during the interpretive process. These applications include: detection of shallow gas and structures that may confine gas in the near surface (clay caps), explanation of artesian water in hole d-66-f and prediction of further artesian water flow througout the property , and detection of near suface coarse materials for engineering applications such as road and drill pad construction. The case study illustrates the interpretive power of combining AEM models with seismic interpretation as well as the advantages that low noise and high resolution multi moment airborne electromagnetic data acquisition systems and advanced EM processing bring to the interpretive process. Figure 1: Location of AEM study area. The data considered here were acquired in block 3
-
Upload
truongkhanh -
Category
Documents
-
view
215 -
download
2
Transcript of Application of an innovative AEM system for mapping...

GeoConvention 2014: FOCUS 1
Application of an innovative AEM system for mapping hazards and water resources in oil and gas fields Scott R. Napier Mira Geoscience Ltd.
Bill Brown SkyTEM Canada Inc.
Shannon Frey Mira Geoscience Ltd.
Summary
Mira Geoscience has collaborated with SkyTEM Canada Inc. to produce this case study using public
Airborne Electromagnetic (AEM) data collected by Geoscience BC in partnership with members of the
Horn River Basin Producers Group. The objective of the AEM survey at the outset was to delineate
possible sources of near surface groundwater thought to be contained in quaternary paleochanels.
Modelling and interpretation of the data has resulted in imaging of subsurface resistivity features
thought to represent these paleochannels. Throughout the course of the project other applications of
the dataset have become apparent during the interpretive process. These applications include:
detection of shallow gas and structures that may confine gas in the near surface (clay caps),
explanation of artesian water in hole d-66-f and prediction of further artesian water flow througout the
property , and detection of near suface coarse materials for engineering applications such as road and
drill pad construction. The case study illustrates the interpretive power of combining AEM models with
seismic interpretation as well as the advantages that low noise and high resolution multi moment
airborne electromagnetic data acquisition systems and advanced EM processing bring to the
interpretive process.
Figure 1: Location of AEM study area. The data considered here were acquired in block 3
GeoConvention 2014: Integration 2
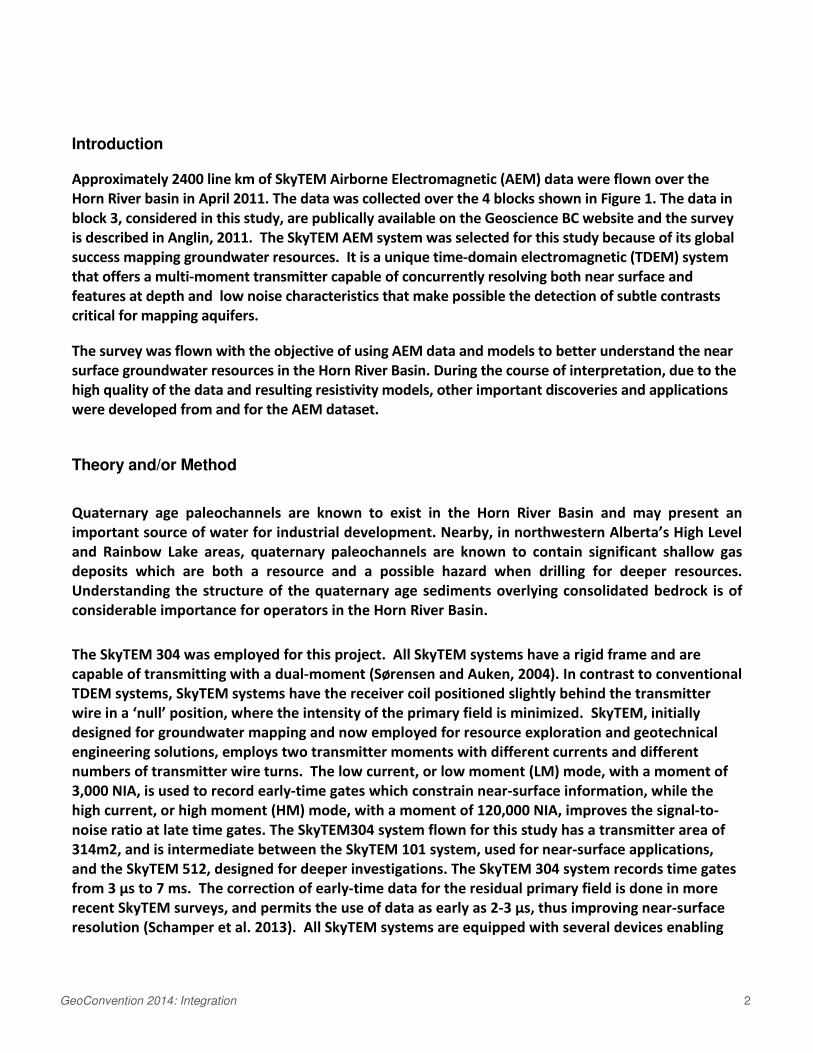
Introduction
Approximately 2400 line km of SkyTEM Airborne Electromagnetic (AEM) data were flown over the
Horn River basin in April 2011. The data was collected over the 4 blocks shown in Figure 1. The data in
block 3, considered in this study, are publically available on the Geoscience BC website and the survey
is described in Anglin, 2011. The SkyTEM AEM system was selected for this study because of its global
success mapping groundwater resources. It is a unique time-domain electromagnetic (TDEM) system
that offers a multi-moment transmitter capable of concurrently resolving both near surface and
features at depth and low noise characteristics that make possible the detection of subtle contrasts
critical for mapping aquifers.
The survey was flown with the objective of using AEM data and models to better understand the near
surface groundwater resources in the Horn River Basin. During the course of interpretation, due to the
high quality of the data and resulting resistivity models, other important discoveries and applications
were developed from and for the AEM dataset.
Theory and/or Method
Quaternary age paleochannels are known to exist in the Horn River Basin and may present an
important source of water for industrial development. Nearby, in northwestern Alberta’s High Level
and Rainbow Lake areas, quaternary paleochannels are known to contain significant shallow gas
deposits which are both a resource and a possible hazard when drilling for deeper resources.
Understanding the structure of the quaternary age sediments overlying consolidated bedrock is of
considerable importance for operators in the Horn River Basin.
The SkyTEM 304 was employed for this project. All SkyTEM systems have a rigid frame and are
capable of transmitting with a dual-moment (Sørensen and Auken, 2004). In contrast to conventional
TDEM systems, SkyTEM systems have the receiver coil positioned slightly behind the transmitter
wire in a ‘null’ position, where the intensity of the primary field is minimized. SkyTEM, initially
designed for groundwater mapping and now employed for resource exploration and geotechnical
engineering solutions, employs two transmitter moments with different currents and different
numbers of transmitter wire turns. The low current, or low moment (LM) mode, with a moment of
3,000 NIA, is used to record early-time gates which constrain near-surface information, while the
high current, or high moment (HM) mode, with a moment of 120,000 NIA, improves the signal-to-
noise ratio at late time gates. The SkyTEM304 system flown for this study has a transmitter area of
314m2, and is intermediate between the SkyTEM 101 system, used for near-surface applications,
and the SkyTEM 512, designed for deeper investigations. The SkyTEM 304 system records time gates
from 3 μs to 7 ms. The correction of early-time data for the residual primary field is done in more
recent SkyTEM surveys, and permits the use of data as early as 2-3 μs, thus improving near-surface
resolution (Schamper et al. 2013). All SkyTEM systems are equipped with several devices enabling

GeoConvention 2014: Integration 3
complete modelling of the movement of the system in the air facilitating excellent high resolution
images of the subsurface. (Auken et al. 2009)
AEM inversion is a quantitative method that produces a resistivity model of the earth consistent
with the airborne observations and capable of stably resolving considerable subsurface detail. The
program EM1DTM was used to simultaneously invert both high and low moment SkyTEM data for
the vertical resistivity structure of the earth. The program EM1DTM is one of the most flexible EM
inversion programs currently available, providing the ability to statistically deal with data outliers
using L1 measures of data misfit and to recover L2 ‘smooth’ or L1 ‘blocky’ or any intermediate
models as required. Mira Geoscience provides EM inversion processing using specialized techniques
and experienced processors resulting in reliable, interpretable models of subsurface resistivity. An
example of SkyTEM EM profile data and the inverted resistivity model result is provided in Figure 2.
Figure 2: SkyTEM high moment EM profile data (above) and inversion model below. The location of the well d-66-f is shown with the deep resistivity profile M2RX in green.

GeoConvention 2014: Integration 4
Figure 3 Right: simplified geology log. Left: M2RX deep resistivity log (green) and the SkyTEM inverted resistivity model profile extracted along the well path (yellow).
GeoConvention 2014: Integration 5
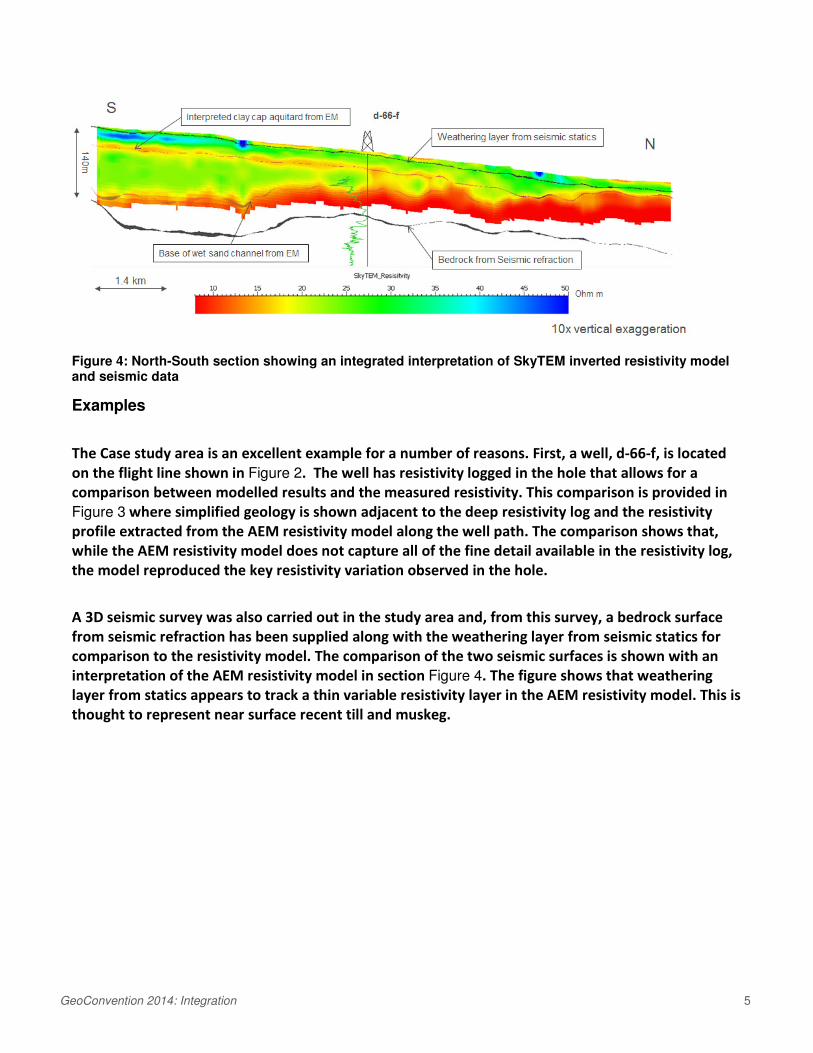
Figure 4: North-South section showing an integrated interpretation of SkyTEM inverted resistivity model and seismic data
Examples
The Case study area is an excellent example for a number of reasons. First, a well, d-66-f, is located
on the flight line shown in Figure 2. The well has resistivity logged in the hole that allows for a
comparison between modelled results and the measured resistivity. This comparison is provided in
Figure 3 where simplified geology is shown adjacent to the deep resistivity log and the resistivity
profile extracted from the AEM resistivity model along the well path. The comparison shows that,
while the AEM resistivity model does not capture all of the fine detail available in the resistivity log,
the model reproduced the key resistivity variation observed in the hole.
A 3D seismic survey was also carried out in the study area and, from this survey, a bedrock surface
from seismic refraction has been supplied along with the weathering layer from seismic statics for
comparison to the resistivity model. The comparison of the two seismic surfaces is shown with an
interpretation of the AEM resistivity model in section Figure 4. The figure shows that weathering
layer from statics appears to track a thin variable resistivity layer in the AEM resistivity model. This is
thought to represent near surface recent till and muskeg.

GeoConvention 2014: Integration 6
Figure 5: Comparison to 3D seismic bedrock surface to AEM base of sand interpretation. Perspective view from above and from the NE. Above: bedrock from seismic. Below: interpreted base of wet sand from resistivity shown with bedrock from seismic.
Below the weathering layer the AEM resistivity model shows considerable and significant detail. A
thin, continuous conductive layer (red) is imaged throughout the property at a depth ranging from
15-25m as shown in Figure 4. This layer is thought to represent a thin lacustrine clay horizon which
has the potential to be an aquitard. Below this clay cap, over most of the property, a relatively
resistive and variable thickness layer is imaged below (green). Below this layer the model resistivity
drops to relatively low values ( < 10 Ωm ) before the depth of investigation of the system is reached.
The layers below the clay cap are interpreted to represent water charged quaternary paleochannels
overlying a basal quaternary clay fill. The shapes of these sand channels are very similar to the
seismic refraction image of the consolidated bedrock as shown in Figure 5 (which largely occurs at a
depth below the depth of investigation of the AEM survey). Both the AEM resistivity model and the
bedrock from seismic refraction image the dendritic pattern of the river valley system.
From the AEM resistivity model the sand channel’s resistivity and thicknesses can be estimated.
Figure 6 shows the resistivity-thickness product in the quaternary channel as an indication of the
potential for contained water. Areas with greater resistivity-thickness are likely to result in more
productive water wells from the Quaternary sediments.

GeoConvention 2014: Integration 7
Well d-66-f experienced artesian water flow from the quaternary. Based on this information and,
given that the clay cap confining the aquifer below has been imaged as a continuous layer
throughout the property, we are able to predict the artesian flow on the property, as shown in
Figure 6. Given a pressure reading at the well head, the interpretation could be extended to provide
artesian water pressure over the entire property using the geometry of the confining layer and the
location of the reservoir.
A complete geological interpretation of the quaternary can be assembled from the combined
seismic and AEM data and the interpretation is provided in Figure 7.
This geological configuration is highly reminiscent of the geology observed in the nearby Rainbow
Lake and High Level area where lacustrine clay caps in the quaternary trap significant accumulations
of shallow gas in underlying quaternary paleochannels . Napier et al, 2005 showed significant
shallow gas accumulations in this setting appear as comparatively high resistivity zones within the
quaternary with AEM resistivity model values ranging from 200 Ωm to more than 1000 Ωm in some
areas. No resistivities greater than 50 Ωm were observed within the channels identified in this study,
indicating that it is unlikely that the channels are gas-charged anywhere within the property.
Figure 6: Left: Prediction for location of artesian water flow from the quaternary. Right: Resistivity-Thickness of interpreted quaternary sand channel as an indication of contained water.

GeoConvention 2014: Integration 8
Figure 7: Property wide interpreted stratigraphy of the quaternary.
Conclusions
A multi moment AEM system (SkyTEM) along with a carefully applied EM inversion modelling
workflow is capable of providing both near surface resolution (aggregates, engineering materials) as
well as the ability to map targets at depth (sand channels, clay caps) and does a good job of
discriminating lateral resistivity contrasts and layering. Furthermore, subsequent to this work, SkyTEM
has developed much more powerful systems capable of achieving greater depths of investigation
without comprising the level of detail. This makes the combination of SkyTEM and EM inversion even
more effective than shown in this study.
This study has demonstrated a good correlation between inversion models of SkyTEM airborne TDEM
data, well logs and seismic data. A 3D integrated interpretation of AEM inversion models provides
complimentary information to the seismic dataset and allows a complete interpretation of the
quaternary sequence, which is not possible with seismic alone.
The interpretation shows similarities to previous work by Napier et al, 2005 in nearby NW Alberta
showing that AEM can/should be considered as a tool for detecting, mapping and discriminating
between water and gas filled quaternary channels.
The 3D interpretation provides a number of verifiable predictions: prediction for the location of ground
water resources, prediction for the location of artesian water flow from the quaternary, prediction for
the presence (absence) of shallow gas on the property, and a prediction for locations of near surface
coarse materials for engineering applications.
Acknowledgements
The authors would like to thank Geoscience BC for making the AEM data and other background
materials publically available.

GeoConvention 2014: Integration 9
An independent oil and gas company has been essential in providing data and insight into the
modelling results.
References
Anglin, L. (2012, March). Examining Water Sources in NE BC in Support of Responsible Development of Unconventional Gas. Geoscience BC.
Auken E etal (2009) An integrated processing scheme for high-resolution airborne electromagnetic surveys, the SkyTEM system. Exploration Geophysics, 2009, 40, 184–192.
Napier, S., Oldenburg, D., Cristall, J. (2005). EM geophysics for hydrocarbons: Inversion applications and current research at UBC-GIF. Presented at the CSEG annual meeting, Calgary, AB.
Schamper, C., Auken, E., and Sørensen, K.I., 2013, Coil response inversion for very early time modeling of helicopter-borne time-domain EM data and mapping of near-surface geological layers: Geophysical Prospecting, v. Submitted after revision. Sørensen, K.I., and Auken, E., 2004, SkyTEM - A new high-resolution helicopter transient electromagnetic system: Exploration Geophysics, 35, no. 3, p. 191–199.
EM1DTM; A Program Library for Forward Modelling and Inversion of Time Domain Electromagnetic Data over 1D Structures,
version 1.0. Developed by the UBC-Geophysical Inversion Facility, Department of Earth and Ocean Sciences, University of
British Columbia, Vancouver, British Columbia.