APPLICATION OF ALGAE IN AIR POLLUTION CONTROL TECHNIQUEethesis.nitrkl.ac.in/7439/1/121.pdf ·...
30
APPLICATION OF ALGAE IN AIR POLLUTION CONTROL TECHNIQUE A THESIS SUBMITTED IN PARTIAL FULFILMENT OF THE REQUIREMENT FOR THE DEGREE OF BACHELOR OF TECHNOLOGY IN CIVIL ENGINEERING BY SMITA SAROJINI BAGH DEPARTMENT OF CIVIL ENGINEERING NATIONAL INSTITUE OF TECHNOLOGY ROURKELA, 769008
Transcript of APPLICATION OF ALGAE IN AIR POLLUTION CONTROL TECHNIQUEethesis.nitrkl.ac.in/7439/1/121.pdf ·...
APPLICATION OF ALGAE IN AIR POLLUTION CONTROL
TECHNIQUE
A THESIS SUBMITTED IN PARTIAL FULFILMENT OF THE
REQUIREMENT FOR THE DEGREE OF
BACHELOR OF TECHNOLOGY
IN
CIVIL ENGINEERING
BY
SMITA SAROJINI BAGH
DEPARTMENT OF CIVIL ENGINEERING
NATIONAL INSTITUE OF TECHNOLOGY
ROURKELA, 769008
APPLICATION OF ALGAE IN AIR POLLUTION CONTROL
TECHNIQUE
A THESIS SUBMITTED IN PARTIAL FULFILMENT OF THE
REQUIREMENT FOR THE DEGREE OF
BACHELOR OF TECHNOLOGY
IN
CIVIL ENGINEERING
BY
SMITA SAROJINI BAGH
UNDER GUIDANCE OF
PROF.K.K.PAUL
DEPARTMENT OF CIVIL ENGINEERING
NATIONAL INSTITUE OF TECHNOLOGY
ROURKELA, 769008
CERTIFICATE
This is to certify that the thesis entitled “application of algae in air pollution
control technique” submitted by Smita Sarojini Bagh Roll no-111ce0027 in
partial fulfilment of the requirements for the award of Bachelor of Technology
degree in Civil Engineering at National Institute of Technology, Rourkela is an
authentic work carried out by her under my supervision and guidance.
To the best of my Knowledge, the matter embodied in this thesis is not been
submitted to any other university/institute for any Degree or Diploma
Date: (Prof.K.K.Paul)

ACKNOWLEDGEMENT
My heart pulsates with the thrill for tendering gratitude to those who helped me
in completion of project.
The most pleasant point of presenting a thesis is the opportunity to thank those
who have contributed to it. Unfortunately the list of expression of thank no
matter how extensive is always incomplete and inadequate. Indeed this page of
acknowledgement shall never be able to touch the horizon of generosity of those
who tendered their help to me.
First and foremost, I express my sincere gratitude and indebtedness to Prof.
K.K.Paul for her kindness in allowing me for introducing present topic and for
her inspiring guidance, constructive criticism and valuable suggestions
throughout this project work. I am sincerely thankful to her able guidance and
pain taking my effort in improving my understanding of this project.
I am also thankful to Dipayan Priyadarshi and Naga Chaitanya kavuri for their
valuable suggestion and encouragement in various stages of work.
Last but not the least my sincere thanks to all my friends who have patiently
extended all sorts of help for accomplishing this undertaking.
Date: Smita Sarojini Bagh
Department of civil engineering
National Institute of Technology
Rourkela, 769008
Contents
LIST OF TABLES ............................................................................................. 6
LIST OF FIGURES: .......................................................................................... 6
ABSTRACT ...................................................................................................... 7
CHAPTER 1: ..................................................................................................... 8
INTRODUCTION ............................................................................................. 8
CHAPTER 2 .................................................................................................... 10
LITERATURE REVIEW ................................................................................ 10
OBJECTIVE .................................................................................................... 13
CHAPTER 3 .................................................................................................... 14
METHODOLGY ............................................................................................. 14
3.1 SAMPLE COLLECTION ....................................................................... 15
3.2Design of filter bed: ................................................................................. 16
3.3 Filter bed with algae: .............................................................................. 17
3.4 Production of Hydrogen sulphide: ........................................................... 17
3.5 Determination of concentration of pollutant H2S ..................................... 19
3.6 Pollutant removal by Filter bed ............................................................... 19
3.7 Pollutant removal by filter bed with algae ............................................... 20
Pollutant removal efficiency calculation: ...................................................... 20
CHAPTER4: .................................................................................................... 21
OBSERVATIONS ........................................................................................... 21
CHAPTER 4 .................................................................................................... 24
RESULTS AND DISCUSSION ...................................................................... 24
CHAPTER 5 .................................................................................................... 26
CONCLUSION ............................................................................................... 26
CHAPTER 7 .................................................................................................... 28
REFERENCES ................................................................................................ 28
LIST OF TABLES
Table 1; Ambient air quality standard .............................................................. 12
Table 2: Code of safety of hydrogen sulphide .................................................. 12
Table 3: Size of filter bed ................................................................................ 16
Table 4:Determination of Initial concentration of H2 S ..................................... 22
Table 5: concentration of H2 S after passing through filter bed only ................. 22
Table 6: Concentration of H2S after passing through filter bed with algae ....... 22
Table 7: Removal efficiency by only filter bed without algae .......................... 23
Table 8: Efficiency of filter bed with algae in removal of air pollutant H2S ..... 23
LIST OF FIGURES:
Figure A: algae collected in bottle are allowed to settle down. ......................... 15
Figure B: coconut fibre filter bed of surface area 45.83 cm2 ............................ 16
Figure C: Filter bed with algae ......................................................................... 17
Figure D: Kipp’s apparatus .............................................................................. 18

ABSTRACT
Air pollution is creating alarming situation day by day. Various primary and secondary air
pollutants are the reasons behind it which are formed by various stimuli. To overcome the
threats various control technologies like cyclonic separation, various scrubbers,
hydrodynamic separator etc were used. One more method bio-filtration is used which uses
living micro or macro organisms to biodegrade waste or harmful constituents. Air pollutants
can be removed by the process of bio filtration. Aim of the project is to use algae in air
pollution control technique and determine its efficiency when coconut fibres were used as
filter bed. Hydrogen sulphide was prepared by Kipp’s apparatus. Filter bed of coconut coir
was designed. Known concentration of hydrogen sulphide was passed through filter bed and
concentration of passed air was measured by iodometric method. The collected algae were
spread in filter bed. The known concentration of hydrogen sulphide was then passed through
this filter bed consisting algae and passed air’s final concentration was again determined. The
efficiency of only filter bed was found to be 62.52% and filter bed with algae was
70.66%.Algae can be successfully used in air pollution control technique.
Keywords: Air pollution, Air quality standard, Algae, Coconut fibre bed, Hydrogen
sulphide, Kipp’s apparatus, Pollutants

CHAPTER 1:
INTRODUCTION
1.1 INTRODUCTION
Air pollution is growing day by day and it threat is becoming a challenge which we need to
overcome. Every life form one way or another is getting affected by this threat. Air pollution
are caused by various pollutant may it be primary like sulphur dioxide, carbon monoxide,
volatile organic compounds, chlorofluorocarbons CFCs etc or secondary like ozone,
peroxyacytele nitrate (PAN). Each pollutant has its own threats to us, out of which some
creates grave danger to human life. According to IS code 15200-2002 code of safety for
hydrogen sulphide, when it exceeds the permissible limit of 10 ppm is fatally poisonous gas
which affects respiratory tract, even causes skin irritations and eye itchiness. To check threats
by pollutants various methods like absorption, adsorption, bio filtration etc are there. Bio-
filtration technique is one of most efficient technique which takes microorganisms in action
to treat polluted air. This bio filtration technique has used bacteria and fungi in bio film. We
have algae in tremendous quantity and these algae are very much efficient in capturing
carbon dioxide and using that in their further growth. Algae’s contribution in Oxygen
concentration is very well known and appreciated. So why not to use algae for air pollution
control technique? So aim of this project is to use these algae and observe if they can treat
polluted air. For that we first need to produce known concentration of any pollutant.
Hydrogen sulphide can be produced by Kipp’s apparatus using sulphuric acid and ferrous
sulphate (John wiley & sons, 1900). To know the concentration of produced hydrogen
sulphide iodometric back titration method can be done. The bio filter bed can be produced
using various material like wood chips, peat, plastic media of different shapes, glass etc. In
this method, coconut fibre has been used to prepare filter bed. The algae were collected from
local ponds and used for filtration.

CHAPTER 2
LITERATURE REVIEW

2.1 LITERATURE REVIEW
In this section the literature meeting the goal of study i.e. application of algae in air pollution
control technique is reviewed. Algae create more than 70% of oxygen by photosynthesis.
Algae seem to have the capacity to ingest carbon dioxide, nitrogen dioxide and sulphur
dioxide. Moreover carbon dioxide escalates their growth to further extent. Algae have more
photosynthetic efficiency than plants and herbs so they are more able to catch carbon dioxide.
Various plants discharges high rate of carbon dioxide like coal terminated plants. In this cases
if we can incorporate algae in filtration media than we will be in side of benefit.
Studying the remarks by (Munoz et al, 2009) wastewater can be used as microalgae
supplement and algal biomass could get the opportunity to be, soon, a budgetary and suitable
material for specific removal of heavy metals from waste water.
Vent gasses from various plants are culprit for creating more than 7% of the aggregate world
CO2 generation mechanical fumes gasses contains up to 15% CO2.
(Cheng et al. (2006)) concentrated on carbon dioxide expulsion from air by microalgae
refined in a layer photograph bioreactor. He found that the photosynthetic CO2 obsession was
unequivocally subject to the amassing of CO2 consistently gave amid the algal development.
In light of study by Keiun Kodo, Yasumasa Kodo, Makoto Tsuruoka(1998) a system for
cleansing a sullied air by using green growth development, for instance, Spirulina is fit for
decreasing carbon dioxide (CO2), nitrogen oxide (NOx) and/or sulfur oxide (SOx) in the
dirtied air and creating oxygen. That is, this structure includes a general public tank stacked
with a general public fluid including the green development, an air supply unit for convincing
the polluted air into the lifestyle fluid to separate carbon dioxide and nitrogen oxide and/or
sulphur oxide in the lifestyle fluid, and a lighting unit for radiating a light to the lifestyle
fluid. By exuding the light to the lifestyle fluid in the region of carbon dioxide,
photosynthesis of the green development is raised to change over carbon dioxide into oxygen.
Besides, the green development uses the nitrogen oxide and/or sulphur oxide as a supplement
in the midst of the photosynthesis. In this way, the present system can adequately refine the
debased air to make a cleaner air, which is rich in oxygen. (Fun et. al., 2011) prepared bio-
powers from green growth extraordinarily biodiesel. The quick advantage of green growth is
growing step by step
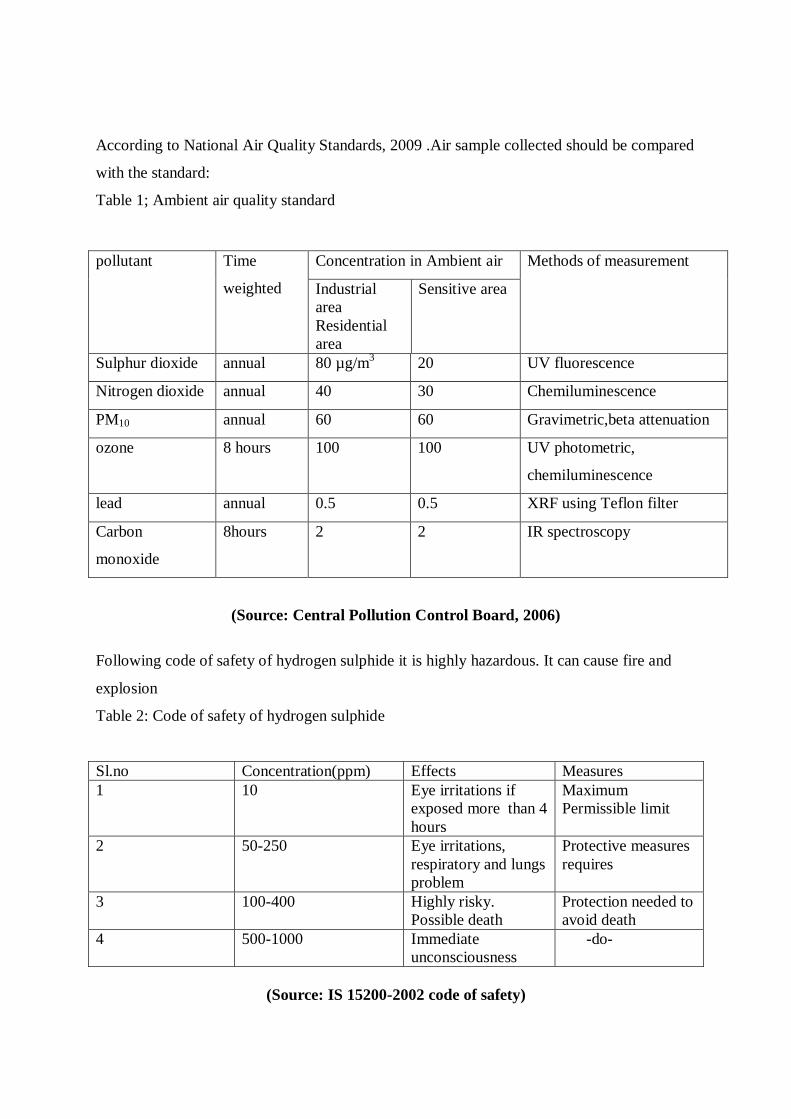
According to National Air Quality Standards, 2009 .Air sample collected should be compared
with the standard:
Table 1; Ambient air quality standard
pollutant Time
weighted
Concentration in Ambient air Methods of measurement
Industrial
area
Residential
area
Sensitive area
Sulphur dioxide annual 80 µg/m3 20 UV fluorescence
Nitrogen dioxide annual 40 30 Chemiluminescence
PM10 annual 60 60 Gravimetric,beta attenuation
ozone 8 hours 100 100 UV photometric,
chemiluminescence
lead annual 0.5 0.5 XRF using Teflon filter
Carbon
monoxide
8hours 2 2 IR spectroscopy
(Source: Central Pollution Control Board, 2006)
Following code of safety of hydrogen sulphide it is highly hazardous. It can cause fire and
explosion
Table 2: Code of safety of hydrogen sulphide
Sl.no Concentration(ppm) Effects Measures
1 10 Eye irritations if
exposed more than 4
hours
Maximum
Permissible limit
2 50-250 Eye irritations,
respiratory and lungs
problem
Protective measures
requires
3 100-400 Highly risky.
Possible death
Protection needed to
avoid death
4 500-1000 Immediate
unconsciousness
-do-
(Source: IS 15200-2002 code of safety)

OBJECTIVE
The objective of the present study is to design the coconut filter bed in treating hydrogen
sulphide gas. Also, to treat hydrogen sulphide gas by coconut fibre bed with wild algae.

CHAPTER 3
METHODOLGY

3.1 SAMPLE COLLECTION
Collection of wild algae:
Collection of algae: plastic bottle can be taken which was first de-chlorinated. Using
the bottle algae was collected along with water. Algae were allowed to settle down
when left overnight.
The flasks petridishes all which is to be used when working with algae were sterilised
using autoclave at 121oC for 15 min at 15 psi. And were allowed to cool (Atlas, 2010)
The collected algae was sterilised too. And antifungal was then added about 1gm.
The collected algae can be further divided to number of algal broths were nutrients
can be provide for further growth of algae. The broth can be left for incubation in
room temperature.
Figure A: algae collected in bottle are allowed to settle down.

3.2Design of filter bed:
Coconut fibre is collected. The fibre (10-15cm) is given a proper shape when compressed.
Figure B: coconut fibre filter bed of surface area 45.83 cm2
Table 3: Size of filter bed
Filter bed no
surface area(cm2)
Thickness(cm)
1
153.15
0.5
2 45.83 2.2
3 38.48 1.8
4 12.56 0.5
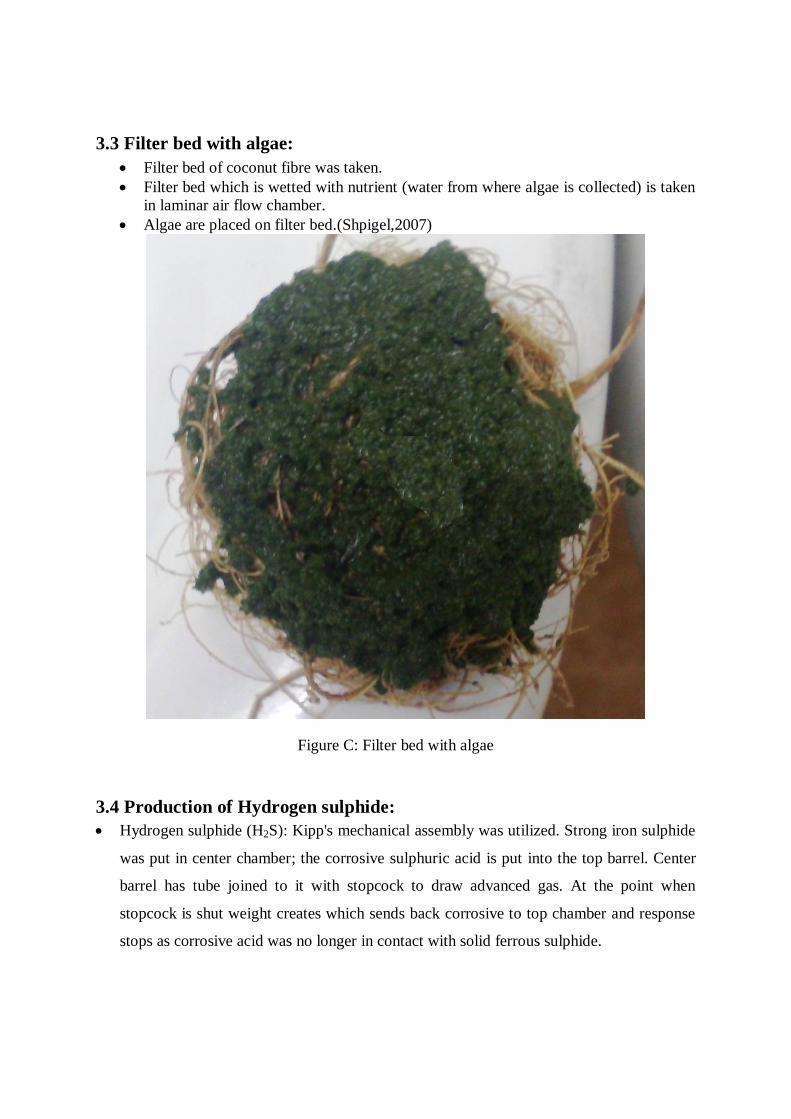
3.3 Filter bed with algae:
Filter bed of coconut fibre was taken.
Filter bed which is wetted with nutrient (water from where algae is collected) is taken
in laminar air flow chamber.
Algae are placed on filter bed.(Shpigel,2007)
Figure C: Filter bed with algae
3.4 Production of Hydrogen sulphide:
Hydrogen sulphide (H2S): Kipp's mechanical assembly was utilized. Strong iron sulphide
was put in center chamber; the corrosive sulphuric acid is put into the top barrel. Center
barrel has tube joined to it with stopcock to draw advanced gas. At the point when
stopcock is shut weight creates which sends back corrosive to top chamber and response
stops as corrosive acid was no longer in contact with solid ferrous sulphide.
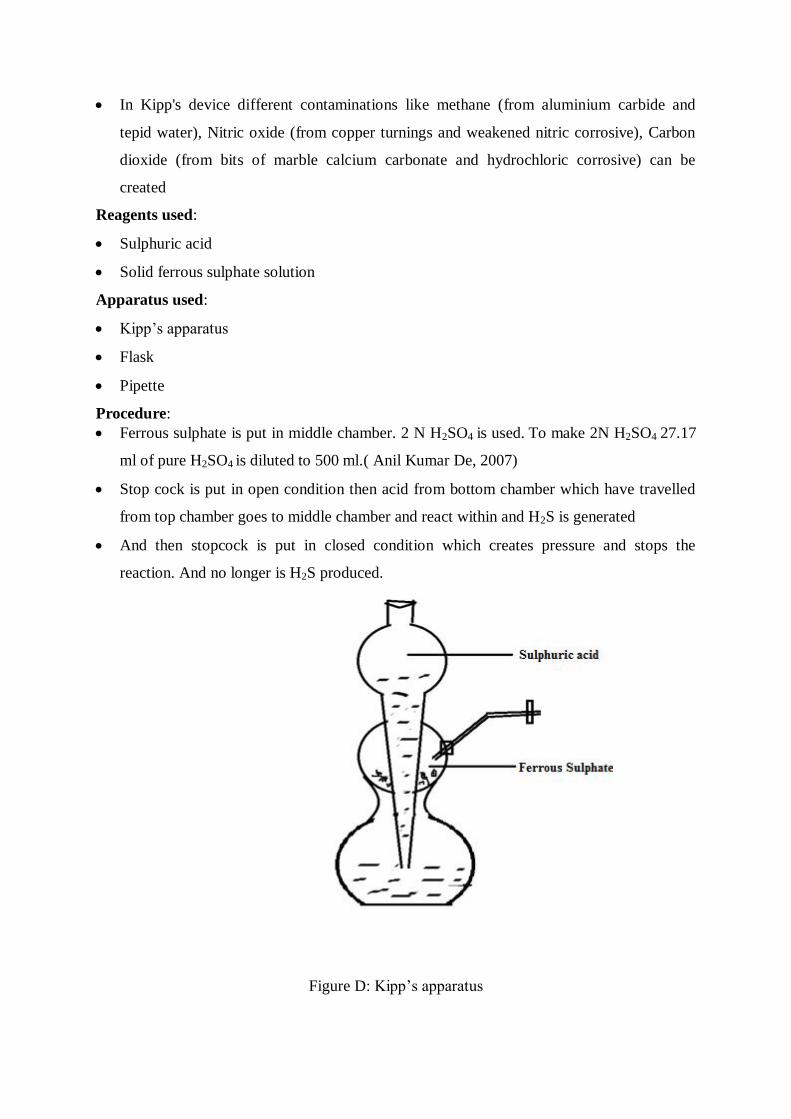
In Kipp's device different contaminations like methane (from aluminium carbide and
tepid water), Nitric oxide (from copper turnings and weakened nitric corrosive), Carbon
dioxide (from bits of marble calcium carbonate and hydrochloric corrosive) can be
created
Reagents used:
Sulphuric acid
Solid ferrous sulphate solution
Apparatus used:
Kipp’s apparatus
Flask
Pipette
Procedure:
Ferrous sulphate is put in middle chamber. 2 N H2SO4 is used. To make 2N H2SO4 27.17
ml of pure H2SO4 is diluted to 500 ml.( Anil Kumar De, 2007)
Stop cock is put in open condition then acid from bottom chamber which have travelled
from top chamber goes to middle chamber and react within and H2S is generated
And then stopcock is put in closed condition which creates pressure and stops the
reaction. And no longer is H2S produced.
Figure D: Kipp’s apparatus

3.5 Determination of concentration of pollutant H2S
Iodometric back titration method was used. [IS 11255 (part 4)-2006]
Reagents used:
Cadmium chloride solution: it was prepared adding 10g CdCl 2 in 450 ml water. And 10
ml 0.5N sodium hydroxide solution is added
Iodine solution(0.025N):20-25g potassium iodide was added in little water. Then 3.2 g
iodine is added and was allowed to dissolve.the sample was diluted to 1000ml.
Standard sodium thiosulphate solution (0.0250N): 6.205g sodium thiosulphate
pentahydrate (Na2S2O3.5H2O) and 0.4 g solid sodium hydroxide is added. Then the
sample is diluted to 1000ml.
Starch indicator: 2g soluble starch and 0.2 g salicylic acid is taken.these are added in
100ml hot distilled water.
Procedure:
Flasks containing 30 ml absorber i.e. cadmium chloride solution were taken
H2s was passed through these absorber
Sample was titrated with excess of potassium iodine solution. Reading is noted as A when
yellow colour is achieved. End point is checked by HCl.
After 10 min it was back titrated with 0.025N sodium thiosulphate solution.colour
disappeared and starch solution is used as indicator.
Observations were noted in table 3.
Hydrogen sulphide concentration is measured by equation 1.
H2S
... ... ( 1)
Where
A=Volume of iodine solution
B=Normality of iodine solution
C=volume of sample taken
3.6 Pollutant removal by Filter bed:
Initial concentration of H2S was found from Table 4.
Air passed through filter bed was then passed through absorbing solution to check the
concentration of H2S
The Iodometric method is used again to find the concentration of hydrogen sulphide.
The readings were noted in table 5.
Removal efficiency of filter bed found from table 7.
3.7 Pollutant removal by filter bed with algae
Filter bed which is wetted with nutrient(water from where algae is collected) is taken in
laminar air flow chamber
There freshly collected algae is placed in filter bed.
H2S is passed through the filter media i.e.flter bed with wild algae.
It was left for 1 hour.
Then the gas passed through this media is collected and passed through absorbing
solution i.e. cadmium sulphate solution.
And iodometric method is followed to find the concentration of hydrogen sulphide passed
through filter media.
The final concentration of H2S was found from table 6.
Removal efficiency by filter bed with algae is calculated from table 9.
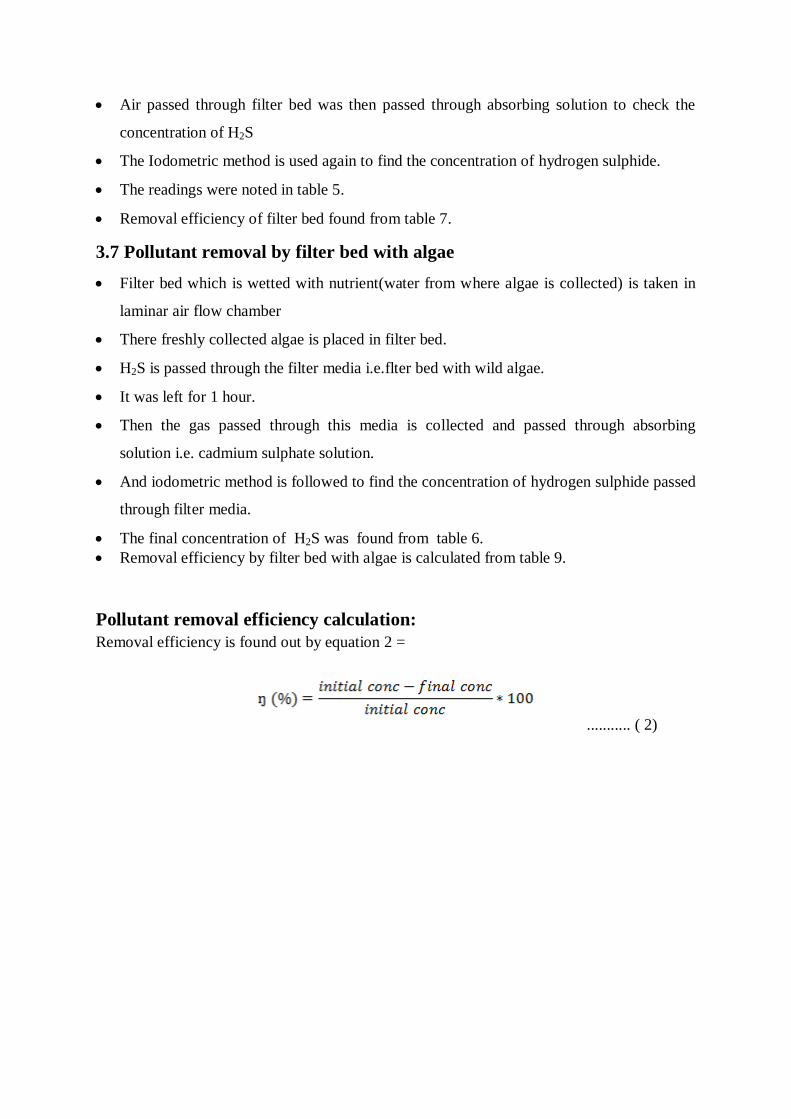
Pollutant removal efficiency calculation:
Removal efficiency is found out by equation 2 =
........... ( 2)

CHAPTER4:
OBSERVATIONS
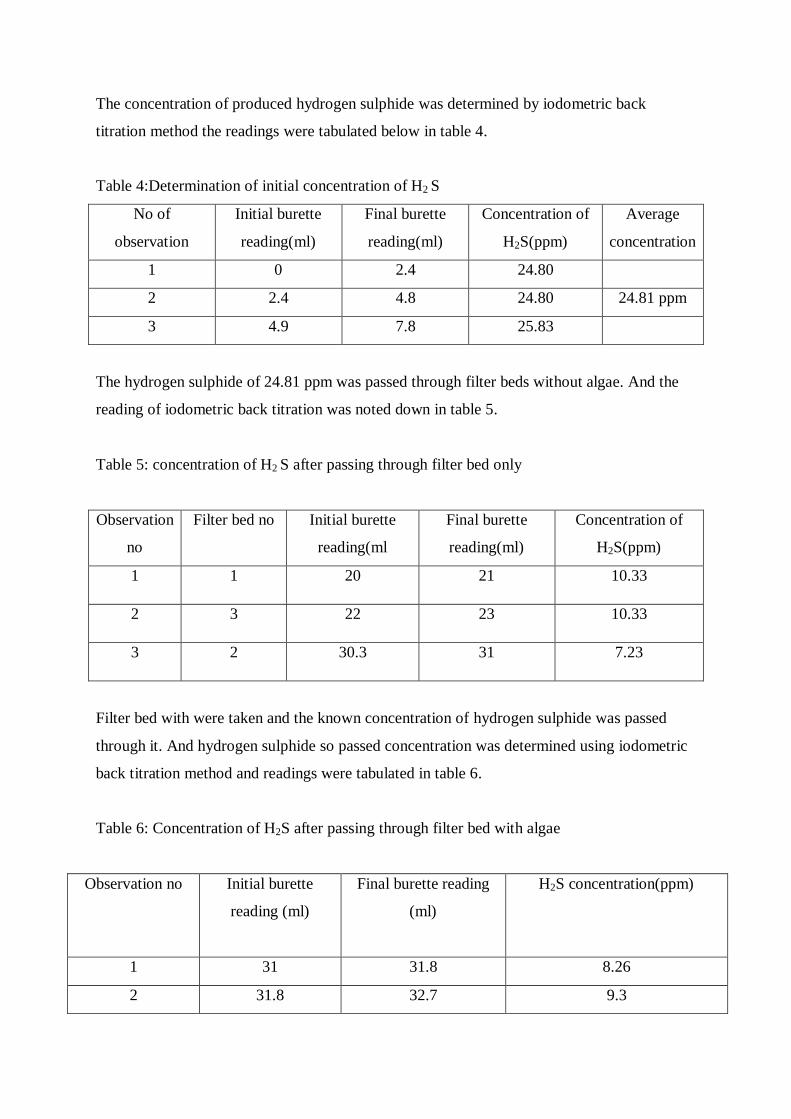
The concentration of produced hydrogen sulphide was determined by iodometric back
titration method the readings were tabulated below in table 4.
Table 4:Determination of initial concentration of H2 S
No of
observation
Initial burette
reading(ml)
Final burette
reading(ml)
Concentration of
H2S(ppm)
Average
concentration
1 0 2.4 24.80
2 2.4 4.8 24.80 24.81 ppm
3 4.9 7.8 25.83
The hydrogen sulphide of 24.81 ppm was passed through filter beds without algae. And the
reading of iodometric back titration was noted down in table 5.
Table 5: concentration of H2 S after passing through filter bed only
Observation
no
Filter bed no Initial burette
reading(ml
Final burette
reading(ml)
Concentration of
H2S(ppm)
1 1 20 21 10.33
2 3 22 23 10.33
3 2 30.3 31 7.23
Filter bed with were taken and the known concentration of hydrogen sulphide was passed
through it. And hydrogen sulphide so passed concentration was determined using iodometric
back titration method and readings were tabulated in table 6.
Table 6: Concentration of H2S after passing through filter bed with algae
Observation no Initial burette
reading (ml)
Final burette reading
(ml)
H2S concentration(ppm)
1 31 31.8 8.26
2 31.8 32.7 9.3
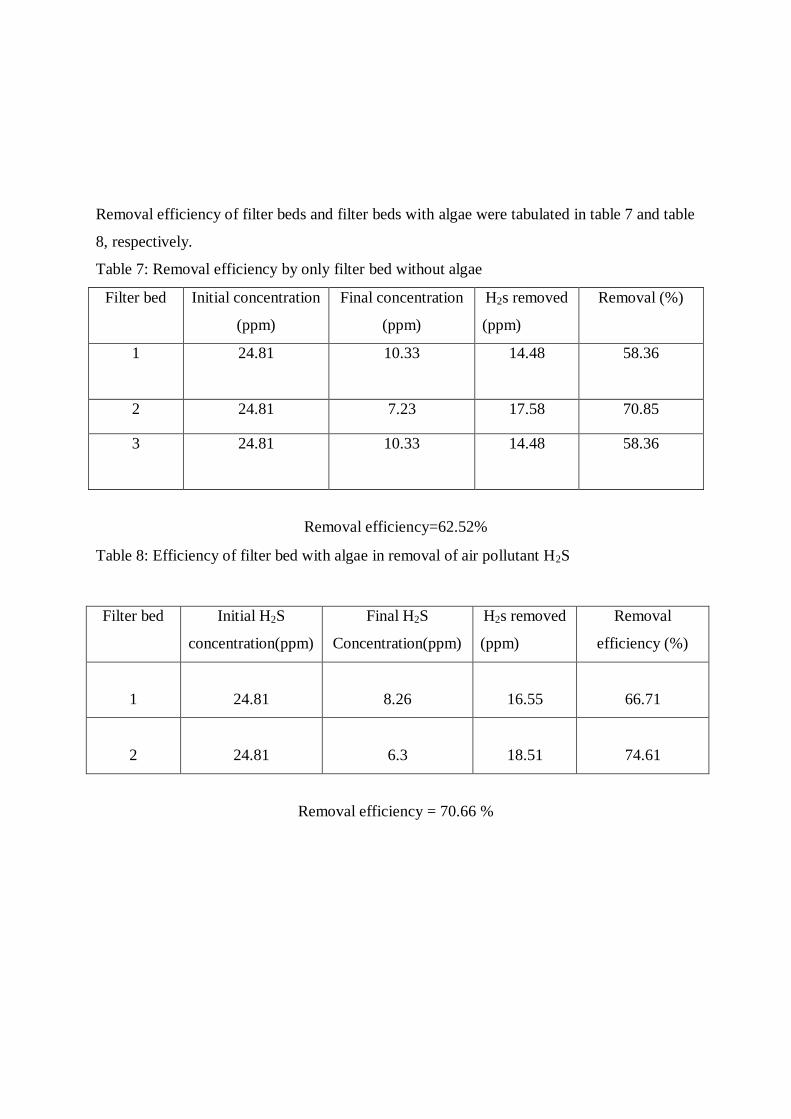
Removal efficiency of filter beds and filter beds with algae were tabulated in table 7 and table
8, respectively.
Table 7: Removal efficiency by only filter bed without algae
Filter bed Initial concentration
(ppm)
Final concentration
(ppm)
H2s removed
(ppm)
Removal (%)
1 24.81 10.33
14.48 58.36
2 24.81 7.23 17.58 70.85
3 24.81 10.33
14.48 58.36
Removal efficiency=62.52%
Table 8: Efficiency of filter bed with algae in removal of air pollutant H2S
Filter bed Initial H2S
concentration(ppm)
Final H2S
Concentration(ppm)
H2s removed
(ppm)
Removal
efficiency (%)
1
24.81
8.26
16.55
66.71
2
24.81
6.3
18.51
74.61
Removal efficiency = 70.66 %

CHAPTER 4
RESULTS AND DISCUSSION

4.1 Results and Discussion
From the above procedure initial concentration of hydrogen sulphide gas was found to be
24.81ppm which is exceeding the permissible limit prescribed by code of safety for hydrogen
sulphide gas IS 15200-2002. After passing the hydrogen sulphide through filter bed of
coconut fibre the final concentration of hydrogen sulphide was determined. The final
concentration of hydrogen sulphide passed through 1st filter bed of 153.15 cm
2 and thickness
0.5 cm was found to be 10.33 ppm. And hydrogen sulphide passed through 2nd
filter bed of
45.83 cm2 and thickness 2.2 cm was 7.23 ppm. The 1
st filter bed of coconut fibre was 12.5%
less efficient than 2nd
filter bed in removing hydrogen sulphide gas. In average filter bed of
coconut fibre was 62.52% efficient in removing hydrogen sulphide gas.
The 1st and 2
nd bed with algae removed 16.55 ppm and 18.51 ppm of hydrogen sulphide gas
respectively. In this case 2nd
filter bed was 7.9% more efficient in removing hydrogen
sulphide. In average removal efficiency of filter bed with algae was found 70.66%. The
produced hydrogen sulphide’s concentration was then brought down to 6.3ppm by 2nd
filter
bed which in safe range (IS 15200-2002) . In experimentation process maintaining humidity
is a challenge which can be overcome if water can be provided.

CHAPTER 5
CONCLUSION

CONCLUSION
The concentration of hydrogen sulphide gas produced was 24.81 ppm which was in toxic
range (IS 15200-2002) and hence, an attempt has been made to reduce its concentration
within permissible limit after passing through filter bed. The 2nd
filter bed with greater
thickness has been found to be more efficient in removing hydrogen sulphide gas. It showed
that when filter bed is having more volume it is able to remove better. So, depending upon
the required concentration, size of filter bed can be varied and can be used widely. Algae
when incorporated in filter bed the efficiency further increases. The efficiency of filter bed
with algae was found to be 70.66% whereas, without algae it was 62.52%. Thus, algae can be
successfully be used in air pollution control technique. This technique can be used in larger
area too to treat more air pollutants in large scale.

CHAPTER 7
REFERENCES
REFERENCES: 1. Anil Kumar De , A Text Book of Inorganic Chemistry,2007
2. Balendu Shekher Giri , Ki Hyun Kima, R.A. Pandey, Jinwoo Choc, Hocheol Songc,
Yoon Shin Kimd , Review of bio treatment techniques for volatile sulphur compounds
with an emphasis on di-methyl sulphide. January 2014,
3. Central Pollution Control Board 2006
4. D.C. ALLEN ,1952 Arch. Microbiol. 17:34.
5. David J.Nowak,Daniel E.Crane,Air Pollution Removal by urban trees and shrubs in
US:2010
6. Harriet wilson,Introduction to algae.2003
7. IS 15200-2002 Code of safety of hydrogen sulphide.
8. IS code 11255(part4)Determination of hydrogen sulphide and carbon disulphide from
stationary source
9. John Wiley &Sons, Introduction to chemical preparation 1900
10. Kathy F. Atkinson , Algae shows promise as pollution-fighter, fuel-maker
11. Mark Z. Jacobson, Review of solutions to global warming, air pollution, and energy
security June 2008
12. Matt smith, Sizing a bio filter,1995
13. MathewB.Gerhardt,F.Bailey.Green,Robert ,D.Newman,Tryg J.Lundquist,R.Blake
Treasan,William J.Oswald,Removal of selenium using a novel algal-bacterial process.
14. Maxwell B.Randa,David E.Cooper,Chee-Pan Woo Graham C.Fletcher,Kevin
A.Rolfe,Compost filters for H2S removal from anaerobic digestion and rendering
exhausts. February 1981
15. Neelam Arun, Shalini Gupta and D.P. Singh. Antimicrobial and antioxidant property
of commonly found microalgae spirulina platenesis,nostoc moscorum,and chlorella
pyrenoidosa against some pathogenic bacteria and fungi, August, 2012
16. P.M. Ndegw, A.N. Hristov, J. Arogo , R.E. Sheffield,A review of ammonia emission
mitigation techniques for concentrated animal feeding operations , March 2008
17. R.A. Pandey , S.N. Mudliar, S. Borgaokar National Environmental Engineering
Research Institute, Nehru Marg, Nagpur 440 020, India, Treatment of waste gas
containing diethyl disulphide (DEDS) in a bench scale bio-filter, February 2008
18. Ronald M. Atlas, Handbook of Microbiological Media,2010
19. Shpigel M, Microalgae, Macroalgae, and Bivalves as Biofilters, 2007

20. U.S.Department of health and human service, Guidelines for air sampling and
analytical method development and evalutation,1995
21. Vanda Villanyi, Environmental engineering book edited , ISBN 978-953-307-143-5,
2010
22. X.L. Zhang , S. Yana, R.D. Tyagi , R.Y. Surampalli , Odour control in lagoons
journal published: June 2012