Application of Activity Coefficient Models in VLE ... · 2.4.2UNIquac Functional group Activity...
10
DOI:10.23883/IJRTER.2018.4040.GBKO1 338 Application of Activity Coefficient Models in VLE Determination for Azeotropic System Using Othmer Type Ebulliometer Manojkumar M.S 1 , B. Sivaprakash 2 1 Department of Chemical Engineering, Annamalai University, Annamalai Nagar- 608002, India. Abstract: Vapour liquid equilibrium data are the basic need in the design of distillation columns. In the present study VLE prediction of four binary azeotropic systems namely ethanol-water, acetone-water, ethanol-benzene and methanol-water was carried out using UNIQUAC and UNIFAC models. UNIQUAC parameters of the chosen systems were computed using Newton Raphson’s technique. Computations of UNIFAC model were done using ASOG method. VLE predicted from these models was validated using experimentations carried out in Othmer VLE still and thermodynamic consistency test using Redlich Kiester method. It was observed that both models are able to fit the experimental VLE data for all the systems. The results show that all the four systems are minimum boiling azeotropes having positive deviation from ideality. Key words: Azeotrope, Non ideal system, Thermodynamic consistency, UNIFAC model UNIQUAC model. I. INTRODUCTION Industrial production of chemicals involves purification and recovery of the products, by- products and unreacted raw materials. Distillation is a commonly used method for purifying liquids and separating mixtures of liquids into their individual components [1]. It is clearly the dominating separation process, accounting for more applications than all the others combined (extraction, adsorption, crystallization, membrane-based technologies and so forth). Familiar examples include fractionation of crude oil into useful products such as gasoline and heating oil etc., distillation of crude fermentation broths into alcoholic spirits such as gin, vodka and many more [2]. Distillation columns consume more than 95% of the total energy used in separations in chemical process industries worldwide. Hence, design of distillation columns is a major concern of chemical engineers. Azeotropic phenomenon is often encountered in distillation operations which complicates the separation process by usual fractionation method. An azeotrope is a mixture of two or more liquids (chemicals) in such a ratio that its composition cannot be changed by simple distillation [3].This occur because, when an azeotrope is boiled, the resulting vapor has the same ratio of constituents as the original mixture. As their composition is unchanged by distillation, azeotropes are also called constant boiling mixtures [4]. The boiling temperature of an azeotrope is either less than the boiling point temperatures of any of its constituents (a positive azeotrope), or greater than the boiling point temperatures of any of its constituents (a negative azeotrope). The defining condition of azeotropic mixtures and physical phenomena leads to non-ideality [5]. VLE data are essential in the design of distillation columns for industrial applications. VLE computations using theoretical methods rather than experimentations are simpler and cheaper. The objective of the present investigation is to determine the VLE data using UNIQUAC and UNIFAC models for four azeotropic systems namely ethanol-water, acetone-water, ethanol- benzene and methanol-water. The VLE predicted by these models was validated using
Transcript of Application of Activity Coefficient Models in VLE ... · 2.4.2UNIquac Functional group Activity...
DOI:10.23883/IJRTER.2018.4040.GBKO1 338
Application of Activity Coefficient Models in VLE Determination
for Azeotropic System Using Othmer Type Ebulliometer
Manojkumar M.S1, B. Sivaprakash2
1Department of Chemical Engineering, Annamalai University,
Annamalai Nagar- 608002, India.
Abstract: Vapour liquid equilibrium data are the basic need in the design of distillation
columns. In the present study VLE prediction of four binary azeotropic systems namely
ethanol-water, acetone-water, ethanol-benzene and methanol-water was carried out using
UNIQUAC and UNIFAC models. UNIQUAC parameters of the chosen systems were
computed using Newton Raphson’s technique. Computations of UNIFAC model were done
using ASOG method. VLE predicted from these models was validated using experimentations
carried out in Othmer VLE still and thermodynamic consistency test using Redlich Kiester
method. It was observed that both models are able to fit the experimental VLE data for all the
systems. The results show that all the four systems are minimum boiling azeotropes having
positive deviation from ideality.
Key words: Azeotrope, Non ideal system, Thermodynamic consistency, UNIFAC model
UNIQUAC model.
I. INTRODUCTION Industrial production of chemicals involves purification and recovery of the products, by-
products and unreacted raw materials. Distillation is a commonly used method for purifying
liquids and separating mixtures of liquids into their individual components [1]. It is clearly the
dominating separation process, accounting for more applications than all the others combined
(extraction, adsorption, crystallization, membrane-based technologies and so forth). Familiar
examples include fractionation of crude oil into useful products such as gasoline and heating
oil etc., distillation of crude fermentation broths into alcoholic spirits such as gin, vodka and
many more [2]. Distillation columns consume more than 95% of the total energy used in
separations in chemical process industries worldwide. Hence, design of distillation columns is
a major concern of chemical engineers. Azeotropic phenomenon is often encountered in
distillation operations which complicates the separation process by usual fractionation
method. An azeotrope is a mixture of two or more liquids (chemicals) in such a ratio that its
composition cannot be changed by simple distillation [3].This occur because, when an
azeotrope is boiled, the resulting vapor has the same ratio of constituents as the original
mixture. As their composition is unchanged by distillation, azeotropes are also called constant
boiling mixtures [4]. The boiling temperature of an azeotrope is either less than the boiling
point temperatures of any of its constituents (a positive azeotrope), or greater than the boiling
point temperatures of any of its constituents (a negative azeotrope). The defining condition of
azeotropic mixtures and physical phenomena leads to non-ideality [5].
VLE data are essential in the design of distillation columns for industrial applications. VLE
computations using theoretical methods rather than experimentations are simpler and cheaper.
The objective of the present investigation is to determine the VLE data using UNIQUAC and
UNIFAC models for four azeotropic systems namely ethanol-water, acetone-water, ethanol-
benzene and methanol-water. The VLE predicted by these models was validated using
International Journal of Recent Trends in Engineering & Research (IJRTER) Volume 04, Issue 01; January - 2018 [ISSN: 2455-1457]
@IJRTER-2017, All Rights Reserved 339
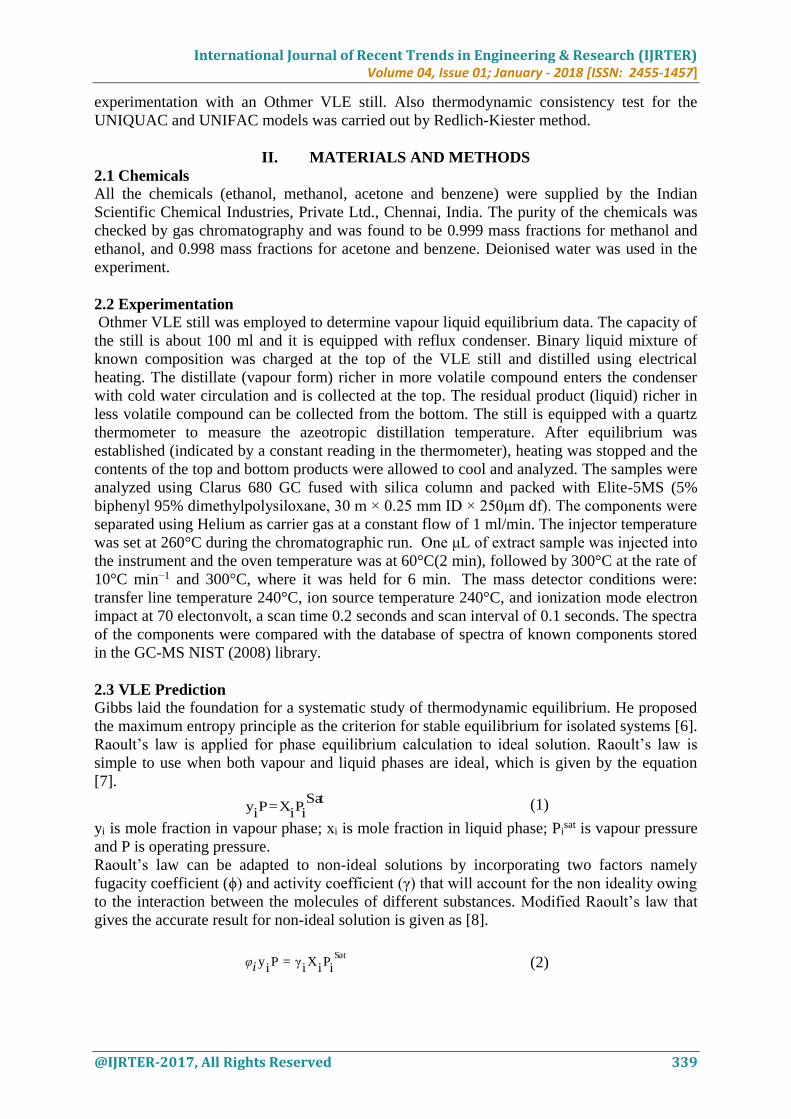
experimentation with an Othmer VLE still. Also thermodynamic consistency test for the
UNIQUAC and UNIFAC models was carried out by Redlich-Kiester method.
II. MATERIALS AND METHODS
2.1 Chemicals
All the chemicals (ethanol, methanol, acetone and benzene) were supplied by the Indian
Scientific Chemical Industries, Private Ltd., Chennai, India. The purity of the chemicals was
checked by gas chromatography and was found to be 0.999 mass fractions for methanol and
ethanol, and 0.998 mass fractions for acetone and benzene. Deionised water was used in the
experiment.
2.2 Experimentation
Othmer VLE still was employed to determine vapour liquid equilibrium data. The capacity of
the still is about 100 ml and it is equipped with reflux condenser. Binary liquid mixture of
known composition was charged at the top of the VLE still and distilled using electrical
heating. The distillate (vapour form) richer in more volatile compound enters the condenser
with cold water circulation and is collected at the top. The residual product (liquid) richer in
less volatile compound can be collected from the bottom. The still is equipped with a quartz
thermometer to measure the azeotropic distillation temperature. After equilibrium was
established (indicated by a constant reading in the thermometer), heating was stopped and the
contents of the top and bottom products were allowed to cool and analyzed. The samples were
analyzed using Clarus 680 GC fused with silica column and packed with Elite-5MS (5%
biphenyl 95% dimethylpolysiloxane, 30 m × 0.25 mm ID × 250μm df). The components were
separated using Helium as carrier gas at a constant flow of 1 ml/min. The injector temperature
was set at 260°C during the chromatographic run. One μL of extract sample was injected into
the instrument and the oven temperature was at 60°C(2 min), followed by 300°C at the rate of
10°C min−1 and 300°C, where it was held for 6 min. The mass detector conditions were:
transfer line temperature 240°C, ion source temperature 240°C, and ionization mode electron
impact at 70 electonvolt, a scan time 0.2 seconds and scan interval of 0.1 seconds. The spectra
of the components were compared with the database of spectra of known components stored
in the GC-MS NIST (2008) library.
2.3 VLE Prediction
Gibbs laid the foundation for a systematic study of thermodynamic equilibrium. He proposed
the maximum entropy principle as the criterion for stable equilibrium for isolated systems [6].
Raoult’s law is applied for phase equilibrium calculation to ideal solution. Raoult’s law is
simple to use when both vapour and liquid phases are ideal, which is given by the equation
[7]. Sat
iP
iX = P
iy (1)
yi is mole fraction in vapour phase; xi is mole fraction in liquid phase; Pisat is vapour pressure
and P is operating pressure.
Raoult’s law can be adapted to non-ideal solutions by incorporating two factors namely
fugacity coefficient (ϕ) and activity coefficient (γ) that will account for the non ideality owing
to the interaction between the molecules of different substances. Modified Raoult’s law that
gives the accurate result for non-ideal solution is given as [8].
Sat
iP
iX
iγ=P
iyiφ (2)
International Journal of Recent Trends in Engineering & Research (IJRTER) Volume 04, Issue 01; January - 2018 [ISSN: 2455-1457]
@IJRTER-2017, All Rights Reserved 340
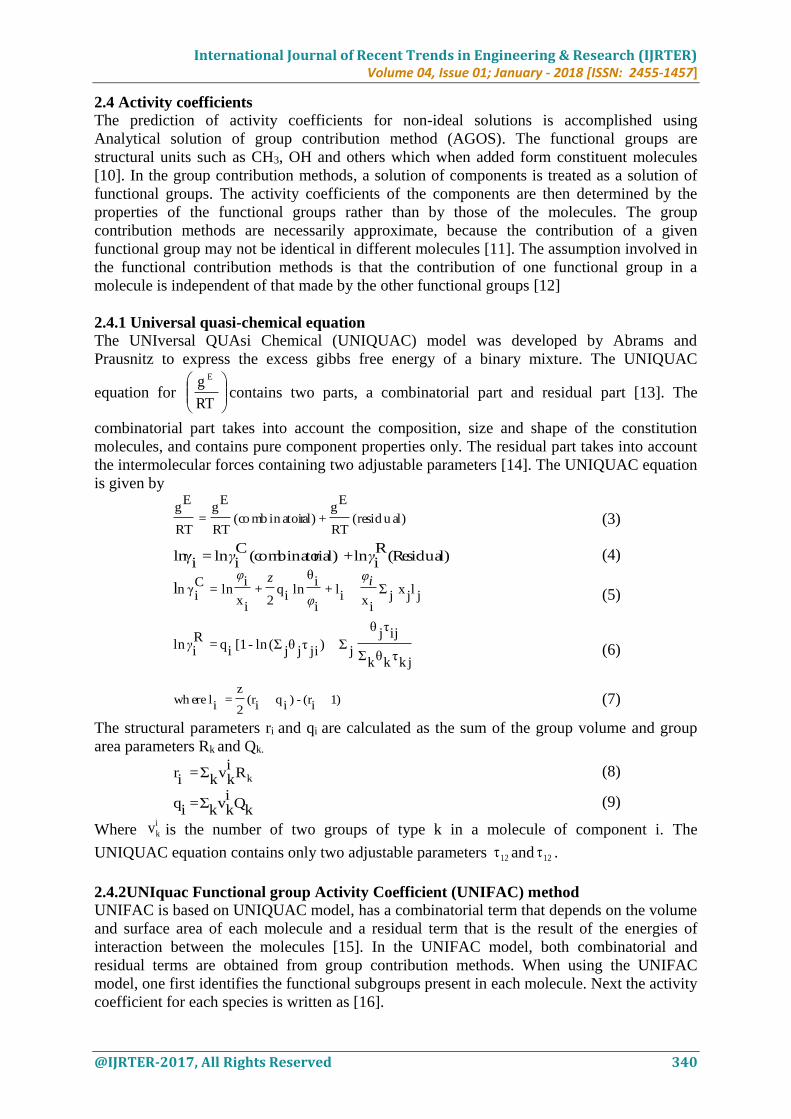
2.4 Activity coefficients
The prediction of activity coefficients for non-ideal solutions is accomplished using
Analytical solution of group contribution method (AGOS). The functional groups are
structural units such as CH3, OH and others which when added form constituent molecules
[10]. In the group contribution methods, a solution of components is treated as a solution of
functional groups. The activity coefficients of the components are then determined by the
properties of the functional groups rather than by those of the molecules. The group
contribution methods are necessarily approximate, because the contribution of a given
functional group may not be identical in different molecules [11]. The assumption involved in
the functional contribution methods is that the contribution of one functional group in a
molecule is independent of that made by the other functional groups [12]
2.4.1 Universal quasi-chemical equation
The UNIversal QUAsi Chemical (UNIQUAC) model was developed by Abrams and
Prausnitz to express the excess gibbs free energy of a binary mixture. The UNIQUAC
equation for
RT
g E
contains two parts, a combinatorial part and residual part [13]. The
combinatorial part takes into account the composition, size and shape of the constitution
molecules, and contains pure component properties only. The residual part takes into account
the intermolecular forces containing two adjustable parameters [14]. The UNIQUAC equation
is given by
resid u al)(RT
Eg
+ial)co mb in ato r(RT
Eg
=RT
Eg
(3)
(Residual)Ri
ln + )rial(combinato Ci
ln=i
lnγ γγ (4)
lj
lj
xj
Σ
ixi
l+
i
iθ
ln i
q2
+
ix
i ln=
Ci
γniφ
φ
zφ (5)
k jτ
kθ
kΣ
ijτ
jθ
jΣ)
jiτ
jθ
jΣ(ln -[1
iq =
Ri
ln γ (6)
)1i
(r - )i
qi
(r 2
z =
il wh ere (7)
The structural parameters ri and qi are calculated as the sum of the group volume and group
area parameters Rk and Qk.
kRik
vk
Σ = ir (8)
kQ
ik
vkΣ =
iq (9)
Where i
kv is the number of two groups of type k in a molecule of component i. The
UNIQUAC equation contains only two adjustable parameters 12τ and 12τ .
2.4.2UNIquac Functional group Activity Coefficient (UNIFAC) method
UNIFAC is based on UNIQUAC model, has a combinatorial term that depends on the volume
and surface area of each molecule and a residual term that is the result of the energies of
interaction between the molecules [15]. In the UNIFAC model, both combinatorial and
residual terms are obtained from group contribution methods. When using the UNIFAC
model, one first identifies the functional subgroups present in each molecule. Next the activity
coefficient for each species is written as [16].

International Journal of Recent Trends in Engineering & Research (IJRTER) Volume 04, Issue 01; January - 2018 [ISSN: 2455-1457]
@IJRTER-2017, All Rights Reserved 341
(residual) i
ln + rial)(combinato i
ln=i
ln γγγ (10)
The combinatorial term is evaluated using equation (5). However, the residual term is also
evaluated by a group contribution method, so that the mixture is envisioned as a mixture of
functional groups, rather than of molecules .The residual contribution to the logarithm of the
activity coefficient of group k in the mixture, ln Γk is computed from the group contribution
analog of ‘equation 6’ which can be written as [17].
]nmΨnnΣ
kmmmΣ)
mkΨmmΣ( ln1[
kQ=K Γln
φ
ψφφ (11)
m group offraction area surface = mφ
nQnxnΣ
mQmx= (12)
.mixturein m group offraction mole = mX
KT
uu exp nnm n
m n (13)
T
mnaexp= (14)
Where umn is measure of the interaction energy between groups m and n, and the sums are
over all groups in the mixture. The residual part of the activity coefficient of species i is
computed from
]ik
lnΓkΓ[ln
ik
vkΣ = (residual) ln iγ
(15)
Here i
kv is the number of k groups present in species i, and i
k is the residual contribution to
the activity coefficient of group k in a pure fluid of species i molecule. The volume (Ri) and
surface (Qi) parameters are anm and ann for each pair of functional groups [18]. Continuing
with the group contribution idea, it is next assumed that any pair of functional groups m and n
will interact in the same manner, that have the same value of amn and anm independent of the
mixtures in which these two groups occur. Consequently by a regression analysis of great
quantities of activity coefficient data, the binary parameters anm and amn for many group-group
interactions can be determined [19]. These parameters can then be used to predict the activity
coefficient in mixtures for which no experimental data are available. The advantage of this
group contribution approach is that with a relatively small number of functional groups [20]
the properties of the millions up on millions of different molecules can be obtained.The
parameters used in this model were taken from literature.
2.5 Error Analysis
The relative error percentages of the models are calculated using equation
100x a lExperiment
1y
C alcula ted 1
y - a lExperiment 1
y =
1R Ey
(16)
2.6 Consistency of VLE The thermodynamic consistency of measured (vapour + liquid) equilibrium data is validated
using Redlich-Kiester method. According to this method only pure components are involved
at the two end state and no mixing effect occurs, [21] at these points.

International Journal of Recent Trends in Engineering & Research (IJRTER) Volume 04, Issue 01; January - 2018 [ISSN: 2455-1457]
@IJRTER-2017, All Rights Reserved 342
∫10 0 = 1d x
2γ
1γln (17)
2
1
γ
γln Calculated from two models is evaluated and plotted against x1. The area above the x-
axis will be equal to area below it for thermodynamically consistent data.
III. RESULTS AND DISCUSSION The experimental VLE data of the four binary azeotropes namely Ethanol-water, Acetone-
water, Ethanol- benzene and Methanol-water are shown in Tables (1-4) respectively. The
experimental values are compared with literature and found to be reasonably accurate. The
calculated fugacity coefficients for four azeotropes were found to be closer to unity, hence it
is reasonable to assume that vapour phase is ideal. The activity coefficient (1) calculated
from the experimental values using ‘Equation 2’ for the four binary systems is also included
in Tables (1-4). It is evident from the values of the activity coefficients (greater than unity)
from experimental VLE that the liquid phase non-ideality is too high. This is due to the fact
that the molecules of the compounds present in each of the azeotropes are not chemically
similar. While water is ionised and strongly polar, ethanol, methanol and acetone are more
organic in character [22]. The experimental Txy diagram of four binary azeotropic systems
shown positive deviation from ideality. For all the four azeotropes the mixture has higher
vapour pressure than Raoult’s law, yielding positive deviation from ideality (minimum
boiling azeotrope). The molecules present in the four azeotropes repel each other but do not
attract. This results in higher concentration of molecules in vapour phase than in the liquid
phase with higher activity coefficient. Eventually minimum temperature was reached at the
azeotropic composition for all the systems representing minimum boiling homogenous
azeotropisim.
3.1 Modelling
VLE computation with UNIQUAC model was made using Newton Raphson technique. This
was accomplished using computer programming with Java 1.6 version. The model parameters
of the systems estimated from the program are presented in Table 5.Analytical solution of
group contribution method (ASOG) was adopted in VLE calculation using UNIFAC model.
Comparison of the VLE predicted from the two models with the experimental data is
presented in Tables (1-4) for ethanol-water, acetone-water, ethanol-benzene and methanol-
water respectively
Table 1. Experimental and Model prediction of VLE Ethanol-water system at 101.325 kPa
Experimental UNIQUAC UNIFAC
T/C x1 y1
γ1 1 y1
y1 error
% 1 y1
y1 error
%
92.5 0.017 0.1589 5.4644 5.7189 0.1663 2.6391 5.6446 0.1641 3.2973
90.5 0.0621 0.3789 3.8360 3.8925 0.3844 1.4636 3.9483 0.3900 2.9275
88.5 0.0856 0.4375 3.4586 3.4478 0.4361 0.3094 3.4355 0.4345 0.6693
86 0.1238 0.4805 2.8834 2.8135 0.4688 2.4224 2.8580 0.4762 0.8822
84.5 0.1561 0.5219 2.6287 2.4903 0.4944 5.2550 2.6499 0.5260 0.8028
84.5 0.2508 0.558 1.7493 1.6873 0.5382 3.5461 1.8225 0.5813 4.1810
82.5 0.3075 0.5826 1.6081 1.5386 0.5574 4.3185 1.6647 0.6031 3.5246
80.5 0.4065 0.6223 1.4040 1.3047 0.5782 7.0710 1.4180 0.6284 0.9939
79.5 0.4979 0.6564 1.2573 1.1344 0.5922 9.7705 1.2473 0.6511 0.7999
79 0.5198 0.6629 1.2404 1.1207 0.5989 9.6533 1.2255 0.6549 1.2057

International Journal of Recent Trends in Engineering & Research (IJRTER) Volume 04, Issue 01; January - 2018 [ISSN: 2455-1457]
@IJRTER-2017, All Rights Reserved 343
78 0.5923 0.6921 1.1823 1.0644 0.6230 9.9709 1.1513 0.6739 2.6282
77 0.6963 0.7495 1.1333 1.0515 0.6953 7.2241 1.0977 0.7259 3.1480
75.5 0.7572 0.7965 1.1762 1.1121 0.7530 5.4546 1.1367 0.7697 3.3619
74.5 0.9143 0.9243 1.1770 1.1300 0.8873 3.9943 1.1319 0.8888 3.8383
Overall error
percentage 5.2209
2.3043
Table 2. Experimental and Model prediction of VLE Acetone-water system at 101.325 kPa
Experimental UNIQUAC UNIFAC
T/C x1 y1
γ1 1 y1
y1 error
% 1 y1 y1 error %
74.8 0.0615 0.5981 5.3416 4.9006 0.5487 8.2529 5.0863 0.5695 5.0170
68.53 0.1253 0.7401 3.9329 4.1109 0.7735 4.5153 3.9143 0.7365 0.4882
65.26 0.1492 0.7616 3.7698 3.9432 0.7966 4.6009 3.7134 0.7501 1.5217
63.59 0.2124 0.7912 2.9033 3.0613 0.8342 5.4456 2.9388 0.8008 1.2028
60.75 0.3214 0.8204 2.1833 2.2066 0.8291 1.0631 2.1688 0.8149 0.6739
59.95 0.4201 0.8369 1.7497 1.7003 0.8132 2.8268 1.7034 0.8147 2.7218
59.12 0.4961 0.8387 1.5265 1.4761 0.8109 3.3113 1.4738 0.8097 3.5767
58.29 0.6126 0.8592 1.3021 1.2345 0.8145 5.1958 1.2317 0.8127 5.7173
57.49 0.6971 0.8712 1.1920 1.1337 0.8285 4.9006 1.1341 0.8288 5.1074
56.68 0.7838 0.8895 1.1125 1.0729 0.8577 3.5690 1.0741 0.8587 3.5760
56.3 0.8923 0.9233 1.0276 1.0202 0.9166 0.7298 1.0208 0.9171 0.6734
Overall error
percentage 4.0374 2.7524
Table 3. Experimental and Model prediction of VLE Ethanol-benzene system at 101.325 kPa
Experimental UNIQUAC UNIFAC
T/C x1 y1
γ1 1 y1
y1 error
% 1 y1
y1 error
%
78 0.0187 0.1297 7.0951 8.0323 0.1468 13.2536 6.9394 0.1268 2.1665
74 0.0523 0.2394 5.5072 5.8102 0.2525 5.4803 6.0404 0.2625 9.6574
73 0.0993 0.3067 3.8719 4.2007 0.3398 10.8086 4.1638 0.3298 7.5480
68.5 0.1567 0.3596 3.4788 3.7332 0.3858 7.29421 3.4421 0.3558 1.0483
66.5 0.2345 0.3989 2.8115 2.9613 0.4201 5.3346 2.7496 0.3901 2.1860
66 0.3241 0.4322 2.2527 2.3351 0.4479 3.6441 2.1784 0.4179 3.2970
65.5 0.4500 0.4567 1.7524 1.7658 0.4601 0.7641 1.7274 0.4501 1.4254
64.5 0.5228 0.4780 1.6498 1.5683 0.4543 4.9414 1.6356 0.4738 0.8786
63 0.7101 0.5228 1.4202 1.3337 0.4909 6.0979 1.5057 0.5542 6.0061
62 0.7866 0.5760 1.4775 1.3705 0.5342 7.2430 1.5449 0.6022 4.5625
60.5 0.8743 0.6834 1.6882 1.6098 0.6516 4.6429 1.7828 0.7216 5.5999
60 0.9230 0.7734 1.8516 1.8717 0.7817 1.0783 1.8774 0.7841 1.3930
Overall error
percentage
5.8819 3.8141

International Journal of Recent Trends in Engineering & Research (IJRTER) Volume 04, Issue 01; January - 2018 [ISSN: 2455-1457]
@IJRTER-2017, All Rights Reserved 344
Table 4. Experimental and Model prediction of VLE Methanol-water system at 101.325 kPa
Experimental UNIQUAC UNIFAC
T/C x1 y1
γ1 1 y1
y1 error
% 1 y1
y1 error
%
96.4 0.0189 0.1234 1.8695 2.0014 0.1321 7.1202 2.0132 0.1328 7.6899
93.5 0.0389 0.2230 1.8432 1.8238 0.2206 1.0380 1.6667 0.2016 9.5590
91.2 0.0588 0.3104 1.8652 1.9152 0.3187 2.6750 1.8575 0.3091 0.4027
89.3 0.0827 0.3665 1.6888 1.8075 0.3922 7.0394 1.7138 0.3719 1.4887
87.7 0.1032 0.4228 1.6643 1.8326 0.4655 10.1006 1.6704 0.4243 0.3548
84.4 0.1485 0.5117 1.4777 1.6324 0.5652 10.4740 1.5058 0.5214 1.8995
81.7 0.1897 0.5729 1.4504 1.5652 0.6182 7.9244 1.4837 0.5860 2.3003
78.0 0.3016 0.6765 1.1839 1.2295 0.7025 3.8465 1.1872 0.6783 0.2758
75.3 0.3982 0.7311 1.1058 1.1272 0.7452 1.9325 1.1239 0.7430 1.6324
72.1 0.5120 0.7819 1.0148 1.0313 0.7945 1.6209 1.0315 0.7947 1.6422
67.2 0.6015 0.8305 1.0331 1.0435 0.8388 1.0111 1.0459 0.8407 1.2372
66.3 0.7127 0.8689 1.0993 1.1081 0.8758 0.7965 1.1112 0.8782 1.0753
64.5 0.8257 0.9211 1.0416 1.0312 0.9118 1.0135 1.0332 0.9136 0.8132
Overall error
percentage
4.3533 2.3362
‘Fig’ (1-4) portrays the comparison of experimental VLE with the UNIQUAC and UNIFAC
models. The overall error percentages of the VLE for ethanol-water system using UNIQUAC
and UNIFAC models are 5.2209 and 2.3043 respectively. Similarly for acetone-water system,
the calculated overall error percentages from UNIQUAC and UNIFAC models are 4.0374 and
2.7524. In the case of ethanol-benzene system, the error percentage was 5.8819 for
UNIQUAC model and 3.8141 for UNIFAC model. Percentage errors for methanol-water
system using UNIQUAC and UNIFAC model were found to be 4.3522 and 2.3362. Though
both models are able to give better results in VLE prediction for the systems, UNIFAC model
has relatively lesser error percentage.
Fig 1. Experimental and Correlated xy Diagram of Fig 2. Experimental and Correlted
xy diagram Ethanol-water System of Acetone-water System

International Journal of Recent Trends in Engineering & Research (IJRTER) Volume 04, Issue 01; January - 2018 [ISSN: 2455-1457]
@IJRTER-2017, All Rights Reserved 345
Fig 3. Experimental and Correlated xy Diagram of Fig 4. Experimental and Correlated
xy Diagram of Ethanol-benzene System Methanol-water System
Same trend of results is observed with the Redlich Kiester method of thermodynamics
consistency test ‘Equation 23’. This can be seen from ‘fig’ (5-8) for the four binary systems.
These plots are made using the activity coefficients calculated from UNIQUAC and UNIFAC
models (TABLES 1-4). Area under the curve computed from UNIQUAC and UNIFAC
models for all systems is shown in TABLE 6. It can be observed that the computed values are
closer to zero for the UNIQUAC model and almost zero for the UNIFAC model.
Fig 5. Thermodynamic Consistency of Fig6. Thermodynamic consistency of Acetone-
Ethanol-water System water System
Fig 7. Thermodynamic Consistency of Fig 8. Thermodynamic Consistency of Methanol-
Ethanol-benzene System water System

International Journal of Recent Trends in Engineering & Research (IJRTER) Volume 04, Issue 01; January - 2018 [ISSN: 2455-1457]
@IJRTER-2017, All Rights Reserved 339
Table 5. Estimated UNIQUAC Parameters of four binary systems
System UNIQUAC Parameters J/mol K
u12-u22 u21-u11
Ethanol-water 200.5876 1350.3425
Acetone-water 716.1895 1950.1587
Ethanol-benzene 350.2287 1000.5827
Methanol-water 858.3737 1034.8543
Table 6. VLE Consistency test for four azeotropes
System Area
UNIQUAC UNIFAC
Ethanol-water 0.0700 0.0045
Acetone-water 0.0502 0.0071
Ethanol-benzene 0.0182 0.0025
Methanol-water 0.0241 0.0036
IV. CONCLUSION In case of VLE prediction of azeotropes, UNIQUAC and UNIFAC models were tested for the
systems ethanol-water, acetone-water, ethanol-benzene and methanol-water. The
experimental VLE findings prove that all the systems are minimum boiling azeotropes. Major
finding of the present work is the estimation of UNIQUAC parameters for the four systems.
These parameters can be utilized for VLE calculation at any pressure conditions. The error
analysis and thermodynamics consistency test studies reveal that both models give good
representation of VLE for all the chosen systems.
REFERENCES I. W. L. McCabe, J. C. Smith, P. Harriot, Unit Operations in Chemical Engineering 7th Ed., McGraw Hill
Publication, 2004.
II. T. P. Ognisty, Analyze Distillation Columns with Thermodynamics, Chemical Engineering Progress, 11,
1995, 40- 46.
III. J. M. Smith, H. C. Van Ness, M. M. Abbott, Textbook of Introduction to Chemical Engineering
Thermodynamics, 7th Ed., McGraw Hill Publications, 2005.
IV. W. Swietoslawski, Azeotropy and Polyazeotropy, Oxford Pergamon Press publication, 1994.
V. R. E. Treybal, Mass Transfer Operation, 3rd Ed., McGraw Hill Publication, 1981.
VI. S. T. Lin, S. I. Sandler, A Priori Phase Equilibrium Prediction from a Segment Contribution Solvation
Model, Industrial Engineering Chemistry Research, 41, 2002, 899- 913.
VII. S. Skogested, Chemical Process and Energy Process Engineering, 4th Ed., CRC Publication, 2009.
VIII. Y. V. C. Rao, Chemical Engineering Thermodynamics, 3rd Ed., Universities Press India Limited, 1997.
IX. K. S. Pitzer, R. F. Curl, Empirical Equation for the Second Virial Coefficient, Journal of American
chemical society , 79 1957, 2369 – 2370.
X. G. M. Wilson, C. H. Deal, Activity Coefficients and Molecular Structure: Activity Coefficients in
Changing Environments - Solutions of Groups, Industrial Engineering Chemistry Fundamentals 1, 1962,
20 – 23.
XI. P. Alessi, I. Kikic, P. Rasmussen, A. Fredenslund, UNIFAC and Infinite Dilution Activity Coefficients,
Canadian journal of chemical Engineering, 60, 1982, 300 – 304.
XII. A. Fredenslund, R. L. Jones, J. M. Prausnitz, Group- Contribution Estimation of Activity Coefficients in
Nonideal Liquid Mixtures, AIChE JOURNAL 21, 1975, 1086 – 1099.
XIII. T. F. Anderson, J. M. Prausnitz, Application of the UNIQUAC Equation to Calculation of
Multicomponent Phase Equilibria, Industrial and Engineering Chemical Process Design and
Development, 17, 1978, 552 – 561.
XIV. A. Fredenslund, J. Gmehling, M. L. Michelson, P Rasmussen, Computerized Design of Multicomponent
Distillation Columns using the UNIFAC Group Contribution Method, Industrial and Engineering
Chemical Process Design and Development. 16, 1977, 450 – 462.
XV. J. Gmehling, From UNIFAC to Modified UNIFAC to PSRK with the Help of DDB, Fluid Phase
Equilibria, 107, 1995 1 – 29.
International Journal of Recent Trends in Engineering & Research (IJRTER) Volume 04, Issue 01; January - 2018 [ISSN: 2455-1457]
@IJRTER-2017, All Rights Reserved 340
XVI. I. Kikic, P. Alessi, P. Rasmussen, A. Fredenslund, On the Combinatorial Part of the UNIFAC and
UNIQUAC Models, Canadian journal of Chemical engineering, 58 1980, 253 – 258.
XVII. J. Gmehling, J. Lohmann, A. Jakob, J. Li, R. Joh, Modified UNIFAC (Dortmund) Model. 3. Revision
and Extension, Industrial and Engineering Chemistry Research, 37, 1998, 4876 – 4882.
XVIII. M. N. Papadopoulos, E. L. Derr, Group Interaction. II. A Test of the Group Model on Binary Solutions
of Hydrocarbons, Journal of American Chemical society, 81, 1959, 2285 – 2289.
XIX. E.C. Voutsas, D.P. Tassios, Predictions of Infinite-Dilution Activity Coefficients in Binary Mixtures
with UNIFAC. A Critical Evaluation, Industrial and Engineering Chemistry Research, 35, 1996, 1438 –
1445.
XX. O. Redlich, E. L. Derr, G. Pierotti, Group Interaction. I. A Model for Interaction in Solutions. Journal of
American Chemical Society, 81, 959, 2283 – 2285.
XXI. O. Redlich, A. T. Kister, Algebraic Representation of Thermodynamic Properties and the Classification
of Solutions, Industrial and Engineering Chemistry, 40, 1948, 2253-2254.
XXII. L. William Luyben, A. Leonard Wenzel, Chemical Process Analysis, 3rd Ed., Prentice Hall Publication,
1988.