Application of a Tier 3 for enteric methane in dairy catlle_Bannink
19
Application of a Tier 3 for enteric methane in dairy cattle André Bannink
-
Upload
bc3-basque-center-for-climate-change -
Category
Environment
-
view
64 -
download
0
description
Application of a Tier 3 for enteric methane in dairy catlle_Bannink LiveM_Macsur_Bilbao_2014
Transcript of Application of a Tier 3 for enteric methane in dairy catlle_Bannink

Application of a Tier 3 for enteric methane in dairy cattle
André Bannink

A Tier 3 for enteric CH4
Why ?
● accommodate for variation in rumen fermentation
How ?
● addressing chemical/physical aspects rumen function
● using extant process-based model
Activity data from Central Bureau of Statistics to estimate N & P excretion by dairy cows based on diets and productivity
Outputs Tier 3
● CH4 emission factor (kg CH4/cow/yr)
● CH4 as % of gross energy intake

Non-resistant 1, 2
Q Substrate
Q Micro-organisms
Resistant 1
Resistant 2
Microbial growth 1
Microbial growth 2
Feed 1
Feed 2
Rumen CH4 1, CH4 2
Fixed characteristics, no variation with type of ration
Additivity for feed components assumed
Microbial growth = table value
Substrate degradation = table value
Non-Tier 3 approaches for enteric CH4

Substrate degr = fion ( QSub, QMi )
Q Substrate
Q Micro-organisms
Substrate outflow = fion ( QSub )
Microbial growth = fion ( QSub, QMi )
Microbial outflow = fion ( QMi )
Feed
Rumen
No fixed degradation rates, growth rates, and so on
Microbial growth = f ion ( [substrates] & [micro-organisms] )
Substrate degradation = f ion ( [micro-organisms] & [substrates] )
Microbial death/predation = fion ( QSub, QMi )
Tier 3 for enteric CH4

Tier 3 for inventory of effects ration on CH4 3 causal factors to quantify CH4
Organic
matter Micro-
organisms VFA
CH4
Feed intake
Rumen
1. Chemical composition & degradation characteristics
2. Microbial growth (efficiency)
3. Type VFA
fion(substrate type, pH) Small intestine
outflow
absorption
Acetic acid
H2
Propionic acid
Butyric acid
Longchain FA hydrogenation
Valeric acid
Microbial growth on ammonia
Microbial growth on AA
H2 source H2 sink
Methane CO2 + 4H2 CH4 +2H2O
SURPLUS

Chemical composition affects CH4
Line 1
● Level 2
Line 2
● Level 2
● Level 2
● Level 3
● Level 3
Line 3
Line 4
0
100
200
300
400
Eiwit NDF Zetmeel Suikers
Meth
ane (
mm
ol/
mol VFA)
Meta-analysis in vivo data lactating cows Bannink et al (2006 & 2008)
+10%
+68%
+55%
FAT
Delivers no VFA hence no CH4
Negative effect of fat on CH4
Protein NDF Starch Sugars

Recently updated NIR data dairy enteric CH4
Update Ym IPCC Tier 2 from 6.0% to 6.5% GE intake
Budget period 2013 onwards
11%
Update Bannink et al. (2011), unpublished
year
IPCC Tier 2, 6.0% GE intake
IPCC Tier 2 update, 6.5% GE intake
Tier 3

Tier 3 estimates realistic ?
↑ DMI, ↓ methane per MJ feed
IPCC Tier 2 Tier 3
Independent data-base University of Reading; Reynolds & Mills
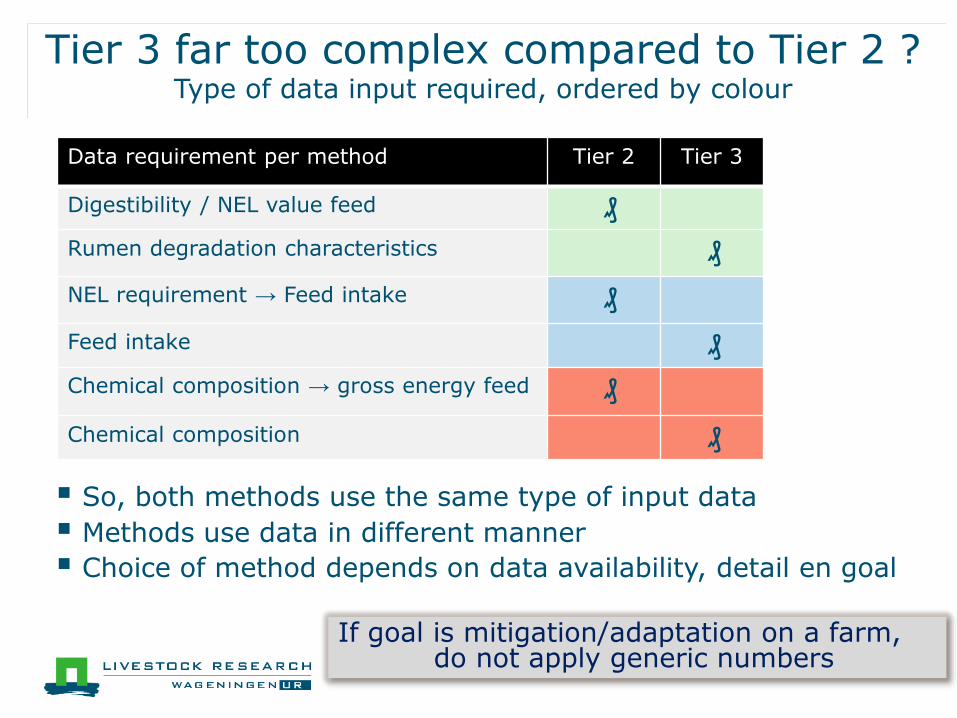
Tier 3 far too complex compared to Tier 2 ? Type of data input required, ordered by colour
So, both methods use the same type of input data
Methods use data in different manner
Choice of method depends on data availability, detail en goal
Data requirement per method Tier 2 Tier 3
Digestibility / NEL value feed ₰
Rumen degradation characteristics ₰
NEL requirement → Feed intake ₰
Feed intake ₰
Chemical composition → gross energy feed ₰
Chemical composition ₰
If goal is mitigation/adaptation on a farm, do not apply generic numbers

Effect grassland management on CH4
10.0
12.0
14.0
16.0
18.0
20.0
22.0
GS-EC GS-LC
g C
H4
/
kg
DM
6.0
8.0
10.0
12.0
14.0
16.0
18.0
GS-EC GS-LCg C
H4 /
kg F
PC
M
GS = grass silage
= high N-fertilization = low N-fertilization
EC = early cut; LC = late cut
Bannink et al (2010)
18 kg DM/d (90% grass silage & 10% concentrates)

HF = high N fertilization; LF = low N fertilization
EC = early cutting; LC = late cutting
Reijs, 2007 Dijkstra et al (2012)
HFEC HFLC LFEC LFLC
Grass s ilage type
0
100
200
300
400
500
N e
xc
reti
on
(g
da
y-1)
Immediately av ai lable N
Eas i ly dec ompos able N
Res is tant N
C:N 0 .5
C:N 3 .4
C:N 3 3
C:N 0 .5
C:N 3 .5
C:N 2 8
C:N 0 .5
C:N 3 .3
C:N 2 9
C:N 0 .5
C:N 3 .3
C:N 3 7
A non-CH4 application, excreta composition

Effect N mitigating feeding measures on CH4
Dijkstra et al (2011)
10 12 14 16 18
N emission (g/kg FPCM)
10
12
14
16
18M
eth
ane e
mis
sio
n (g/k
g F
PC
M)
Mean maize silage
11.1 g N/kg FPCM
14.4 g CH4 /kg FPCM maize silage

Tier 3 for on-farm GHG budgets farm cases
EU – AnimalChange

Tier 3 for Brazilian beef production systems
De Lima et al (2014, submitted) EU – AnimalChange
average Ym of 5.2% ≈ 20% lower than IPCC Tier 2 default Ym of 6.5%
Without supplementation
55-60% DM digestibility
Low Ym of 5.2%
counter-intuitive
Often, higher Ym
than 6.5% adopted
for poor quality diets
(e.g. FAO)
Huge implication for
global enteric CH4
assessments

#669 - “Dry period length and rumen adaptation”
Extensions, developments, other use
Graphical user-interface for Tier 3
Delivering estimates of (variation in) Ym values for farm models & CFP models
Applications Tier 3 model ● GHG budgets farm cases (EU-AnimalChange) ● enteric CH4 in Brazilian beef (EU-AnimalChange) ● research questions excreta (composition & volumes) ● nutritional aspects, e.g. N limitation rumen function ● etc.
Further modelling efforts on ● rumen acidity model (adaptation rumen wall) ● rumen fat metabolism ● effects ionophore monensin; other additives envisaged ● intestinal (enzymatic) digestion ● extension hindgut fermentation ● feed intake patterns

#669 - “Dry period length and rumen adaptation”
Conclusions on Tier 3 for enteric CH4
Advantages ● possibility to simulate wide range of conditions
● introducing ‘logic’ in outcomes
● additional outputs available not directly related to CH4
● composition excreta ● nutrients for maintenance and production ● diet digestibility and milk production
Proves to be useful ● predicts Ym ≈ 6%, comparable to empirical evidence ● example Brazilian beef production systems ● example GHG budgets with varying ‘feeding intensity’
Disadvantages ● activity data on diet composition ● different (non-practical) data on ‘digestibility’

derived from
Dijkstra et al (2007)
for research & experimentation
for inventory (Tier 3)
for practice (on farm)
Tier 3 Inventory / program Low Emission Animal Feed financed by Ministry Economic Affairs & Dutch Product Boards

Representing underlying mechanisms
Dynamics instead of static approaches & fixed values
Interactions & effect rumen conditions
● pH, volume, passage rate
● Interaction micro-organisms / substrates
● Different microbial classes:
● sugars/starch utilizers
● NDF utilizers
● protozoa (predation on bacteria / death)
Production of volatile fatty acids (VFA)
Concentrations of substrate & microbial mass
Tier 3 approach for enteric CH4

Tier 3, schematic
Model structure
Schematic representation mass flows
Changes in masses and flows described by differential equations in simulation model
● parameters & equations
based on useful (in vivo)
studies reported in
literature