Application notes - Detecting Loose Windings in ... · Detecting Loose Windings in Hydroelectric...
2
Detecting Loose Windings in Hydroelectric Generators A typical hydroelectric power station, showing four 100 MW generator units - 1 Jieory frequencies from the turbine as well as odic forcing frequencies. The most random noise from turbulence and likely subharmonics will occur at Vibration of the stator in a multi- cavitation. 60 Hz and at harmonics of 60 Hz; they pole generator is the result of several will appear in the spectrum between forces acting within the unit. The Because the individual strengths of the 120 Hz harmonic series. windings, which are copper bars the magnetic poles in the rotor vary, mounted in slots on the stator, experi-, and also because of rotor eccentricity Because the relative levels of the ence an outward-directed force at the and out-of-roundness, the 120 Hz har- subharmonics are much lower than pole-passing frequency of 120 Hz. monies are amplitude modulated at the levels of the 120 Hz series, they This force is caused by interactions 2,9 Hz, which is the frequency corre- are usually masked by the random between the induced current in the sponding to the shaft speed of the tur- part of the vibration spectrum. A time bars and the magnetic field of the bine. This amplitude modulation ere- synchronous averaging process can re- passing pole. In addition to the electri- ates sidebands in the vibration spec- duce the random signal enough to ex- . cally and magnetically induced vibra- trum at intervals of 2,9 Hz around pose the subharmonics if they exist. tion, it is reasonable to find mechani- each harmonic. These sidebands are Synchronous averaging is signal aver- cally-induced vibration at turbine generally low in amplitude and are aging in the time domain with the blade-passing frequencies and random usually masked by random noise in start of each average initiated at a components due to turbulence and the spectrum, but they can be seen in particular point on the waveform by a cavitation in the turbine. Note that some high-resolution spectra. trigger pulse. The trigger is normally there is no force on the stator at the , derived from a tachometer which gen- line frequency of 60 Hz; the forces are If the copper bars are not perfectly erates a pulse at the same instant in in the same direction regardless of the rigid in their slots in the stator, the the cycle of a rotating part. In this polarity of the passing pole. forces on them will cause them to case, however, the 60 Hz line frequen- ■ , ■ move. This motion can act as a non- cy was used as the trigger for the syn- The vibration spectrum due to these linearity of the overall stiffness of the chronous averaging because it is pre- forces would therefore be expected to structure. Ref. 1 has shown that a cisely aligned with the motion of the consist of lines at 120 Hz and its har- structure with non-linear stiffness can rotor. It was also easily available, elim- monics, with no line at 60 Hz. There generate vibrations at subharmonic inating the need for special equipment would also be lines at blade-passing frequencies (1/2, 1/3, etc.) of the peri- to generate a trigger. BO 0236-11 - - ' '
Transcript of Application notes - Detecting Loose Windings in ... · Detecting Loose Windings in Hydroelectric...

Detecting Loose Windings in Hydroelectric Generators
A typical hydroelectric power station, showing four 100 MW generator units
-
1 Jieory frequencies from the turbine as well as odic forcing frequencies. The most random noise from turbulence and likely subharmonics will occur at
Vibration of the stator in a multi- cavitation. 60 Hz and at harmonics of 60 Hz; they pole generator is the result of several will appear in the spectrum between forces acting within the unit. The Because the individual strengths of the 120 Hz harmonic series. windings, which are copper bars the magnetic poles in the rotor vary, mounted in slots on the stator, experi-, and also because of rotor eccentricity Because the relative levels of the ence an outward-directed force at the and out-of-roundness, the 120 Hz har- subharmonics are much lower than pole-passing frequency of 120 Hz. monies are amplitude modulated at the levels of the 120 Hz series, they This force is caused by interactions 2,9 Hz, which is the frequency corre- are usually masked by the random between the induced current in the sponding to the shaft speed of the tur- part of the vibration spectrum. A time bars and the magnetic field of the bine. This amplitude modulation ere- synchronous averaging process can re-passing pole. In addition to the electri- ates sidebands in the vibration spec- duce the random signal enough to ex- . cally and magnetically induced vibra- trum at intervals of 2,9 Hz around pose the subharmonics if they exist. tion, it is reasonable to find mechani- each harmonic. These sidebands are Synchronous averaging is signal aver-cally-induced vibration at turbine generally low in amplitude and are aging in the time domain with the blade-passing frequencies and random usually masked by random noise in start of each average initiated at a components due to turbulence and the spectrum, but they can be seen in particular point on the waveform by a cavitation in the turbine. Note that some high-resolution spectra. trigger pulse. The trigger is normally there is no force on the stator at the , derived from a tachometer which gen-line frequency of 60 Hz; the forces are If the copper bars are not perfectly erates a pulse at the same instant in in the same direction regardless of the rigid in their slots in the stator, the the cycle of a rotating part. In this polarity of the passing pole. forces on them will cause them to case, however, the 60 Hz line frequen-
■ , ■ move. This motion can act as a non- cy was used as the trigger for the syn-The vibration spectrum due to these linearity of the overall stiffness of the chronous averaging because it is pre-
forces would therefore be expected to structure. Ref. 1 has shown that a cisely aligned with the motion of the consist of lines at 120 Hz and its har- structure with non-linear stiffness can rotor. It was also easily available, elim-monics, with no line at 60 Hz. There generate vibrations at subharmonic inating the need for special equipment would also be lines at blade-passing frequencies (1/2, 1/3, etc.) of the peri- to generate a trigger.
BO 0236-11 - - ' '
Measurements In the next experiment, the vibra- suit of unavoidable looseness in the tion signal and the trigger signal were bars.
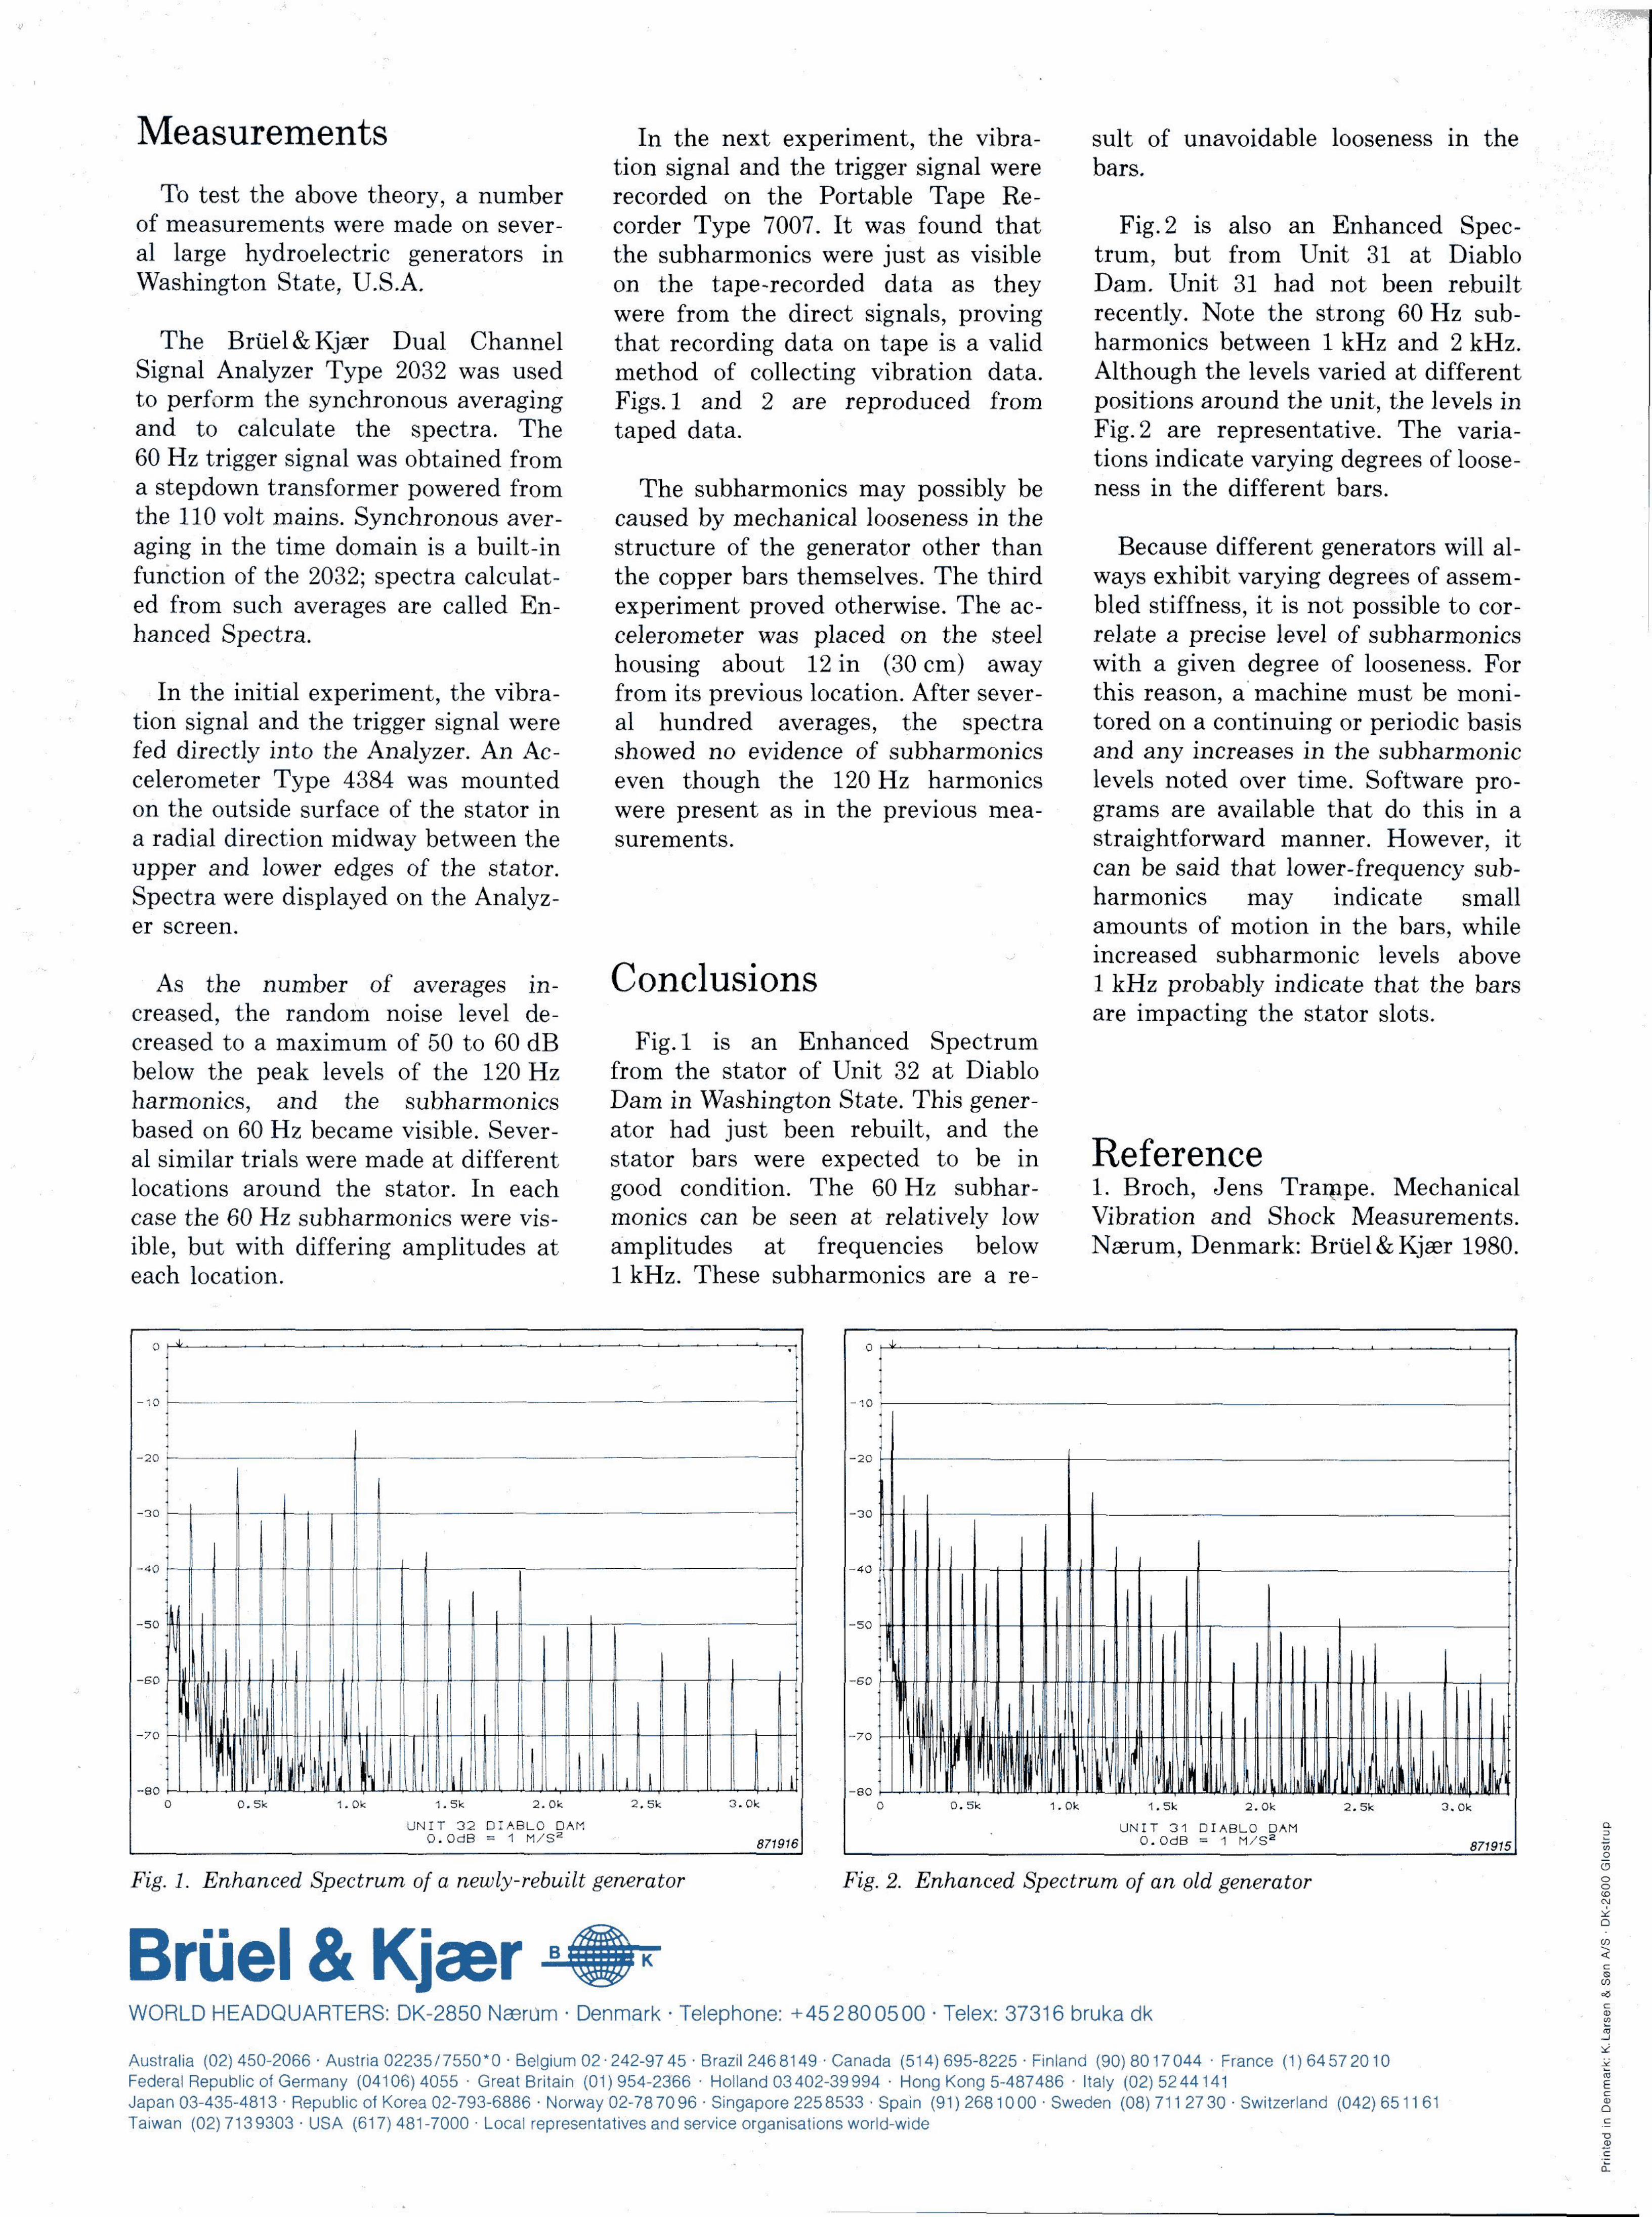
To test the above theory, a number recorded on the Portable Tape Re-of measurements were made on sever- corder Type 7007. It was found that Fig. 2 is also an Enhanced Spec-al large hydroelectric generators in the subharmonics were just as visible trum, but from Unit 31 at Diablo Washington State, U.S.A. on the tape-recorded data as they Dam. Unit 31 had not been rebuilt
were from the direct signals, proving recently. Note the strong 60 Hz sub-The Brtiel&Kjaer Dual Channel that recording data on tape is a valid harmonics between 1 kHz and 2 kHz.
Signal Analyzer Type 2032 was used method of collecting vibration data. Although the levels varied at different to perform the synchronous averaging Figs. 1 and 2 are reproduced from positions around the unit, the levels in and to calculate the spectra. The taped data. Fig. 2 are representative. The varia-60 Hz trigger signal was obtained from tions indicate varying degrees of loose-a stepdown transformer powered from The subharmonics may possibly be ness in the different bars. the 110 volt mains. Synchronous aver- caused by mechanical looseness in the aging in the time domain is a built-in structure of the generator other than Because different generators will al-function of the 2032; spectra calculat- the copper bars themselves. The third ways exhibit varying degrees of assem-ed from such averages are called En- experiment proved otherwise. The ac- bled stiffness, it is not possible to cor-hanced Spectra. celerometer was placed on the steel relate a precise level of subharmonics
housing about 12 in (30 cm) away with a given degree of looseness. For In the initial experiment, the vibra- from its previous location. After sever- this reason, a machine must be moni
tion signal and the trigger signal were al hundred averages, the spectra tored on a continuing or periodic basis fed directly into the Analyzer. An Ac- showed no evidence of subharmonics and any increases in the subharmonic celerometer Type 4384 was mounted even though the 120 Hz harmonics levels noted over time. Software pro-on the outside surface of the stator in were present as in the previous mea- grams are available that do this in a a radial direction midway between the surements. straightforward manner. However, it upper and lower edges of the stator. can be said that lower-frequency sub-Spectra were displayed on the Analyz- harmonics may indicate small er screen. amounts of motion in the bars, while
- ' increased subharmonic levels above As the number of averages in- OonClUSlOnS 1 kHz probably indicate that the bars
* creased, the random noise level de- are impacting the stator slots. creased to a maximum of 50 to 60 dB Fig. 1 is an Enhanced Spectrum below the peak levels of the 120 Hz from the stator of Unit 32 at Diablo harmonics, and the subharmonics Dam in Washington State. This gener-based on 60 Hz became visible. Sever- ator had just been rebuilt, and the al similar trials were made at different stator bars were expected to be in rveiereilCe locations around the stator. In each good condition. The 60 Hz subhar- 1. Broch, Jens Trampe. Mechanical case the 60 Hz subharmonics were vis- monies can be seen at relatively low Vibration and Shock Measurements. ible, but with differing amplitudes at amplitudes at frequencies below Naerum, Denmark: Briiel&Kjaer 1980. each location. 1 kHz. These subharmonics are a re-
Fig. 1. Enhanced Spectrum of a newly-rebuilt generator , Fig. 2. Enhanced Spectrum of an old generator