Application and verification of ECMWF products 2012 · Application and verification of ECMWF...
6
FRANCE FRANCE 1 Application and verification of ECMWF products 2012 Météo-France – J. Stein, N. Girardot, O. Mestre, D. Paradis, and F. Pouponneau 1. Summary of major highlights • Strong increase of the number of satellite data assimilated and change of the data bases used for the orography and physiographic data in the 3 limited area models ALADIN over tropical areas coupled to IFS 2. Use and application of products 2.1 Post-processing of model output 2.1.1 Statistical adaptation Millions of local forecasts of weather parameters are produced daily through statistical adaptation of NWP output. Main methods are multiple linear regression (MLR) and linear discriminant analysis (DA). MOS (model output statistics) is generally preferred to PP (perfect prognosis). Kalman filter (KF) is applied when relevant. The production is described in Table 1. Note the new production of grid point total cloud cover forecast based on a statistical adaptation using satellite data as predictand. Deterministic model T1279 Parameter Method Domain Number of Sites Steps Tri-hourly 2m Temperature MLR (MOS) +KF France 2781 +3h to +180h by 3h Daily extremes 2m temperature MLR (MOS) +KF France 2781 D to D+6 10m Wind Speed MLR (MOS) France 861 +6h to +180h by 3h 10m Wind Direction MLR (MOS) France 822 +6h to +180h by 3h Total Cloud Cover MLR (MOS)/LDA France 164/152 +12h to +180h by 3h Total Cloud Cover LDA France GRID 0.5x0.5 0h to +156h by 3h Tri-hourly 2m relative Humidty MLR (MOS) +KF France 1269 +6h to +180h by 3h Daily extremes 2m rel. Humidity MLR (MOS) +KF France 1269 D to D+6 Tri-hourly 2m Temperature MLR (MOS) +KF World 7128 +1h to +180h by 1h Daily extremes 2m temperature MLR (MOS) +KF World 7128 D to D+6 Mixed ARPEGE+IFS MLR (MOS) +KF France 2781 +3h to +102h by 3h Mixed ARPEGE+IFS MLR (MOS) +KF World 4367 +1h to +102h by 1h Table 1 : Statistical adaptations for the deterministic high resolution model
Transcript of Application and verification of ECMWF products 2012 · Application and verification of ECMWF...

FRANCE FRANCE
1
Application and verification of ECMWF products 2012
Météo-France – J. Stein, N. Girardot, O. Mestre, D. Paradis, and F. Pouponneau
1. Summary of major highlights • Strong increase of the number of satellite data assimilated and change of the data bases used for
the orography and physiographic data in the 3 limited area models ALADIN over tropical areas coupled to IFS
2. Use and application of products 2.1 Post-processing of model output 2.1.1 Statistical adaptation
Millions of local forecasts of weather parameters are produced daily through statistical adaptation of NWP output. Main methods are multiple linear regression (MLR) and linear discriminant analysis (DA). MOS (model output statistics) is generally preferred to PP (perfect prognosis). Kalman filter (KF) is applied when relevant. The production is described in Table 1.
Note the new production of grid point total cloud cover forecast based on a statistical adaptation using satellite data as predictand.
Deterministic model T1279
Parameter Method Domain Number of Sites
Steps
Tri-hourly 2m Temperature MLR (MOS) +KF
France 2781 +3h to +180h by 3h
Daily extremes 2m temperature MLR (MOS) +KF
France 2781 D to D+6
10m Wind Speed MLR (MOS) France 861 +6h to +180h by 3h 10m Wind Direction MLR (MOS) France 822 +6h to +180h by 3h Total Cloud Cover MLR
(MOS)/LDA France 164/152 +12h to +180h by 3h
Total Cloud Cover LDA France GRID
0.5x0.5 0h to +156h by 3h
Tri-hourly 2m relative Humidty
MLR (MOS) +KF
France 1269 +6h to +180h by 3h
Daily extremes 2m rel. Humidity
MLR (MOS) +KF France 1269 D to D+6
Tri-hourly 2m Temperature MLR (MOS) +KF
World 7128 +1h to +180h by 1h
Daily extremes 2m temperature MLR (MOS) +KF
World 7128 D to D+6
Mixed ARPEGE+IFS MLR (MOS) +KF
France 2781 +3h to +102h by 3h
Mixed ARPEGE+IFS MLR (MOS) +KF
World 4367 +1h to +102h by 1h
Table 1 : Statistical adaptations for the deterministic high resolution model

FRANCE FRANCE
2
EPS Statistical adaptation is applied to individual ensemble runs (Table 2). Methods are the same as for the deterministic model output but pseudo-PP (statistical equations computed during the first 24 hours then applied to the other corresponding steps) is preferred to MOS. VAREPS is used and Météo-France provides local forecast (temperatures) up to 14 days.
EPS Ensemble mean and individual members
Parameter Method Domain Number of Sites
Steps
Tri-hourly 2m Temperature MLR (pPP) +KF France 2761 +3h to +360h by 3h Daily extremes 2m temperature MLR (pPP) +KF France 2761 D to D+14 10m Wind Speed MLR France 792 +6h to +240h by 3h
+246 to +360 by 6h Tri-hourly 2m relative Humidty
MLR (pPP) +KF France 1146 0h to +240h by 3h
Daily extremes 2m rel. Humidity
MLR (pPP) +KF France 1146 D to D+10
Tri-hourly 2m Temperature MLR (pPP) +KF World 3338 +0h to +360h by 3h (by 1h for ensemble mean)
Daily extremes 2m temperature MLR (pPP) +KF World 3338 D to D+14
Table 2 : Statistical adaptations for the EPS
EPS Distribution Calibration is applied to the EPS distribution in order to optimize reliability. Operationally, a calibration based on rank diagrams is used for 10m wind speed and total precipitations. Monthly forecast
Statistical models are also applied to the monthly forecasts up to 32 days (Table 3). These locally corrected forecasts allow to couple electricity consumption models.
Parameter Method Domain Number of Sites
Steps
Tri-hourly 2m Temperature MLR (pPP) France 1056 +0h to +768h by 3h Daily extremes 2m temperature MLR (pPP) France 1056 D to D+31 Tri-hourly 2m Temperature MLR (pPP) World 7128 +0h to +768h by 3h Daily extremes 2m temperature MLR (pPP) World 7128 D to D+31
Table 3 : Statistical adaptations for the monthly forecasts
2.1.2 Physical adaptation
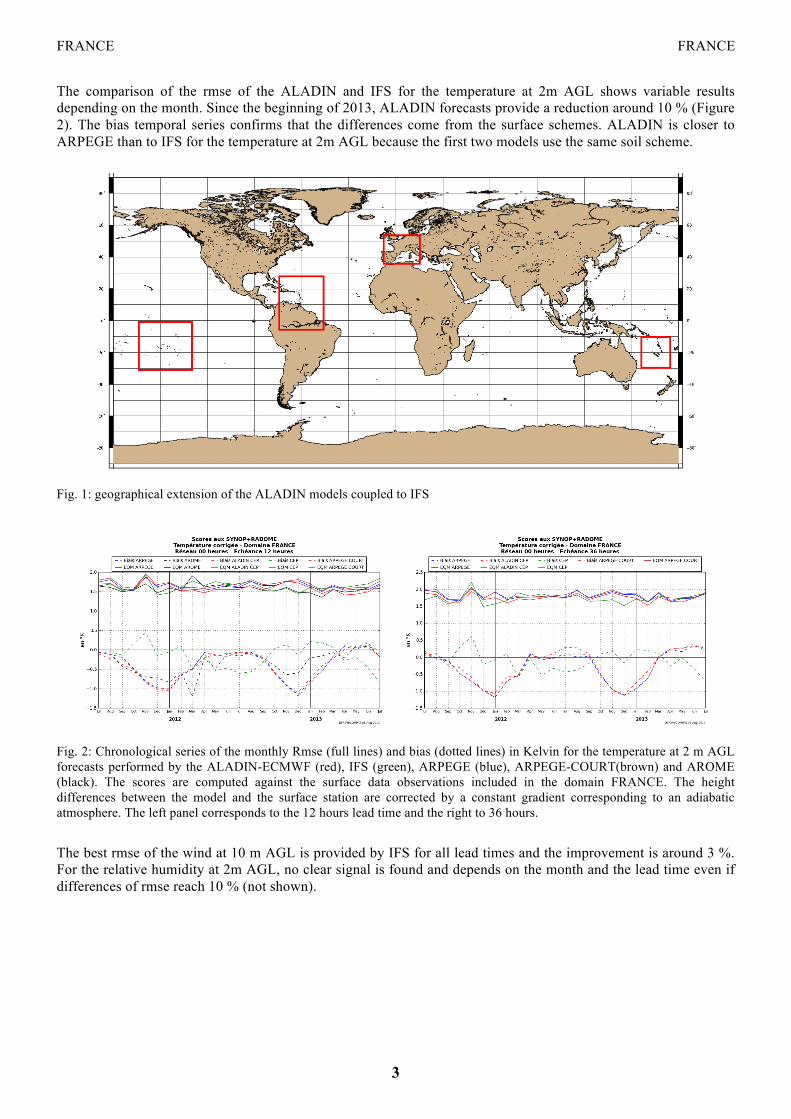
The first physical adaptation is performed by the limited area model (LAM) ALADIN which operates over western Europe (Figure 1). This models performs a dynamical adaptation of the IFS forecasts using a higher horizontal resolution of 7.5 km. The orography and the physiographic data of this ALADIN version are taken from a new database since 02/07/2013 like all the LAM operational at Météo-France. Objective scores have been computed for the surface parameters against the measurements of French surface stations and compared to the IFS forecasts.
FRANCE FRANCE
3
The comparison of the rmse of the ALADIN and IFS for the temperature at 2m AGL shows variable results depending on the month. Since the beginning of 2013, ALADIN forecasts provide a reduction around 10 % (Figure 2). The bias temporal series confirms that the differences come from the surface schemes. ALADIN is closer to ARPEGE than to IFS for the temperature at 2m AGL because the first two models use the same soil scheme.
Fig. 1: geographical extension of the ALADIN models coupled to IFS
Fig. 2: Chronological series of the monthly Rmse (full lines) and bias (dotted lines) in Kelvin for the temperature at 2 m AGL forecasts performed by the ALADIN-ECMWF (red), IFS (green), ARPEGE (blue), ARPEGE-COURT(brown) and AROME (black). The scores are computed against the surface data observations included in the domain FRANCE. The height differences between the model and the surface station are corrected by a constant gradient corresponding to an adiabatic atmosphere. The left panel corresponds to the 12 hours lead time and the right to 36 hours.
The best rmse of the wind at 10 m AGL is provided by IFS for all lead times and the improvement is around 3 %. For the relative humidity at 2m AGL, no clear signal is found and depends on the month and the lead time even if differences of rmse reach 10 % (not shown).

FRANCE FRANCE
4
Three LAM ALADIN have been operated by Météo-France to provide high-resolution forecasts for tropical area including French overseas territories (Figure 1). Their horizontal resolution is equal to 8 km. A 3DVAR assimilation scheme has been developed for these three LAM with 6 hours temporal windows. Two daily runs are performed at 0 and 12 UTC taking their boundary conditions in the IFS runs starting 6 hours before. The maximum lead time is 54 hours. The surface conditions are computed by a specific surface analysis similar to the one used by the French global model ARPEGE since September 2011. A major increase of the number of satellite data became operational the 02/07/2013 with the assimilation of IASI B, CRIS, OCEANSAT and ATMS. The LAM forecasts are compared with the IFS forecasts for surface parameters. For 6 hours accumulated rain, the LAM results are slightly better than their IFS counterparts for the Proportion Correct (PC) diagnostic defined as the number of good forecasts over the number of forecasts (not shown). Both PC present a diurnal cycle with better results during the nights over ANTILLES-GUYANE. The temporal series of the rmse for the wind at 10 m AGL (Figure 3) present a stronger improvement over the NOUVELLE CALEDONIE area than over the ANTILLES-GUYANE area. This difference is likely related to the mountainous characteristics of the domains which increase the advantage due to the higher resolution of ALADIN. The improvement oscillates between 10 and 25 % for the NOUVELLE CALEDONIE area and -5 to 5 % for the ANTILLES-GUYANE area depending on the lead time. For the temperature and relative humidity at 2m AGL (not shown), no improvement is brought by the ALADIN model to the IFS forecasts for both areas.
Fig. 3 Temporal series of the rmse (full lines) and bias (dotted lines) for the wind at 10m AGL in m/s forecasted at 36 hours by ALADIN ANTILLES-GUYANE (blue lines) and IFS (red lines) on the left panel. The reference is provided by the surface stations included in the LAM domain and the errors are monthly averages. The same comparison is presented for the ALADIN CALEDONIE on the right panel at 36 hours.
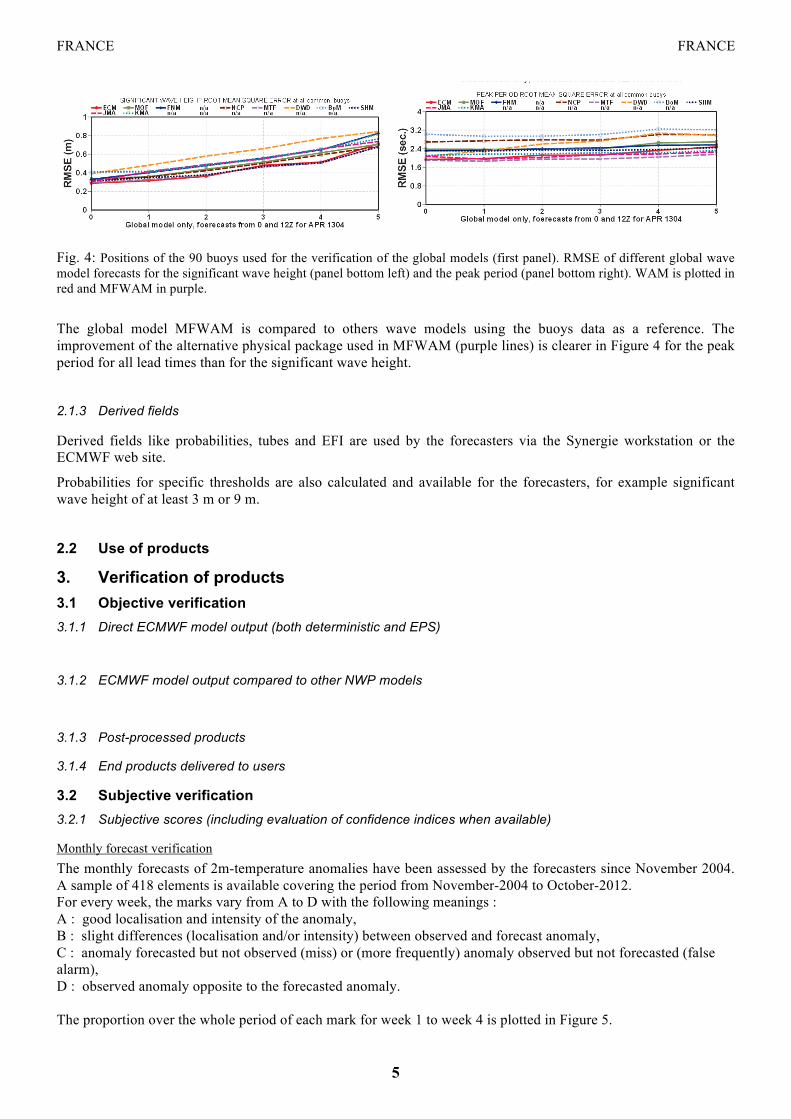
The wind fields of the deterministic ECMWF model provide the forcing of the third generation wave model MFWAM, which is derived from the wave model WAM of ECMWF but used a different physical package. A global version and a regional version centred on Europe used horizontal meshes of 0.5° and 0.1°, respectively.
07-2011
07-2012
07-2013
0
1
2
07-2011
07-2012
07-2013
0
1
2
FRANCE FRANCE
5
Fig. 4: Positions of the 90 buoys used for the verification of the global models (first panel). RMSE of different global wave model forecasts for the significant wave height (panel bottom left) and the peak period (panel bottom right). WAM is plotted in red and MFWAM in purple.
The global model MFWAM is compared to others wave models using the buoys data as a reference. The improvement of the alternative physical package used in MFWAM (purple lines) is clearer in Figure 4 for the peak period for all lead times than for the significant wave height.
2.1.3 Derived fields
Derived fields like probabilities, tubes and EFI are used by the forecasters via the Synergie workstation or the ECMWF web site.
Probabilities for specific thresholds are also calculated and available for the forecasters, for example significant wave height of at least 3 m or 9 m.
2.2 Use of products
3. Verification of products 3.1 Objective verification 3.1.1 Direct ECMWF model output (both deterministic and EPS)
3.1.2 ECMWF model output compared to other NWP models
3.1.3 Post-processed products
3.1.4 End products delivered to users
3.2 Subjective verification 3.2.1 Subjective scores (including evaluation of confidence indices when available)
Monthly forecast verification The monthly forecasts of 2m-temperature anomalies have been assessed by the forecasters since November 2004. A sample of 418 elements is available covering the period from November-2004 to October-2012. For every week, the marks vary from A to D with the following meanings : A : good localisation and intensity of the anomaly, B : slight differences (localisation and/or intensity) between observed and forecast anomaly, C : anomaly forecasted but not observed (miss) or (more frequently) anomaly observed but not forecasted (false alarm), D : observed anomaly opposite to the forecasted anomaly. The proportion over the whole period of each mark for week 1 to week 4 is plotted in Figure 5.

FRANCE FRANCE
6
Fig. 5 : Proportions of subjective notations for the forecast of the anomalies over France monthly temperature at 2m AGL from November 2004 to October 2012 (sample size=418) for week 1 (top left panel), week 2 (top right panel), week 3 (bottom left panel), week 4 (bottom right panel), The forecast quality is very good for week 1 and good for week 2. For the weeks 3 and 4, there are more bad forecasts than good ones. This is mainly due to the important number of C marks, which often correspond to misses where there is no signal in the forecast and an observed anomaly. If we remove the cases where there is no signal in the forecast, the number of good forecasts becomes around 57 % for week 3 and 52 % for week 4. Table 4 corresponds to the comparison between Thursday and Monday monthly forecasts over the period november 2011 – october 2012.
week 1 week 2 week 3 week 4 % Thursday Monday Thursday Monday Thursday Monday Thursday Monday A 68 90 41 57 22 31 6 17 B 14 2 16 17 20 23 21 18 C 8 4 21 10 35 24 67 57 D 10 4 22 16 23 22 6 8
total 100 100 100 100 100 100 100 100 Table 4: Proportions (%) of subjective notations for the forecast of the anomalies over France monthly temperature at
2m AGL for Thursday and Monday forecasts (from november 2011 to october 2012, 51 cases)
Monday forecast improves clearly the scores : proportion of A marks increases whereas proportion of C+D decreases. 3.2.2 Synoptic studies
4. References to relevant publications