Application and testing of a GIS-based sediment ...
1
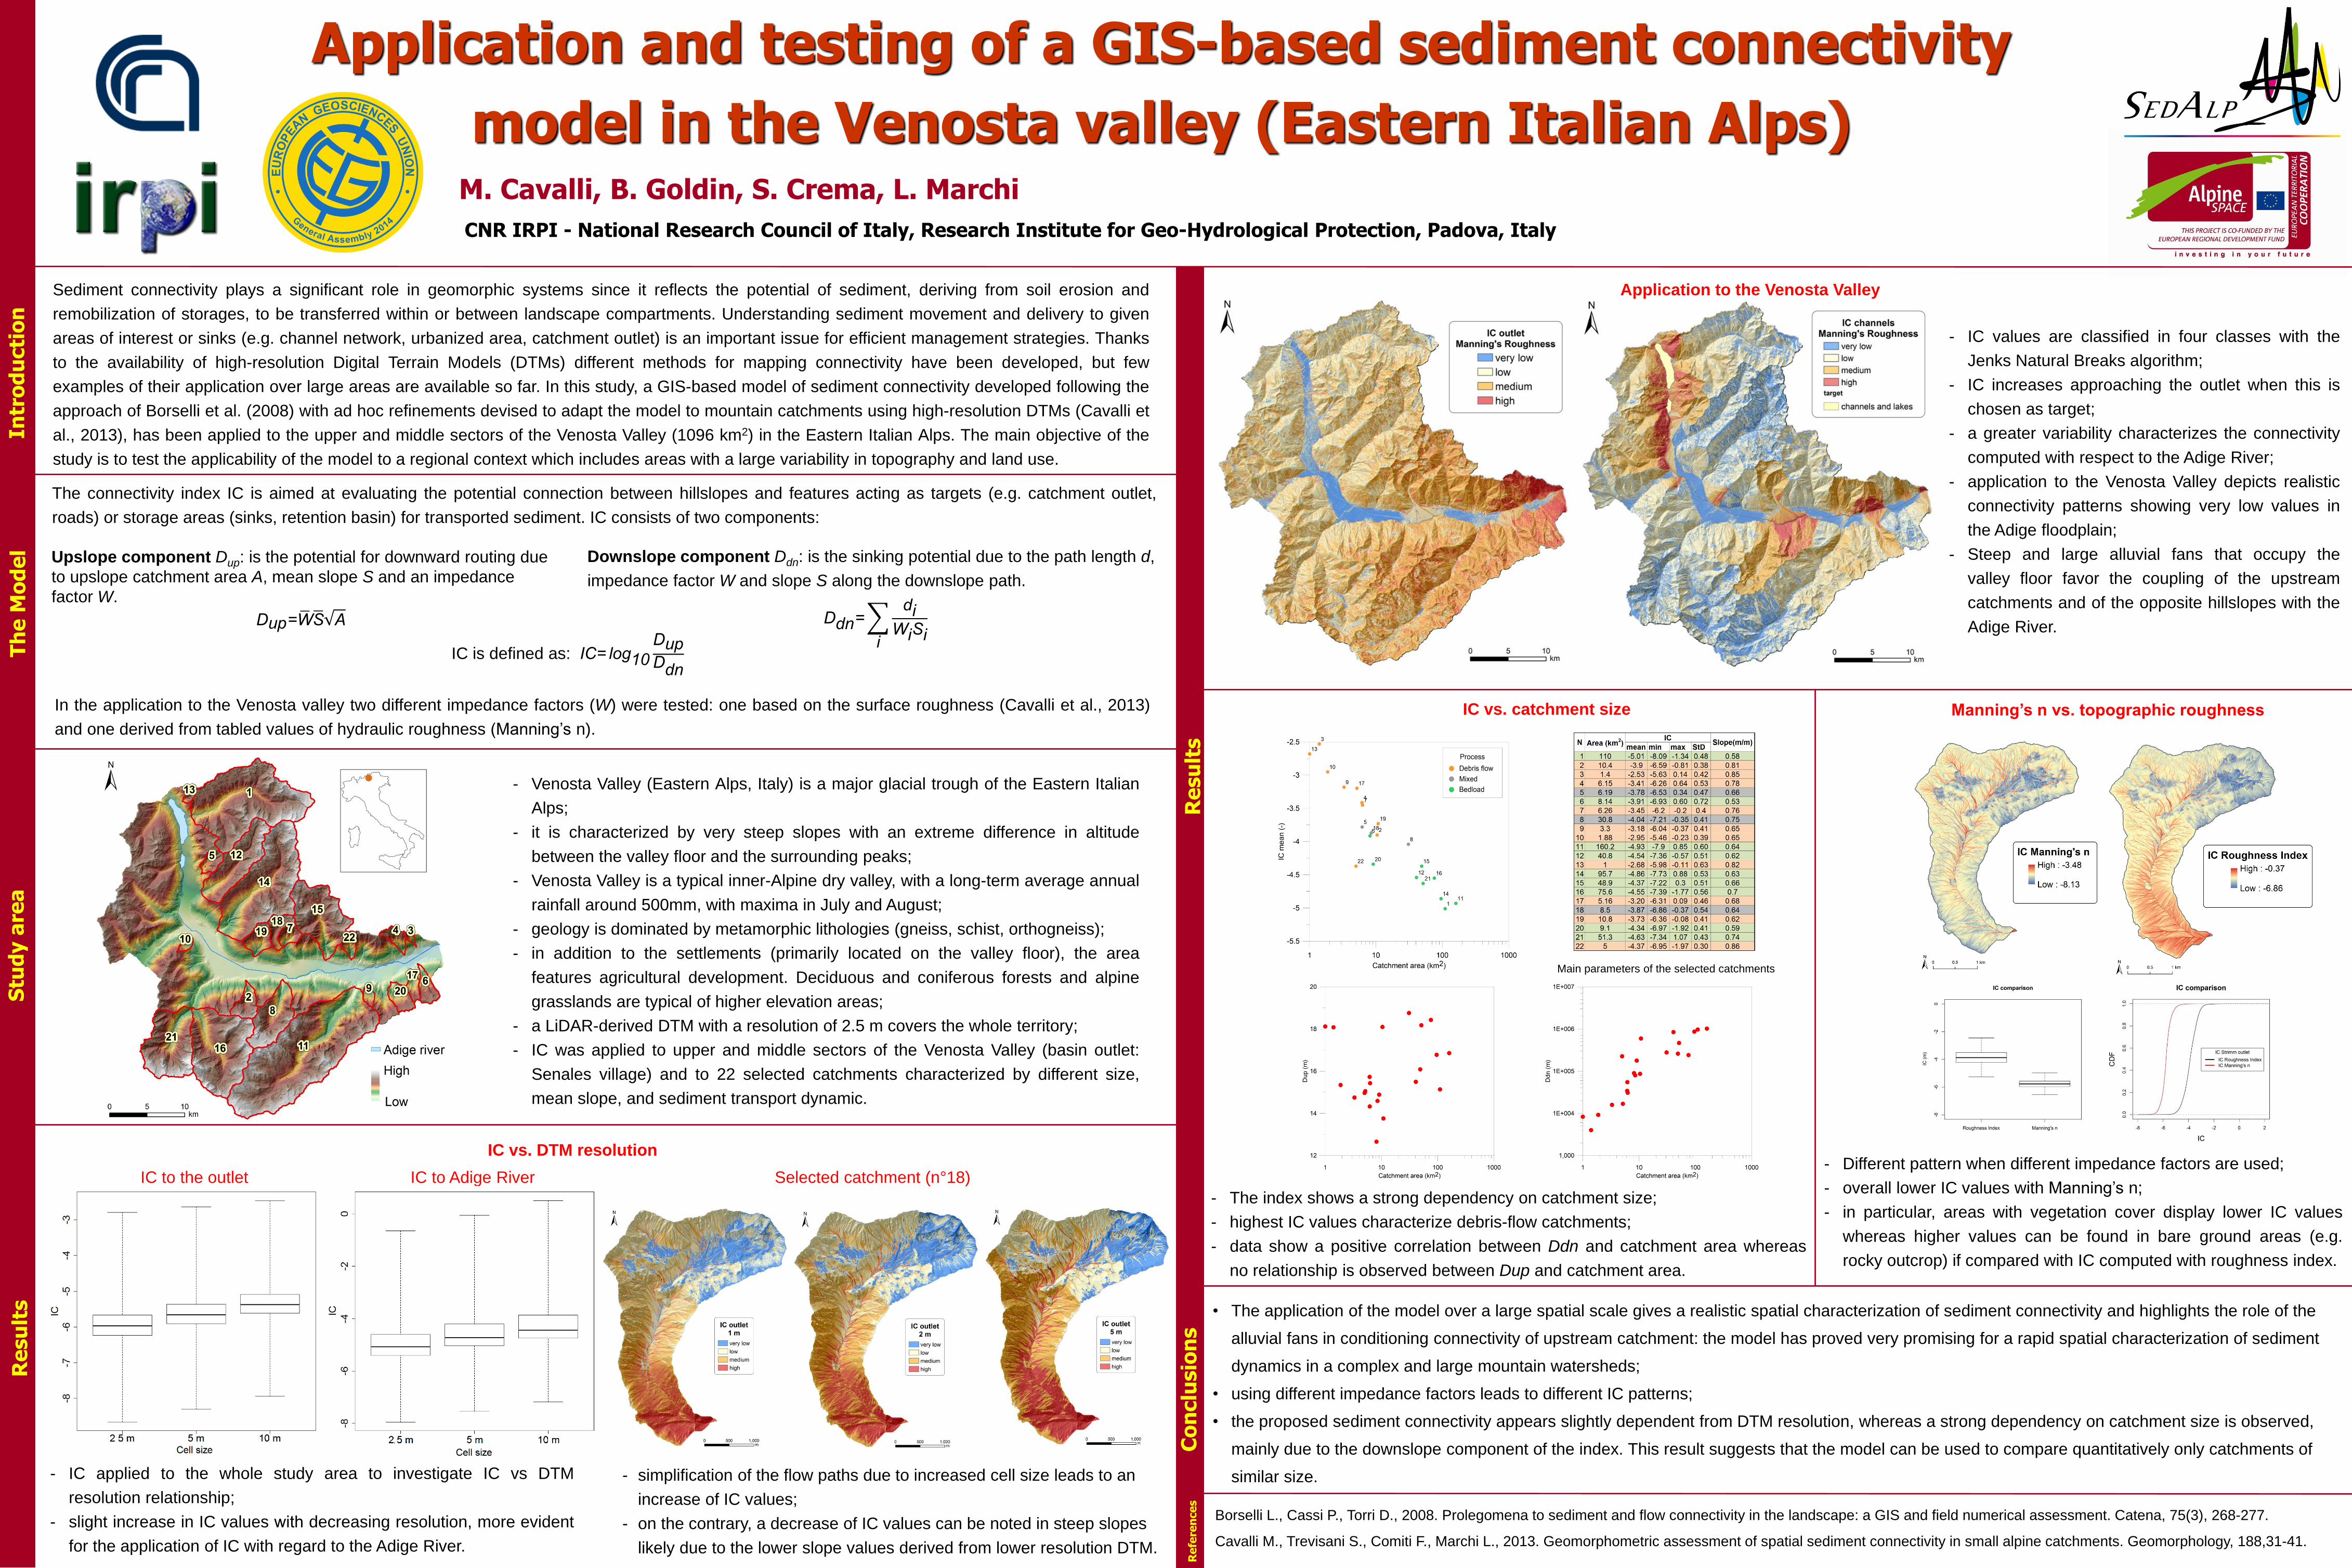
Application and testing of a GIS - based sediment connectivity model in the Venosta valley (Eastern Italian Alps) M. Cavalli, B. Goldin, S. Crema, L. Marchi Introduction The Model Study area CNR IRPI - National Research Council of Italy, Research Institute for Geo-Hydrological Protection, Padova, Italy Results References Conclusions Borselli L., Cassi P., Torri D., 2008. Prolegomena to sediment and flow connectivity in the landscape: a GIS and field numerical assessment. Catena, 75(3), 268-277. Cavalli M., Trevisani S., Comiti F., Marchi L., 2013. Geomorphometric assessment of spatial sediment connectivity in small alpine catchments. Geomorphology, 188,31-41. Sediment connectivity plays a significant role in geomorphic systems since it reflects the potential of sediment, deriving from soil erosion and remobilization of storages, to be transferred within or between landscape compartments. Understanding sediment movement and delivery to given areas of interest or sinks (e.g. channel network, urbanized area, catchment outlet) is an important issue for efficient management strategies. Thanks to the availability of high-resolution Digital Terrain Models (DTMs) different methods for mapping connectivity have been developed, but few examples of their application over large areas are available so far. In this study, a GIS-based model of sediment connectivity developed following the approach of Borselli et al. (2008) with ad hoc refinements devised to adapt the model to mountain catchments using high-resolution DTMs (Cavalli et al., 2013), has been applied to the upper and middle sectors of the Venosta Valley (1096 km 2 ) in the Eastern Italian Alps. The main objective of the study is to test the applicability of the model to a regional context which includes areas with a large variability in topography and land use. The connectivity index IC is aimed at evaluating the potential connection between hillslopes and features acting as targets (e.g. catchment outlet, roads) or storage areas (sinks, retention basin) for transported sediment. IC consists of two components: - Venosta Valley (Eastern Alps, Italy) is a major glacial trough of the Eastern Italian Alps; - it is characterized by very steep slopes with an extreme difference in altitude between the valley floor and the surrounding peaks; - Venosta Valley is a typical inner-Alpine dry valley, with a long-term average annual rainfall around 500mm, with maxima in July and August; - geology is dominated by metamorphic lithologies (gneiss, schist, orthogneiss); - in addition to the settlements (primarily located on the valley floor), the area features agricultural development. Deciduous and coniferous forests and alpine grasslands are typical of higher elevation areas; - a LiDAR-derived DTM with a resolution of 2.5 m covers the whole territory; - IC was applied to upper and middle sectors of the Venosta Valley (basin outlet: Senales village) and to 22 selected catchments characterized by different size, mean slope, and sediment transport dynamic. • The application of the model over a large spatial scale gives a realistic spatial characterization of sediment connectivity and highlights the role of the alluvial fans in conditioning connectivity of upstream catchment: the model has proved very promising for a rapid spatial characterization of sediment dynamics in a complex and large mountain watersheds; • using different impedance factors leads to different IC patterns; • the proposed sediment connectivity appears slightly dependent from DTM resolution, whereas a strong dependency on catchment size is observed, mainly due to the downslope component of the index. This result suggests that the model can be used to compare quantitatively only catchments of similar size. Results - IC applied to the whole study area to investigate IC vs DTM resolution relationship; - slight increase in IC values with decreasing resolution, more evident for the application of IC with regard to the Adige River. IC to the outlet IC to Adige River - simplification of the flow paths due to increased cell size leads to an increase of IC values; - on the contrary, a decrease of IC values can be noted in steep slopes likely due to the lower slope values derived from lower resolution DTM. - IC values are classified in four classes with the Jenks Natural Breaks algorithm; - IC increases approaching the outlet when this is chosen as target; - a greater variability characterizes the connectivity computed with respect to the Adige River; - application to the Venosta Valley depicts realistic connectivity patterns showing very low values in the Adige floodplain; - Steep and large alluvial fans that occupy the valley floor favor the coupling of the upstream catchments and of the opposite hillslopes with the Adige River. - The index shows a strong dependency on catchment size; - highest IC values characterize debris-flow catchments; - data show a positive correlation between Ddn and catchment area whereas no relationship is observed between Dup and catchment area. IC vs. catchment size Application to the Venosta Valley Manning’s n vs. topographic roughness - Different pattern when different impedance factors are used; - overall lower IC values with Manning’s n; - in particular, areas with vegetation cover display lower IC values whereas higher values can be found in bare ground areas (e.g. rocky outcrop) if compared with IC computed with roughness index. Upslope component D up : is the potential for downward routing due to upslope catchment area A, mean slope S and an impedance factor W. D up = W S A Downslope component D dn : is the sinking potential due to the path length d, impedance factor W and slope S along the downslope path. D dn = i d i W i S i IC is defined as: IC= log 10 D up D dn In the application to the Venosta valley two different impedance factors (W) were tested: one based on the surface roughness (Cavalli et al., 2013) and one derived from tabled values of hydraulic roughness (Manning’s n). IC vs. DTM resolution Selected catchment (n°18) Main parameters of the selected catchments
Transcript of Application and testing of a GIS-based sediment ...
Application and testing of a GIS-based sediment connectivity
model in the Venosta valley (Eastern Italian Alps)M. Cavalli, B. Goldin, S. Crema, L. Marchi
Intr
od
ucti
on
Th
e M
od
el
Stu
dy a
rea
CNR IRPI - National Research Council of Italy, Research Institute for Geo-Hydrological Protection, Padova, Italy
Re
su
lts
Re
fere
nce
sC
on
clu
sio
ns
Borselli L., Cassi P., Torri D., 2008. Prolegomena to sediment and flow connectivity in the landscape: a GIS and field numerical assessment. Catena, 75(3), 268-277.
Cavalli M., Trevisani S., Comiti F., Marchi L., 2013. Geomorphometric assessment of spatial sediment connectivity in small alpine catchments. Geomorphology, 188,31-41.
Sediment connectivity plays a significant role in geomorphic systems since it reflects the potential of sediment, deriving from soil erosion and
remobilization of storages, to be transferred within or between landscape compartments. Understanding sediment movement and delivery to given
areas of interest or sinks (e.g. channel network, urbanized area, catchment outlet) is an important issue for efficient management strategies. Thanks
to the availability of high-resolution Digital Terrain Models (DTMs) different methods for mapping connectivity have been developed, but few
examples of their application over large areas are available so far. In this study, a GIS-based model of sediment connectivity developed following the
approach of Borselli et al. (2008) with ad hoc refinements devised to adapt the model to mountain catchments using high-resolution DTMs (Cavalli et
al., 2013), has been applied to the upper and middle sectors of the Venosta Valley (1096 km2) in the Eastern Italian Alps. The main objective of the
study is to test the applicability of the model to a regional context which includes areas with a large variability in topography and land use.
The connectivity index IC is aimed at evaluating the potential connection between hillslopes and features acting as targets (e.g. catchment outlet,
roads) or storage areas (sinks, retention basin) for transported sediment. IC consists of two components:
- Venosta Valley (Eastern Alps, Italy) is a major glacial trough of the Eastern Italian
Alps;
- it is characterized by very steep slopes with an extreme difference in altitude
between the valley floor and the surrounding peaks;
- Venosta Valley is a typical inner-Alpine dry valley, with a long-term average annual
rainfall around 500mm, with maxima in July and August;
- geology is dominated by metamorphic lithologies (gneiss, schist, orthogneiss);
- in addition to the settlements (primarily located on the valley floor), the area
features agricultural development. Deciduous and coniferous forests and alpine
grasslands are typical of higher elevation areas;
- a LiDAR-derived DTM with a resolution of 2.5 m covers the whole territory;
- IC was applied to upper and middle sectors of the Venosta Valley (basin outlet:
Senales village) and to 22 selected catchments characterized by different size,
mean slope, and sediment transport dynamic.
• The application of the model over a large spatial scale gives a realistic spatial characterization of sediment connectivity and highlights the role of the
alluvial fans in conditioning connectivity of upstream catchment: the model has proved very promising for a rapid spatial characterization of sediment
dynamics in a complex and large mountain watersheds;
• using different impedance factors leads to different IC patterns;
• the proposed sediment connectivity appears slightly dependent from DTM resolution, whereas a strong dependency on catchment size is observed,
mainly due to the downslope component of the index. This result suggests that the model can be used to compare quantitatively only catchments of
similar size.
Re
su
lts
- IC applied to the whole study area to investigate IC vs DTM
resolution relationship;
- slight increase in IC values with decreasing resolution, more evident
for the application of IC with regard to the Adige River.
IC to the outlet IC to Adige River
- simplification of the flow paths due to increased cell size leads to an
increase of IC values;
- on the contrary, a decrease of IC values can be noted in steep slopes
likely due to the lower slope values derived from lower resolution DTM.
- IC values are classified in four classes with the
Jenks Natural Breaks algorithm;
- IC increases approaching the outlet when this is
chosen as target;
- a greater variability characterizes the connectivity
computed with respect to the Adige River;
- application to the Venosta Valley depicts realistic
connectivity patterns showing very low values in
the Adige floodplain;
- Steep and large alluvial fans that occupy the
valley floor favor the coupling of the upstream
catchments and of the opposite hillslopes with the
Adige River.
- The index shows a strong dependency on catchment size;
- highest IC values characterize debris-flow catchments;
- data show a positive correlation between Ddn and catchment area whereas
no relationship is observed between Dup and catchment area.
IC vs. catchment size
Application to the Venosta Valley
Manning’s n vs. topographic roughness
- Different pattern when different impedance factors are used;
- overall lower IC values with Manning’s n;
- in particular, areas with vegetation cover display lower IC values
whereas higher values can be found in bare ground areas (e.g.
rocky outcrop) if compared with IC computed with roughness index.
Upslope component Dup: is the potential for downward routing due
to upslope catchment area A, mean slope S and an impedance
factor W.
Dup= W S A
Downslope component Ddn: is the sinking potential due to the path length d,
impedance factor W and slope S along the downslope path.
Ddn=
i
diWiSi
IC is defined as: IC= log10
DupDdn
In the application to the Venosta valley two different impedance factors (W) were tested: one based on the surface roughness (Cavalli et al., 2013)
and one derived from tabled values of hydraulic roughness (Manning’s n).
IC vs. DTM resolution
Selected catchment (n°18)
Main parameters of the selected catchments