Appliances facilitating everyday life – electricity use...
8
Appliances facilitating everyday life – electricity use derived from daily activities Kajsa Ellegård 1,* , Joakim Widén 2 , Katerina Vrotsou 3 1 Dept of Thematic Studies, Linköping University, Sweden 2 Dept of Engineering Sciences, Uppsala University, Sweden 3 Dept of Science and Technology, Linköping University, Sweden *Corresponding author. Tel +4613285836; Fax +4613284461; e-mail: [email protected] Abstract: The purpose of this paper is to present how, using a visualization method, electricity use can be derived from the everyday activity patterns of household members. Target groups are, on the one hand, professionals in the energy sector and energy advisors who need more knowledge about household energy use, and, on the other hand, household members wanting to reduce the energy use by revealing their own habits and thereby finding out how changed activity performance may influence electricity use. The focus is on the relation between utilizing electric appliances to perform everyday life activities and the use of electricity. The visualization method is based on the time-geographic approach developed by Hägerstrand and includes a model that estimates appliance electricity use from household members’ activities. Focus, in this paper, is put on some basic activities performed to satisfy daily life needs: cooking and use of information, communication and entertainment devices. These activities appear frequently in the everyday life of households, even though not all household members perform them all. The method is applied on a data material comprising time-diaries written by 463 individuals (aged 10 to 85+) in 179 households in different parts of Sweden. The visualization method reveals when and for how long activities that claim electric appliances are performed by which individual(s). It also shows electricity load curves generated from the use of appliances at different levels, such as individual, household and group or population levels. At household level the method can reveal which household members are the main users of electricity, i.e. the division of labour between household members. Thereby it also informs about whom could be approached by energy companies and energy advisors in information campaigns. The main result of the study is that systematic differences in activity patterns in subgroups of a population can be identified (e.g. men and women) but that directed information based on these patterns has to be made with care and with the risk of making too broad generalizations. Keywords: Electricity use, Everyday activity sequence, Visualization, Activity pattern, Load curve. 1. Introduction Information is a relatively cheap way to make efforts to influence people to change their everyday life activities in order to better comply with the policies aiming at mitigating climate change from overuse of resources, among them electricity [1,2]. Information as a means to influence people’s daily routines is not effective unless the individuals judge the information to be relevant to them. Therefore information must be targeted carefully. Who is to be targeted with information about energy saving and energy efficiency activities? This question has to do with the correspondence between which household members are in the energy company’s billing register and which household member(s) utilize the electricity demanding appliances in the home. The aim of this paper is to present how the visualization method VISUAL-TimePAcTS/energy use 1 can be used to study energy use in households and can facilitate the identification of the actual users of electric appliances within these households. Thereby relevant information for various target groups can be developed. The method has been developed in an interdisciplinary research group in which scientists from social science, visualization science and physics cooperate on a long term basis [3,4,5,6,7]. The method aids 1 VISUAL-TimePAcTS: VISUAL = visualization, P = place, Ac = activity, T = technology, S = social companionship; time is, of course, time. 1031
Transcript of Appliances facilitating everyday life – electricity use...
Appliances facilitating everyday life – electricity use derived from daily activities
Kajsa Ellegård1,*, Joakim Widén2, Katerina Vrotsou3
1Dept of Thematic Studies, Linköping University, Sweden 2Dept of Engineering Sciences, Uppsala University, Sweden
3Dept of Science and Technology, Linköping University, Sweden *Corresponding author. Tel +4613285836; Fax +4613284461; e-mail: [email protected]
Abstract: The purpose of this paper is to present how, using a visualization method, electricity use can be derived from the everyday activity patterns of household members. Target groups are, on the one hand, professionals in the energy sector and energy advisors who need more knowledge about household energy use, and, on the other hand, household members wanting to reduce the energy use by revealing their own habits and thereby finding out how changed activity performance may influence electricity use. The focus is on the relation between utilizing electric appliances to perform everyday life activities and the use of electricity. The visualization method is based on the time-geographic approach developed by Hägerstrand and includes a model that estimates appliance electricity use from household members’ activities. Focus, in this paper, is put on some basic activities performed to satisfy daily life needs: cooking and use of information, communication and entertainment devices. These activities appear frequently in the everyday life of households, even though not all household members perform them all. The method is applied on a data material comprising time-diaries written by 463 individuals (aged 10 to 85+) in 179 households in different parts of Sweden. The visualization method reveals when and for how long activities that claim electric appliances are performed by which individual(s). It also shows electricity load curves generated from the use of appliances at different levels, such as individual, household and group or population levels. At household level the method can reveal which household members are the main users of electricity, i.e. the division of labour between household members. Thereby it also informs about whom could be approached by energy companies and energy advisors in information campaigns. The main result of the study is that systematic differences in activity patterns in subgroups of a population can be identified (e.g. men and women) but that directed information based on these patterns has to be made with care and with the risk of making too broad generalizations.
Keywords: Electricity use, Everyday activity sequence, Visualization, Activity pattern, Load curve.
1. Introduction Information is a relatively cheap way to make efforts to influence people to change their everyday life activities in order to better comply with the policies aiming at mitigating climate change from overuse of resources, among them electricity [1,2]. Information as a means to influence people’s daily routines is not effective unless the individuals judge the information to be relevant to them. Therefore information must be targeted carefully. Who is to be targeted with information about energy saving and energy efficiency activities? This question has to do with the correspondence between which household members are in the energy company’s billing register and which household member(s) utilize the electricity demanding appliances in the home. The aim of this paper is to present how the visualization method VISUAL-TimePAcTS/energy use1can be used to study energy use in households and can facilitate the identification of the actual users of electric appliances within these households. Thereby relevant information for various target groups can be developed. The method has been developed in an interdisciplinary research group in which scientists from social science, visualization science and physics cooperate on a long term basis [3,4,5,6,7]. The method aids
1 VISUAL-TimePAcTS: VISUAL = visualization, P = place, Ac = activity, T = technology, S = social companionship; time is, of course, time.
1031

in increasing our knowledge about human daily activities and the use of electric appliances for performing them. Gram-Hanssen showed that even if households are similar in many respects, their energy use may differ a lot [8]. This has to be handled. A basic assumption is that in order to influence people to change their everyday life habits and routines, the information presented to them must address problems that are relevant to them. This means that they should be able to recognize their own daily situation in the material presented and thereby find substance in the arguments. 2. Method and the models for accounting electricity use VISUAL-TimePAcTS/energy use is developed in the tradition of time geography [9,10,11,12] and its point of departure is the individual and her daily activities as they are seen in a sequence over the day. If data allows (i.e. if there are diaries from more than one person in a multi person household), the individual is seen in the context of her household. Even when individuals are aggregated to group or population levels the important information distinguishing one individual from another is still visible, figure 1. The data used for developing the method is collected by Statistics Sweden in a pilot study in 1996. An important and valuable characteristic of this dataset is that it contains individuals in households, i.e. individuals of 10 years and older in the 179 households have written time-diaries. The age span of the total dataset is 10 to 97 years and the household sizes vary from 1 person upwards. The households included in the study are situated in different parts of Sweden and their income, education and accommodation forms vary. The individuals (N=463) have written time-diaries during one weekday and one weekend day. Their weekday activity sequences forming an activity pattern of the population is shown in figure 1 (right). Members of the same household have written diaries on the same date, which means that it is possible to couple and compare the individuals’ activities to each other. For example, which person cooks and which person buys the ingredients for cooking within the same household can be revealed. The diary data considered in this paper are categorized into 7 main activity categories and each of these categories is broken up into more detailed descriptions of a performed activity. Apart from activity type, information about companionship while performing each activity is also available, meaning together with whom or what appliance an individual is. This makes possible the extraction of information concerning energy use of individuals, households and whole populations. A model for computing load profiles for household electricity and hot water use based on activities has been presented by Widén [13,14]. In the developed model, activity diary data are converted to energy load profiles by considering an energy-use category and a corresponding energy-use pattern for each activity. Each energy-use category is described by a number of parameter values corresponding to standard powers and runtime of appliances used for performing activities within it (fig. 2, right). There are two main schemes describing how energy is consumed while performing activities (fig. 2, left). The first one includes activities that consume energy while they are being performed, like cooking, watching TV or using the radio. The second scheme refers to activities that start consuming energy for a period of time after the activity has been completed, like starting the washing machine or dishwasher. Based on these energy use schemes and the energy type parameter values for
1032
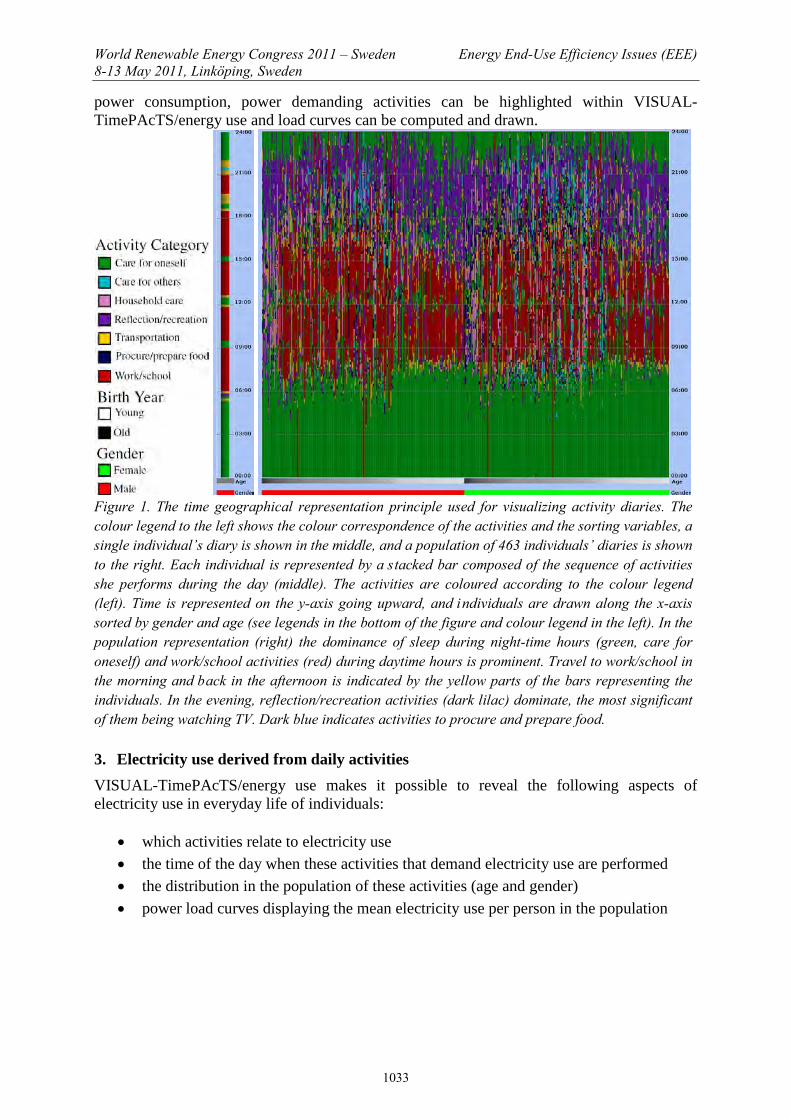
power consumption, power demanding activities can be highlighted within VISUAL-TimePAcTS/energy use and load curves can be computed and drawn.
Figure 1. The time geographical representation principle used for visualizing activity diaries. The colour legend to the left shows the colour correspondence of the activities and the sorting variables, a single individual’s diary is shown in the middle, and a population of 463 individuals’ diaries is shown to the right. Each individual is represented by a stacked bar composed of the sequence of activities she performs during the day (middle). The activities are coloured according to the colour legend (left). Time is represented on the y-axis going upward, and individuals are drawn along the x-axis sorted by gender and age (see legends in the bottom of the figure and colour legend in the left). In the population representation (right) the dominance of sleep during night-time hours (green, care for oneself) and work/school activities (red) during daytime hours is prominent. Travel to work/school in the morning and back in the afternoon is indicated by the yellow parts of the bars representing the individuals. In the evening, reflection/recreation activities (dark lilac) dominate, the most significant of them being watching TV. Dark blue indicates activities to procure and prepare food. 3. Electricity use derived from daily activities VISUAL-TimePAcTS/energy use makes it possible to reveal the following aspects of electricity use in everyday life of individuals:
• which activities relate to electricity use • the time of the day when these activities that demand electricity use are performed • the distribution in the population of these activities (age and gender) • power load curves displaying the mean electricity use per person in the population
1033
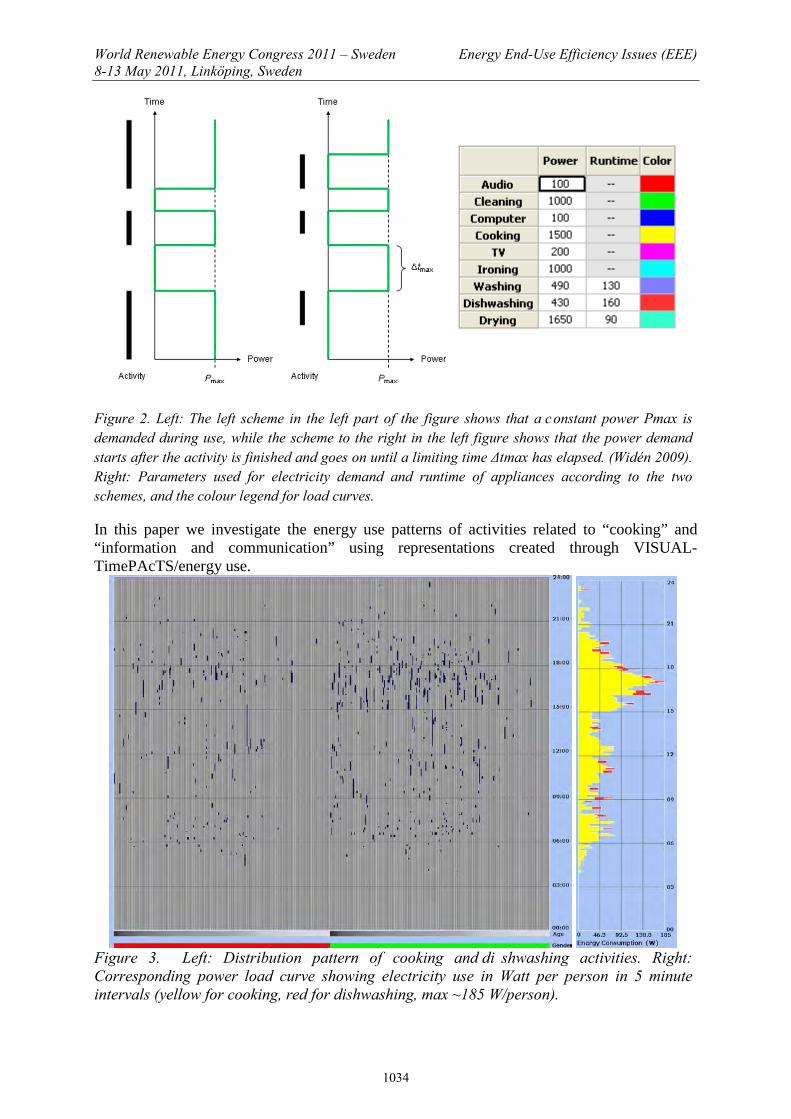
Figure 2. Left: The left scheme in the left part of the figure shows that a constant power Pmax is demanded during use, while the scheme to the right in the left figure shows that the power demand starts after the activity is finished and goes on until a limiting time Δtmax has elapsed. (Widén 2009). Right: Parameters used for electricity demand and runtime of appliances according to the two schemes, and the colour legend for load curves.
In this paper we investigate the energy use patterns of activities related to “cooking” and “information and communication” using representations created through VISUAL-TimePAcTS/energy use.
Figure 3. Left: Distribution pattern of cooking and di shwashing activities. Right: Corresponding power load curve showing electricity use in Watt per person in 5 minute intervals (yellow for cooking, red for dishwashing, max ~185 W/person).
1034
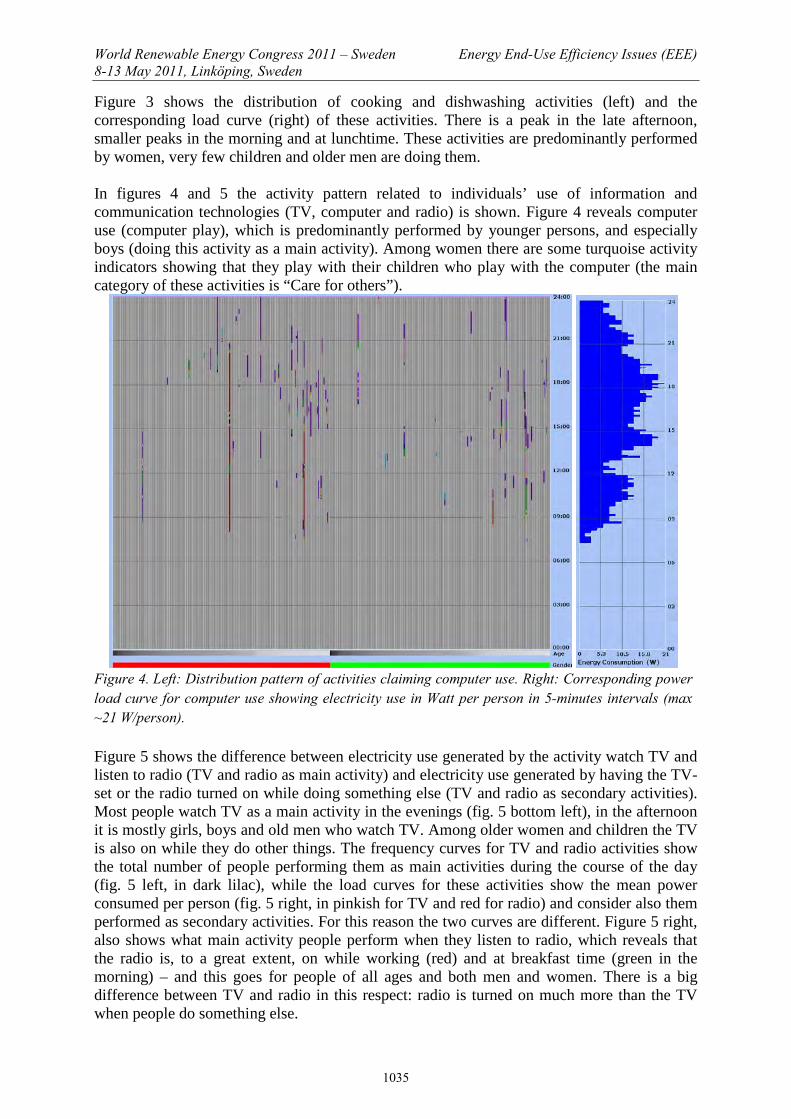
Figure 3 shows the distribution of cooking and dishwashing activities (left) and the corresponding load curve (right) of these activities. There is a peak in the late afternoon, smaller peaks in the morning and at lunchtime. These activities are predominantly performed by women, very few children and older men are doing them. In figures 4 and 5 the activity pattern related to individuals’ use of information and communication technologies (TV, computer and radio) is shown. Figure 4 reveals computer use (computer play), which is predominantly performed by younger persons, and especially boys (doing this activity as a main activity). Among women there are some turquoise activity indicators showing that they play with their children who play with the computer (the main category of these activities is “Care for others”).
Figure 4. Left: Distribution pattern of activities claiming computer use. Right: Corresponding power load curve for computer use showing electricity use in Watt per person in 5-minutes intervals (max ~21 W/person).
Figure 5 shows the difference between electricity use generated by the activity watch TV and listen to radio (TV and radio as main activity) and electricity use generated by having the TV-set or the radio turned on while doing something else (TV and radio as secondary activities). Most people watch TV as a main activity in the evenings (fig. 5 bottom left), in the afternoon it is mostly girls, boys and old men who watch TV. Among older women and children the TV is also on while they do other things. The frequency curves for TV and radio activities show the total number of people performing them as main activities during the course of the day (fig. 5 left, in dark lilac), while the load curves for these activities show the mean power consumed per person (fig. 5 right, in pinkish for TV and red for radio) and consider also them performed as secondary activities. For this reason the two curves are different. Figure 5 right, also shows what main activity people perform when they listen to radio, which reveals that the radio is, to a great extent, on while working (red) and at breakfast time (green in the morning) – and this goes for people of all ages and both men and women. There is a big difference between TV and radio in this respect: radio is turned on much more than the TV when people do something else.
1035
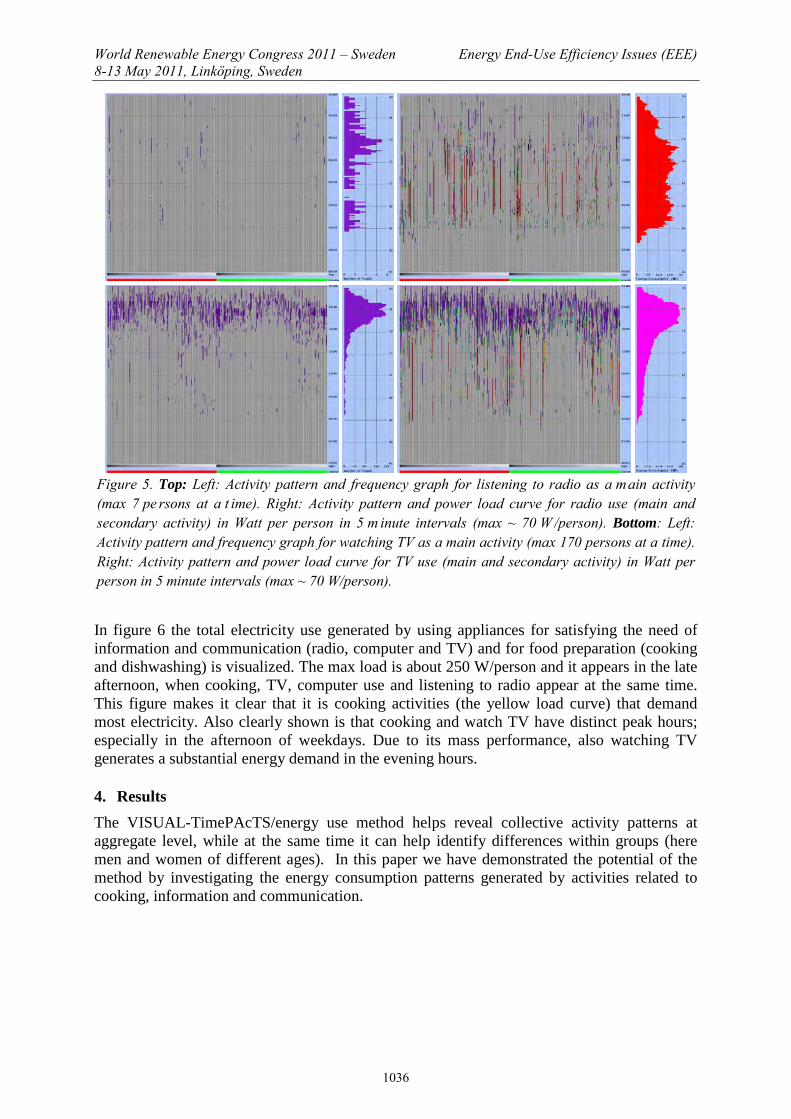
Figure 5. Top: Left: Activity pattern and frequency graph for listening to radio as a main activity (max 7 pe rsons at a t ime). Right: Activity pattern and power load curve for radio use (main and secondary activity) in Watt per person in 5 m inute intervals (max ~ 70 W /person). Bottom: Left: Activity pattern and frequency graph for watching TV as a main activity (max 170 persons at a time). Right: Activity pattern and power load curve for TV use (main and secondary activity) in Watt per person in 5 minute intervals (max ~ 70 W/person).
In figure 6 the total electricity use generated by using appliances for satisfying the need of information and communication (radio, computer and TV) and for food preparation (cooking and dishwashing) is visualized. The max load is about 250 W/person and it appears in the late afternoon, when cooking, TV, computer use and listening to radio appear at the same time. This figure makes it clear that it is cooking activities (the yellow load curve) that demand most electricity. Also clearly shown is that cooking and watch TV have distinct peak hours; especially in the afternoon of weekdays. Due to its mass performance, also watching TV generates a substantial energy demand in the evening hours. 4. Results The VISUAL-TimePAcTS/energy use method helps reveal collective activity patterns at aggregate level, while at the same time it can help identify differences within groups (here men and women of different ages). In this paper we have demonstrated the potential of the method by investigating the energy consumption patterns generated by activities related to cooking, information and communication.
1036

Figure 6. Left: Distribution pattern of all activities claiming the use of the considered electric appliances; TV, radio, computer, kitchen appliances. Right: Corresponding power load curve showing electricity use in Watt per person in 5 minute intervals (max ~250 W/person).
Through this example it becomes obvious that cooking is a daily activity that is to a large extent female gendered. Also shown is that children do not cook. The use of the TV-set is more equally divided between genders and is primarily performed in the evenings, but it differs with respect to age –younger people watch TV also in the afternoon after school. There were big differences between ages when it comes to computer use which was dominated by boys. Listening to radio was more evenly spread over the day, and between ages and gender. Finally, watching TV and especially listening to radio are activities that allow people to do other things and are often performed as secondary activities. This is especially true for listening to radio, an activity that seldom appear in its own right. 5. Conclusions and recommendation The knowledge that can be acquired from representations created through VISUAL-TimePAcTS/energy use can be useful when policy makers and energy companies try to target information in order to reduce energy use and make it more efficient. For example, in a household with a man and a woman where the man receives the electricity bill, the man might not be the ideal receiver of attached information about energy-efficient cooking because, as we have seen, women cook more often. Information directed to women would perhaps be more effective. However, such directed information faces the risk of being too generalized and not reflecting the diversity between households in terms of both habits and family constellations. This particular analysis is also limited because of the relatively old data. In general, the visualizations can be used to improve knowledge about what purpose people utilize electric appliances for. At individual and household levels the method can be utilized for communicating energy efficiency advice since it is easy for the individuals to recognize
1037
their own daily life in the visualizations of their time-diaries. In order to improve its general applicability, the method will be extended with a module for heating, hot water use and energy use for daily transportation. The method can serve as complement, and maybe also as substitute, to expensive metering studies. References [1] Lindén, Anna-Lisa, Carlsson-Kanyama, Annika & Eriksson, B (2006), Efficient and
inefficient aspects of residential energy behavior. What are the policy instruments of change”, Energy Policy, 34, 1918-1927.
[2] Lindén, Anna-Lisa (2007) Hushållens energianvändning och styrmedelsstrategier, Report ER 2007:41, Swedish Energy Agency, Eskilstuna, Sweden.
[3] Ellegård, Kajsa & Cooper, Matthew (2004) Complexity in daily life: A 3D visualisation showing activity patterns in their contexts. eIJTUR, 37, 37–59.
[4] Ellegård, Kajsa & Vrotsou, Katerina (2006) Capturing patterns of everyday life – presentation of the visualization method VISUAL-TimePAcTS, Paper presented at the IATUR Annual Conference 2006. Copenhagen.
[5] Vrotsou, Katerina, Ellegård, Kajsa & Cooper, Matthew (2009) Exploring time diaries using semi-automated activity pattern extraction. Electronic International Journal of Time Use Research 2009, Vol. 6, No. 1, 1-25.
[6] Ellegård, Kajsa, Vrotsou, Katerina & Widén, Joakim (2010) VISUAL-TimePAcTS/energy use – a software application for visualizing energy use from activities performed. Paper presented at the Scientific session, Energitinget, Stockholm Älvsjö Fairs. March 2010 (http://works.bepress.com/dr_erik_dahlquist/6/)
[7] Vrotsou, Katerina (2010) Everyday mining. Exploring sequences in event-based data. Linköping studies in Science and technology. Dissertations no 1331. Linköping University, Sweden
[8] Gram-Hanssen, Kirsten (2004) Different Everyday Lives – Different Patterns of Electricity Use. In: Proceedings of the 2004 American Council for an Energy Efficient Economy. Summer study in Buildings. Washington DC: ACEEE.
[9] Hägerstrand, Torsten (1974) Tidsgeografisk beskrivning - syfte och postulat. Svensk Geografisk Årsbok 50, 86-94.
[10] Hägerstrand, Torsten (1985) Time-Geography. Focus on the Corporeality of Man, Society and Environment. The Science and Praxis of Complexity. The United Nations University, Tokyo, pp 193-216. French translation in Science et pratique de la complexité La Documentation Francaise, Paris 1986, pp 225-250
[11] Hägerstrand, Torsten & Lenntorp, Bo (1993) Region och miljö - sammanfattning av ett projekt om ekologiska perspektiv på den rumsliga närings- och bosättningsstrukturen, NordREFO 1993:5. pp 229-237.
[12] Hägerstrand, Torsten (2009) Tillvaroväven. (K Ellegård & U Svedin Eds). Forskningsrådet Formas, Stockholm.
[13] Widén, Joakim (2009) Distributed Photovoltaics in the Swedish Energy System. Model Development and Simulations. Licentiate Thesis, Uppsala University, Sweden.
[14] Widén, Joakim (2010) System Studies and Simulations of Distributed Photovoltaics in Sweden. PhD Thesis, Uppsala University, Sweden.
1038