Apple q3'15 commentary intro
10
Aquilla Apple Results Q3 2015 Summary and Commentary Note: Apple Q3 = Calendar Q2 These data are derived from results published by Apple, Inc., from the published results of other companies, and from assorted independent analysts, as identified in the slides. The opinions are those of the author, and should in no way be interpreted as investment advice.
-
Upload
aquilla-europe -
Category
Technology
-
view
35 -
download
3
Transcript of Apple q3'15 commentary intro
Aquilla
Apple Results Q3 2015Summary and Commentary
Note: Apple Q3 = Calendar Q2
These data are derived from results published by Apple, Inc., from the published results
of other companies, and from assorted independent analysts, as identified in the slides.
The opinions are those of the author, and should in no way be interpreted as
investment advice.

AquillaSource: Apple Results
Quarterly RevenueGrowth Accelerates •Revenues of $49.6B
were another record for the quarter, and exceeded Apple’s guidance from April
•Growth accelerated, tipping 33% YoY, which for a company of Apple’s size remains remarkable
•Channel inventories were down by 1M units, without which revenues would probably have topped $50B
•These numbers dwarf those of Google and Microsoft. Samsung has not yet reported its CQ2, but seems unlikely to catch Apple
•However guidance midpoint for Q4 ($50B) suggests slowing growth (YoY 19%)
Comparative Revenues CQ2 2015
Sam
sung
Elec
tronic
s (C
Q1)
Mic
roso
ft
Goo
gle
Sam
sung
Mobile
0%
15%
30%
45%
60%
75%
90%
0
15
30
45
60
75
90
Q1 '09
Q2 '09
Q3 '09
Q4 '09
Q1 '10
Q2 '10
Q3 '10
Q4 '10
Q1 '11
Q2 '11
Q3 '11
Q4 '11
Q1 '12
Q2 '12
Q3 '12
Q4 '12
Q1 '13
Q2 '13
Q3 '13
Q4 '13
Q1 '14
Q2 '14
Q3 '14
Q4 '14
Q1 '15
Q2 '15
Q3 '15
Q4 '15
Revenue Growth
(%)
Revenue (B$)
Apple Revenue
Revenue B$ Revenue YoY Growth
AquillaSource: Apple Results
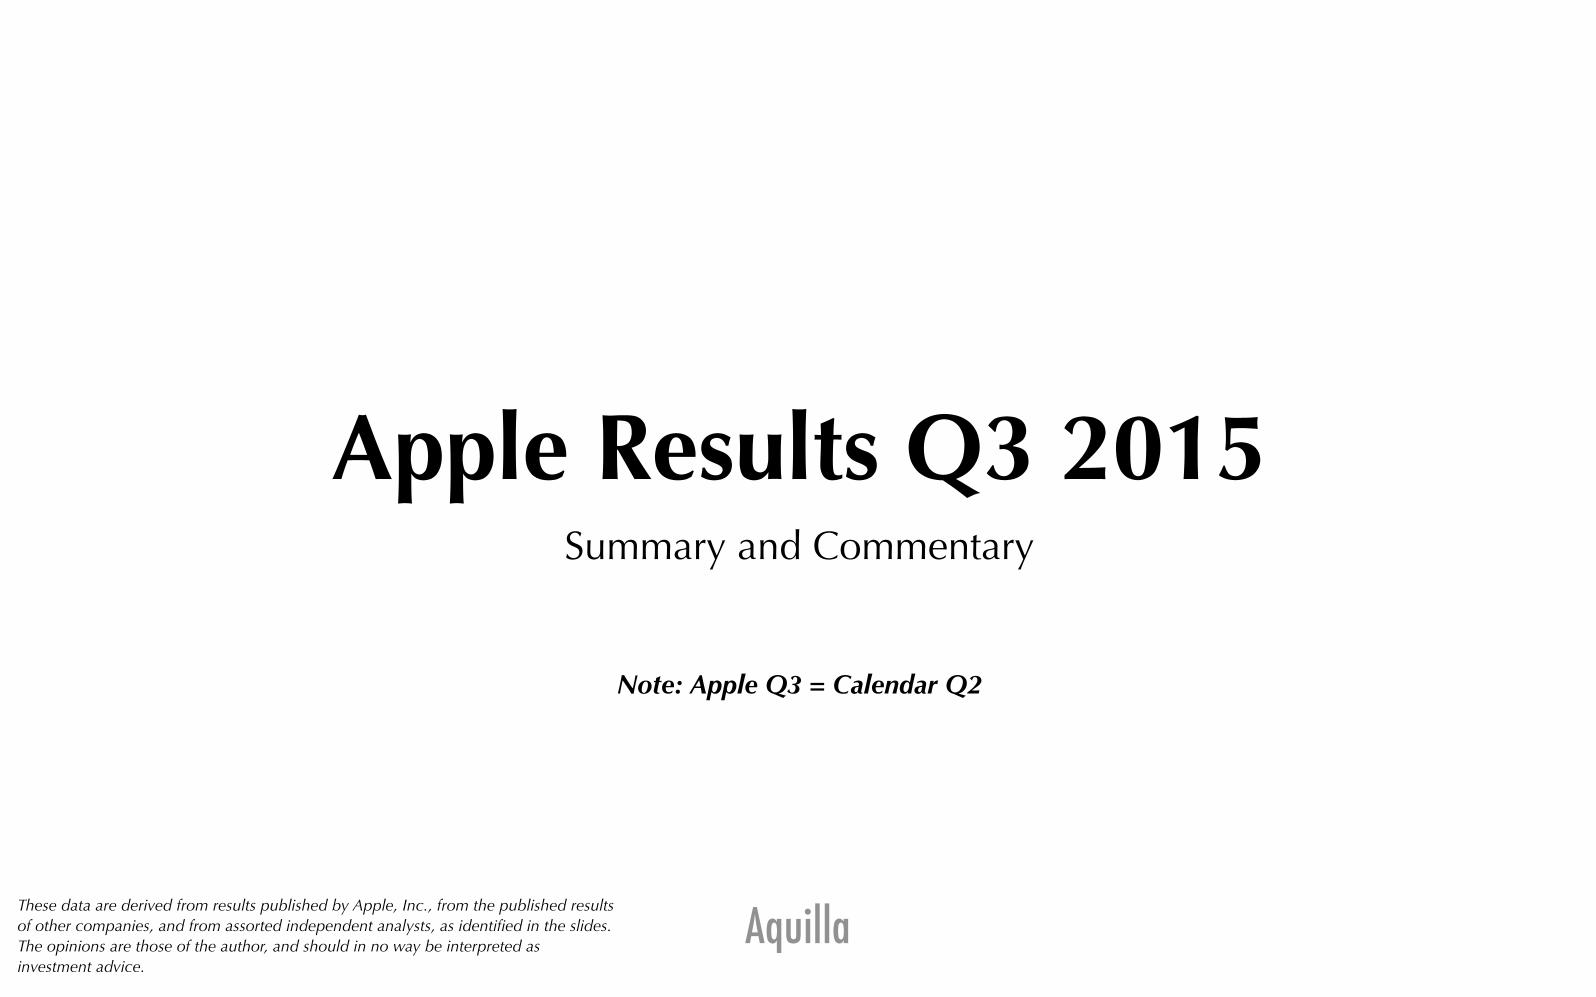
Cash, Investments & Capital ReturnCapital Return Program Grows •Apple generated $15.0B of cash from
operations in the quarter, another huge jump from the year-ago quarter
•The company returned $13.1B to shareholders during the quarter, mostly through Stock Repurchases ($10.0B), which offer Apple greater flexibility than dividends
•Long and short term cash holdings grew by $9.3B in the quarter, and the company now has over $203B in cash
•Cash held outside the US, for tax reasons, is increasingly an issue: Apple is borrowing in the US to fund the capital return programme, while the offshore cash approaches 90% of the total ($181B, 89%)
0%
20%
40%
60%
80%
100%
0
20
40
60
80
100
120
140
160
180
200
220
Q1 '09
Q2 '09
Q3 '09
Q4 '09
Q1 '10
Q2 '10
Q3 '10
Q4 '10
Q1 '11
Q2 '11
Q3 '11
Q4 '11
Q1 '12
Q2 '12
Q3 '12
Q4 '12
Q1 '13
Q2 '13
Q3 '13
Q4 '13
Q1 '14
Q2 '14
Q3 '14
Q4 '14
Q1 '15
Q2 '15
Q3 '15
Q4 '15
Ex-US (B$)
Cash & Capital Return
Short Term Cash B$ Long Term Cash B$
Cash Generated B$ Capital Return B$
Non-US Held Cash %

AquillaSource: Apple Results
Revenue Mix by Product LineiPhone dominates •iPhone’s dominance
slipped sequentially, but gained 10 points YoY to 63% of the
revenues in the quarter
•Mac increased its share to 12% of the mix, a very healthy result
•iPad was the big loser, declining a further 23%, and slipping 4th place in $ share
•Services continues to grow, and Apple Music can only add to this
•Other Products ticked up, with Apple Watch accounting for all of this (and more)
Most recent$ Share $ YoY
5% 49%
10% 12%
12% 9%
9% -23%
63% 59%iPhone M$
iPad M$
Mac M$
Services M$
Other Products M$
0%
10%
20%
30%
40%
50%
60%
70%
80%
90%
100%
Q1 '09
Q2 '09
Q3 '09
Q4 '09
Q1 '10
Q2 '10
Q3 '10
Q4 '10
Q1 '11
Q2 '11
Q3 '11
Q4 '11
Q1 '12
Q2 '12
Q3 '12
Q4 '12
Q1 '13
Q2 '13
Q3 '13
Q4 '13
Q1 '14
Q2 '14
Q3 '14
Q4 '14
Q1 '15
Q2 '15
Q3 '15
Product Line Revenue Mix
Services: iTunes, App, Mac App & iBooks Stores, AppleCare, Apple Pay, licensing, other services
Other Products: Watch, iPod, Apple TV, Beats Electronics and Apple-branded and third-party accessories
Aquilla
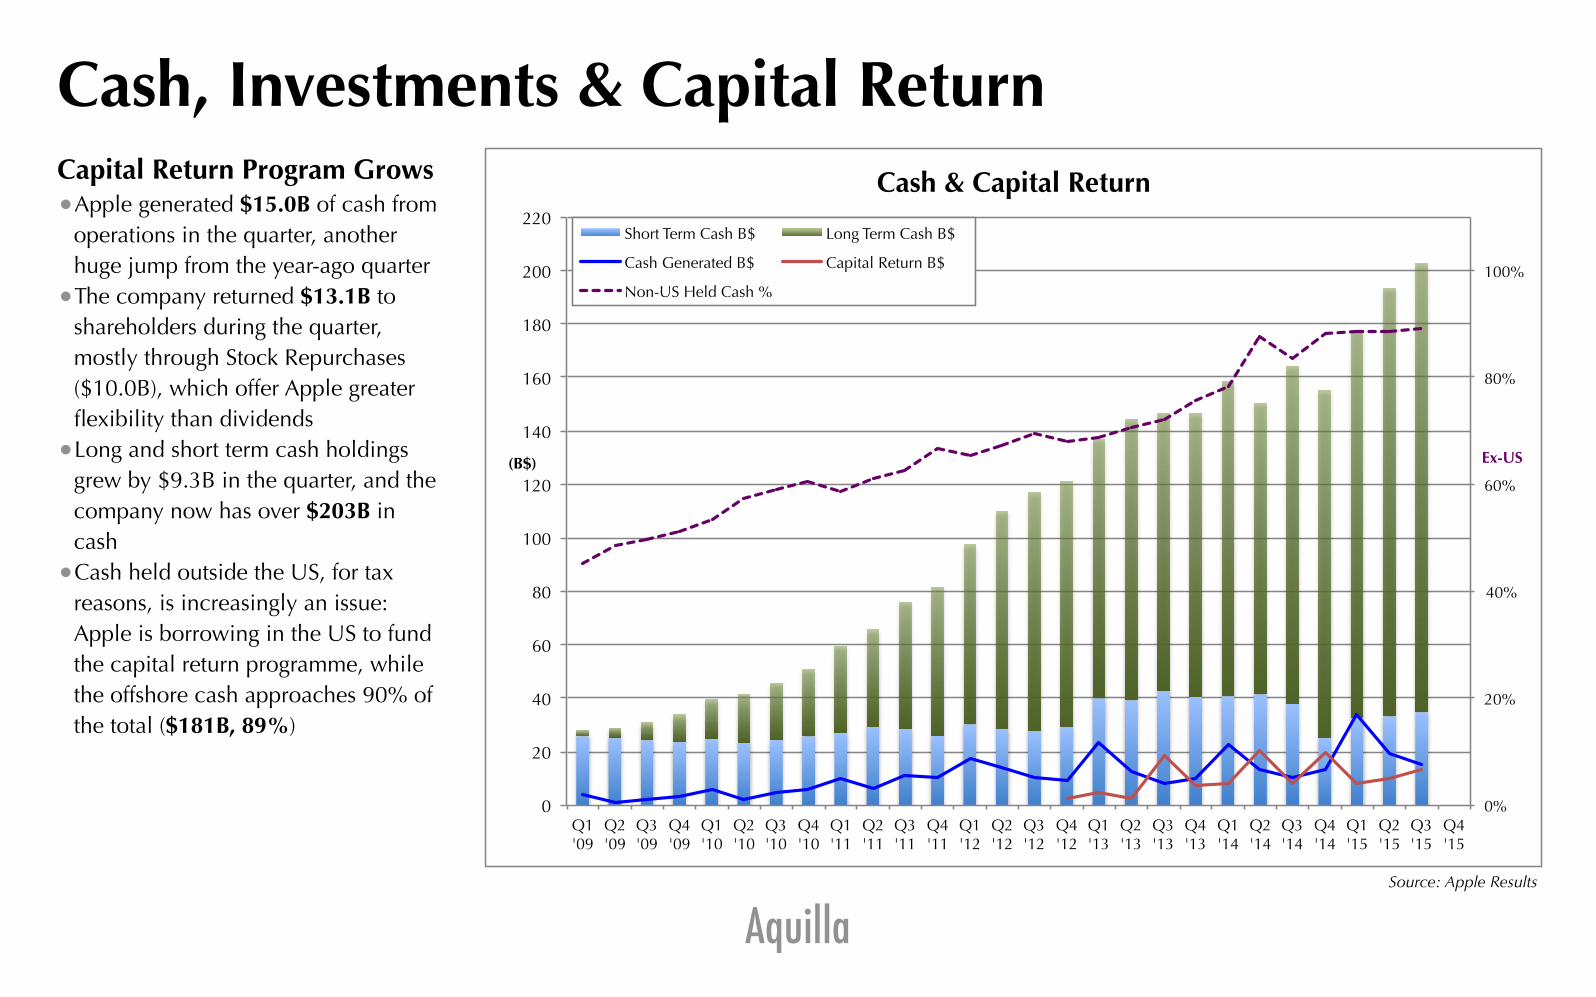
Services - Steady Gains (Music to come)Tracking the trailing 12 months (current and 3
previous Quarters) eliminates seasonality, and
gives a better indication of the longer term trends
Source: Apple Results
Services: iTunes, App, Mac App & iBooks Stores, AppleCare, Apple Pay, licensing, other services
0
4,000
8,000
12,000
16,000
20,000
24,000
0
1,000
2,000
3,000
4,000
5,000
6,000
Q1 '09
Q2 '09
Q3 '09
Q4 '09
Q1 '10
Q2 '10
Q3 '10
Q4 '10
Q1 '11
Q2 '11
Q3 '11
Q4 '11
Q1 '12
Q2 '12
Q3 '12
Q4 '12
Q1 '13
Q2 '13
Q3 '13
Q4 '13
Q1 '14
Q2 '14
Q3 '14
Q4 '14
Q1 '15
Q2 '15
Q3 '15
Q4 '15
Trailing 12m Revenue
($M)
Revenue ($M)
Services Revenue
Services M$ Services Trailing 12m M$

AquillaSource: Apple Results
Geo Revenue and 12m TrailingAmericas/China Ticked Up •Trailing 12 months shows clearly
where Apple’s growth is coming from - Americas and China
•China is still on fire, and surged past EMEIA in 12 month trailing revenues, as well as in the quarter
•EMEIA returned a strong quarter, and long term trend reflects this, continuing to climb
•APAC showed healthy growth, and we can expect to see this reflected in the longer term trends in the coming 1-2 quarters
Tracking the trailing 12 months (current and 3
previous Quarters) eliminates seasonality, and
gives a better indication of the longer term trends
0
20,000
40,000
60,000
80,000
100,000
Q1 '09
Q2 '09
Q3 '09
Q4 '09
Q1 '10
Q2 '10
Q3 '10
Q4 '10
Q1 '11
Q2 '11
Q3 '11
Q4 '11
Q1 '12
Q2 '12
Q3 '12
Q4 '12
Q1 '13
Q2 '13
Q3 '13
Q4 '13
Q1 '14
Q2 '14
Q3 '14
Q4 '14
Q1 '15
Q2 '15
Q3 '15
Q4 '15
Revenue $M
Geo Revenue and 12m Trailing Revenue
APAC Japan Greater China EMEIA Americas
APAC 12m Trailing Japan 12m Trailing Greater China 12m Trailing EMEIA 12m Trailing Americas 12m Trailing

AquillaSource: Apple Results
Competitive Landscape - TabletsApple still leads in declining market •Apple claimed dominance of the $200+ tablet market in
the US - several case studies were referenced, in particular United Airlines, and the IBM partnership talked up again
•However the next likelihood of growth will be once the iPhone 6 comps are eliminated, most likely in Q1 2016 (which assumes the iPad was cannibalised by the larger screen iPhones)
•Microsoft flagged strong Surface growth, though it remains at less than 20% of iPad revenues
•Windows 10 may yet pose a threat to Apple’s enterprise ambitions for iPad, especially as many X86 tablets are subsidised by Intel
Source: Company Reports
0
3
6
9
12
Q3 2013 Q4 2013 Q1 2014 Q2 2014 Q3 2014 Q4 2014 Q1 2015 Q2 2015
iPad Surface
$B

Aquilla
Apple’s Q2 Results Analysis - Full Slide Deck

Aquilla
Apple’s Q3 Results Analysis
These popular slides cover an in-depth analysis of
Apple’s historic record-beating Q3 results
The slides shown are an introduction
To receive the full set, including
charts, commentary, interpretation and outlook
plus all slides in full colour
contact
Aquilla Europe

AquillaNick Graves, CEO • [email protected] • +44 780 225 6536
Aquilla Europe Ltd • Kennett Cottage • OX9 3QS • UK • www.aquilla-europe.com