APPLE HOSPITALITY REIT, INC. · APPLE HOSPITALITY REIT, INC. FORM 10-Q INDEX € € This Form 10-Q...
43
UNITED STATES SECURITIES AND EXCHANGE COMMISSION Washington, D.C. 20549 FORM 10-Q For the quarterly period ended March 31, 2015 Commission File Number 000-53603 APPLE HOSPITALITY REIT, INC. (Exact name of registrant as specified in its charter) (804) 344 - 8121 (Registrant's telephone number, including area code) Indicate by check mark whether the registrant (1) has filed all reports required to be filed by Section 13 or 15(d) of the Securities Exchange Act of 1934 during the preceding 12 months (or for such shorter period that the registrant was required to file such reports), and (2) has been subject to such filing requirements for the past 90 days. Yes ⌧ No o Indicate by check mark whether the registrant has submitted electronically and posted on its corporate Web site, if any, every Interactive Data File required to be submitted and posted pursuant to Rule 405 of Regulation S-T (§232.405 of this chapter) during the preceding 12 months (or for such shorter period that the registrant was required to submit and post such files). Yes ⌧ No ¨ Indicate by check mark whether the registrant is a large accelerated filer, an accelerated filer, a non-accelerated filer, or a smaller reporting company. See the definitions of “large accelerated filer,” “accelerated filer” and “smaller reporting company” in Rule 12b-2 of the Exchange Act. Indicate by check mark whether the registrant is a shell company (as defined in Rule 12b-2 of the Exchange Act). Yes ¨ No ⌧ Number of registrant’s common shares outstanding as of May 1, 2015: 372,197,631 ⌧ QUARTERLY REPORT PURSUANT TO SECTION 13 OR 15(d) OF THE SECURITIES EXCHANGE ACT OF 1934 o TRANSITION REPORT PURSUANT TO SECTION 13 OR 15 (d) OF THE SECURITIES EXCHANGE ACT OF 1934 FOR THE TRANSITION PERIOD FROM _______ TO _______ Virginia 26 - 1379210 (State or other jurisdiction of incorporation or organization) (IRS Employer Identification No.) 814 East Main Street Richmond, Virginia 23219 (Address of principal executive offices) (Zip Code) Large accelerated filer ¨ Accelerated filer ¨ Non-accelerated filer ⌧ Smaller reporting company ¨ (Do not check if a smaller reporting company)
Transcript of APPLE HOSPITALITY REIT, INC. · APPLE HOSPITALITY REIT, INC. FORM 10-Q INDEX € € This Form 10-Q...
UNITED STATES
SECURITIES AND EXCHANGE COMMISSION
Washington, D.C. 20549
FORM 10-Q
For the quarterly period ended March 31, 2015
Commission File Number 000-53603
APPLE HOSPITALITY REIT, INC. (Exact name of registrant as specified in its charter)
(804) 344-8121
(Registrant's telephone number, including area code)
Indicate by check mark whether the registrant (1) has filed all reports required to be filed by Section 13 or 15(d) of the Securities Exchange Act of 1934 during the preceding 12 months (or for such shorter period that the registrant was required to file such reports), and (2) has been subject to such filing requirements for the past 90 days. Yes ⌧ No o
Indicate by check mark whether the registrant has submitted electronically and posted on its corporate Web site, if any, every Interactive Data File required to be submitted and posted pursuant to Rule 405 of Regulation S-T (§232.405 of this chapter) during the preceding 12 months (or for such shorter period that the registrant was required to submit and post such files). Yes ⌧ No ¨
Indicate by check mark whether the registrant is a large accelerated filer, an accelerated filer, a non-accelerated filer, or a smaller reporting company. See the definitions of “large accelerated filer,” “accelerated filer” and “smaller reporting company” in Rule 12b-2 of the Exchange Act.
Indicate by check mark whether the registrant is a shell company (as defined in Rule 12b-2 of the Exchange Act). Yes ¨ No ⌧
Number of registrant’s common shares outstanding as of May 1, 2015: 372,197,631
⌧⌧⌧⌧ QUARTERLY REPORT PURSUANT TO SECTION 13 OR 15(d) OF THE SECURITIES EXCHANGE ACT OF 1934
oooo TRANSITION REPORT PURSUANT TO SECTION 13 OR 15 (d) OF THE SECURITIES EXCHANGE ACT OF 1934 FOR THE TRANSITION PERIOD FROM _______ TO _______
Virginia 26-1379210(State or other jurisdiction
of incorporation or organization) (IRS Employer
Identification No.)
814 East Main Street Richmond, Virginia
23219
(Address of principal executive offices) (Zip Code)
Large accelerated filer ¨ Accelerated filer ¨ Non-accelerated filer ⌧ Smaller reporting company ¨
(Do not check if a smaller
reporting company)
APPLE HOSPITALITY REIT, INC.
FORM 10-Q INDEX
This Form 10-Q includes references to certain trademarks or service marks. The Courtyard® by Marriott, Fairfield Inn® by Marriott, Fairfield Inn and Suites®
by Marriott, Marriott®, Renaissance®, Residence Inn® by Marriott, SpringHill Suites® by Marriott and TownePlace Suites® by Marriott trademarks are the property of Marriott International, Inc. or one of its affiliates. The Embassy Suites Hotels®, Hampton Inn®, Hampton Inn and Suites®, Hilton®, Hilton Garden Inn®, Home2 Suites® by Hilton and Homewood Suites® by Hilton trademarks are the property of Hilton Worldwide Holdings, Inc. or one or more of its affiliates. For convenience, the applicable trademark or service mark symbol has been omitted but will be deemed to be included wherever the above referenced terms are used.
Index
Page Number
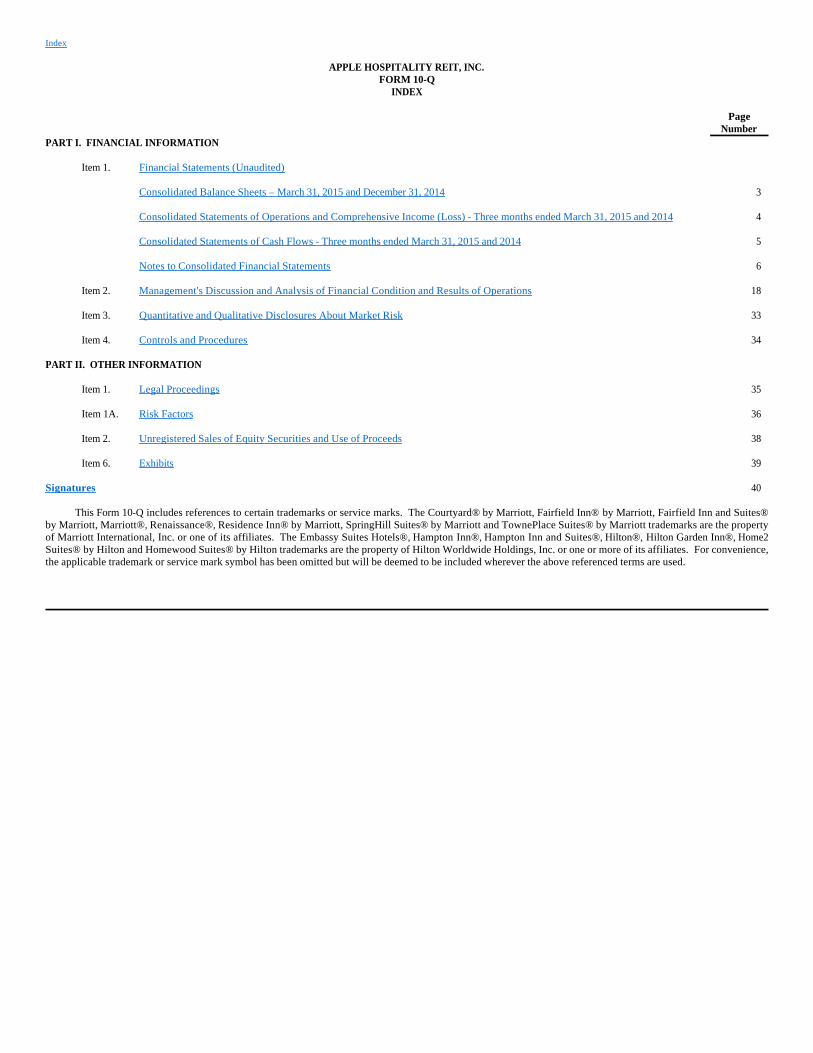
PART I. FINANCIAL INFORMATION Item 1. Financial Statements (Unaudited) Consolidated Balance Sheets – March 31, 2015 and December 31, 2014 3 Consolidated Statements of Operations and Comprehensive Income (Loss) - Three months ended March 31, 2015 and 2014 4 Consolidated Statements of Cash Flows - Three months ended March 31, 2015 and 2014 5 Notes to Consolidated Financial Statements 6 Item 2. Management's Discussion and Analysis of Financial Condition and Results of Operations 18 Item 3. Quantitative and Qualitative Disclosures About Market Risk 33 Item 4. Controls and Procedures 34 PART II. OTHER INFORMATION Item 1. Legal Proceedings 35 Item 1A. Risk Factors 36 Item 2. Unregistered Sales of Equity Securities and Use of Proceeds 38 Item 6. Exhibits 39 Signatures 40
PART I. FINANCIAL INFORMATION Item 1. Financial Statements
APPLE HOSPITALITY REIT, INC.
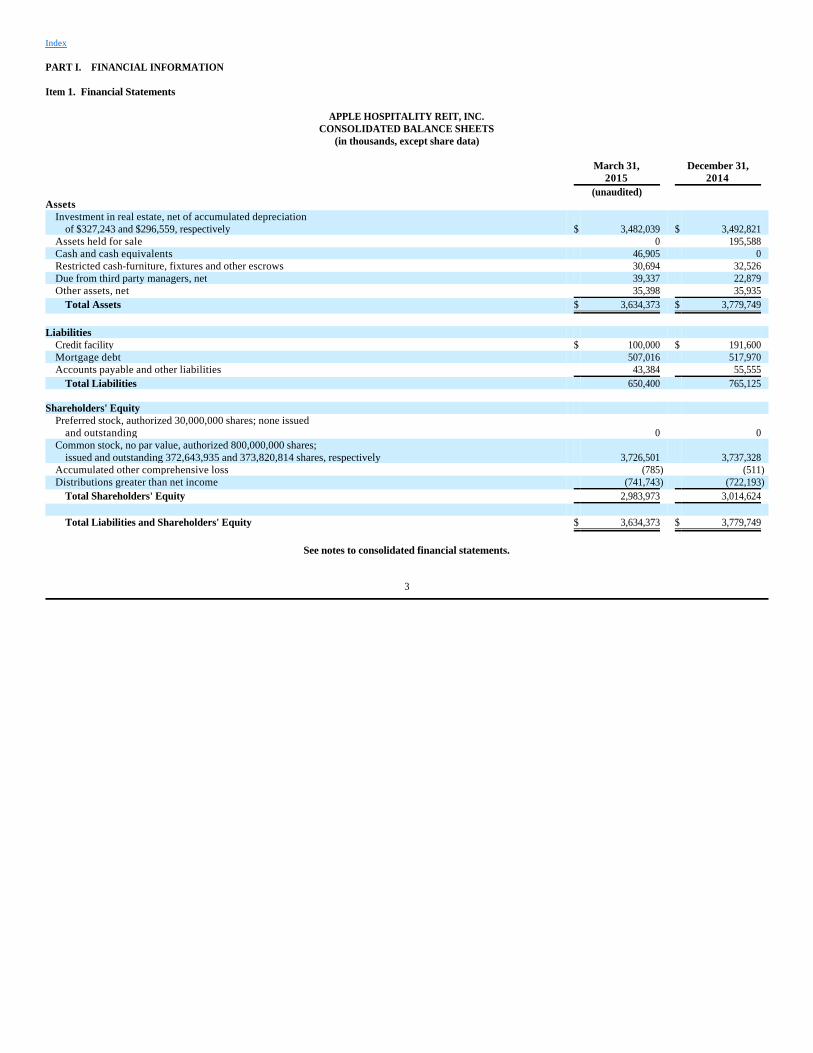
CONSOLIDATED BALANCE SHEETS (in thousands, except share data)
See notes to consolidated financial statements.
Index
March 31, December 31, 2015 2014 (unaudited) Assets
Investment in real estate, net of accumulated depreciation of $327,243 and $296,559, respectively $ 3,482,039 $ 3,492,821
Assets held for sale 0 195,588 Cash and cash equivalents 46,905 0 Restricted cash-furniture, fixtures and other escrows 30,694 32,526 Due from third party managers, net 39,337 22,879 Other assets, net 35,398 35,935
Total Assets $ 3,634,373 $ 3,779,749
Liabilities
Credit facility $ 100,000 $ 191,600 Mortgage debt 507,016 517,970 Accounts payable and other liabilities 43,384 55,555
Total Liabilities 650,400 765,125 Shareholders' Equity
Preferred stock, authorized 30,000,000 shares; none issued and outstanding 0 0
Common stock, no par value, authorized 800,000,000 shares; issued and outstanding 372,643,935 and 373,820,814 shares, respectively 3,726,501 3,737,328
Accumulated other comprehensive loss (785) (511)Distributions greater than net income (741,743) (722,193)
Total Shareholders' Equity 2,983,973 3,014,624
Total Liabilities and Shareholders' Equity $ 3,634,373 $ 3,779,749
3

APPLE HOSPITALITY REIT, INC.
CONSOLIDATED STATEMENTS OF OPERATIONS AND COMPREHENSIVE INCOME (LOSS) (Unaudited)
(in thousands, except per share data)
See notes to consolidated financial statements.
Index
Three Months Ended March 31, 2015 2014 Revenues:
Room $ 192,013 $ 125,442 Other 18,339 11,679
Total revenue 210,352 137,121 Expenses:
Operating 54,605 35,256 Hotel administrative 17,156 10,358 Sales and marketing 17,098 11,084 Utilities 8,158 5,390 Repair and maintenance 9,169 5,612 Franchise fees 8,822 5,716 Management fees 7,505 4,933 Property taxes, insurance and other 11,561 7,126 Ground lease 2,501 872 General and administrative 5,547 2,519 Transaction and potential listing costs 1,224 2,110 Series B convertible preferred share expense 0 117,133 Depreciation 30,719 19,559
Total expenses 174,065 227,668 Operating income (loss) 36,287 (90,547)
Interest and other expense, net (7,737) (3,524)Gain on sale of real estate 15,629 0
Income (loss) before income taxes 44,179 (94,071)
Income tax expense (312) (391) Net income (loss) $ 43,867 $ (94,462)
Unrealized gain (loss) on interest rate derivative (274) 468
Comprehensive income (loss) $ 43,593 $ (93,994)
Basic and diluted net income (loss) per common share $ 0.12 $ (0.38)
Weighted average common shares outstanding - basic and diluted 372,892 248,665
4

APPLE HOSPITALITY REIT, INC.
CONSOLIDATED STATEMENTS OF CASH FLOWS (Unaudited)
(in thousands)
See notes to consolidated financial statements.
Index
Three Months Ended March 31, 2015 2014 Cash flows from operating activities:
Net income (loss) $ 43,867 $ (94,462)Adjustments to reconcile net income (loss) to cash provided by operating activities:
Series B convertible preferred share expense 0 117,133 Depreciation 30,719 19,559 Gain on sale of real estate (15,629) 0 Other non-cash expenses, net 2,519 223
Changes in operating assets and liabilities, net of amounts acquired or assumed with acquisitions:
Increase in due from third party managers, net (16,458) (12,875)Increase in other assets, net (2,229) (1,190)Decrease in accounts payable and other liabilities (6,531) (5,517)
Net cash provided by operating activities 36,258 22,871 Cash flows from investing activities:
Capital improvements and development costs (18,806) (11,790)Decrease in capital improvement reserves 3,836 186 Net proceeds from sale of real estate 201,853 2,134
Net cash provided by (used in) investing activities 186,883 (9,470) Cash flows from financing activities:
Redemptions of shares (10,827) 0 Distributions paid to common shareholders (63,417) (45,866)Payments on extinguished credit facilities 0 (129,490)Net proceeds from (payments on) existing credit facility (91,600) 150,500 Proceeds from mortgage debt 10,000 0 Payments of mortgage debt (19,899) (1,841)Financing costs (493) (4,806)
Net cash used in financing activities (176,236) (31,503) Increase (decrease) in cash and cash equivalents 46,905 (18,102) Cash and cash equivalents, beginning of period 0 18,102 Cash and cash equivalents, end of period $ 46,905 $ 0
Supplemental cash flow information: Interest paid $ 8,063 $ 4,280
Supplemental disclosure of noncash investing and financing activities:
Merger transactions purchase price, net $ 0 $ 1,814,613
Conversion of Series B convertible preferred shares to common shares $ 0 $ 117,133
5

APPLE HOSPITALITY REIT, INC.
NOTES TO CONSOLIDATED FINANCIAL STATEMENTS (Unaudited)
1. Organization and Summary of Significant Accounting Policies
Organization
Apple Hospitality REIT, Inc., together with its wholly owned subsidiaries (the “Company”), is a Virginia corporation that has elected to be treated as a real estate investment trust (“REIT”) for federal income tax purposes. The Company is a self-advised REIT that invests in income-producing real estate, primarily in the lodging sector, in the United States. The Company’s fiscal year end is December 31. The Company has no foreign operations or assets and its operating structure includes only one segment. The consolidated financial statements include the accounts of the Company and its subsidiaries. All intercompany accounts and transactions have been eliminated. As of March 31, 2015, the Company owned 173 hotels with an aggregate of 22,003 rooms located in 32 states.
Basis of Presentation
The accompanying unaudited consolidated financial statements have been prepared in accordance with the rules and regulations for reporting on Form 10-Q. Accordingly, they do not include all of the information required by accounting principles generally accepted in the United States for complete financial statements. In the opinion of management, all adjustments (consisting of normal recurring accruals) considered necessary for a fair presentation have been included. These unaudited financial statements should be read in conjunction with the Company’s audited consolidated financial statements included in its 2014 Annual Report on Form 10-K. Operating results for the three months ended March 31, 2015 are not necessarily indicative of the results that may be expected for the twelve month period ending December 31, 2015.
Use of Estimates
The preparation of the financial statements in conformity with United States generally accepted accounting principles requires management to make estimates and assumptions that affect the amounts reported in the consolidated financial statements and accompanying notes. Actual results could differ from those estimates.
Reclassifications
Certain prior period amounts in the consolidated financial statements have been reclassified to conform to the current period presentation with no effect on previously reported net loss, shareholders’ equity or cash flows.
Comprehensive Income (Loss)
Comprehensive income (loss) includes net income (loss) and other comprehensive income (loss), which is comprised of unrealized gains and losses resulting from hedging activity.
Earnings Per Common Share
Basic earnings per common share is computed based upon the weighted average number of shares outstanding during the period. Diluted earnings per common share is calculated after giving effect to all potential common shares that were dilutive and outstanding for the period. There were no potential common shares with a dilutive effect for the three months ended March 31, 2015 and 2014. As a result, basic and dilutive net income (loss) per common share were the same. As discussed in Note 2, as a result of becoming self-advised, the Series B convertible preferred shares converted to common shares effective March 1, 2014, resulting in approximately 11.6 million additional common shares outstanding.
Index
6
Recent Accounting Standards
In April 2015, the Financial Accounting Standards Board issued Accounting Standards Update No. 2015-03, Simplifying the Presentation of Debt Issuance
Costs, which requires debt issuance costs to be presented in the balance sheet as a direct deduction from the associated debt. The standard is effective for annual reporting periods beginning after December 15, 2015, and interim periods within those years, with early adoption permitted. The standard will be applied on a retrospective basis. The adoption of this standard is not expected to have a material impact on the Company’s consolidated financial statements. 2. Mergers with Apple REIT Seven, Inc. and Apple REIT Eight, Inc.
Effective March 1, 2014, the Company completed its mergers with Apple REIT Seven, Inc. (“Apple Seven”) and Apple REIT Eight, Inc. (“Apple Eight”) (the “A7 and A8 mergers”). Pursuant to the Agreement and Plan of Merger entered into on August 7, 2013, as amended (the “Merger Agreement”), Apple Seven and Apple Eight merged with and into wholly owned subsidiaries of the Company effective March 1, 2014 and Apple Seven’s and Apple Eight’s separate corporate existence ceased. With the completion of the A7 and A8 mergers, the Company added 99 continuing hotels located in 27 states (consisting of 48 hotels with an aggregate of 6,209 rooms from Apple Seven and 51 hotels with an aggregate of 5,912 rooms from Apple Eight) to the Company’s real estate portfolio.
In connection with the A7 and A8 mergers, the Company issued approximately 180 million common shares to Apple Seven and Apple Eight shareholders. The Company accounted for the A7 and A8 mergers in accordance with Accounting Standards Codification (“ASC”) 805, Business Combinations. The Company was considered the acquirer for financial reporting purposes, which required, among other things, that the assets acquired and liabilities assumed from Apple Seven and Apple Eight be recognized at their acquisition date fair values. For purpose of accounting for the transactions, the total consideration of the Company’s common shares transferred in the A7 and A8 mergers was estimated to be approximately $1.8 billion and was based on a fair value estimate of $10.10 per common share.
As contemplated in the Merger Agreement, in connection with completion of the A7 and A8 mergers, the Company became self-advised and the advisory agreements between the Company and its advisors were terminated. The termination of the advisory agreements resulted in the conversion of each issued and outstanding Series B convertible preferred share of the Company into 24.17104 common shares of the Company, or approximately 11.6 million common shares. As a result of the conversion, all of the Company’s Series A preferred shares were terminated and the Company only has common shares outstanding. In conjunction with this event, during the first quarter of 2014, the Company recorded a non-cash expense totaling approximately $117.1 million, included in the Company’s consolidated statements of operations, to reflect the fair value estimate of the conversion of the Series B convertible preferred shares to common shares at a fair value estimate of $10.10 per common share.
All costs related to the A7 and A8 mergers have been expensed in the period they were incurred and are included in transaction and potential listing costs in the Company’s consolidated statements of operations. In connection with these activities, the Company has incurred approximately $7.2 million in total merger costs (including approximately $1.4 million of costs incurred to defend the ongoing purported class action related to the A7 and A8 mergers discussed in Note 10), of which approximately $0.7 million and $2.0 million, respectively, were incurred during the three months ended March 31, 2015 and 2014. During the first quarter of 2015, the merger costs consisted primarily of costs to defend the class action lawsuit.
Effective March 1, 2014, upon completion of the A7 and A8 mergers, the Company assumed approximately $385.1 million in mortgage debt, prior to any fair value adjustments, secured by 34 properties. The Company also assumed the outstanding balances on Apple Seven’s and Apple Eight’s credit facilities totaling approximately $129.5 million, which were then terminated on March 3, 2014 when the Company entered into a new $345 million unsecured credit facility.
Total revenue and operating income related to the A7 and A8 mergers, from the effective date of the mergers through March 31, 2014, included in the Company’s consolidated statements of operations were approximately $38.4 million and $8.7 million, respectively.
Index
7

The following unaudited pro forma information for the three months ended March 31, 2015 and 2014 is presented as if the A7 and A8 mergers, effective March
1, 2014, had occurred on January 1, 2014, and is based on assumptions and estimates considered appropriate by the Company. The pro forma information is provided for illustrative purposes only and does not necessarily reflect what the operating results would have been had the mergers been completed on January 1, 2014, nor is it necessarily indicative of future operating results. The pro forma information does not give effect to any cost synergies or other operating efficiencies that could result from the mergers. Amounts are in thousands except per share data.
For purposes of calculating these pro forma amounts, merger transaction costs and the expense related to the conversion of the Series B convertible preferred
shares, each included in the Company’s consolidated statements of operations, were excluded from the pro forma amounts since these are attributable to the A7 and A8 mergers and related transactions and do not have an ongoing impact to the statements of operations. Merger transaction costs totaled approximately $0.7 million and $2.0 million for the three months ended March 31, 2015 and 2014. The expense related to the conversion of the Series B convertible preferred shares was approximately $117.1 million for the three months ended March 31, 2014. As discussed in Note 4, the Company sold 18 hotels on February 26, 2015, of which 12 of the hotels were acquired with the A7 and A8 mergers, and therefore the pro forma results of the Company for the three months ended March 31, 2015 only include operations of the 18 hotels through the time of the sale on February 26, 2015. 3. Investment in Real Estate
The Company’s total investment in real estate consisted of the following (in thousands):
As of March 31, 2015, the Company owned 173 hotels with an aggregate of 22,003 rooms located in 32 states. As further discussed in Note 4, during the first
quarter of 2015 the Company decided not to sell the TownePlace Suites in Columbus, Georgia, which was classified as held for sale as of December 31, 2014, and reclassified the property as held and used as of March 31, 2015.
The Company determined there was no impairment of its real estate assets for the three months ended March 31, 2015 or 2014.
Index
Three Months Ended March 31, 2015 2014 Total revenue $ 210,352 $ 197,969 Net income $ 44,573 $ 25,993 Net income per share - basic and diluted $ 0.12 $ 0.07
Weighted average common shares outstanding - basic and diluted 372,892 373,821
March 31, December 31, 2015 2014 Land $ 520,406 $ 520,406 Building and Improvements 3,024,406 3,010,314 Furniture, Fixtures and Equipment 256,953 251,170 Franchise Fees 7,517 7,490 3,809,282 3,789,380 Less Accumulated Depreciation (327,243) (296,559)Investment in Real Estate, net $ 3,482,039 $ 3,492,821
8

4. Dispositions
In December 2014, the Company entered into a purchase and sale agreement for 19 properties for $213 million. These properties were identified for potential sale during the third quarter of 2014. The 19 properties were classified as held for sale at historical cost in the Company’s consolidated balance sheet as of December 31, 2014. On February 26, 2015, the Company completed the sale of 18 of the 19 hotels for a total sales price of $206.4 million, resulting in a gain of approximately $15.6 million, which is included in the Company’s consolidated statement of operations in the first quarter of 2015. The following table lists the 18 hotels sold:
The 18 hotels had a total carrying value of approximately $188.3 million at the time of the sale. The Company used a portion of the proceeds from the sale to
repay the outstanding balance under its revolving credit facility, with the remaining portion to be used to acquire other hotel properties and fund hotel renovations. The Company’s consolidated statements of operations include operating income of approximately $2.0 million for both the three months ended March 31, 2015 and 2014 relating to results of operations for the 18 hotels for the respective periods of ownership. Twelve of the 18 hotels were originally acquired by the Company in the A7 and A8 mergers, effective March 1, 2014 (see table above for a list of properties), and therefore the historical operating results of the Company only include operations from March 1, 2014 through the date of sale for these hotels. The sale of these properties does not represent a strategic shift that has, or will have, a major effect on the Company’s operations and financial results, and therefore the operating results for the period of ownership of these properties are included in income from continuing operations for the three months ended March 31, 2015 and 2014.
As contemplated in the purchase and sale agreement, the buyer exercised its right to exclude the remaining hotel (the TownePlace Suites in Columbus, Georgia with a purchase price of $6.6 million) from the transaction. At this time, the Company does not have any immediate plans to sell this hotel. Due to this change in plans, this hotel was reclassified as held and used during the first quarter of 2015 and is included in investment in real estate, net in the Company’s consolidated balance sheet as of March 31, 2015. There are no assets classified as held for sale as of March 31, 2015.
Prior to the sale, on February 13, 2015, the Company extinguished a mortgage totaling approximately $4.6 million secured by the Hampton Inn located in Concord, North Carolina, and incurred expenses, including defeasance costs during the first quarter of 2015, which were recorded as a reduction to the gain on sale of real estate.
Index
City State Brand Date Acquired Rooms Huntsville AL TownePlace Suites 3/1/2014 86 Troy AL Courtyard 6/18/2009 90 Troy AL Hampton Inn 3/1/2014 82 Rogers AR Fairfield Inn & Suites 3/1/2014 99 Pueblo CO Hampton Inn & Suites 10/31/2008 81 Port Wentworth GA Hampton Inn 3/1/2014 106 Bowling Green KY Hampton Inn 3/1/2014 130 Alexandria LA Courtyard 9/15/2010 96 West Monroe LA Hilton Garden Inn 7/30/2010 134 Concord NC Hampton Inn 3/1/2014 101 Dunn NC Hampton Inn 3/1/2014 120 Jacksonville NC TownePlace Suites 2/16/2010 86 Matthews NC Hampton Inn 3/1/2014 91 Cincinnati OH Homewood Suites 3/1/2014 76 Tulsa OK Hampton Inn & Suites 3/1/2014 102 Jackson TN Courtyard 12/16/2008 94 Brownsville TX Courtyard 3/1/2014 90 San Antonio TX TownePlace Suites 3/1/2014 123 Total 1,787
9

5. Credit Facility and Mortgage Debt
Credit Facility
On March 3, 2014, the Company entered into a $345 million unsecured credit facility (comprised of a $245 million revolving credit facility and a $100 million term loan). The $345 million credit facility is available for working capital, hotel acquisitions, hotel renovations and development and other general corporate purposes, including the funding of share repurchases and payment of distributions. The $345 million credit facility may be increased to $700 million, subject to certain conditions. Under the terms of the $345 million credit facility, the Company may make voluntary prepayments in whole or in part, at any time. The $245 million revolving credit facility matures in March 2018; however, the Company has the right, upon satisfaction of certain conditions, including covenant compliance and payment of an extension fee, to extend the maturity date to March 2019. The $100 million term loan matures in March 2019. Interest payments on the $345 million credit facility are due monthly and the interest rate, subject to certain exceptions, is equal to the one-month LIBOR (the London Inter-Bank Offered Rate for a one-month term) plus a margin ranging from 1.55% to 2.35%, depending upon the Company’s leverage ratio, as calculated under the terms of the credit agreement. In conjunction with the $100 million term loan, the Company entered into an interest rate swap agreement for the same notional amount and maturity as the term loan. The interest rate swap agreement effectively provides the Company with payment requirements equal to a fixed interest rate on the term loan through the maturity of the loan in March 2019 (see Note 6 for more information on the interest rate swap agreement). The Company is also required to pay an unused facility fee of 0.20% or 0.30% on the unused portion of the $245 million revolving credit facility, based on the amount of borrowings outstanding during the quarter. As of March 31, 2015, the credit facility had an outstanding principal balance of $100 million, which consisted only of the $100 million term loan with an effective annual fixed interest rate of approximately 3.13%. As of December 31, 2014, the credit facility had an outstanding principal balance of $191.6 million, including the $100 million term loan with an effective annual fixed interest rate of approximately 3.13% and $91.6 million outstanding on the $245 million revolving credit facility with an annual variable interest rate of approximately 1.77%.
The $345 million credit facility contains customary affirmative covenants, negative covenants and events of defaults. It also contains covenants restricting the level of certain investments and quarterly financial covenants which include, among others, a minimum tangible net worth, maximum debt limits, minimum interest and fixed charge coverage ratios and maximum dividend payout ratio. The Company was in compliance with the applicable covenants at March 31, 2015.
Mortgage Debt
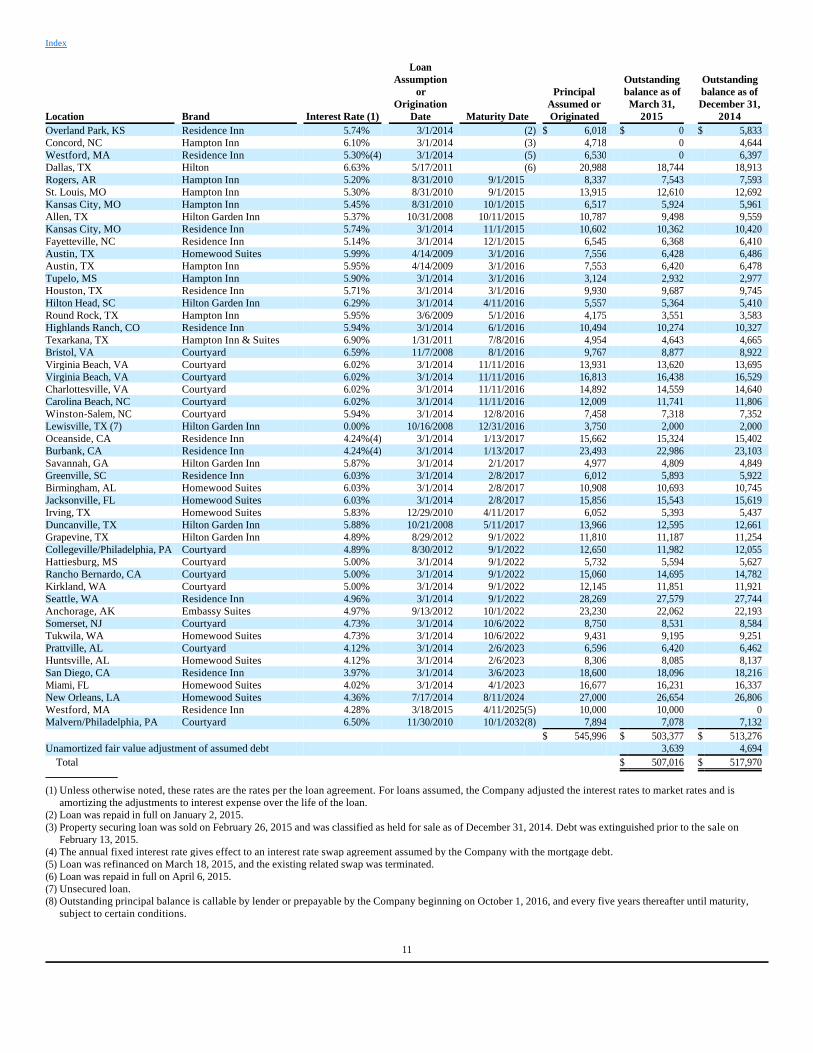
As of March 31, 2015, the Company had approximately $503.4 million in outstanding property level debt secured by 45 properties, with maturity dates ranging from April 2015 to October 2032, stated interest rates ranging from 0% to 6.90% and effective interest rates ranging from 3.66% to 6.52%. The loans generally provide for monthly payments of principal and interest on an amortized basis. The loans are generally subject to defeasance or prepayment penalties if prepaid. The following table sets forth the hotel properties securing each loan, the interest rate, loan assumption or origination date, maturity date, the principal amount assumed or originated, and the outstanding balance prior to any fair value adjustments as of March 31, 2015 and December 31, 2014 for each of the Company’s debt obligations. All dollar amounts are in thousands.
Index
10
Index
Location Brand Interest Rate (1)
Loan Assumption
or Origination
Date Maturity Date
Principal Assumed or Originated
Outstanding balance as of March 31,
2015
Outstanding balance as of December 31,
2014 Overland Park, KS Residence Inn 5.74% 3/1/2014 (2) $ 6,018 $ 0 $ 5,833 Concord, NC Hampton Inn 6.10% 3/1/2014 (3) 4,718 0 4,644 Westford, MA Residence Inn 5.30%(4) 3/1/2014 (5) 6,530 0 6,397 Dallas, TX Hilton 6.63% 5/17/2011 (6) 20,988 18,744 18,913 Rogers, AR Hampton Inn 5.20% 8/31/2010 9/1/2015 8,337 7,543 7,593 St. Louis, MO Hampton Inn 5.30% 8/31/2010 9/1/2015 13,915 12,610 12,692 Kansas City, MO Hampton Inn 5.45% 8/31/2010 10/1/2015 6,517 5,924 5,961 Allen, TX Hilton Garden Inn 5.37% 10/31/2008 10/11/2015 10,787 9,498 9,559 Kansas City, MO Residence Inn 5.74% 3/1/2014 11/1/2015 10,602 10,362 10,420 Fayetteville, NC Residence Inn 5.14% 3/1/2014 12/1/2015 6,545 6,368 6,410 Austin, TX Homewood Suites 5.99% 4/14/2009 3/1/2016 7,556 6,428 6,486 Austin, TX Hampton Inn 5.95% 4/14/2009 3/1/2016 7,553 6,420 6,478 Tupelo, MS Hampton Inn 5.90% 3/1/2014 3/1/2016 3,124 2,932 2,977 Houston, TX Residence Inn 5.71% 3/1/2014 3/1/2016 9,930 9,687 9,745 Hilton Head, SC Hilton Garden Inn 6.29% 3/1/2014 4/11/2016 5,557 5,364 5,410 Round Rock, TX Hampton Inn 5.95% 3/6/2009 5/1/2016 4,175 3,551 3,583 Highlands Ranch, CO Residence Inn 5.94% 3/1/2014 6/1/2016 10,494 10,274 10,327 Texarkana, TX Hampton Inn & Suites 6.90% 1/31/2011 7/8/2016 4,954 4,643 4,665 Bristol, VA Courtyard 6.59% 11/7/2008 8/1/2016 9,767 8,877 8,922 Virginia Beach, VA Courtyard 6.02% 3/1/2014 11/11/2016 13,931 13,620 13,695 Virginia Beach, VA Courtyard 6.02% 3/1/2014 11/11/2016 16,813 16,438 16,529 Charlottesville, VA Courtyard 6.02% 3/1/2014 11/11/2016 14,892 14,559 14,640 Carolina Beach, NC Courtyard 6.02% 3/1/2014 11/11/2016 12,009 11,741 11,806 Winston-Salem, NC Courtyard 5.94% 3/1/2014 12/8/2016 7,458 7,318 7,352 Lewisville, TX (7) Hilton Garden Inn 0.00% 10/16/2008 12/31/2016 3,750 2,000 2,000 Oceanside, CA Residence Inn 4.24%(4) 3/1/2014 1/13/2017 15,662 15,324 15,402 Burbank, CA Residence Inn 4.24%(4) 3/1/2014 1/13/2017 23,493 22,986 23,103 Savannah, GA Hilton Garden Inn 5.87% 3/1/2014 2/1/2017 4,977 4,809 4,849 Greenville, SC Residence Inn 6.03% 3/1/2014 2/8/2017 6,012 5,893 5,922 Birmingham, AL Homewood Suites 6.03% 3/1/2014 2/8/2017 10,908 10,693 10,745 Jacksonville, FL Homewood Suites 6.03% 3/1/2014 2/8/2017 15,856 15,543 15,619 Irving, TX Homewood Suites 5.83% 12/29/2010 4/11/2017 6,052 5,393 5,437 Duncanville, TX Hilton Garden Inn 5.88% 10/21/2008 5/11/2017 13,966 12,595 12,661 Grapevine, TX Hilton Garden Inn 4.89% 8/29/2012 9/1/2022 11,810 11,187 11,254 Collegeville/Philadelphia, PA Courtyard 4.89% 8/30/2012 9/1/2022 12,650 11,982 12,055 Hattiesburg, MS Courtyard 5.00% 3/1/2014 9/1/2022 5,732 5,594 5,627 Rancho Bernardo, CA Courtyard 5.00% 3/1/2014 9/1/2022 15,060 14,695 14,782 Kirkland, WA Courtyard 5.00% 3/1/2014 9/1/2022 12,145 11,851 11,921 Seattle, WA Residence Inn 4.96% 3/1/2014 9/1/2022 28,269 27,579 27,744 Anchorage, AK Embassy Suites 4.97% 9/13/2012 10/1/2022 23,230 22,062 22,193 Somerset, NJ Courtyard 4.73% 3/1/2014 10/6/2022 8,750 8,531 8,584 Tukwila, WA Homewood Suites 4.73% 3/1/2014 10/6/2022 9,431 9,195 9,251 Prattville, AL Courtyard 4.12% 3/1/2014 2/6/2023 6,596 6,420 6,462 Huntsville, AL Homewood Suites 4.12% 3/1/2014 2/6/2023 8,306 8,085 8,137 San Diego, CA Residence Inn 3.97% 3/1/2014 3/6/2023 18,600 18,096 18,216 Miami, FL Homewood Suites 4.02% 3/1/2014 4/1/2023 16,677 16,231 16,337 New Orleans, LA Homewood Suites 4.36% 7/17/2014 8/11/2024 27,000 26,654 26,806 Westford, MA Residence Inn 4.28% 3/18/2015 4/11/2025 (5) 10,000 10,000 0 Malvern/Philadelphia, PA Courtyard 6.50% 11/30/2010 10/1/2032 (8) 7,894 7,078 7,132 $ 545,996 $ 503,377 $ 513,276 Unamortized fair value adjustment of assumed debt 3,639 4,694 Total $ 507,016 $ 517,970
(1) Unless otherwise noted, these rates are the rates per the loan agreement. For loans assumed, the Company adjusted the interest rates to market rates and is amortizing the adjustments to interest expense over the life of the loan.
(2) Loan was repaid in full on January 2, 2015. (3) Property securing loan was sold on February 26, 2015 and was classified as held for sale as of December 31, 2014. Debt was extinguished prior to the sale on
February 13, 2015. (4) The annual fixed interest rate gives effect to an interest rate swap agreement assumed by the Company with the mortgage debt. (5) Loan was refinanced on March 18, 2015, and the existing related swap was terminated. (6) Loan was repaid in full on April 6, 2015. (7) Unsecured loan. (8) Outstanding principal balance is callable by lender or prepayable by the Company beginning on October 1, 2016, and every five years thereafter until maturity,
subject to certain conditions.
11

6. Fair Value of Financial Instruments
Credit Facility and Mortgage Debt
The Company estimates the fair value of its debt by discounting the future cash flows of each instrument at estimated market rates consistent with the maturity of a debt obligation with similar credit terms and credit characteristics which are Level 3 inputs under the fair value hierarchy. Market rates take into consideration general market conditions and maturity. As of March 31, 2015, the carrying value and estimated fair value of the Company’s debt was approximately $607.0 million and $618.5 million. As of December 31, 2014, the carrying value and estimated fair value of the Company’s debt was approximately $709.6 million and $718.9 million.
Derivative Instruments
Currently, the Company uses interest rate swaps to manage its interest rate risks on variable rate debt. These instruments, as described below, are recorded at fair value and are included in accounts payable and other liabilities in the Company’s consolidated balance sheets.
On March 1, 2014, the Company assumed three interest rate swap agreements, with an aggregate notional amount of $45.7 million that effectively fixed the interest rate on two separate variable-rate mortgage loans assumed with the A7 and A8 mergers through maturity. The fair value of the interest rate swap agreements assumed was approximately $0.5 million (liability) and was included in accounts payable and other liabilities as part of the purchase price allocation. Throughout the terms of these interest rate swaps, the Company pays a fixed rate of interest and receives a floating rate of interest equal to the one month LIBOR. As of December 31, 2014, the fair value of these swaps was approximately $0.3 million (liability). During the first quarter of 2015, one of these swaps expired. Additionally, during the first quarter of 2015, one swap was terminated in conjunction with the extinguishment of the related mortgage loan, and the Company incurred a termination fee of approximately $0.05 million, which was equal to the swap’s fair value at the date of termination and was paid in satisfaction of the existing liability. As of March 31, 2015, the fair value of the remaining swap was approximately $0.3 million (liability). These interest rate swaps assumed were not designated by the Company as hedges for accounting purposes, and therefore the changes in the fair value for these swaps are recorded to interest and other expense, net in the Company’s consolidated statements of operations. For the three months ended March 31, 2015 and 2014, the change in fair value (excluding the $0.05 million termination fee) resulted in a net increase of approximately $0.1 million and a net decrease of approximately $0.2 million, respectively, to interest and other expense, net.
In March 2014, the Company entered into an interest rate swap agreement with a commercial bank for the same notional amount and maturity as its $100 million term loan. The interest rate swap agreement effectively fixes the interest rate on the $100 million term loan (subject to the Company’s leverage ratio) through maturity. Under the terms of this interest rate swap, the Company pays a fixed interest rate of 1.58% and receives a floating rate of interest equal to the one month LIBOR. The interest rate swap agreement matures in March 2019. As of March 31, 2015 and December 31, 2014, the fair value of this swap totaled approximately $1.6 million and $0.5 million (liability), respectively. At inception, the interest rate swap was designated by the Company as an effective cash flow hedge for accounting purposes. The Company assesses, both at inception and on an ongoing basis, the effectiveness of its qualifying cash flow hedge. From inception of the swap through March 2, 2015, the swap was a fully effective hedge for accounting purposes, and therefore the changes in the fair value through this date were recorded in accumulated other comprehensive loss, a component of shareholder’s equity in the Company’s consolidated balance sheets, which totaled $0.8 million and $0.5 million as of March 31, 2015 and December 31, 2014, respectively. For the three months ended March 31, 2015 and 2014, the Company recorded an unrealized loss of approximately $0.3 million and an unrealized gain of approximately $0.5 million, respectively, in other comprehensive income (loss) relating to this swap. In 2015, the Company announced its intent to pursue a listing of its common shares on a national securities exchange and intent to enter into a new credit facility to fund a possible tender offer and share buyback program. As a result of this decision, it was determined that the cash flows being hedged were no longer probable of occurring through the maturity date of the swap. Therefore the Company discontinued hedge accounting, and the change in fair value resulting in a loss of $0.8 million for the remainder of the quarter was recorded to interest and other expense, net in the Company’s consolidated statement of operations. The Company will reclassify the amount included in accumulated other comprehensive loss as of March 31, 2015 to interest and other expense, net if it becomes probable that the cash flows relating to interest payments on the $100 million term loan will change.
Index
12

The fair value of the Company’s interest rate swap agreements are determined using the market standard methodology of netting the discounted future fixed
cash payments and the discounted expected variable cash receipts, which is considered a Level 2 measurement under the fair value hierarchy. The variable cash receipts are based on an expectation of future interest rates (forward curves) derived from observable market interest rate curves.
The following is a summary of the notional amounts, maturity dates and fair values (liabilities) of the interest rate swap agreements outstanding as of March 31, 2015 and December 31, 2014 (in thousands):
The carrying value of the Company’s other financial instruments approximates fair value due to the short-term nature of these financial instruments.
7. Related Parties
The Company has, and is expected to continue to engage in, transactions with related parties. These transactions cannot be construed to be at arm’s length and the results of the Company’s operations may be different if these transactions were conducted with non-related parties. The Company’s independent members of the Board of Directors oversee and annually review the Company’s related party relationships (including the relationships discussed in this section) and are required to approve any significant modifications to the existing relationships, as well as any new significant related party transactions. The Board of Directors is not required to approve each individual transaction that falls under the related party relationships. However, under the direction of the Board of Directors, at least one member of the Company’s senior management team approves each related party transaction. There have been no changes to the contracts and relationships discussed in the Company’s 2014 Annual Report on Form 10-K. Below is a summary of the related party relationships in effect as of March 31, 2015.
Prior to the A7 and A8 mergers, Glade M. Knight, Executive Chairman of the Company and formerly Chairman and Chief Executive Officer of the Company, was Chairman and Chief Executive Officer of Apple Seven and Apple Eight and is currently Chairman and Chief Executive Officer of Apple REIT Ten, Inc. (“Apple Ten”). The former advisors of Apple Seven, Apple Eight and the Company, and the advisors of Apple Ten, are wholly owned by Mr. Knight. Mr. Knight is also a partner and Chief Executive Officer of Energy 11 GP, LLC, which is the general partner of Energy 11, L.P. Effective January 1, 2015, Justin G. Knight, the Company’s President and Chief Executive Officer, and Apple Ten’s President, was appointed to the Company’s Board of Directors.
Index
Fair value
Related debt Notional amount at
March 31, 2015 Maturity date March 31, 2015 December 31, 2014 Term loan facility (1) $ 100,000 3/1/2019 $ (1,553) $ (511)Westford Residence Inn (2)(3) 0 10/1/2015 0 (74)Oceanside Residence Inn/Burbank Residence Inn (2)(4) 0 1/13/2015 0 (11)Oceanside Residence Inn/Burbank Residence Inn (2)(5) 38,310 1/13/2017 (296) (183)
(1) Designated as a cash flow hedge through March 2, 2015 and was fully effective during this period. From March 3, 2015 and thereafter, due to a potential change in the underlying hedged debt instrument as discussed above, the swap is no longer designated as a cash flow hedge.
(2) Not designated as a cash flow hedge. (3) On March 18, 2015, the Company refinanced the related mortgage note and terminated this swap agreement. As part of this termination, the Company paid a fee
of approximately $0.05 million to satisfy the outstanding liability at the time of termination. (4) Swap matured during the first quarter of 2015. (5) Effective date of the forward interest rate swap agreement was January 13, 2015, the same date the previous swap agreement matured.
13

Subcontract Agreement with Apple Ten Advisors, Inc.
In connection with the Merger Agreement, on August 7, 2013, the Company entered into a subcontract agreement, as amended with Apple Ten Advisors, Inc.
(“A10A”) to subcontract A10A’s obligations under the advisory agreement between A10A and Apple Ten to the Company. The subcontract agreement provides that, from and after the completion of the A7 and A8 mergers, the Company provides to Apple Ten advisory services and receives an annual fee ranging from 0.1% to 0.25% (based on Apple Ten’s operating results) of total equity proceeds received by Apple Ten, and is reimbursed by Apple Ten for the use of the Company’s employees and corporate office and other costs associated with the advisory agreement, as described below. Total advisory fees earned by the Company from Apple Ten for the three months ended March 31, 2015 and 2014 totaled approximately $0.4 million and $0.1 million, and are recorded as a reduction to general and administrative expenses in the Company’s consolidated statements of operations.
Support Services to Apple Ten, A10A and Apple Suites Realty Group, Inc.
From and after the A7 and A8 mergers, the Company provides support services to Apple Ten, A10A and Apple Suites Realty Group, Inc. (“ASRG”), which have agreed to reimburse the Company for its costs in providing these services. Total reimbursed costs received by the Company from these entities for the three months ended March 31, 2015 and 2014 totaled approximately $0.7 million and $0.3 million, respectively, and are recorded as a reduction to general and administrative expenses in the Company’s consolidated statements of operations. Under this cost sharing structure, amounts reimbursed to the Company include both compensation for personnel and office related costs (including office rent, utilities, office supplies, etc.) used by each company. The amounts reimbursed to the Company are based on a good faith estimate of the proportionate amount of time incurred by the Company’s employees on behalf of Apple Ten, A10A and ASRG. As part of the cost sharing arrangements, certain day-to-day transactions may result in amounts due to or from the Company, Apple Ten, A10A and ASRG. To efficiently manage cash disbursements, the Company, Apple Ten, A10A or ASRG may make payments for any or all of the related companies. Under the cash management process, each of the companies may advance or defer up to $1 million at any time. Each month, any outstanding amounts are settled among the affected companies. This process allows each company to minimize its cash on hand, which, in turn, reduces the cost of each company’s credit facility. The amounts outstanding at any point in time are not significant to any of the companies.
Apple Air Holding, LLC (“Apple Air”)
The Company, through a jointly-owned subsidiary, Apple Air, owns a Learjet used primarily for acquisition, asset management and renovation purposes. Apple Air is jointly owned by the Company (74%) and Apple Ten (26%), with Apple Ten’s ownership interest accounted for as a minority interest, which as of both March 31, 2015 and December 31, 2014, totaled approximately $1.0 million and is included in accounts payable and other liabilities in the Company’s consolidated balance sheets. The aircraft is also leased to affiliates of the Company based on third party rates, which was not significant during the reporting periods. 8. Shareholders’ Equity
Distributions
For the three months ended March 31, 2015 and 2014, the Company made distributions of $0.17 and $0.1934 per common share for a total of $63.4 million and $45.9 million, respectively. The Company’s current annual distribution rate, payable monthly is $0.68 per common share. As contemplated by the A7 and A8 mergers, the Board of Directors reduced the annual distribution rate from $0.83025 per common share to $0.66 per common share, effective with the March 2014 distribution. Effective with the September 2014 distribution, the Board of Directors increased the annual distribution rate from $0.66 per common share to $0.68 per common share.
Index
14
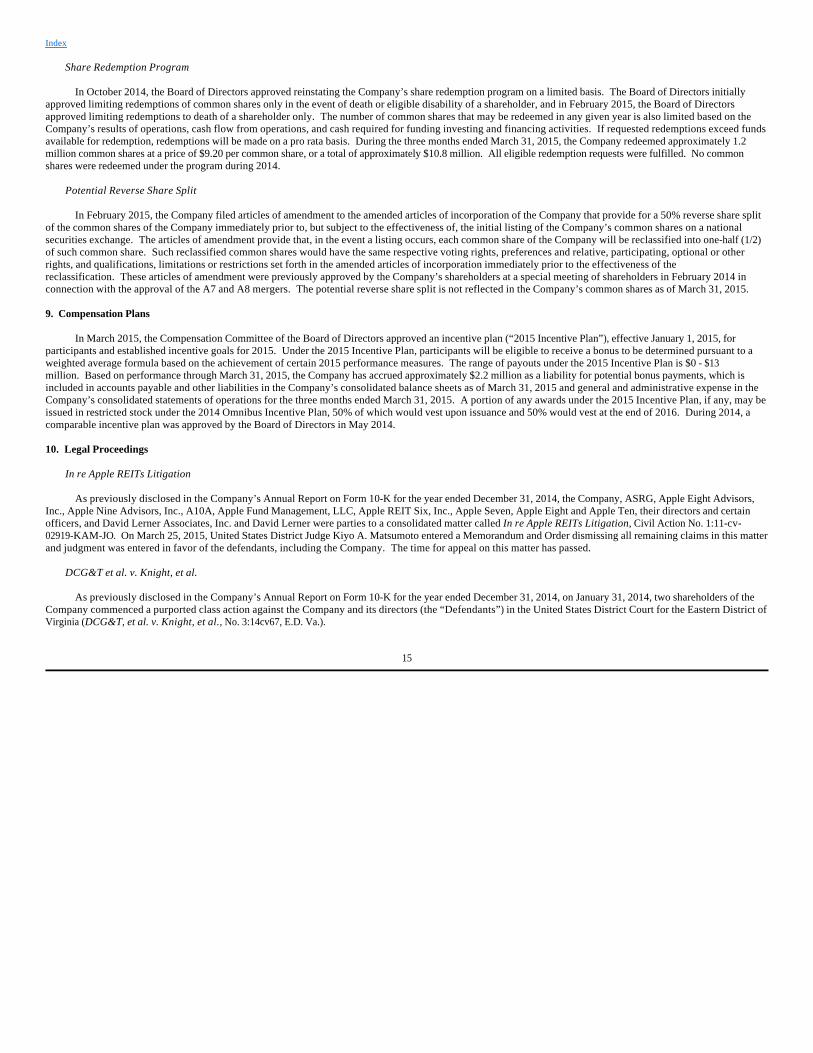
Share Redemption Program
In October 2014, the Board of Directors approved reinstating the Company’s share redemption program on a limited basis. The Board of Directors initially
approved limiting redemptions of common shares only in the event of death or eligible disability of a shareholder, and in February 2015, the Board of Directors approved limiting redemptions to death of a shareholder only. The number of common shares that may be redeemed in any given year is also limited based on the Company’s results of operations, cash flow from operations, and cash required for funding investing and financing activities. If requested redemptions exceed funds available for redemption, redemptions will be made on a pro rata basis. During the three months ended March 31, 2015, the Company redeemed approximately 1.2 million common shares at a price of $9.20 per common share, or a total of approximately $10.8 million. All eligible redemption requests were fulfilled. No common shares were redeemed under the program during 2014.
Potential Reverse Share Split
In February 2015, the Company filed articles of amendment to the amended articles of incorporation of the Company that provide for a 50% reverse share split of the common shares of the Company immediately prior to, but subject to the effectiveness of, the initial listing of the Company’s common shares on a national securities exchange. The articles of amendment provide that, in the event a listing occurs, each common share of the Company will be reclassified into one-half (1/2) of such common share. Such reclassified common shares would have the same respective voting rights, preferences and relative, participating, optional or other rights, and qualifications, limitations or restrictions set forth in the amended articles of incorporation immediately prior to the effectiveness of the reclassification. These articles of amendment were previously approved by the Company’s shareholders at a special meeting of shareholders in February 2014 in connection with the approval of the A7 and A8 mergers. The potential reverse share split is not reflected in the Company’s common shares as of March 31, 2015. 9. Compensation Plans
In March 2015, the Compensation Committee of the Board of Directors approved an incentive plan (“2015 Incentive Plan”), effective January 1, 2015, for participants and established incentive goals for 2015. Under the 2015 Incentive Plan, participants will be eligible to receive a bonus to be determined pursuant to a weighted average formula based on the achievement of certain 2015 performance measures. The range of payouts under the 2015 Incentive Plan is $0 - $13 million. Based on performance through March 31, 2015, the Company has accrued approximately $2.2 million as a liability for potential bonus payments, which is included in accounts payable and other liabilities in the Company’s consolidated balance sheets as of March 31, 2015 and general and administrative expense in the Company’s consolidated statements of operations for the three months ended March 31, 2015. A portion of any awards under the 2015 Incentive Plan, if any, may be issued in restricted stock under the 2014 Omnibus Incentive Plan, 50% of which would vest upon issuance and 50% would vest at the end of 2016. During 2014, a comparable incentive plan was approved by the Board of Directors in May 2014. 10. Legal Proceedings
In re Apple REITs Litigation
As previously disclosed in the Company’s Annual Report on Form 10-K for the year ended December 31, 2014, the Company, ASRG, Apple Eight Advisors, Inc., Apple Nine Advisors, Inc., A10A, Apple Fund Management, LLC, Apple REIT Six, Inc., Apple Seven, Apple Eight and Apple Ten, their directors and certain officers, and David Lerner Associates, Inc. and David Lerner were parties to a consolidated matter called In re Apple REITs Litigation, Civil Action No. 1:11-cv-02919-KAM-JO. On March 25, 2015, United States District Judge Kiyo A. Matsumoto entered a Memorandum and Order dismissing all remaining claims in this matter and judgment was entered in favor of the defendants, including the Company. The time for appeal on this matter has passed.
DCG&T et al. v. Knight, et al.
As previously disclosed in the Company’s Annual Report on Form 10-K for the year ended December 31, 2014, on January 31, 2014, two shareholders of the Company commenced a purported class action against the Company and its directors (the “Defendants”) in the United States District Court for the Eastern District of Virginia (DCG&T, et al. v. Knight, et al., No. 3:14cv67, E.D. Va.).
Index
15

On December 18, 2014, the United States District Court for the Eastern District of Virginia issued an order granting the Defendants’ motion to dismiss in part
and denying it in part. Specifically, the court dismissed each of Plaintiffs’ class action claims, but held that Plaintiffs could bring derivative claims for breach of fiduciary duties of care and loyalty (Count II) and for conflicts of interest (Count IV). On April 1, 2015, the Court entered an agreed stipulation of dismissal, dismissing with prejudice Count IV.
Discovery in the case is proceeding. A bench trial is scheduled to begin July 13, 2015.
The Company believes that Plaintiffs’ claims are without merit and intends to defend this case vigorously. At this time, the Company cannot reasonably predict the outcome of these proceedings or provide a reasonable estimate of the possible loss or range of loss due to these proceedings, if any.
Moses, et al. v. Apple Hospitality REIT, Inc., et al.
As previously disclosed in the Company’s Annual Report on Form 10-K for the year ended December 31, 2014, on April 22, 2014, Plaintiff Susan Moses, purportedly a shareholder of Apple Seven and Apple Eight, now part of the Company, filed a class action against the Company and several individual directors on behalf of all then-existing shareholders and former shareholders of Apple Seven and Apple Eight, now part of the Company, who purchased additional shares under the Apple REITs’ Dividend Reinvestment Plans between July 17, 2007 and February 12, 2014 (Susan Moses, et al. v. Apple Hospitality REIT, Inc., et al., 14-CV-3131 (DLI)(SMG)).
On March 9, 2015, the Court entered a Memorandum and Order dismissing all claims. On April 6, 2015, Plaintiff filed a Second Amended Class Action Complaint asserting a breach of contract claim. Defendants moved to dismiss the Second Amended Complaint on April 29, 2015.
The Company believes that Plaintiff’s claims are without merit and intends to defend this case vigorously. At this time, the Company cannot reasonably predict the outcome of these proceedings or provide a reasonable estimate of the possible loss or range of loss due to these proceedings, if any.
Wenzel v. Knight et al.
As previously disclosed in the Company’s Annual Report on Form 10-K for the year ended December 31, 2014, on June 16, 2014, Plaintiff Dorothy Wenzel, purportedly a shareholder of Apple Seven and Apple Eight, now part of the Company, filed a class action against Apple Seven Advisors, Inc., Apple Eight Advisors, Inc., Apple Fund Management, LLC and several officers and directors of the Company on behalf of all then-existing shareholders and former shareholders of Apple Seven and Apple Eight, now part of the Company, who purchased additional shares under the Apple REITs' Dividend Reinvestment Plans between July 17, 2007 and June 30, 2013 (Wenzel v. Knight, et al., Case No. 3:14-cv-00432, E.D. Va.). On February 4, 2015, Plaintiff filed an amended complaint against the Company, Apple Eight Advisors, Inc., Apple Fund Management, LLC, and several officers and directors of the Company alleging breach of contract, tortious interference with contract, fraud, negligence and violation of the Virginia Securities Act. Defendants’ Motion to Dismiss all claims is fully briefed and the case is stayed pending the Court’s ruling on the Motion.
The Company believes that Plaintiff's claims are without merit and intends to defend this case vigorously. At this time, the Company cannot reasonably predict the outcome of these proceedings or provide a reasonable estimate of the possible loss or range of loss due to these proceedings, if any. 11. Subsequent Events
In April 2015, the Company declared and paid approximately $21.1 million, or $0.056667 per outstanding common share, in distributions to its common shareholders.
In April 2015, under the Company’s limited share redemption program, the Company redeemed approximately 0.4 million common shares in the amount of $4.1 million. Redemptions were limited to death of a shareholder and were made at a price of $9.20 per common share. All eligible redemption requests were fulfilled. Following this redemption, the Board of Directors approved the termination of the limited share redemption program. No additional redemptions will be made under this program.
In April 2015, the Board of Directors approved the termination of the Company’s suspended Dividend Reinvestment Plan, which had been suspended since June 2013.
Index
16
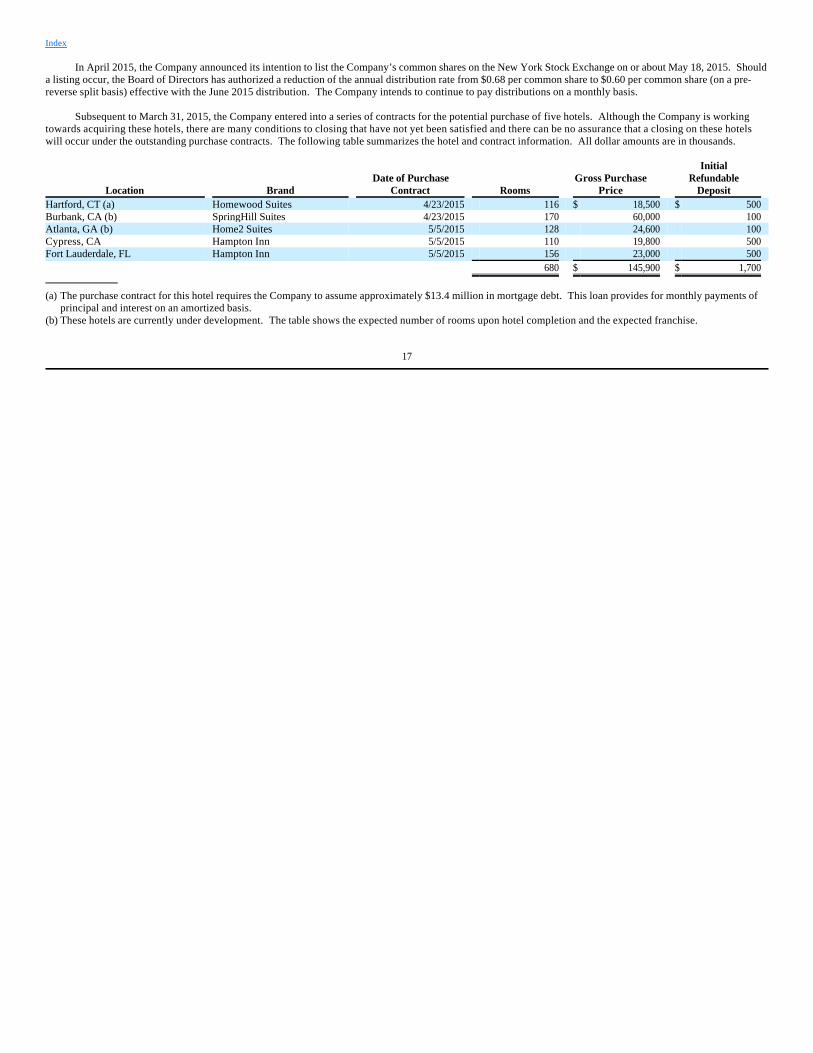
In April 2015, the Company announced its intention to list the Company’s common shares on the New York Stock Exchange on or about May 18, 2015. Should
a listing occur, the Board of Directors has authorized a reduction of the annual distribution rate from $0.68 per common share to $0.60 per common share (on a pre-reverse split basis) effective with the June 2015 distribution. The Company intends to continue to pay distributions on a monthly basis.
Subsequent to March 31, 2015, the Company entered into a series of contracts for the potential purchase of five hotels. Although the Company is working towards acquiring these hotels, there are many conditions to closing that have not yet been satisfied and there can be no assurance that a closing on these hotels will occur under the outstanding purchase contracts. The following table summarizes the hotel and contract information. All dollar amounts are in thousands.
Index
Location
Brand
Date of Purchase Contract Rooms
Gross Purchase Price
Initial Refundable
Deposit Hartford, CT (a) Homewood Suites 4/23/2015 116 $ 18,500 $ 500 Burbank, CA (b) SpringHill Suites 4/23/2015 170 60,000 100 Atlanta, GA (b) Home2 Suites 5/5/2015 128 24,600 100 Cypress, CA Hampton Inn 5/5/2015 110 19,800 500 Fort Lauderdale, FL Hampton Inn 5/5/2015 156 23,000 500 680 $ 145,900 $ 1,700
(a) The purchase contract for this hotel requires the Company to assume approximately $13.4 million in mortgage debt. This loan provides for monthly payments of principal and interest on an amortized basis.
(b) These hotels are currently under development. The table shows the expected number of rooms upon hotel completion and the expected franchise.
17
Item 2. Management’s Discussion and Analysis of Financial Condition and Results of Operations Forward-Looking Statements
This Quarterly Report contains forward-looking statements within the meaning of Section 27A of the Securities Act of 1933, as amended, and Section 21E of the Securities Exchange Act of 1934, as amended. Forward-looking statements are typically identified by use of terms such as “may,” “believe,” “expect,” “anticipate,” “intend,” “estimate,” “project,” “target,” “goal,” “plan,” “should,” “will,” “predict,” “potential,” and similar expressions that convey the uncertainty of future events or outcomes. Such statements, including statements regarding the timing and certainty of a listing of the Company’s common shares on the New York Stock Exchange and other related events, involve known and unknown risks, uncertainties, and other factors which may cause the actual results, performance, or achievements of Apple Hospitality REIT, Inc. (the “Company”) to be materially different from future results, performance or achievements expressed or implied by such forward-looking statements. Such factors include, but are not limited to, the ability of the Company to effectively acquire and dispose of properties; the ability of the Company to implement its operating strategy; the ability of the Company to provide liquidity opportunities for its shareholders; changes in general political, economic and competitive conditions and specific market conditions; adverse changes in the real estate and real estate capital markets; financing risks; the outcome of current and future litigation; regulatory proceedings or inquiries; and changes in laws or regulations or interpretations of current laws and regulations that impact the Company’s business, assets or classification as a real estate investment trust. Although the Company believes that the assumptions underlying the forward-looking statements contained herein are reasonable, any of the assumptions could be inaccurate, and therefore there can be no assurance that such statements included in this Quarterly Report will prove to be accurate. In light of the significant uncertainties inherent in the forward-looking statements included herein, the inclusion of such information should not be regarded as a representation by the Company or any other person that the results or conditions described in such statements or the objectives and plans of the Company will be achieved. In addition, the Company’s qualification as a real estate investment trust involves the application of highly technical and complex provisions of the Internal Revenue Code. Readers should carefully review the risk factors described in the Company’s filings with the Securities and Exchange Commission (“SEC”), including but not limited to those discussed in the section titled Risk Factors in the Company’s Annual Report on Form 10-K for the year ended December 31, 2014. Any forward-looking statement that the Company makes speaks only as of the date of this report. The Company undertakes no obligation to publicly update or revise any forward-looking statements or cautionary factors, as a result of new information, future events, or otherwise, except as required by law.
The following discussion and analysis should be read in conjunction with the Company’s Unaudited Consolidated Financial Statements and Notes thereto, appearing elsewhere in this Quarterly Report on Form 10-Q, as well as the information contained in the Company’s Annual Report on Form 10-K for the year ended December 31, 2014. Overview
The Company is a Virginia corporation that has elected to be treated as a real estate investment trust (“REIT”) for federal income tax purposes. The Company is self-advised and invests in income-producing real estate, primarily in the lodging sector, in the United States. As of March 31, 2015, the Company owned 173 hotels with an aggregate of 22,003 rooms located in 32 states. All of the Company’s hotels operate under Marriott or Hilton brands. The hotels are operated and managed under separate management agreements with 17 hotel management companies, none of which are affiliated with the Company. Hotel Operations
Although hotel performance can be influenced by many factors including local competition, local and general economic conditions in the United States and the performance of individual managers assigned to each hotel, performance of the hotels as compared to other hotels within their respective local markets, in general, has met the Company’s expectations for the period owned. The hotel industry and the Company’s hotels overall continue to experience improvement in both revenues and operating income as compared to the prior year. Although the economy in the United States has continued to improve, there is no way to predict future general economic conditions, and there are certain factors that could negatively affect the lodging industry and the Company, including but not limited to, increased hotel supply in certain markets, labor uncertainty both for the economy as a whole and the lodging industry in particular, global volatility and government fiscal policies. The Company, on a comparable basis (as defined below), and industry are forecasting a mid to upper-single digit percentage increase in revenue for 2015 as compared to 2014.
Index
18

In evaluating financial condition and operating performance, the most important indicators on which the Company focuses are revenue measurements, such as
average occupancy, average daily rate (“ADR”) and revenue per available room (“RevPAR”), and expenses, such as hotel operating expenses, general and administrative expenses and other expenses described below.
The Company continually monitors the profitability of its properties, market conditions, and capital requirements and attempts to maximize shareholder value by timely disposal of properties. In December 2014, the Company entered into a purchase and sale agreement for 19 properties for $213 million. These properties were identified for potential sale during the third quarter of 2014 based on individual market conditions, the Company’s total investment in certain markets and additional capital requirements for these properties. On February 26, 2015, the Company completed the sale of 18 of the 19 hotels for a total sales price of $206.4 million, resulting in a gain of approximately $15.6 million, which is included in the Company’s consolidated statement of operations in the first quarter of 2015. Twelve of the 18 hotels sold were acquired in the Company’s mergers with Apple REIT Seven, Inc. (“Apple Seven”) and Apple REIT Eight, Inc. (“Apple Eight”), effective March 1, 2014 (the “A7 and A8 mergers”). As contemplated in the purchase and sale agreement, the buyer exercised its right to exclude the remaining hotel with a purchase price of $6.6 million from the transaction. At this time, the Company does not have any immediate plans to sell this hotel. The Company used a portion of the proceeds from the sale to repay the outstanding balance under its revolving credit facility, with the remaining portion to be used to acquire other hotel properties and fund hotel renovations. The sale of these properties does not represent a strategic shift that has, or will have, a major effect on the Company’s operations and financial results, and therefore the operating results for the period of ownership of these properties are included in income from continuing operations for the three months ended March 31, 2015 and 2014.
As of March 31, 2015, the Company owned 173 hotels. For hotels acquired, opened or disposed of during the current reporting period and prior year, operating results for these hotels are not comparable for the three months ended March 31, 2015 and 2014. These hotels include 99 continuing hotels that were acquired in the A7 and A8 mergers, effective March 1, 2014, one hotel acquired and two newly constructed hotels that opened during the fourth quarter of 2014, and the 18 hotels disposed of on February 26, 2015 (12 of which were acquired in the A7 and A8 mergers). The results of operations for the three months ended March 31, 2014 include only one month of results for the hotels acquired through the A7 and A8 mergers. Additionally, the results of operations for the three months ended March 31, 2015 include results of operations for the 18 hotels sold on February 26, 2015 only through the time of the sale.
The following is a summary of the results from operations of the Company’s hotels for their respective periods of ownership.
Index
Three Months Ended March 31, (in thousands) 2015 Percent of Revenue 2014 Percent of Revenue Total revenue $ 210,352 100% $ 137,121 100%Hotel operating expense 122,513 58% 78,349 57%Property taxes, insurance and other expense 11,561 5% 7,126 5%Ground lease expense 2,501 1% 872 1%General and administrative expense 5,547 3% 2,519 2% Transaction and potential listing costs 1,224 2,110 Depreciation expense 30,719 19,559 Interest and other expense, net 7,737 3,524 Gain on sale of real estate 15,629 - Income tax expense 312 391
19
Comparable Operating Results
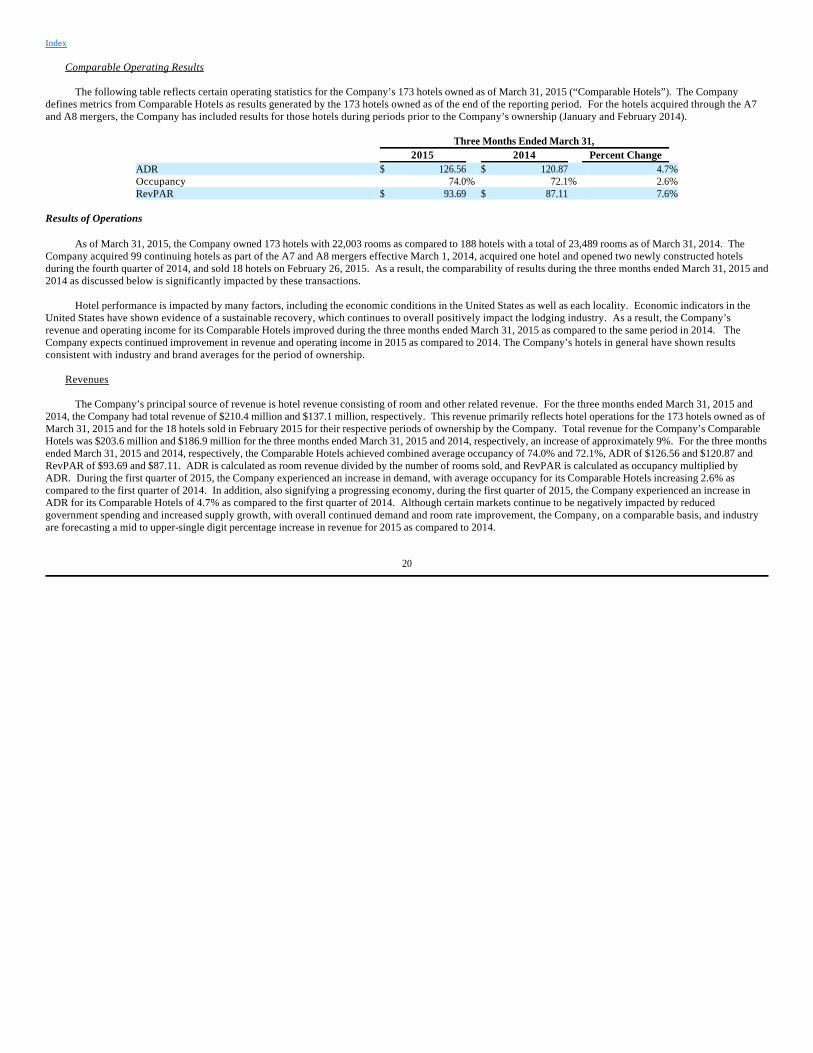
The following table reflects certain operating statistics for the Company’s 173 hotels owned as of March 31, 2015 (“Comparable Hotels”). The Company
defines metrics from Comparable Hotels as results generated by the 173 hotels owned as of the end of the reporting period. For the hotels acquired through the A7 and A8 mergers, the Company has included results for those hotels during periods prior to the Company’s ownership (January and February 2014).
Results of Operations
As of March 31, 2015, the Company owned 173 hotels with 22,003 rooms as compared to 188 hotels with a total of 23,489 rooms as of March 31, 2014. The Company acquired 99 continuing hotels as part of the A7 and A8 mergers effective March 1, 2014, acquired one hotel and opened two newly constructed hotels during the fourth quarter of 2014, and sold 18 hotels on February 26, 2015. As a result, the comparability of results during the three months ended March 31, 2015 and 2014 as discussed below is significantly impacted by these transactions.
Hotel performance is impacted by many factors, including the economic conditions in the United States as well as each locality. Economic indicators in the United States have shown evidence of a sustainable recovery, which continues to overall positively impact the lodging industry. As a result, the Company’s revenue and operating income for its Comparable Hotels improved during the three months ended March 31, 2015 as compared to the same period in 2014. The Company expects continued improvement in revenue and operating income in 2015 as compared to 2014. The Company’s hotels in general have shown results consistent with industry and brand averages for the period of ownership.
Revenues
The Company’s principal source of revenue is hotel revenue consisting of room and other related revenue. For the three months ended March 31, 2015 and 2014, the Company had total revenue of $210.4 million and $137.1 million, respectively. This revenue primarily reflects hotel operations for the 173 hotels owned as of March 31, 2015 and for the 18 hotels sold in February 2015 for their respective periods of ownership by the Company. Total revenue for the Company’s Comparable Hotels was $203.6 million and $186.9 million for the three months ended March 31, 2015 and 2014, respectively, an increase of approximately 9%. For the three months ended March 31, 2015 and 2014, respectively, the Comparable Hotels achieved combined average occupancy of 74.0% and 72.1%, ADR of $126.56 and $120.87 and RevPAR of $93.69 and $87.11. ADR is calculated as room revenue divided by the number of rooms sold, and RevPAR is calculated as occupancy multiplied by ADR. During the first quarter of 2015, the Company experienced an increase in demand, with average occupancy for its Comparable Hotels increasing 2.6% as compared to the first quarter of 2014. In addition, also signifying a progressing economy, during the first quarter of 2015, the Company experienced an increase in ADR for its Comparable Hotels of 4.7% as compared to the first quarter of 2014. Although certain markets continue to be negatively impacted by reduced government spending and increased supply growth, with overall continued demand and room rate improvement, the Company, on a comparable basis, and industry are forecasting a mid to upper-single digit percentage increase in revenue for 2015 as compared to 2014.
Index
Three Months Ended March 31, 2015 2014 Percent Change ADR $ 126.56 $ 120.87 4.7%Occupancy 74.0% 72.1% 2.6%RevPAR $ 93.69 $ 87.11 7.6%
20

Expenses
Hotel operating expense primarily relates to the 173 hotels owned as of March 31, 2015 and for the 18 hotels sold in February 2015 for their respective periods
owned and consists of direct room operating expense, hotel administrative expense, sales and marketing expense, utilities expense, repair and maintenance expense, franchise fees and management fees. For the three months ended March 31, 2015 and 2014, respectively, hotel operating expense totaled $122.5 million and $78.3 million or 58% and 57% of total revenue for each respective period. Overall hotel operational expenses for the first quarter of 2015 reflect the impact of the A7 and A8 mergers for the entire quarter and the impact of the disposition of 18 hotels until the date of sale, and for the first quarter of 2014 reflect the A7 and A8 mergers only for the month of March and the 18 hotels sold in 2015 (of which 12 were acquired in the A7 and A8 mergers) for the entire period. The increase in operating expense as a percentage of revenue is primarily due to the timing of the A7 and A8 mergers, which were effective March 1, 2014. For the Company’s Comparable Hotels, operating expense as a percentage of revenue decreased slightly for the three months ended March 31, 2015 as compared to the same period in 2014 primarily due to the overall increase in ADR for these hotels. Certain operating costs such as management costs, certain utility costs and minimum supply and maintenance costs are relatively fixed in nature. The Company has been successful in reducing, relative to revenue increases, certain labor costs, hotel supply costs, maintenance costs and utility costs by continually monitoring and sharing utilization data across its hotels and management companies. The Company has experienced a modest increase in labor benefit costs compared to the same period in the prior year, which are likely to continue to grow at increased rates due to government regulations surrounding healthcare and other benefits. Other government-related initiatives, such as the “living wage” increase, also could impact operating expenses in certain markets moving forward. Although operating expenses will increase as revenue increases, the Company will continue to work with its management companies to reduce costs as a percentage of revenue where possible while maintaining quality and service levels at each property.
Property taxes, insurance, and other expense for the three months ended March 31, 2015 and 2014 totaled $11.6 million and $7.1 million, respectively, or 5% of total revenue for each respective period. For the Company’s Comparable Hotels, real estate taxes during the three months ended March 31, 2015 increased due to higher taxes for certain properties as a result of the reassessment of property values by localities and from the improved economy, partially offset by a decrease in 2015 due to successful appeals of tax assessments at certain locations. With the economy continuing to improve, the Company anticipates continued increases in property tax assessments during the remainder of 2015. The Company will continue to appeal tax assessments in certain jurisdictions to minimize the tax increases as warranted.
Ground lease expense for the three months ended March 31, 2015 and 2014 was $2.5 million and $0.9 million, respectively. Ground lease expense primarily represents the expense incurred by the Company to lease land for ten of its hotel properties, nine of which were acquired effective March 1, 2014 with the A7 and A8 mergers.
General and administrative expense for the three months ended March 31, 2015 and 2014 was $5.5 million and $2.5 million, respectively, or 3% and 2% of total revenue for each respective period. The principal components of general and administrative expense are payroll and related benefit costs, advisory fees and reimbursable expenses incurred prior to the A7 and A8 mergers, as well as legal fees, accounting fees and reporting expenses. In connection with the completion of the A7 and A8 mergers, the Company became self-advised and the advisory agreements between the Company and its advisors were terminated. As a result, the employees, including management, became employed by the Company at that time, rather than the Company’s former external advisor. In addition, from and after the A7 and A8 mergers, the Company provides to Apple REIT Ten, Inc. (“Apple Ten”) the advisory services contemplated under their advisory agreement, and the Company receives fees and reimbursement of expenses payable under the advisory agreement from Apple Ten, both of which are reductions to general and administrative expenses. The increase in general and administrative expense was primarily related to approximately $2.2 million accrued during the first quarter of 2015 for potential payments under the Company’s 2015 incentive compensation plan. During 2014, a comparable plan was approved by the Board of Directors in May 2014, and therefore potential payments related to this plan were not incurred until the second quarter of 2014.
Transaction and potential listing costs for the three months ended March 31, 2015 and 2014 were $1.2 million and $2.1 million, respectively, and consists primarily of costs related to the A7 and A8 mergers, effective March 1, 2014, and costs related to the Board of Directors’ ongoing review and evaluation of strategic alternatives, including a potential listing of the Company’s common shares on a national securities exchange. Merger costs for the three months ended March 31, 2015 consisted primarily of costs to defend the A7 and A8 mergers class action lawsuit, discussed in Note 10 titled Legal Proceedings in the Company’s Unaudited Consolidated Financial Statements and Notes thereto, appearing elsewhere in this Quarterly Report on Form 10-Q.
Index
21
Depreciation expense for the three months ended March 31, 2015 and 2014 was $30.7 million and $19.6 million, respectively. Depreciation expense primarily
represents expense of the Company’s hotel buildings and related improvements, and associated personal property (furniture, fixtures, and equipment) for their respective periods owned. The increase was due to the increase in the number of properties owned as a result of the A7 and A8 mergers and renovations completed throughout 2015 and 2014. These increases were partially offset by the sale of the 18 hotels in February 2015, which were classified as held for sale as of December 31, 2014 and therefore no depreciation was recorded for the properties during the first quarter of 2015.
Interest and other expense, net for the three months ended March 31, 2015 and 2014 was $7.7 million and $3.5 million, respectively and is net of approximately $0.6 million and $0.3 million of interest capitalized associated with renovation and construction projects. The increase in interest expense was primarily due to an increase in the Company’s average outstanding borrowings during the first quarter of 2015 as compared to the prior year’s quarter which is attributable to (a) the mortgage debt assumed effective March 1, 2014 with the A7 and A8 mergers and (b) borrowings on the Company’s $345 million credit facility beginning March 3, 2014, which were primarily used to repay the extinguished credit facilities associated with the A7 and A8 mergers, pay closing costs, fund hotel renovations and development, service debt repayments and other general corporate purposes. These increases were partially offset by a full repayment of the outstanding balance of the Company’s revolving credit facility as a result of cash proceeds received from the sale of 18 hotels on February 26, 2015 as discussed herein. The impact of higher debt balances was partially offset by a reduction in the average interest rate incurred under the Company’s outstanding debt. In addition to the above, the Company recorded a loss of approximately $0.8 million to interest and other expense, net during the first quarter of 2015 related to the change in fair value in the Company’s interest rate swap that was no longer designated as a cash flow hedge due to a potential change in the underlying hedged debt instrument. Series B Convertible Preferred Share Expense
In connection with completion of the A7 and A8 mergers, the Company became self-advised and the advisory agreements between the Company and its advisors were terminated. The termination of the advisory agreements resulted in the conversion of each issued and outstanding Series B convertible preferred share of the Company into 24.17104 common shares of the Company, or approximately 11.6 million common shares. As a result of the conversion, all of the Company’s Series A preferred shares were terminated and the Company only has common shares outstanding. In conjunction with this event, during the first quarter of 2014, the Company recorded a non-cash expense totaling approximately $117.1 million, included in the Company’s consolidated statements of operations, to reflect the fair value estimate of the conversion of the Series B convertible preferred shares to common shares at a fair value estimate of $10.10 per common share. Non-GAAP Financial Measures
The Company considers the following non-GAAP financial measures useful to investors as key supplemental measures of its operating performance: Funds from Operations (“FFO”), Modified FFO (“MFFO”), Earnings before Interest, Income Taxes, Depreciation and Amortization (“EBITDA”), and Adjusted EBITDA (“Adjusted EBITDA”). These non-GAAP financial measures should be considered along with, but not as alternatives to, net income (loss), cash flow from operations or any other operating GAAP measure. FFO, MFFO, EBITDA and Adjusted EBITDA are not necessarily indicative of funds available to fund the Company’s cash needs, including its ability to make cash distributions. Although FFO, MFFO, EBITDA and Adjusted EBITDA, as calculated by the Company, may not be comparable to FFO, MFFO, EBITDA and Adjusted EBITDA as reported by other companies that do not define such terms exactly as the Company defines such terms, the Company believes these supplemental measures are useful to investors when comparing the Company’s results between periods and with other REITs.
Index
22
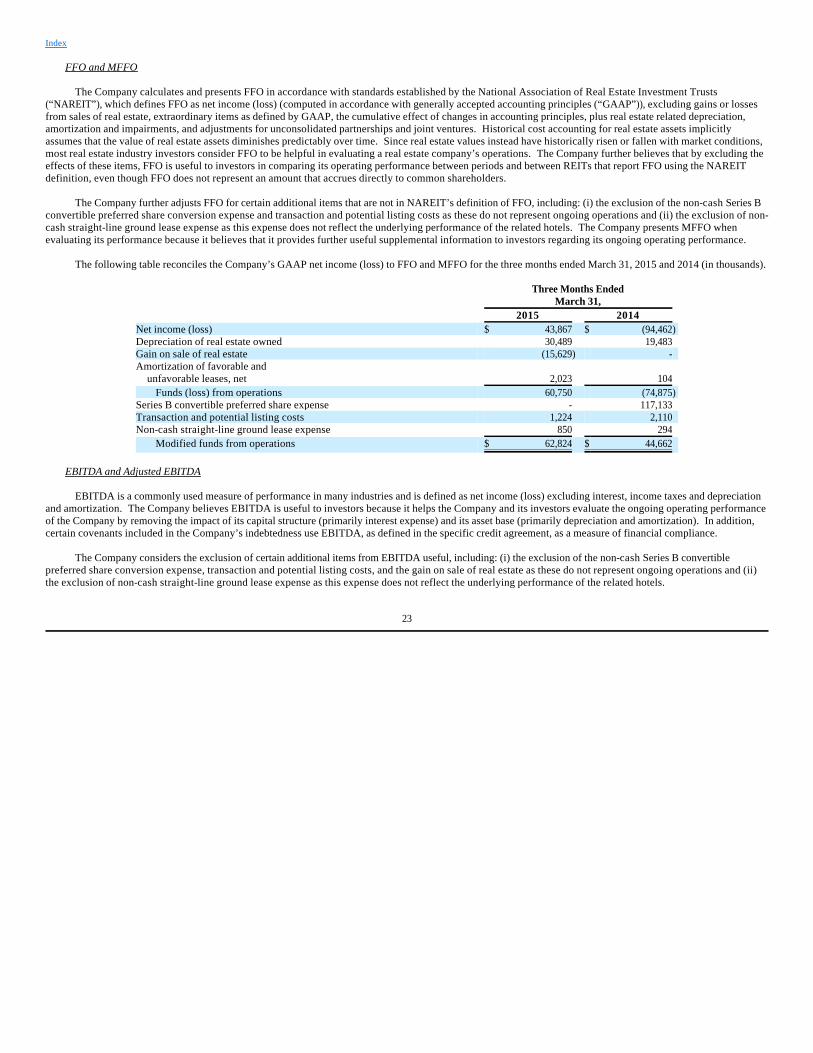
FFO and MFFO
The Company calculates and presents FFO in accordance with standards established by the National Association of Real Estate Investment Trusts
(“NAREIT”), which defines FFO as net income (loss) (computed in accordance with generally accepted accounting principles (“GAAP”)), excluding gains or losses from sales of real estate, extraordinary items as defined by GAAP, the cumulative effect of changes in accounting principles, plus real estate related depreciation, amortization and impairments, and adjustments for unconsolidated partnerships and joint ventures. Historical cost accounting for real estate assets implicitly assumes that the value of real estate assets diminishes predictably over time. Since real estate values instead have historically risen or fallen with market conditions, most real estate industry investors consider FFO to be helpful in evaluating a real estate company’s operations. The Company further believes that by excluding the effects of these items, FFO is useful to investors in comparing its operating performance between periods and between REITs that report FFO using the NAREIT definition, even though FFO does not represent an amount that accrues directly to common shareholders.
The Company further adjusts FFO for certain additional items that are not in NAREIT’s definition of FFO, including: (i) the exclusion of the non-cash Series B convertible preferred share conversion expense and transaction and potential listing costs as these do not represent ongoing operations and (ii) the exclusion of non-cash straight-line ground lease expense as this expense does not reflect the underlying performance of the related hotels. The Company presents MFFO when evaluating its performance because it believes that it provides further useful supplemental information to investors regarding its ongoing operating performance.
The following table reconciles the Company’s GAAP net income (loss) to FFO and MFFO for the three months ended March 31, 2015 and 2014 (in thousands).
EBITDA and Adjusted EBITDA
EBITDA is a commonly used measure of performance in many industries and is defined as net income (loss) excluding interest, income taxes and depreciation
and amortization. The Company believes EBITDA is useful to investors because it helps the Company and its investors evaluate the ongoing operating performance of the Company by removing the impact of its capital structure (primarily interest expense) and its asset base (primarily depreciation and amortization). In addition, certain covenants included in the Company’s indebtedness use EBITDA, as defined in the specific credit agreement, as a measure of financial compliance.
The Company considers the exclusion of certain additional items from EBITDA useful, including: (i) the exclusion of the non-cash Series B convertible preferred share conversion expense, transaction and potential listing costs, and the gain on sale of real estate as these do not represent ongoing operations and (ii) the exclusion of non-cash straight-line ground lease expense as this expense does not reflect the underlying performance of the related hotels.
Index
Three Months Ended March 31, 2015 2014 Net income (loss) $ 43,867 $ (94,462)Depreciation of real estate owned 30,489 19,483 Gain on sale of real estate (15,629) - Amortization of favorable and unfavorable leases, net 2,023 104
Funds (loss) from operations 60,750 (74,875)Series B convertible preferred share expense - 117,133 Transaction and potential listing costs 1,224 2,110 Non-cash straight-line ground lease expense 850 294
Modified funds from operations $ 62,824 $ 44,662
23
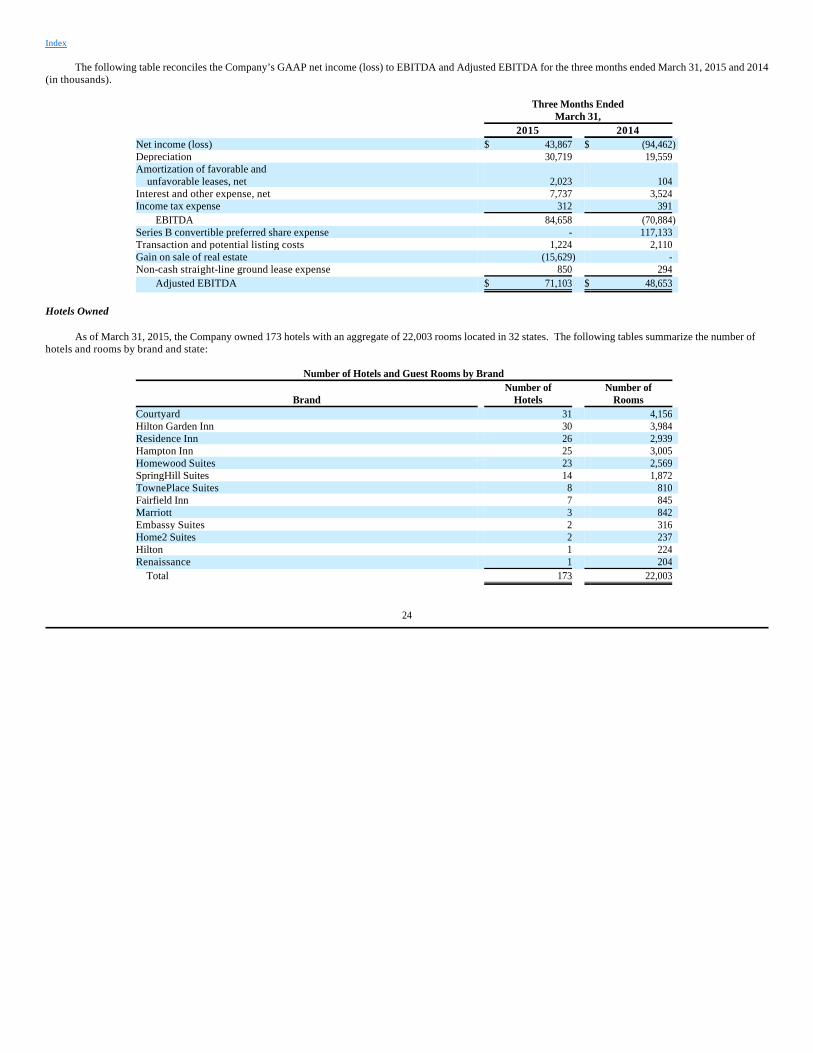
The following table reconciles the Company’s GAAP net income (loss) to EBITDA and Adjusted EBITDA for the three months ended March 31, 2015 and 2014
(in thousands).
Hotels Owned
As of March 31, 2015, the Company owned 173 hotels with an aggregate of 22,003 rooms located in 32 states. The following tables summarize the number of hotels and rooms by brand and state:
Index
Three Months Ended March 31, 2015 2014 Net income (loss) $ 43,867 $ (94,462)Depreciation 30,719 19,559 Amortization of favorable and unfavorable leases, net 2,023 104 Interest and other expense, net 7,737 3,524 Income tax expense 312 391
EBITDA 84,658 (70,884)Series B convertible preferred share expense - 117,133 Transaction and potential listing costs 1,224 2,110 Gain on sale of real estate (15,629) - Non-cash straight-line ground lease expense 850 294
Adjusted EBITDA $ 71,103 $ 48,653
Number of Hotels and Guest Rooms by Brand Number of Number of
Brand Hotels Rooms Courtyard 31 4,156 Hilton Garden Inn 30 3,984 Residence Inn 26 2,939 Hampton Inn 25 3,005 Homewood Suites 23 2,569 SpringHill Suites 14 1,872 TownePlace Suites 8 810 Fairfield Inn 7 845 Marriott 3 842 Embassy Suites 2 316 Home2 Suites 2 237 Hilton 1 224 Renaissance 1 204 Total 173 22,003
24

Index
Number of Hotels and Guest Rooms by State Number of Number of
State Hotels Rooms Alabama 10 948 Alaska 1 169 Arizona 7 926 Arkansas 4 408 California 19 2,527 Colorado 2 245 Florida 15 1,833 Georgia 5 468 Idaho 2 416 Illinois 4 601 Indiana 2 236 Kansas 4 422 Louisiana 4 541 Massachusetts 4 466 Maryland 2 233 Michigan 1 148 Minnesota 1 124 Mississippi 3 264 Missouri 4 544 Nebraska 1 181 New Jersey 5 629 New York 2 368 North Carolina 9 1,038 Ohio 1 142 Oklahoma 1 200 Pennsylvania 3 391 South Carolina 3 325 Tennessee 6 702 Texas 28 3,452 Utah 2 257 Virginia 14 2,190 Washington 4 609 Total 173 22,003
25
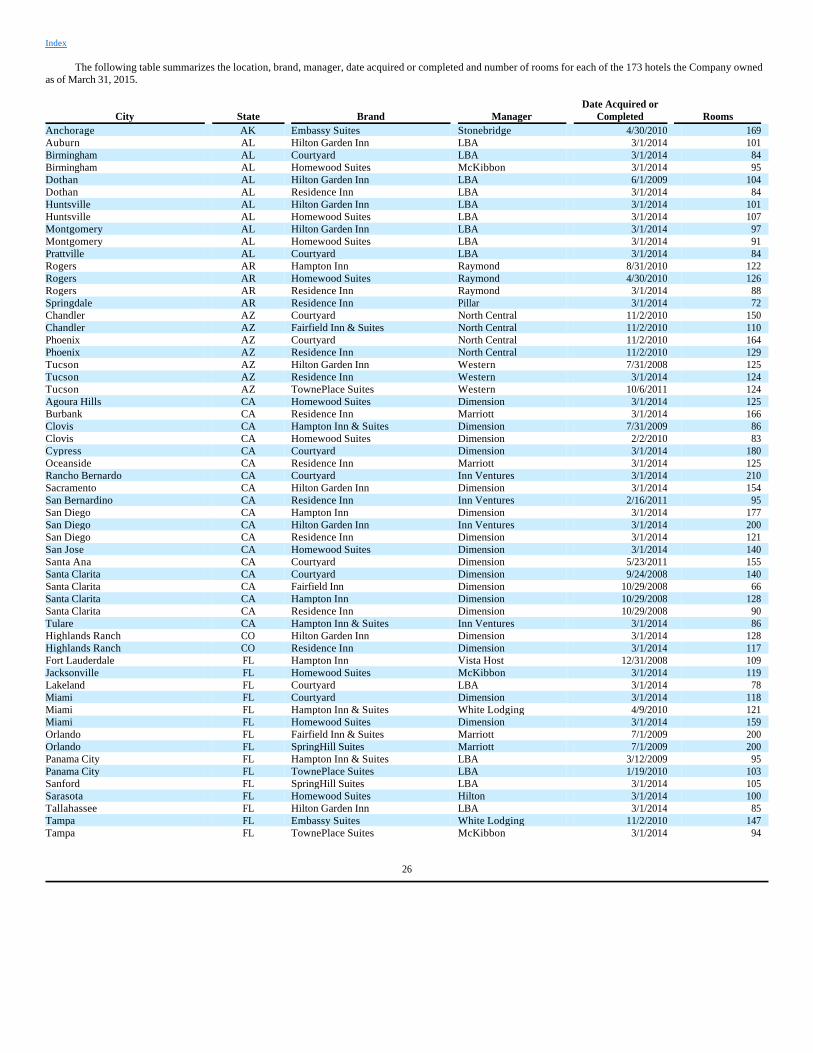
The following table summarizes the location, brand, manager, date acquired or completed and number of rooms for each of the 173 hotels the Company owned
as of March 31, 2015.
Index
City State Brand Manager Date Acquired or
Completed Rooms Anchorage AK Embassy Suites Stonebridge 4/30/2010 169 Auburn AL Hilton Garden Inn LBA 3/1/2014 101 Birmingham AL Courtyard LBA 3/1/2014 84 Birmingham AL Homewood Suites McKibbon 3/1/2014 95 Dothan AL Hilton Garden Inn LBA 6/1/2009 104 Dothan AL Residence Inn LBA 3/1/2014 84 Huntsville AL Hilton Garden Inn LBA 3/1/2014 101 Huntsville AL Homewood Suites LBA 3/1/2014 107 Montgomery AL Hilton Garden Inn LBA 3/1/2014 97 Montgomery AL Homewood Suites LBA 3/1/2014 91 Prattville AL Courtyard LBA 3/1/2014 84 Rogers AR Hampton Inn Raymond 8/31/2010 122 Rogers AR Homewood Suites Raymond 4/30/2010 126 Rogers AR Residence Inn Raymond 3/1/2014 88 Springdale AR Residence Inn Pillar 3/1/2014 72 Chandler AZ Courtyard North Central 11/2/2010 150 Chandler AZ Fairfield Inn & Suites North Central 11/2/2010 110 Phoenix AZ Courtyard North Central 11/2/2010 164 Phoenix AZ Residence Inn North Central 11/2/2010 129 Tucson AZ Hilton Garden Inn Western 7/31/2008 125 Tucson AZ Residence Inn Western 3/1/2014 124 Tucson AZ TownePlace Suites Western 10/6/2011 124 Agoura Hills CA Homewood Suites Dimension 3/1/2014 125 Burbank CA Residence Inn Marriott 3/1/2014 166 Clovis CA Hampton Inn & Suites Dimension 7/31/2009 86 Clovis CA Homewood Suites Dimension 2/2/2010 83 Cypress CA Courtyard Dimension 3/1/2014 180 Oceanside CA Residence Inn Marriott 3/1/2014 125 Rancho Bernardo CA Courtyard Inn Ventures 3/1/2014 210 Sacramento CA Hilton Garden Inn Dimension 3/1/2014 154 San Bernardino CA Residence Inn Inn Ventures 2/16/2011 95 San Diego CA Hampton Inn Dimension 3/1/2014 177 San Diego CA Hilton Garden Inn Inn Ventures 3/1/2014 200 San Diego CA Residence Inn Dimension 3/1/2014 121 San Jose CA Homewood Suites Dimension 3/1/2014 140 Santa Ana CA Courtyard Dimension 5/23/2011 155 Santa Clarita CA Courtyard Dimension 9/24/2008 140 Santa Clarita CA Fairfield Inn Dimension 10/29/2008 66 Santa Clarita CA Hampton Inn Dimension 10/29/2008 128 Santa Clarita CA Residence Inn Dimension 10/29/2008 90 Tulare CA Hampton Inn & Suites Inn Ventures 3/1/2014 86 Highlands Ranch CO Hilton Garden Inn Dimension 3/1/2014 128 Highlands Ranch CO Residence Inn Dimension 3/1/2014 117 Fort Lauderdale FL Hampton Inn Vista Host 12/31/2008 109 Jacksonville FL Homewood Suites McKibbon 3/1/2014 119 Lakeland FL Courtyard LBA 3/1/2014 78 Miami FL Courtyard Dimension 3/1/2014 118 Miami FL Hampton Inn & Suites White Lodging 4/9/2010 121 Miami FL Homewood Suites Dimension 3/1/2014 159 Orlando FL Fairfield Inn & Suites Marriott 7/1/2009 200 Orlando FL SpringHill Suites Marriott 7/1/2009 200 Panama City FL Hampton Inn & Suites LBA 3/12/2009 95 Panama City FL TownePlace Suites LBA 1/19/2010 103 Sanford FL SpringHill Suites LBA 3/1/2014 105 Sarasota FL Homewood Suites Hilton 3/1/2014 100 Tallahassee FL Hilton Garden Inn LBA 3/1/2014 85 Tampa FL Embassy Suites White Lodging 11/2/2010 147 Tampa FL TownePlace Suites McKibbon 3/1/2014 94
26
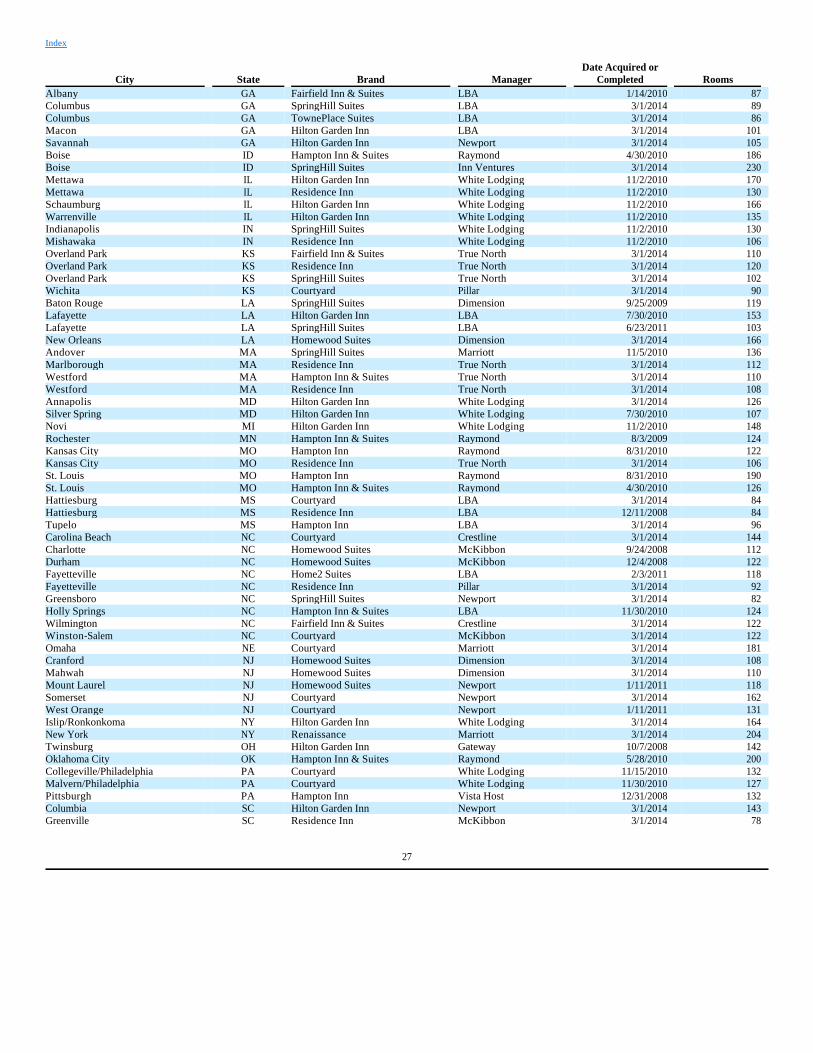
Index
City State Brand Manager Date Acquired or
Completed Rooms Albany GA Fairfield Inn & Suites LBA 1/14/2010 87 Columbus GA SpringHill Suites LBA 3/1/2014 89 Columbus GA TownePlace Suites LBA 3/1/2014 86 Macon GA Hilton Garden Inn LBA 3/1/2014 101 Savannah GA Hilton Garden Inn Newport 3/1/2014 105 Boise ID Hampton Inn & Suites Raymond 4/30/2010 186 Boise ID SpringHill Suites Inn Ventures 3/1/2014 230 Mettawa IL Hilton Garden Inn White Lodging 11/2/2010 170 Mettawa IL Residence Inn White Lodging 11/2/2010 130 Schaumburg IL Hilton Garden Inn White Lodging 11/2/2010 166 Warrenville IL Hilton Garden Inn White Lodging 11/2/2010 135 Indianapolis IN SpringHill Suites White Lodging 11/2/2010 130 Mishawaka IN Residence Inn White Lodging 11/2/2010 106 Overland Park KS Fairfield Inn & Suites True North 3/1/2014 110 Overland Park KS Residence Inn True North 3/1/2014 120 Overland Park KS SpringHill Suites True North 3/1/2014 102 Wichita KS Courtyard Pillar 3/1/2014 90 Baton Rouge LA SpringHill Suites Dimension 9/25/2009 119 Lafayette LA Hilton Garden Inn LBA 7/30/2010 153 Lafayette LA SpringHill Suites LBA 6/23/2011 103 New Orleans LA Homewood Suites Dimension 3/1/2014 166 Andover MA SpringHill Suites Marriott 11/5/2010 136 Marlborough MA Residence Inn True North 3/1/2014 112 Westford MA Hampton Inn & Suites True North 3/1/2014 110 Westford MA Residence Inn True North 3/1/2014 108 Annapolis MD Hilton Garden Inn White Lodging 3/1/2014 126 Silver Spring MD Hilton Garden Inn White Lodging 7/30/2010 107 Novi MI Hilton Garden Inn White Lodging 11/2/2010 148 Rochester MN Hampton Inn & Suites Raymond 8/3/2009 124 Kansas City MO Hampton Inn Raymond 8/31/2010 122 Kansas City MO Residence Inn True North 3/1/2014 106 St. Louis MO Hampton Inn Raymond 8/31/2010 190 St. Louis MO Hampton Inn & Suites Raymond 4/30/2010 126 Hattiesburg MS Courtyard LBA 3/1/2014 84 Hattiesburg MS Residence Inn LBA 12/11/2008 84 Tupelo MS Hampton Inn LBA 3/1/2014 96 Carolina Beach NC Courtyard Crestline 3/1/2014 144 Charlotte NC Homewood Suites McKibbon 9/24/2008 112 Durham NC Homewood Suites McKibbon 12/4/2008 122 Fayetteville NC Home2 Suites LBA 2/3/2011 118 Fayetteville NC Residence Inn Pillar 3/1/2014 92 Greensboro NC SpringHill Suites Newport 3/1/2014 82 Holly Springs NC Hampton Inn & Suites LBA 11/30/2010 124 Wilmington NC Fairfield Inn & Suites Crestline 3/1/2014 122 Winston-Salem NC Courtyard McKibbon 3/1/2014 122 Omaha NE Courtyard Marriott 3/1/2014 181 Cranford NJ Homewood Suites Dimension 3/1/2014 108 Mahwah NJ Homewood Suites Dimension 3/1/2014 110 Mount Laurel NJ Homewood Suites Newport 1/11/2011 118 Somerset NJ Courtyard Newport 3/1/2014 162 West Orange NJ Courtyard Newport 1/11/2011 131 Islip/Ronkonkoma NY Hilton Garden Inn White Lodging 3/1/2014 164 New York NY Renaissance Marriott 3/1/2014 204 Twinsburg OH Hilton Garden Inn Gateway 10/7/2008 142 Oklahoma City OK Hampton Inn & Suites Raymond 5/28/2010 200 Collegeville/Philadelphia PA Courtyard White Lodging 11/15/2010 132 Malvern/Philadelphia PA Courtyard White Lodging 11/30/2010 127 Pittsburgh PA Hampton Inn Vista Host 12/31/2008 132 Columbia SC Hilton Garden Inn Newport 3/1/2014 143 Greenville SC Residence Inn McKibbon 3/1/2014 78
27
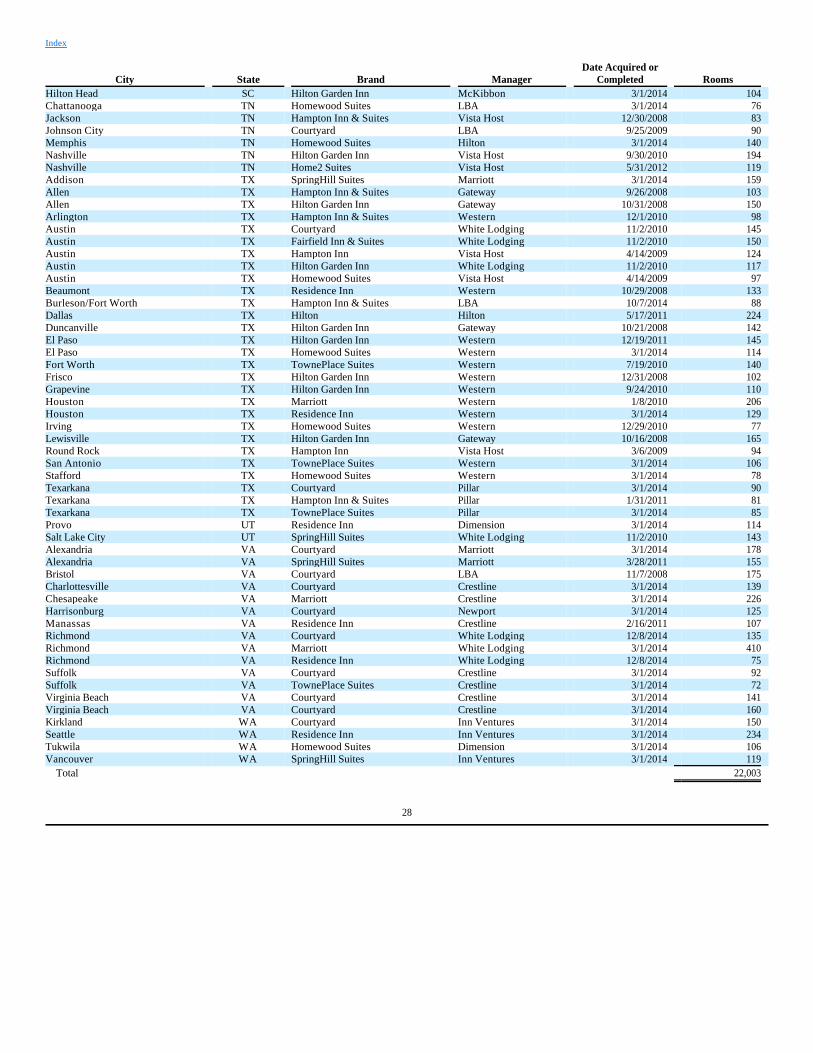
Index
City State Brand Manager Date Acquired or
Completed Rooms Hilton Head SC Hilton Garden Inn McKibbon 3/1/2014 104 Chattanooga TN Homewood Suites LBA 3/1/2014 76 Jackson TN Hampton Inn & Suites Vista Host 12/30/2008 83 Johnson City TN Courtyard LBA 9/25/2009 90 Memphis TN Homewood Suites Hilton 3/1/2014 140 Nashville TN Hilton Garden Inn Vista Host 9/30/2010 194 Nashville TN Home2 Suites Vista Host 5/31/2012 119 Addison TX SpringHill Suites Marriott 3/1/2014 159 Allen TX Hampton Inn & Suites Gateway 9/26/2008 103 Allen TX Hilton Garden Inn Gateway 10/31/2008 150 Arlington TX Hampton Inn & Suites Western 12/1/2010 98 Austin TX Courtyard White Lodging 11/2/2010 145 Austin TX Fairfield Inn & Suites White Lodging 11/2/2010 150 Austin TX Hampton Inn Vista Host 4/14/2009 124 Austin TX Hilton Garden Inn White Lodging 11/2/2010 117 Austin TX Homewood Suites Vista Host 4/14/2009 97 Beaumont TX Residence Inn Western 10/29/2008 133 Burleson/Fort Worth TX Hampton Inn & Suites LBA 10/7/2014 88 Dallas TX Hilton Hilton 5/17/2011 224 Duncanville TX Hilton Garden Inn Gateway 10/21/2008 142 El Paso TX Hilton Garden Inn Western 12/19/2011 145 El Paso TX Homewood Suites Western 3/1/2014 114 Fort Worth TX TownePlace Suites Western 7/19/2010 140 Frisco TX Hilton Garden Inn Western 12/31/2008 102 Grapevine TX Hilton Garden Inn Western 9/24/2010 110 Houston TX Marriott Western 1/8/2010 206 Houston TX Residence Inn Western 3/1/2014 129 Irving TX Homewood Suites Western 12/29/2010 77 Lewisville TX Hilton Garden Inn Gateway 10/16/2008 165 Round Rock TX Hampton Inn Vista Host 3/6/2009 94 San Antonio TX TownePlace Suites Western 3/1/2014 106 Stafford TX Homewood Suites Western 3/1/2014 78 Texarkana TX Courtyard Pillar 3/1/2014 90 Texarkana TX Hampton Inn & Suites Pillar 1/31/2011 81 Texarkana TX TownePlace Suites Pillar 3/1/2014 85 Provo UT Residence Inn Dimension 3/1/2014 114 Salt Lake City UT SpringHill Suites White Lodging 11/2/2010 143 Alexandria VA Courtyard Marriott 3/1/2014 178 Alexandria VA SpringHill Suites Marriott 3/28/2011 155 Bristol VA Courtyard LBA 11/7/2008 175 Charlottesville VA Courtyard Crestline 3/1/2014 139 Chesapeake VA Marriott Crestline 3/1/2014 226 Harrisonburg VA Courtyard Newport 3/1/2014 125 Manassas VA Residence Inn Crestline 2/16/2011 107 Richmond VA Courtyard White Lodging 12/8/2014 135 Richmond VA Marriott White Lodging 3/1/2014 410 Richmond VA Residence Inn White Lodging 12/8/2014 75 Suffolk VA Courtyard Crestline 3/1/2014 92 Suffolk VA TownePlace Suites Crestline 3/1/2014 72 Virginia Beach VA Courtyard Crestline 3/1/2014 141 Virginia Beach VA Courtyard Crestline 3/1/2014 160 Kirkland WA Courtyard Inn Ventures 3/1/2014 150 Seattle WA Residence Inn Inn Ventures 3/1/2014 234 Tukwila WA Homewood Suites Dimension 3/1/2014 106 Vancouver WA SpringHill Suites Inn Ventures 3/1/2014 119 Total 22,003
28

Related Parties
The Company has, and is expected to continue to engage in, transactions with related parties. These transactions cannot be construed to be at arm’s length and the results of the Company’s operations may be different if these transactions were conducted with non-related parties. The Company’s independent members of the Board of Directors oversee and annually review the Company’s related party relationships and are required to approve any significant modifications to the existing relationships, as well as any new significant related party transactions. The Board of Directors is not required to approve each individual transaction that falls under the related party relationships. However, under the direction of the Board of Directors, at least one member of the Company’s senior management team approves each related party transaction.
See Note 7 titled Related Parties in the Company’s Unaudited Consolidated Financial Statements and Notes thereto, appearing elsewhere in this Quarterly Report on Form 10-Q for additional information concerning the Company’s related party transactions. Liquidity and Capital Resources
Capital Resources
Credit Facilities
After completion of the A7 and A8 mergers, on March 3, 2014, the Company entered into a $345 million unsecured credit facility (comprised of a $245 million revolving credit facility and a $100 million term loan). The $345 million credit facility is available for working capital, hotel acquisitions, hotel renovations and development and other general corporate purposes, including the funding of share repurchases and payment of distributions. The $345 million credit facility may be increased to $700 million, subject to certain conditions. The $245 million revolving credit facility matures in March 2018; however, the Company has the right, upon satisfaction of certain conditions, including covenant compliance and payment of an extension fee, to extend the maturity date to March 2019. The $100 million term loan matures in March 2019. Interest payments on the $345 million credit facility are due monthly and the interest rate, subject to certain exceptions, is equal to the one-month LIBOR (the London Inter-Bank Offered Rate for a one-month term) plus a margin ranging from 1.55% to 2.35%, depending upon the Company’s leverage ratio, as calculated under the terms of the credit agreement. In conjunction with the $100 million term loan, the Company entered into an interest rate swap agreement for the same notional amount and maturity as the term loan. The interest rate swap agreement effectively provides the Company with payment requirements equal to a fixed interest rate on the term loan through the maturity of the loan in March 2019. As of March 31, 2015, the credit facility had an outstanding principal balance of $100 million, which consisted only of the $100 million term loan with an effective annual fixed interest rate of approximately 3.13%.
The $345 million credit facility contains customary affirmative covenants, negative covenants and events of defaults. It also contains covenants restricting the level of certain investments and quarterly financial covenants which include, among others, a minimum tangible net worth, maximum debt limits, minimum interest and fixed charge coverage ratios and maximum dividend payout ratio. The Company was in compliance with the applicable covenants at March 31, 2015.
In April 2015, the Company announced that the Board of Directors had approved plans to list its common shares on the New York Stock Exchange. The Board of Directors also approved, in connection with a listing, the implementation by the Company of a modified “Dutch Auction” tender offer for up to $200 million of the Company’s common shares. Additionally, the Board approved a $500 million share buyback program to be implemented as appropriate subsequent to the completion of the tender offer. To increase the available funds to support these plans should they occur, the Company intends to enter into an amended and restated credit facility with increased capacity. Although there can be no assurance that the Company will enter into a new credit facility or that the terms will be consistent with the Company’s current credit facility, it has received non-binding commitments for up to $965 million under a new credit facility with terms consistent with the Company’s current credit facility. Borrowings under the new credit facility are expected to be used for other corporate purposes including acquisitions should it close and not be needed for purposes of the anticipated tender offer or if the share buyback program is not implemented.
Index
29

Capital Uses
The Company’s principal sources of liquidity are cash on hand, the operating cash flow generated from the Company’s properties and its $345 million credit
facility. The Company anticipates that cash on hand, cash flow from operations and availability under its existing revolving credit facility will be adequate to meet its anticipated liquidity requirements, including debt service, hotel acquisitions, hotel renovations and development, and required distributions to shareholders (the Company is not required to make distributions at its current rate for REIT purposes). As discussed above, if the Company commences a tender offer or implements a share buyback program, it expects to enter into a new credit facility which will be used to fund the repurchases of common shares.
Distributions
To maintain its REIT status, the Company is required to distribute at least 90% of its ordinary income. Distributions during the three months ended March 31, 2015 totaled approximately $63.4 million and were paid at a monthly rate of $0.056667 per common share. For the same period the Company’s net cash generated from operations was approximately $36.3 million. This shortfall includes a return of capital and was funded in part by borrowings on the Company’s credit facility.
The Company’s current annual distribution rate, payable monthly is $0.68 per common share. As contemplated by the A7 and A8 mergers, the Board of Directors reduced the annual distribution rate from $0.83025 per common share to $0.66 per common share, effective with the March 2014 distribution. Effective with the September 2014 distribution, the Board of Directors increased the annual distribution rate from $0.66 per common share to $0.68 per common share. As it has done historically, the Company may use its credit facility to maintain the consistency of the monthly distribution rate, taking into consideration any acquisitions, dispositions, capital improvements and economic cycles. Any distribution will be subject to approval of the Company’s Board of Directors and there can be no assurance of the classification or duration of distributions at the current annual distribution rate. The Board of Directors monitors the Company’s distribution rate relative to the performance of the hotels on an ongoing basis and may make adjustments to the distribution rate as determined to be prudent in relation to other cash requirements of the Company. If cash flow from operations and the credit facility are not adequate to meet liquidity requirements, the Company will attempt if necessary to utilize additional financing or offering proceeds to achieve this objective. Although the Company has relatively low levels of debt, there can be no assurances it will be successful with this strategy and may need to reduce its distributions to required levels. If the Company were unable to extend its maturing debt in future periods or if it were to default on its debt, it may be unable to make distributions.
Share Redemption Program
In October 2014, the Board of Directors approved reinstating the Company’s share redemption program on a limited basis. The Board of Directors initially approved limiting redemptions of common shares only in the event of death or eligible disability of a shareholder, and in February 2015, the Board of Directors approved limiting redemptions to death of a shareholder only. The number of common shares that may be redeemed in any given year is also limited based on the Company’s results of operations, cash flow from operations, and cash required for funding investing and financing activities. If requested redemptions exceed funds available for redemption, redemptions will be made on a pro rata basis. During the three months ended March 31, 2015, the Company redeemed approximately 1.2 million common shares at a price of $9.20 per common share, or a total of approximately $10.8 million. All eligible redemption requests were fulfilled. No common shares were redeemed under the program during 2014.
Capital Improvements
The Company has ongoing capital commitments to fund its capital improvements. The Company is required, under all of the hotel management agreements and certain loan agreements, to make available, for the repair, replacement and refurbishing of furniture, fixtures, and equipment, a percentage of gross revenues provided that such amount may be used for the Company’s capital expenditures with respect to the hotels. As of March 31, 2015, the Company held $23.7 million in reserves for capital expenditures. During the three months ended March 31, 2015, the Company invested approximately $12.4 million in capital expenditures and anticipates spending an additional $40 to $50 million during the remainder of 2015. The Company does not currently have any existing or planned projects for development.
Index
30

Cash Management Activities
As part of the cost sharing arrangements discussed in Note 7 titled Related Parties in the Company’s Unaudited Consolidated Financial Statements and Notes
thereto, appearing elsewhere in this Quarterly Report on Form 10-Q, certain day-to-day transactions may result in amounts due to or from the Company, Apple Ten, A10A and ASRG. To efficiently manage cash disbursements, the Company, Apple Ten, A10A or ASRG may make payments for any or all of the related companies. Under the cash management process, each of the companies may advance or defer up to $1 million at any time. Each month, any outstanding amounts are settled among the affected companies. This process allows each company to minimize its cash on hand, which, in turn, reduces the cost of each company’s credit facility. The amounts outstanding at any point in time are not significant to any of the companies. Impact of Inflation
Operators of hotels, in general, possess the ability to adjust room rates daily to reflect the effects of inflation. Competitive pressures may, however, limit the operators’ ability to raise room rates. Currently the Company is not experiencing any material impact from inflation. Business Interruption
Being in the real estate industry, the Company is exposed to natural disasters on both a local and national scale. Although management believes there is adequate insurance to cover this exposure, there can be no assurance that such events will not have a material adverse effect on the Company’s financial position or results of operations. Seasonality
The hotel industry historically has been seasonal in nature. Seasonal variations in occupancy at the Company’s hotels may cause quarterly fluctuations in its revenues. Generally, occupancy rates and hotel revenues are greater in the second and third quarters than in the first and fourth quarters. To the extent that cash flow from operations is insufficient during any quarter, due to temporary or seasonal fluctuations in revenue, the Company expects to utilize cash on hand or available financing sources to make distributions. Recent Accounting Standards
In April 2015, the Financial Accounting Standards Board issued Accounting Standards Update No. 2015-03, Simplifying the Presentation of Debt Issuance Costs, which requires debt issuance costs to be presented in the balance sheet as a direct deduction from the associated debt. The standard is effective for annual reporting periods beginning after December 15, 2015, and interim periods within those years, with early adoption permitted. The standard will be applied on a retrospective basis. The adoption of this standard is not expected to have a material impact on the Company’s consolidated financial statements. Subsequent Events
In April 2015, the Company declared and paid approximately $21.1 million, or $0.056667 per outstanding common share, in distributions to its common shareholders.
In April 2015, under the Company’s limited share redemption program, the Company redeemed approximately 0.4 million common shares in the amount of $4.1 million. Redemptions were limited to death of a shareholder and were made at a price of $9.20 per common share. All eligible redemption requests were fulfilled. Following this redemption, the Board of Directors approved the termination of the limited share redemption program. No additional redemptions will be made under this program.
In April 2015, the Board of Directors approved the termination of the Company’s suspended Dividend Reinvestment Plan, which had been suspended since June 2013.
Index
31

In April 2015, the Company announced its intention to list the Company’s common shares on the New York Stock Exchange on or about May 18, 2015. Should
a listing occur, the Board of Directors has authorized a reduction of the annual distribution rate from $0.68 per common share to $0.60 per common share (on a pre-reverse split basis) effective with the June 2015 distribution. The Company intends to continue to pay distributions on a monthly basis.
Subsequent to March 31, 2015, the Company entered into a series of contracts for the potential purchase of five hotels. Although the Company is working towards acquiring these hotels, there are many conditions to closing that have not yet been satisfied and there can be no assurance that a closing on these hotels will occur under the outstanding purchase contracts. The following table summarizes the hotel and contract information. All dollar amounts are in thousands.
Index
Location
Brand
Date of Purchase Contract Rooms
Gross Purchase Price
Initial Refundable
Deposit Hartford, CT (a) Homewood Suites 4/23/2015 116 $ 18,500 $ 500 Burbank, CA (b) SpringHill Suites 4/23/2015 170 60,000 100 Atlanta, GA (b) Home2 Suites 5/5/2015 128 24,600 100 Cypress, CA Hampton Inn 5/5/2015 110 19,800 500 Fort Lauderdale, FL Hampton Inn 5/5/2015 156 23,000 500 680 $ 145,900 $ 1,700
(a) The purchase contract for this hotel requires the Company to assume approximately $13.4 million in mortgage debt. This loan provides for monthly payments of principal and interest on an amortized basis.
(b) These hotels are currently under development. The table shows the expected number of rooms upon hotel completion and the expected franchise.
32
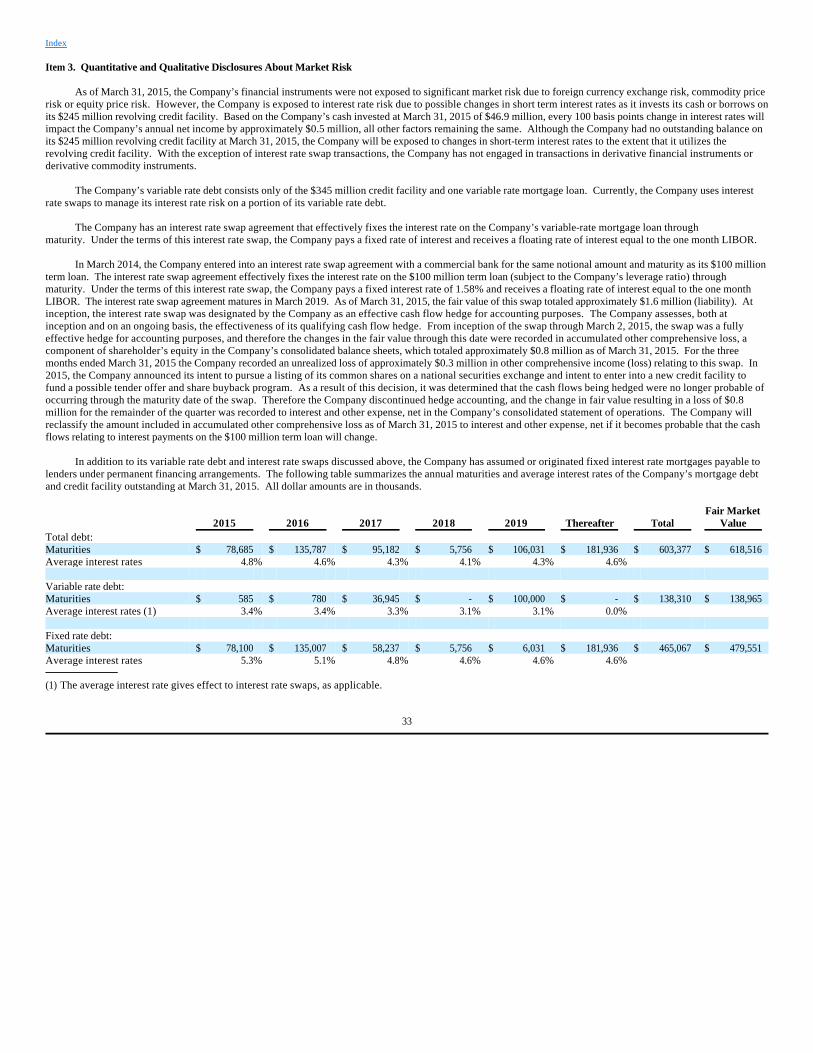
Item 3. Quantitative and Qualitative Disclosures About Market Risk
As of March 31, 2015, the Company’s financial instruments were not exposed to significant market risk due to foreign currency exchange risk, commodity price risk or equity price risk. However, the Company is exposed to interest rate risk due to possible changes in short term interest rates as it invests its cash or borrows on its $245 million revolving credit facility. Based on the Company’s cash invested at March 31, 2015 of $46.9 million, every 100 basis points change in interest rates will impact the Company’s annual net income by approximately $0.5 million, all other factors remaining the same. Although the Company had no outstanding balance on its $245 million revolving credit facility at March 31, 2015, the Company will be exposed to changes in short-term interest rates to the extent that it utilizes the revolving credit facility. With the exception of interest rate swap transactions, the Company has not engaged in transactions in derivative financial instruments or derivative commodity instruments.
The Company’s variable rate debt consists only of the $345 million credit facility and one variable rate mortgage loan. Currently, the Company uses interest rate swaps to manage its interest rate risk on a portion of its variable rate debt.
The Company has an interest rate swap agreement that effectively fixes the interest rate on the Company’s variable-rate mortgage loan through maturity. Under the terms of this interest rate swap, the Company pays a fixed rate of interest and receives a floating rate of interest equal to the one month LIBOR.
In March 2014, the Company entered into an interest rate swap agreement with a commercial bank for the same notional amount and maturity as its $100 million term loan. The interest rate swap agreement effectively fixes the interest rate on the $100 million term loan (subject to the Company’s leverage ratio) through maturity. Under the terms of this interest rate swap, the Company pays a fixed interest rate of 1.58% and receives a floating rate of interest equal to the one month LIBOR. The interest rate swap agreement matures in March 2019. As of March 31, 2015, the fair value of this swap totaled approximately $1.6 million (liability). At inception, the interest rate swap was designated by the Company as an effective cash flow hedge for accounting purposes. The Company assesses, both at inception and on an ongoing basis, the effectiveness of its qualifying cash flow hedge. From inception of the swap through March 2, 2015, the swap was a fully effective hedge for accounting purposes, and therefore the changes in the fair value through this date were recorded in accumulated other comprehensive loss, a component of shareholder’s equity in the Company’s consolidated balance sheets, which totaled approximately $0.8 million as of March 31, 2015. For the three months ended March 31, 2015 the Company recorded an unrealized loss of approximately $0.3 million in other comprehensive income (loss) relating to this swap. In 2015, the Company announced its intent to pursue a listing of its common shares on a national securities exchange and intent to enter into a new credit facility to fund a possible tender offer and share buyback program. As a result of this decision, it was determined that the cash flows being hedged were no longer probable of occurring through the maturity date of the swap. Therefore the Company discontinued hedge accounting, and the change in fair value resulting in a loss of $0.8 million for the remainder of the quarter was recorded to interest and other expense, net in the Company’s consolidated statement of operations. The Company will reclassify the amount included in accumulated other comprehensive loss as of March 31, 2015 to interest and other expense, net if it becomes probable that the cash flows relating to interest payments on the $100 million term loan will change.
In addition to its variable rate debt and interest rate swaps discussed above, the Company has assumed or originated fixed interest rate mortgages payable to lenders under permanent financing arrangements. The following table summarizes the annual maturities and average interest rates of the Company’s mortgage debt and credit facility outstanding at March 31, 2015. All dollar amounts are in thousands.
Index
2015 2016 2017 2018 2019 Thereafter Total Fair Market
Value Total debt: Maturities $ 78,685 $ 135,787 $ 95,182 $ 5,756 $ 106,031 $ 181,936 $ 603,377 $ 618,516 Average interest rates 4.8% 4.6% 4.3% 4.1% 4.3% 4.6% Variable rate debt: Maturities $ 585 $ 780 $ 36,945 $ - $ 100,000 $ - $ 138,310 $ 138,965 Average interest rates (1) 3.4% 3.4% 3.3% 3.1% 3.1% 0.0% Fixed rate debt: Maturities $ 78,100 $ 135,007 $ 58,237 $ 5,756 $ 6,031 $ 181,936 $ 465,067 $ 479,551 Average interest rates 5.3% 5.1% 4.8% 4.6% 4.6% 4.6%
(1) The average interest rate gives effect to interest rate swaps, as applicable.
33

Item 4. Controls and Procedures
Senior management, including the Chief Executive Officer and Chief Financial Officer, evaluated the effectiveness of the Company’s disclosure controls and procedures as of the end of the period covered by this report. Based on this evaluation process, the Chief Executive Officer and Chief Financial Officer have concluded that the Company’s disclosure controls and procedures were effective as of March 31, 2015. There have been no changes in the Company’s internal control over financial reporting that occurred during the last fiscal quarter that have materially affected, or are reasonably likely to materially affect, the Company’s internal control over financial reporting.
Index
34
PART II. OTHER INFORMATION Item 1. Legal Proceedings
In re Apple REITs Litigation
As previously disclosed in the Company’s Annual Report on Form 10-K for the year ended December 31, 2014, the Company, Apple Suites Realty Group, Inc., Apple Eight Advisors, Inc., Apple Nine Advisors, Inc., Apple Ten Advisors, Inc., Apple Fund Management, LLC, Apple REIT Six, Inc., Apple REIT Seven, Inc., Apple REIT Eight, Inc. and Apple REIT Ten, Inc., their directors and certain officers, and David Lerner Associates, Inc. and David Lerner were parties to a consolidated matter called In re Apple REITs Litigation, Civil Action No. 1:11-cv-02919-KAM-JO. On March 25, 2015, United States District Judge Kiyo A. Matsumoto entered a Memorandum and Order dismissing all remaining claims in this matter and judgment was entered in favor of the defendants, including the Company. The time for appeal on this matter has passed.
DCG&T et al. v. Knight, et al.
As previously disclosed in the Company’s Annual Report on Form 10-K for the year ended December 31, 2014, on January 31, 2014, two shareholders of the Company commenced a purported class action against the Company and its directors (the “Defendants”) in the United States District Court for the Eastern District of Virginia (DCG&T, et al. v. Knight, et al., No. 3:14cv67, E.D. Va.).
On December 18, 2014, the United States District Court for the Eastern District of Virginia issued an order granting the Defendants’ motion to dismiss in part and denying it in part. Specifically, the court dismissed each of Plaintiffs’ class action claims, but held that Plaintiffs could bring derivative claims for breach of fiduciary duties of care and loyalty (Count II) and for conflicts of interest (Count IV). On April 1, 2015, the Court entered an agreed stipulation of dismissal, dismissing with prejudice Count IV.
Discovery in the case is proceeding. A bench trial is scheduled to begin July 13, 2015.
The Company believes that Plaintiffs’ claims are without merit and intends to defend this case vigorously. At this time, the Company cannot reasonably predict the outcome of these proceedings or provide a reasonable estimate of the possible loss or range of loss due to these proceedings, if any.
Moses, et al. v. Apple Hospitality REIT, Inc., et al.
As previously disclosed in the Company’s Annual Report on Form 10-K for the year ended December 31, 2014, on April 22, 2014, Plaintiff Susan Moses, purportedly a shareholder of Apple REIT Seven, Inc. and Apple REIT Eight, Inc., now part of the Company, filed a class action against the Company and several individual directors on behalf of all then-existing shareholders and former shareholders of Apple REIT Seven, Inc. and Apple REIT Eight, Inc., now part of the Company, who purchased additional shares under the Apple REITs’ Dividend Reinvestment Plans between July 17, 2007 and February 12, 2014 (Susan Moses, et al. v. Apple Hospitality REIT, Inc., et al., 14-CV-3131 (DLI)(SMG)).
On March 9, 2015, the Court entered a Memorandum and Order dismissing all claims. On April 6, 2015, Plaintiff filed a Second Amended Class Action Complaint asserting a breach of contract claim. Defendants moved to dismiss the Second Amended Complaint on April 29, 2015.
The Company believes that Plaintiff’s claims are without merit and intends to defend this case vigorously. At this time, the Company cannot reasonably predict the outcome of these proceedings or provide a reasonable estimate of the possible loss or range of loss due to these proceedings, if any.
Index
35

Wenzel v. Knight et al.
As previously disclosed in the Company’s Annual Report on Form 10-K for the year ended December 31, 2014, on June 16, 2014, Plaintiff Dorothy Wenzel,
purportedly a shareholder of Apple REIT Seven, Inc. and Apple REIT Eight, Inc., now part of the Company, filed a class action against Apple Seven Advisors, Inc., Apple Eight Advisors, Inc., Apple Fund Management, LLC and several officers and directors of the Company on behalf of all then-existing shareholders and former shareholders of Apple REIT Seven, Inc. and Apple REIT Eight, Inc., now part of the Company, who purchased additional shares under the Apple REITs' Dividend Reinvestment Plans between July 17, 2007 and June 30, 2013 (Wenzel v. Knight, et al., Case No. 3:14-cv-00432, E.D. Va.). On February 4, 2015, Plaintiff filed an amended complaint against the Company, Apple Eight Advisors, Inc., Apple Fund Management, LLC, and several officers and directors of the Company alleging breach of contract, tortious interference with contract, fraud, negligence and violation of the Virginia Securities Act. Defendants’ Motion to Dismiss all claims is fully briefed and the case is stayed pending the Court’s ruling on the Motion.
The Company believes that Plaintiff's claims are without merit and intends to defend this case vigorously. At this time, the Company cannot reasonably predict the outcome of these proceedings or provide a reasonable estimate of the possible loss or range of loss due to these proceedings, if any. Item 1A. Risk Factors
You should carefully consider the risk factors discussed below and contained in the Company’s Annual Report on Form 10-K for the year ended December 31, 2014 before making an investment decision regarding the Company. The risks and uncertainties described herein and in the Annual Report on Form 10-K for the year ended December 31, 2014 are not the only ones facing the Company and there may be additional risks that the Company does not presently know of or that it currently considers not likely to have a significant impact. All of these risks could adversely affect the Company’s business, financial condition, results of operations and cash flows. In addition to the risks identified in the Company’s Annual Report on Form 10-K for the year ended December 31, 2014, the Company is also subject to the following additional risks:
If the Company’s common shares are listed on the New York Stock Exchange, the market price of its common shares may fluctuate widely and there can be no assurance that the market for the common shares will provide shareholders with adequate liquidity.
There is currently no material public market for the Company’s common shares, however, the Company is pursuing a listing of its common shares on the New York Stock Exchange (the “NYSE”), which it expects to be effective on or about May 18, 2015. If the Company’s commons shares are listed on the NYSE, the market price of its common shares may fluctuate widely, depending on many factors, some of which may be beyond the Company’s control, including:
Index
• actual or anticipated differences in the Company’s operating results, liquidity, or financial condition; • changes in revenues, funds from operations (“FFO”), modified FFO, earnings before interest, income taxes, depreciation and amortization (“EBITDA”),
adjusted EBITDA or earnings estimates; • publication of research reports about the Company, its hotels or the lodging or overall real estate industry; • failure to meet analysts’ revenue or earnings estimates; • the extent of institutional investor interest in the Company; • the reputation of Real Estate Investment Trusts (“REITs”) and real estate investments generally and the attractiveness of REIT equity securities in
comparison to other equity securities, including securities issued by other real estate companies, and fixed income securities;
36

Stock markets in general have experienced volatility that has often been unrelated to the operating performance of a particular company. These broad market
fluctuations may adversely affect the trading price of the Company’s common shares.
Following listing on the NYSE, significant sales of the Company’s common shares, or the perception that significant sales of such shares could occur, may cause the price of the common shares to decline significantly.
A large volume of sales of the Company’s common shares could decrease the market price of the Company’s common shares and could impair the Company’s ability to raise additional capital through the sale of equity securities in the future. Even if a substantial number of sales of common shares are not affected, the mere perception of the possibility of these sales could depress the market price of the Company’s common shares and have a negative effect on the Company’s ability to raise capital in the future. In addition, anticipated downward pressure on the price of the Company’s common shares due to actual or anticipated sales of common shares from this market overhang could cause some institutions or individuals to engage in short sales of the common shares, which may itself cause the price of the common shares to decline.
The Company’s common shares may experience low trading volumes and higher trading price volatility due to the composition of the shareholder base in the months following the initial listing on the NYSE.
The Company is currently a non-publicly-traded REIT held almost exclusively by non-institutional shareholders. Assuming the Company’s common shares are listed on the NYSE, in the months after listing, a significant portion of the Company’s common shares will continue to be held by such non-institutional shareholders. Non-institutional shareholders may not trade with the frequency and predictability of institutional shareholders, which may result in low liquidity and trading price volatility.
Increases in market interest rates may reduce demand for the Company’s common shares and result in a decline in the market price of the Company’s common shares.
The market price of the Company’s common shares following listing on the NYSE may be influenced by the distribution yield on its common shares (i.e., the amount of the Company’s annual distributions as a percentage of the market price of its common shares) relative to market interest rates. An increase in market interest rates, which are currently low compared to historical levels, may lead prospective purchasers of the Company’s common shares to expect a higher distribution yield, which the Company may not be able, or may choose not, to provide. Thus, higher market interest rates could cause the market price of the Company’s common shares to decline.
Index
• additions and departures of key personnel; • the performance and market valuations of other similar companies; • strategic actions by the Company or its competitors, such as acquisitions or dispositions; • fluctuations in the stock price and operating results of the Company’s competitors; • the passage of legislation or other regulatory developments that may adversely affect the Company or its industry; • the realization of any of the other risk factors presented in the Company’s Annual Report on Form 10-K for the year ended December 31, 2014; • speculation in the press or investment community; • changes in accounting principles; • terrorist acts; and • general market and economic conditions, including factors unrelated to the Company’s operating performance.
37

Item 2. Unregistered Sales of Equity Securities and Use Of Proceeds Share Redemption Program
In October 2014, the Board of Directors approved reinstating the Company’s share redemption program on a limited basis. The Board of Directors initially approved limiting redemptions of common shares only in the event of death or eligible disability of a shareholder, and in February 2015, the Board of Directors approved limiting redemptions to death of a shareholder only. The number of common shares that may be redeemed in any given year is also limited based on the Company’s results of operations, cash flow from operations, and cash required for funding investing and financing activities. If requested redemptions exceed funds available for redemption, redemptions will be made on a pro rata basis. During the three months ended March 31, 2015, the Company redeemed approximately 1.2 million common shares at a price of $9.20 per common share, or a total of approximately $10.8 million. All eligible redemption requests were fulfilled. No common shares were redeemed under the program during 2014.
The following is a summary of redemptions during the first quarter of 2015 (no redemptions occurred in February and March of 2015).
Index
Issuer Purchases of Equity Securities (a) (b) (c) (d)
Period Total Number of
Shares Purchased Average Price Paid
per Share
Total Number of Shares Purchased as Part of Publicly Announced Plans
or Programs
Maximum Number of Shares that May Yet Be Purchased Under the Plans or
Programs January 2015 1,176,879 $ 9.20 1,176,879 (1)
(1) The maximum number of shares eligible for redemption in any 12 month period is limited to up to five percent (5.0%) of the weighted average number of shares outstanding from the beginning of the 12 month period, subject to the Company's right to change the number of shares to be redeemed. In February 2015, the Board of Directors limited redemptions to death of a shareholder only. In April 2015, the Company made additional redemptions under the share redemption program and subsequently terminated the program. No additional redemptions will be made under this program.
38
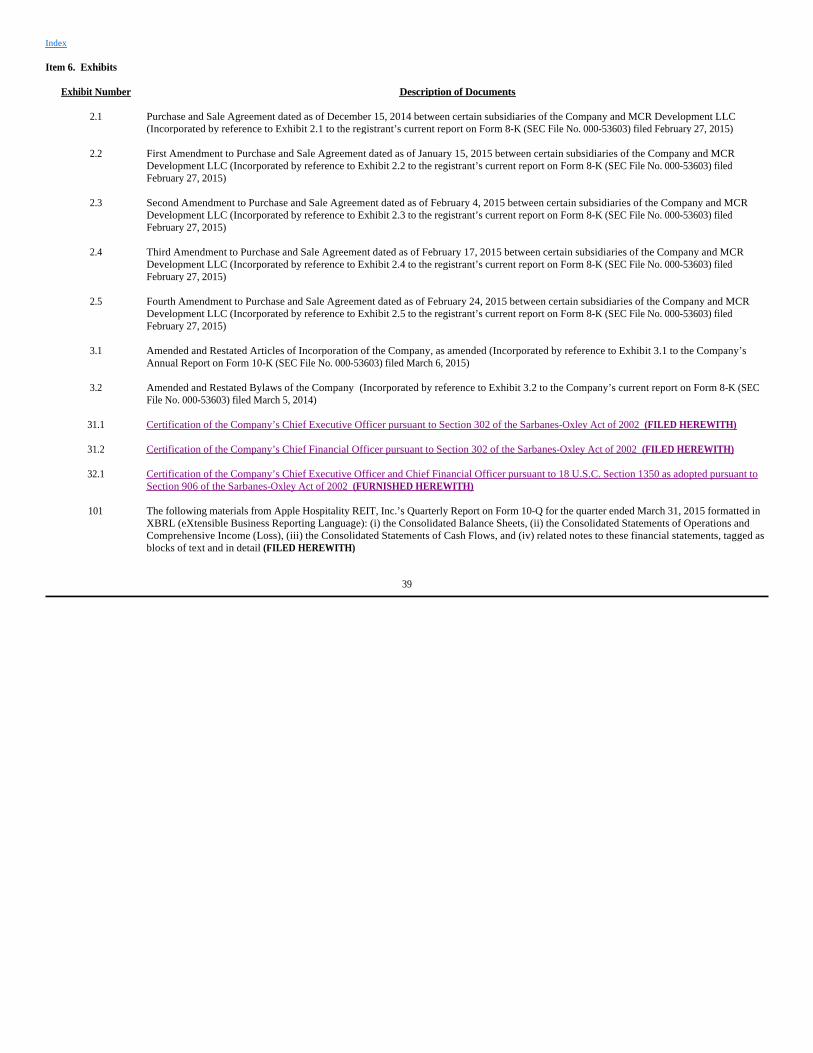
Item 6. Exhibits
Index
Exhibit Number Description of Documents
2.1 Purchase and Sale Agreement dated as of December 15, 2014 between certain subsidiaries of the Company and MCR Development LLC (Incorporated by reference to Exhibit 2.1 to the registrant’s current report on Form 8-K (SEC File No. 000-53603) filed February 27, 2015)
2.2 First Amendment to Purchase and Sale Agreement dated as of January 15, 2015 between certain subsidiaries of the Company and MCR
Development LLC (Incorporated by reference to Exhibit 2.2 to the registrant’s current report on Form 8-K (SEC File No. 000-53603) filed February 27, 2015)
2.3 Second Amendment to Purchase and Sale Agreement dated as of February 4, 2015 between certain subsidiaries of the Company and MCR
Development LLC (Incorporated by reference to Exhibit 2.3 to the registrant’s current report on Form 8-K (SEC File No. 000-53603) filed February 27, 2015)
2.4 Third Amendment to Purchase and Sale Agreement dated as of February 17, 2015 between certain subsidiaries of the Company and MCR
Development LLC (Incorporated by reference to Exhibit 2.4 to the registrant’s current report on Form 8-K (SEC File No. 000-53603) filed February 27, 2015)
2.5 Fourth Amendment to Purchase and Sale Agreement dated as of February 24, 2015 between certain subsidiaries of the Company and MCR
Development LLC (Incorporated by reference to Exhibit 2.5 to the registrant’s current report on Form 8-K (SEC File No. 000-53603) filed February 27, 2015)
3.1 Amended and Restated Articles of Incorporation of the Company, as amended (Incorporated by reference to Exhibit 3.1 to the Company’s
Annual Report on Form 10-K (SEC File No. 000-53603) filed March 6, 2015)
3.2 Amended and Restated Bylaws of the Company (Incorporated by reference to Exhibit 3.2 to the Company’s current report on Form 8-K (SEC File No. 000-53603) filed March 5, 2014)
31.1 Certification of the Company’s Chief Executive Officer pursuant to Section 302 of the Sarbanes-Oxley Act of 2002 (FILED HEREWITH)
31.2 Certification of the Company’s Chief Financial Officer pursuant to Section 302 of the Sarbanes-Oxley Act of 2002 (FILED HEREWITH)
32.1 Certification of the Company’s Chief Executive Officer and Chief Financial Officer pursuant to 18 U.S.C. Section 1350 as adopted pursuant to
Section 906 of the Sarbanes-Oxley Act of 2002 (FURNISHED HEREWITH)
101 The following materials from Apple Hospitality REIT, Inc.’s Quarterly Report on Form 10-Q for the quarter ended March 31, 2015 formatted in XBRL (eXtensible Business Reporting Language): (i) the Consolidated Balance Sheets, (ii) the Consolidated Statements of Operations and Comprehensive Income (Loss), (iii) the Consolidated Statements of Cash Flows, and (iv) related notes to these financial statements, tagged as blocks of text and in detail (FILED HEREWITH)
39
SIGNATURES
Pursuant to the requirements of Section 13 or 15(d) of the Securities Exchange Act of 1934, the registrant has duly caused this report to be signed on its behalf
by the undersigned, thereunto duly authorized.
Index
Apple Hospitality REIT, Inc. By: /s/ Justin G. Knight Date: May 7, 2015 Justin G. Knight, President and
Chief Executive Officer (Principal Executive Officer)
By: /s/ Bryan Peery Date: May 7, 2015 Bryan Peery, Chief Financial Officer
(Principal Financial and Principal Accounting Officer)
40

Exhibit 31.1
CERTIFICATION I, Justin G. Knight, certify that:
1. I have reviewed this report on Form 10-Q of Apple Hospitality REIT, Inc.; 2. Based on my knowledge, this report does not contain any untrue statement of a material fact or omit to state a material fact necessary to make the
statements made, in light of the circumstances under which such statements were made, not misleading with respect to the period covered by this report; 3. Based on my knowledge, the financial statements, and other financial information included in this report, fairly present in all material respects the financial
condition, results of operations and cash flows of the registrant as of, and for, the periods presented in this report; 4. The registrant’s other certifying officer and I are responsible for establishing and maintaining disclosure controls and procedures (as defined in Exchange
Act Rules 13a-15(e) and 15d-15(e)) and internal control over financial reporting (as defined in Exchange Act Rules 13a-15(f) and 15d-15(f)) for the registrant and have:
a) designed such disclosure controls and procedures, or caused such disclosure controls and procedures to be designed under our supervision, to ensure that material information relating to the registrant, including its consolidated subsidiaries, is made known to us by others within those entities, particularly during the period in which this report is being prepared;
b) designed such internal control over financial reporting, or caused such internal control over financial reporting to be designed under our
supervision, to provide reasonable assurance regarding the reliability of financial reporting and the preparation of financial statements for external purposes in accordance with generally accepted accounting principles;
c) evaluated the effectiveness of the registrant’s disclosure controls and procedures and presented in this report our conclusions about the
effectiveness of the disclosure controls and procedures, as of the end of the period covered by this report based on such evaluation; and d) disclosed in this report any change in the registrant’s internal control over financial reporting that occurred during the registrant’s most recent
fiscal quarter (the registrant’s fourth fiscal quarter in the case of an annual report) that has materially affected, or is reasonably likely to materially affect, the registrant’s internal control over financial reporting; and 5. The registrant’s other certifying officer and I have disclosed, based on our most recent evaluation of internal control over financial reporting, to the
registrant’s auditors and the audit committee of the registrant’s board of directors (or persons performing the equivalent functions):
a) all significant deficiencies and material weaknesses in the design or operation of internal control over financial reporting which are reasonably likely to adversely affect the registrant’s ability to record, process, summarize and report financial information; and
b) any fraud, whether or not material, that involves management or other employees who have a significant role in the registrant’s internal control
over financial reporting.
Date: May 7, 2015 /s/ Justin G. Knight
Justin G. Knight
President and Chief Executive Officer Apple Hospitality REIT, Inc.

Exhibit 31.2
CERTIFICATION I, Bryan Peery, certify that:
1. I have reviewed this report on Form 10-Q of Apple Hospitality REIT, Inc.; 2. Based on my knowledge, this report does not contain any untrue statement of a material fact or omit to state a material fact necessary to make the
statements made, in light of the circumstances under which such statements were made, not misleading with respect to the period covered by this report; 3. Based on my knowledge, the financial statements, and other financial information included in this report, fairly present in all material respects the financial
condition, results of operations and cash flows of the registrant as of, and for, the periods presented in this report; 4. The registrant’s other certifying officer and I are responsible for establishing and maintaining disclosure controls and procedures (as defined in Exchange
Act Rules 13a-15(e) and 15d-15(e)) and internal control over financial reporting (as defined in Exchange Act Rules 13a-15(f) and 15d-15(f)) for the registrant and have:
a) designed such disclosure controls and procedures, or caused such disclosure controls and procedures to be designed under our supervision, to ensure that material information relating to the registrant, including its consolidated subsidiaries, is made known to us by others within those entities, particularly during the period in which this report is being prepared;
b) designed such internal control over financial reporting, or caused such internal control over financial reporting to be designed under our
supervision, to provide reasonable assurance regarding the reliability of financial reporting and the preparation of financial statements for external purposes in accordance with generally accepted accounting principles;
c) evaluated the effectiveness of the registrant’s disclosure controls and procedures and presented in this report our conclusions about the
effectiveness of the disclosure controls and procedures, as of the end of the period covered by this report based on such evaluation; and d) disclosed in this report any change in the registrant’s internal control over financial reporting that occurred during the registrant’s most recent
fiscal quarter (the registrant’s fourth fiscal quarter in the case of an annual report) that has materially affected, or is reasonably likely to materially affect, the registrant’s internal control over financial reporting; and 5. The registrant’s other certifying officer and I have disclosed, based on our most recent evaluation of internal control over financial reporting, to the
registrant’s auditors and the audit committee of the registrant’s board of directors (or persons performing the equivalent functions):
a) all significant deficiencies and material weaknesses in the design or operation of internal control over financial reporting which are reasonably likely to adversely affect the registrant’s ability to record, process, summarize and report financial information; and
b) any fraud, whether or not material, that involves management or other employees who have a significant role in the registrant’s internal control
over financial reporting.
Date: May 7, 2015 /s/ Bryan Peery
Bryan Peery Chief Financial Officer
Apple Hospitality REIT, Inc.

Exhibit 32.1
CERTIFICATION PURSUANT TO 18 U.S.C. SECTION 1350 AS ADOPTED PURSUANT TO SECTION 906 OF THE SARBANES-OXLEY ACT OF 2002
In connection with the Quarterly Report of Apple Hospitality REIT, Inc., (the “Company”) on Form 10-Q for the quarter ending March 31, 2015 as filed with the Securities and Exchange Commission on the date hereof (the “Report”), the undersigned hereby certifies, pursuant to 18 U.S.C Section 1350, as adopted pursuant to Section 906 of the Sarbanes-Oxley Act of 2002 that: (1) the Report fully complies with the requirements of Section 13(a) or 15(d) of the Securities Exchange Act of 1934; and (2) the information contained in the Report fairly presents, in all material respects, the financial condition and results of operations of the Company as of March 31, 2015, and for the period then ended.
/s/ Justin G. Knight Justin G. Knight
President and Chief Executive Officer
/s/ Bryan Peery Bryan Peery
Chief Financial Officer May 7, 2015