4.10. D ISPLACEMENT M APPING Exploration of bump, parallax, relief and displacement mapping.

MAPPING THE GROSS POTENTIAL FOR CYCLING: a tool to support planning for cycling in starter cities
Joana Marques
Cecília Silva (coord.), Ana Dias, Tamara Bicalho
CITTA/ FEUP
Cycling Research Board2nd Annual Meeting |Delft 2019

Source: PRESTO (Dufour, 2010)
CHALLENGES
• Residual use of bikes (little critical mass)
• Car-centric societies and car-centric planning
• Limited cycling infrastructure (often leisure oriented)
• Resistance at public, political and technical levels
• Lack of research, data and planning methods specifically focused on starter cycling cities.
STARTERS
Research Project
2
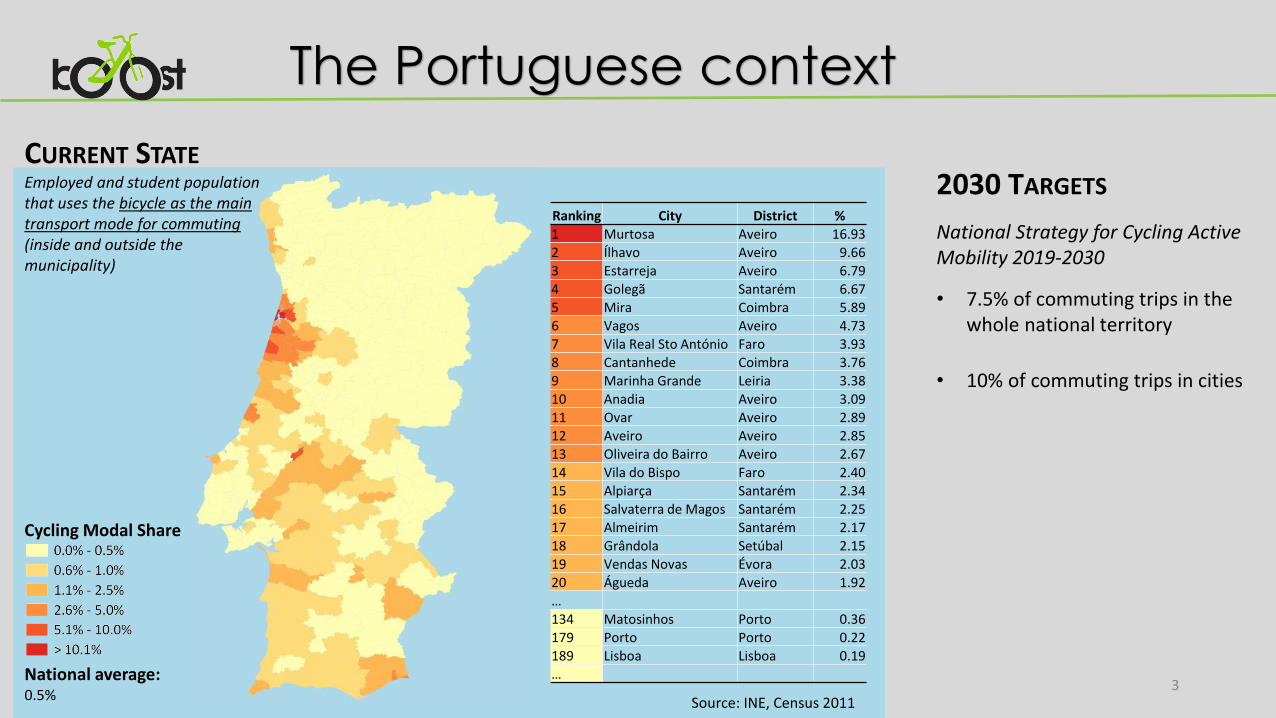
The Portuguese context
Ranking City District %1 Murtosa Aveiro 16.932 Ílhavo Aveiro 9.663 Estarreja Aveiro 6.794 Golegã Santarém 6.675 Mira Coimbra 5.896 Vagos Aveiro 4.737 Vila Real Sto António Faro 3.938 Cantanhede Coimbra 3.769 Marinha Grande Leiria 3.3810 Anadia Aveiro 3.0911 Ovar Aveiro 2.8912 Aveiro Aveiro 2.8513 Oliveira do Bairro Aveiro 2.6714 Vila do Bispo Faro 2.4015 Alpiarça Santarém 2.3416 Salvaterra de Magos Santarém 2.2517 Almeirim Santarém 2.1718 Grândola Setúbal 2.1519 Vendas Novas Évora 2.0320 Águeda Aveiro 1.92…
134 Matosinhos Porto 0.36179 Porto Porto 0.22189 Lisboa Lisboa 0.19…
2030 TARGETS
National Strategy for Cycling Active Mobility 2019-2030
• 7.5% of commuting trips in the whole national territory
• 10% of commuting trips in cities
Cycling Modal Share
National average:0.5%
CURRENT STATEEmployed and student populationthat uses the bicycle as the maintransport mode for commuting(inside and outside themunicipality)
Source: INE, Census 20113
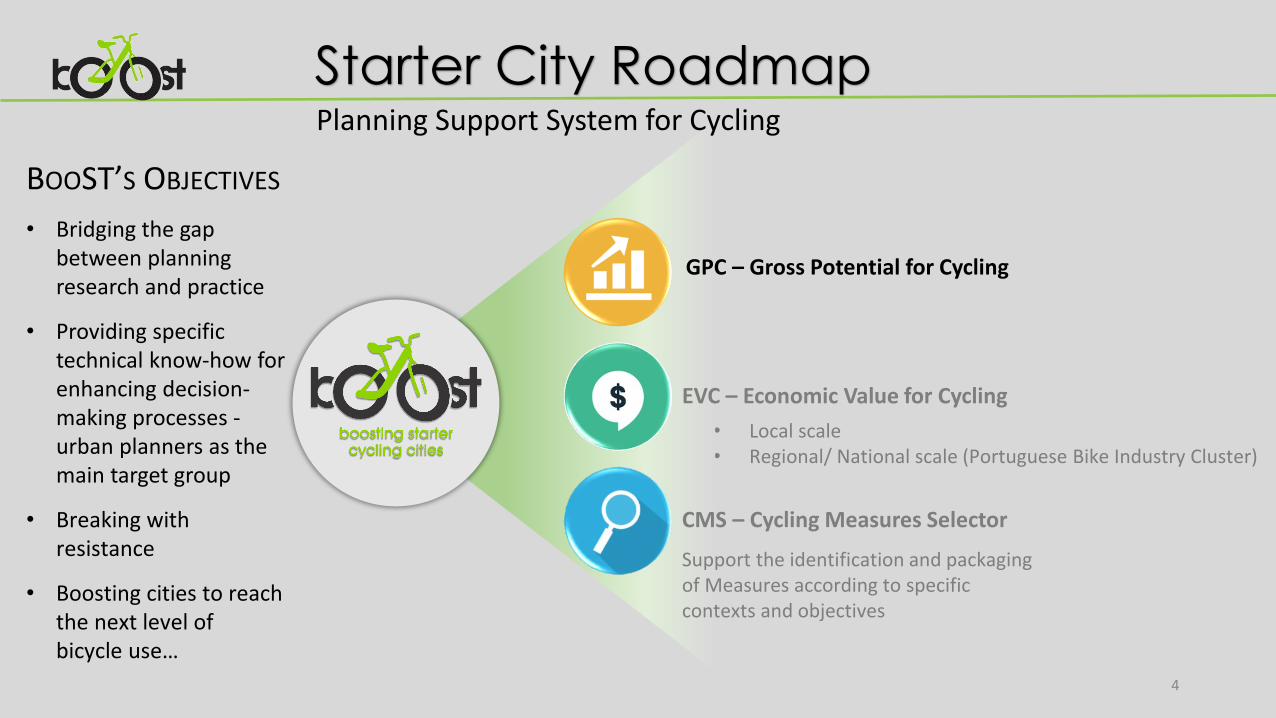
• Local scale• Regional/ National scale (Portuguese Bike Industry Cluster)
Starter City Roadmap
4
BOOST’S OBJECTIVES
• Bridging the gap between planning research and practice
• Providing specific technical know-how for enhancing decision-making processes -urban planners as the main target group
• Breaking with resistance
• Boosting cities to reach the next level of bicycle use…
GPC – Gross Potential for Cycling
EVC – Economic Value for Cycling
CMS – Cycling Measures Selector
Support the identification and packaging of Measures according to specific contexts and objectives
Planning Support System for Cycling
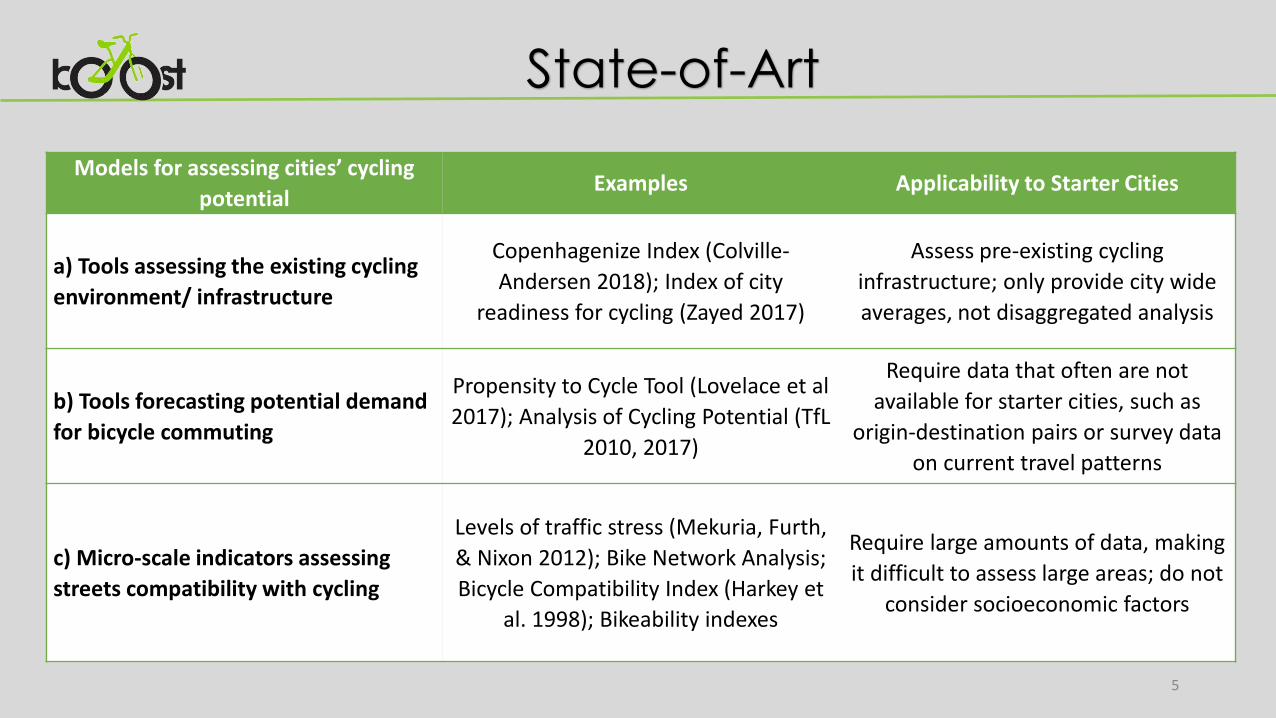
State-of-Art
5
Models for assessing cities’ cycling
potentialExamples Applicability to Starter Cities
a) Tools assessing the existing cycling
environment/ infrastructure
Copenhagenize Index (Colville-
Andersen 2018); Index of city
readiness for cycling (Zayed 2017)
Assess pre-existing cycling
infrastructure; only provide city wide
averages, not disaggregated analysis
b) Tools forecasting potential demand
for bicycle commuting
Propensity to Cycle Tool (Lovelace et al
2017); Analysis of Cycling Potential (TfL
2010, 2017)
Require data that often are not
available for starter cities, such as
origin-destination pairs or survey data
on current travel patterns
c) Micro-scale indicators assessing
streets compatibility with cycling
Levels of traffic stress (Mekuria, Furth,
& Nixon 2012); Bike Network Analysis;
Bicycle Compatibility Index (Harkey et
al. 1998); Bikeability indexes
Require large amounts of data, making
it difficult to assess large areas; do not
consider socioeconomic factors
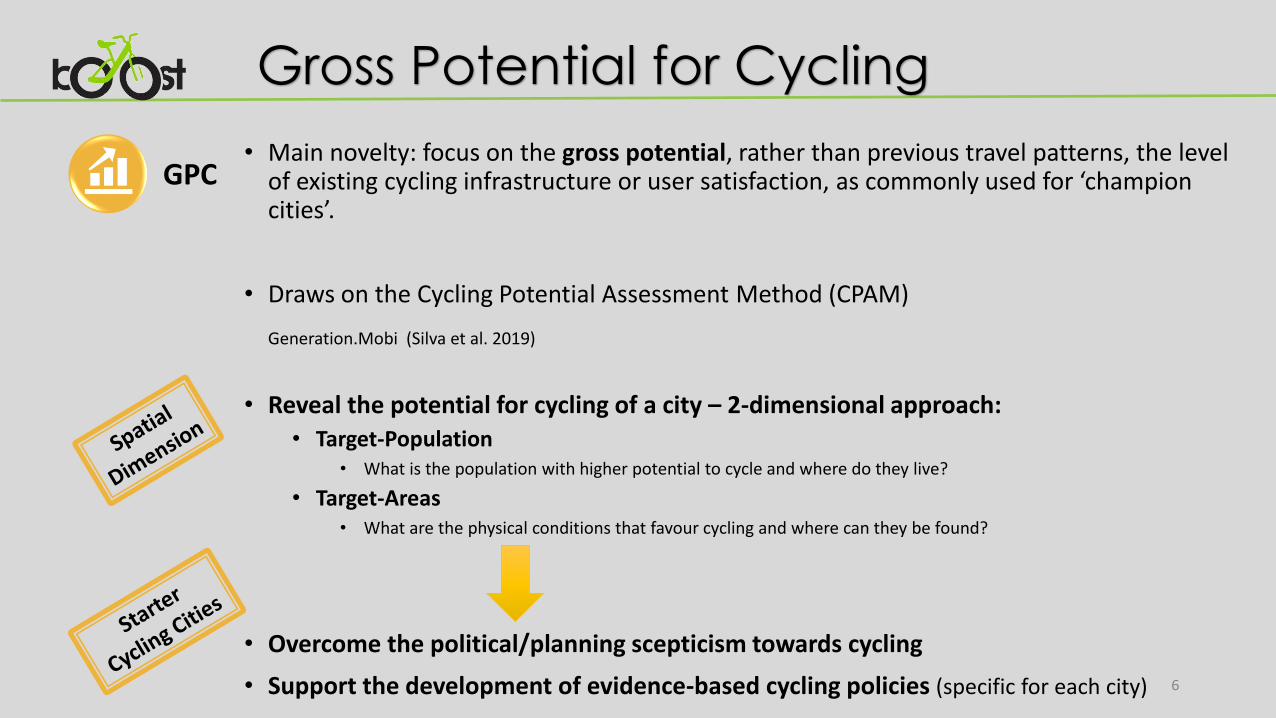
GPC• Main novelty: focus on the gross potential, rather than previous travel patterns, the level
of existing cycling infrastructure or user satisfaction, as commonly used for ‘champion cities’.
• Draws on the Cycling Potential Assessment Method (CPAM)
Generation.Mobi (Silva et al. 2019)
• Reveal the potential for cycling of a city – 2-dimensional approach:• Target-Population
• What is the population with higher potential to cycle and where do they live?
• Target-Areas• What are the physical conditions that favour cycling and where can they be found?
• Overcome the political/planning scepticism towards cycling
• Support the development of evidence-based cycling policies (specific for each city)
Gross Potential for Cycling
6
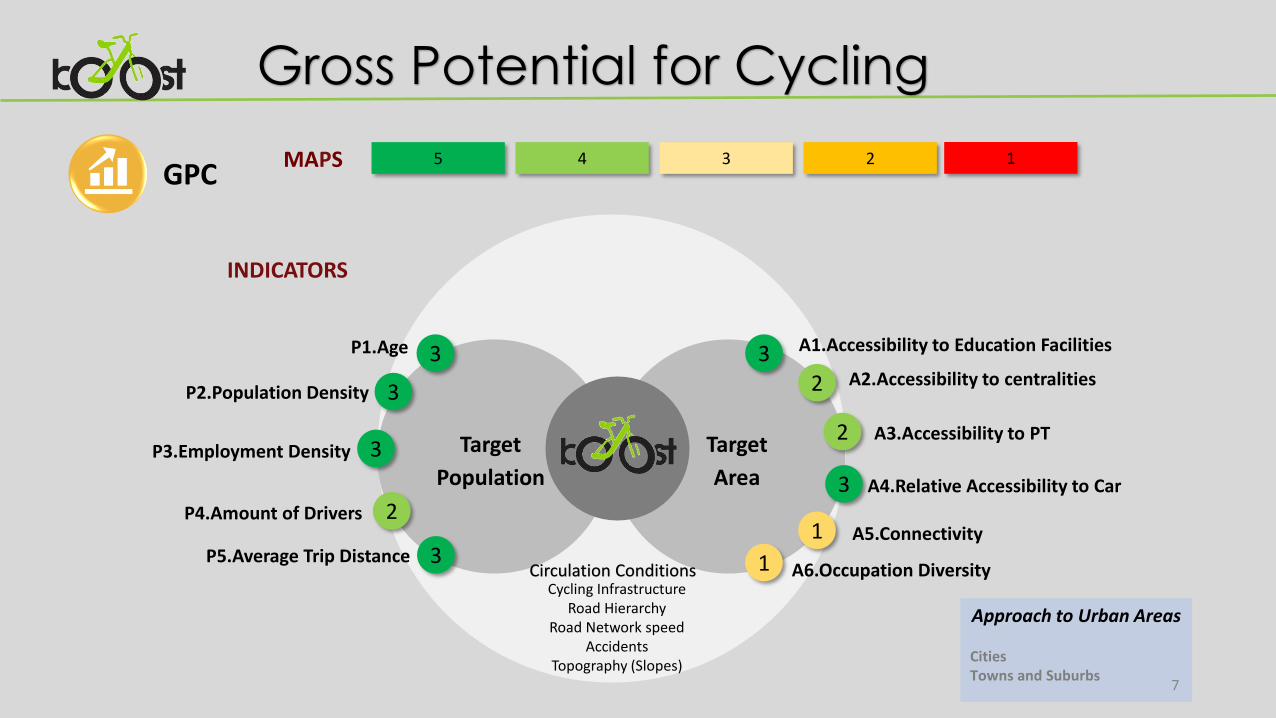
MAPS 5 4 3 2 1
INDICATORS
Gross Potential for Cycling
GPC
Approach to Urban Areas
CitiesTowns and Suburbs
7
P1.Age
P4.Amount of Drivers
3
2
P2.Population Density 3
1 A6.Occupation Diversity
3 A1.Accessibility to Education Facilities
2 A2.Accessibility to centralities
2 A3.Accessibility to PT
A4.Relative Accessibility to Car
A5.Connectivity
3
3
3P5.Average Trip Distance
Target
Population
Target
AreaP3.Employment Density
Cycling InfrastructureRoad Hierarchy
Road Network speedAccidents
Topography (Slopes)
1
Circulation Conditions

Case Study: Matosinhos
8
Source: INE, Census 2011
Transport mode Modal share (%)
Walking 16.1
Cycling 0.4
Public Transport 20.2
Private Motor Vehicle 61.9Others (taxi, company/school
collective transport) 1.4
"Half a million cars chokes Porto every day”
(JN 30 October 2019)
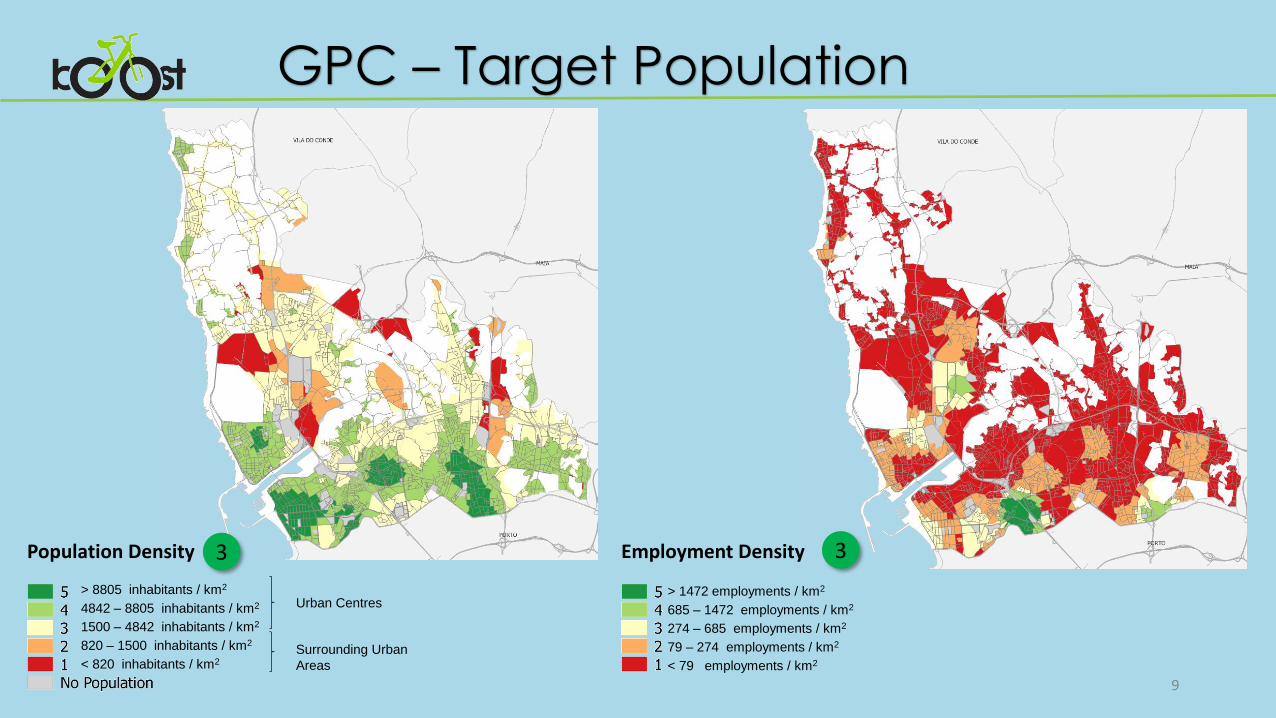
3Population Density
> 8805 inhabitants / km2
4842 – 8805 inhabitants / km2
1500 – 4842 inhabitants / km2
820 – 1500 inhabitants / km2
< 820 inhabitants / km2
Urban Centres
Surrounding Urban
Areas
GPC – Target Population
3Employment Density
> 1472 employments / km2
685 – 1472 employments / km2
274 – 685 employments / km2
79 – 274 employments / km2
< 79 employments / km2
9
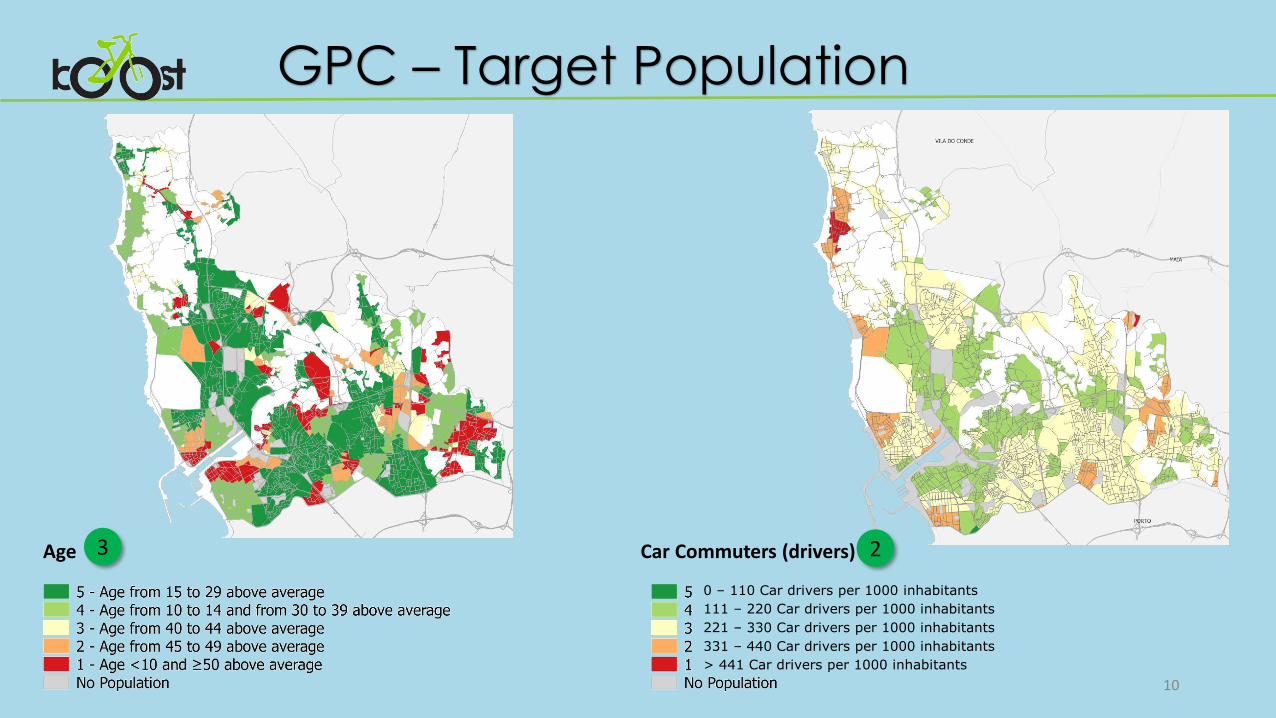
Age 3
GPC – Target Population
10
0 – 110 Car drivers per 1000 inhabitants
111 – 220 Car drivers per 1000 inhabitants
221 – 330 Car drivers per 1000 inhabitants
331 – 440 Car drivers per 1000 inhabitants
> 441 Car drivers per 1000 inhabitants
Car Commuters (drivers) 2

Accessibility to Education Facilities
Below 5 min (BE and SE) or 10 min (HE)
Between 5-10 min (BE and SE) or 10-15 min (HE)
Between 10-15 min (BE and SE) or 15-20 min (HE)
Between 15-20 min (BE), 15-25 (SE) or 20-30 min (HE)
Above 20 (BE), 25 (SE) or 30 min (HE)
GPC – Target Areas
3 2Accessibility to Centralities
Less than 5 min (SC) or 10 min (PC)
Between 5-7.5 min (SC) or 10-15 min (PC)
Between 7.5-10 min (SC) or 15-20 min (PC)
Between 10-15 min (SC) or 20-30 min (PC)
Above 15 min (SC) or 13 min (PC)
Less than 2.5 min
Between 2.5 and 5 min
Between 5 and 7.5 min
Between 7.5 min and 10 min
Above 10 min
2Accessibility to Public Transport
11

Acc by Bike 1.2x Acc by Car
Acc by Bike 1.2 – 1x Acc by Car
Acc by Bike 0.8 – 1x Acc by Car
Acc by Bike 0.4 – 0.8x Acc by Car
Acc by Bike 0.4x Acc by Car
3Relative Accessibility Car/Bicycle (5min)
GPC – Target Areas
1Occupation Diversity
All 9 types of activities in a 500 m radius
Between 7 and 8 activities in a 500 m radius
Between 4 and 6 activities in a 500 m radius
Between 1 and 3 activities in a 500 m radius
No activities in a 500 m radius
< 8.000 m2
8.001 – 20.000 m2
20.001 – 80.000 m2
80.001 – 200.000 m2
> 200.0017 m2
Connectivity(Average Block Size)
12
1
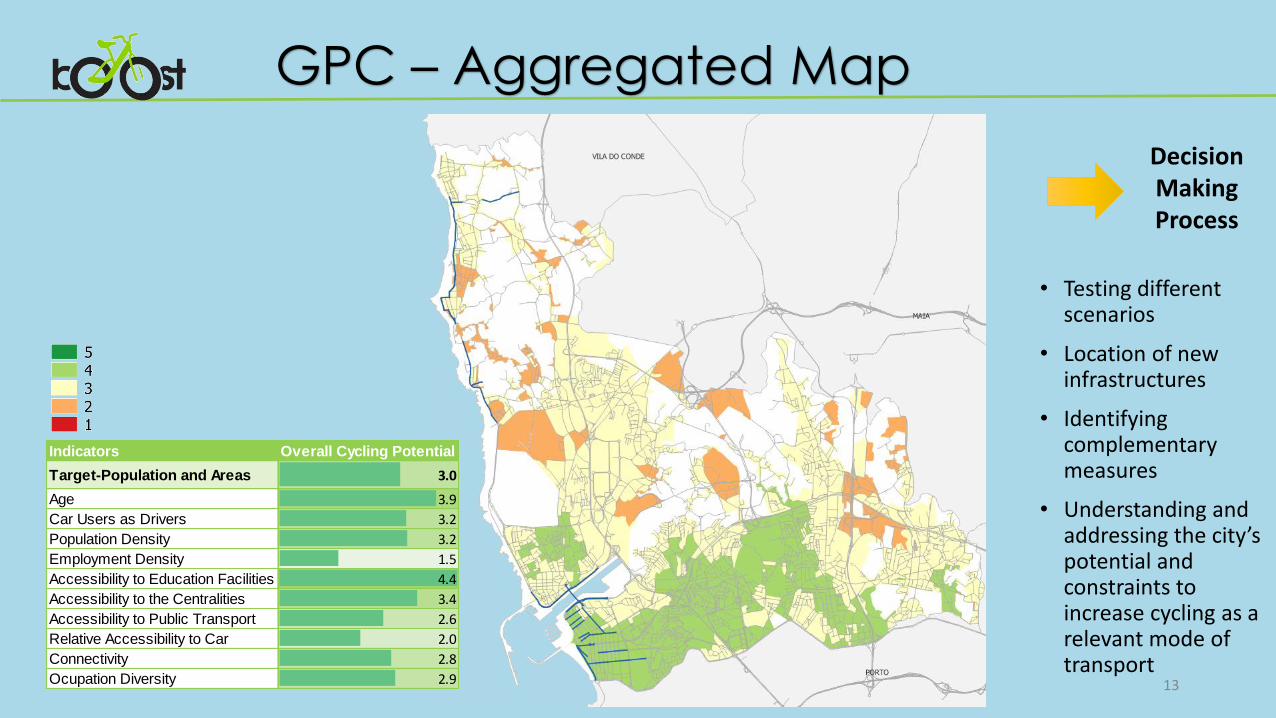
Indicators Overall Cycling Potential
Target-Population and Areas 3.0
Age 3.9
Car Users as Drivers 3.2
Population Density 3.2
Employment Density 1.5
Accessibility to Education Facilities 4.4
Accessibility to the Centralities 3.4
Accessibility to Public Transport 2.6
Relative Accessibility to Car 2.0
Connectivity 2.8
Ocupation Diversity 2.9
GPC – Aggregated Map
• Testing different scenarios
• Location of new infrastructures
• Identifying complementary measures
• Understanding and addressing the city’s potential and constraints to increase cycling as a relevant mode of transport
Decision Making Process
13
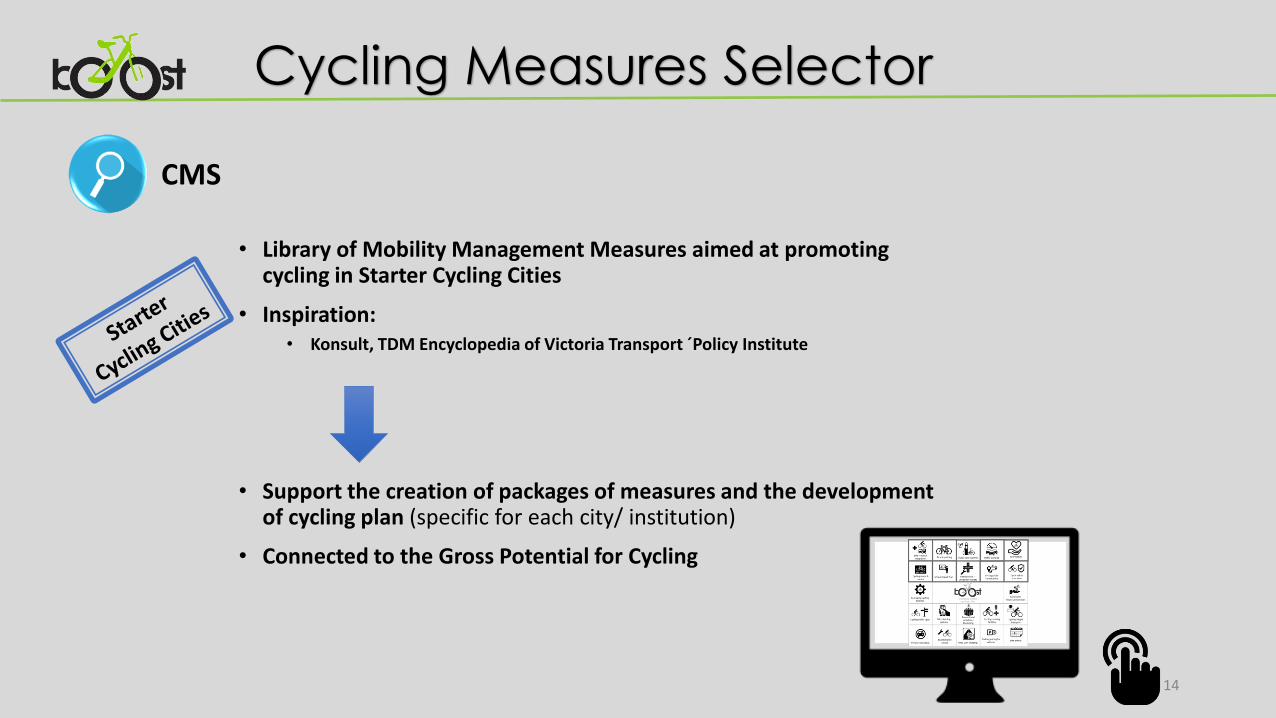
CMS
• Library of Mobility Management Measures aimed at promoting cycling in Starter Cycling Cities
• Inspiration:• Konsult, TDM Encyclopedia of Victoria Transport ´Policy Institute
• Support the creation of packages of measures and the development of cycling plan (specific for each city/ institution)
• Connected to the Gross Potential for Cycling
Cycling Measures Selector
14
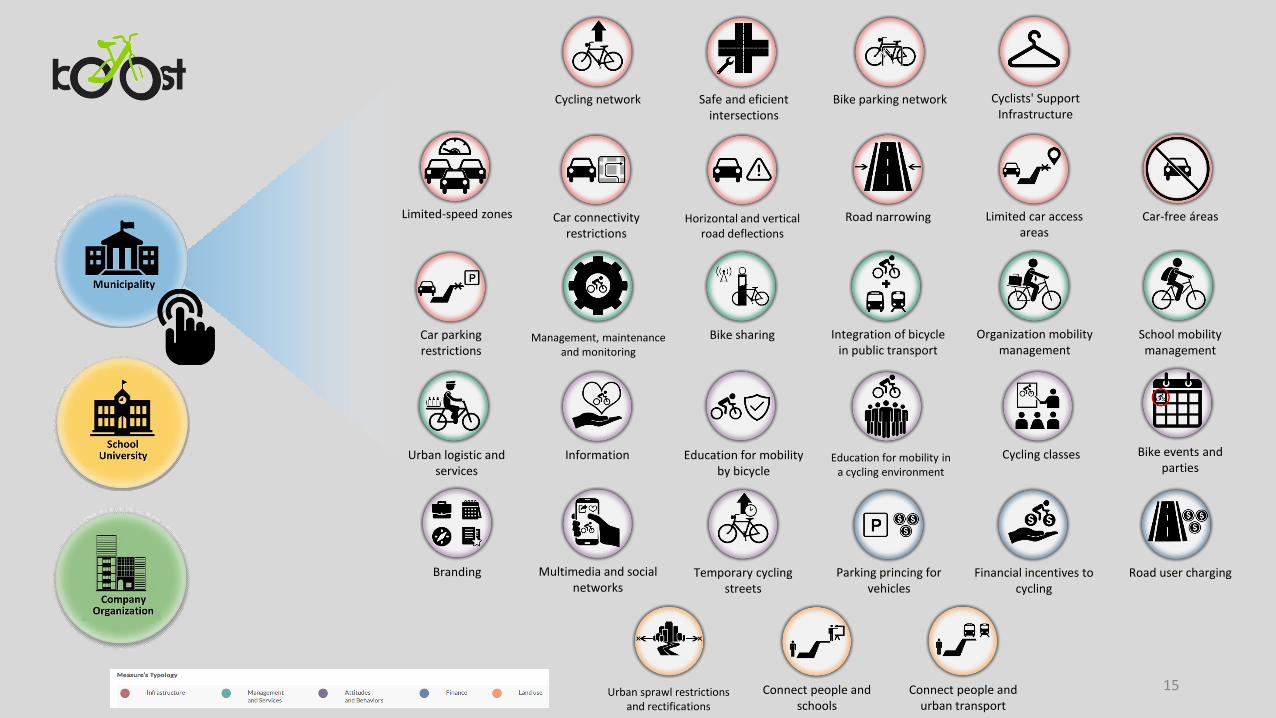
Cycling network Safe and eficientintersections
Bike parking network
Information
Management, maintenanceand monitoring
Limited-speed zones
Urban logistic and services
Bike sharing Integration of bicycle in public transport
School mobility management
Cycling classesEducation for mobility by bicycle
Education for mobility in a cycling environment
Branding
Bike events and parties
Temporary cycling streets
Multimedia and social networks
Financial incentives to cycling
Road user chargingParking princing for vehicles
Urban sprawl restrictionsand rectifications
Connect people and schools
Connect people and urban transport
Horizontal and vertical road deflections
Road narrowingCar connectivityrestrictions
Limited car access areas
Car-free áreas
Car parking restrictions
Cyclists' SupportInfrastructure
Organization mobilitymanagement
15

Next Steps:
• Case Studies & workshops with 25 Portuguese municipalities –participatory process opening up space for collaboratively improving and implementing the tool
• Negotiating access to data/ not open data
• National Ranking of cities GPC?
• Starter Cycling City Roadmap articulating GPC – EVC – CMS
Gross Potential for Cycling
GPC
16
THANK YOU
FOR YOUR
This work is financially supported by: Project POCI-01-0145-FEDER-031479 - funded by FEDER funds through COMPETE 2020 - Programa Operacional Competitividade e Internacionalização (POCI) and by national funds (PIDDAC) through FCT/MCTES.
https://boost.up.pt
17
BooST . Cecília Silva, José Carlos Mota, Frederico Sá, Joana Marques, João Pedro Ferreira, Catarina Isidoro,
Tamara Bicalho, Ana Mélice Dias, Isabel Cunha, Catarina Cadima