Appendix X: 2016 Greenhouse Gas Emissions Inventory and ...
68
Appendix X: 2016 Greenhouse Gas Emissions Inventory and Projections for the San Diego Region Draft for Public Review May 2021
Transcript of Appendix X: 2016 Greenhouse Gas Emissions Inventory and ...
Appendix X: 2016 Greenhouse Gas Emissions Inventory and Projections for the San Diego Region
Draft for Public Review May 2021

San Diego Forward: The 2021 Regional Plan X-1
Appendix X: 2016 Greenhouse Gas Emissions Inventory and Projections for the San Diego Region
Introduction The San Diego Association of Governments (SANDAG) contracted the Energy Policy Initiatives Center (EPIC), housed at the University of San Diego (USD), to estimate the 2016 greenhouse gas (GHG) emissions for the San Diego region and to project GHG emissions for the years 2025, 2030, 2035, 2045, and 2050. The projections take into account the effect of existing federal and California (State) regulations and regional policies to reduce GHG emissions. GHG emissions estimates and projections are to be included in San Diego Forward: The 2021 Regional Plan (2021 Regional Plan) and its associated Environmental Impact Report (EIR). This appendix summarizes the methodologies and data used to conduct this analysis.
To the extent possible, EPIC followed the same methods used in developing the 2012 GHG emissions inventory and projections for San Diego Forward: The 2015 Regional Plan.1 The 2016 GHG inventory and projections include 15 emissions categories and calculated based on the U.S. Community Protocol for Accounting and Reporting of Greenhouse Gas Emissions and California Air Resources Board (CARB) California statewide GHG inventory methodology.
Overview of the Appendix This appendix includes the following sections:
• Background provides common background sources and assumptions used for the inventory and projections.
• Summary of Results provides the results of the 2016 GHG inventory and the GHG projections.
• Method to Calculate Emissions Inventory and Projections by Category includes subsections that cover the methods used to develop the inventory and projections by emissions category. Each subsection also describes how the methods to calculate the 2016 GHG inventory may vary from those used in the previous 2012 GHG inventory.
1 SANDAG: San Diego Forward: 2015 Regional Plan (2015).
X-2 San Diego Forward: The 2021 Regional Plan
Background
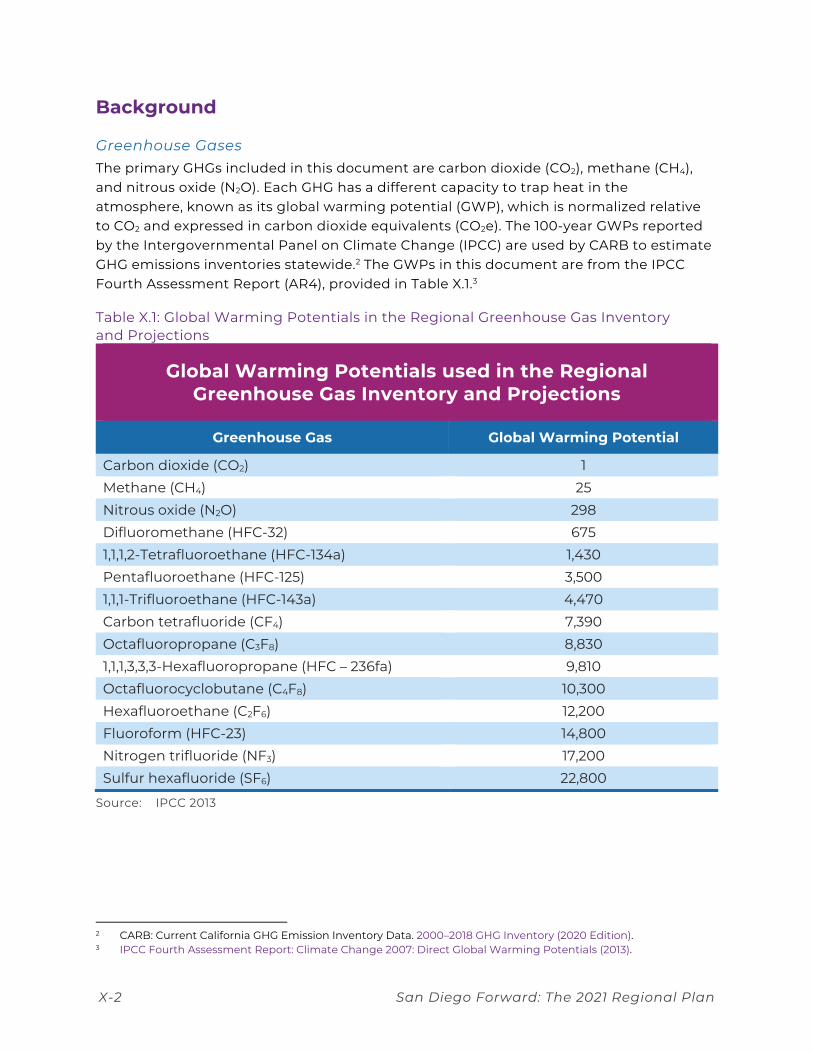
Greenhouse Gases The primary GHGs included in this document are carbon dioxide (CO2), methane (CH4), and nitrous oxide (N2O). Each GHG has a different capacity to trap heat in the atmosphere, known as its global warming potential (GWP), which is normalized relative to CO2 and expressed in carbon dioxide equivalents (CO2e). The 100-year GWPs reported by the Intergovernmental Panel on Climate Change (IPCC) are used by CARB to estimate GHG emissions inventories statewide.2 The GWPs in this document are from the IPCC Fourth Assessment Report (AR4), provided in Table X.1.3
Table X.1: Global Warming Potentials in the Regional Greenhouse Gas Inventory and Projections
Global Warming Potentials used in the Regional Greenhouse Gas Inventory and Projections
Greenhouse Gas Global Warming Potential
Carbon dioxide (CO2) 1 Methane (CH4) 25 Nitrous oxide (N2O) 298 Difluoromethane (HFC-32) 675 1,1,1,2-Tetrafluoroethane (HFC-134a) 1,430 Pentafluoroethane (HFC-125) 3,500 1,1,1-Trifluoroethane (HFC-143a) 4,470 Carbon tetrafluoride (CF4) 7,390 Octafluoropropane (C3F8) 8,830 1,1,1,3,3,3-Hexafluoropropane (HFC – 236fa) 9,810 Octafluorocyclobutane (C4F8) 10,300 Hexafluoroethane (C2F6) 12,200 Fluoroform (HFC-23) 14,800 Nitrogen trifluoride (NF3) 17,200 Sulfur hexafluoride (SF6) 22,800
Source: IPCC 2013
2 CARB: Current California GHG Emission Inventory Data. 2000–2018 GHG Inventory (2020 Edition). 3 IPCC Fourth Assessment Report: Climate Change 2007: Direct Global Warming Potentials (2013).
San Diego Forward: The 2021 Regional Plan X-3
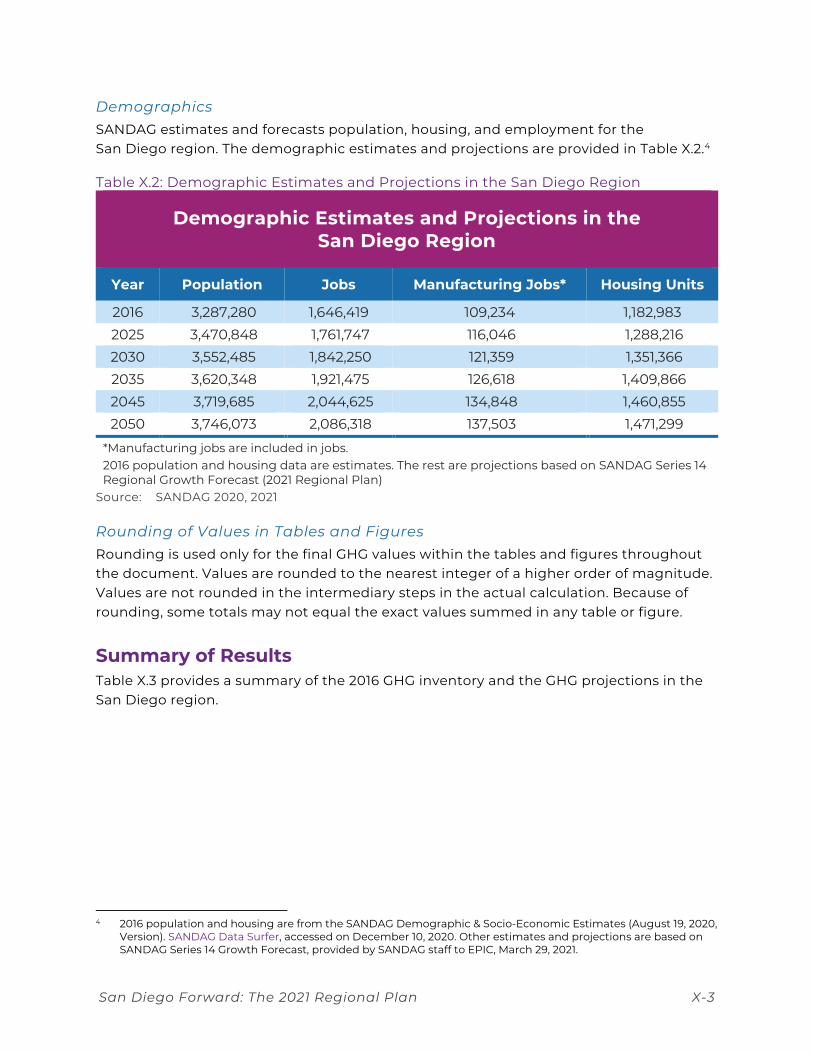
Demographics SANDAG estimates and forecasts population, housing, and employment for the San Diego region. The demographic estimates and projections are provided in Table X.2.4
Table X.2: Demographic Estimates and Projections in the San Diego Region
Demographic Estimates and Projections in the San Diego Region
Year Population Jobs Manufacturing Jobs* Housing Units
2016 3,287,280 1,646,419 109,234 1,182,983 2025 3,470,848 1,761,747 116,046 1,288,216 2030 3,552,485 1,842,250 121,359 1,351,366 2035 3,620,348 1,921,475 126,618 1,409,866 2045 3,719,685 2,044,625 134,848 1,460,855 2050 3,746,073 2,086,318 137,503 1,471,299
*Manufacturing jobs are included in jobs. 2016 population and housing data are estimates. The rest are projections based on SANDAG Series 14 Regional Growth Forecast (2021 Regional Plan)
Source: SANDAG 2020, 2021
Rounding of Values in Tables and Figures Rounding is used only for the final GHG values within the tables and figures throughout the document. Values are rounded to the nearest integer of a higher order of magnitude. Values are not rounded in the intermediary steps in the actual calculation. Because of rounding, some totals may not equal the exact values summed in any table or figure.
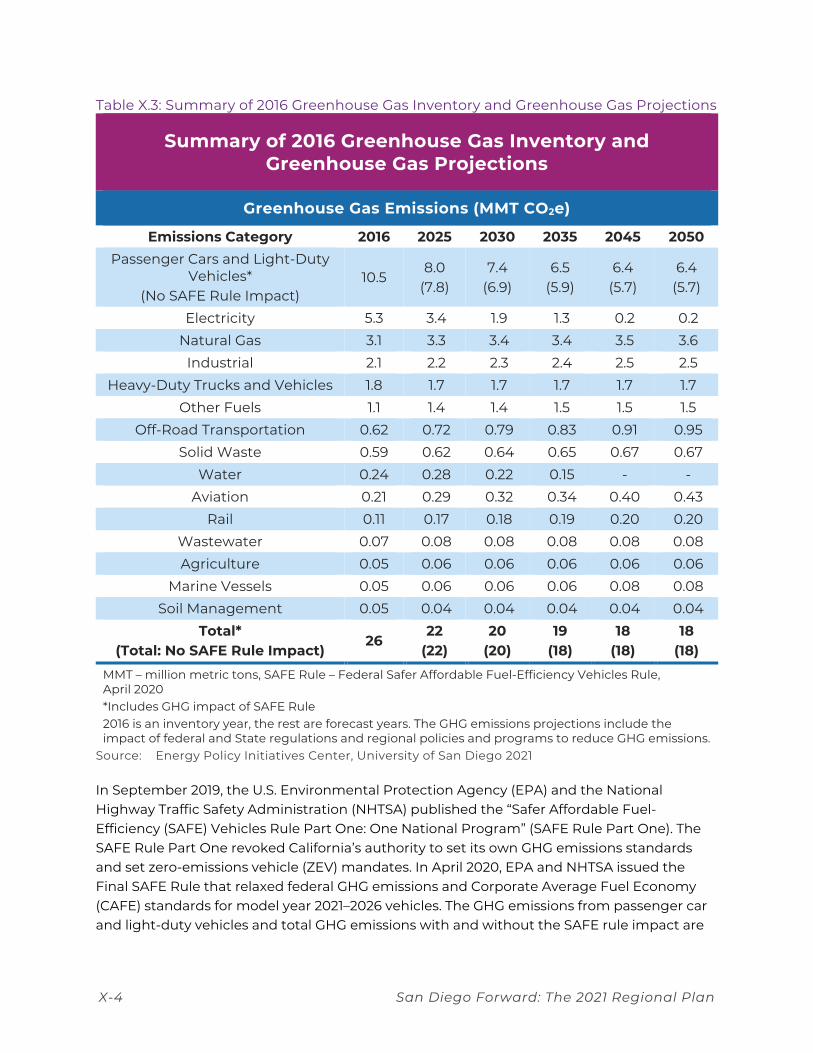
Summary of Results Table X.3 provides a summary of the 2016 GHG inventory and the GHG projections in the San Diego region.
4 2016 population and housing are from the SANDAG Demographic & Socio-Economic Estimates (August 19, 2020,
Version). SANDAG Data Surfer, accessed on December 10, 2020. Other estimates and projections are based on SANDAG Series 14 Growth Forecast, provided by SANDAG staff to EPIC, March 29, 2021.
X-4 San Diego Forward: The 2021 Regional Plan
Table X.3: Summary of 2016 Greenhouse Gas Inventory and Greenhouse Gas Projections
Summary of 2016 Greenhouse Gas Inventory and Greenhouse Gas Projections
Greenhouse Gas Emissions (MMT CO2e)
Emissions Category 2016 2025 2030 2035 2045 2050 Passenger Cars and Light-Duty
Vehicles* (No SAFE Rule Impact)
10.5 8.0
(7.8) 7.4
(6.9) 6.5
(5.9) 6.4
(5.7) 6.4
(5.7)
Electricity 5.3 3.4 1.9 1.3 0.2 0.2 Natural Gas 3.1 3.3 3.4 3.4 3.5 3.6
Industrial 2.1 2.2 2.3 2.4 2.5 2.5 Heavy-Duty Trucks and Vehicles 1.8 1.7 1.7 1.7 1.7 1.7
Other Fuels 1.1 1.4 1.4 1.5 1.5 1.5 Off-Road Transportation 0.62 0.72 0.79 0.83 0.91 0.95
Solid Waste 0.59 0.62 0.64 0.65 0.67 0.67 Water 0.24 0.28 0.22 0.15 - -
Aviation 0.21 0.29 0.32 0.34 0.40 0.43 Rail 0.11 0.17 0.18 0.19 0.20 0.20
Wastewater 0.07 0.08 0.08 0.08 0.08 0.08 Agriculture 0.05 0.06 0.06 0.06 0.06 0.06
Marine Vessels 0.05 0.06 0.06 0.06 0.08 0.08 Soil Management 0.05 0.04 0.04 0.04 0.04 0.04
Total* (Total: No SAFE Rule Impact)
26 22
(22) 20
(20) 19
(18) 18
(18) 18
(18) MMT – million metric tons, SAFE Rule – Federal Safer Affordable Fuel-Efficiency Vehicles Rule, April 2020 *Includes GHG impact of SAFE Rule 2016 is an inventory year, the rest are forecast years. The GHG emissions projections include the impact of federal and State regulations and regional policies and programs to reduce GHG emissions.
Source: Energy Policy Initiatives Center, University of San Diego 2021
In September 2019, the U.S. Environmental Protection Agency (EPA) and the National Highway Traffic Safety Administration (NHTSA) published the “Safer Affordable Fuel-Efficiency (SAFE) Vehicles Rule Part One: One National Program” (SAFE Rule Part One). The SAFE Rule Part One revoked California’s authority to set its own GHG emissions standards and set zero-emissions vehicle (ZEV) mandates. In April 2020, EPA and NHTSA issued the Final SAFE Rule that relaxed federal GHG emissions and Corporate Average Fuel Economy (CAFE) standards for model year 2021–2026 vehicles. The GHG emissions from passenger car and light-duty vehicles and total GHG emissions with and without the SAFE rule impact are
San Diego Forward: The 2021 Regional Plan X-5
shown in Table X.3. The method to adjust on-road transportation emissions with SAFE Rule is discussed in the section On-Road Transportation – Passenger Car and Light-Duty Vehicles.
The previous 2012 GHG inventory included the following land use and development influences on the regional inventory: (1) carbon sequestration from vegetation cover, (2) vegetation displaced by development, and (3) vegetation burning due to wildfires. This inventory excludes emissions and sequestration estimates from vegetation and follows CARB’s approach to track statewide GHG emissions from anthropogenic activities not including the GHG flux associated with carbon stocks in California’s natural and working lands5 and wildfire emissions. This is because wildfires are part of Earth’s carbon cycle and it is difficult to determine how much of the wildfire emissions are from anthropogenic activities.6Error! Reference
source not found., 7
The forecast includes the regional effects of existing federal and State polices and regulations to reduce GHG emissions. The projected reductions are based on the current implementation timeline of these regulations. Many regulations do not extend beyond 2025 or 2030, and therefore are assumed to have no additional impact after 2025 or 2030.
Method to Calculate Emissions Inventory and Projections by Category
On-Road Transportation – Passenger Car and Light-Duty Vehicles The passenger car and light-duty vehicles emissions category is the largest contributor of GHG emissions in the San Diego region, accounting for 41% of total GHG emissions in the 2016 inventory and 32% of total GHG emissions in the 2050 projection. Tailpipe GHG emissions from on-road transportation are the result of fuel combustion (i.e., gasoline, diesel, natural gas) from mobile vehicles on freeways, highways, and local roads. The vehicle classes included in this emissions category are passenger cars and light-duty vehicles. The GHG emissions from other vehicles are accounted for in the subsection titled On-Road Transportation – Heavy-Duty Trucks and Vehicles.
Method Used to Estimate 2016 Emissions
EPIC used EMFAC2017, CARB’s on-road mobile sources model, to estimate the on-road transportation emissions for passenger cars and light-duty vehicles.8 SANDAG provided the input file to run EMFAC2017 under custom mode, as well as the output file containing all emissions results.9 The input file, from SANDAG’s activity-based model (ABM14.2.1), includes vehicle miles traveled (VMT) on an average weekday by EMFAC vehicle
5 CARB began a natural and working lands carbon and GHG flux assessment in 2018 based on IPCC principles.
See arb.ca.gov/nwl-inventory. 6 CARB: Frequently Asked Questions: Wildfire Emissions. 7 California Senate Bill 901 (Dodd, 2018) (SB 901) requires that the state develop a report assessing GHG emissions
from wildfire and forest management activities by December 2020 and every five years thereafter. The SB 901 2020 report provides wildfire estimates for the years 2000–2019. See California Wildfire Burn Acreages and Preliminary Emissions Estimates.
8 CARB: Mobile Source Emissions Inventory. EMFAC 2017. 9 Files provided by SANDAG staff, December 11, 2020.
X-6 San Diego Forward: The 2021 Regional Plan
categories and fuel types. The output file, from an EMFAC2017 custom model run, provides CO2 emissions in tons per weekday for each vehicle category and each fuel type. This passenger car and light-duty vehicles emissions category covers the GHG emissions from EMFAC2017 vehicle classes LDA, LDT1, LDT2, and MDV.10
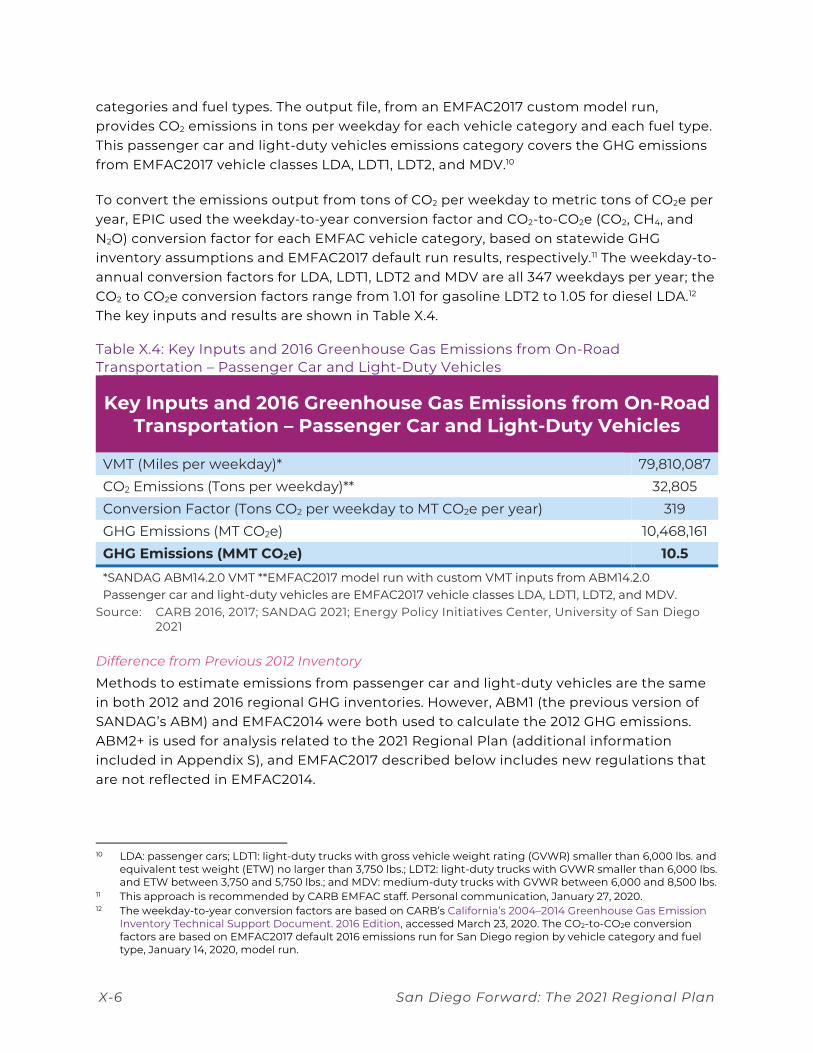
To convert the emissions output from tons of CO2 per weekday to metric tons of CO2e per year, EPIC used the weekday-to-year conversion factor and CO2-to-CO2e (CO2, CH4, and N2O) conversion factor for each EMFAC vehicle category, based on statewide GHG inventory assumptions and EMFAC2017 default run results, respectively.11 The weekday-to-annual conversion factors for LDA, LDT1, LDT2 and MDV are all 347 weekdays per year; the CO2 to CO2e conversion factors range from 1.01 for gasoline LDT2 to 1.05 for diesel LDA.12 The key inputs and results are shown in Table X.4.
Table X.4: Key Inputs and 2016 Greenhouse Gas Emissions from On-Road Transportation – Passenger Car and Light-Duty Vehicles
Key Inputs and 2016 Greenhouse Gas Emissions from On-Road Transportation – Passenger Car and Light-Duty Vehicles
VMT (Miles per weekday)* 79,810,087 CO2 Emissions (Tons per weekday)** 32,805 Conversion Factor (Tons CO2 per weekday to MT CO2e per year) 319 GHG Emissions (MT CO2e) 10,468,161 GHG Emissions (MMT CO2e) 10.5
*SANDAG ABM14.2.0 VMT **EMFAC2017 model run with custom VMT inputs from ABM14.2.0 Passenger car and light-duty vehicles are EMFAC2017 vehicle classes LDA, LDT1, LDT2, and MDV.
Source: CARB 2016, 2017; SANDAG 2021; Energy Policy Initiatives Center, University of San Diego 2021
Difference from Previous 2012 Inventory
Methods to estimate emissions from passenger car and light-duty vehicles are the same in both 2012 and 2016 regional GHG inventories. However, ABM1 (the previous version of SANDAG’s ABM) and EMFAC2014 were both used to calculate the 2012 GHG emissions. ABM2+ is used for analysis related to the 2021 Regional Plan (additional information included in Appendix S), and EMFAC2017 described below includes new regulations that are not reflected in EMFAC2014.
10 LDA: passenger cars; LDT1: light-duty trucks with gross vehicle weight rating (GVWR) smaller than 6,000 lbs. and
equivalent test weight (ETW) no larger than 3,750 lbs.; LDT2: light-duty trucks with GVWR smaller than 6,000 lbs. and ETW between 3,750 and 5,750 lbs.; and MDV: medium-duty trucks with GVWR between 6,000 and 8,500 lbs.
11 This approach is recommended by CARB EMFAC staff. Personal communication, January 27, 2020. 12 The weekday-to-year conversion factors are based on CARB’s California’s 2004–2014 Greenhouse Gas Emission
Inventory Technical Support Document. 2016 Edition, accessed March 23, 2020. The CO2-to-CO2e conversion factors are based on EMFAC2017 default 2016 emissions run for San Diego region by vehicle category and fuel type, January 14, 2020, model run.
San Diego Forward: The 2021 Regional Plan X-7
Method Used to Develop Emissions Projections
The method used to develop projections is similar to the method used to estimate 2016 emissions, based on an EMFAC2017 model run with SANDAG VMT inputs. For forecast years, EMFAC2017 model results include the effect of all key federal and State laws, regulations, and legislative actions that were adopted as of December 2017. The updated regulation for passenger cars and light-duty vehicles since the release of EMFAC2014 is the California Advanced Clean Car (ACC) Program, which includes:
• Tailpipe emissions standards equivalent to CAFE standards for vehicle model years 2017–2025
• A ZEV program that requires manufacturers to produce increasing numbers of ZEVs and plug-in hybrid electric vehicles for model years 2017–2025
The impact of the ACC Program had already been incorporated into the previous version, EMFAC2014; however, EMFAC2017 includes updated assumptions in the ACC regulation based on its 2017 midterm review.
With the same tons of CO2 per weekday to MT CO2e per year conversion method discussed in the previous inventory method section, the key inputs and results are shown in Table X.5.13
13 VMT input files and emission output files were provided by SANDAG Staff, March 18, 2021.
X-8 San Diego Forward: The 2021 Regional Plan
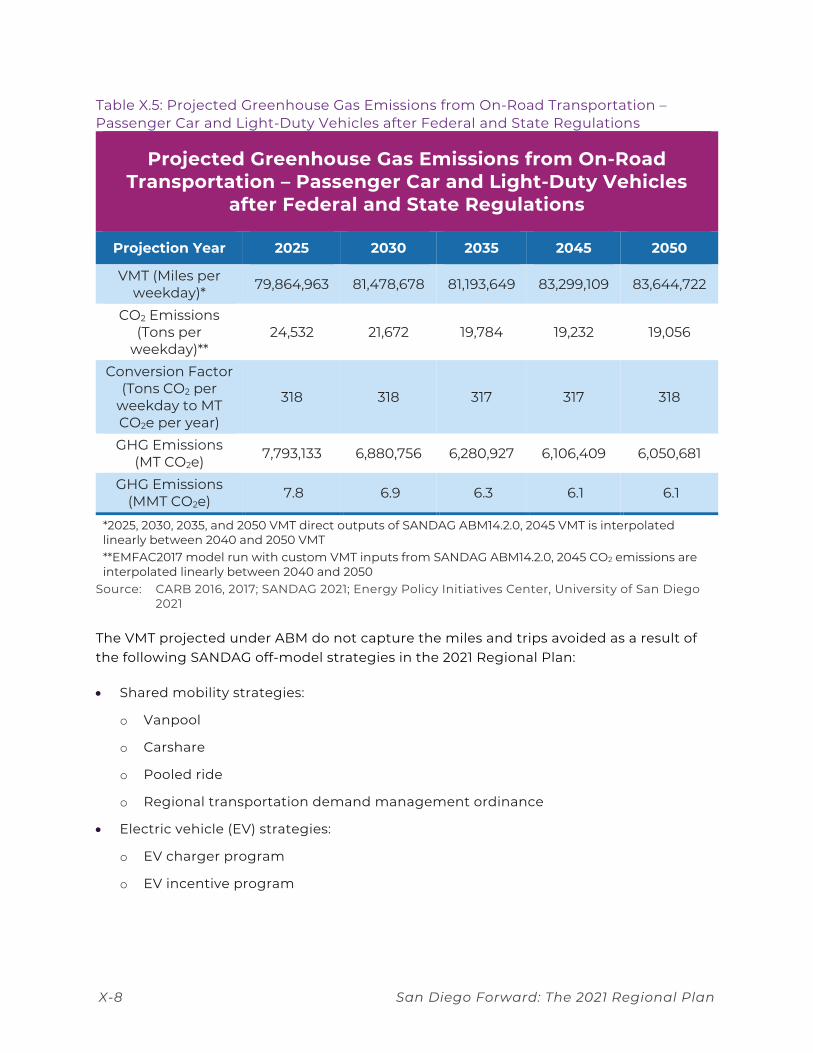
Table X.5: Projected Greenhouse Gas Emissions from On-Road Transportation – Passenger Car and Light-Duty Vehicles after Federal and State Regulations
Projected Greenhouse Gas Emissions from On-Road Transportation – Passenger Car and Light-Duty Vehicles
after Federal and State Regulations
Projection Year 2025 2030 2035 2045 2050
VMT (Miles per weekday)* 79,864,963 81,478,678 81,193,649 83,299,109 83,644,722
CO2 Emissions (Tons per
weekday)** 24,532 21,672 19,784 19,232 19,056
Conversion Factor (Tons CO2 per
weekday to MT CO2e per year)
318 318 317 317 318
GHG Emissions (MT CO2e) 7,793,133 6,880,756 6,280,927 6,106,409 6,050,681
GHG Emissions (MMT CO2e) 7.8 6.9 6.3 6.1 6.1
*2025, 2030, 2035, and 2050 VMT direct outputs of SANDAG ABM14.2.0, 2045 VMT is interpolated linearly between 2040 and 2050 VMT **EMFAC2017 model run with custom VMT inputs from SANDAG ABM14.2.0, 2045 CO2 emissions are interpolated linearly between 2040 and 2050
Source: CARB 2016, 2017; SANDAG 2021; Energy Policy Initiatives Center, University of San Diego 2021
The VMT projected under ABM do not capture the miles and trips avoided as a result of the following SANDAG off-model strategies in the 2021 Regional Plan:
• Shared mobility strategies:
o Vanpool
o Carshare
o Pooled ride
o Regional transportation demand management ordinance
• Electric vehicle (EV) strategies:
o EV charger program
o EV incentive program
San Diego Forward: The 2021 Regional Plan X-9
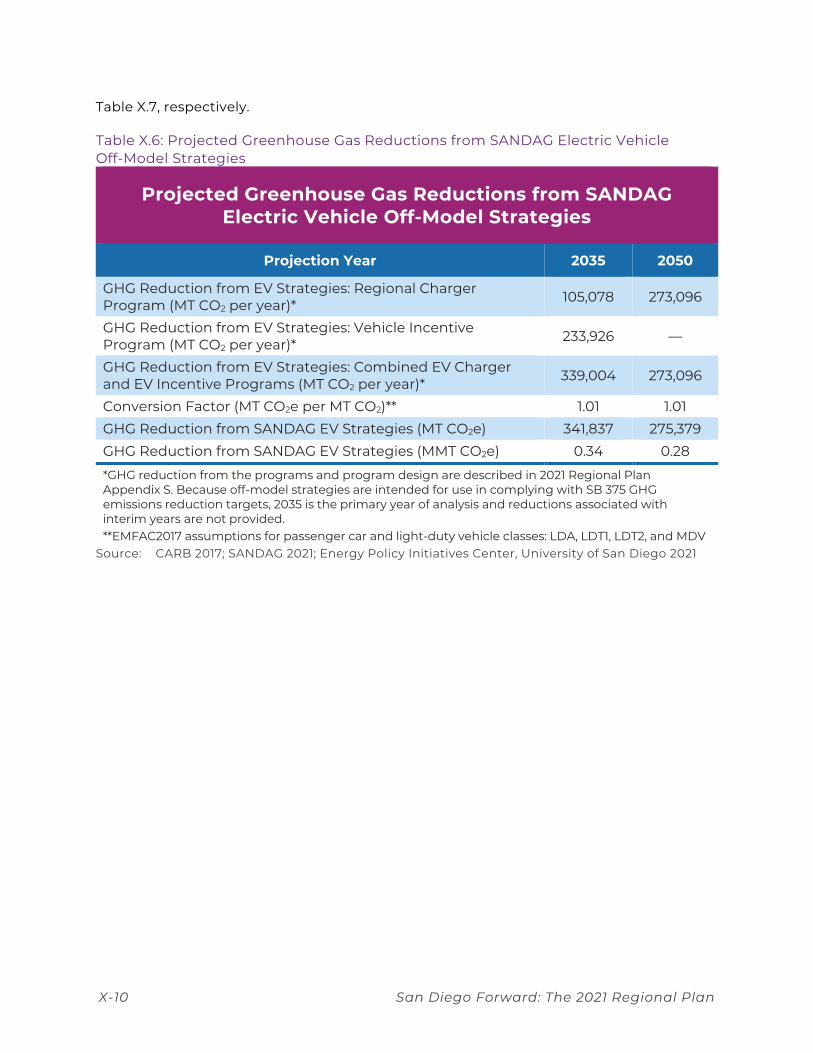
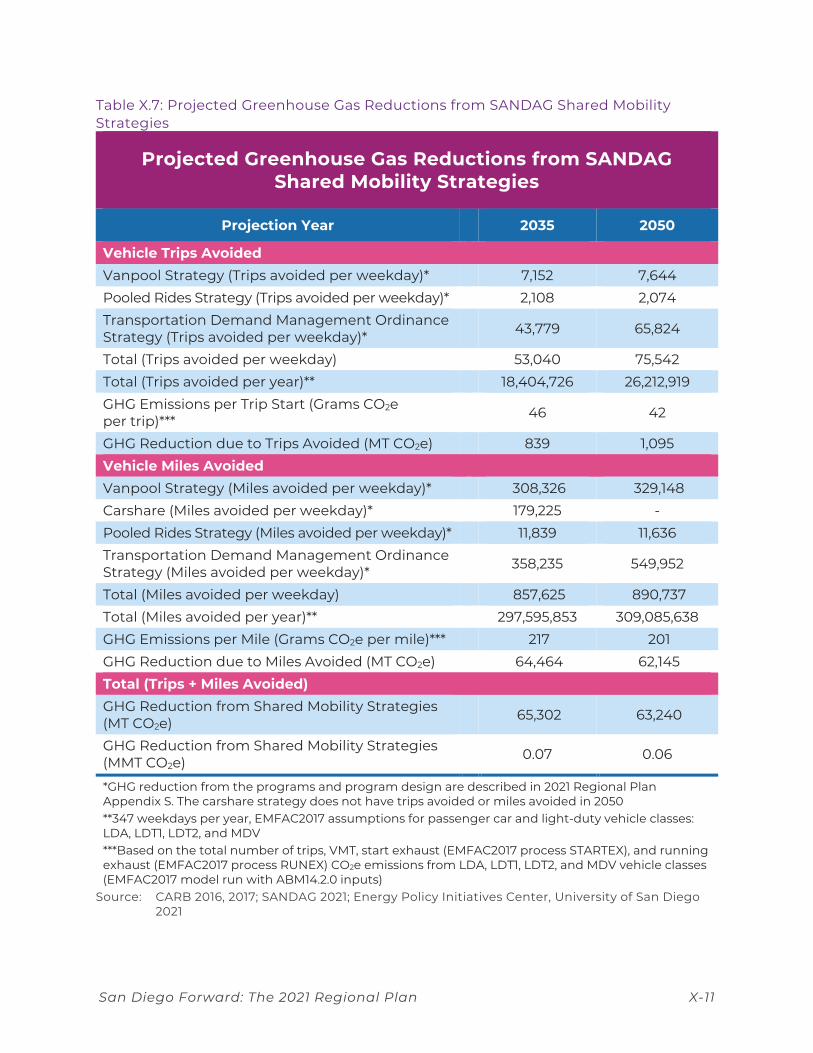
The detailed strategy descriptions and the methods to estimate CO2 reductions due to the strategies are provided in Appendix S. EPIC converted the annual CO2 reductions (EV strategies) and weekday CO2 reductions (shared mobility strategies) to annual CO2e reductions using the same conversion method as described above. For the shared mobility strategies, only the GHG reductions from running exhaust and start exhaust processes are included in this appendix to be consistent with Appendix S. The projected GHG reductions from EV strategies and shared mobility strategies are shown in Table X.6 and
X-10 San Diego Forward: The 2021 Regional Plan
Table X.7, respectively.
Table X.6: Projected Greenhouse Gas Reductions from SANDAG Electric Vehicle Off-Model Strategies
Projected Greenhouse Gas Reductions from SANDAG Electric Vehicle Off-Model Strategies
Projection Year 2035 2050
GHG Reduction from EV Strategies: Regional Charger Program (MT CO2 per year)* 105,078 273,096
GHG Reduction from EV Strategies: Vehicle Incentive Program (MT CO2 per year)* 233,926 —
GHG Reduction from EV Strategies: Combined EV Charger and EV Incentive Programs (MT CO2 per year)* 339,004 273,096
Conversion Factor (MT CO2e per MT CO2)** 1.01 1.01 GHG Reduction from SANDAG EV Strategies (MT CO2e) 341,837 275,379 GHG Reduction from SANDAG EV Strategies (MMT CO2e) 0.34 0.28
*GHG reduction from the programs and program design are described in 2021 Regional Plan Appendix S. Because off-model strategies are intended for use in complying with SB 375 GHG emissions reduction targets, 2035 is the primary year of analysis and reductions associated with interim years are not provided. **EMFAC2017 assumptions for passenger car and light-duty vehicle classes: LDA, LDT1, LDT2, and MDV
Source: CARB 2017; SANDAG 2021; Energy Policy Initiatives Center, University of San Diego 2021
San Diego Forward: The 2021 Regional Plan X-11
Table X.7: Projected Greenhouse Gas Reductions from SANDAG Shared Mobility Strategies
Projected Greenhouse Gas Reductions from SANDAG Shared Mobility Strategies
Projection Year 2035 2050
Vehicle Trips Avoided Vanpool Strategy (Trips avoided per weekday)* 7,152 7,644 Pooled Rides Strategy (Trips avoided per weekday)* 2,108 2,074 Transportation Demand Management Ordinance Strategy (Trips avoided per weekday)* 43,779 65,824
Total (Trips avoided per weekday) 53,040 75,542 Total (Trips avoided per year)** 18,404,726 26,212,919 GHG Emissions per Trip Start (Grams CO2e per trip)*** 46 42
GHG Reduction due to Trips Avoided (MT CO2e) 839 1,095 Vehicle Miles Avoided Vanpool Strategy (Miles avoided per weekday)* 308,326 329,148 Carshare (Miles avoided per weekday)* 179,225 - Pooled Rides Strategy (Miles avoided per weekday)* 11,839 11,636 Transportation Demand Management Ordinance Strategy (Miles avoided per weekday)* 358,235 549,952
Total (Miles avoided per weekday) 857,625 890,737 Total (Miles avoided per year)** 297,595,853 309,085,638 GHG Emissions per Mile (Grams CO2e per mile)*** 217 201 GHG Reduction due to Miles Avoided (MT CO2e) 64,464 62,145 Total (Trips + Miles Avoided) GHG Reduction from Shared Mobility Strategies (MT CO2e) 65,302 63,240
GHG Reduction from Shared Mobility Strategies (MMT CO2e) 0.07 0.06
*GHG reduction from the programs and program design are described in 2021 Regional Plan Appendix S. The carshare strategy does not have trips avoided or miles avoided in 2050 **347 weekdays per year, EMFAC2017 assumptions for passenger car and light-duty vehicle classes: LDA, LDT1, LDT2, and MDV ***Based on the total number of trips, VMT, start exhaust (EMFAC2017 process STARTEX), and running exhaust (EMFAC2017 process RUNEX) CO2e emissions from LDA, LDT1, LDT2, and MDV vehicle classes (EMFAC2017 model run with ABM14.2.0 inputs)
Source: CARB 2016, 2017; SANDAG 2021; Energy Policy Initiatives Center, University of San Diego 2021
X-12 San Diego Forward: The 2021 Regional Plan
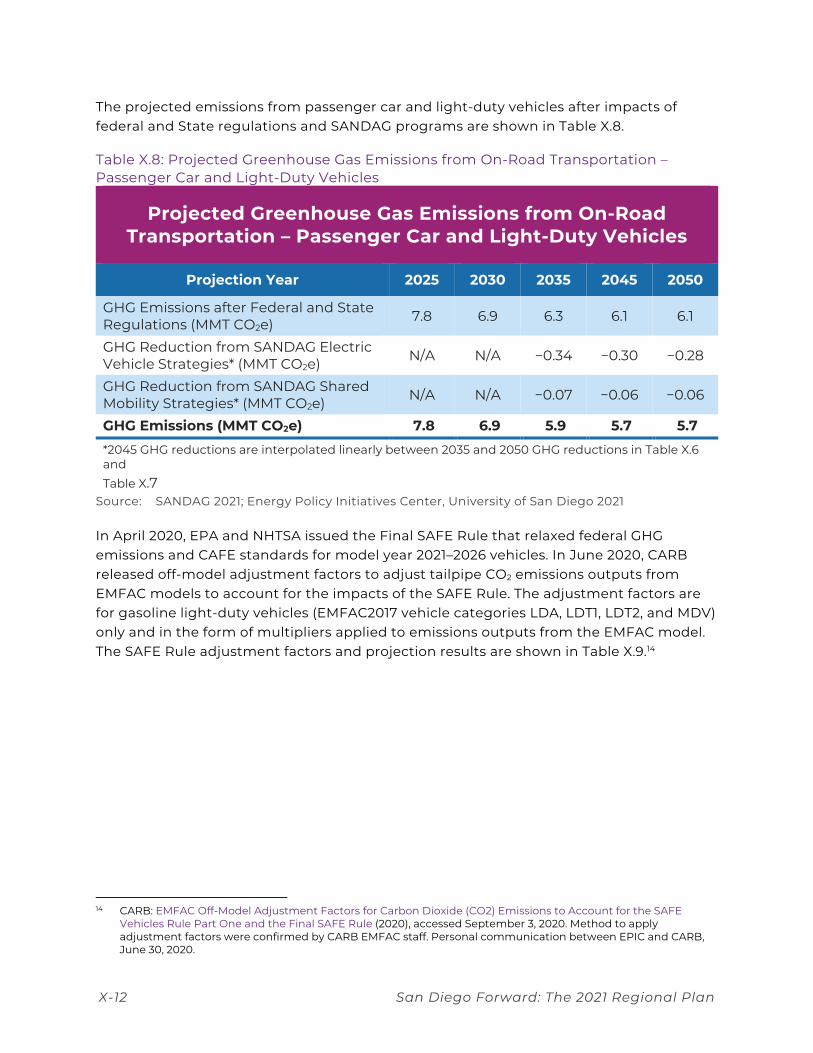
The projected emissions from passenger car and light-duty vehicles after impacts of federal and State regulations and SANDAG programs are shown in Table X.8.
Table X.8: Projected Greenhouse Gas Emissions from On-Road Transportation – Passenger Car and Light-Duty Vehicles
Projected Greenhouse Gas Emissions from On-Road Transportation – Passenger Car and Light-Duty Vehicles
Projection Year 2025 2030 2035 2045 2050
GHG Emissions after Federal and State Regulations (MMT CO2e) 7.8 6.9 6.3 6.1 6.1
GHG Reduction from SANDAG Electric Vehicle Strategies* (MMT CO2e) N/A N/A −0.34 −0.30 −0.28
GHG Reduction from SANDAG Shared Mobility Strategies* (MMT CO2e) N/A N/A −0.07 −0.06 −0.06
GHG Emissions (MMT CO2e) 7.8 6.9 5.9 5.7 5.7 *2045 GHG reductions are interpolated linearly between 2035 and 2050 GHG reductions in Table X.6 and Table X.7
Source: SANDAG 2021; Energy Policy Initiatives Center, University of San Diego 2021
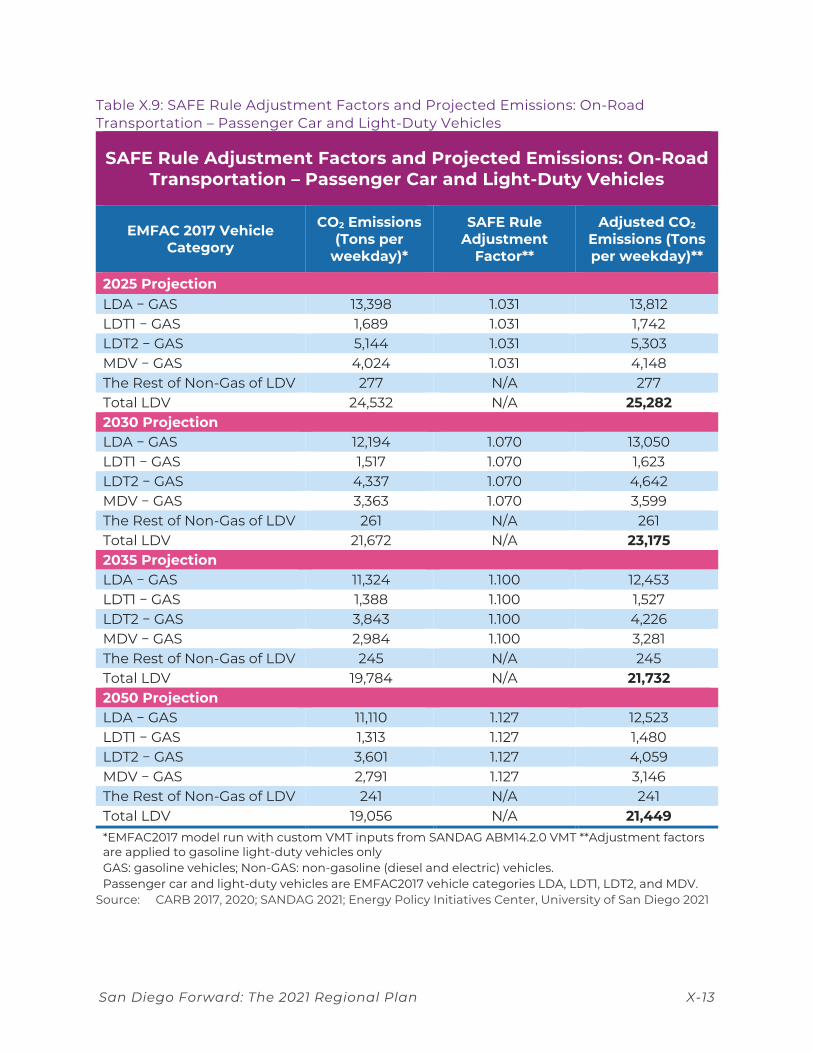
In April 2020, EPA and NHTSA issued the Final SAFE Rule that relaxed federal GHG emissions and CAFE standards for model year 2021–2026 vehicles. In June 2020, CARB released off-model adjustment factors to adjust tailpipe CO2 emissions outputs from EMFAC models to account for the impacts of the SAFE Rule. The adjustment factors are for gasoline light-duty vehicles (EMFAC2017 vehicle categories LDA, LDT1, LDT2, and MDV) only and in the form of multipliers applied to emissions outputs from the EMFAC model. The SAFE Rule adjustment factors and projection results are shown in Table X.9.14
14 CARB: EMFAC Off-Model Adjustment Factors for Carbon Dioxide (CO2) Emissions to Account for the SAFE
Vehicles Rule Part One and the Final SAFE Rule (2020), accessed September 3, 2020. Method to apply adjustment factors were confirmed by CARB EMFAC staff. Personal communication between EPIC and CARB, June 30, 2020.
San Diego Forward: The 2021 Regional Plan X-13
Table X.9: SAFE Rule Adjustment Factors and Projected Emissions: On-Road Transportation – Passenger Car and Light-Duty Vehicles
SAFE Rule Adjustment Factors and Projected Emissions: On-Road Transportation – Passenger Car and Light-Duty Vehicles
EMFAC 2017 Vehicle Category
CO2 Emissions (Tons per
weekday)*
SAFE Rule Adjustment
Factor**
Adjusted CO2 Emissions (Tons per weekday)**
2025 Projection LDA − GAS 13,398 1.031 13,812 LDT1 − GAS 1,689 1.031 1,742 LDT2 − GAS 5,144 1.031 5,303 MDV − GAS 4,024 1.031 4,148 The Rest of Non-Gas of LDV 277 N/A 277 Total LDV 24,532 N/A 25,282 2030 Projection LDA − GAS 12,194 1.070 13,050 LDT1 − GAS 1,517 1.070 1,623 LDT2 − GAS 4,337 1.070 4,642 MDV − GAS 3,363 1.070 3,599 The Rest of Non-Gas of LDV 261 N/A 261 Total LDV 21,672 N/A 23,175 2035 Projection LDA − GAS 11,324 1.100 12,453 LDT1 − GAS 1,388 1.100 1,527 LDT2 − GAS 3,843 1.100 4,226 MDV − GAS 2,984 1.100 3,281 The Rest of Non-Gas of LDV 245 N/A 245 Total LDV 19,784 N/A 21,732 2050 Projection LDA − GAS 11,110 1.127 12,523 LDT1 − GAS 1,313 1.127 1,480 LDT2 − GAS 3,601 1.127 4,059 MDV − GAS 2,791 1.127 3,146 The Rest of Non-Gas of LDV 241 N/A 241 Total LDV 19,056 N/A 21,449 *EMFAC2017 model run with custom VMT inputs from SANDAG ABM14.2.0 VMT **Adjustment factors are applied to gasoline light-duty vehicles only GAS: gasoline vehicles; Non-GAS: non-gasoline (diesel and electric) vehicles. Passenger car and light-duty vehicles are EMFAC2017 vehicle categories LDA, LDT1, LDT2, and MDV.
Source: CARB 2017, 2020; SANDAG 2021; Energy Policy Initiatives Center, University of San Diego 2021
X-14 San Diego Forward: The 2021 Regional Plan
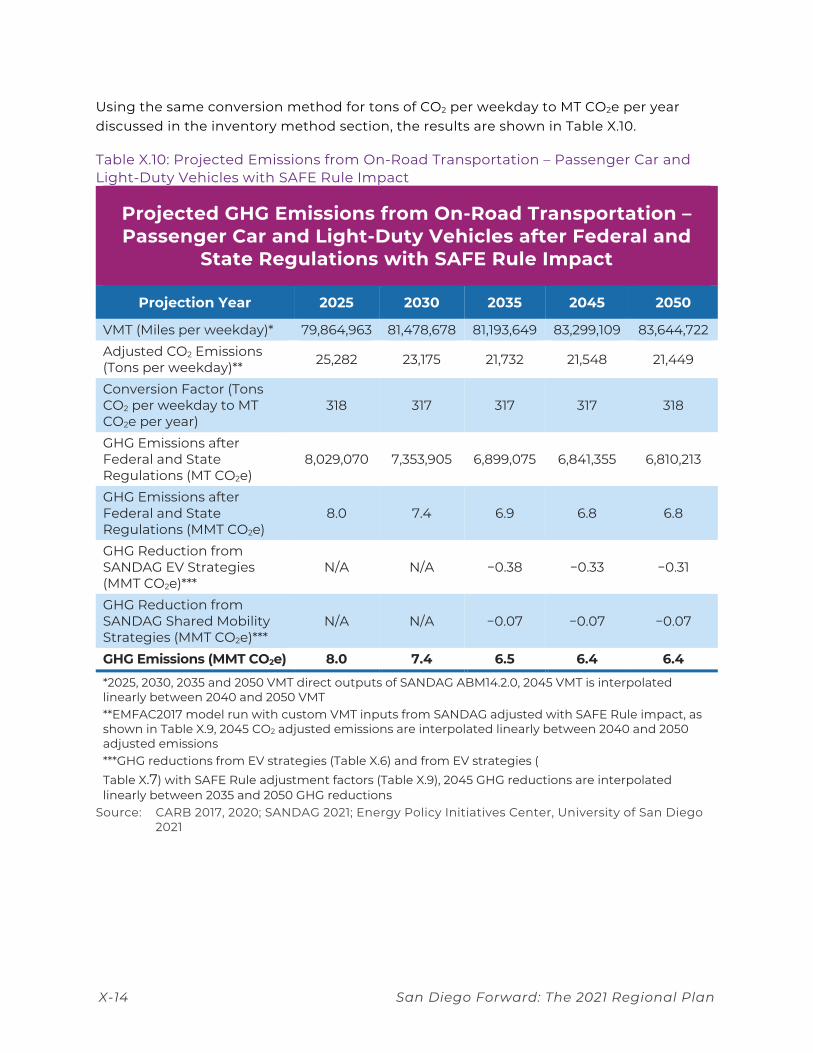
Using the same conversion method for tons of CO2 per weekday to MT CO2e per year discussed in the inventory method section, the results are shown in Table X.10.
Table X.10: Projected Emissions from On-Road Transportation – Passenger Car and Light-Duty Vehicles with SAFE Rule Impact
Projected GHG Emissions from On-Road Transportation – Passenger Car and Light-Duty Vehicles after Federal and
State Regulations with SAFE Rule Impact
Projection Year 2025 2030 2035 2045 2050
VMT (Miles per weekday)* 79,864,963 81,478,678 81,193,649 83,299,109 83,644,722 Adjusted CO2 Emissions (Tons per weekday)** 25,282 23,175 21,732 21,548 21,449
Conversion Factor (Tons CO2 per weekday to MT CO2e per year)
318 317 317 317 318
GHG Emissions after Federal and State Regulations (MT CO2e)
8,029,070 7,353,905 6,899,075 6,841,355 6,810,213
GHG Emissions after Federal and State Regulations (MMT CO2e)
8.0 7.4 6.9 6.8 6.8
GHG Reduction from SANDAG EV Strategies (MMT CO2e)***
N/A N/A −0.38 −0.33 −0.31
GHG Reduction from SANDAG Shared Mobility Strategies (MMT CO2e)***
N/A N/A −0.07 −0.07 −0.07
GHG Emissions (MMT CO2e) 8.0 7.4 6.5 6.4 6.4
*2025, 2030, 2035 and 2050 VMT direct outputs of SANDAG ABM14.2.0, 2045 VMT is interpolated linearly between 2040 and 2050 VMT **EMFAC2017 model run with custom VMT inputs from SANDAG adjusted with SAFE Rule impact, as shown in Table X.9, 2045 CO2 adjusted emissions are interpolated linearly between 2040 and 2050 adjusted emissions ***GHG reductions from EV strategies (Table X.6) and from EV strategies ( Table X.7) with SAFE Rule adjustment factors (Table X.9), 2045 GHG reductions are interpolated linearly between 2035 and 2050 GHG reductions
Source: CARB 2017, 2020; SANDAG 2021; Energy Policy Initiatives Center, University of San Diego 2021
San Diego Forward: The 2021 Regional Plan X-15
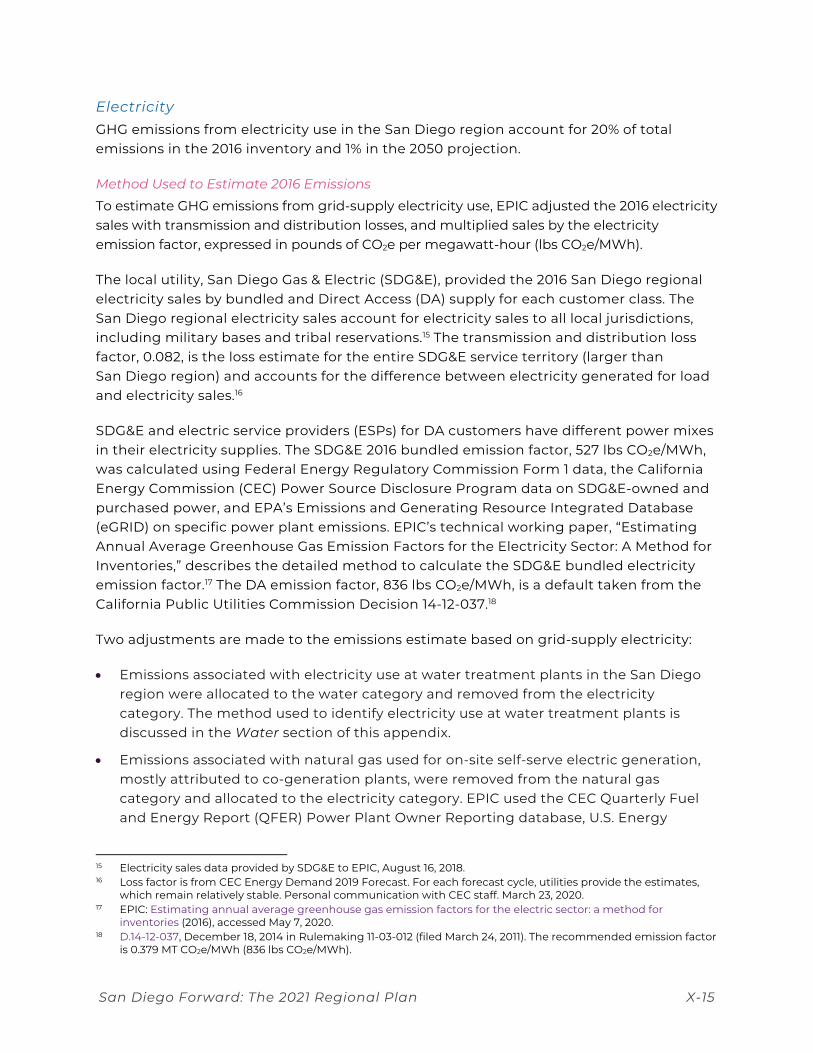
Electricity GHG emissions from electricity use in the San Diego region account for 20% of total emissions in the 2016 inventory and 1% in the 2050 projection.
Method Used to Estimate 2016 Emissions
To estimate GHG emissions from grid-supply electricity use, EPIC adjusted the 2016 electricity sales with transmission and distribution losses, and multiplied sales by the electricity emission factor, expressed in pounds of CO2e per megawatt-hour (lbs CO2e/MWh).
The local utility, San Diego Gas & Electric (SDG&E), provided the 2016 San Diego regional electricity sales by bundled and Direct Access (DA) supply for each customer class. The San Diego regional electricity sales account for electricity sales to all local jurisdictions, including military bases and tribal reservations.15 The transmission and distribution loss factor, 0.082, is the loss estimate for the entire SDG&E service territory (larger than San Diego region) and accounts for the difference between electricity generated for load and electricity sales.16
SDG&E and electric service providers (ESPs) for DA customers have different power mixes in their electricity supplies. The SDG&E 2016 bundled emission factor, 527 lbs CO2e/MWh, was calculated using Federal Energy Regulatory Commission Form 1 data, the California Energy Commission (CEC) Power Source Disclosure Program data on SDG&E-owned and purchased power, and EPA’s Emissions and Generating Resource Integrated Database (eGRID) on specific power plant emissions. EPIC’s technical working paper, “Estimating Annual Average Greenhouse Gas Emission Factors for the Electricity Sector: A Method for Inventories,” describes the detailed method to calculate the SDG&E bundled electricity emission factor.17 The DA emission factor, 836 lbs CO2e/MWh, is a default taken from the California Public Utilities Commission Decision 14-12-037.18
Two adjustments are made to the emissions estimate based on grid-supply electricity:
• Emissions associated with electricity use at water treatment plants in the San Diego region were allocated to the water category and removed from the electricity category. The method used to identify electricity use at water treatment plants is discussed in the Water section of this appendix.
• Emissions associated with natural gas used for on-site self-serve electric generation, mostly attributed to co-generation plants, were removed from the natural gas category and allocated to the electricity category. EPIC used the CEC Quarterly Fuel and Energy Report (QFER) Power Plant Owner Reporting database, U.S. Energy
15 Electricity sales data provided by SDG&E to EPIC, August 16, 2018. 16 Loss factor is from CEC Energy Demand 2019 Forecast. For each forecast cycle, utilities provide the estimates,
which remain relatively stable. Personal communication with CEC staff. March 23, 2020. 17 EPIC: Estimating annual average greenhouse gas emission factors for the electric sector: a method for
inventories (2016), accessed May 7, 2020. 18 D.14-12-037, December 18, 2014 in Rulemaking 11-03-012 (filed March 24, 2011). The recommended emission factor
is 0.379 MT CO2e/MWh (836 lbs CO2e/MWh).
X-16 San Diego Forward: The 2021 Regional Plan
Information Administration (EIA) Form 923 data, and the 2016 SDG&E Power Source Disclosure Program to identify the self-serve electric generation plants.
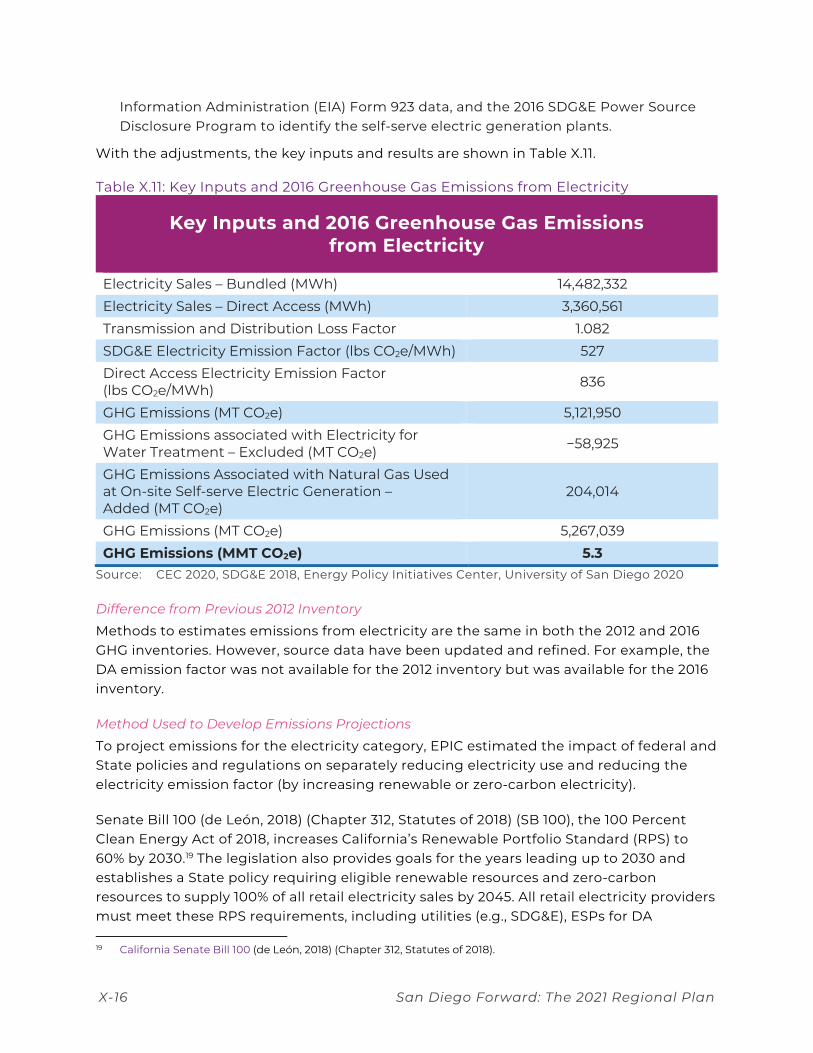
With the adjustments, the key inputs and results are shown in Table X.11.
Table X.11: Key Inputs and 2016 Greenhouse Gas Emissions from Electricity
Key Inputs and 2016 Greenhouse Gas Emissions from Electricity
Electricity Sales – Bundled (MWh) 14,482,332 Electricity Sales – Direct Access (MWh) 3,360,561 Transmission and Distribution Loss Factor 1.082 SDG&E Electricity Emission Factor (lbs CO2e/MWh) 527 Direct Access Electricity Emission Factor (lbs CO2e/MWh) 836
GHG Emissions (MT CO2e) 5,121,950 GHG Emissions associated with Electricity for Water Treatment – Excluded (MT CO2e) −58,925
GHG Emissions Associated with Natural Gas Used at On-site Self-serve Electric Generation – Added (MT CO2e)
204,014
GHG Emissions (MT CO2e) 5,267,039 GHG Emissions (MMT CO2e) 5.3
Source: CEC 2020, SDG&E 2018, Energy Policy Initiatives Center, University of San Diego 2020
Difference from Previous 2012 Inventory
Methods to estimates emissions from electricity are the same in both the 2012 and 2016 GHG inventories. However, source data have been updated and refined. For example, the DA emission factor was not available for the 2012 inventory but was available for the 2016 inventory.
Method Used to Develop Emissions Projections
To project emissions for the electricity category, EPIC estimated the impact of federal and State policies and regulations on separately reducing electricity use and reducing the electricity emission factor (by increasing renewable or zero-carbon electricity).
Senate Bill 100 (de León, 2018) (Chapter 312, Statutes of 2018) (SB 100), the 100 Percent Clean Energy Act of 2018, increases California’s Renewable Portfolio Standard (RPS) to 60% by 2030.19 The legislation also provides goals for the years leading up to 2030 and establishes a State policy requiring eligible renewable resources and zero-carbon resources to supply 100% of all retail electricity sales by 2045. All retail electricity providers must meet these RPS requirements, including utilities (e.g., SDG&E), ESPs for DA
19 California Senate Bill 100 (de León, 2018) (Chapter 312, Statutes of 2018).
San Diego Forward: The 2021 Regional Plan X-17
customers, and other local renewable programs (e.g., Community Choice Energy programs). EPIC assumed that all retail electricity providers will meet the 2030 and 2045 SB 100 targets.
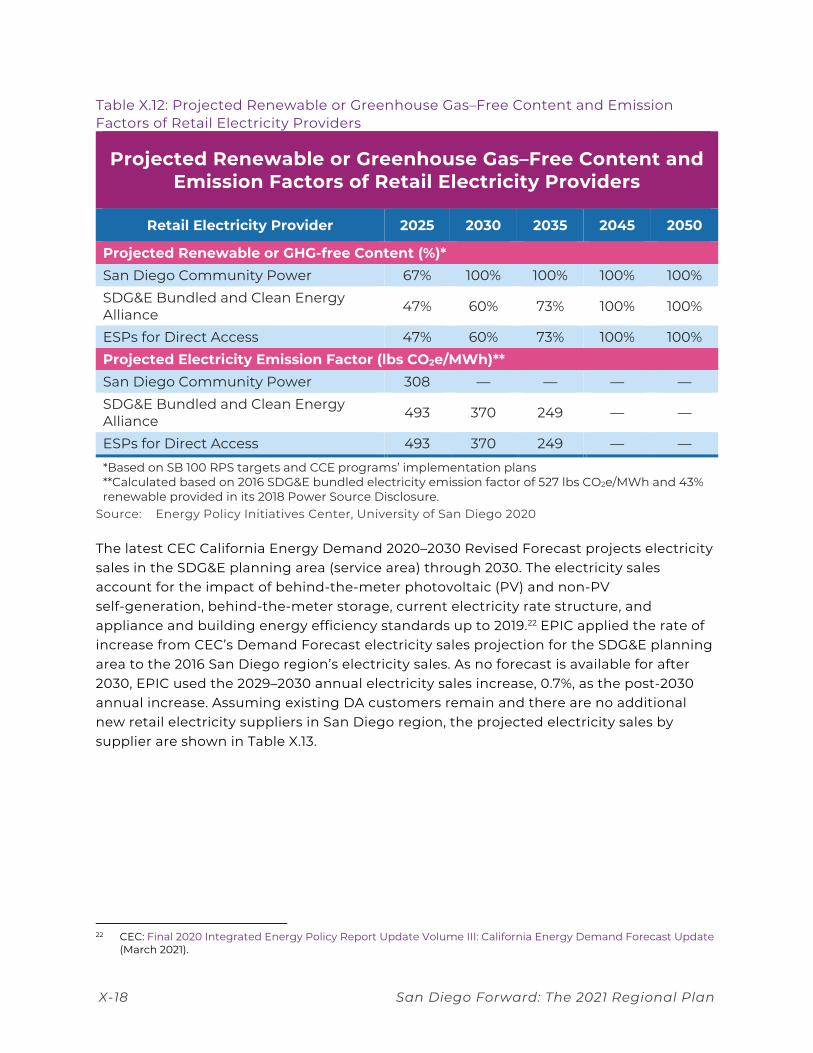
In addition, San Diego Community Power (SDCP), a Community Choice Energy (CCE) program formed by the cities of Chula Vista, Encinitas, Imperial Beach, La Mesa, and San Diego, started delivering power in March 2021. SDCP plans to start with 55% GHG-free electricity in 2021 and to supply 100% renewable electricity by 2030 or 2035.20 Because SDCP will be operational by time the 2021 Regional Plan is adopted, the impact of SDCP delivering GHG-free electricity above the 2030 RPS target is included in the emissions projection. Another CCE program, Clean Energy Alliance (CEA), formed by the cities of Carlsbad, Del Mar, and Solana Beach, started delivering power in May 2021. Because the planned renewable content in CEA’s electricity supply is consistent with the RPS target, 60% renewable by 2030, the impact of the CEA is not shown separately.21 The projected renewable or GHG-free content and electricity emission factors for each supplier are shown in Table X.12.
20 SDCP: Community Choice Aggregation Implementation Plan and Statement of Intent (2019), accessed
August 4, 2020. SDCP: Board of Directors Meeting, May 28, 2020, SDCP Renewable and GHG-Free Targets, accessed August 4, 2020.
21 CEA: Community Choice Aggregation Implementation Plan and Statement of Intent (2019), accessed December 22, 2020.
X-18 San Diego Forward: The 2021 Regional Plan
Table X.12: Projected Renewable or Greenhouse Gas–Free Content and Emission Factors of Retail Electricity Providers
Projected Renewable or Greenhouse Gas–Free Content and Emission Factors of Retail Electricity Providers
Retail Electricity Provider 2025 2030 2035 2045 2050
Projected Renewable or GHG-free Content (%)* San Diego Community Power 67% 100% 100% 100% 100% SDG&E Bundled and Clean Energy Alliance 47% 60% 73% 100% 100%
ESPs for Direct Access 47% 60% 73% 100% 100% Projected Electricity Emission Factor (lbs CO2e/MWh)** San Diego Community Power 308 — — — — SDG&E Bundled and Clean Energy Alliance 493 370 249 — —
ESPs for Direct Access 493 370 249 — —
*Based on SB 100 RPS targets and CCE programs’ implementation plans **Calculated based on 2016 SDG&E bundled electricity emission factor of 527 lbs CO2e/MWh and 43% renewable provided in its 2018 Power Source Disclosure.
Source: Energy Policy Initiatives Center, University of San Diego 2020
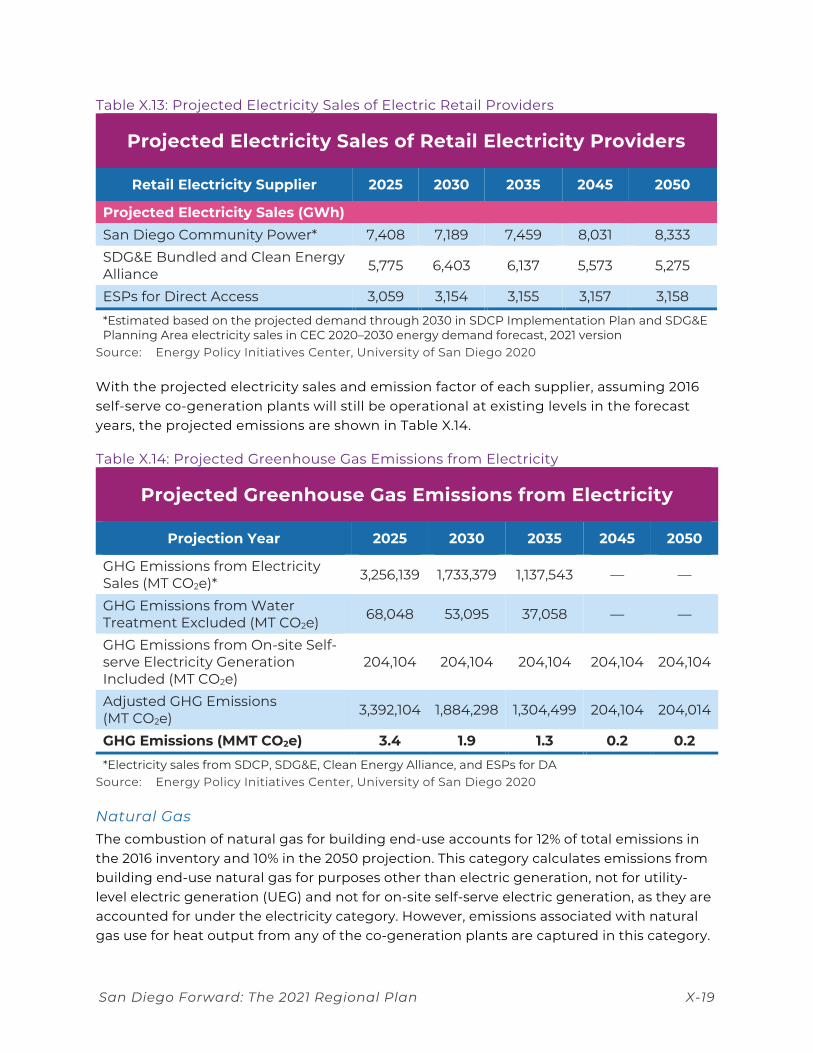
The latest CEC California Energy Demand 2020–2030 Revised Forecast projects electricity sales in the SDG&E planning area (service area) through 2030. The electricity sales account for the impact of behind-the-meter photovoltaic (PV) and non-PV self-generation, behind-the-meter storage, current electricity rate structure, and appliance and building energy efficiency standards up to 2019.22 EPIC applied the rate of increase from CEC’s Demand Forecast electricity sales projection for the SDG&E planning area to the 2016 San Diego region’s electricity sales. As no forecast is available for after 2030, EPIC used the 2029–2030 annual electricity sales increase, 0.7%, as the post-2030 annual increase. Assuming existing DA customers remain and there are no additional new retail electricity suppliers in San Diego region, the projected electricity sales by supplier are shown in Table X.13.
22 CEC: Final 2020 Integrated Energy Policy Report Update Volume III: California Energy Demand Forecast Update
(March 2021).
San Diego Forward: The 2021 Regional Plan X-19
Table X.13: Projected Electricity Sales of Electric Retail Providers
Projected Electricity Sales of Retail Electricity Providers
Retail Electricity Supplier 2025 2030 2035 2045 2050
Projected Electricity Sales (GWh) San Diego Community Power* 7,408 7,189 7,459 8,031 8,333 SDG&E Bundled and Clean Energy Alliance 5,775 6,403 6,137 5,573 5,275
ESPs for Direct Access 3,059 3,154 3,155 3,157 3,158
*Estimated based on the projected demand through 2030 in SDCP Implementation Plan and SDG&E Planning Area electricity sales in CEC 2020–2030 energy demand forecast, 2021 version
Source: Energy Policy Initiatives Center, University of San Diego 2020
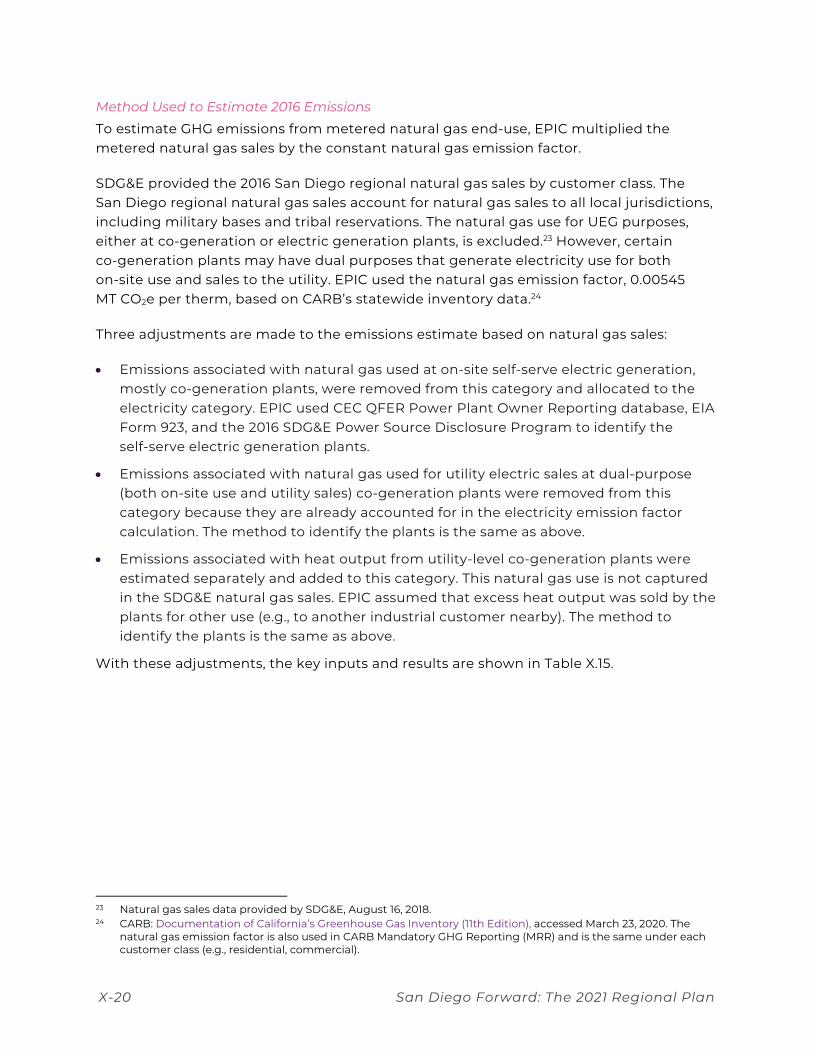
With the projected electricity sales and emission factor of each supplier, assuming 2016 self-serve co-generation plants will still be operational at existing levels in the forecast years, the projected emissions are shown in Table X.14.
Table X.14: Projected Greenhouse Gas Emissions from Electricity
Projected Greenhouse Gas Emissions from Electricity
Projection Year 2025 2030 2035 2045 2050
GHG Emissions from Electricity Sales (MT CO2e)* 3,256,139 1,733,379 1,137,543 — —
GHG Emissions from Water Treatment Excluded (MT CO2e) 68,048 53,095 37,058 — —
GHG Emissions from On-site Self-serve Electricity Generation Included (MT CO2e)
204,104 204,104 204,104 204,104 204,104
Adjusted GHG Emissions (MT CO2e) 3,392,104 1,884,298 1,304,499 204,104 204,014
GHG Emissions (MMT CO2e) 3.4 1.9 1.3 0.2 0.2
*Electricity sales from SDCP, SDG&E, Clean Energy Alliance, and ESPs for DA Source: Energy Policy Initiatives Center, University of San Diego 2020
Natural Gas The combustion of natural gas for building end-use accounts for 12% of total emissions in the 2016 inventory and 10% in the 2050 projection. This category calculates emissions from building end-use natural gas for purposes other than electric generation, not for utility-level electric generation (UEG) and not for on-site self-serve electric generation, as they are accounted for under the electricity category. However, emissions associated with natural gas use for heat output from any of the co-generation plants are captured in this category.
X-20 San Diego Forward: The 2021 Regional Plan
Method Used to Estimate 2016 Emissions
To estimate GHG emissions from metered natural gas end-use, EPIC multiplied the metered natural gas sales by the constant natural gas emission factor.
SDG&E provided the 2016 San Diego regional natural gas sales by customer class. The San Diego regional natural gas sales account for natural gas sales to all local jurisdictions, including military bases and tribal reservations. The natural gas use for UEG purposes, either at co-generation or electric generation plants, is excluded.23 However, certain co-generation plants may have dual purposes that generate electricity use for both on-site use and sales to the utility. EPIC used the natural gas emission factor, 0.00545 MT CO2e per therm, based on CARB’s statewide inventory data.24
Three adjustments are made to the emissions estimate based on natural gas sales:
• Emissions associated with natural gas used at on-site self-serve electric generation, mostly co-generation plants, were removed from this category and allocated to the electricity category. EPIC used CEC QFER Power Plant Owner Reporting database, EIA Form 923, and the 2016 SDG&E Power Source Disclosure Program to identify the self-serve electric generation plants.
• Emissions associated with natural gas used for utility electric sales at dual-purpose (both on-site use and utility sales) co-generation plants were removed from this category because they are already accounted for in the electricity emission factor calculation. The method to identify the plants is the same as above.
• Emissions associated with heat output from utility-level co-generation plants were estimated separately and added to this category. This natural gas use is not captured in the SDG&E natural gas sales. EPIC assumed that excess heat output was sold by the plants for other use (e.g., to another industrial customer nearby). The method to identify the plants is the same as above.
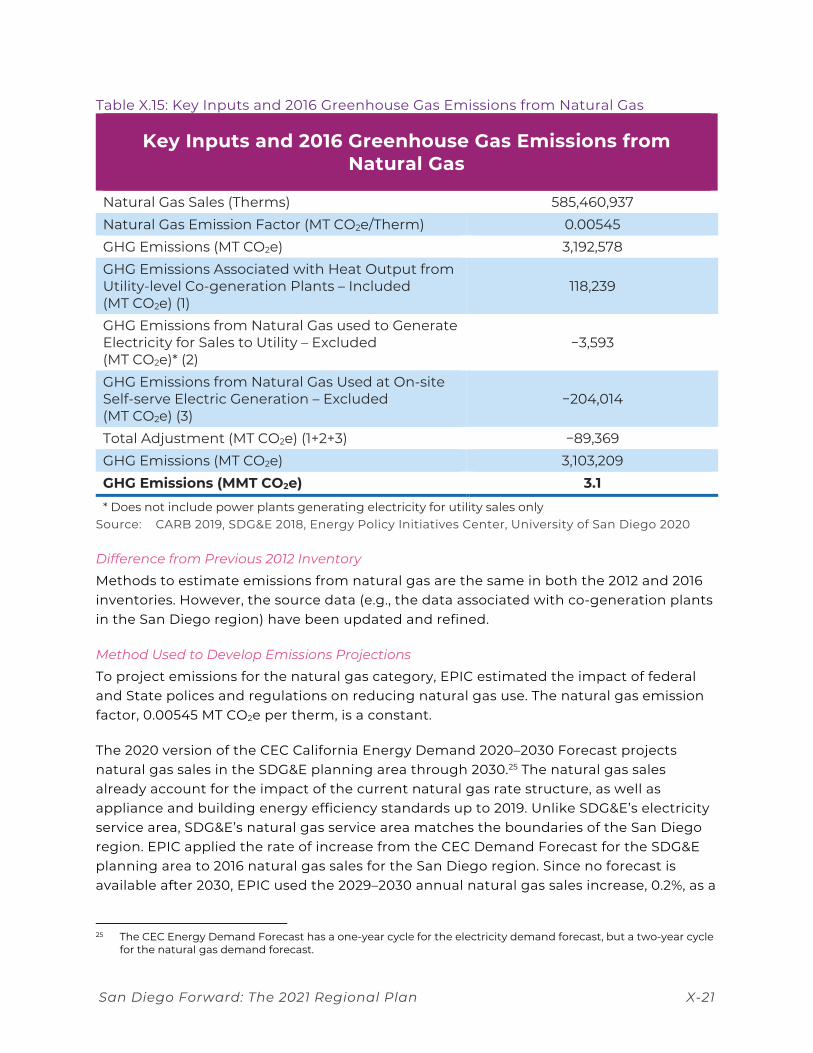
With these adjustments, the key inputs and results are shown in Table X.15.
23 Natural gas sales data provided by SDG&E, August 16, 2018. 24 CARB: Documentation of California’s Greenhouse Gas Inventory (11th Edition), accessed March 23, 2020. The
natural gas emission factor is also used in CARB Mandatory GHG Reporting (MRR) and is the same under each customer class (e.g., residential, commercial).
San Diego Forward: The 2021 Regional Plan X-21
Table X.15: Key Inputs and 2016 Greenhouse Gas Emissions from Natural Gas
Key Inputs and 2016 Greenhouse Gas Emissions from Natural Gas
Natural Gas Sales (Therms) 585,460,937 Natural Gas Emission Factor (MT CO2e/Therm) 0.00545 GHG Emissions (MT CO2e) 3,192,578 GHG Emissions Associated with Heat Output from Utility-level Co-generation Plants – Included (MT CO2e) (1)
118,239
GHG Emissions from Natural Gas used to Generate Electricity for Sales to Utility – Excluded (MT CO2e)* (2)
−3,593
GHG Emissions from Natural Gas Used at On-site Self-serve Electric Generation – Excluded (MT CO2e) (3)
−204,014
Total Adjustment (MT CO2e) (1+2+3) −89,369 GHG Emissions (MT CO2e) 3,103,209 GHG Emissions (MMT CO2e) 3.1 * Does not include power plants generating electricity for utility sales only
Source: CARB 2019, SDG&E 2018, Energy Policy Initiatives Center, University of San Diego 2020
Difference from Previous 2012 Inventory
Methods to estimate emissions from natural gas are the same in both the 2012 and 2016 inventories. However, the source data (e.g., the data associated with co-generation plants in the San Diego region) have been updated and refined.
Method Used to Develop Emissions Projections
To project emissions for the natural gas category, EPIC estimated the impact of federal and State polices and regulations on reducing natural gas use. The natural gas emission factor, 0.00545 MT CO2e per therm, is a constant.
The 2020 version of the CEC California Energy Demand 2020–2030 Forecast projects natural gas sales in the SDG&E planning area through 2030.25 The natural gas sales already account for the impact of the current natural gas rate structure, as well as appliance and building energy efficiency standards up to 2019. Unlike SDG&E’s electricity service area, SDG&E’s natural gas service area matches the boundaries of the San Diego region. EPIC applied the rate of increase from the CEC Demand Forecast for the SDG&E planning area to 2016 natural gas sales for the San Diego region. Since no forecast is available after 2030, EPIC used the 2029–2030 annual natural gas sales increase, 0.2%, as a
25 The CEC Energy Demand Forecast has a one-year cycle for the electricity demand forecast, but a two-year cycle
for the natural gas demand forecast.
X-22 San Diego Forward: The 2021 Regional Plan
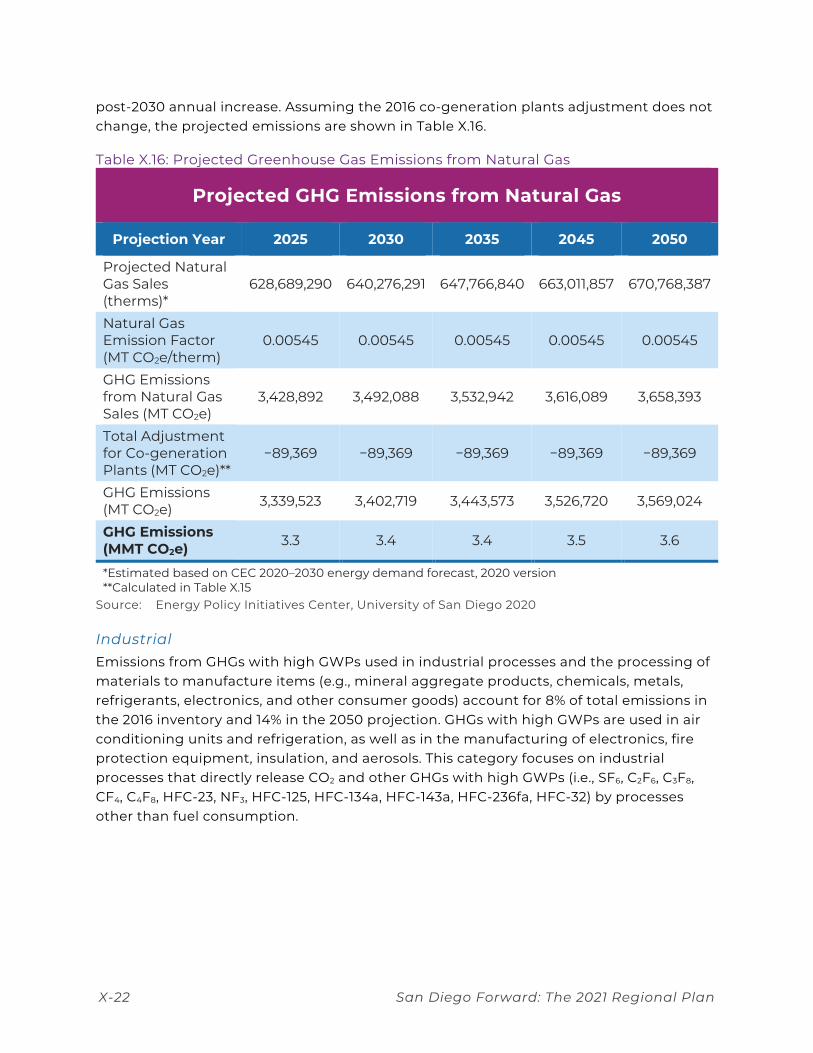
post-2030 annual increase. Assuming the 2016 co-generation plants adjustment does not change, the projected emissions are shown in Table X.16.
Table X.16: Projected Greenhouse Gas Emissions from Natural Gas
Projected GHG Emissions from Natural Gas
Projection Year 2025 2030 2035 2045 2050
Projected Natural Gas Sales (therms)*
628,689,290 640,276,291 647,766,840 663,011,857 670,768,387
Natural Gas Emission Factor (MT CO2e/therm)
0.00545 0.00545 0.00545 0.00545 0.00545
GHG Emissions from Natural Gas Sales (MT CO2e)
3,428,892 3,492,088 3,532,942 3,616,089 3,658,393
Total Adjustment for Co-generation Plants (MT CO2e)**
−89,369 −89,369 −89,369 −89,369 −89,369
GHG Emissions (MT CO2e) 3,339,523 3,402,719 3,443,573 3,526,720 3,569,024
GHG Emissions (MMT CO2e) 3.3 3.4 3.4 3.5 3.6
*Estimated based on CEC 2020–2030 energy demand forecast, 2020 version **Calculated in Table X.15
Source: Energy Policy Initiatives Center, University of San Diego 2020
Industrial Emissions from GHGs with high GWPs used in industrial processes and the processing of materials to manufacture items (e.g., mineral aggregate products, chemicals, metals, refrigerants, electronics, and other consumer goods) account for 8% of total emissions in the 2016 inventory and 14% in the 2050 projection. GHGs with high GWPs are used in air conditioning units and refrigeration, as well as in the manufacturing of electronics, fire protection equipment, insulation, and aerosols. This category focuses on industrial processes that directly release CO2 and other GHGs with high GWPs (i.e., SF6, C2F6, C3F8, CF4, C4F8, HFC-23, NF3, HFC-125, HFC-134a, HFC-143a, HFC-236fa, HFC-32) by processes other than fuel consumption.
San Diego Forward: The 2021 Regional Plan X-23
Method Used to Estimate 2016 Emissions
Similar to the method used in the other fuels category, EPIC scaled down the industrial emissions in the CARB statewide GHG inventory to the San Diego region based on the San Diego region to State ratio relevant to each economic sector.26
The following are the IPCC category numbers, subcategory numbers, headings, codes, and fuel types used within each type of activity in the statewide inventory. Only those categories, subcategories, activities, and fuel types causing emissions in the San Diego region are shown:
• 2D1: Industrial Lubricant Use
o Not Specified Industrial > Fuel consumption – Lubricants > CO2
o Not Specified Transportation > Fuel consumption – Lubricants > CO2
• 2D3: Industrial Solvent Use
o Solvents & Chemicals: Evaporative losses: Fugitives > Fugitive emissions > CO2
• 2E: Electronic Industry
o Manufacturing: Electric & Electronic Equip.: Semiconductors & Related Products > Semiconductor manufacture > C2F6
o Manufacturing: Electric & Electronic Equip.: Semiconductors & Related Products > Semiconductor manufacture > C3F8
o Manufacturing: Electric & Electronic Equip.: Semiconductors & Related Products > Semiconductor manufacture > C4F8
o Manufacturing: Electric & Electronic Equip.: Semiconductors & Related Products > Semiconductor manufacture > CF4
o Manufacturing: Electric & Electronic Equip.: Semiconductors & Related Products > Semiconductor manufacture > HFC-23
o Manufacturing: Electric & Electronic Equip.: Semiconductors & Related Products > Semiconductor manufacture > NF3
o Manufacturing: Electric & Electronic Equip.: Semiconductors & Related Products > Semiconductor manufacture > SF6
• 2F: Product Uses as – Not Specified Commercial
o Use of substitutes for ozone depleting substances > CF4
o Use of substitutes for ozone depleting substances > HFC-125
o Use of substitutes for ozone depleting substances > HFC-134a
o Use of substitutes for ozone depleting substances > HFC-143a
26 CARB: CARB Greenhouse Gas Emission Inventory – Query Tool for years 2000 to 2017 (12th edition), accessed on
June 5, 2020.
X-24 San Diego Forward: The 2021 Regional Plan
o Use of substitutes for ozone depleting substances > HFC-236fa
o Use of substitutes for ozone depleting substances > HFC-32
o Use of substitutes for ozone depleting substances > Other ODS substitutes
• 2G1b: Other Industrial Product – Electrical
o Imported Electricity: Transmission and Distribution > Electricity transmitted > SF6
o In State Generation: Transmission and Distribution > Electricity transmitted > SF6
• 2G4: Other Industrial Product – CO2, Limestone
o Not Specified Industrial > CO2 consumption > CO2
o Not Specified Industrial > Limestone and dolomite consumption > CO2
o Not Specified Industrial > Soda ash consumption > CO2
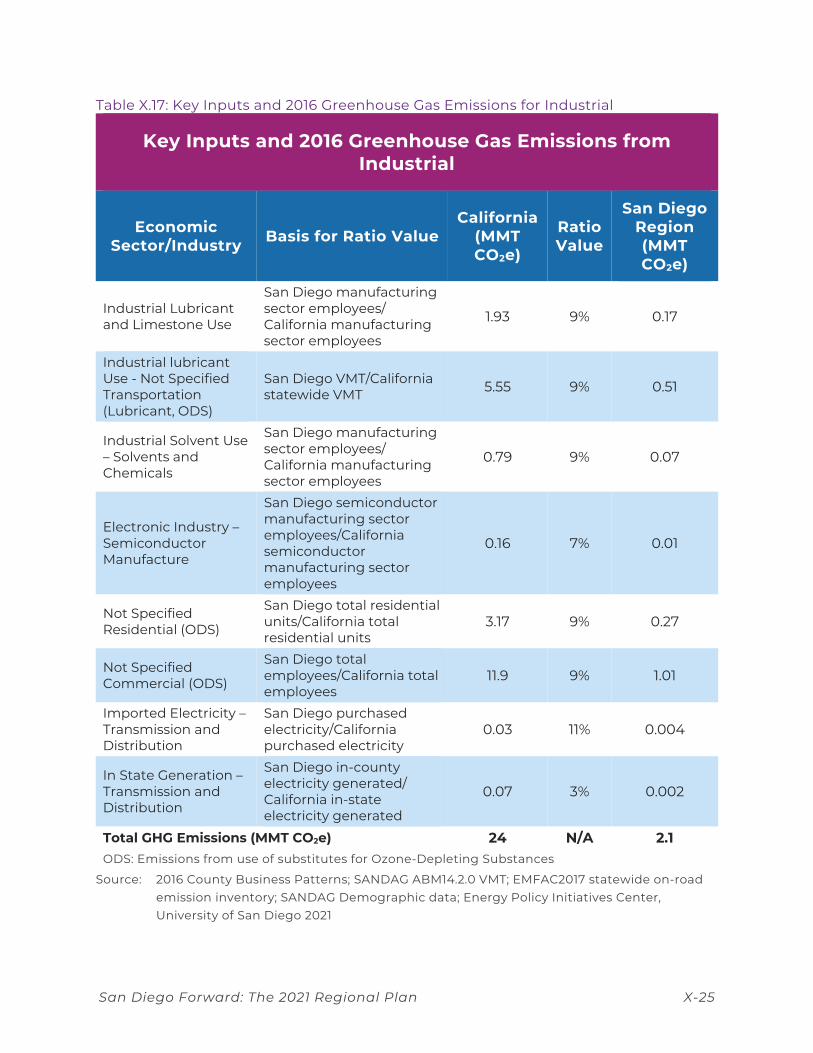
EPIC used different ratios to scale down the activities above to the San Diego region. Table X.17 shows the ratios used and their values in 2016.
San Diego Forward: The 2021 Regional Plan X-25
Table X.17: Key Inputs and 2016 Greenhouse Gas Emissions for Industrial
Key Inputs and 2016 Greenhouse Gas Emissions from Industrial
Economic Sector/Industry Basis for Ratio Value
California (MMT CO2e)
Ratio Value
San Diego Region (MMT CO2e)
Industrial Lubricant and Limestone Use
San Diego manufacturing sector employees/ California manufacturing sector employees
1.93 9% 0.17
Industrial lubricant Use - Not Specified Transportation (Lubricant, ODS)
San Diego VMT/California statewide VMT 5.55 9% 0.51
Industrial Solvent Use – Solvents and Chemicals
San Diego manufacturing sector employees/ California manufacturing sector employees
0.79 9% 0.07
Electronic Industry – Semiconductor Manufacture
San Diego semiconductor manufacturing sector employees/California semiconductor manufacturing sector employees
0.16 7% 0.01
Not Specified Residential (ODS)
San Diego total residential units/California total residential units
3.17 9% 0.27
Not Specified Commercial (ODS)
San Diego total employees/California total employees
11.9 9% 1.01
Imported Electricity – Transmission and Distribution
San Diego purchased electricity/California purchased electricity
0.03 11% 0.004
In State Generation – Transmission and Distribution
San Diego in-county electricity generated/ California in-state electricity generated
0.07 3% 0.002
Total GHG Emissions (MMT CO2e) 24 N/A 2.1 ODS: Emissions from use of substitutes for Ozone-Depleting Substances
Source: 2016 County Business Patterns; SANDAG ABM14.2.0 VMT; EMFAC2017 statewide on-road emission inventory; SANDAG Demographic data; Energy Policy Initiatives Center, University of San Diego 2021
X-26 San Diego Forward: The 2021 Regional Plan
Emissions from the following categories were included in CARB’s statewide inventory but not in the 2016 regional inventory because Economic Census data indicated no economic activity in the San Diego region.27 The categories are:
• 2A1: Manufacturing: Stone, Clay, Glass, and Cement: Cement > Clinker Production> CO2
• 2A2: Manufacturing: Stone, Clay, Glass, and Cement: Lime > Lime Production> CO2
• 2B2: Manufacturing: Chemical and Allied Products: Nitric Acid > Nitric Acid Production > N2O
• 2H3: Petroleum Refining: Transformation > Fuel Consumption > CO2
Difference from Previous 2012 Inventory
Methods to estimates emissions from the Industrial sector are the same in both the 2012 and 2016 inventories.
Similar to the other fuels category, there are no empirical data for industrial activities in San Diego region. For the 2016 inventory, EPIC used the same methodology as the 2012 inventory. However, refinements were made on the downscaling ratios. For industrial (not specified) lubricant use, the 2012 inventory used the VMT ratio. In the 2012 inventory, the emissions, due to use of substitutes for Ozone-Depleting Substances (ODS), were a single category and were scaled down based on the population ratio. For the 2016 inventory, EPIC used CARB’s categories and categorized these emissions into not-specified transportation, not-specified commercial, and not-specified residential sectors. The ratios to scale down these emissions were discussed in the previous section. For the emissions due to soda ash and limestone consumption, which is a not-specified industrial activity, EPIC used the ratio of the manufacturing sector employees instead of the ratio of population used in the 2012 inventory.
Method Used to Develop Emissions Projections
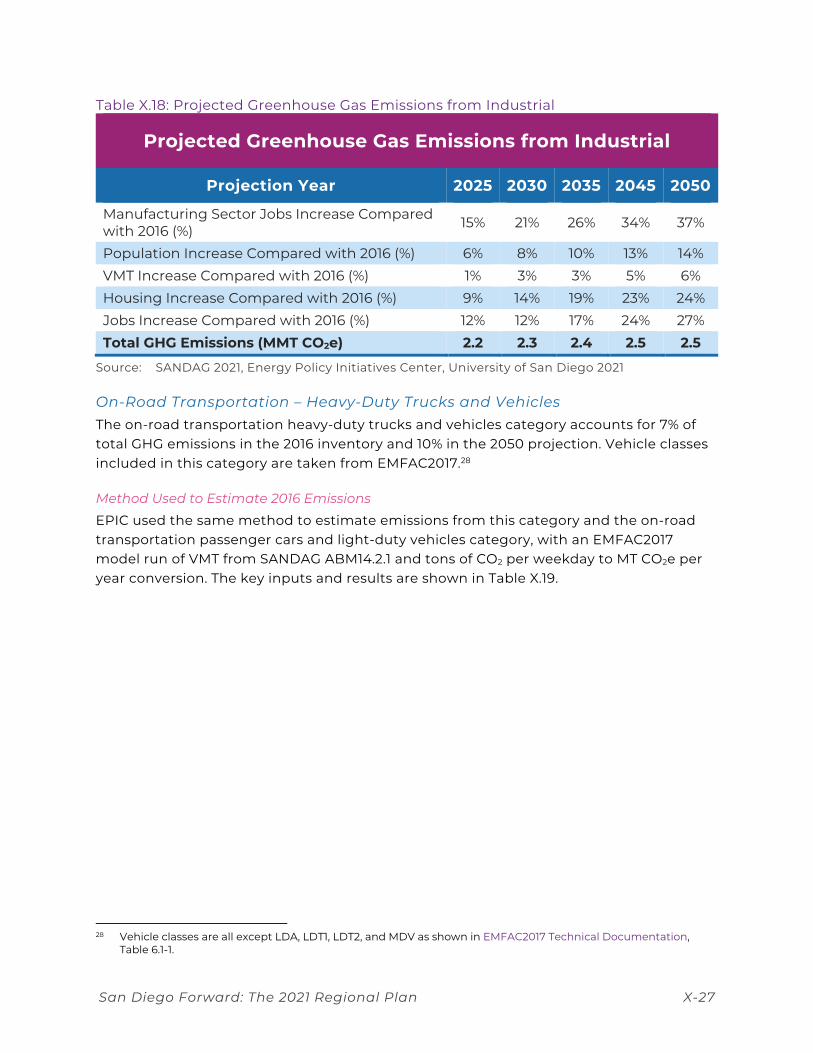
EPIC projected emissions for the Industrial sector are based on the San Diego regional population, housing, jobs, and VMT projections. Each specific industry is projected separately based on the type of activity as shown in Table X.17. For example, the emissions from transportation lubricants use were projected based on San Diego regional VMT forecast and the emissions from solvents and chemicals were projected based on the San Diego regional manufacturing jobs forecast. The projected emissions are shown in Table X.18.
27 Confirmed by San Diego Economic Development Corporation research team, personal communication.
San Diego Forward: The 2021 Regional Plan X-27
Table X.18: Projected Greenhouse Gas Emissions from Industrial
Projected Greenhouse Gas Emissions from Industrial
Projection Year 2025 2030 2035 2045 2050
Manufacturing Sector Jobs Increase Compared with 2016 (%) 15% 21% 26% 34% 37%
Population Increase Compared with 2016 (%) 6% 8% 10% 13% 14% VMT Increase Compared with 2016 (%) 1% 3% 3% 5% 6% Housing Increase Compared with 2016 (%) 9% 14% 19% 23% 24% Jobs Increase Compared with 2016 (%) 12% 12% 17% 24% 27% Total GHG Emissions (MMT CO2e) 2.2 2.3 2.4 2.5 2.5
Source: SANDAG 2021, Energy Policy Initiatives Center, University of San Diego 2021
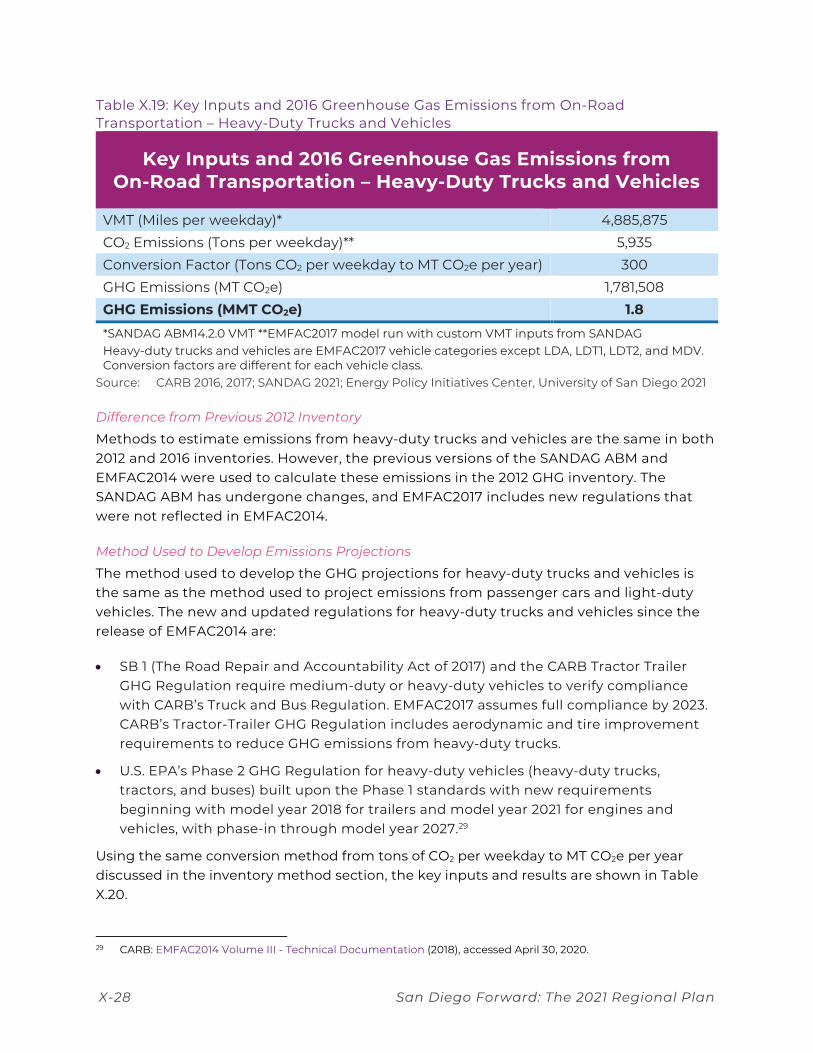
On-Road Transportation – Heavy-Duty Trucks and Vehicles The on-road transportation heavy-duty trucks and vehicles category accounts for 7% of total GHG emissions in the 2016 inventory and 10% in the 2050 projection. Vehicle classes included in this category are taken from EMFAC2017.28
Method Used to Estimate 2016 Emissions
EPIC used the same method to estimate emissions from this category and the on-road transportation passenger cars and light-duty vehicles category, with an EMFAC2017 model run of VMT from SANDAG ABM14.2.1 and tons of CO2 per weekday to MT CO2e per year conversion. The key inputs and results are shown in Table X.19.
28 Vehicle classes are all except LDA, LDT1, LDT2, and MDV as shown in EMFAC2017 Technical Documentation,
Table 6.1-1.
X-28 San Diego Forward: The 2021 Regional Plan
Table X.19: Key Inputs and 2016 Greenhouse Gas Emissions from On-Road Transportation – Heavy-Duty Trucks and Vehicles
Key Inputs and 2016 Greenhouse Gas Emissions from On-Road Transportation – Heavy-Duty Trucks and Vehicles
VMT (Miles per weekday)* 4,885,875 CO2 Emissions (Tons per weekday)** 5,935 Conversion Factor (Tons CO2 per weekday to MT CO2e per year) 300 GHG Emissions (MT CO2e) 1,781,508 GHG Emissions (MMT CO2e) 1.8 *SANDAG ABM14.2.0 VMT **EMFAC2017 model run with custom VMT inputs from SANDAG Heavy-duty trucks and vehicles are EMFAC2017 vehicle categories except LDA, LDT1, LDT2, and MDV. Conversion factors are different for each vehicle class.
Source: CARB 2016, 2017; SANDAG 2021; Energy Policy Initiatives Center, University of San Diego 2021
Difference from Previous 2012 Inventory
Methods to estimate emissions from heavy-duty trucks and vehicles are the same in both 2012 and 2016 inventories. However, the previous versions of the SANDAG ABM and EMFAC2014 were used to calculate these emissions in the 2012 GHG inventory. The SANDAG ABM has undergone changes, and EMFAC2017 includes new regulations that were not reflected in EMFAC2014.
Method Used to Develop Emissions Projections
The method used to develop the GHG projections for heavy-duty trucks and vehicles is the same as the method used to project emissions from passenger cars and light-duty vehicles. The new and updated regulations for heavy-duty trucks and vehicles since the release of EMFAC2014 are:
• SB 1 (The Road Repair and Accountability Act of 2017) and the CARB Tractor Trailer GHG Regulation require medium-duty or heavy-duty vehicles to verify compliance with CARB’s Truck and Bus Regulation. EMFAC2017 assumes full compliance by 2023. CARB’s Tractor-Trailer GHG Regulation includes aerodynamic and tire improvement requirements to reduce GHG emissions from heavy-duty trucks.
• U.S. EPA’s Phase 2 GHG Regulation for heavy-duty vehicles (heavy-duty trucks, tractors, and buses) built upon the Phase 1 standards with new requirements beginning with model year 2018 for trailers and model year 2021 for engines and vehicles, with phase-in through model year 2027.29
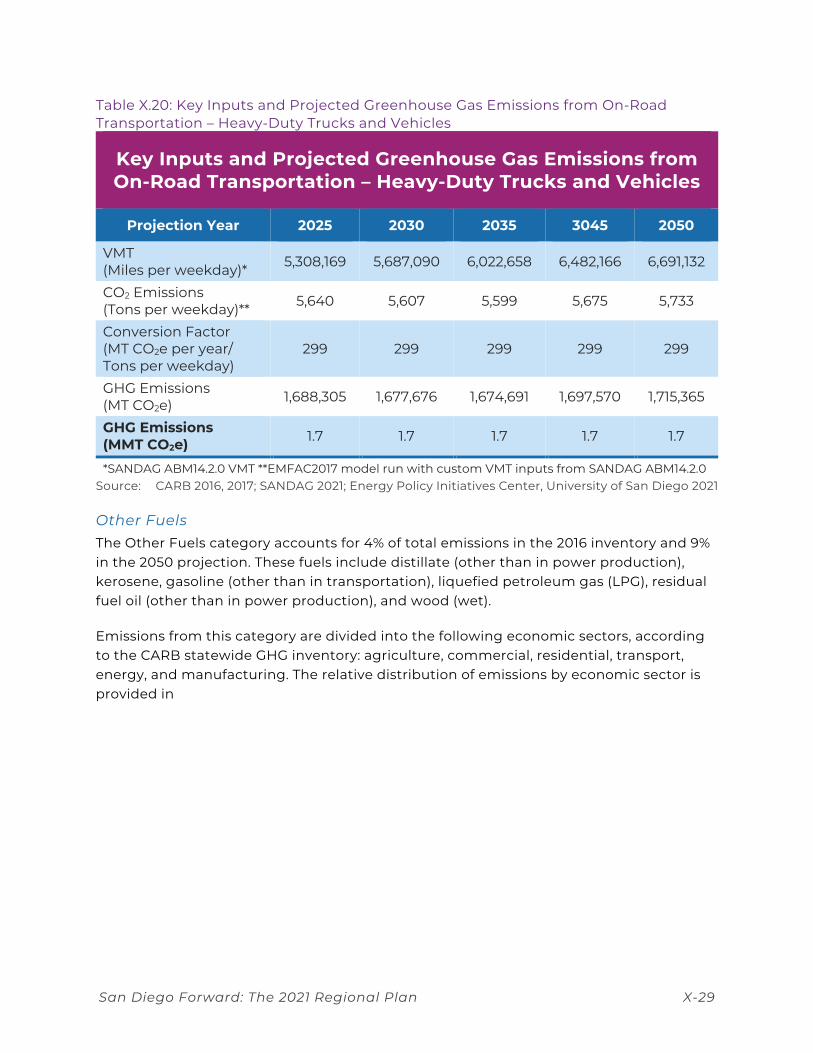
Using the same conversion method from tons of CO2 per weekday to MT CO2e per year discussed in the inventory method section, the key inputs and results are shown in Table X.20.
29 CARB: EMFAC2014 Volume III - Technical Documentation (2018), accessed April 30, 2020.
San Diego Forward: The 2021 Regional Plan X-29
Table X.20: Key Inputs and Projected Greenhouse Gas Emissions from On-Road Transportation – Heavy-Duty Trucks and Vehicles
Key Inputs and Projected Greenhouse Gas Emissions from On-Road Transportation – Heavy-Duty Trucks and Vehicles
Projection Year 2025 2030 2035 3045 2050
VMT (Miles per weekday)* 5,308,169 5,687,090 6,022,658 6,482,166 6,691,132
CO2 Emissions (Tons per weekday)** 5,640 5,607 5,599 5,675 5,733
Conversion Factor (MT CO2e per year/ Tons per weekday)
299 299 299 299 299
GHG Emissions (MT CO2e) 1,688,305 1,677,676 1,674,691 1,697,570 1,715,365
GHG Emissions (MMT CO2e) 1.7 1.7 1.7 1.7 1.7
*SANDAG ABM14.2.0 VMT **EMFAC2017 model run with custom VMT inputs from SANDAG ABM14.2.0 Source: CARB 2016, 2017; SANDAG 2021; Energy Policy Initiatives Center, University of San Diego 2021
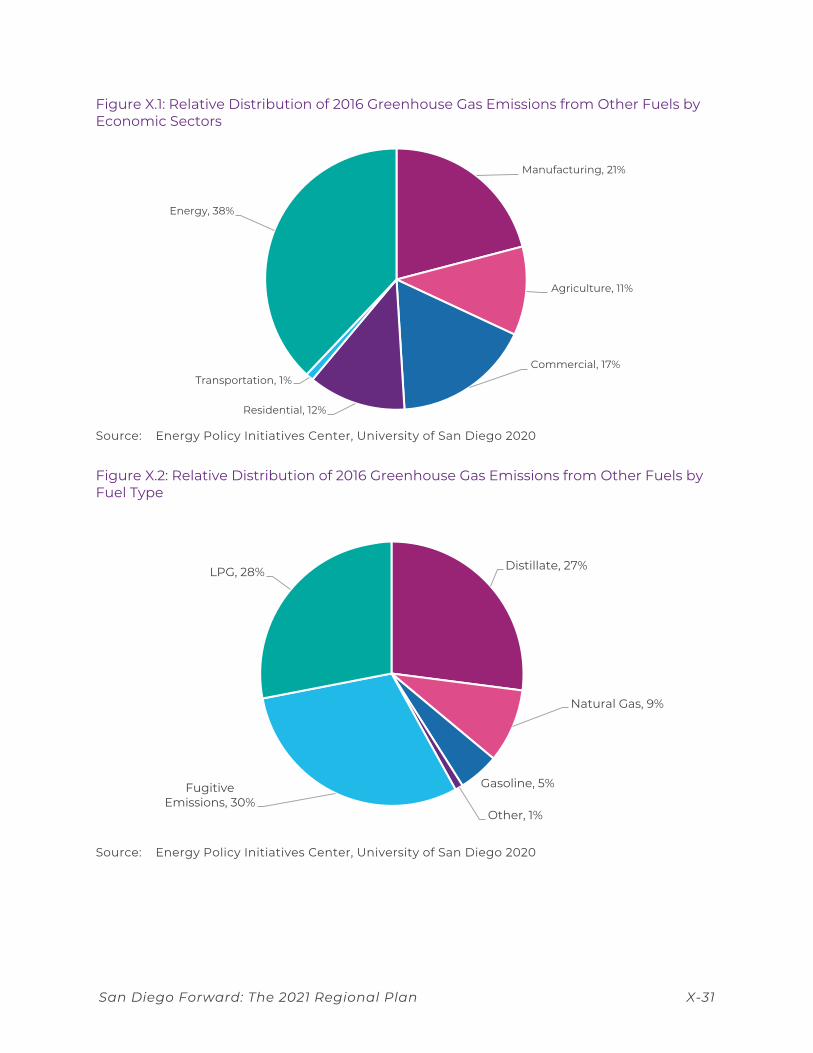
Other Fuels The Other Fuels category accounts for 4% of total emissions in the 2016 inventory and 9% in the 2050 projection. These fuels include distillate (other than in power production), kerosene, gasoline (other than in transportation), liquefied petroleum gas (LPG), residual fuel oil (other than in power production), and wood (wet).
Emissions from this category are divided into the following economic sectors, according to the CARB statewide GHG inventory: agriculture, commercial, residential, transport, energy, and manufacturing. The relative distribution of emissions by economic sector is provided in
X-30 San Diego Forward: The 2021 Regional Plan
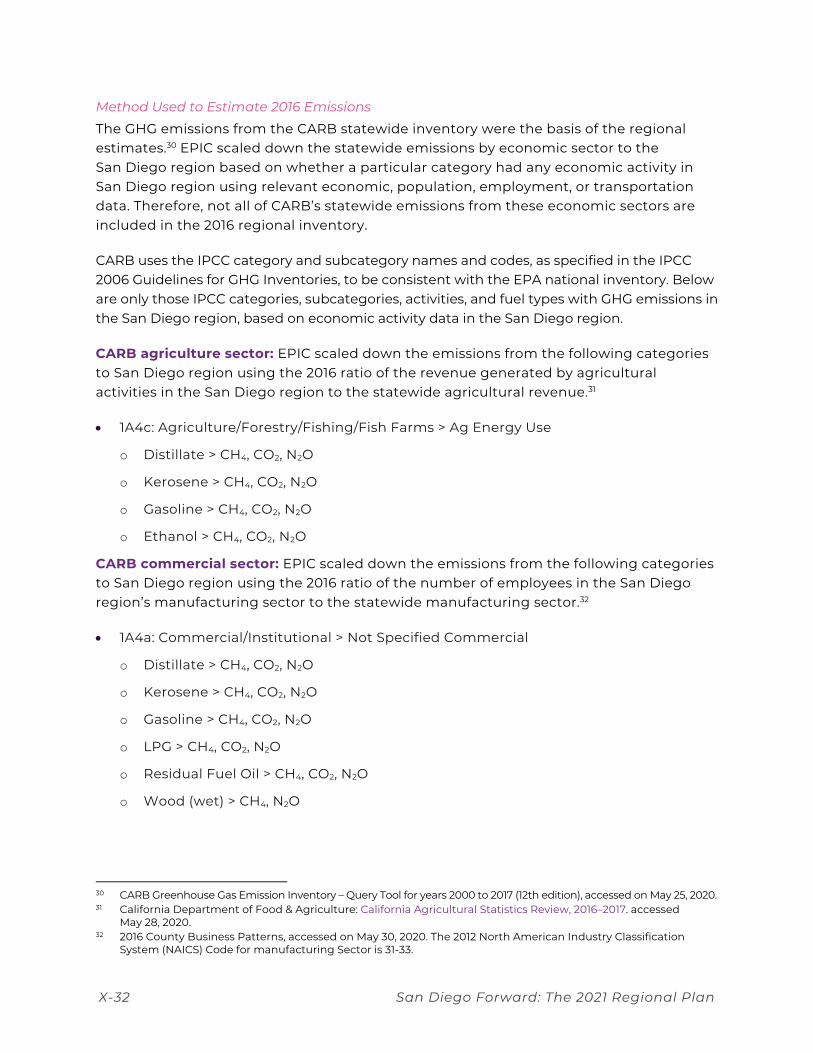
Figure X.1 and by fuel type in Figure X.2.
San Diego Forward: The 2021 Regional Plan X-31
Figure X.1: Relative Distribution of 2016 Greenhouse Gas Emissions from Other Fuels by Economic Sectors
Source: Energy Policy Initiatives Center, University of San Diego 2020
Figure X.2: Relative Distribution of 2016 Greenhouse Gas Emissions from Other Fuels by Fuel Type
Source: Energy Policy Initiatives Center, University of San Diego 2020
Manufacturing, 21%
Agriculture, 11%
Commercial, 17%
Residential, 12%
Transportation, 1%
Energy, 38%
Distillate, 27%
Natural Gas, 9%
Gasoline, 5%
Other, 1%
Fugitive Emissions, 30%
LPG, 28%
X-32 San Diego Forward: The 2021 Regional Plan
Method Used to Estimate 2016 Emissions
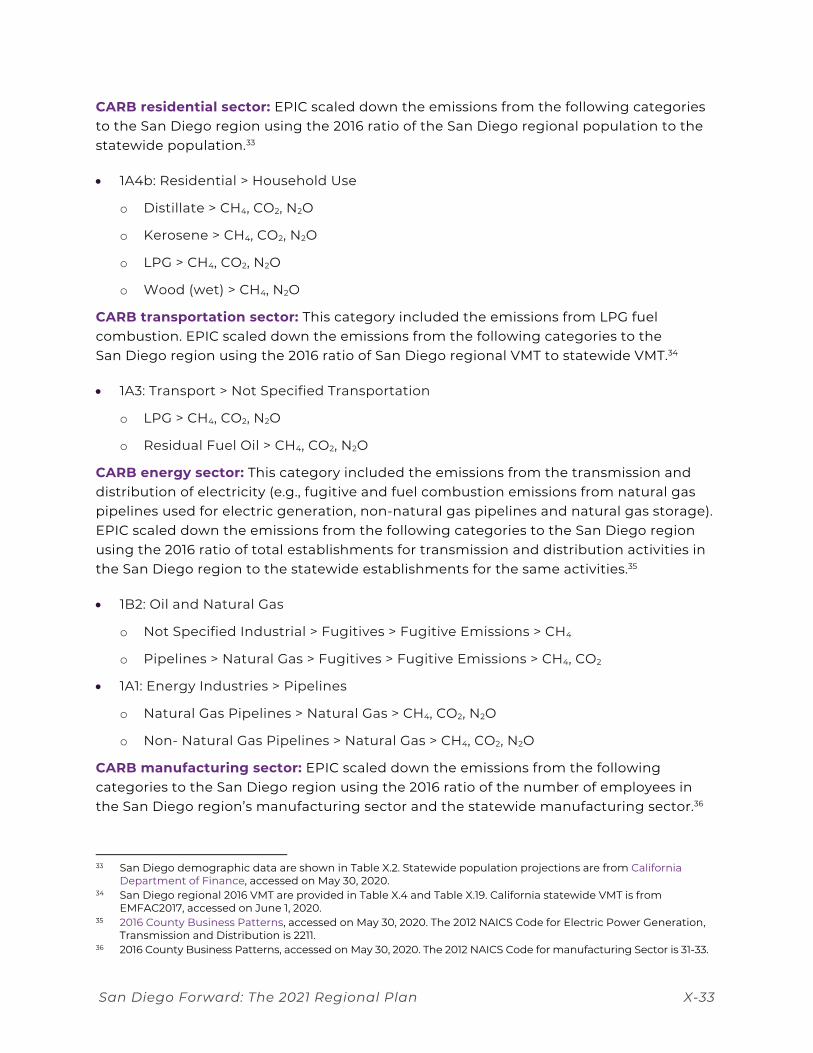
The GHG emissions from the CARB statewide inventory were the basis of the regional estimates.30 EPIC scaled down the statewide emissions by economic sector to the San Diego region based on whether a particular category had any economic activity in San Diego region using relevant economic, population, employment, or transportation data. Therefore, not all of CARB’s statewide emissions from these economic sectors are included in the 2016 regional inventory.
CARB uses the IPCC category and subcategory names and codes, as specified in the IPCC 2006 Guidelines for GHG Inventories, to be consistent with the EPA national inventory. Below are only those IPCC categories, subcategories, activities, and fuel types with GHG emissions in the San Diego region, based on economic activity data in the San Diego region.
CARB agriculture sector: EPIC scaled down the emissions from the following categories to San Diego region using the 2016 ratio of the revenue generated by agricultural activities in the San Diego region to the statewide agricultural revenue.31
• 1A4c: Agriculture/Forestry/Fishing/Fish Farms > Ag Energy Use
o Distillate > CH4, CO2, N2O
o Kerosene > CH4, CO2, N2O
o Gasoline > CH4, CO2, N2O
o Ethanol > CH4, CO2, N2O
CARB commercial sector: EPIC scaled down the emissions from the following categories to San Diego region using the 2016 ratio of the number of employees in the San Diego region’s manufacturing sector to the statewide manufacturing sector.32
• 1A4a: Commercial/Institutional > Not Specified Commercial
o Distillate > CH4, CO2, N2O
o Kerosene > CH4, CO2, N2O
o Gasoline > CH4, CO2, N2O
o LPG > CH4, CO2, N2O
o Residual Fuel Oil > CH4, CO2, N2O
o Wood (wet) > CH4, N2O
30 CARB Greenhouse Gas Emission Inventory – Query Tool for years 2000 to 2017 (12th edition), accessed on May 25, 2020. 31 California Department of Food & Agriculture: California Agricultural Statistics Review, 2016–2017. accessed
May 28, 2020. 32 2016 County Business Patterns, accessed on May 30, 2020. The 2012 North American Industry Classification
System (NAICS) Code for manufacturing Sector is 31-33.
San Diego Forward: The 2021 Regional Plan X-33
CARB residential sector: EPIC scaled down the emissions from the following categories to the San Diego region using the 2016 ratio of the San Diego regional population to the statewide population.33
• 1A4b: Residential > Household Use
o Distillate > CH4, CO2, N2O
o Kerosene > CH4, CO2, N2O
o LPG > CH4, CO2, N2O
o Wood (wet) > CH4, N2O
CARB transportation sector: This category included the emissions from LPG fuel combustion. EPIC scaled down the emissions from the following categories to the San Diego region using the 2016 ratio of San Diego regional VMT to statewide VMT.34
• 1A3: Transport > Not Specified Transportation
o LPG > CH4, CO2, N2O
o Residual Fuel Oil > CH4, CO2, N2O
CARB energy sector: This category included the emissions from the transmission and distribution of electricity (e.g., fugitive and fuel combustion emissions from natural gas pipelines used for electric generation, non-natural gas pipelines and natural gas storage). EPIC scaled down the emissions from the following categories to the San Diego region using the 2016 ratio of total establishments for transmission and distribution activities in the San Diego region to the statewide establishments for the same activities.35
• 1B2: Oil and Natural Gas
o Not Specified Industrial > Fugitives > Fugitive Emissions > CH4
o Pipelines > Natural Gas > Fugitives > Fugitive Emissions > CH4, CO2
• 1A1: Energy Industries > Pipelines
o Natural Gas Pipelines > Natural Gas > CH4, CO2, N2O
o Non- Natural Gas Pipelines > Natural Gas > CH4, CO2, N2O
CARB manufacturing sector: EPIC scaled down the emissions from the following categories to the San Diego region using the 2016 ratio of the number of employees in the San Diego region’s manufacturing sector and the statewide manufacturing sector.36
33 San Diego demographic data are shown in Table X.2. Statewide population projections are from California
Department of Finance, accessed on May 30, 2020. 34 San Diego regional 2016 VMT are provided in Table X.4 and Table X.19. California statewide VMT is from
EMFAC2017, accessed on June 1, 2020. 35 2016 County Business Patterns, accessed on May 30, 2020. The 2012 NAICS Code for Electric Power Generation,
Transmission and Distribution is 2211. 36 2016 County Business Patterns, accessed on May 30, 2020. The 2012 NAICS Code for manufacturing Sector is 31-33.
X-34 San Diego Forward: The 2021 Regional Plan
• 1A2f: Manufacturing Industries and Construction > Non-Metallic Minerals > Stone, Clay, Glass, and Cement > Cement
o Distillate > CH4, CO2, N2O
o LPG > CH4, CO2, N2O
o MSW > CH4, CO2, N2O
o Petroleum Coke > CH4, CO2, N2O
o Residual Fuel Oil > CH4, CO2, N2O
o Tires > CH4, CO2, N2O
• 1A2k: Manufacturing Industries and Construction > Construction
o Gasoline > CH4, CO2, N2O
• 1A2m: Manufacturing Industries and Construction > Non-Specified Industry
o Distillate > CH4, CO2, N2O
o Gasoline > CH4, CO2, N2O
o Kerosene > CH4, CO2, N2O
o LPG > CH4, CO2, N2O
o Petroleum Coke > CH4, CO2, N2O
o Residual Fuel Oil > CH4, CO2, N2O
• 1B2: Oil and Natural Gas > Manufacturing
o Chemicals and Allied Products > Fugitives > Fugitive Emissions > CH4
o Construction > Fugitives > Fugitive Emissions > CH4
o Electric and Electronic Equipment > Fugitives > Fugitive Emissions > CH4
o Food Products > Fugitives > Fugitive Emissions > CH4
o Fugitives > Fugitive Emissions > CH4
o Plastic and Rubber > Fugitives > Fugitive Emissions > CH4
o Primary Metals > Fugitives > Fugitive Emissions > CH4
o Pulp and Paper > Fugitives > Fugitive Emissions > CH4
o Storage Tanks > Fugitives > Fugitive Emissions > CH4
Several categories were included in CARB’s statewide inventory, but not in this 2016 regional inventory, because 2016 business patterns in data for the San Diego region indicated no economic activities under these categories. The categories are:
• 1A1b: Petroleum Refining
o Associated Gas > CH4, CO2, N2O
San Diego Forward: The 2021 Regional Plan X-35
o Catalyst Coke> CH4, CO2, N2O
o Distillate> CH4, CO2, N2O
o LPG > CH4, CO2, N2O
o Petroleum Coke > CH4, CO2, N2O
o Refinery Gas > CH4, CO2, N2O
o Residual Fuel Oil > CH4, CO2, N2O
• 1A1c: Manufacture of Solid Fuels and Other Energy Industries
o Associated Gas > CH4, CO2, N2O
o Crude Oil > CH4, CO2, N2O
o Distillate > CH4, CO2, N2O
o Residual Fuel Oil > CH4, CO2, N2O
• 1B2: Oil and Natural Gas > Manufacturing: Stone, Clay, Glass, and Cement: Fugitives > Fugitive Emissions > CH4
• 1B2a: Oil > Petroleum Refining: Process Losses: Fugitives > Fugitive Emissions > CH4
• 1B3: Other Emissions from Energy Production > In State Generation: Merchant Owned > Geothermal Power – Geothermal > CO2
• 1B3: Other Emissions from Energy Production > In State Generation: Utility Owned > Geothermal power > CO2
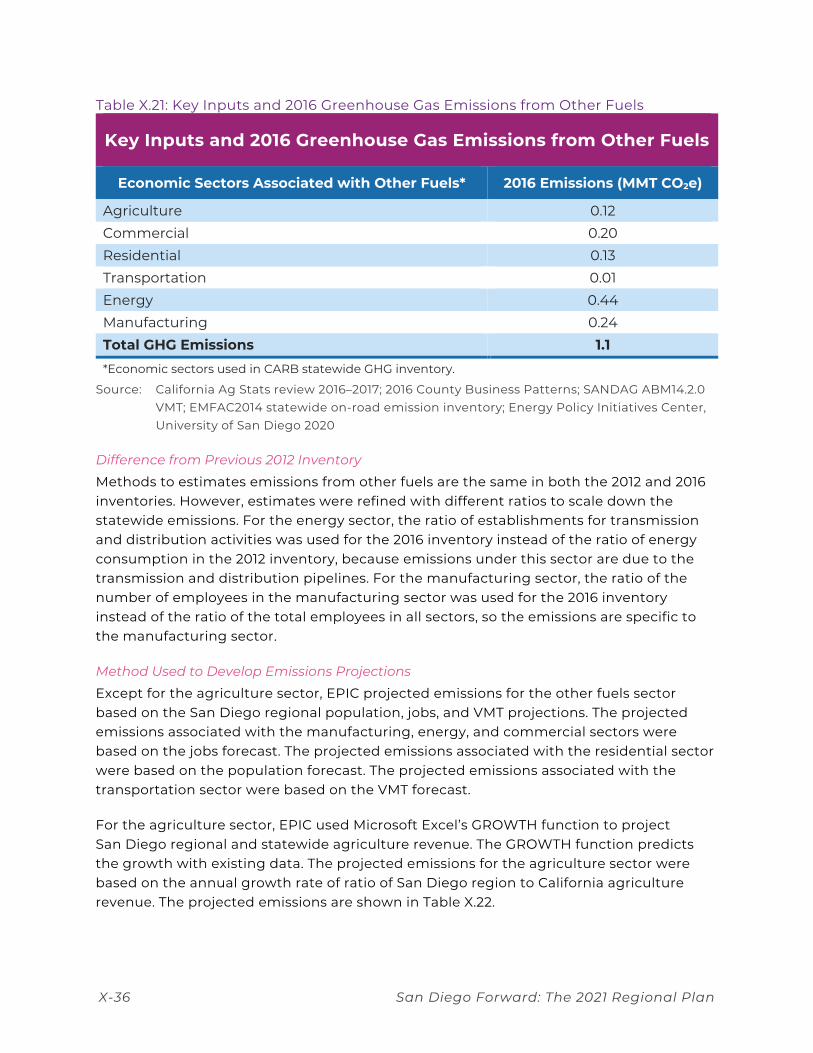
The key inputs and results are shown in Table X.21.
X-36 San Diego Forward: The 2021 Regional Plan
Table X.21: Key Inputs and 2016 Greenhouse Gas Emissions from Other Fuels
Key Inputs and 2016 Greenhouse Gas Emissions from Other Fuels
Economic Sectors Associated with Other Fuels* 2016 Emissions (MMT CO2e)
Agriculture 0.12 Commercial 0.20 Residential 0.13 Transportation 0.01 Energy 0.44 Manufacturing 0.24 Total GHG Emissions 1.1
*Economic sectors used in CARB statewide GHG inventory.
Source: California Ag Stats review 2016–2017; 2016 County Business Patterns; SANDAG ABM14.2.0 VMT; EMFAC2014 statewide on-road emission inventory; Energy Policy Initiatives Center, University of San Diego 2020
Difference from Previous 2012 Inventory
Methods to estimates emissions from other fuels are the same in both the 2012 and 2016 inventories. However, estimates were refined with different ratios to scale down the statewide emissions. For the energy sector, the ratio of establishments for transmission and distribution activities was used for the 2016 inventory instead of the ratio of energy consumption in the 2012 inventory, because emissions under this sector are due to the transmission and distribution pipelines. For the manufacturing sector, the ratio of the number of employees in the manufacturing sector was used for the 2016 inventory instead of the ratio of the total employees in all sectors, so the emissions are specific to the manufacturing sector.
Method Used to Develop Emissions Projections
Except for the agriculture sector, EPIC projected emissions for the other fuels sector based on the San Diego regional population, jobs, and VMT projections. The projected emissions associated with the manufacturing, energy, and commercial sectors were based on the jobs forecast. The projected emissions associated with the residential sector were based on the population forecast. The projected emissions associated with the transportation sector were based on the VMT forecast.
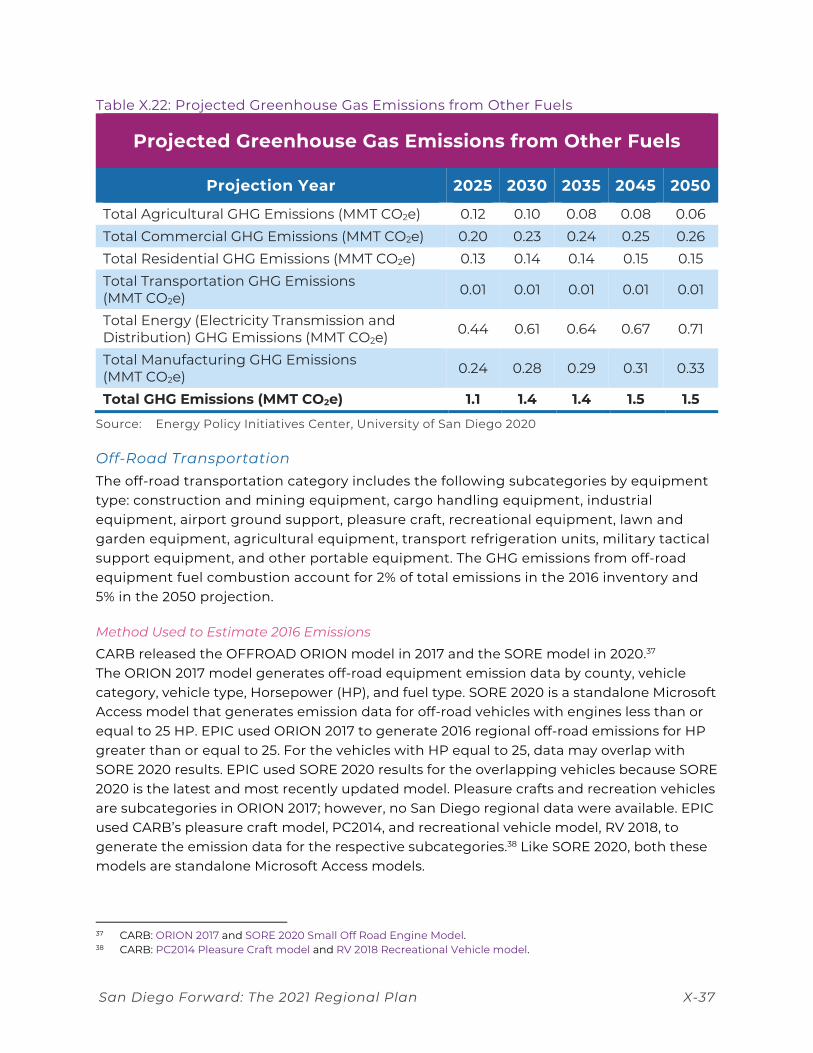
For the agriculture sector, EPIC used Microsoft Excel’s GROWTH function to project San Diego regional and statewide agriculture revenue. The GROWTH function predicts the growth with existing data. The projected emissions for the agriculture sector were based on the annual growth rate of ratio of San Diego region to California agriculture revenue. The projected emissions are shown in Table X.22.
San Diego Forward: The 2021 Regional Plan X-37
Table X.22: Projected Greenhouse Gas Emissions from Other Fuels
Projected Greenhouse Gas Emissions from Other Fuels
Projection Year 2025 2030 2035 2045 2050
Total Agricultural GHG Emissions (MMT CO2e) 0.12 0.10 0.08 0.08 0.06 Total Commercial GHG Emissions (MMT CO2e) 0.20 0.23 0.24 0.25 0.26 Total Residential GHG Emissions (MMT CO2e) 0.13 0.14 0.14 0.15 0.15 Total Transportation GHG Emissions (MMT CO2e) 0.01 0.01 0.01 0.01 0.01
Total Energy (Electricity Transmission and Distribution) GHG Emissions (MMT CO2e) 0.44 0.61 0.64 0.67 0.71
Total Manufacturing GHG Emissions (MMT CO2e) 0.24 0.28 0.29 0.31 0.33
Total GHG Emissions (MMT CO2e) 1.1 1.4 1.4 1.5 1.5
Source: Energy Policy Initiatives Center, University of San Diego 2020
Off-Road Transportation The off-road transportation category includes the following subcategories by equipment type: construction and mining equipment, cargo handling equipment, industrial equipment, airport ground support, pleasure craft, recreational equipment, lawn and garden equipment, agricultural equipment, transport refrigeration units, military tactical support equipment, and other portable equipment. The GHG emissions from off-road equipment fuel combustion account for 2% of total emissions in the 2016 inventory and 5% in the 2050 projection.
Method Used to Estimate 2016 Emissions
CARB released the OFFROAD ORION model in 2017 and the SORE model in 2020.37 The ORION 2017 model generates off-road equipment emission data by county, vehicle category, vehicle type, Horsepower (HP), and fuel type. SORE 2020 is a standalone Microsoft Access model that generates emission data for off-road vehicles with engines less than or equal to 25 HP. EPIC used ORION 2017 to generate 2016 regional off-road emissions for HP greater than or equal to 25. For the vehicles with HP equal to 25, data may overlap with SORE 2020 results. EPIC used SORE 2020 results for the overlapping vehicles because SORE 2020 is the latest and most recently updated model. Pleasure crafts and recreation vehicles are subcategories in ORION 2017; however, no San Diego regional data were available. EPIC used CARB’s pleasure craft model, PC2014, and recreational vehicle model, RV 2018, to generate the emission data for the respective subcategories.38 Like SORE 2020, both these models are standalone Microsoft Access models.
37 CARB: ORION 2017 and SORE 2020 Small Off Road Engine Model. 38 CARB: PC2014 Pleasure Craft model and RV 2018 Recreational Vehicle model.
X-38 San Diego Forward: The 2021 Regional Plan
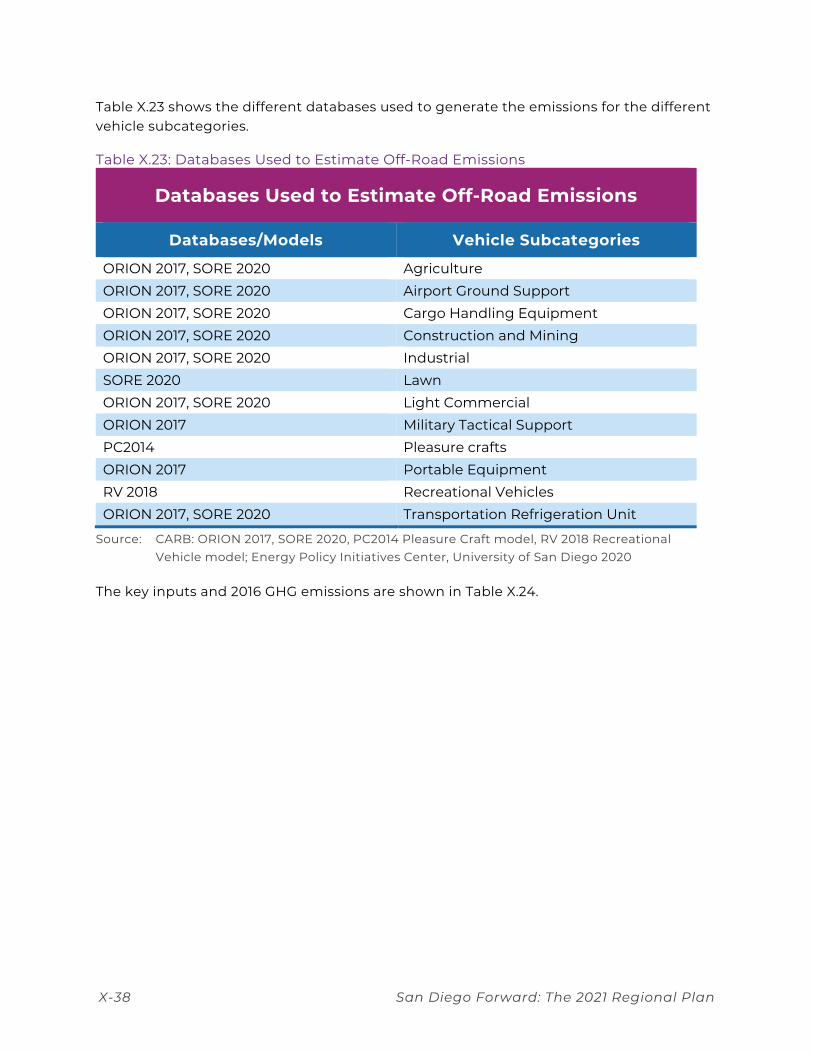
Table X.23 shows the different databases used to generate the emissions for the different vehicle subcategories.
Table X.23: Databases Used to Estimate Off-Road Emissions
Databases Used to Estimate Off-Road Emissions
Databases/Models Vehicle Subcategories
ORION 2017, SORE 2020 Agriculture ORION 2017, SORE 2020 Airport Ground Support ORION 2017, SORE 2020 Cargo Handling Equipment ORION 2017, SORE 2020 Construction and Mining ORION 2017, SORE 2020 Industrial SORE 2020 Lawn ORION 2017, SORE 2020 Light Commercial ORION 2017 Military Tactical Support PC2014 Pleasure crafts ORION 2017 Portable Equipment RV 2018 Recreational Vehicles ORION 2017, SORE 2020 Transportation Refrigeration Unit
Source: CARB: ORION 2017, SORE 2020, PC2014 Pleasure Craft model, RV 2018 Recreational Vehicle model; Energy Policy Initiatives Center, University of San Diego 2020
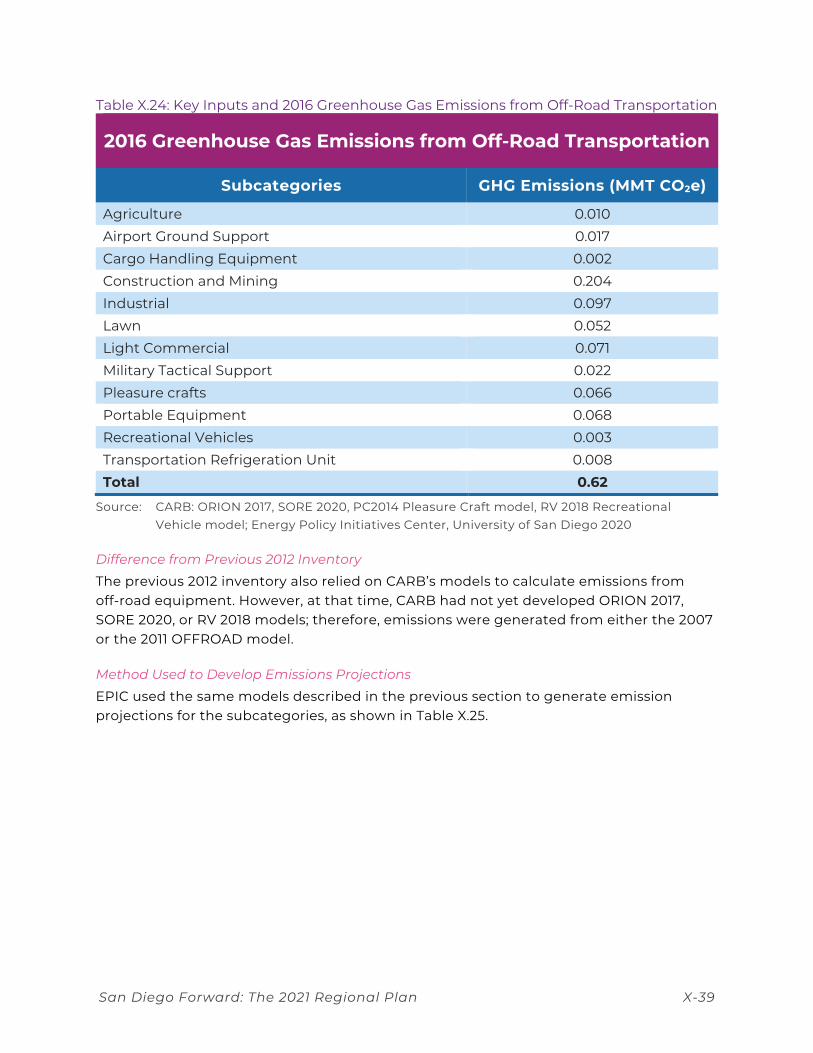
The key inputs and 2016 GHG emissions are shown in Table X.24.
San Diego Forward: The 2021 Regional Plan X-39
Table X.24: Key Inputs and 2016 Greenhouse Gas Emissions from Off-Road Transportation
2016 Greenhouse Gas Emissions from Off-Road Transportation
Subcategories GHG Emissions (MMT CO2e)
Agriculture 0.010 Airport Ground Support 0.017 Cargo Handling Equipment 0.002 Construction and Mining 0.204 Industrial 0.097 Lawn 0.052 Light Commercial 0.071 Military Tactical Support 0.022 Pleasure crafts 0.066 Portable Equipment 0.068 Recreational Vehicles 0.003 Transportation Refrigeration Unit 0.008 Total 0.62
Source: CARB: ORION 2017, SORE 2020, PC2014 Pleasure Craft model, RV 2018 Recreational Vehicle model; Energy Policy Initiatives Center, University of San Diego 2020
Difference from Previous 2012 Inventory
The previous 2012 inventory also relied on CARB’s models to calculate emissions from off-road equipment. However, at that time, CARB had not yet developed ORION 2017, SORE 2020, or RV 2018 models; therefore, emissions were generated from either the 2007 or the 2011 OFFROAD model.
Method Used to Develop Emissions Projections
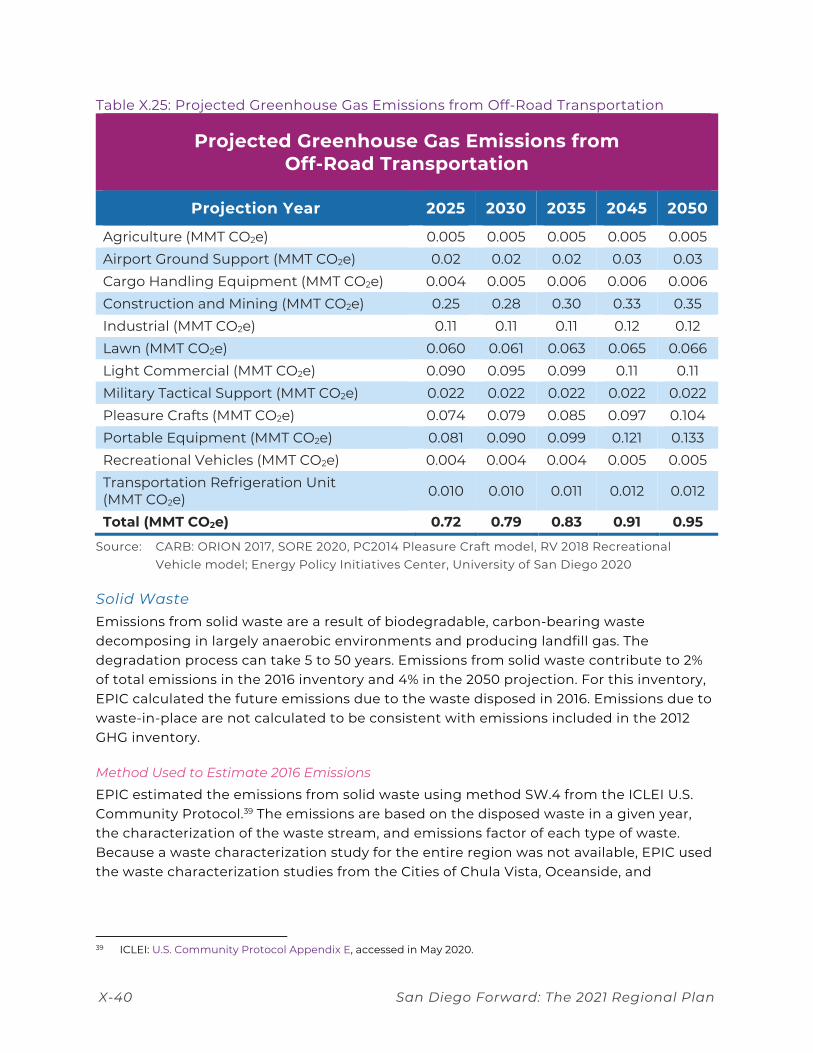
EPIC used the same models described in the previous section to generate emission projections for the subcategories, as shown in Table X.25.
X-40 San Diego Forward: The 2021 Regional Plan
Table X.25: Projected Greenhouse Gas Emissions from Off-Road Transportation
Projected Greenhouse Gas Emissions from Off-Road Transportation
Projection Year 2025 2030 2035 2045 2050
Agriculture (MMT CO2e) 0.005 0.005 0.005 0.005 0.005 Airport Ground Support (MMT CO2e) 0.02 0.02 0.02 0.03 0.03 Cargo Handling Equipment (MMT CO2e) 0.004 0.005 0.006 0.006 0.006 Construction and Mining (MMT CO2e) 0.25 0.28 0.30 0.33 0.35 Industrial (MMT CO2e) 0.11 0.11 0.11 0.12 0.12 Lawn (MMT CO2e) 0.060 0.061 0.063 0.065 0.066 Light Commercial (MMT CO2e) 0.090 0.095 0.099 0.11 0.11 Military Tactical Support (MMT CO2e) 0.022 0.022 0.022 0.022 0.022 Pleasure Crafts (MMT CO2e) 0.074 0.079 0.085 0.097 0.104 Portable Equipment (MMT CO2e) 0.081 0.090 0.099 0.121 0.133 Recreational Vehicles (MMT CO2e) 0.004 0.004 0.004 0.005 0.005 Transportation Refrigeration Unit (MMT CO2e) 0.010 0.010 0.011 0.012 0.012
Total (MMT CO2e) 0.72 0.79 0.83 0.91 0.95
Source: CARB: ORION 2017, SORE 2020, PC2014 Pleasure Craft model, RV 2018 Recreational Vehicle model; Energy Policy Initiatives Center, University of San Diego 2020
Solid Waste Emissions from solid waste are a result of biodegradable, carbon-bearing waste decomposing in largely anaerobic environments and producing landfill gas. The degradation process can take 5 to 50 years. Emissions from solid waste contribute to 2% of total emissions in the 2016 inventory and 4% in the 2050 projection. For this inventory, EPIC calculated the future emissions due to the waste disposed in 2016. Emissions due to waste-in-place are not calculated to be consistent with emissions included in the 2012 GHG inventory.
Method Used to Estimate 2016 Emissions
EPIC estimated the emissions from solid waste using method SW.4 from the ICLEI U.S. Community Protocol.39 The emissions are based on the disposed waste in a given year, the characterization of the waste stream, and emissions factor of each type of waste. Because a waste characterization study for the entire region was not available, EPIC used the waste characterization studies from the Cities of Chula Vista, Oceanside, and
39 ICLEI: U.S. Community Protocol Appendix E, accessed in May 2020.
San Diego Forward: The 2021 Regional Plan X-41
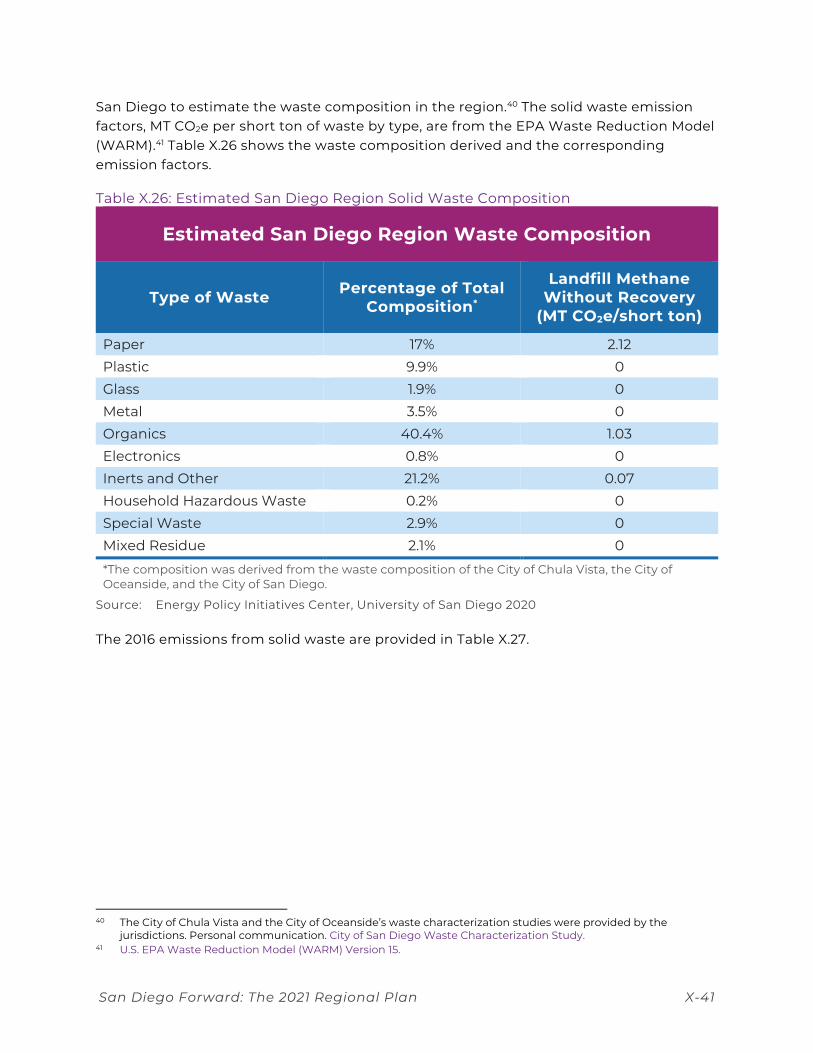
San Diego to estimate the waste composition in the region.40 The solid waste emission factors, MT CO2e per short ton of waste by type, are from the EPA Waste Reduction Model (WARM).41 Table X.26 shows the waste composition derived and the corresponding emission factors.
Table X.26: Estimated San Diego Region Solid Waste Composition
Estimated San Diego Region Waste Composition
Type of Waste Percentage of Total Composition*
Landfill Methane Without Recovery
(MT CO2e/short ton)
Paper 17% 2.12 Plastic 9.9% 0 Glass 1.9% 0 Metal 3.5% 0 Organics 40.4% 1.03 Electronics 0.8% 0 Inerts and Other 21.2% 0.07 Household Hazardous Waste 0.2% 0 Special Waste 2.9% 0 Mixed Residue 2.1% 0
*The composition was derived from the waste composition of the City of Chula Vista, the City of Oceanside, and the City of San Diego.
Source: Energy Policy Initiatives Center, University of San Diego 2020
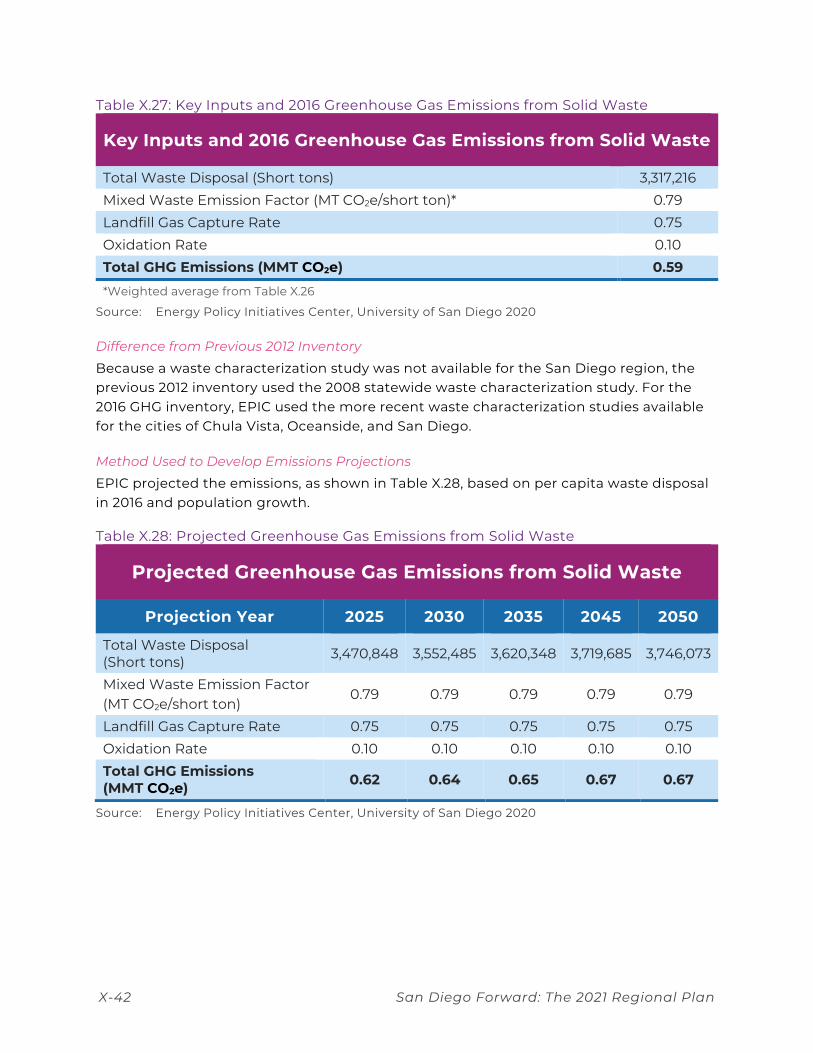
The 2016 emissions from solid waste are provided in Table X.27.
40 The City of Chula Vista and the City of Oceanside’s waste characterization studies were provided by the
jurisdictions. Personal communication. City of San Diego Waste Characterization Study. 41 U.S. EPA Waste Reduction Model (WARM) Version 15.
X-42 San Diego Forward: The 2021 Regional Plan
Table X.27: Key Inputs and 2016 Greenhouse Gas Emissions from Solid Waste
Key Inputs and 2016 Greenhouse Gas Emissions from Solid Waste
Total Waste Disposal (Short tons) 3,317,216 Mixed Waste Emission Factor (MT CO2e/short ton)* 0.79 Landfill Gas Capture Rate 0.75 Oxidation Rate 0.10 Total GHG Emissions (MMT CO2e) 0.59
*Weighted average from Table X.26
Source: Energy Policy Initiatives Center, University of San Diego 2020
Difference from Previous 2012 Inventory
Because a waste characterization study was not available for the San Diego region, the previous 2012 inventory used the 2008 statewide waste characterization study. For the 2016 GHG inventory, EPIC used the more recent waste characterization studies available for the cities of Chula Vista, Oceanside, and San Diego.
Method Used to Develop Emissions Projections
EPIC projected the emissions, as shown in Table X.28, based on per capita waste disposal in 2016 and population growth.
Table X.28: Projected Greenhouse Gas Emissions from Solid Waste
Projected Greenhouse Gas Emissions from Solid Waste
Projection Year 2025 2030 2035 2045 2050
Total Waste Disposal (Short tons) 3,470,848 3,552,485 3,620,348 3,719,685 3,746,073
Mixed Waste Emission Factor (MT CO2e/short ton)
0.79 0.79 0.79 0.79 0.79
Landfill Gas Capture Rate 0.75 0.75 0.75 0.75 0.75 Oxidation Rate 0.10 0.10 0.10 0.10 0.10 Total GHG Emissions (MMT CO2e) 0.62 0.64 0.65 0.67 0.67
Source: Energy Policy Initiatives Center, University of San Diego 2020
San Diego Forward: The 2021 Regional Plan X-43
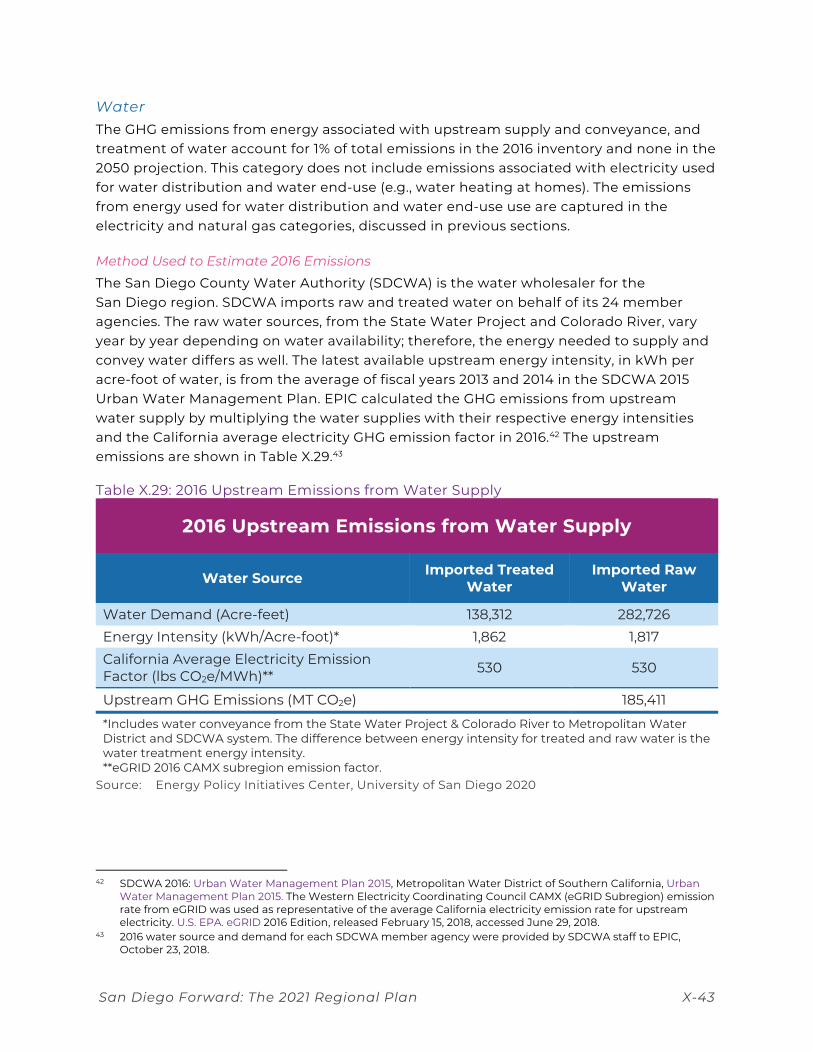
Water The GHG emissions from energy associated with upstream supply and conveyance, and treatment of water account for 1% of total emissions in the 2016 inventory and none in the 2050 projection. This category does not include emissions associated with electricity used for water distribution and water end-use (e.g., water heating at homes). The emissions from energy used for water distribution and water end-use use are captured in the electricity and natural gas categories, discussed in previous sections.
Method Used to Estimate 2016 Emissions
The San Diego County Water Authority (SDCWA) is the water wholesaler for the San Diego region. SDCWA imports raw and treated water on behalf of its 24 member agencies. The raw water sources, from the State Water Project and Colorado River, vary year by year depending on water availability; therefore, the energy needed to supply and convey water differs as well. The latest available upstream energy intensity, in kWh per acre-foot of water, is from the average of fiscal years 2013 and 2014 in the SDCWA 2015 Urban Water Management Plan. EPIC calculated the GHG emissions from upstream water supply by multiplying the water supplies with their respective energy intensities and the California average electricity GHG emission factor in 2016.42 The upstream emissions are shown in Table X.29.43
Table X.29: 2016 Upstream Emissions from Water Supply
2016 Upstream Emissions from Water Supply
Water Source Imported Treated Water
Imported Raw Water
Water Demand (Acre-feet) 138,312 282,726 Energy Intensity (kWh/Acre-foot)* 1,862 1,817 California Average Electricity Emission Factor (lbs CO2e/MWh)** 530 530
Upstream GHG Emissions (MT CO2e) 185,411
*Includes water conveyance from the State Water Project & Colorado River to Metropolitan Water District and SDCWA system. The difference between energy intensity for treated and raw water is the water treatment energy intensity. **eGRID 2016 CAMX subregion emission factor.
Source: Energy Policy Initiatives Center, University of San Diego 2020
42 SDCWA 2016: Urban Water Management Plan 2015, Metropolitan Water District of Southern California, Urban
Water Management Plan 2015. The Western Electricity Coordinating Council CAMX (eGRID Subregion) emission rate from eGRID was used as representative of the average California electricity emission rate for upstream electricity. U.S. EPA. eGRID 2016 Edition, released February 15, 2018, accessed June 29, 2018.
43 2016 water source and demand for each SDCWA member agency were provided by SDCWA staff to EPIC, October 23, 2018.
X-44 San Diego Forward: The 2021 Regional Plan
SDCWA has its own water treatment plant (WTP), Twin Oaks WTP, and many SDCWA member agencies have their own WTPs. Member agencies that do not have WTPs may purchase treated water from other member agencies or from SDCWA. For example, the City of San Diego and the City of Del Mar are member agencies of the SDCWA, but the City of San Diego provides water treatment service for the City of Del Mar. Local water treatment energy intensity depends on water sources, treatment level, capacity, and efficiency of the WTP. For example, brackish groundwater requires advanced treatment, such as reverse osmosis, to remove the salinity in the water, so its treatment has a higher energy intensity than surface water treatment with conventional methods. Table X.30 below shows the WTPs in San Diego region, the water treated, and the associated electricity use for water treatment in 2016.44 EPIC calculated the GHG emissions from water treatment by multiplying the electricity used for water treatment with SDG&E 2016 electricity GHG emission factor.
44 Data were collected by EPIC from 2018 to 2020 for the development of SANDAG’s 2016 and 2018 “ReCAP
Snapshots” (greenhouse gas inventory and Climate Action Plan monitoring reports prepared for local jurisdictions).
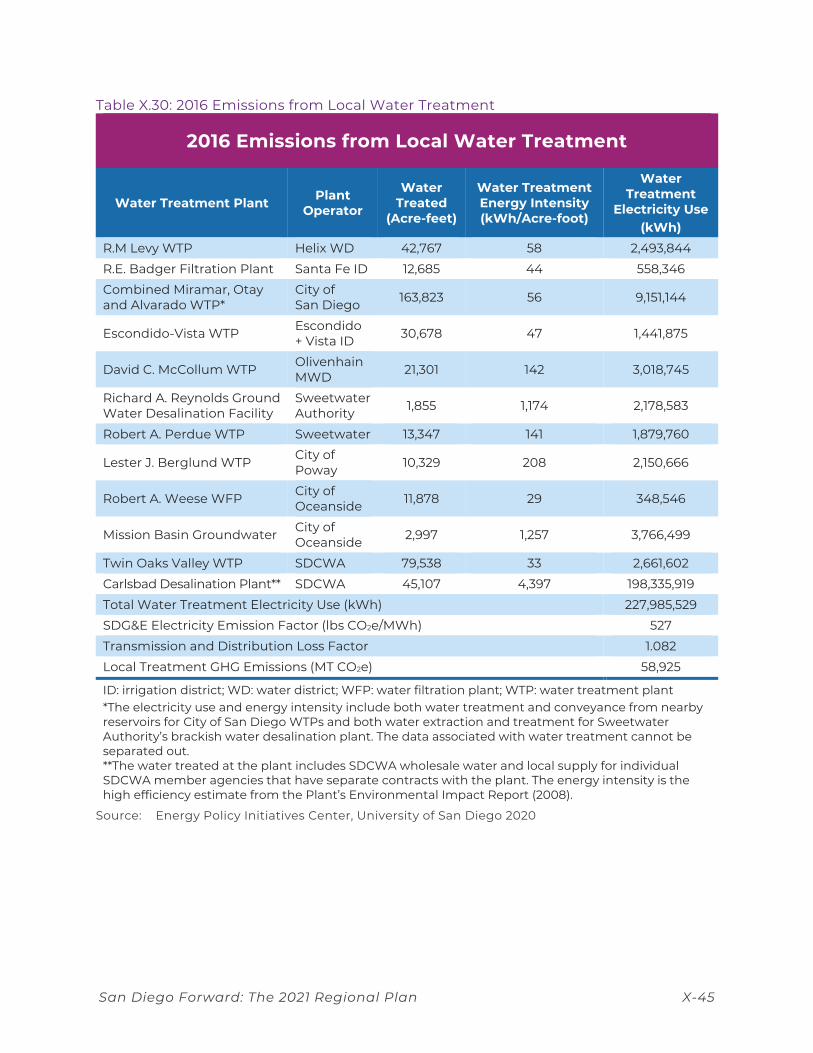
San Diego Forward: The 2021 Regional Plan X-45
Table X.30: 2016 Emissions from Local Water Treatment
2016 Emissions from Local Water Treatment
Water Treatment Plant Plant Operator
Water Treated
(Acre-feet)
Water Treatment Energy Intensity (kWh/Acre-foot)
Water Treatment
Electricity Use (kWh)
R.M Levy WTP Helix WD 42,767 58 2,493,844
R.E. Badger Filtration Plant Santa Fe ID 12,685 44 558,346
Combined Miramar, Otay and Alvarado WTP*
City of San Diego 163,823 56 9,151,144
Escondido-Vista WTP Escondido + Vista ID 30,678 47 1,441,875
David C. McCollum WTP Olivenhain MWD 21,301 142 3,018,745
Richard A. Reynolds Ground Water Desalination Facility
Sweetwater Authority 1,855 1,174 2,178,583
Robert A. Perdue WTP Sweetwater 13,347 141 1,879,760
Lester J. Berglund WTP City of Poway 10,329 208 2,150,666
Robert A. Weese WFP City of Oceanside 11,878 29 348,546
Mission Basin Groundwater City of Oceanside 2,997 1,257 3,766,499
Twin Oaks Valley WTP SDCWA 79,538 33 2,661,602
Carlsbad Desalination Plant** SDCWA 45,107 4,397 198,335,919
Total Water Treatment Electricity Use (kWh) 227,985,529
SDG&E Electricity Emission Factor (lbs CO2e/MWh) 527
Transmission and Distribution Loss Factor 1.082
Local Treatment GHG Emissions (MT CO2e) 58,925
ID: irrigation district; WD: water district; WFP: water filtration plant; WTP: water treatment plant *The electricity use and energy intensity include both water treatment and conveyance from nearby reservoirs for City of San Diego WTPs and both water extraction and treatment for Sweetwater Authority’s brackish water desalination plant. The data associated with water treatment cannot be separated out. **The water treated at the plant includes SDCWA wholesale water and local supply for individual SDCWA member agencies that have separate contracts with the plant. The energy intensity is the high efficiency estimate from the Plant’s Environmental Impact Report (2008).
Source: Energy Policy Initiatives Center, University of San Diego 2020
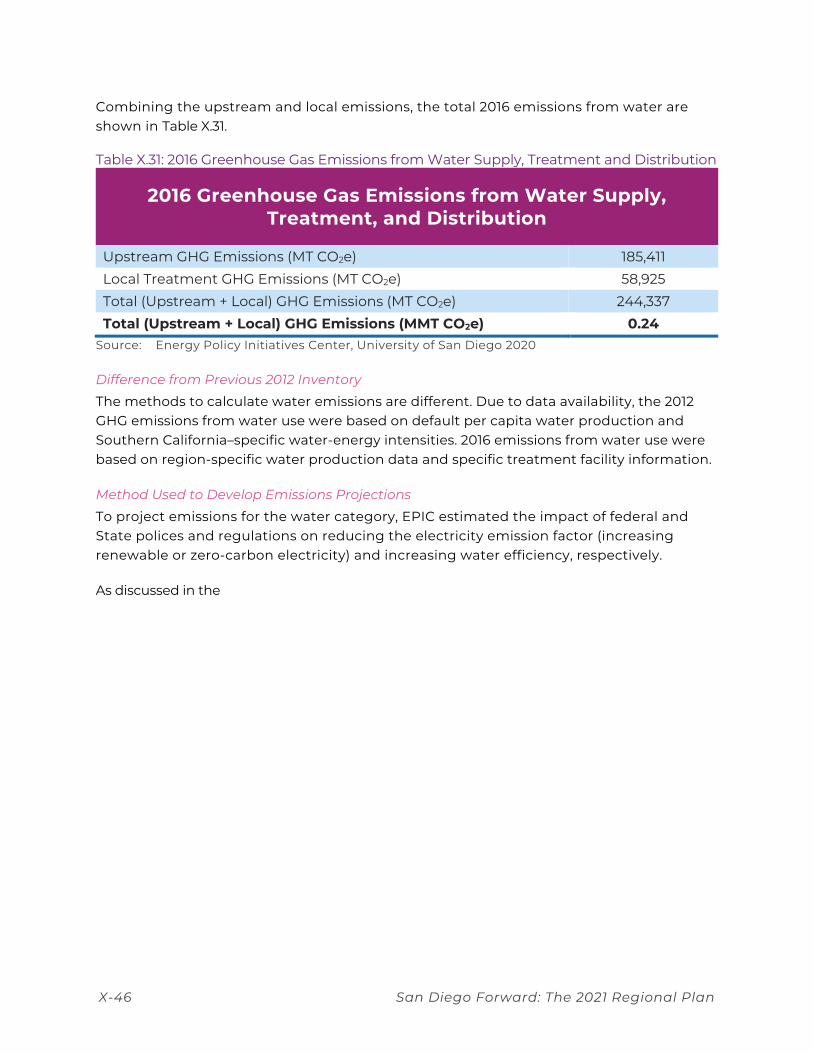
X-46 San Diego Forward: The 2021 Regional Plan
Combining the upstream and local emissions, the total 2016 emissions from water are shown in Table X.31.
Table X.31: 2016 Greenhouse Gas Emissions from Water Supply, Treatment and Distribution
2016 Greenhouse Gas Emissions from Water Supply, Treatment, and Distribution
Upstream GHG Emissions (MT CO2e) 185,411 Local Treatment GHG Emissions (MT CO2e) 58,925 Total (Upstream + Local) GHG Emissions (MT CO2e) 244,337 Total (Upstream + Local) GHG Emissions (MMT CO2e) 0.24
Source: Energy Policy Initiatives Center, University of San Diego 2020
Difference from Previous 2012 Inventory
The methods to calculate water emissions are different. Due to data availability, the 2012 GHG emissions from water use were based on default per capita water production and Southern California–specific water-energy intensities. 2016 emissions from water use were based on region-specific water production data and specific treatment facility information.
Method Used to Develop Emissions Projections
To project emissions for the water category, EPIC estimated the impact of federal and State polices and regulations on reducing the electricity emission factor (increasing renewable or zero-carbon electricity) and increasing water efficiency, respectively.
As discussed in the
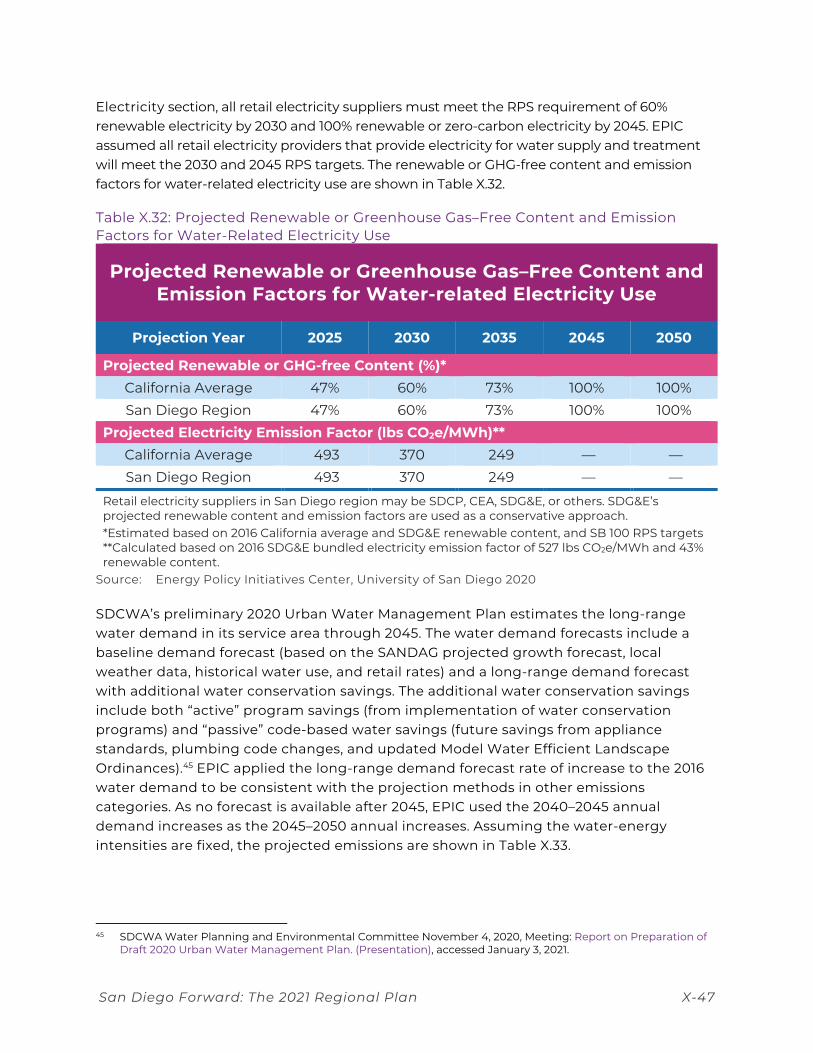
San Diego Forward: The 2021 Regional Plan X-47
Electricity section, all retail electricity suppliers must meet the RPS requirement of 60% renewable electricity by 2030 and 100% renewable or zero-carbon electricity by 2045. EPIC assumed all retail electricity providers that provide electricity for water supply and treatment will meet the 2030 and 2045 RPS targets. The renewable or GHG-free content and emission factors for water-related electricity use are shown in Table X.32.
Table X.32: Projected Renewable or Greenhouse Gas–Free Content and Emission Factors for Water-Related Electricity Use
Projected Renewable or Greenhouse Gas–Free Content and Emission Factors for Water-related Electricity Use
Projection Year 2025 2030 2035 2045 2050
Projected Renewable or GHG-free Content (%)* California Average 47% 60% 73% 100% 100% San Diego Region 47% 60% 73% 100% 100%
Projected Electricity Emission Factor (lbs CO2e/MWh)** California Average 493 370 249 — — San Diego Region 493 370 249 — —
Retail electricity suppliers in San Diego region may be SDCP, CEA, SDG&E, or others. SDG&E’s projected renewable content and emission factors are used as a conservative approach. *Estimated based on 2016 California average and SDG&E renewable content, and SB 100 RPS targets **Calculated based on 2016 SDG&E bundled electricity emission factor of 527 lbs CO2e/MWh and 43% renewable content.
Source: Energy Policy Initiatives Center, University of San Diego 2020
SDCWA’s preliminary 2020 Urban Water Management Plan estimates the long-range water demand in its service area through 2045. The water demand forecasts include a baseline demand forecast (based on the SANDAG projected growth forecast, local weather data, historical water use, and retail rates) and a long-range demand forecast with additional water conservation savings. The additional water conservation savings include both “active” program savings (from implementation of water conservation programs) and “passive” code-based water savings (future savings from appliance standards, plumbing code changes, and updated Model Water Efficient Landscape Ordinances).45 EPIC applied the long-range demand forecast rate of increase to the 2016 water demand to be consistent with the projection methods in other emissions categories. As no forecast is available after 2045, EPIC used the 2040–2045 annual demand increases as the 2045–2050 annual increases. Assuming the water-energy intensities are fixed, the projected emissions are shown in Table X.33.
45 SDCWA Water Planning and Environmental Committee November 4, 2020, Meeting: Report on Preparation of
Draft 2020 Urban Water Management Plan. (Presentation), accessed January 3, 2021.
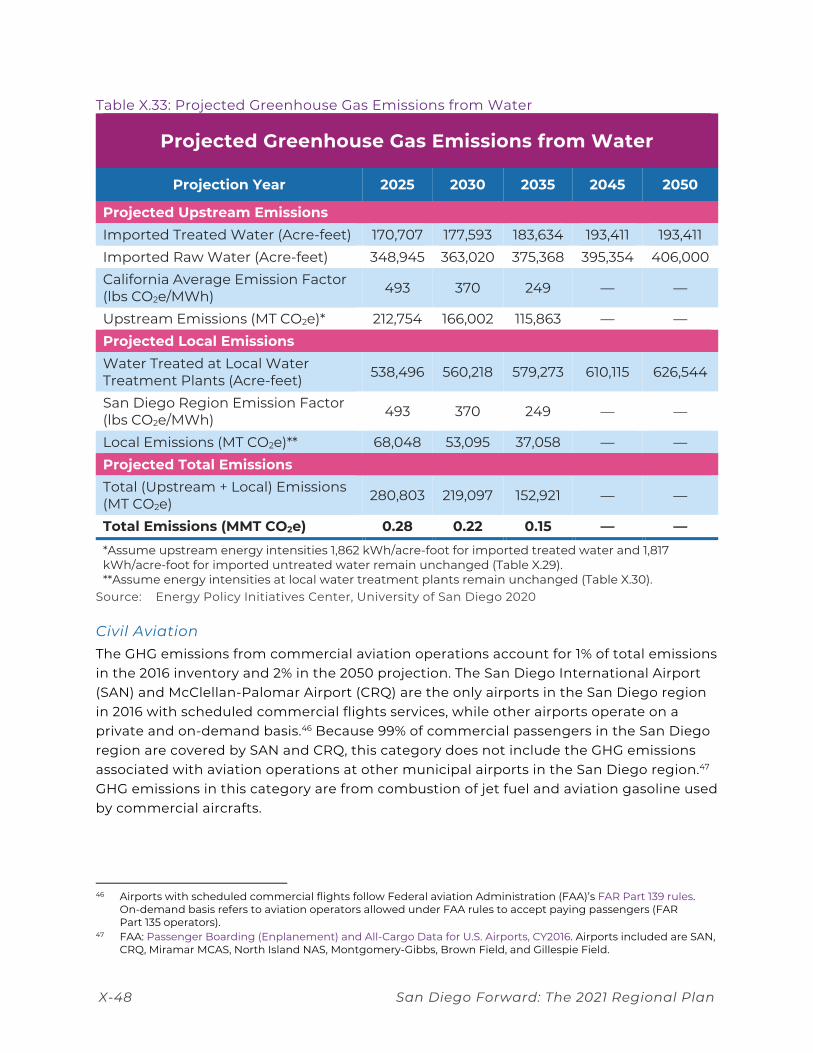
X-48 San Diego Forward: The 2021 Regional Plan
Table X.33: Projected Greenhouse Gas Emissions from Water
Projected Greenhouse Gas Emissions from Water
Projection Year 2025 2030 2035 2045 2050
Projected Upstream Emissions Imported Treated Water (Acre-feet) 170,707 177,593 183,634 193,411 193,411 Imported Raw Water (Acre-feet) 348,945 363,020 375,368 395,354 406,000 California Average Emission Factor (lbs CO2e/MWh) 493 370 249 — —
Upstream Emissions (MT CO2e)* 212,754 166,002 115,863 — — Projected Local Emissions Water Treated at Local Water Treatment Plants (Acre-feet) 538,496 560,218 579,273 610,115 626,544
San Diego Region Emission Factor (lbs CO2e/MWh) 493 370 249 — —
Local Emissions (MT CO2e)** 68,048 53,095 37,058 — — Projected Total Emissions Total (Upstream + Local) Emissions (MT CO2e) 280,803 219,097 152,921 — —
Total Emissions (MMT CO2e) 0.28 0.22 0.15 — — *Assume upstream energy intensities 1,862 kWh/acre-foot for imported treated water and 1,817 kWh/acre-foot for imported untreated water remain unchanged (Table X.29). **Assume energy intensities at local water treatment plants remain unchanged (Table X.30).
Source: Energy Policy Initiatives Center, University of San Diego 2020
Civil Aviation The GHG emissions from commercial aviation operations account for 1% of total emissions in the 2016 inventory and 2% in the 2050 projection. The San Diego International Airport (SAN) and McClellan-Palomar Airport (CRQ) are the only airports in the San Diego region in 2016 with scheduled commercial flights services, while other airports operate on a private and on-demand basis.46 Because 99% of commercial passengers in the San Diego region are covered by SAN and CRQ, this category does not include the GHG emissions associated with aviation operations at other municipal airports in the San Diego region.47 GHG emissions in this category are from combustion of jet fuel and aviation gasoline used by commercial aircrafts.
46 Airports with scheduled commercial flights follow Federal aviation Administration (FAA)’s FAR Part 139 rules.
On-demand basis refers to aviation operators allowed under FAA rules to accept paying passengers (FAR Part 135 operators).
47 FAA: Passenger Boarding (Enplanement) and All-Cargo Data for U.S. Airports, CY2016. Airports included are SAN, CRQ, Miramar MCAS, North Island NAS, Montgomery-Gibbs, Brown Field, and Gillespie Field.
San Diego Forward: The 2021 Regional Plan X-49
Method Used to Estimate 2016 Emissions
EPIC used the aircraft emissions reported in the SAN 2016 GHG Emissions Inventory (SAN GHG Inventory)—developed by the San Diego County Regional Airport Authority—and CRQ 2016 Emissions Inventory—developed for the CRQ Master Plan Program Environmental Impact Report (PEIR). The aircraft emissions in the SAN GHG Inventory are calculated based on the Airport GHG Emissions Management Guidance Manual and include emissions from aircraft start up, take off, and up to mixing height (3,000 feet).48 The aircraft emissions in CRQ 2016 Emissions Inventory include emissions from fuel combustion and emissions from auxiliary power units.49
The 2016 aircraft emissions were 213,353 (0.2 MMT CO2e), with 95% from SAN aircraft emissions and 5% from CRQ aircraft emissions.
Difference from Previous 2012 Inventory
In both inventories, emissions from the SAN GHG Inventories were used directly. However, the 2016 Airport GHG inventory is calculated with Airports Council International’s Airport Carbon and Emissions Reporting Tool, which no longer includes the emissions from aircrafts during cruise (above mixing height: 3,000 feet). The 2012 Airport GHG Inventory included emissions from the entire flight. In addition, aircraft emissions from CRQ were added to 2016 GHG emissions.
Method Used to Develop Emissions Projections
To project emissions for the civil aviation category, EPIC applied the rate of increase of the projected passengers served at the SAN to the 2016 aircraft emissions. In 2016, SAN served a total of 20,729,353 passengers.50 The draft SAN Development Plan projects the number of passengers served with the proposed Terminal 1 replacement and Terminal 2 modification. Under the constrained demand scenario, the SAN Development Plan projects an average increase of 1.6% per year in passengers from 2018 to 2050.51 EPIC applied the 1.6% annual increase to the SAN aircraft emissions in 2016. For CRQ, the projected 2036 aircraft emissions under proposed CRQ Master Plan are used directly and kept fixed through 2050.52 The projected emissions are shown in Table X.34.
48 San Diego County Regional Airport Authority: 2016 Greenhouse Gas Emissions Inventory (October 16, 2018),
provided by Airport Authority staff to EPIC, August 7, 2018. 49 CRQ Master Plan Update PEIR: Appendix H – Climate Change Technical Report (2018). 50 San Diego International Airport: Air Traffic Report, January 2017, accessed December 23, 2020. 51 San Diego County Regional Airport Authority: Airport Development Plan Recirculated Draft EIR
(September 2019), accessed January 10, 2021. 52 CRQ Master Plan Update PEIR: Appendix H – Climate Change Technical Report (2018).
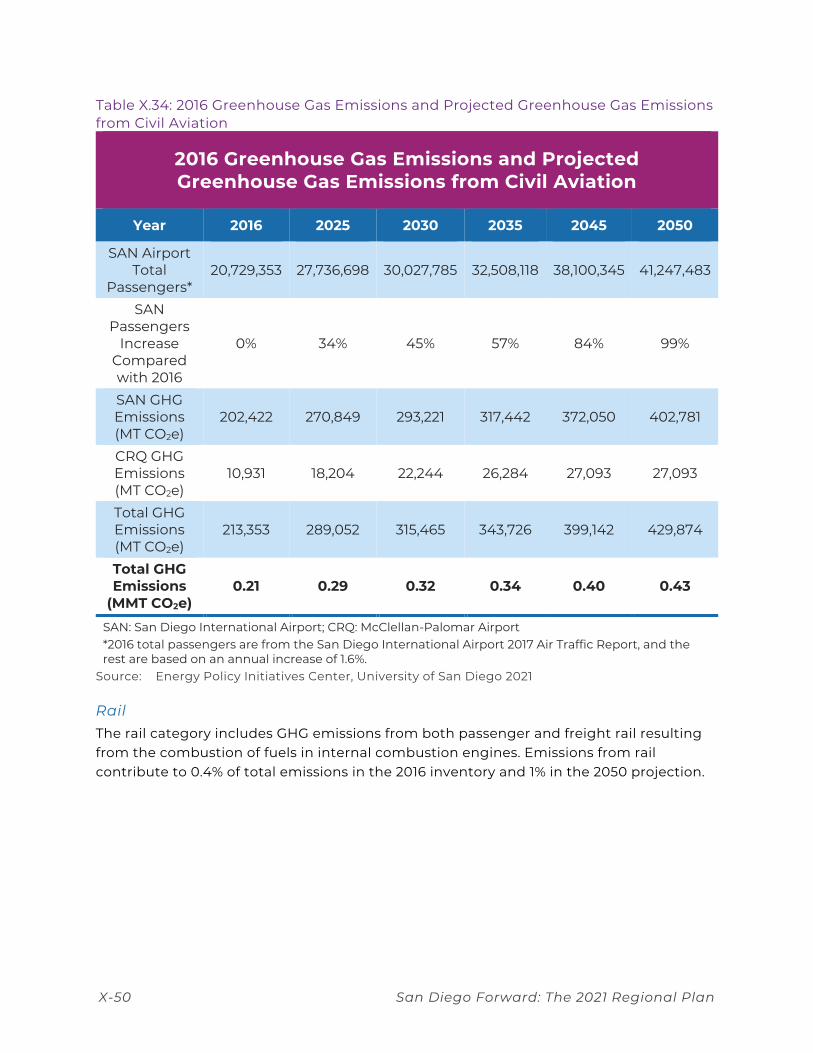
X-50 San Diego Forward: The 2021 Regional Plan
Table X.34: 2016 Greenhouse Gas Emissions and Projected Greenhouse Gas Emissions from Civil Aviation
2016 Greenhouse Gas Emissions and Projected Greenhouse Gas Emissions from Civil Aviation
Year 2016 2025 2030 2035 2045 2050
SAN Airport Total
Passengers* 20,729,353 27,736,698 30,027,785 32,508,118 38,100,345 41,247,483
SAN Passengers
Increase Compared with 2016
0% 34% 45% 57% 84% 99%
SAN GHG Emissions (MT CO2e)
202,422 270,849 293,221 317,442 372,050 402,781
CRQ GHG Emissions (MT CO2e)
10,931 18,204 22,244 26,284 27,093 27,093
Total GHG Emissions (MT CO2e)
213,353 289,052 315,465 343,726 399,142 429,874
Total GHG Emissions
(MMT CO2e) 0.21 0.29 0.32 0.34 0.40 0.43
SAN: San Diego International Airport; CRQ: McClellan-Palomar Airport *2016 total passengers are from the San Diego International Airport 2017 Air Traffic Report, and the rest are based on an annual increase of 1.6%.
Source: Energy Policy Initiatives Center, University of San Diego 2021
Rail The rail category includes GHG emissions from both passenger and freight rail resulting from the combustion of fuels in internal combustion engines. Emissions from rail contribute to 0.4% of total emissions in the 2016 inventory and 1% in the 2050 projection.
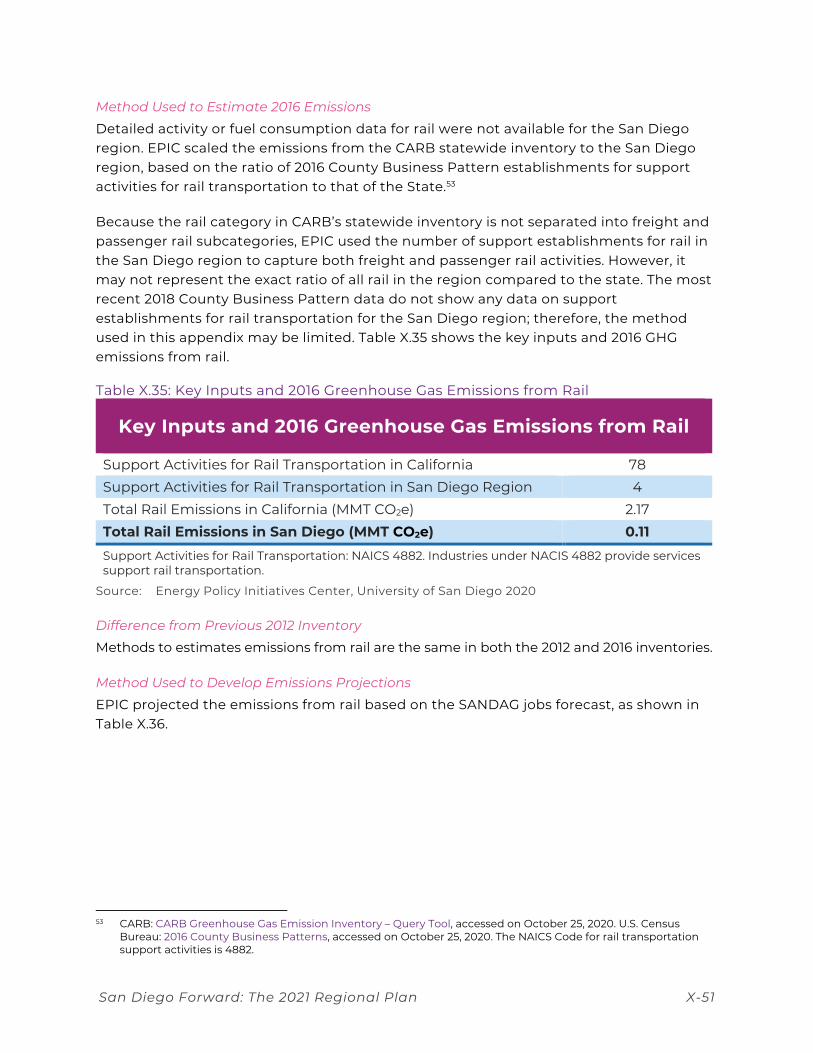
San Diego Forward: The 2021 Regional Plan X-51
Method Used to Estimate 2016 Emissions
Detailed activity or fuel consumption data for rail were not available for the San Diego region. EPIC scaled the emissions from the CARB statewide inventory to the San Diego region, based on the ratio of 2016 County Business Pattern establishments for support activities for rail transportation to that of the State.53
Because the rail category in CARB’s statewide inventory is not separated into freight and passenger rail subcategories, EPIC used the number of support establishments for rail in the San Diego region to capture both freight and passenger rail activities. However, it may not represent the exact ratio of all rail in the region compared to the state. The most recent 2018 County Business Pattern data do not show any data on support establishments for rail transportation for the San Diego region; therefore, the method used in this appendix may be limited. Table X.35 shows the key inputs and 2016 GHG emissions from rail.
Table X.35: Key Inputs and 2016 Greenhouse Gas Emissions from Rail
Key Inputs and 2016 Greenhouse Gas Emissions from Rail
Support Activities for Rail Transportation in California 78 Support Activities for Rail Transportation in San Diego Region 4 Total Rail Emissions in California (MMT CO2e) 2.17 Total Rail Emissions in San Diego (MMT CO2e) 0.11 Support Activities for Rail Transportation: NAICS 4882. Industries under NACIS 4882 provide services support rail transportation.
Source: Energy Policy Initiatives Center, University of San Diego 2020
Difference from Previous 2012 Inventory
Methods to estimates emissions from rail are the same in both the 2012 and 2016 inventories.
Method Used to Develop Emissions Projections
EPIC projected the emissions from rail based on the SANDAG jobs forecast, as shown in Table X.36.
53 CARB: CARB Greenhouse Gas Emission Inventory – Query Tool, accessed on October 25, 2020. U.S. Census
Bureau: 2016 County Business Patterns, accessed on October 25, 2020. The NAICS Code for rail transportation support activities is 4882.
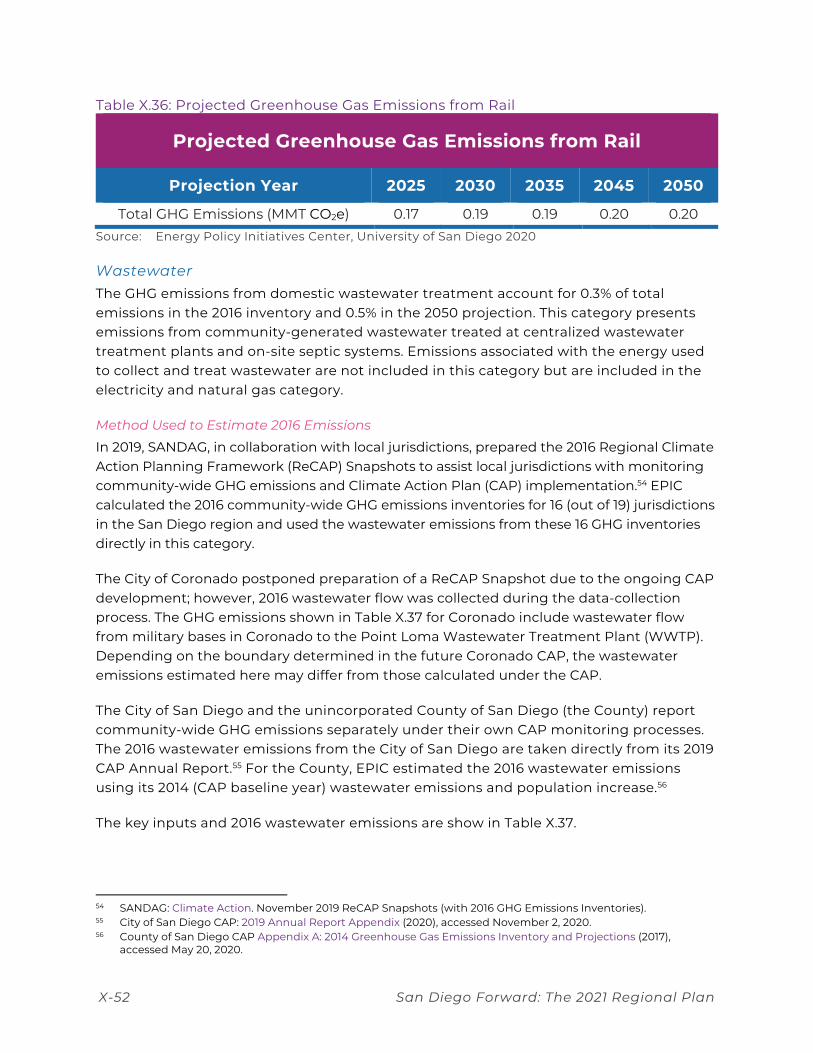
X-52 San Diego Forward: The 2021 Regional Plan
Table X.36: Projected Greenhouse Gas Emissions from Rail
Projected Greenhouse Gas Emissions from Rail
Projection Year 2025 2030 2035 2045 2050
Total GHG Emissions (MMT CO2e) 0.17 0.19 0.19 0.20 0.20 Source: Energy Policy Initiatives Center, University of San Diego 2020
Wastewater The GHG emissions from domestic wastewater treatment account for 0.3% of total emissions in the 2016 inventory and 0.5% in the 2050 projection. This category presents emissions from community-generated wastewater treated at centralized wastewater treatment plants and on-site septic systems. Emissions associated with the energy used to collect and treat wastewater are not included in this category but are included in the electricity and natural gas category.
Method Used to Estimate 2016 Emissions
In 2019, SANDAG, in collaboration with local jurisdictions, prepared the 2016 Regional Climate Action Planning Framework (ReCAP) Snapshots to assist local jurisdictions with monitoring community-wide GHG emissions and Climate Action Plan (CAP) implementation.54 EPIC calculated the 2016 community-wide GHG emissions inventories for 16 (out of 19) jurisdictions in the San Diego region and used the wastewater emissions from these 16 GHG inventories directly in this category.
The City of Coronado postponed preparation of a ReCAP Snapshot due to the ongoing CAP development; however, 2016 wastewater flow was collected during the data-collection process. The GHG emissions shown in Table X.37 for Coronado include wastewater flow from military bases in Coronado to the Point Loma Wastewater Treatment Plant (WWTP). Depending on the boundary determined in the future Coronado CAP, the wastewater emissions estimated here may differ from those calculated under the CAP.
The City of San Diego and the unincorporated County of San Diego (the County) report community-wide GHG emissions separately under their own CAP monitoring processes. The 2016 wastewater emissions from the City of San Diego are taken directly from its 2019 CAP Annual Report.55 For the County, EPIC estimated the 2016 wastewater emissions using its 2014 (CAP baseline year) wastewater emissions and population increase.56
The key inputs and 2016 wastewater emissions are show in Table X.37.
54 SANDAG: Climate Action. November 2019 ReCAP Snapshots (with 2016 GHG Emissions Inventories). 55 City of San Diego CAP: 2019 Annual Report Appendix (2020), accessed November 2, 2020. 56 County of San Diego CAP Appendix A: 2014 Greenhouse Gas Emissions Inventory and Projections (2017),
accessed May 20, 2020.
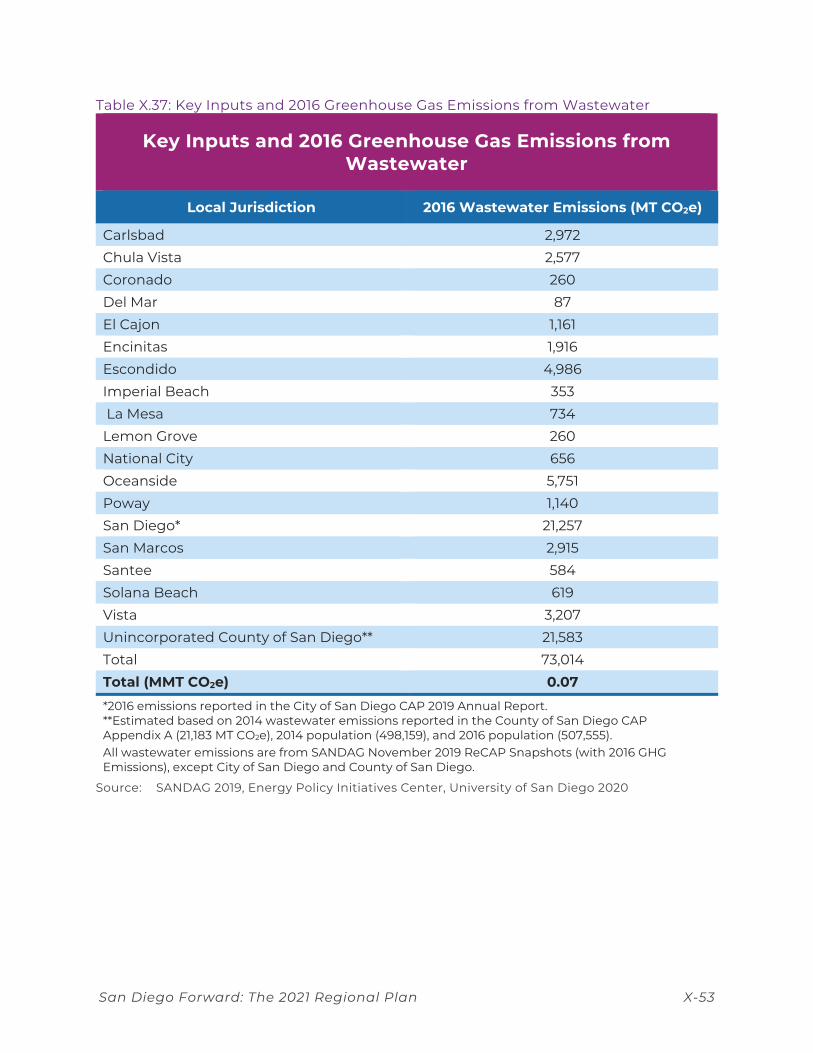
San Diego Forward: The 2021 Regional Plan X-53
Table X.37: Key Inputs and 2016 Greenhouse Gas Emissions from Wastewater
Key Inputs and 2016 Greenhouse Gas Emissions from Wastewater
Local Jurisdiction 2016 Wastewater Emissions (MT CO2e)
Carlsbad 2,972 Chula Vista 2,577 Coronado 260 Del Mar 87 El Cajon 1,161 Encinitas 1,916 Escondido 4,986 Imperial Beach 353 La Mesa 734 Lemon Grove 260 National City 656 Oceanside 5,751 Poway 1,140 San Diego* 21,257 San Marcos 2,915 Santee 584 Solana Beach 619 Vista 3,207 Unincorporated County of San Diego** 21,583 Total 73,014 Total (MMT CO2e) 0.07 *2016 emissions reported in the City of San Diego CAP 2019 Annual Report. **Estimated based on 2014 wastewater emissions reported in the County of San Diego CAP Appendix A (21,183 MT CO2e), 2014 population (498,159), and 2016 population (507,555). All wastewater emissions are from SANDAG November 2019 ReCAP Snapshots (with 2016 GHG Emissions), except City of San Diego and County of San Diego.
Source: SANDAG 2019, Energy Policy Initiatives Center, University of San Diego 2020
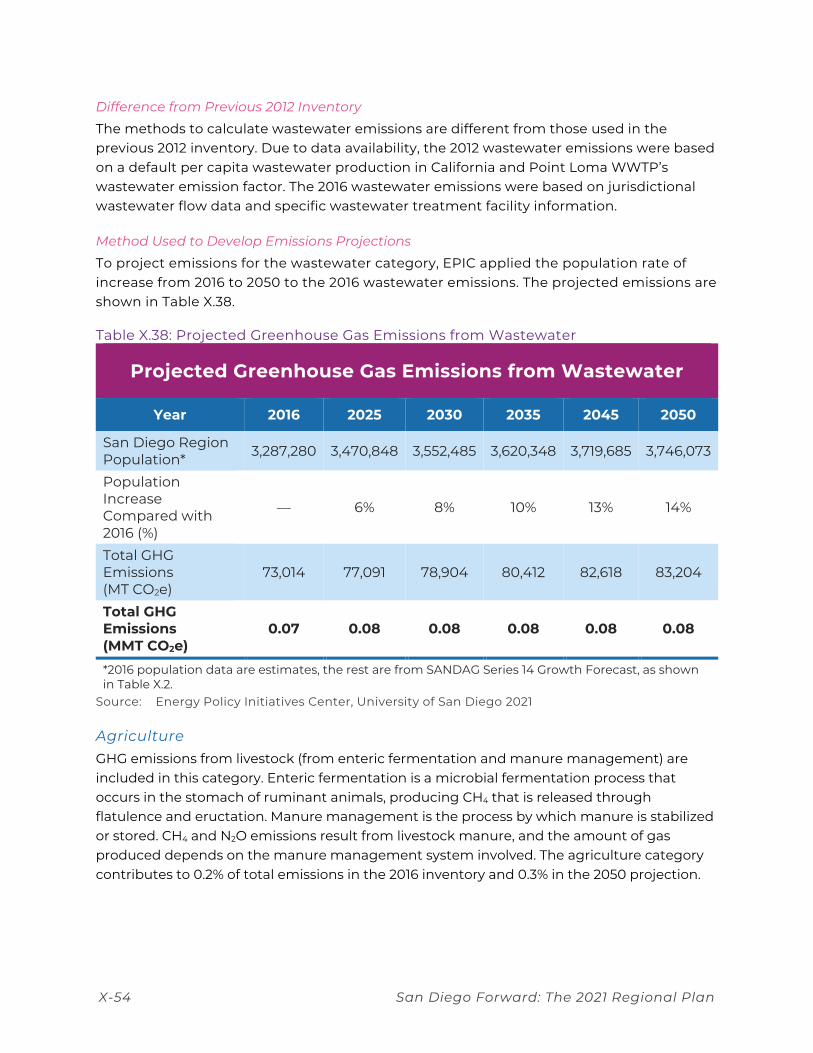
X-54 San Diego Forward: The 2021 Regional Plan
Difference from Previous 2012 Inventory
The methods to calculate wastewater emissions are different from those used in the previous 2012 inventory. Due to data availability, the 2012 wastewater emissions were based on a default per capita wastewater production in California and Point Loma WWTP’s wastewater emission factor. The 2016 wastewater emissions were based on jurisdictional wastewater flow data and specific wastewater treatment facility information.
Method Used to Develop Emissions Projections
To project emissions for the wastewater category, EPIC applied the population rate of increase from 2016 to 2050 to the 2016 wastewater emissions. The projected emissions are shown in Table X.38.
Table X.38: Projected Greenhouse Gas Emissions from Wastewater
Projected Greenhouse Gas Emissions from Wastewater
Year 2016 2025 2030 2035 2045 2050
San Diego Region Population* 3,287,280 3,470,848 3,552,485 3,620,348 3,719,685 3,746,073
Population Increase Compared with 2016 (%)
— 6% 8% 10% 13% 14%
Total GHG Emissions (MT CO2e)
73,014 77,091 78,904 80,412 82,618 83,204
Total GHG Emissions (MMT CO2e)
0.07 0.08 0.08 0.08 0.08 0.08
*2016 population data are estimates, the rest are from SANDAG Series 14 Growth Forecast, as shown in Table X.2.
Source: Energy Policy Initiatives Center, University of San Diego 2021
Agriculture GHG emissions from livestock (from enteric fermentation and manure management) are included in this category. Enteric fermentation is a microbial fermentation process that occurs in the stomach of ruminant animals, producing CH4 that is released through flatulence and eructation. Manure management is the process by which manure is stabilized or stored. CH4 and N2O emissions result from livestock manure, and the amount of gas produced depends on the manure management system involved. The agriculture category contributes to 0.2% of total emissions in the 2016 inventory and 0.3% in the 2050 projection.
San Diego Forward: The 2021 Regional Plan X-55
Method Used to Estimate 2016 Emissions
EPIC followed the ICLEI U.S. Community Protocol for Emissions from Domestic Animal Production within a Community (A.1 and A.2) to calculate the emissions from agriculture.57 Method A.1 addresses enteric fermentation from livestock production. CH4 emissions due to enteric fermentation are derived from the livestock population and emission factors for each animal type. Method A.2 addresses emissions from manure management. Emissions from manure management are derived from data on animal populations, animal characteristics, and manure management practices. Method A.2 is broken up into three subcategories, including CH4 emissions from manure management (A.2.1), direct N2O emissions from manure management (A.2.3), and indirect N2O emissions from manure management (A.2.4).
All the emission factors and other factors used for the calculations were taken from the ICLEI protocol. Table X.39 shows the factors used to calculate the agriculture emissions.
57 ICLEI: U.S. Community Protocol for Emissions from Domestic Animal Production within a Community, accessed
August 3, 2020.
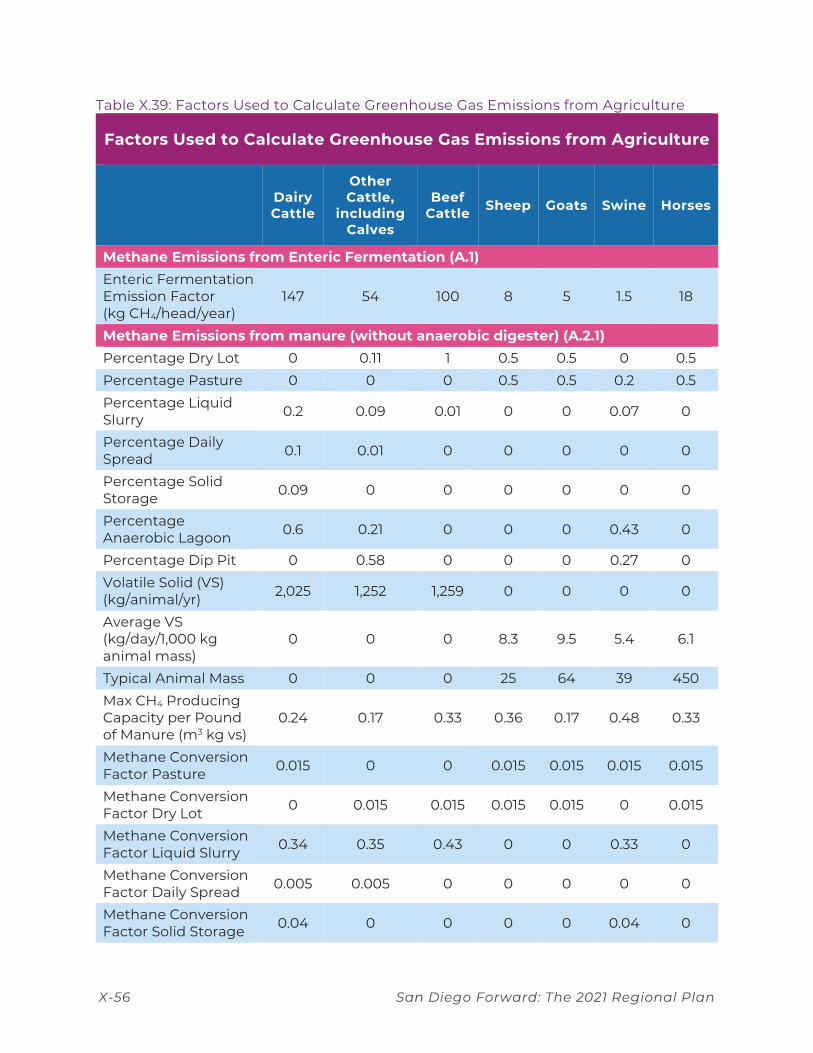
X-56 San Diego Forward: The 2021 Regional Plan
Table X.39: Factors Used to Calculate Greenhouse Gas Emissions from Agriculture
Factors Used to Calculate Greenhouse Gas Emissions from Agriculture
Dairy Cattle
Other Cattle,
including Calves
Beef Cattle Sheep Goats Swine Horses
Methane Emissions from Enteric Fermentation (A.1) Enteric Fermentation Emission Factor (kg CH4/head/year)
147 54 100 8 5 1.5 18
Methane Emissions from manure (without anaerobic digester) (A.2.1) Percentage Dry Lot 0 0.11 1 0.5 0.5 0 0.5 Percentage Pasture 0 0 0 0.5 0.5 0.2 0.5 Percentage Liquid Slurry 0.2 0.09 0.01 0 0 0.07 0
Percentage Daily Spread 0.1 0.01 0 0 0 0 0
Percentage Solid Storage 0.09 0 0 0 0 0 0
Percentage Anaerobic Lagoon 0.6 0.21 0 0 0 0.43 0
Percentage Dip Pit 0 0.58 0 0 0 0.27 0 Volatile Solid (VS) (kg/animal/yr) 2,025 1,252 1,259 0 0 0 0
Average VS (kg/day/1,000 kg animal mass)
0 0 0 8.3 9.5 5.4 6.1
Typical Animal Mass 0 0 0 25 64 39 450 Max CH4 Producing Capacity per Pound of Manure (m3 kg vs)
0.24 0.17 0.33 0.36 0.17 0.48 0.33
Methane Conversion Factor Pasture 0.015 0 0 0.015 0.015 0.015 0.015
Methane Conversion Factor Dry Lot 0 0.015 0.015 0.015 0.015 0 0.015
Methane Conversion Factor Liquid Slurry 0.34 0.35 0.43 0 0 0.33 0
Methane Conversion Factor Daily Spread 0.005 0.005 0 0 0 0 0
Methane Conversion Factor Solid Storage 0.04 0 0 0 0 0.04 0
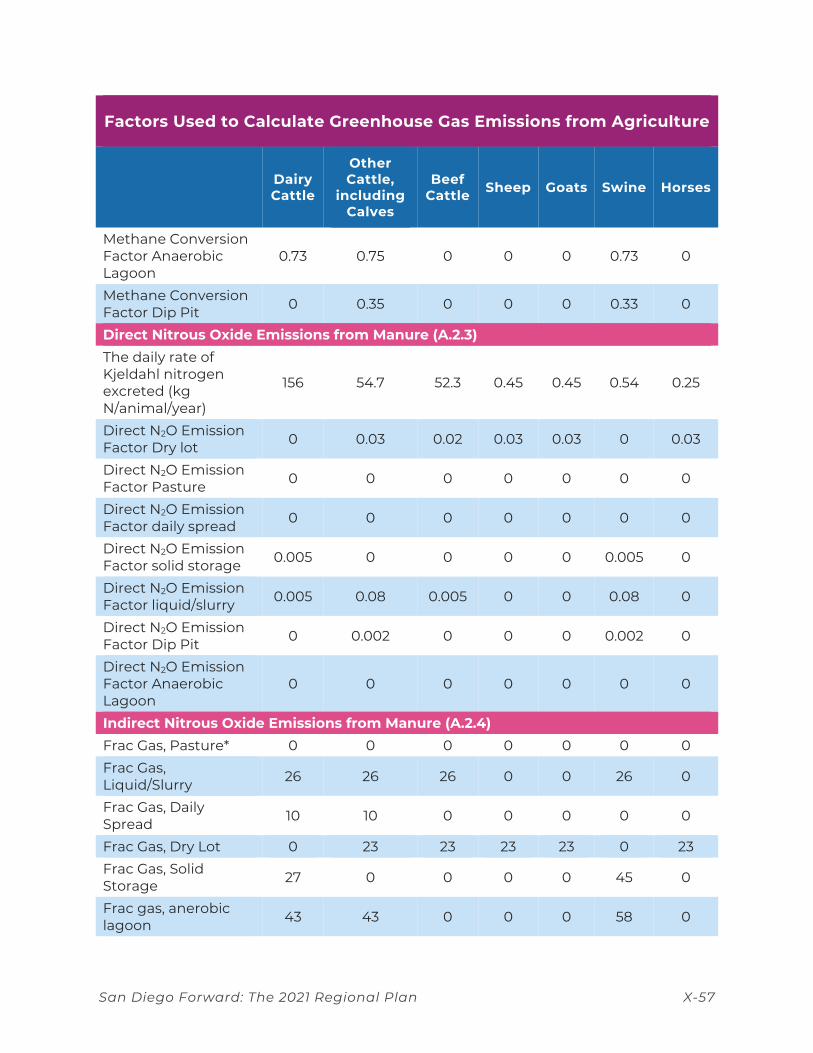
San Diego Forward: The 2021 Regional Plan X-57
Factors Used to Calculate Greenhouse Gas Emissions from Agriculture
Dairy Cattle
Other Cattle,
including Calves
Beef Cattle Sheep Goats Swine Horses
Methane Conversion Factor Anaerobic Lagoon
0.73 0.75 0 0 0 0.73 0
Methane Conversion Factor Dip Pit 0 0.35 0 0 0 0.33 0
Direct Nitrous Oxide Emissions from Manure (A.2.3) The daily rate of Kjeldahl nitrogen excreted (kg N/animal/year)
156 54.7 52.3 0.45 0.45 0.54 0.25
Direct N2O Emission Factor Dry lot 0 0.03 0.02 0.03 0.03 0 0.03
Direct N2O Emission Factor Pasture 0 0 0 0 0 0 0
Direct N2O Emission Factor daily spread 0 0 0 0 0 0 0
Direct N2O Emission Factor solid storage 0.005 0 0 0 0 0.005 0
Direct N2O Emission Factor liquid/slurry 0.005 0.08 0.005 0 0 0.08 0
Direct N2O Emission Factor Dip Pit 0 0.002 0 0 0 0.002 0
Direct N2O Emission Factor Anaerobic Lagoon
0 0 0 0 0 0 0
Indirect Nitrous Oxide Emissions from Manure (A.2.4) Frac Gas, Pasture* 0 0 0 0 0 0 0 Frac Gas, Liquid/Slurry 26 26 26 0 0 26 0
Frac Gas, Daily Spread 10 10 0 0 0 0 0
Frac Gas, Dry Lot 0 23 23 23 23 0 23 Frac Gas, Solid Storage 27 0 0 0 0 45 0
Frac gas, anerobic lagoon 43 43 0 0 0 58 0
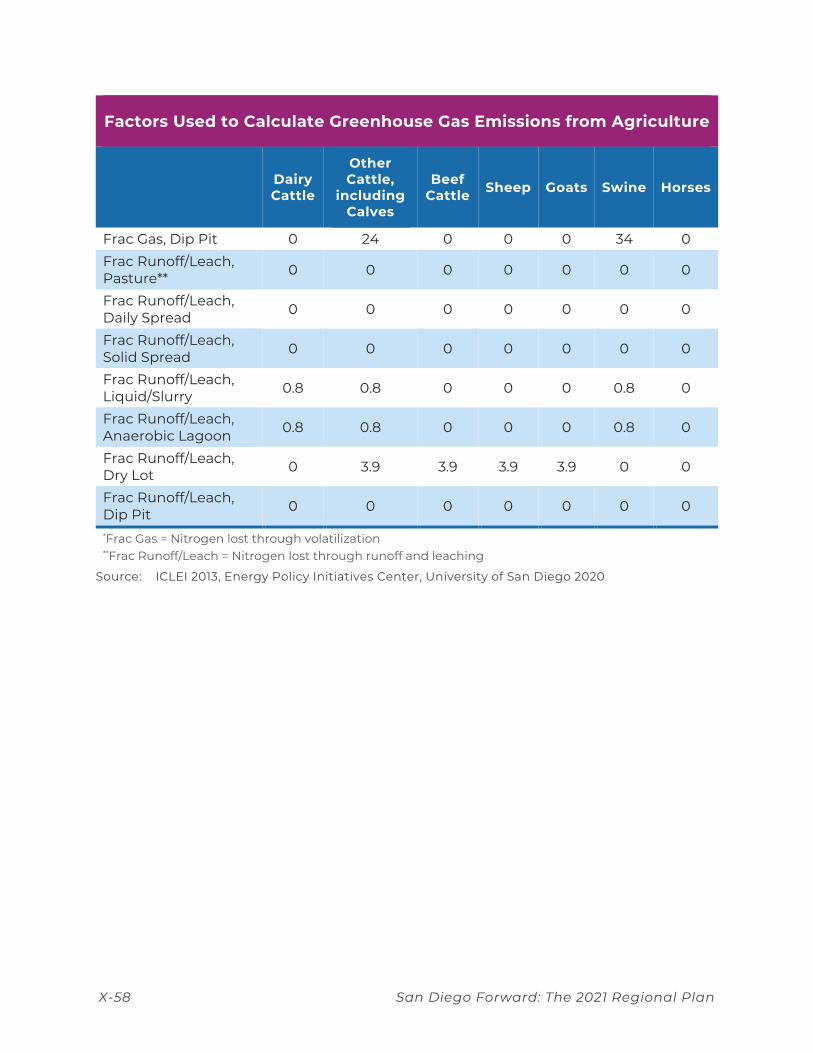
X-58 San Diego Forward: The 2021 Regional Plan
Factors Used to Calculate Greenhouse Gas Emissions from Agriculture
Dairy Cattle
Other Cattle,
including Calves
Beef Cattle Sheep Goats Swine Horses
Frac Gas, Dip Pit 0 24 0 0 0 34 0 Frac Runoff/Leach, Pasture** 0 0 0 0 0 0 0
Frac Runoff/Leach, Daily Spread 0 0 0 0 0 0 0
Frac Runoff/Leach, Solid Spread 0 0 0 0 0 0 0
Frac Runoff/Leach, Liquid/Slurry 0.8 0.8 0 0 0 0.8 0
Frac Runoff/Leach, Anaerobic Lagoon 0.8 0.8 0 0 0 0.8 0
Frac Runoff/Leach, Dry Lot 0 3.9 3.9 3.9 3.9 0 0
Frac Runoff/Leach, Dip Pit 0 0 0 0 0 0 0
*Frac Gas = Nitrogen lost through volatilization **Frac Runoff/Leach = Nitrogen lost through runoff and leaching
Source: ICLEI 2013, Energy Policy Initiatives Center, University of San Diego 2020
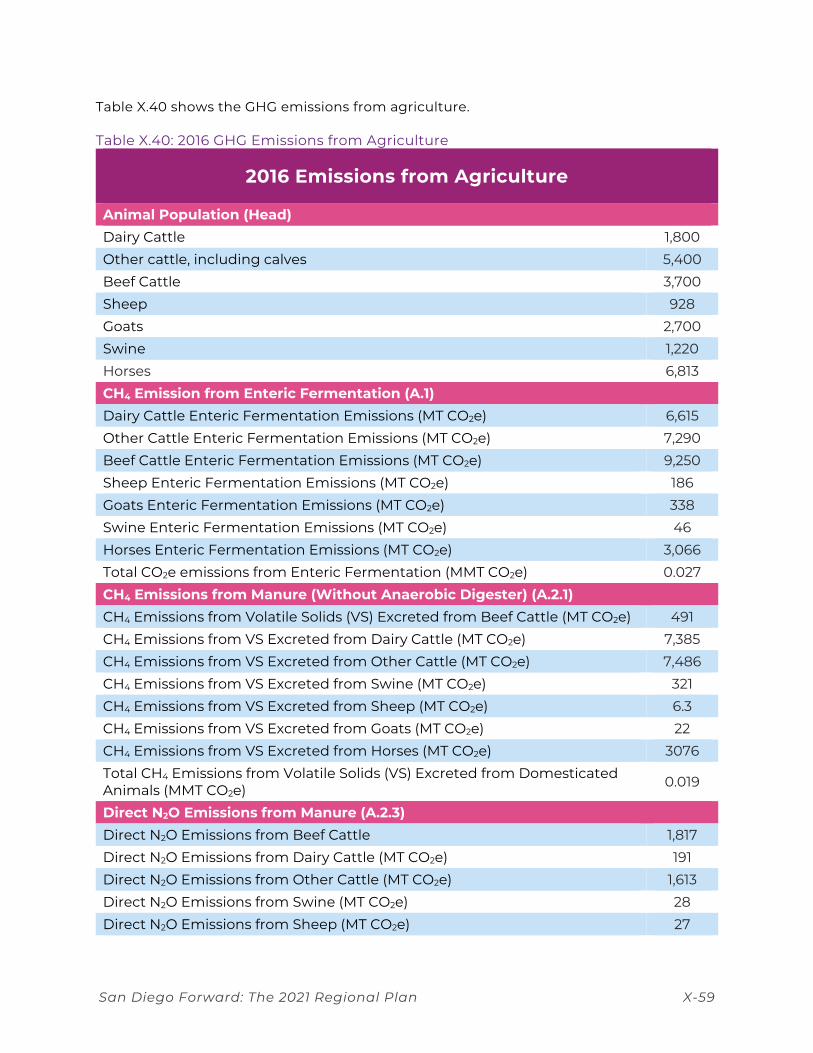
San Diego Forward: The 2021 Regional Plan X-59
Table X.40 shows the GHG emissions from agriculture.
Table X.40: 2016 GHG Emissions from Agriculture
2016 Emissions from Agriculture
Animal Population (Head) Dairy Cattle 1,800 Other cattle, including calves 5,400 Beef Cattle 3,700 Sheep 928 Goats 2,700 Swine 1,220 Horses 6,813 CH4 Emission from Enteric Fermentation (A.1) Dairy Cattle Enteric Fermentation Emissions (MT CO2e) 6,615 Other Cattle Enteric Fermentation Emissions (MT CO2e) 7,290 Beef Cattle Enteric Fermentation Emissions (MT CO2e) 9,250 Sheep Enteric Fermentation Emissions (MT CO2e) 186 Goats Enteric Fermentation Emissions (MT CO2e) 338 Swine Enteric Fermentation Emissions (MT CO2e) 46 Horses Enteric Fermentation Emissions (MT CO2e) 3,066 Total CO2e emissions from Enteric Fermentation (MMT CO2e) 0.027 CH4 Emissions from Manure (Without Anaerobic Digester) (A.2.1) CH4 Emissions from Volatile Solids (VS) Excreted from Beef Cattle (MT CO2e) 491 CH4 Emissions from VS Excreted from Dairy Cattle (MT CO2e) 7,385 CH4 Emissions from VS Excreted from Other Cattle (MT CO2e) 7,486 CH4 Emissions from VS Excreted from Swine (MT CO2e) 321 CH4 Emissions from VS Excreted from Sheep (MT CO2e) 6.3 CH4 Emissions from VS Excreted from Goats (MT CO2e) 22 CH4 Emissions from VS Excreted from Horses (MT CO2e) 3076 Total CH4 Emissions from Volatile Solids (VS) Excreted from Domesticated Animals (MMT CO2e) 0.019
Direct N2O Emissions from Manure (A.2.3) Direct N2O Emissions from Beef Cattle 1,817 Direct N2O Emissions from Dairy Cattle (MT CO2e) 191 Direct N2O Emissions from Other Cattle (MT CO2e) 1,613 Direct N2O Emissions from Swine (MT CO2e) 28 Direct N2O Emissions from Sheep (MT CO2e) 27
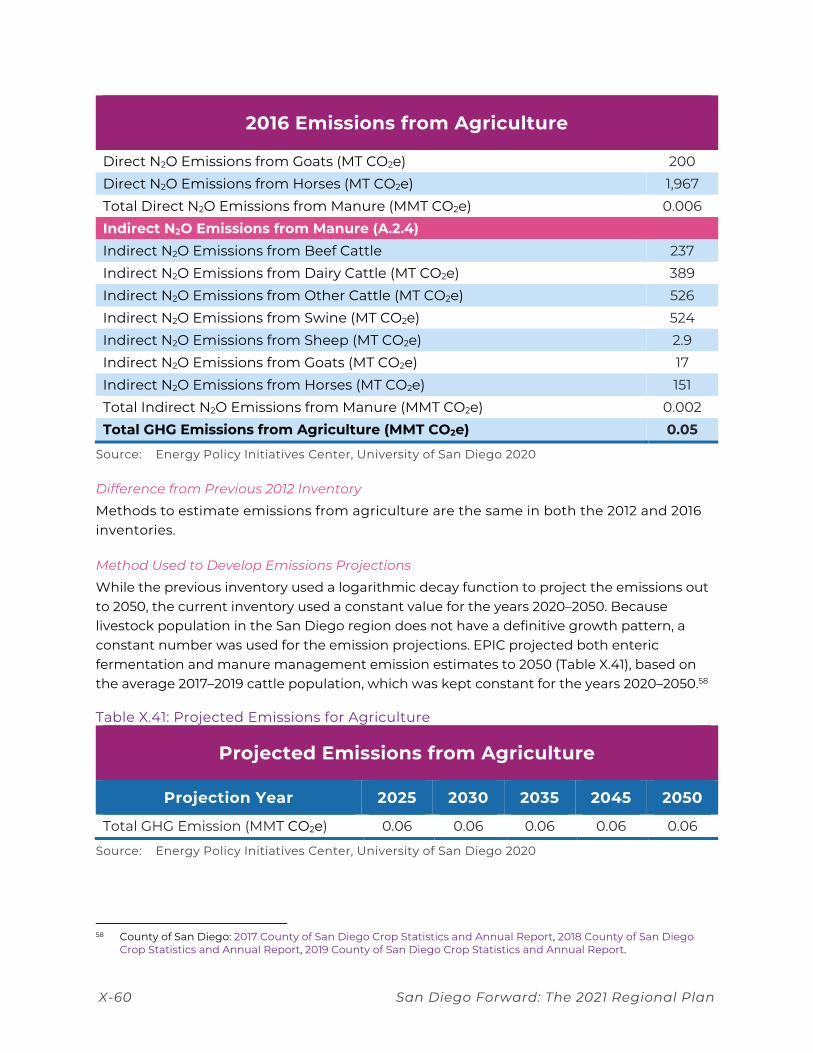
X-60 San Diego Forward: The 2021 Regional Plan
2016 Emissions from Agriculture
Direct N2O Emissions from Goats (MT CO2e) 200 Direct N2O Emissions from Horses (MT CO2e) 1,967 Total Direct N2O Emissions from Manure (MMT CO2e) 0.006 Indirect N2O Emissions from Manure (A.2.4) Indirect N2O Emissions from Beef Cattle 237 Indirect N2O Emissions from Dairy Cattle (MT CO2e) 389 Indirect N2O Emissions from Other Cattle (MT CO2e) 526 Indirect N2O Emissions from Swine (MT CO2e) 524 Indirect N2O Emissions from Sheep (MT CO2e) 2.9 Indirect N2O Emissions from Goats (MT CO2e) 17 Indirect N2O Emissions from Horses (MT CO2e) 151 Total Indirect N2O Emissions from Manure (MMT CO2e) 0.002 Total GHG Emissions from Agriculture (MMT CO2e) 0.05
Source: Energy Policy Initiatives Center, University of San Diego 2020
Difference from Previous 2012 Inventory
Methods to estimate emissions from agriculture are the same in both the 2012 and 2016 inventories.
Method Used to Develop Emissions Projections
While the previous inventory used a logarithmic decay function to project the emissions out to 2050, the current inventory used a constant value for the years 2020–2050. Because livestock population in the San Diego region does not have a definitive growth pattern, a constant number was used for the emission projections. EPIC projected both enteric fermentation and manure management emission estimates to 2050 (Table X.41), based on the average 2017–2019 cattle population, which was kept constant for the years 2020–2050.58
Table X.41: Projected Emissions for Agriculture
Projected Emissions from Agriculture
Projection Year 2025 2030 2035 2045 2050
Total GHG Emission (MMT CO2e) 0.06 0.06 0.06 0.06 0.06
Source: Energy Policy Initiatives Center, University of San Diego 2020
58 County of San Diego: 2017 County of San Diego Crop Statistics and Annual Report, 2018 County of San Diego
Crop Statistics and Annual Report, 2019 County of San Diego Crop Statistics and Annual Report.
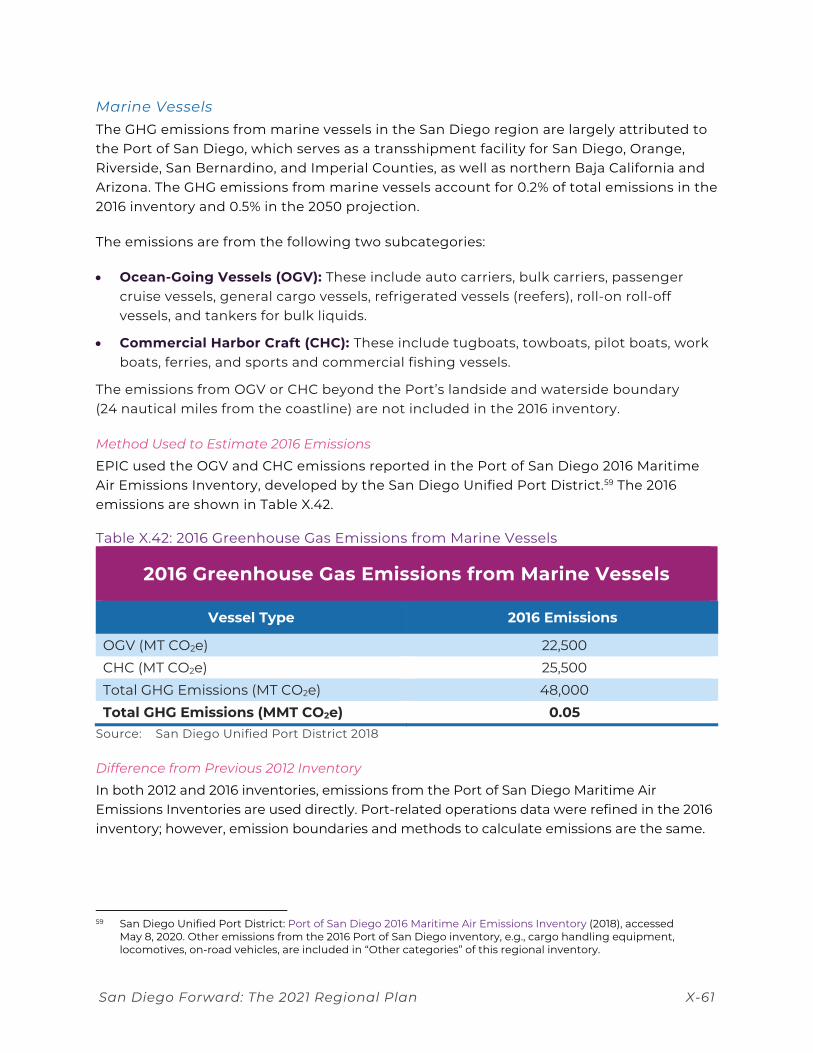
San Diego Forward: The 2021 Regional Plan X-61
Marine Vessels The GHG emissions from marine vessels in the San Diego region are largely attributed to the Port of San Diego, which serves as a transshipment facility for San Diego, Orange, Riverside, San Bernardino, and Imperial Counties, as well as northern Baja California and Arizona. The GHG emissions from marine vessels account for 0.2% of total emissions in the 2016 inventory and 0.5% in the 2050 projection.
The emissions are from the following two subcategories:
• Ocean-Going Vessels (OGV): These include auto carriers, bulk carriers, passenger cruise vessels, general cargo vessels, refrigerated vessels (reefers), roll-on roll-off vessels, and tankers for bulk liquids.
• Commercial Harbor Craft (CHC): These include tugboats, towboats, pilot boats, work boats, ferries, and sports and commercial fishing vessels.
The emissions from OGV or CHC beyond the Port’s landside and waterside boundary (24 nautical miles from the coastline) are not included in the 2016 inventory.
Method Used to Estimate 2016 Emissions
EPIC used the OGV and CHC emissions reported in the Port of San Diego 2016 Maritime Air Emissions Inventory, developed by the San Diego Unified Port District.59 The 2016 emissions are shown in Table X.42.
Table X.42: 2016 Greenhouse Gas Emissions from Marine Vessels
2016 Greenhouse Gas Emissions from Marine Vessels
Vessel Type 2016 Emissions
OGV (MT CO2e) 22,500 CHC (MT CO2e) 25,500 Total GHG Emissions (MT CO2e) 48,000 Total GHG Emissions (MMT CO2e) 0.05
Source: San Diego Unified Port District 2018
Difference from Previous 2012 Inventory
In both 2012 and 2016 inventories, emissions from the Port of San Diego Maritime Air Emissions Inventories are used directly. Port-related operations data were refined in the 2016 inventory; however, emission boundaries and methods to calculate emissions are the same.
59 San Diego Unified Port District: Port of San Diego 2016 Maritime Air Emissions Inventory (2018), accessed
May 8, 2020. Other emissions from the 2016 Port of San Diego inventory, e.g., cargo handling equipment, locomotives, on-road vehicles, are included in “Other categories” of this regional inventory.
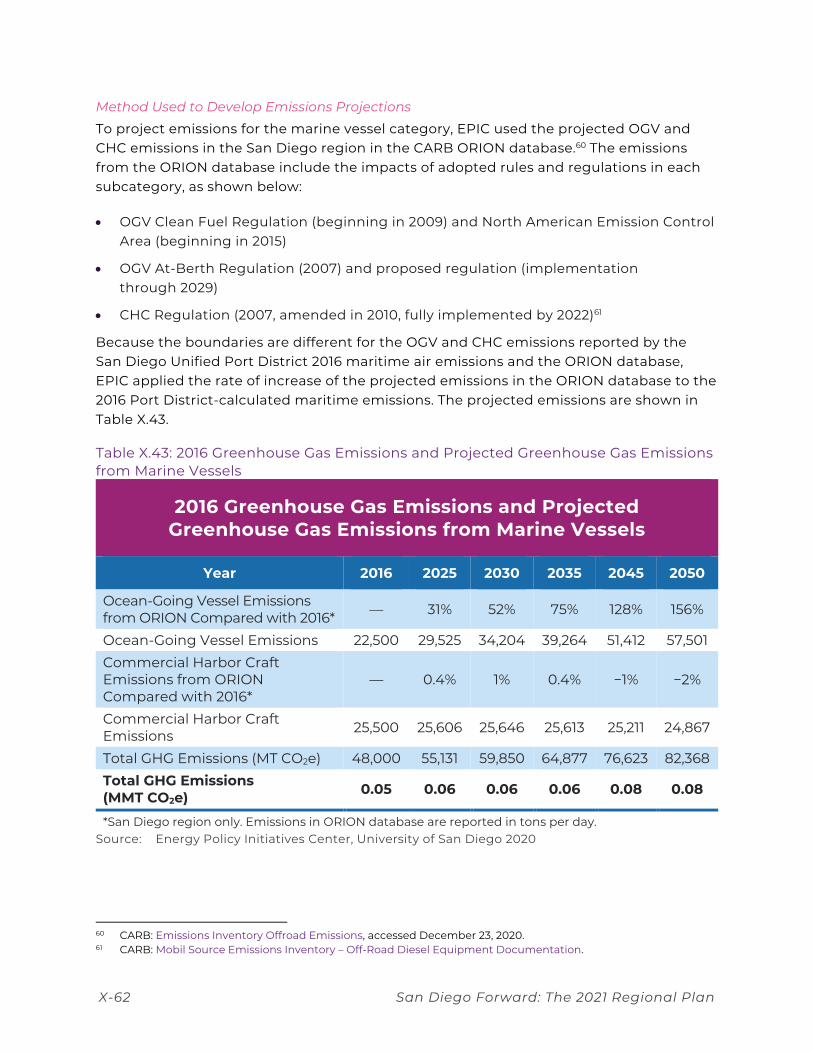
X-62 San Diego Forward: The 2021 Regional Plan
Method Used to Develop Emissions Projections
To project emissions for the marine vessel category, EPIC used the projected OGV and CHC emissions in the San Diego region in the CARB ORION database.60 The emissions from the ORION database include the impacts of adopted rules and regulations in each subcategory, as shown below:
• OGV Clean Fuel Regulation (beginning in 2009) and North American Emission Control Area (beginning in 2015)
• OGV At-Berth Regulation (2007) and proposed regulation (implementation through 2029)
• CHC Regulation (2007, amended in 2010, fully implemented by 2022)61
Because the boundaries are different for the OGV and CHC emissions reported by the San Diego Unified Port District 2016 maritime air emissions and the ORION database, EPIC applied the rate of increase of the projected emissions in the ORION database to the 2016 Port District-calculated maritime emissions. The projected emissions are shown in Table X.43.
Table X.43: 2016 Greenhouse Gas Emissions and Projected Greenhouse Gas Emissions from Marine Vessels
2016 Greenhouse Gas Emissions and Projected Greenhouse Gas Emissions from Marine Vessels
Year 2016 2025 2030 2035 2045 2050
Ocean-Going Vessel Emissions from ORION Compared with 2016* — 31% 52% 75% 128% 156%
Ocean-Going Vessel Emissions 22,500 29,525 34,204 39,264 51,412 57,501 Commercial Harbor Craft Emissions from ORION Compared with 2016*
— 0.4% 1% 0.4% −1% −2%
Commercial Harbor Craft Emissions 25,500 25,606 25,646 25,613 25,211 24,867
Total GHG Emissions (MT CO2e) 48,000 55,131 59,850 64,877 76,623 82,368 Total GHG Emissions (MMT CO2e) 0.05 0.06 0.06 0.06 0.08 0.08
*San Diego region only. Emissions in ORION database are reported in tons per day. Source: Energy Policy Initiatives Center, University of San Diego 2020
60 CARB: Emissions Inventory Offroad Emissions, accessed December 23, 2020. 61 CARB: Mobil Source Emissions Inventory – Off-Road Diesel Equipment Documentation.
San Diego Forward: The 2021 Regional Plan X-63
Soil Management Emissions from synthetic fertilizer use and crop residue or soil management contribute to 0.2% of total emissions in the 2016 inventory and 0.2% in the 2050 projection. The emissions are broken into two subcategories: farm emissions and non-farm emissions. The farm emissions account for the emissions due to agricultural soil management activities, such as synthetic fertilizers used for cultivation purposes to enhance the soil’s nutrients and emissions due to crop residue. The non-farm emissions account for synthetic fertilizers used for residential or commercial purposes.
Farm emissions due to agricultural synthetic fertilizer use include direct N2O emissions, indirect N2O emissions, and CO2 emissions from urea and lime application. The non-farm emissions only include direct N2O and indirect N2O emissions. The N2O emissions from crop residues are due to the nitrogen content in the residue.
Method Used to Estimate 2016 Emissions
EPIC followed the IPCC method to calculate the direct and indirect N2O and CO2 emissions from managed soils.62 The IPCC method calculates emissions from manure management, fertilizer application, and agricultural activities. Because the emissions from manure management are accounted for in the agriculture category, this section does not include these emissions.
To calculate the direct and indirect N2O emissions from fertilizer applications for both farm and non-farm activities, EPIC multiplied the tonnage used by the nitrogen content of each synthetic fertilizer.63 The nitrogen content of each fertilizer is based on the specific chemical content.64 If the specific chemical content of a fertilizer is not given, code 97 fertilizer with a 25-15-17 Nitrogen-Phosphorous-Potassium (NPK) composition is used.
The farm use soil management has N2O emissions from crop residue and from crop burning activities. Because the San Diego region does not have agricultural burning activities in 2016, EPIC only considered the emissions due to crop residue. Among the crops that have nitrogen content in their residue, only oats/hay are grown in the San Diego region. EPIC calculated the emissions from crop residue using the total nitrogen content in the crop residue based on the acres of crop cultivated.65 The CO2 emissions from urea application and from liming are based on the total quantities of urea and lime applied and their respective emission factors.63 Table X.44 shows the key inputs and results for the soil management emissions.
62 IPCC: N2O emissions from managed soils and CO2 emissions from Urea and Lime application, accessed on
August 2, 2020. 63 California Department of Food & Agriculture: 2016 Fertilizing Material Tonnage Report, accessed on
August 3, 2020. 64 International Fertilizer Association: fertilizer converter, accessed on August 3, 2020. This database provides
information on the nitrogen content percentage by weight of a given fertilizer. 65 California Department of Agriculture Weights & Measures: 2016 County of San Diego Crop Statistics and Annual
report, accessed on August 4, 2020.
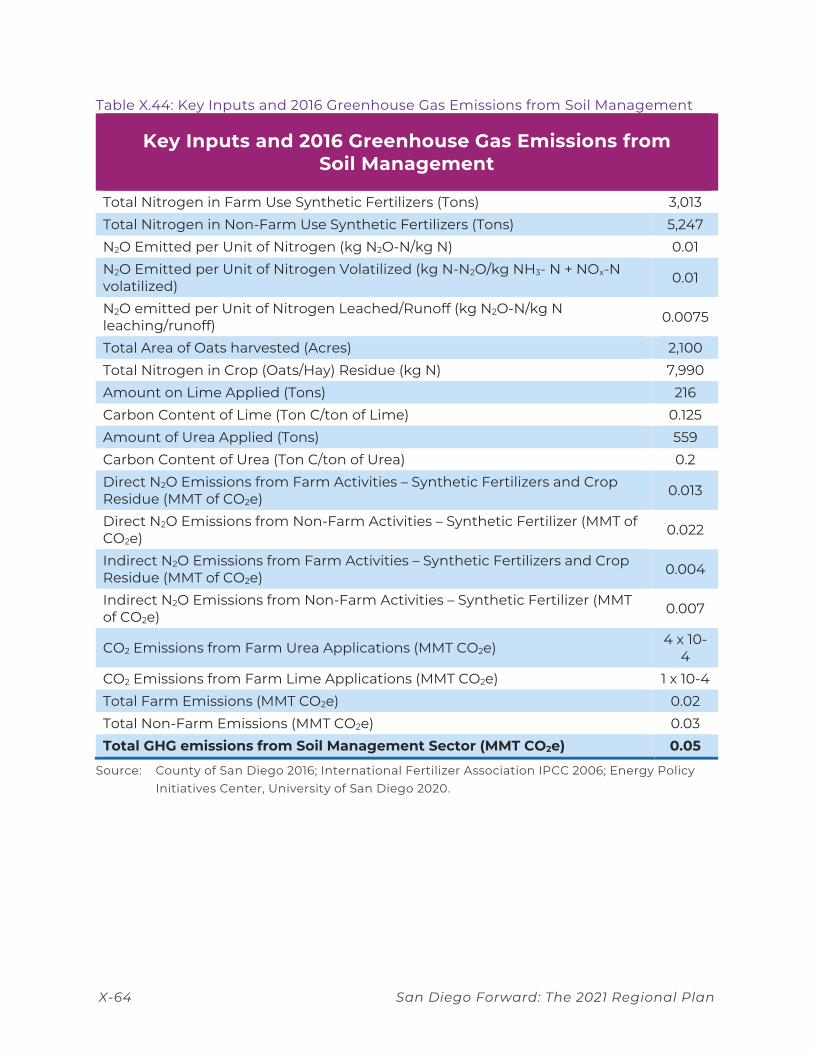
X-64 San Diego Forward: The 2021 Regional Plan
Table X.44: Key Inputs and 2016 Greenhouse Gas Emissions from Soil Management
Key Inputs and 2016 Greenhouse Gas Emissions from Soil Management
Total Nitrogen in Farm Use Synthetic Fertilizers (Tons) 3,013 Total Nitrogen in Non-Farm Use Synthetic Fertilizers (Tons) 5,247 N2O Emitted per Unit of Nitrogen (kg N2O-N/kg N) 0.01 N2O Emitted per Unit of Nitrogen Volatilized (kg N-N2O/kg NH3- N + NOx-N volatilized) 0.01
N2O emitted per Unit of Nitrogen Leached/Runoff (kg N2O-N/kg N leaching/runoff) 0.0075
Total Area of Oats harvested (Acres) 2,100 Total Nitrogen in Crop (Oats/Hay) Residue (kg N) 7,990 Amount on Lime Applied (Tons) 216 Carbon Content of Lime (Ton C/ton of Lime) 0.125 Amount of Urea Applied (Tons) 559 Carbon Content of Urea (Ton C/ton of Urea) 0.2 Direct N2O Emissions from Farm Activities – Synthetic Fertilizers and Crop Residue (MMT of CO2e) 0.013
Direct N2O Emissions from Non-Farm Activities – Synthetic Fertilizer (MMT of CO2e) 0.022
Indirect N2O Emissions from Farm Activities – Synthetic Fertilizers and Crop Residue (MMT of CO2e) 0.004
Indirect N2O Emissions from Non-Farm Activities – Synthetic Fertilizer (MMT of CO2e) 0.007
CO2 Emissions from Farm Urea Applications (MMT CO2e) 4 x 10⁻⁴
CO2 Emissions from Farm Lime Applications (MMT CO2e) 1 x 10⁻⁴ Total Farm Emissions (MMT CO2e) 0.02 Total Non-Farm Emissions (MMT CO2e) 0.03 Total GHG emissions from Soil Management Sector (MMT CO2e) 0.05
Source: County of San Diego 2016; International Fertilizer Association IPCC 2006; Energy Policy Initiatives Center, University of San Diego 2020.
San Diego Forward: The 2021 Regional Plan X-65
Difference from Previous 2012 Inventory
The previous 2012 inventory did not include emissions from soil management activities (fertilizer application and crop residue).
Method Used to Develop Emissions Projections
Direct and indirect N2O and CO2 emissions were projected to 2050 using the Microsoft Excel GROWTH function. EPIC calculated the emissions for the years 2016–2019 using the available data for oats harvested, fertilizer use, and the IPCC emission factors and projected the activity data out to 2050 with these values.66 Table X.45 shows the projection results for soil management emissions.
66 County of San Diego: 2017 County of San Diego Crop Statistics and Annual Report, 2018 County of San Diego
Crop Statistics and Annual Report, 2019 County of San Diego Crop Statistics and Annual Report. California Department of Food and Agriculture: 2017 Fertilizing Tonnage Report. 2018 Fertilizing Tonnage Report. 2019 Fertilizing Tonnage Report, accessed on April 22, 2020.
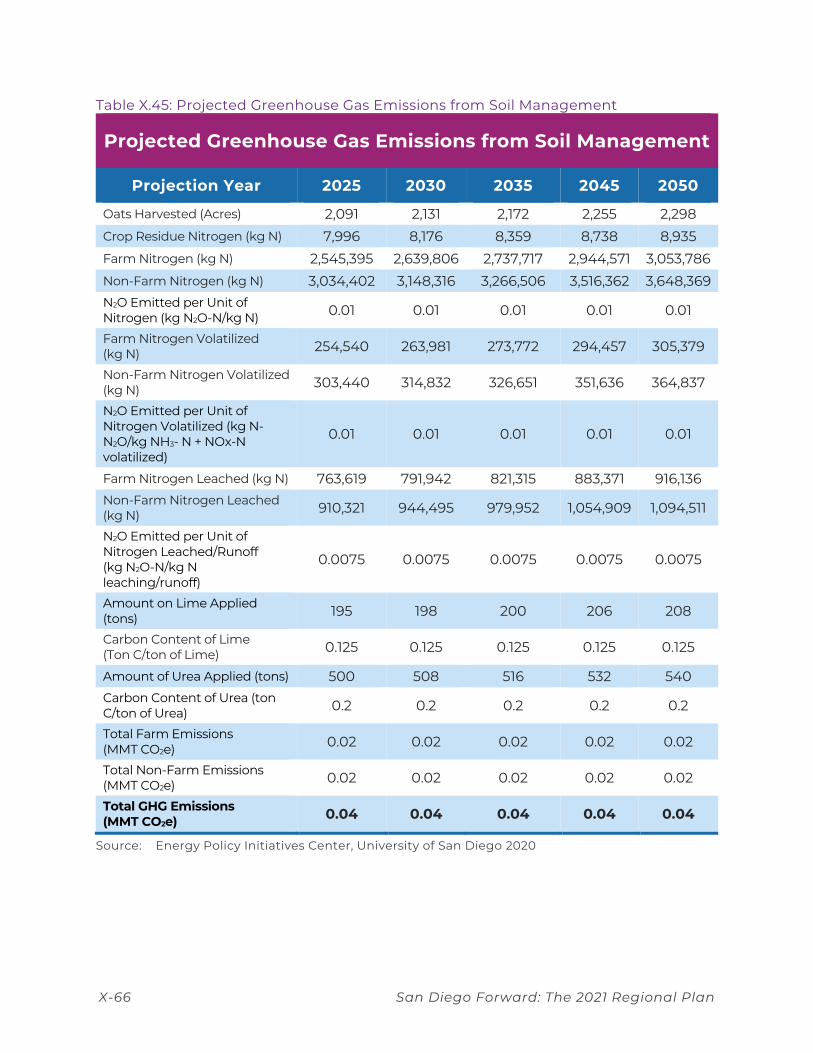
X-66 San Diego Forward: The 2021 Regional Plan
Table X.45: Projected Greenhouse Gas Emissions from Soil Management
Projected Greenhouse Gas Emissions from Soil Management
Projection Year 2025 2030 2035 2045 2050
Oats Harvested (Acres) 2,091 2,131 2,172 2,255 2,298 Crop Residue Nitrogen (kg N) 7,996 8,176 8,359 8,738 8,935 Farm Nitrogen (kg N) 2,545,395 2,639,806 2,737,717 2,944,571 3,053,786 Non-Farm Nitrogen (kg N) 3,034,402 3,148,316 3,266,506 3,516,362 3,648,369 N2O Emitted per Unit of Nitrogen (kg N2O-N/kg N) 0.01 0.01 0.01 0.01 0.01
Farm Nitrogen Volatilized (kg N) 254,540 263,981 273,772 294,457 305,379
Non-Farm Nitrogen Volatilized (kg N) 303,440 314,832 326,651 351,636 364,837
N2O Emitted per Unit of Nitrogen Volatilized (kg N-N2O/kg NH3- N + NOx-N volatilized)
0.01 0.01 0.01 0.01 0.01
Farm Nitrogen Leached (kg N) 763,619 791,942 821,315 883,371 916,136 Non-Farm Nitrogen Leached (kg N) 910,321 944,495 979,952 1,054,909 1,094,511
N2O Emitted per Unit of Nitrogen Leached/Runoff (kg N2O-N/kg N leaching/runoff)
0.0075 0.0075 0.0075 0.0075 0.0075
Amount on Lime Applied (tons) 195 198 200 206 208
Carbon Content of Lime (Ton C/ton of Lime) 0.125 0.125 0.125 0.125 0.125
Amount of Urea Applied (tons) 500 508 516 532 540 Carbon Content of Urea (ton C/ton of Urea) 0.2 0.2 0.2 0.2 0.2
Total Farm Emissions (MMT CO2e) 0.02 0.02 0.02 0.02 0.02
Total Non-Farm Emissions (MMT CO2e) 0.02 0.02 0.02 0.02 0.02
Total GHG Emissions (MMT CO2e) 0.04 0.04 0.04 0.04 0.04
Source: Energy Policy Initiatives Center, University of San Diego 2020