Appendix V Modification to a Road Standard: Driveway Spacing · Modification to a Road Standard:...
22
Appendix V Modification to a Road Standard: Driveway Spacing Meadowood (TM 5354) Traffic Study Appendix Page 668 of 771
Transcript of Appendix V Modification to a Road Standard: Driveway Spacing · Modification to a Road Standard:...

Appendix V Modification to a Road Standard: Driveway Spacing
Meadowood (TM 5354) Traffic Study Appendix Page 668 of 771

Meadowood (TM 5354) Traffic Study Appendix Page 669 of 771

Appendix W Landscape Plan
Meadowood (TM 5354) Traffic Study Appendix Page 670 of 771

Meadowood (TM 5354) Traffic Study Appendix Page 671 of 771

Appendix X Trails Graphic
Meadowood (TM 5354) Traffic Study Appendix Page 672 of 771

Meadowood (TM 5354) Traffic Study Appendix Page 673 of 771
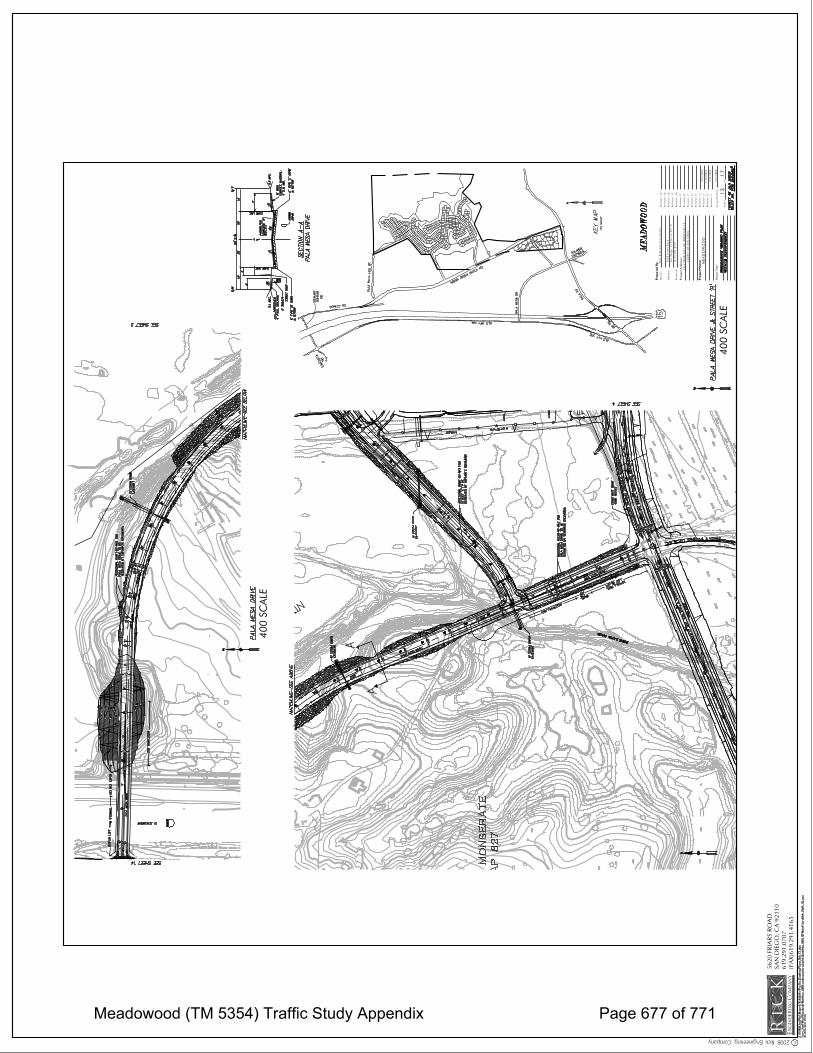
Appendix Y Proposed Roadway Striping
Meadowood (TM 5354) Traffic Study Appendix Page 674 of 771

Meadowood (TM 5354) Traffic Study Appendix Page 675 of 771

Meadowood (TM 5354) Traffic Study Appendix Page 676 of 771
Meadowood (TM 5354) Traffic Study Appendix Page 677 of 771

Meadowood (TM 5354) Traffic Study Appendix Page 678 of 771

Meadowood (TM 5354) Traffic Study Appendix Page 679 of 771

Appendix Z Direct Impact Intersection LOS Calculations with Mitigation and Signal Warrants
Meadowood (TM 5354) Traffic Study Appendix Page 680 of 771

AM Existing With Mitigation15: Reche Rd & Old Hwy 395 Timings
LOS Engineering
Lane Group EBL NBL NBT SBTLane ConfigurationsVolume (vph) 189 115 68 66Turn Type ProtProtected Phases 4 5 2 6Permitted PhasesDetector Phases 4 5 2 6Minimum Initial (s) 4.0 4.0 4.0 4.0Minimum Split (s) 20.0 8.0 20.0 20.0Total Split (s) 26.0 28.0 64.0 36.0Total Split (%) 28.9% 31.1% 71.1% 40.0%Yellow Time (s) 3.5 3.5 3.5 3.5All-Red Time (s) 0.5 0.5 0.5 0.5Lead/Lag Lead LagLead-Lag Optimize? Yes YesRecall Mode None None Min MinAct Effct Green (s) 20.2 9.2 20.8 10.1Actuated g/C Ratio 0.41 0.18 0.42 0.20v/c Ratio 0.62 0.43 0.09 0.44Control Delay 16.7 24.4 8.6 13.3Queue Delay 0.0 0.0 0.0 0.0Total Delay 16.7 24.4 8.6 13.3LOS B C A BApproach Delay 16.7 18.5 13.3Approach LOS B B B
Intersection SummaryCycle Length: 90Actuated Cycle Length: 49.3Natural Cycle: 60Control Type: Actuated-UncoordinatedMaximum v/c Ratio: 0.62Intersection Signal Delay: 16.3 Intersection LOS: BIntersection Capacity Utilization 53.0% ICU Level of Service AAnalysis Period (min) 15
Splits and Phases: 15: Reche Rd & Old Hwy 395
AM Existing With Mitigation15: Reche Rd & Old Hwy 395 Queues
LOS Engineering
Lane Group EBL NBL NBT SBTLane Group Flow (vph) 405 121 72 194v/c Ratio 0.62 0.43 0.09 0.44Control Delay 16.7 24.4 8.6 13.3Queue Delay 0.0 0.0 0.0 0.0Total Delay 16.7 24.4 8.6 13.3Queue Length 50th (ft) 73 32 12 22Queue Length 95th (ft) #211 79 29 74Internal Link Dist (ft) 2555 3330 4880Turn Bay Length (ft) 150Base Capacity (vph) 691 578 1271 835Starvation Cap Reductn 0 0 0 0Spillback Cap Reductn 0 0 0 0Storage Cap Reductn 0 0 0 0Reduced v/c Ratio 0.59 0.21 0.06 0.23
Intersection Summary# 95th percentile volume exceeds capacity, queue may be longer. Queue shown is maximum after two cycles.
Meadowood (TM 5354) Traffic Study Appendix Page 681 of 771

AM Existing With Mitigation15: Reche Rd & Old Hwy 395 HCM Signalized Intersection Capacity Analysis
LOS Engineering
Movement EBL EBR NBL NBT SBT SBRLane ConfigurationsIdeal Flow (vphpl) 1700 1700 1700 1900 1900 1700Total Lost time (s) 4.0 4.0 4.0 4.0Lane Util. Factor 1.00 1.00 1.00 1.00Frt 0.93 1.00 1.00 0.91Flt Protected 0.98 0.95 1.00 1.00Satd. Flow (prot) 1515 1583 1863 1701Flt Permitted 0.98 0.95 1.00 1.00Satd. Flow (perm) 1515 1583 1863 1701Volume (vph) 189 196 115 68 66 119Peak-hour factor, PHF 0.95 0.95 0.95 0.95 0.95 0.95Adj. Flow (vph) 199 206 121 72 69 125RTOR Reduction (vph) 33 0 0 0 89 0Lane Group Flow (vph) 372 0 121 72 105 0Turn Type ProtProtected Phases 4 5 2 6Permitted PhasesActuated Green, G (s) 20.3 7.6 21.7 10.1Effective Green, g (s) 20.3 7.6 21.7 10.1Actuated g/C Ratio 0.41 0.15 0.43 0.20Clearance Time (s) 4.0 4.0 4.0 4.0Vehicle Extension (s) 3.0 3.0 3.0 3.0Lane Grp Cap (vph) 615 241 809 344v/s Ratio Prot c0.25 c0.08 0.04 c0.06v/s Ratio Permv/c Ratio 0.61 0.50 0.09 0.30Uniform Delay, d1 11.7 19.5 8.3 17.0Progression Factor 1.00 1.00 1.00 1.00Incremental Delay, d2 1.7 1.6 0.0 0.5Delay (s) 13.4 21.1 8.4 17.5Level of Service B C A BApproach Delay (s) 13.4 16.4 17.5Approach LOS B B B
Intersection SummaryHCM Average Control Delay 15.1 HCM Level of Service BHCM Volume to Capacity ratio 0.50Actuated Cycle Length (s) 50.0 Sum of lost time (s) 12.0Intersection Capacity Utilization 53.0% ICU Level of Service AAnalysis Period (min) 15c Critical Lane Group
Meadowood (TM 5354) Traffic Study Appendix Page 682 of 771

PM Existing With Mitigation15: Reche Rd & Old Hwy 395 Timings
LOS Engineering
Lane Group EBL NBL NBT SBTLane ConfigurationsVolume (vph) 205 210 79 53Turn Type ProtProtected Phases 4 5 2 6Permitted PhasesDetector Phases 4 5 2 6Minimum Initial (s) 4.0 4.0 4.0 4.0Minimum Split (s) 20.0 8.0 20.0 20.0Total Split (s) 40.0 28.0 50.0 22.0Total Split (%) 44.4% 31.1% 55.6% 24.4%Yellow Time (s) 3.5 3.5 3.5 3.5All-Red Time (s) 0.5 0.5 0.5 0.5Lead/Lag Lead LagLead-Lag Optimize? Yes YesRecall Mode None None Min MinAct Effct Green (s) 17.2 12.6 24.4 10.9Actuated g/C Ratio 0.34 0.24 0.48 0.21v/c Ratio 0.73 0.59 0.09 0.46Control Delay 22.5 27.1 8.9 13.8Queue Delay 0.0 0.0 0.0 0.0Total Delay 22.5 27.1 8.9 13.8LOS C C A BApproach Delay 22.5 22.2 13.8Approach LOS C C B
Intersection SummaryCycle Length: 90Actuated Cycle Length: 51.2Natural Cycle: 60Control Type: Actuated-UncoordinatedMaximum v/c Ratio: 0.73Intersection Signal Delay: 20.3 Intersection LOS: CIntersection Capacity Utilization 59.9% ICU Level of Service BAnalysis Period (min) 15
Splits and Phases: 15: Reche Rd & Old Hwy 395
PM Existing With Mitigation15: Reche Rd & Old Hwy 395 Queues
LOS Engineering
Lane Group EBL EBR NBL NBT SBT SBRLane ConfigurationsIdeal Flow (vphpl) 1700 1700 1700 1900 1900 1700Storage Length (ft) 0 0 150 0Storage Lanes 1 0 1 0Total Lost Time (s) 4.0 4.0 4.0 4.0 4.0 4.0Leading Detector (ft) 50 50 50 50Trailing Detector (ft) 0 0 0 0Turning Speed (mph) 15 9 15 9Lane Util. Factor 1.00 1.00 1.00 1.00 1.00 1.00Frt 0.938 0.900Flt Protected 0.974 0.950Satd. Flow (prot) 1523 0 1583 1863 1676 0Flt Permitted 0.974 0.950Satd. Flow (perm) 1523 0 1583 1863 1676 0Right Turn on Red Yes YesSatd. Flow (RTOR) 57 143Headway Factor 1.00 1.00 1.00 1.00 1.00 1.00Link Speed (mph) 30 30 30Link Distance (ft) 2635 3410 4960Travel Time (s) 59.9 77.5 112.7Volume (vph) 205 176 210 79 53 152Peak Hour Factor 0.95 0.95 0.95 0.95 0.95 0.95Adj. Flow (vph) 216 185 221 83 56 160Lane Group Flow (vph) 401 0 221 83 216 0v/c Ratio 0.73 0.59 0.09 0.46Control Delay 22.5 27.1 8.9 13.8Queue Delay 0.0 0.0 0.0 0.0Total Delay 22.5 27.1 8.9 13.8Queue Length 50th (ft) 79 53 11 18Queue Length 95th (ft) 244 171 45 100Internal Link Dist (ft) 2555 3330 4880Turn Bay Length (ft) 150Base Capacity (vph) 842 615 1208 661Starvation Cap Reductn 0 0 0 0Spillback Cap Reductn 0 0 0 0Storage Cap Reductn 0 0 0 0Reduced v/c Ratio 0.48 0.36 0.07 0.33
Intersection SummaryArea Type: Other
Meadowood (TM 5354) Traffic Study Appendix Page 683 of 771

PM Existing With Mitigation15: Reche Rd & Old Hwy 395 HCM Signalized Intersection Capacity Analysis
LOS Engineering
Movement EBL EBR NBL NBT SBT SBRLane ConfigurationsIdeal Flow (vphpl) 1700 1700 1700 1900 1900 1700Total Lost time (s) 4.0 4.0 4.0 4.0Lane Util. Factor 1.00 1.00 1.00 1.00Frt 0.94 1.00 1.00 0.90Flt Protected 0.97 0.95 1.00 1.00Satd. Flow (prot) 1522 1583 1863 1676Flt Permitted 0.97 0.95 1.00 1.00Satd. Flow (perm) 1522 1583 1863 1676Volume (vph) 205 176 210 79 53 152Peak-hour factor, PHF 0.95 0.95 0.95 0.95 0.95 0.95Adj. Flow (vph) 216 185 221 83 56 160RTOR Reduction (vph) 38 0 0 0 112 0Lane Group Flow (vph) 363 0 221 83 104 0Turn Type ProtProtected Phases 4 5 2 6Permitted PhasesActuated Green, G (s) 17.2 10.4 25.3 10.9Effective Green, g (s) 17.2 10.4 25.3 10.9Actuated g/C Ratio 0.34 0.21 0.50 0.22Clearance Time (s) 4.0 4.0 4.0 4.0Vehicle Extension (s) 3.0 3.0 3.0 3.0Lane Grp Cap (vph) 518 326 933 362v/s Ratio Prot c0.24 c0.14 0.04 c0.06v/s Ratio Permv/c Ratio 0.70 0.68 0.09 0.29Uniform Delay, d1 14.4 18.5 6.6 16.6Progression Factor 1.00 1.00 1.00 1.00Incremental Delay, d2 4.3 5.5 0.0 0.4Delay (s) 18.7 24.0 6.6 17.0Level of Service B C A BApproach Delay (s) 18.7 19.3 17.0Approach LOS B B B
Intersection SummaryHCM Average Control Delay 18.5 HCM Level of Service BHCM Volume to Capacity ratio 0.58Actuated Cycle Length (s) 50.5 Sum of lost time (s) 12.0Intersection Capacity Utilization 59.9% ICU Level of Service BAnalysis Period (min) 15c Critical Lane Group
Meadowood (TM 5354) Traffic Study Appendix Page 684 of 771

AM Existing + Project With Mitigation15: Reche Rd & Old Hwy 395 Timings
LOS Engineering
Lane Group EBL NBL NBT SBTLane ConfigurationsVolume (vph) 189 142 163 97Turn Type ProtProtected Phases 4 5 2 6Permitted PhasesDetector Phases 4 5 2 6Minimum Initial (s) 4.0 4.0 4.0 4.0Minimum Split (s) 20.0 8.0 20.0 20.0Total Split (s) 43.0 23.0 47.0 24.0Total Split (%) 47.8% 25.6% 52.2% 26.7%Yellow Time (s) 3.5 3.5 3.5 3.5All-Red Time (s) 0.5 0.5 0.5 0.5Lead/Lag Lead LagLead-Lag Optimize? Yes YesRecall Mode None None Min MinAct Effct Green (s) 17.3 10.4 24.8 13.2Actuated g/C Ratio 0.34 0.19 0.48 0.26v/c Ratio 0.74 0.48 0.19 0.46Control Delay 22.0 28.1 9.6 19.6Queue Delay 0.0 0.0 0.0 0.0Total Delay 22.0 28.1 9.6 19.6LOS C C A BApproach Delay 22.0 18.2 19.6Approach LOS C B B
Intersection SummaryCycle Length: 90Actuated Cycle Length: 51.5Natural Cycle: 60Control Type: Actuated-UncoordinatedMaximum v/c Ratio: 0.74Intersection Signal Delay: 20.2 Intersection LOS: CIntersection Capacity Utilization 57.0% ICU Level of Service BAnalysis Period (min) 15
Splits and Phases: 15: Reche Rd & Old Hwy 395
AM Existing + Project With Mitigation15: Reche Rd & Old Hwy 395 Queues
LOS Engineering
Lane Group EBL EBR NBL NBT SBT SBRLane ConfigurationsIdeal Flow (vphpl) 1700 1700 1700 1900 1900 1700Storage Length (ft) 0 0 150 0Storage Lanes 1 0 1 0Total Lost Time (s) 4.0 4.0 4.0 4.0 4.0 4.0Leading Detector (ft) 50 50 50 50Trailing Detector (ft) 0 0 0 0Turning Speed (mph) 15 9 15 9Lane Util. Factor 1.00 1.00 1.00 1.00 1.00 1.00Frt 0.930 0.926Flt Protected 0.977 0.950Satd. Flow (prot) 1514 0 1583 1863 1725 0Flt Permitted 0.977 0.950Satd. Flow (perm) 1514 0 1583 1863 1725 0Right Turn on Red Yes YesSatd. Flow (RTOR) 77 63Headway Factor 1.00 1.00 1.00 1.00 1.00 1.00Link Speed (mph) 30 30 30Link Distance (ft) 2635 3410 4960Travel Time (s) 59.9 77.5 112.7Volume (vph) 189 206 142 163 97 119Peak Hour Factor 0.95 0.95 0.95 0.95 0.95 0.95Adj. Flow (vph) 199 217 149 172 102 125Lane Group Flow (vph) 416 0 149 172 227 0v/c Ratio 0.74 0.48 0.19 0.46Control Delay 22.0 28.1 9.6 19.6Queue Delay 0.0 0.0 0.0 0.0Total Delay 22.0 28.1 9.6 19.6Queue Length 50th (ft) 79 37 24 40Queue Length 95th (ft) 238 126 85 144Internal Link Dist (ft) 2555 3330 4880Turn Bay Length (ft) 150Base Capacity (vph) 870 509 1177 676Starvation Cap Reductn 0 0 0 0Spillback Cap Reductn 0 0 0 0Storage Cap Reductn 0 0 0 0Reduced v/c Ratio 0.48 0.29 0.15 0.34
Intersection SummaryArea Type: Other
Meadowood (TM 5354) Traffic Study Appendix Page 685 of 771

AM Existing + Project With Mitigation15: Reche Rd & Old Hwy 395 HCM Signalized Intersection Capacity Analysis
LOS Engineering
Movement EBL EBR NBL NBT SBT SBRLane ConfigurationsIdeal Flow (vphpl) 1700 1700 1700 1900 1900 1700Total Lost time (s) 4.0 4.0 4.0 4.0Lane Util. Factor 1.00 1.00 1.00 1.00Frt 0.93 1.00 1.00 0.93Flt Protected 0.98 0.95 1.00 1.00Satd. Flow (prot) 1513 1583 1863 1724Flt Permitted 0.98 0.95 1.00 1.00Satd. Flow (perm) 1513 1583 1863 1724Volume (vph) 189 206 142 163 97 119Peak-hour factor, PHF 0.95 0.95 0.95 0.95 0.95 0.95Adj. Flow (vph) 199 217 149 172 102 125RTOR Reduction (vph) 51 0 0 0 47 0Lane Group Flow (vph) 365 0 149 172 180 0Turn Type ProtProtected Phases 4 5 2 6Permitted PhasesActuated Green, G (s) 17.3 8.5 25.7 13.2Effective Green, g (s) 17.3 8.5 25.7 13.2Actuated g/C Ratio 0.34 0.17 0.50 0.26Clearance Time (s) 4.0 4.0 4.0 4.0Vehicle Extension (s) 3.0 3.0 3.0 3.0Lane Grp Cap (vph) 513 264 939 446v/s Ratio Prot c0.24 c0.09 0.09 c0.10v/s Ratio Permv/c Ratio 0.71 0.56 0.18 0.40Uniform Delay, d1 14.7 19.5 6.9 15.6Progression Factor 1.00 1.00 1.00 1.00Incremental Delay, d2 4.6 2.8 0.1 0.6Delay (s) 19.3 22.3 7.0 16.2Level of Service B C A BApproach Delay (s) 19.3 14.1 16.2Approach LOS B B B
Intersection SummaryHCM Average Control Delay 16.9 HCM Level of Service BHCM Volume to Capacity ratio 0.58Actuated Cycle Length (s) 51.0 Sum of lost time (s) 12.0Intersection Capacity Utilization 57.0% ICU Level of Service BAnalysis Period (min) 15c Critical Lane Group
Meadowood (TM 5354) Traffic Study Appendix Page 686 of 771

PM Existing + Project With Mitigation15: Reche Rd & Old Hwy 395 Timings
LOS Engineering
Lane Group EBL NBL NBT SBTLane ConfigurationsVolume (vph) 205 224 127 164Turn Type ProtProtected Phases 4 5 2 6Permitted PhasesDetector Phases 4 5 2 6Minimum Initial (s) 4.0 4.0 4.0 4.0Minimum Split (s) 20.0 8.0 20.0 20.0Total Split (s) 37.0 24.0 53.0 29.0Total Split (%) 41.1% 26.7% 58.9% 32.2%Yellow Time (s) 3.5 3.5 3.5 3.5All-Red Time (s) 0.5 0.5 0.5 0.5Lead/Lag Lead LagLead-Lag Optimize? Yes YesRecall Mode None None Min MinAct Effct Green (s) 20.6 13.9 31.2 17.0Actuated g/C Ratio 0.33 0.22 0.50 0.28v/c Ratio 0.80 0.68 0.14 0.65Control Delay 29.9 37.7 9.2 27.2Queue Delay 0.0 0.0 0.0 0.0Total Delay 29.9 37.7 9.2 27.2LOS C D A CApproach Delay 29.9 27.4 27.2Approach LOS C C C
Intersection SummaryCycle Length: 90Actuated Cycle Length: 61.8Natural Cycle: 60Control Type: Actuated-UncoordinatedMaximum v/c Ratio: 0.80Intersection Signal Delay: 28.3 Intersection LOS: CIntersection Capacity Utilization 68.7% ICU Level of Service CAnalysis Period (min) 15
Splits and Phases: 15: Reche Rd & Old Hwy 395
PM Existing + Project With Mitigation15: Reche Rd & Old Hwy 395 Queues
LOS Engineering
Lane Group EBL EBR NBL NBT SBT SBRLane ConfigurationsIdeal Flow (vphpl) 1700 1700 1700 1900 1900 1700Storage Length (ft) 0 0 150 0Storage Lanes 1 0 1 0Total Lost Time (s) 4.0 4.0 4.0 4.0 4.0 4.0Leading Detector (ft) 50 50 50 50Trailing Detector (ft) 0 0 0 0Turning Speed (mph) 15 9 15 9Lane Util. Factor 1.00 1.00 1.00 1.00 1.00 1.00Frt 0.932 0.935Flt Protected 0.976 0.950Satd. Flow (prot) 1516 0 1583 1863 1742 0Flt Permitted 0.976 0.950Satd. Flow (perm) 1516 0 1583 1863 1742 0Right Turn on Red Yes YesSatd. Flow (RTOR) 64 51Headway Factor 1.00 1.00 1.00 1.00 1.00 1.00Link Speed (mph) 30 30 30Link Distance (ft) 2635 3410 4960Travel Time (s) 59.9 77.5 112.7Volume (vph) 205 208 224 127 164 152Peak Hour Factor 0.95 0.95 0.95 0.95 0.95 0.95Adj. Flow (vph) 216 219 236 134 173 160Lane Group Flow (vph) 435 0 236 134 333 0v/c Ratio 0.80 0.68 0.14 0.65Control Delay 29.9 37.7 9.2 27.2Queue Delay 0.0 0.0 0.0 0.0Total Delay 29.9 37.7 9.2 27.2Queue Length 50th (ft) 128 82 23 99Queue Length 95th (ft) 298 #208 64 233Internal Link Dist (ft) 2555 3330 4880Turn Bay Length (ft) 150Base Capacity (vph) 746 481 1186 706Starvation Cap Reductn 0 0 0 0Spillback Cap Reductn 0 0 0 0Storage Cap Reductn 0 0 0 0Reduced v/c Ratio 0.58 0.49 0.11 0.47
Intersection SummaryArea Type: Other# 95th percentile volume exceeds capacity, queue may be longer. Queue shown is maximum after two cycles.
Meadowood (TM 5354) Traffic Study Appendix Page 687 of 771

PM Existing + Project With Mitigation15: Reche Rd & Old Hwy 395 HCM Signalized Intersection Capacity Analysis
LOS Engineering
Movement EBL EBR NBL NBT SBT SBRLane ConfigurationsIdeal Flow (vphpl) 1700 1700 1700 1900 1900 1700Total Lost time (s) 4.0 4.0 4.0 4.0Lane Util. Factor 1.00 1.00 1.00 1.00Frt 0.93 1.00 1.00 0.94Flt Protected 0.98 0.95 1.00 1.00Satd. Flow (prot) 1516 1583 1863 1742Flt Permitted 0.98 0.95 1.00 1.00Satd. Flow (perm) 1516 1583 1863 1742Volume (vph) 205 208 224 127 164 152Peak-hour factor, PHF 0.95 0.95 0.95 0.95 0.95 0.95Adj. Flow (vph) 216 219 236 134 173 160RTOR Reduction (vph) 42 0 0 0 37 0Lane Group Flow (vph) 393 0 236 134 296 0Turn Type ProtProtected Phases 4 5 2 6Permitted PhasesActuated Green, G (s) 20.6 11.2 32.2 17.0Effective Green, g (s) 20.6 11.2 32.2 17.0Actuated g/C Ratio 0.34 0.18 0.53 0.28Clearance Time (s) 4.0 4.0 4.0 4.0Vehicle Extension (s) 3.0 3.0 3.0 3.0Lane Grp Cap (vph) 514 292 987 487v/s Ratio Prot c0.26 c0.15 0.07 c0.17v/s Ratio Permv/c Ratio 0.76 0.81 0.14 0.61Uniform Delay, d1 17.9 23.8 7.2 19.0Progression Factor 1.00 1.00 1.00 1.00Incremental Delay, d2 6.7 15.0 0.1 2.2Delay (s) 24.6 38.8 7.3 21.2Level of Service C D A CApproach Delay (s) 24.6 27.4 21.2Approach LOS C C C
Intersection SummaryHCM Average Control Delay 24.5 HCM Level of Service CHCM Volume to Capacity ratio 0.72Actuated Cycle Length (s) 60.8 Sum of lost time (s) 12.0Intersection Capacity Utilization 68.7% ICU Level of Service CAnalysis Period (min) 15c Critical Lane Group
Meadowood (TM 5354) Traffic Study Appendix Page 688 of 771

Meadowood (TM 5354) Traffic Study Appendix Page 689 of 771