Appendix )ORZ 7UDFNHU %URFKXUH DQG … · measurements or over 150,000 ... Any reference to...
61
Selenium, Hydrogeology, and Water Quality, BCW Watershed FINAL REPORT Appendix –
Transcript of Appendix )ORZ 7UDFNHU %URFKXUH DQG … · measurements or over 150,000 ... Any reference to...

Selenium, Hydrogeology, and Water Quality, BCW Watershed FINAL REPORT
Appendix 4D – Flow Tracker Brochure and Operating Manual

FlowTrackerH a n d h e l d A D V
S O N T E K
Standard Features
• Low-profile 2-D ADV water velocitysensor on 2m flexible cable (measurein depths down to 2cm (1 inch))
• Automatic discharge computationprotocols (ISO/USGS mid-section,mean-section, and Japanese)
• Handheld keypad interface with real-timedisplay
•Velocity methods: ISO, USGS, under ice,Kreps, 5-point, and multipoint
• Languages supported: English, Spanish,German, Italian, and French
• Recorder space: up to 64 dischargemeasurements or over 150,000individual velocity samples
• Data Set Documentation: up to 20 valuesof time-stamped user commentsincluding gauge height and rated flow
• QA/QC: automated data review anddischarge uncertainty calculations
• Communication protocol: RS232• Software: Windows software with diag-
nostic beam-check, recorder access, datavisualization and customizable reports
• Compatible with FlowPack VelocityIndexing software
• Temperature sensor• Hard plastic case
Optional Features
• 2-D/3-D ADV side-looking probe• 3m flexible cable• Deluxe SonTek two piece, top-setting
wading rod kit (1.2m Metric or 4 ftEnglish) including case and mountingbrackets
• Wading rod mounting bracket forcontroller/keypad
• Offset mounting bracket for ADV probe
Specifications
• Velocity range: ±0.001 to 4.0 m/s(±0.003 to 13 ft/s)
• Velocity resolution: 0.0001 m/s• Velocity accuracy: ±1% of measured
velocity, ±0.25 cm/s• Sampling volume location: 10 cm from
center transducer• Power supply: 8 AA batteries• Typical battery life: 25+ hours continuous
operation (alkaline batteries)• Weight: 1.8 kg/4.0 lbs• Probe width: 130 mm (5.1 inches)• Handheld controller/keypad: temporarily
submersible to 1m• Operating temperature: -20o to 50o C• Storage temperature: -20o to 50o C
SonTek/YSI, founded in 1992 and advancing environmental science in over 100 countries, manufactures affordable,reliable acoustic Doppler instrumentation for water velocity measurement in oceans, rivers, lakes, harbors, estuaries,and laboratories. Headquarters are located in San Diego, California. Additional information can be found at www.sontek.com. SonTek/YSI is an employee-owned company.
SonTek, ADV and FlowTracker are trademarks of SonTek/YSI Inc., San Diego, CA USAThe FlowTracker is made in the USA. FT Brochure 10/06, Rev. 4 - Oxford Group
SonTek/YSI Inc.9940 Summers Ridge RoadSan Diego, CA 92121Tel: +1 (858) 546-8327Fax: + (858) 546-8150Email: [email protected]
SmartQC is abuilt-in quality control
feature that gives you theadded assurance your FlowTracker data iscorrect. With each measurement, data iscompared to a variety of adaptive QC criteriato ensure the best measurement possible.
SmartQC is our exclusive promise yourSonTek/YSI system is performing at optimum standards and that your data isprecise, reliable and exceeds your serviceexpectations.
®
®
FEATURING
The SonTek Deluxe wading rod,featuring a sturdy grip
and bubble level
FlowPack Velocity Indexing report software
Rugged case provided with optional top-setting rod
No other wading discharge device on themarket comes with more useful options and accessories, making the FlowTracker a complete, turn-key solution.
FlowTracker®
Nothing in this area
6” short foldfront cover

FlowTracker in the Field
With rugged construction for any climate and a backlit display easily read during both day andnight, the FlowTracker goes wherever you need it to go.
• Natural Streams • Irrigation Canals • Mining Channels • Water Treatment• Weirs/Flumes • Storm Water• Open Channels • Lakes
Nothing in this area
Sound Principles. Good Advice.
Portable. Precise. Practical.
Designed with the field user in mind, this handheld ADV® (Acoustic Doppler Velocimeter) measures2D or 3D currents, attaches easily to wading rods, and features an automatic discharge computa-tion using a variety of international methods, including ISO and USGS standards. At the end of thedata run, just press a button and the FlowTracker calculates the discharge for you!
The FlowTracker is the ideal solution if you're looking for:• Help in challenging outdoor conditions• A way to avoid recurring calibration/maintenance• Tough equipment that doesn't break down all the time• Unmatched performance in shallow water and low flows• An easy-to-use interface• Fewer steps to follow• Built-in quality checks (SmartQC) so you know your data is right.
The handy FlowTracker keypad is custom-designed for both discharge measurements and general purpose water velocity. Featuring provisions forstarting edges, multiple channels, and even ice covered water, it is ready forany environmental situation. In addition, the FlowTracker's intelligent algorithmautomatically prompts you for the proper measurement method based on yourprevious measurement stations.
The FlowTracker Advantage
It doesn’t matter if you are new to acoustic Doppler technology, or an old familiar friend, theFlowTracker provides unparalleled benefits you will only find with SonTek/YSI systems. Here issome of what sets the FlowTracker apart.
• Multi-language instrument and software (English, Spanish, French, Italian, and German)• Proven velocity precision - accurate to as low as 0.001 m/s (0.003 ft/s) and up to
4.0 m/s (13 ft/s)• Automatic discharge calculation - International techniques, including ISO and USGS standards• Record changing gauge heights and rated flows, with comments in each measurement• Automatic discharge uncertainty calculation to ISO standard. A FlowTracker First!• Measure velocities in water as shallow as 2 cm (less than an 1 inch)• Keypad interface with real-time velocity and flow display• Automatic quality control for accurate data collection• Two or three dimensional velocity measurement• Recorded data is shielded from power loss• Lightweight, rugged, and waterproof• No calibration required - ever!• Built-in temperature sensor
FlowTracker Software Speaks Your Language
The FlowTracker comes with user-friendly, data analysis software that helps you produce attractive, customizable and professional reports in minutes. FlowTracker software also supportsseveral languages, making it an ideal solution for international applications.
Example of FlowTracker discharge software and reports
Irrigation Canals
Spot Current Sampling
River Discharge and Flow
WadingDischargeMeasurementDeviceFlowTracker
H a n d h e l d A D V ®
®
Example of typical stance and technique when using
the FlowTracker
2D/3D side-looking
probe
2D side-looking
probe

Washington State Department of Ecology Environmental Assessment Program Standard Operating Procedure for Operation of the SonTek® FlowTracker® Handheld ADV
®
Version 1.0 Author – Tyler W. Burks, EOS FMU Date – February 26, 2009 Reviewer – Mitch Wallace, EOS FMU Date – March 30, 2009 QA Approval - William R. Kammin, Ecology Quality Assurance Officer Date – EAP058 APPROVED: June 24, 2009 Signatures on File

X:\EA PROGRAM\ECYEAPSOP\Approved SOPs\ECY_EAP_SOP_OperationofSonTekFlowTrackerHandheldADV_v1_0.doc_06/24/09_Page 2
Please note that the Washington State Department of Ecology’s Standard Operating Procedures (SOPs) are adapted from published methods, or developed by in-house technical and administrative experts. Their primary purpose is for internal Ecology use, although sampling and administrative SOPs may have a wider utility. Our SOPs do not supplant official published methods. Distribution of these SOPs does not constitute an endorsement of a particular procedure or method. Any reference to specific equipment, manufacturer, or supplies is for descriptive purposes only and does not constitute an endorsement of a particular product or service by the author or by the Department of Ecology. Although Ecology follows the SOP in most instances, there may be instances in which Ecology uses an alternative methodology, procedure, or process.

X:\EA PROGRAM\ECYEAPSOP\Approved SOPs\ECY_EAP_SOP_OperationofSonTekFlowTrackerHandheldADV_v1_0.doc_06/24/09_Page 3
SOP Revision History Revision Date Rev
number Summary of changes Sections Reviser(s)
X:\EA PROGRAM\ECYEAPSOP\Approved SOPs\ECY_EAP_SOP_OperationofSonTekFlowTrackerHandheldADV_v1_0.doc_06/24/09_Page 4
Environmental Assessment Program Standard Operating Procedure for Measuring Stream Discharge using the SonTek® FlowTracker® Handheld ADV
®
Introduction The SonTek® FlowTracker®
Handheld Acoustic Doppler Velocimeter (FlowTracker) is the primary instrument used for measuring surface freshwater discharge in wadeable streams by the Environmental Assessment Program (EAP) Freshwater Monitoring Unit (FMU). The FlowTracker ADV operates at an acoustic frequency of 10 MHz and measures the phase change caused by the Doppler shift in acoustic frequency that occurs when a transmitted acoustic signal reflects off particles in the flow of water. The magnitude of the phase change is proportional to the flow velocity. In cooperation with the United States Geological Survey, SonTek/YSI Inc. adapted this previously lab-restricted technology for use by hydrographers in wadeable streams, via a Top-set wading rod.
1.0 Purpose and Scope 1.1 This document is the Environmental Assessment Program (EAP) Freshwater
Monitoring Unit (FMU) Standard Operating Procedure (SOP) for measuring stream discharge using the SonTek FlowTracker Handheld ADV.
1.2 The procedure for operation, maintenance, quality assurance, and data management for
producing a surface water measurement with the FlowTracker is summarized in this document. The information hereafter is for quick reference and FMU relative supplementary information and is not a substitute for the SonTek FlowTracker Quick Start Guide, User’s Manual, or the more in-depth Technical Manual.
2.0 Applicability 2.1 This procedure is followed when conditions warrant a wading discharge measurement.
Certain steps in this procedure (i.e. maintenance and quality assurance) can be followed out of sequence during periodic maintenance or office processing of a discharge measurement.
3.0 Definitions 3.1 Acoustic Doppler Velocimeter (ADV): An instrument that measures stream velocity by
sensing the phase change caused by the Doppler shift in acoustic frequency that occurs when a transmitted acoustic signal reflects off particles in the flow.
3.2 Boundary: An underwater obstacle that impedes the transmission or receipt of the acoustic signal by the FlowTracker. The sampling range self-adjusts to some boundaries but may dramatically reduce recorded maximum velocity. The degree of interference is reported as the Boundary QC.

X:\EA PROGRAM\ECYEAPSOP\Approved SOPs\ECY_EAP_SOP_OperationofSonTekFlowTrackerHandheldADV_v1_0.doc_06/24/09_Page 5
3.3 Cross-section: A vertical plane oriented perpendicular to the stream flow direction that extends from bank to bank and from the channel substrate to the water surface.
3.4 Discharge: The volume of water in a stream passing a given point at a given moment in
time and is determined by measuring the stream channel cross sectional area and the water’s mean velocity at the site selected.
3.5 QA Thermistor: An analytical probe comprised of thermally sensitive resistors used to measure water temperature for quality assurance purposes.
3.6 Quality control (QC) data: In addition to velocity, the FlowTracker records several quality control parameters. These include signal-to-noise ratio (SNR), standard error of velocity, boundary adjustment, the number of spikes filtered from data, and velocity angle. For details about quality control data, see §8.1 of this document.
3.7 Signal-to-noise ratio (SNR): The ratio of the received acoustic signal strength to the
ambient noise level. It is expressed in the logarithmic unit of decibels (dB), and is the most important quality control data for the FlowTracker. Without sufficient SNR, the FlowTracker cannot measure velocity.
3.8 Standard error of velocity (σ V): A direct measure of the accuracy of the mean velocity
data. σ V is calculated by dividing the standard deviation of one-second samples by the square root of the number of samples.
4.0 Personnel Qualifications/Responsibilities
4.1 Personnel should possess knowledge of safely conducting discharge measurements by wading methods.
4.2 Anyone tasked to make a wading discharge measurement that has secured a FlowTracker from the FMU equipment pool.
5.0 Equipment, Reagents, and Supplies 5.1 2-D ADV Probe attached to FlowTracker Handheld Unit (Handheld Unit). 5.2 Top-Set Wading Rod with ADV Probe Mount and bubble level. 5.3 Mounting bracket for Handheld Unit. 5.4 Phillips-head screwdriver. 5.5 Discharge Measurement Notes Form (ECY 040-56 (Rev. 12/07)). 5.6 Personal Floatation Device. 5.7 Engineer’s Rule Measuring Tape (graduated in 10ths of feet to an appropriate length)
and two stakes (or means to secure measuring tape). 5.8 Attire suitable for entering the stream. 5.9 RS-232 Communication Cable. 5.10 External Computer with SonTek Software installed (SonTek FlowTracker v2.11,
SonUtils v4.00, and all versions of the manual). 5.11 Large container of turbid water (i.e. 5 gallon bucket or rectangular plastic tote).

X:\EA PROGRAM\ECYEAPSOP\Approved SOPs\ECY_EAP_SOP_OperationofSonTekFlowTrackerHandheldADV_v1_0.doc_06/24/09_Page 6
6.0 Summary of Procedure 6.1
Instrument Assembly
6.1.1 Remove 2-D ADV Probe, Handheld Unit, Mounting Bracket, and screwdriver from the protective case.
6.1.2 Attach Mounting Bracket via thumbscrews to the two threaded holes on the back of the
Handheld Unit. 6.1.3 Insert the Mounting Post of the ADV Probe into the ADV Probe Mount on the Top-Set
Wading Rod; tighten the Phillips-head setscrew with the supplied screwdriver.
(SonTek/YSI, Inc., 2006)
6.1.4 Place the Mounting Bracket on the post extending from the top of the Top-Set Wading Rod; tighten the bracket using the black plastic-capped setscrew.
(SonTek/YSI, Inc., 2006)

X:\EA PROGRAM\ECYEAPSOP\Approved SOPs\ECY_EAP_SOP_OperationofSonTekFlowTrackerHandheldADV_v1_0.doc_06/24/09_Page 7
6.2 Pre-Measurement Diagnostics:
are performed both in the office and field environment in order to verify proper system function. BeamCheck is a SonTek diagnostic tool used to test and track the integrity of the ADV Probe in a controlled environment before the unit is taken to the measurement location. Additionally, there are procedures that are followed in the field before the measurement is started to assure system function.
6.2.1 BeamCheck is conducted prior to deployment for a typical weeklong field excursion, after an extended period of non-use, or potential damage to the FlowTracker is suspected.
6.2.1.1 Fill a container (five-gallon bucket or rectangular plastic tote) with at least 12 inches of
water. This water must be turbid enough to reflect the transmitted acoustic pulses back to the receivers at the ADV Probe. If using tap water, add a handful of fine-grained dirt and stir into the container until suspended.
6.2.1.2 Connect the RS-232 Communication cable between an external computer and the
threaded 5-pin connector to COM port at the base of the Handheld Unit. 6.2.1.3 Start up the external computer. 6.2.1.4 Turn the Handheld Unit on by holding down the yellow button on the keypad. 6.2.1.5 Run the FlowTracker software v2.11 (click Start | Programs | SonTek Software |
FlowTracker). 6.2.1.6 Click Connect to a FlowTracker. Select the correct COM port and click Connect. 6.2.1.7 Click BeamCheck 6.2.1.8 Submerge ADV Probe in turbid water assuring that it is a minimum of 2 inches from the
bottom of the container and ideally 8-12 inches from the edge of the container. It is important however that a boundary does exist.
6.2.1.9 In the upper right of the BeamCheck window, click Averaging. 6.2.1.10 Click Start then quickly click Record. 6.2.1.10.1 The software will log the BeamCheck session to a file. 6.2.1.10.2 Use the following file naming convention: FT*-YYYY-MM-DD.bmc. (*Depends on
the EAP assigned number to that particular FlowTracker unit). 6.2.1.10.3 Save the file to the external computer for future archiving. 6.2.1.11 After recording a minimum of 20 pings click Stop.

X:\EA PROGRAM\ECYEAPSOP\Approved SOPs\ECY_EAP_SOP_OperationofSonTekFlowTrackerHandheldADV_v1_0.doc_06/24/09_Page 8
6.2.1.11.1 The number of recorded pings is monitored in the upper left corner of the BeamCheck window.
6.2.1.11.2 The following diagram is an example of a near ideal Beam Check session:
6.2.1.11.3 Refer to SonTek/YSI FlowTracker Technical Manual (§6.5.5) for detailed explanation
of the sample diagram. Refer to SonTek/YSI FlowTracker Technical Manual (§6.5.6) for assistance with diagnosing potential hardware problems using BeamCheck.
6.2.1.12 Click File | Exit to close BeamCheck. 6.2.1.13 Click Disconnect. 6.2.1.14 Disconnect the RS-232 Communication cable from the Handheld Unit and external
computer. 6.2.1.15 Press and hold the yellow power button on the Handheld Unit until the screen is blank. 6.2.1.16 Disassemble the FlowTracker and secure for departure.
X:\EA PROGRAM\ECYEAPSOP\Approved SOPs\ECY_EAP_SOP_OperationofSonTekFlowTrackerHandheldADV_v1_0.doc_06/24/09_Page 9
6.2.2 Field Diagnostics are performed, with the instrument assembled, prior to each discharge measurement or periodically throughout the field excursion to confirm operation and capacity of the instrument.
6.2.2.1 The Recorder Status option checks the amount of space available on the 4-MB internal
memory of the Handheld Unit. 6.2.2.1.1 Press and hold the yellow power button to turn on the unit. 6.2.2.1.2 Press Enter for the Main Menu 6.2.2.1.3 Press 2 to access System Functions 6.2.2.1.4 Press 2 to access Recorder Status 6.2.2.1.4.1 The number of files recorded and the maximum number of files available will be
reported. On 4-MB of internal memory approximately 64 measurements can be conducted before the memory must be reformatted (erased).
6.2.2.1.5 Press Enter to return to the System Functions menu 6.2.2.1.6 If you have concerns regarding the amount of space available, Press 3 to Format
Recorder. 6.2.2.1.6.1 Before the internal memory is erased be sure to download the data to an external
computer, or confirm with others that the data has been properly archived. Once the memory is reformatted, the previous data is non-recoverable.
6.2.2.1.7 Press “1” “2” “3” and Enter to confirm your decision. 6.2.2.1.8 Press Enter after the format is complete to return to the System Functions menu. This
process will take approximately 15-60+ seconds. 6.2.2.2 Temperature Data should be checked for accuracy because it is used for sound speed
calculations and can affect velocity data. 6.2.2.2.1 Place the ADV Probe in the water that is to be measured. 6.2.2.2.2 From the System Functions menu Press 4 to access temperature data. 6.2.2.2.2.1 The temperature sensor is in the probe head and is accurate to ±0.1°C. The temperature
recorded is used for automatic sound speed correction. 6.2.2.2.3 This temperature value should be compared to an independent measurement of water
temperature (QA Thermistor) before a measurement is conducted. A difference of 5°C between the two values could result in an error of ≈ 2% in mean velocity determination.

X:\EA PROGRAM\ECYEAPSOP\Approved SOPs\ECY_EAP_SOP_OperationofSonTekFlowTrackerHandheldADV_v1_0.doc_06/24/09_Page 10
6.2.2.2.4 Press Enter to return to the System Functions menu. 6.2.2.3 Battery Data should be checked prior to each measurement to confirm that there is
capacity to complete the measurement. 6.2.2.3.1 From the System Functions menu Press 5 to access battery data. 6.2.2.3.1.1 The battery voltage and estimated remaining capacity (percent of total) based on voltage
will be displayed for three battery types. In most cases, Alkaline or NiMH batteries are available.
6.2.2.3.1.2 Alkaline batteries have an average continuous running time of 25 hours, with a
“drained” voltage of 7.0 V. 6.2.2.3.1.3 NiMH (1600mAh) batteries have an average continuous running time of 15 hours, with
a “drained” voltage of 8.0V. If the alkaline voltage drops, below ≈ 8.0 V, the batteries should be changed. Batteries cannot be changed during a measurement without the possibility of losing data,
6.2.2.3.1.4 It is important to check the battery data at ambient temperature because capacity can
vary greatly with environmental conditions. 6.2.2.3.2 Refer to SonTek/YSI FlowTracker Technical Manual (§7.2) for further information
regarding the Handheld Unit Power Supply. 6.2.2.3.3 Press Enter to return to the System Functions menu. 6.2.2.3.4 The batteries are accessed from the back of the Handheld Unit. 6.2.2.3.4.1 Turn the system off by holding down the yellow power button. 6.2.2.3.4.1.1 Special Note:
Each time the Handheld Unit is turned off, it is critical that you do so from the Main Menu. This ensures that all information is properly saved.
6.2.2.3.4.2 Remove the six screws holding the battery compartment lid to the main housing. 6.2.2.3.4.3 Remove the old batteries from the battery holder. 6.2.2.3.4.3.1 Place all discharged single-use alkaline batteries in a receptacle for proper recycling, or
recharge NiMH batteries for later reuse. 6.2.2.3.4.4 Install the new batteries, matching the orientation shown on the battery holder. 6.2.2.3.4.5 Secure the battery compartment lid using the six screws.

X:\EA PROGRAM\ECYEAPSOP\Approved SOPs\ECY_EAP_SOP_OperationofSonTekFlowTrackerHandheldADV_v1_0.doc_06/24/09_Page 11
6.2.2.3.4.6 Turn the system on and check the battery voltage level as described in §6.2.2.3.1 of this document.
6.2.2.3.4.6.1 New alkaline batteries will show approximately 12.0V, where NiMH will show
approximately 10.5V. 6.2.2.4 Confirm the System Clock displays the correct date and time (PST). 6.2.2.4.1 From the System Functions menu Press 9 to access Set System Clock. 6.2.2.4.2 If time and date are accurate Press 0 to exit back to the System Functions menu. 6.2.2.4.2.1 Change Date if not accurate. 6.2.2.4.2.1.1 Press 1 to change Date. 6.2.2.4.2.1.2 Type date on keypad YYYY/MM/DD. Use “.” for “/.” 6.2.2.4.2.1.3 Press Enter to return to Set System Clock menu. 6.2.2.4.2.2 Change Time (PST) if not accurate. 6.2.2.4.2.2.1 Press 2 to change Time. 6.2.2.4.2.2.2 Type time on keypad HH:MM:SS. Use “.” for “:.” 6.2.2.4.2.2.3 Press Enter to apply the set time and return to the Set System Clock menu. 6.2.2.4.2.3 Press 0 to exit back to the System Functions menu. 6.2.2.4.3 Press 0 to exit back to the Main Menu. 6.3 Setup Parameters determine how the FlowTracker collects data and establishes quality
control criteria. In most cases these settings will not vary from the USGS (Blanchard, 2007) recommended defaults. Instances of deviation will be mentioned below. It is however important to verify the setup parameters prior to deployment. (Special Note:
Press Enter to scroll through the Setup Parameters menu)
6.3.1 The Units System defines the units used for display and output data. 6.3.1.1 From the Main Menu Press 1 to enter the Setup Parameters menu 6.3.1.2 Confirm that the Unit System is “English.” 6.3.1.2.1 To change, Press 1 from the Setup Parameters menu.

X:\EA PROGRAM\ECYEAPSOP\Approved SOPs\ECY_EAP_SOP_OperationofSonTekFlowTrackerHandheldADV_v1_0.doc_06/24/09_Page 12
6.3.1.2.2 Press 1 to change the Units System to “English.” 6.3.2 The Avg Time (averaging time) option determines the period of sampling (in seconds)
for data collection at each station. 6.3.2.1 The current averaging time will be displayed in parentheses to the right of Avg Time. 6.3.2.2 Confirm that the Avg Time is 40 seconds. 6.3.2.3 To change, Press 2 from the Setup Parameters menu. 6.3.2.3.1 In normal measuring conditions the averaging time is 40 seconds which conforms to
EAP FMU and USGS standards. 6.3.2.3.2 In certain measurement conditions (Shedd, 2009) it is necessary to increase or decrease
the averaging time. The desired time can be entered on the keypad during step 6.3.2.3. 6.3.3 The Data Collection Mode (Mode) option determines the procedure when collecting a
series of measurement stations. 6.3.3.1 The current data collection mode will be displayed to the right of Mode. 6.3.3.2 Confirm that the Mode is set to “Discharge.” 6.3.3.3 To change, Press 3 from the Setup Parameters Menu. 6.3.3.4 Press 1 to set the mode to “Discharge”, or Press 2 to set the mode to “General.” 6.3.3.4.1 Typical discharge measurements require the Mode be set to “Discharge.” 6.3.3.4.2 The “General” mode is reserved for the storage of location and velocity information
without discharge calculation. This mode will not be discussed further in this document. Refer to SonTek/YSI FlowTracker Technical Manual §4.2.2 for further information.
6.3.4 The QC Settings menu sets quality control criteria for discharge measurements. To
access the QC Settings menu Press 4 from the Setup Parameters menu, this grants you access to multiple criteria.
6.3.4.1 Press 1 to set the SNR Threshold. 6.3.4.1.1 The SNR Threshold should be set to 10dB, which conforms to EAP FMU and USGS
standards. 6.3.4.1.2 The optimal operating range is ≈ 10dB; however, the FlowTracker can operate properly
at a ratio as low as 4dB. Below 4dB additional seeding material may be required to collect accurate data.

X:\EA PROGRAM\ECYEAPSOP\Approved SOPs\ECY_EAP_SOP_OperationofSonTekFlowTrackerHandheldADV_v1_0.doc_06/24/09_Page 13
6.3.4.1.3 For additional information regarding the SNR refer to SonTek FlowTracker Technical
Manual §1.4.2 6.3.4.2 Press 2 to set the σ V Threshold (Standard Error of Velocity Threshold). 6.3.4.2.1 The σ V Threshold should be set to 0.033 feet per second (ft/sec), which conforms to
EAP FMU and USGS standards. 6.3.4.2.2 σ V is normally dominated by real variations in the flow and will vary depending on the
measurement environment. 6.3.4.2.3 If the threshold is exceeded the observation can be repeated, with an adjustment of
location in the cross section if desired. In certain measurement environments threshold exceedances are unavoidable.
6.3.4.2.4 For additional information regarding the σ V refer to SonTek FlowTracker Technical
Manual §1.4.3 6.3.4.3 Press 3 to set the Spike Threshold. 6.3.4.3.1 The Spike Threshold should be set to 10%, which conforms to EAP FMU and USGS
standards. 6.3.4.3.2 Spikes in velocity data are inherent in all acoustic Doppler velocity sensors. Spikes have
many causes; but typically include: boundaries, highly aerated water, or acoustic anomalies.
6.3.4.3.3 A warning is given after a velocity observation if the percentage of spikes relative to the
total number of points exceeds 10%. In the case of a 40 second averaging time this threshold would be 5 spikes.
6.3.4.3.4 If the threshold is exceeded the observation can be repeated, with an adjustment of
location in the cross section if desired. In certain measurement environments threshold exceedances are unavoidable.
6.3.4.3.5 For additional information regarding the Spike Threshold refer to SonTek FlowTracker
Technical Manual §1.4.5 6.3.4.4 Press 4 to set the Max Velocity Angle. 6.3.4.4.1 The Max Velocity Angle should be set to 20°, which conforms to EAP FMU and
USGS standards. 6.3.4.4.2 Velocity angle is defined as the water flow direction relative to the FlowTracker’s X
measurement component.

X:\EA PROGRAM\ECYEAPSOP\Approved SOPs\ECY_EAP_SOP_OperationofSonTekFlowTrackerHandheldADV_v1_0.doc_06/24/09_Page 14
6.3.4.4.3 The following diagram by (Rehmel, 2007) illustrates the probe coordinate system
relative to the channel cross section.
(Rehmel, 2007) 6.3.4.4.4 The FlowTracker’s ability to measure two components of velocity eliminates the
requirement for the individual to measure and document flow angles at each station for later use in discharge computation of wading measurements.
6.3.4.4.5 If the threshold is exceeded the observation can be repeated, with an adjustment of
location in the cross section if desired. If however a majority of the channel flow is beyond 20-30° in a single direction (positive or negative) a new location for the measurement cross section should be considered.
6.3.4.4.6 For additional information regarding the Max Velocity Angle refer to SonTek
FlowTracker Technical Manual §1.4.6. 6.3.5 The Discharge Settings menu specifies settings for the discharge calculations and the
quality control criteria used for Discharge measurements. To access the Discharge Settings menu Press 5 from the Setup Parameters menu.

X:\EA PROGRAM\ECYEAPSOP\Approved SOPs\ECY_EAP_SOP_OperationofSonTekFlowTrackerHandheldADV_v1_0.doc_06/24/09_Page 15
6.3.5.1 From the Discharge Settings menu Press 1 to confirm the Equation used discharge calculation. The current equation used is in parentheses next to the word Equation.
6.3.5.1.1 The Equation should be set to Mid Section, which conforms to EAP FMU and USGS
standards. 6.3.5.1.2 If the Equation differs Press 1 to set to the Mid Section method. 6.3.5.1.3 By selecting the Mid Section method this sets Repeat Depth and Repeat Velocity to
“NO.” Repeat Depth and Repeat Velocity are only used in measurement methods non-standard to the EAP FMU and USGS.
6.3.5.2 From the Discharge Settings menu Press 4 to confirm the Max Section Discharge,
which is the percentage of the total discharge allowed in each section. 6.3.5.2.1 The Max Section Discharge should be set to 10%, which conforms to EAP FMU and
USGS standards. 6.3.5.2.2 The default Max Section Discharge is 10%. 6.3.5.2.3 The operator is given an alert during the measurement if a Rated discharge is entered,
or after the entire measurement is complete. For additional information regarding the Max Section Discharge refer to SonTek FlowTracker Technical Manual §1.4.7.
6.3.5.3 From the Discharge Settings menu Press 5 to confirm the Max Depth Change (default
50%), which is intended to alert the operator of potential depth entry errors. 6.3.5.3.1 If the entered depth differs from the previous or adjacent section by 50% the operator is
alerted and prompted to re-enter or accept the value. 6.3.5.3.2 For additional information regarding the Max Depth Change refer to SonTek
FlowTracker Technical Manual §1.4.8. 6.3.5.4 From the Discharge Settings menu Press 6 to confirm the Max Location Change
(default 100%), which is intended to alert the operator of potential location entry errors. 6.3.5.4.1 With a setting of 100% an alert will be given to the operator if the station spacing
changes by two-times or if a station is simply out of order. Stations can be entered out of order, however an alert is given to confirm the entry prior to sorting the location to the correct order.
6.3.5.4.2 For additional information regarding the Max Location Change refer to SonTek
FlowTracker Technical Manual §1.4.9. 6.3.5.5 From the Discharge Settings menu Press 7 to confirm the discharge Reference value.

X:\EA PROGRAM\ECYEAPSOP\Approved SOPs\ECY_EAP_SOP_OperationofSonTekFlowTrackerHandheldADV_v1_0.doc_06/24/09_Page 16
6.3.5.5.1 The discharge Reference value is used to compute percent discharge (%Q) at each station.
6.3.5.5.2 The operator has the option to compute %Q using a Rated or Measured discharge. 6.3.5.5.3 Rated is the default option, however, if a value is not supplied the Measured discharge
is used. 6.3.5.5.4 One benefit of entering a Rated discharge is that the operator is able to monitor the %Q
of each section as the measurement progresses; adding additional sections if necessary. 6.3.5.6 From the Discharge Settings menu Press 8 to select the Methods Displayed. This
allows the operator to select the options available to measure mean velocity at a section. 6.3.5.6.1 The EAP FMU only uses a limited number of the total methods available. The unused
methods can be turned off to reduce the number of methods toggled through during a measurement if a method change is required. Special Note:
To the right of each method the word ON or OFF will be displayed.
6.3.5.6.2 Based on current techniques employed by the EAP FMU the following Methods should be toggled to the ON position: 2-6-8 Methods, and Multi Methods.
6.3.5.6.3 Press 1 to toggle ON 2-6-8 Methods. 6.3.5.6.4 Press 5 to toggle ON Multi Methods. 6.3.5.6.5 For additional information regarding the methods available for the measurement of
mean velocity in a section refer to SonTek FlowTracker Technical Manual §5.2.4. 6.3.5.7 From the Discharge Settings menu Press 9 to confirm the Uncertainty calculation. 6.3.5.7.1 The Uncertainty calculation should be set to Stats (abbreviated from Statistical),
which conforms to EAP FMU standards. The Stats calculation provides an estimate of measurement uncertainty for each discharge calculation.
6.3.5.7.2 In addition to an overall statistical uncertainty calculation uncertainty is split into the
following components: accuracy, depth, velocity, and width. 6.3.5.7.3 The Stats Uncertainty calculation incorporates measurement uncertainty, natural
stream conditions (e.g., different bottom types), and the assumption that depth and velocity change linearly between stations.
6.3.5.7.4 For detailed information regarding the Stats Uncertainty calculation refer to SonTek
FlowTracker Technical Manual §5.2.5 and Appendix C.

X:\EA PROGRAM\ECYEAPSOP\Approved SOPs\ECY_EAP_SOP_OperationofSonTekFlowTrackerHandheldADV_v1_0.doc_06/24/09_Page 17
6.3.6 Salinity 6.3.6.1 The salinity of the water being measured can affect the sound speed which is used for
mean velocity determination. 6.3.6.2 Freshwater has a salinity of <0.5 ppt (parts per thousand) and seawater has a salinity of
35-50 ppt. 6.3.6.2.1 For the purposes of the EAP FMU, it is rare that the FlowTracker will be used in water
with a salinity that will affect the sound speed. However, salinity may affect sound speed in estuary (brackish), or polluted waters.
6.3.6.2.2 IMPORTANT: When using the FlowTracker in salt water, a sacrificial zinc anode
should be installed on the probe for corrosion protection. 6.3.6.3 It has been determined that an error of 12 ppt in salinity creates a ≈ 2% error in mean
velocity. 6.3.6.4 From the Setup Parameters Menu press 6 to change the Salinity value (in ppt). 6.3.7 Language 6.3.7.1 The FlowTracker firmware can be operated in five different languages: English, French,
German, Spanish, and Italian. 6.3.7.2 From the Setup Parameters Menu press 7 to change the Language. 6.3.7.3 Press 1 to set the firmware to English. 6.3.7.4 Consult the FlowTracker Technical Manual §2.4.7 if another language is desired. 6.4 Discharge Measurement Procedure 6.4.1
Summary of Site Selection Criteria
6.4.1.1 The first and often most critical step in determining the discharge of a watercourse is selecting a representative cross section. The following is a brief summary of site selection criteria that are specific to producing the best results with the SonTek FlowTracker. For a full description of measurement site selection criteria review (Shedd, 2009).
6.4.1.2 The channel is relatively straight for a distance (≈ 10-20 channel widths upstream and
downstream of the measurement site) to provide uniform flow through the measuring section.
6.4.1.3 Streamflow is perpendicular to the measurement cross section and tagline.

X:\EA PROGRAM\ECYEAPSOP\Approved SOPs\ECY_EAP_SOP_OperationofSonTekFlowTrackerHandheldADV_v1_0.doc_06/24/09_Page 18
6.4.1.4 The channel is free of obstructions (e.g., vegetation, woody debris, and variable
substrate sizes) and excessive turbulence that create negative velocity, uneven velocity distribution across the measurement cross section, or that interfere with the acoustic signal.
6.4.1.4.1 In some cases, especially shallow streams with variable substrate sizes, minor channel
modification may be necessary to improve a measurement site. 6.4.1.4.2 Modifications should be minor and conducted prior to the start of the flow
measurement. Be mindful of the potential for salmonid redds during appropriate seasons.
6.4.1.5 The water to be measured has sufficient particulate matter (fine sediment, organics, and
air) entrained to carry an acoustic signal. 6.4.2
Summary of the Mid-Section Method
6.4.2.1 The following is a brief summary of the mid-section method for determining stream discharge. A full explanation can be found in (Shedd, 2009).
6.4.2.2 The default method (§6.3.5.1) used by the FlowTracker for discharge calculation is the
mid-section method. This discharge setting organizes the entered measurement information for the operator and applies the mid-section equation to the data to calculate discharge. Therefore, only working knowledge of the mid-section method is necessary.
6.4.2.3 In order to accurately define the area and mean velocity of the channel, the cross section
is divided into multiple segments. A discharge measurement is the summation of the products of the partial areas of the stream cross section and their respective average velocities.
6.4.2.4 In the mid-section method of computing a discharge measurement, it is assumed that the
velocity sample at each point represents the mean velocity in a rectangular subsection. The subsection area extends laterally from half the distance from the preceding observation point to half the distance to the next, and vertically from the water surface to the sounded depth (Buchanan and Somers, 1969; Rantz et al., 1982).
6.4.3
Data Collection Procedure
6.4.3.1 Assemble the FlowTracker as described in §6.1 of this document. 6.4.3.2 Select the cross-section location and stretch the tagline perpendicular to the prominent
flow direction. 6.4.3.3 Begin filling out Discharge Measurement Notes Form (ECY 040-56 (Rev. 12/07)).

X:\EA PROGRAM\ECYEAPSOP\Approved SOPs\ECY_EAP_SOP_OperationofSonTekFlowTrackerHandheldADV_v1_0.doc_06/24/09_Page 19
6.4.3.4 Read and record all primary, secondary, and auxiliary gage indices (where applicable). 6.4.3.5 Read and record water temperature for future comparison to both station data and the
FlowTracker water temperature sensor. 6.4.3.6
Measurement Header Information
6.4.3.6.1 From the Main Menu Press 3 to Start Data Run 6.4.3.6.2 Press 1 to Name the data file. 6.4.3.6.2.1 Enter the station number (e.g., 45F110) using the keypad. It is similar to a touch-tone
phone keypad, where numbers are displayed first then letters. Press the individual key multiple time to reach the desired number or letter.
6.4.3.6.2.2 Press Enter when finished. 6.4.3.6.3 Press 2 to add an extension to the Data File Name. The extension should consist of the
3-digit date as an identifier. Press Enter when finished. 6.4.3.6.4 Review the Data File Name, displayed in parentheses, for accuracy. 6.4.3.6.5 Press 9 to accept the Data File Name. 6.4.3.6.6 Press 1 to enter the Site name, this name will be imported during post-processing into
the Hydstra database. 6.4.3.6.6.1 Enter the station number (e.g., 45F110) using the keypad. In this case the letters are
displayed first, and then numbers. If a key is needed for a consecutive letter/number combination, wait for the cursor to move to the next space before pressing the keypad.
6.4.3.6.6.2 Press Enter when finished. 6.4.3.6.7 Press 2 to enter Operator Name (initials). Enter your initials using the keypad. In this
case the letters are displayed first, and then numbers. Press Enter when finished. 6.4.3.7
Pre-measurement QC Data
6.4.3.7.1 Press 9 to Start. 6.4.3.7.2 Press 8 or QC Menu (in yellow text) to enter gage height, rated discharge, location, and
site condition information. This button can be pressed at any point during the measurement to better document conditions throughout the site. For example, multiple entries of Height may be required during a rapidly changing stage. Up to 20 different entries can be added to each measurement file.

X:\EA PROGRAM\ECYEAPSOP\Approved SOPs\ECY_EAP_SOP_OperationofSonTekFlowTrackerHandheldADV_v1_0.doc_06/24/09_Page 20
6.4.3.7.2.1 Press 1 to enter gage Height in feet. This value should be the most recent recorded observation of the primary gage index.
6.4.3.7.2.2 Press 2 to enter the RatedQ in ft3
/s. A current rating table is required to enter this information. This value is used for comparison to measured discharge both in %Q calculation during the measurement (aides in adjusting width spacing) and a quality control feature at the end of the measurement, showing departure from the current rating. Press Enter when finished.
6.4.3.7.2.3 Press 3 to enter the Time of the observation if it differs from the current time displayed. Press Enter when finished.
6.4.3.7.2.4 Press 4 to enter the Location of the observation on the tag line in feet. Press Enter when
finished. 6.4.3.7.2.5 Press 5 to enter text Comments about the measurement cross section or a particular
location in the cross section. The “-” button is used to put a space between words. It is advised that this feature only be used for limited text entry. Document additional notes on Discharge Measurement Note Sheet (ECY 040-56 (Rev. 12/07)). Press Enter when finished.
6.4.3.7.2.6 By pressing 6 or 7 you are able to navigate between specific observation entries. 6.4.3.7.2.7 Once you have completed pertinent entries press 0 to exit. This will either continue with
the beginning of the measurement or return to the present measurement location. 6.4.3.7.3 The operator will next be prompted to Run or Skip the Auto QC Test. The Auto QC
Test is essentially a field version of BeamCheck, but is particular to the present measurement environment. This information is stored with each discharge measurement file and is displayed on the discharge measurement summary.
6.4.3.7.3.1 It is a requirement of all EAP FMU members to conduct an Auto QC Test prior to each
discharge measurement. 6.4.3.7.3.2 Press 1 to Run Test. 6.4.3.7.3.3 The operator will be prompted to put the FlowTracker probe in moving water, away
from obstructions. It is suggested that the operator place the probe in a location within the cross section that is representative of the stream to be measured. Set the probe at the 6/10ths depth on the wading rod and Press Enter.
6.4.3.7.3.4 The FlowTracker will collect 20 pings and either report that “All Results are Good” or
that the test completed with warnings.

X:\EA PROGRAM\ECYEAPSOP\Approved SOPs\ECY_EAP_SOP_OperationofSonTekFlowTrackerHandheldADV_v1_0.doc_06/24/09_Page 21
6.4.3.7.3.5 If a warning exists Press 1 to End Test or Press 2 to Repeat Test. If the test is being repeated, move to a different place in the cross section free of potential boundary interference.
6.4.3.7.4 At this point of the procedure you are prompted to enter the Starting Edge of the cross
section to be measured and will soon be collecting velocity data. 6.4.3.7.4.1 All discharge measurements conducted by EAP FMU members begin at the right edge
of water (REW). However the default is the left edge. 6.4.3.7.4.2 Press LEW/REW (#4) to toggle between the edges, and set the starting edge to REW. 6.4.3.7.4.3 Press Set Location to enter the distance on the tagline for the starting REW. Press Enter
when finished. 6.4.3.7.4.4 Some cases exist where the edge of the cross section has a depth (Shedd, 2009), e.g., at
a bridge abutment. 6.4.3.7.4.5 Press Set Depth to enter the depth of water at the particular location on the tagline. Refer
to (Shedd, 2009) for instructions on the use of a top-set wading rod. Press Enter when finished.
6.4.3.7.4.6 Press Next Station (#2) to continue the measurement. 6.4.3.7.4.7 The following sequence will occur at each successive location of the cross section.
Generally, 25-30 observations per cross section are sufficient to define the natural variability of the channel. Narrow channels will have fewer observations due to the fact that spacing between observations is limited to 0.3 feet.
6.4.3.7.4.7.1 Press Set Location to enter the location on the tagline of the velocity observation. Press
Enter when finished. The default observation spacing is one foot. Each successive observation sends you to the next point on the tagline based on the spacing of previous observations.
6.4.3.7.4.7.2 Press Set Depth to enter the depth of water at the observation point. Press Enter when
finished. Each successive observation copies the depth of the previous point. 6.4.3.7.4.7.3 Depending on the depth of water at the observation point, the measurement method
(§6.3.5.6) may differ in order to calculate mean velocity. To toggle between the various methods press Method+. The actual velocity observation depth (referenced from the bottom-up) is displayed in parentheses. This depth changes with method.
6.4.3.7.4.7.4 When all values are correctly set and the probe is located as desired, press Measure to
start velocity data collection. Make sure you keep the probe’s X direction perpendicular to the tag line being used to define the stream cross section (see §6.3.4.4.3 of this document).

X:\EA PROGRAM\ECYEAPSOP\Approved SOPs\ECY_EAP_SOP_OperationofSonTekFlowTrackerHandheldADV_v1_0.doc_06/24/09_Page 22
6.4.3.7.4.7.5 It is possible to recover if you mistakenly press Measure with an incorrect parameter or
Method. Press Abort to terminate the measurement (or let the measurement finish), and press 2 to repeat the measurement. Until one measurement is accepted at a station, you have the ability to change all parameters. After one measurement has been accepted, Method can no longer be changed (although other parameters can still be changed).
6.4.3.7.4.7.6 An updating display (right) shows velocity and SNR data. Displayed values represent the running mean of data at that station.
6.4.3.7.4.7.7 Once the measurement time has elapsed, a series of quality control criteria warnings
may be displayed, depending on the measurement environment. Below is a series of tables that describes the quality control warnings and recommend action. Sections in this table refer to the FlowTracker Technical Manual.

X:\EA PROGRAM\ECYEAPSOP\Approved SOPs\ECY_EAP_SOP_OperationofSonTekFlowTrackerHandheldADV_v1_0.doc_06/24/09_Page 23
6.4.3.7.4.7.8 Following the potential quality control warnings a summary of velocity and quality
control data is shown. Below is an example of a summary screen.
6.4.3.7.4.7.9 Press 1 to Accept the data and move to the next station or location in the measurement
series (e.g., advancing from the 2/10ths to 8/10ths
observation depth). Record location, depth, and mean velocity in the Discharge Measurement Notes after each accepted observation.
6.4.3.7.4.7.10 Press 2 to Repeat the measurement, especially if quality control issues arise. When a measurement is repeated, data are not lost. However, you will no longer be able to view the old data from the keypad interface. The old data are still recorded. Later, the data can be extracted in the raw data file (*.dat) and the measurement summary file (*.sum), but not in the discharge summary file (*.dis).
6.4.3.7.4.7.11 Once a station is completed, the FlowTracker displays the next station. Location, depth,
and method data for new stations are predicted using previous stations. If a multiple measurement method was used (e.g., 2/10ths and 8/10ths water depth), the next station will use the same method in the opposite order (i.e.; 8/10ths then 2/10ths
depth).
6.4.3.7.4.7.12 Depending on the width and flow characteristics of the stream being measured, steps encompassed in §6.4.3.7.4.7 (through *7.10) will be repeated for approximately 25-30 locations across the cross section.

X:\EA PROGRAM\ECYEAPSOP\Approved SOPs\ECY_EAP_SOP_OperationofSonTekFlowTrackerHandheldADV_v1_0.doc_06/24/09_Page 24
6.4.3.7.4.7.13 At the end of the cross section, or when an individual station is complete, the operator can review summary data for stations by pressing Next Station and Previous Station. Below is an example of summary information that is displayed.
6.4.3.7.4.7.14 After initial review of the collected data the operator has the option to return to a station
and either delete or repeat the observation. This station can be navigated to by pressing Previous Station or Next Station.
6.4.3.7.4.7.15 Whether you are going to repeat or delete a completed station press Delete and the digits
1-2-3 to confirm. 6.4.3.7.4.7.16 If the operator must repeat or “redo” a station enter the location, depth, and
measurement method of the station. Follow standard measurement procedures for that station. In most cases the operator will get a warning that the entered location is out of sequence. Press 1 to Accept Value, the new station data will automatically be sorted into the correct position so that discharge calculations are accurate. Data from a deleted station is not lost. However, you will no longer be able to view the old data from the keypad interface.
6.4.3.7.4.7.17 Once all measurement stations are completed press End Section. Depending on the
measurement environment the operator is then presented with the summary of all data that has exceeded quality control criteria. Press Enter to review stations with quality control warnings.
6.4.3.7.4.7.18 After the review of stations, the operator has the option to either press 1 to end the
section or to press 2 to not end the section. If quality control warnings exist and the measurement can be improved press 2 to return to the cross section for modification.
6.4.3.7.4.7.19 If the section is not ended the operator is returned to the last station. At this point press
Set Location to add stations. If the operator is not advanced (Next Station) to the current last station of the measurement pressing Set Location will modify the location of the present station on the display. In order to avoid confusion advance to the last station before adding any additional stations.
6.4.3.7.4.7.20 Once satisfied press End Section, and then press 1 to end the collection of velocity
observations.

X:\EA PROGRAM\ECYEAPSOP\Approved SOPs\ECY_EAP_SOP_OperationofSonTekFlowTrackerHandheldADV_v1_0.doc_06/24/09_Page 25
6.4.3.7.4.7.21 Press QC Menu (#8) to enter the ending gage height from the primary gage index, and any additional observations as described in §6.4.3.7.2 of this document.
6.4.3.7.4.7.22 The operator will then be prompted to enter the ending (LEW) edge of water, enter the
respective depth and location. 6.4.3.7.4.7.23 Press Calculate Disch. to finish the measurement. Below is an example of the final
measurement summary screens that are displayed. Press Enter to advance through the multiple screens. While reviewing this information, populate the necessary fields of form ECY 040-56 (Rev. 12/07). It is also suggested that V Max, Depth Mean, SNR Mean, ≈ V Mean, and H2O Temperature be written in the remarks portion of the form.
6.4.3.7.4.7.24 Press 0 to Exit and return to the Main Menu. Once data collection is complete press
and hold the yellow power button until the display goes dark, this must be done from the Main Menu otherwise there is a risk of losing data
.
6.4.3.7.4.7.25 After each completed measurement disassemble the FlowTracker and return it to its protective case. Extra attention should be given to protecting the integrity of the sensor cable.
6.5
Discharge Measurement Processing
6.5.1 Discharge measurements conducted with the FlowTracker are processed using the software SonTek FlowTracker v2.11. For instructions on acquiring and installing this software refer to the SonTek FlowTracker Technical Manual §6.1.
6.5.2 Discharge measurement processing and software utilization requires connecting the
FlowTracker to an external computer. Connect the RS-232 Communication cable between an external computer and the threaded 5-pin connector to the COM port at the base of the Handheld Unit.
6.5.3 Start up the external computer. 6.5.4 Turn the Handheld Unit on by holding down the yellow button on the keypad.

X:\EA PROGRAM\ECYEAPSOP\Approved SOPs\ECY_EAP_SOP_OperationofSonTekFlowTrackerHandheldADV_v1_0.doc_06/24/09_Page 26
6.5.5 Run the FlowTracker software v2.11 (click Start | Programs | SonTek Software |
FlowTracker). Below is the FlowTracker software start up window:
6.5.6 Click Connect to a FlowTracker. Select the correct COM port and click Connect. The
operator will be notified if a connection was established. If a connection is not established a red circle will appear in the “connect to serial port” dialog box.
6.5.7 Each FlowTracker measurement is saved to a master file (*.wad), which is composed of
many extractable file types that can be used in different settings. Each file type can be extracted at any time from the *.wad. Important: FlowTracker software does NOT prompt before overwriting the ASCII output files. Be sure any modified files, or files using the same file name, have been moved to a different folder before extracting the ASCII data.
6.5.7.1 From the main software window review the current file export settings.

X:\EA PROGRAM\ECYEAPSOP\Approved SOPs\ECY_EAP_SOP_OperationofSonTekFlowTrackerHandheldADV_v1_0.doc_06/24/09_Page 27
6.5.7.2 For the proper export settings check the box next to the following three statements: “Show Discharge Summary Report,” “Export ASCII Discharge file (DIS),” and “Put Headers on ASCII files.”
6.5.7.3 “Show Discharge Summary Report” displays the final discharge calculation and
measurement summary report in tabular and graphic form. This includes automatic quality control analysis to flag measurements that may include suspect data. Below is an example of a discharge summary report:

X:\EA PROGRAM\ECYEAPSOP\Approved SOPs\ECY_EAP_SOP_OperationofSonTekFlowTrackerHandheldADV_v1_0.doc_06/24/09_Page 28
6.5.7.4 “Export ASCII Discharge file (DIS)” displays final discharge calculation data and
overall measurement summary. The most widely used output file, especially for database integration. It also displays mean temperature, SNR, and flow angle of each vertical. In the instance that a data entry error was discovered prior to database import; this is the only file that is editable. See example below:

X:\EA PROGRAM\ECYEAPSOP\Approved SOPs\ECY_EAP_SOP_OperationofSonTekFlowTrackerHandheldADV_v1_0.doc_06/24/09_Page 29
6.5.8 From the main software menu click on the “Program Settings” hyperlink. This dialog box allows the operator to specify the output units system, language settings, and (if desired) a fixed output directory for all ASCII output files. See the example below:
6.5.8.1 Set the Unit System and Language to English. 6.5.8.2 The *.dis file is electronically archived in the same location as the *.wad master file.
Therefore, all files should be exported to the same directory as the master file.
6.5.8.3 It is suggested that an official Department of Ecology logo be placed on the discharge summary report header. Click Browse and navigate to H:\FLOWS\Instrumentation\SonTek_FlowTracker\Ecology Logo\LOGO_color_FT.jpg for the current pre-formatted logo.
6.5.8.4 Once satisfied with the Program Settings click OK to exit. These settings will now be valid for all measurements opened using the software.
6.5.9 While the FlowTracker is connected to an external computer the operator has access to the Recorder dialog box via a hyperlink. See an example of the Recorder dialog box below:

X:\EA PROGRAM\ECYEAPSOP\Approved SOPs\ECY_EAP_SOP_OperationofSonTekFlowTrackerHandheldADV_v1_0.doc_06/24/09_Page 30
6.5.9.1 Completed discharge measurements are selected using several different methods. The
operator can click one file to select it, hold Control or Shift and click a series of files, or click Select All to select all files on the recorder.
6.5.9.2 The default download rate for the Recorder is 57,600 baud. Faster or slower download
rates are selectable depending on the external computer. If difficulty arises select a lower baud rate.
6.5.9.3 In most cases the operator will complete batch downloads of measurements. Later these
processed measurements will be electronically archived to a gaging station specific directory. It is suggested that an intermediate Destination folder be established on a Department of Ecology (personal or network) drive in which all pre-processed discharge measurements be stored. Click Browse and navigate to this location.
6.5.9.4 Click Download to copy all the selected files to the specified folder. Note:
A Cancel control will appear to let the operator abort the download process. Watch the status area at the bottom of the dialog box to view the download progress.
6.5.9.5 From the Recorder dialog box the operator can Format (erase) the internal memory of the FlowTracker, as discussed in §6.2.2.1.5 of this document. The previous discussion outlines how to Format the internal memory using the Keypad. The following steps outline how to Format the internal memory using the software.
6.5.9.5.1 Once it has been confirmed that all measurements have been properly downloaded and
are in the proper directory click Format and then OK to confirm the decision to format/erase discharge measurements from the internal memory. As a reminder, once the measurements have been deleted from the FlowTracker’s internal memory the data is non-recoverable
.
6.5.9.5.2 Depending on the number of measurements this process could take several minutes. When finished Close the Recorder dialog box and Disconnect the FlowTracker from the external computer.
6.5.9.6 An electronic and hard-copy archive of all FlowTracker discharge measurements is
required by the EAP FMU. The following steps outline how to generate a hard-copy. 6.5.9.6.1 Run the FlowTracker software v2.11 (click Start | Programs | SonTek Software |
FlowTracker). 6.5.9.6.2 Click the Open a FlowTracker file hyperlink. Browse to the particular discharge
measurement that will be processed.

X:\EA PROGRAM\ECYEAPSOP\Approved SOPs\ECY_EAP_SOP_OperationofSonTekFlowTrackerHandheldADV_v1_0.doc_06/24/09_Page 31
6.5.9.6.3 Prior to opening the *.wad file the file must be renamed. This file name is displayed on the Discharge Measurement Summary and is used to name subsequent export files, such as the *.dis. The name of the *.wad can be renamed by right-clicking on the measurement icon. The electronic file naming convention places station identification number, 4-digit year, 2-digit month, and 2-digit day; all separated by hyphen (e.g., 45F110-2007-07-26.wad).
6.5.9.6.4 Double-click on the measurement icon . This will load measurement
data and display the Discharge Measurement Summary. 6.5.9.6.5 Review summary information for the measurement paying particular attention to the
Discharge Uncertainty statistics, and Quality Control messages. This information is useful for evaluating the overall quality rating more the measurement. Also, assure that the information contained on the Discharge Measurement Notes Form (ECY 040-56 (Rev. 12/07)) and the Discharge Measurement Summary is consistent.
6.5.9.6.6 In the upper right corner of the Discharge Measurement Summary is the Print
icon . Clicking this icon will bring up the print dialog box, which varies depending on the printer being used. In an effort to reduce paper consumption it is suggested that the printer be configured to print two color pages per double-sided sheet. The Discharge Measurement Summary is not editable therefore printing configuration is the only option for paper reduction.
6.5.9.7 Submit the printed Discharge Measurement Summary and the completed Discharge
Measurement Notes form for peer review. 6.5.10 Located on the lower left corner of the main software screen are three hyperlinks to the
three versions of the FlowTracker manual. These include the User’s Manual, Technical Manual, and Quick Start Guide all in *.pdf format.
7.0 Records Management 7.1 Recorded BeamCheck files are saved using the following file naming convention: FT*-
YYYY-MM-DD.bmc. (*Depends on the EAP assigned number to that particular FlowTracker Handheld unit). BeamCheck files are archived on the EAP FMU shared server (H:\FLOWS\Instrumentation\SonTek_FlowTracker\BeamCheck\FT*).
7.2 Field data for discharge measurements are recorded on form ECY 040-56 (Rev. 12/07):
Discharge Measurement Notes. 7.3 Master (*.wad) and auxiliary (*.dis) files are saved using the standard file naming
convention, e.g., 45F110-2009-02-18.wad. 7.4 Both file types for each measurement are electronically archived on the EAP FMU
shared server (H:\FLOWS\Projects), under the specific station name and water year in which the measurement was conducted.

X:\EA PROGRAM\ECYEAPSOP\Approved SOPs\ECY_EAP_SOP_OperationofSonTekFlowTrackerHandheldADV_v1_0.doc_06/24/09_Page 32
7.5 Once returned from peer review (discussed in §8.7) the Discharge Measurement Summary and Discharge Measurement Notes and all original field discharge measurement notes are stored in central locations at Ecology Headquarters, Regional, and Field Offices.
7.6 A record of peer reviews of all discharge measurements is located in the EAP FMU shared
server (H:\FLOWS\QAData). 8.0 Quality Control and Quality Assurance Section 8.1 The FlowTracker records quality control (QC) data with each measurement. QC
parameters are automatically reviewed with each measurement and at the completion of a discharge cross section. Below is a summary table of QC parameters, all section hyperlinks are inactive, but, refer to the FlowTracker Technical Manual:
8.2 If any value exceeds expected criteria, a warning is given. §6.4.3.7.4.7.7 of this
document lists different QC warning messages and gives guidelines for interpreting these messages. All QC review criteria can be adjusted or disabled.
8.3 Avoidance of all QC warnings for a particular discharge measurement is difficult and
strictly dependent on the stream environment available. However, the feedback given by the FlowTracker allows the operator to address potential QC issues at the measurement site. Addressing QC warnings at the measurement site may require modification of the measurement cross section, repeating velocity observations, adjusting the spacing of observations, adding observations to better define the channel, or choosing a different measurement cross section.
X:\EA PROGRAM\ECYEAPSOP\Approved SOPs\ECY_EAP_SOP_OperationofSonTekFlowTrackerHandheldADV_v1_0.doc_06/24/09_Page 33
8.4 Upon completion of the measurement (Calc. Discharge) the FlowTracker reports a calculation of overall statistical discharge uncertainty and the largest contributing source. The Stats Uncertainty calculation incorporates measurement uncertainty, natural stream conditions (e.g., different bottom types), and the assumption that depth and velocity change linearly between stations. This uncertainty percentage should be used as guidance to assign a preliminary quality rating
8.5 As a general guide, if the Overall Uncertainty of the discharge measurement is within
two percent the measurement is considered excellent. If Overall Uncertainty is within five percent the quality of the measurement is good. An Overall Uncertainty between five and eight percent is considered fair. The measurement is regarded as poor if the Overall Uncertainty is greater than eight percent.
8.6 In addition to the discharge uncertainty statistics the relative amount of QC warnings
incurred during the measurement should be considered. The operator should also consider factors such as cross-section quality, and flow conditions as part of the quality assignment.
8.7
Measurement Review
8.7.1 All FlowTracker measurements are peer reviewed. Reviewed materials include completed Discharge Measurement Notes and the Discharge Measurement Summary. Before review, the measurement is entered to the Hydstra Gaugings database.
8.7.2 The reviewer checks measurement notes to ensure proper measurement procedures were
followed and the data reflects the assigned quality code. The Hydstra Gaugings database is checked to verify measurement statistics, stage height, quality assignments, and notes are entered correctly. After the Gaugings database is verified, the reviewer enters his or her initials in the check box provided.
8.7.3 The reviewer compares the Discharge Measurement Summary to the Discharge
Measurement Notes to evaluate potential discrepancies of location, depth, and velocity. Measurements are also checked for the completion of the Auto QC Test and a review of QC warnings present. Though it is the decision of the Basin Lead, the reviewer may suggest an alternative quality rating for the measurement.
8.7.4 The reviewer enters the Overall discharge uncertainty, including the uncertainty in
velocity and depth into the EAP FMU Quality Assurance Database (H:\FLOWS\QAData).
8.7.5 When the review is complete the reviewer initials the field note sheet in the space
provided in the upper right corner and returns the submitted materials along with any written comments to the Basin Lead.

X:\EA PROGRAM\ECYEAPSOP\Approved SOPs\ECY_EAP_SOP_OperationofSonTekFlowTrackerHandheldADV_v1_0.doc_06/24/09_Page 34
8.8
Troubleshooting
8.8.1 If problems persist and solutions cannot be found in this document consult the SonTek FlowTracker Technical Manual (particularly §8.7) for further assistance. If necessary contact SonTek at (858) 546-8327 or via e-mail at [email protected].
8.8.2 BeamCheck is the same diagnostic tool that the manufacturer uses and is available to all
users. BeamCheck methods are outlined in §6.2.1 of this document. 8.8.3 If SonTek is contacted via e-mail it is suggested that you send the *.wad file for the
measurement in which difficulties were experienced and any previous *.bmc files for the FlowTracker that was used for the measurement. This may prevent the need to send the Handheld Unit to SonTek.
9.0 Safety 9.1 Personal Flotation Devices are required for persons working in or near bodies of water. 9.2 All EAP safety policies are followed and safety is always the top priority when
operating this instrument. 9.3 In all measurement situations unsafe deployments that may result in injury to staff, loss
or damage to equipment are not attempted. Refer to the EAP Safety Manual, pages 1-37 and 2-7 (EAP, 2009) for further information about working in and around streams.
9.4 Always consider the safety and traffic situations when measuring from a bridge and
take appropriate actions including suspending the measurement if unsafe conditions exist. Consult the EAP Safety Manual, page 1-31 (EAP, 2009) for further guidance regarding bridge measurement safety.
9.5 Crossing the stream is done safely and in accordance with the guidelines for working in
and around streams established in the EAP Safety Manual, page 1-37 (EAP, 2009). 10.0 References 10.1 Blanchard, S.F., 2007. SonTek/YSI FlowTracker firmware version 3.10 and
softwareversion 2.11 upgrades and additional policy on the use of FlowTrackers for discharge measurements. United States Geological Survey, Office of Surface Water. Technical Memorandum 2007.01.
10.2 Buchanan, T.J., and Somers, W.P., 1969. “Discharge measurements at gaging stations.”
Techniques of water-resources investigations, Book 3, U.S. Geological Survey, Reston,Va., Chapter A8.
10.3 Environmental Assessment Program, 2009. Environmental Assessment Program Safety
Manual, February, 2009. Washington State Department of Ecology, Olympia, WA.

X:\EA PROGRAM\ECYEAPSOP\Approved SOPs\ECY_EAP_SOP_OperationofSonTekFlowTrackerHandheldADV_v1_0.doc_06/24/09_Page 35
10.4 Rantz, S. E., et al., 1982. “Measurement and computation of streamflow.” U.S.Geological Survey Water-Supply Paper No. 2175, Vol. 1, Reston, Va.
10.5 Rehmel, M., 2007. Application of acoustic doppler velocimeters for stream flow
measurements. Journal of Hydraulic Engineering, 133(12):1433-1438. 10.6 Shedd, J.R., 2009. Standard Operating Procedure for Measuring and Calculating Stream
Discharge, Version 1.0. Washington State Department of Ecology, Olympia, WA.SOP Number EAP056. www.ecy.wa.gov/programs/eap/quality.html
10.7 SonTek/YSI, Inc., 2006. FlowTracker® Handheld ADV®
Technical ManualFirmware Version 3.1, Software Version 2.10 featuring SmartQC. P/N 6054-60050--B
10.8 SonTek/YSI, Inc., 2006. FlowTracker® Handheld ADV®
User’s ManualFirmware Version 3.1 featuring SmartQC. P/N 6054-60051--B
10.9 SonTek/YSI, Inc., 2006. FlowTracker®
- Quick Start Guide. P/N 6054-60211--C
10.10 SonTek/YSI, Inc., 2006. SonTek FlowTracker, version 2.11[program]. San Diego,California, SonTek/YSI, Inc.
10.11 Unless otherwise noted all photos and images used in this document courtesy of
SonTek/YSI, Inc.

X:\EA PROGRAM\ECYEAPSOP\Approved SOPs\ECY_EAP_SOP_OperationofSonTekFlowTrackerHandheldADV_v1_0.doc_06/24/09_Page 36
11.0 Appendices
Appendix A Discharge Measurement Notes (ECY 040-56 (Rev. 12/07))

Selenium, Hydrogeology, and Water Quality, BCW Watershed FINAL REPORT
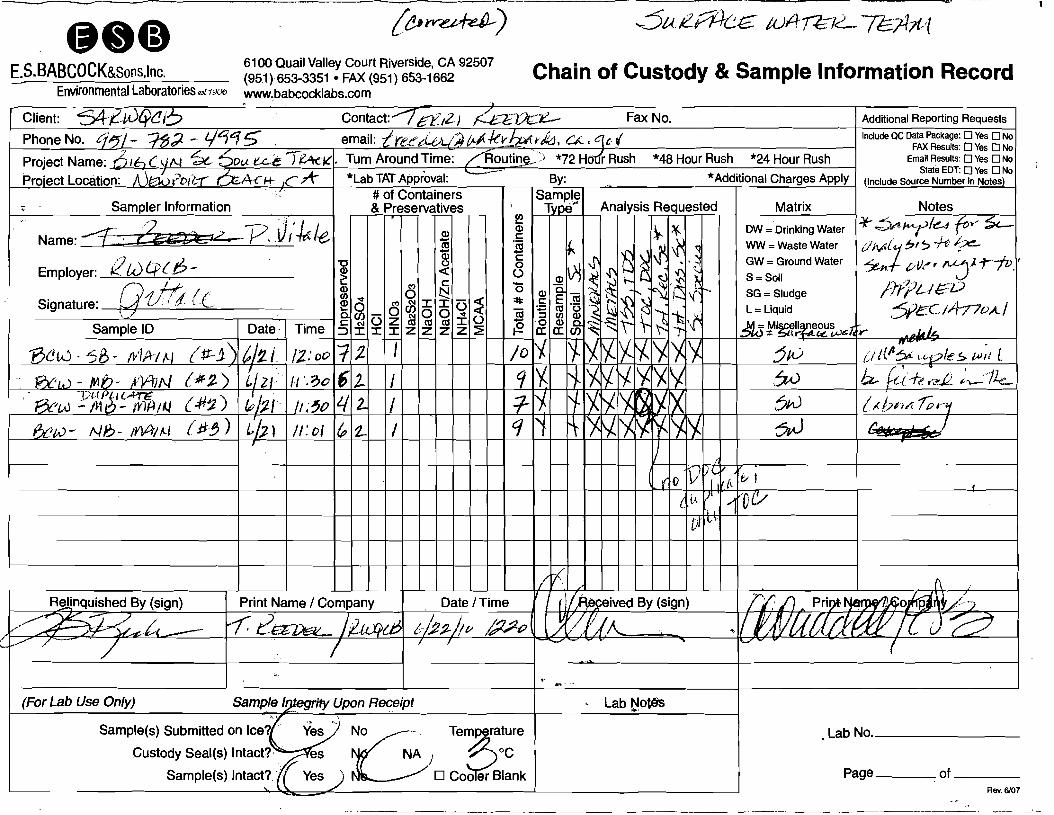
Appendix 4E – Chain of Custody Forms
Selenium in Big Canyon Wash Watershed DRAFT 02-28-11
GROUNDWATER SAMPLES

(~~) qKj)UI];;>NI177£JZ~ ~ ~.4D
6100 Quail Valley Court Riverside, CA 92507 :.S.BABCOCK&Sons,lnc. (951) 653-3351 • FAX (951) 653-1662 Chain of Custody & Sample Information Record Environmental Laboratories"'l 1906 www.babcocklabs.com
Client: "$tJCp(6 Contact: -J, ~JeJL- . Fax No. I Additional Reporting Requests
Phone No.
Project Name: ' L '.
PrOlect ocatlon. .. I # of Containers
Sampler Information & Preservatives
Name: ft']rlU A12£L,?oAJ * -Employer' ;!W 4>C-~ j ~
Signature\TIQC C~cJ L ~ <3 8 gI ~IOI~ ----------------.-----r---lc:~oz~~~:IO
Sample 10 :J I I I Z Z Z Z ~
t/z-, I/o: r:612 I fr'K'- - {Jle:c. - bU IL.j7.J III: ~~ 2 I f;Ci...- Wb?i- l~lJlXK 0rCfll,ol b/Z/I/2',ooI2 1
"BCFl - PII3.-:t - -r1..//
,~ - GAS-r- L1 NDl:::7L02ftINI (P}ll II,; ssl2 {t:ew- YIkH-rS-~A- Ib!zJ 11'2',2512
EX2«) -1
-Pet,- "Sf - HpA- I~/2-1 If2 ~ -351/
() V Include ac Data Package: 0 Yes 0 No FAX Results: 0 Yes 0 No
ush *48 Hour Rush *24 Hour Rush Email Results: 0 Yes 0 No *Add' . Ch State EDT: 0 Yes 0 No
I Itlonal arges Apply (Include Source Number in Notes)
Matrix Notes C/)
~ DW = Drinking Water 4. ...::ftfr1 vi t? ~'L S:::.~ ww =Waste Water ~}AI..-Y61f;> TV 6e o GW =Ground Water je:.Nr lA'>e.):. NIf:;Jfr o S =Source ' '0 SG = Sludge ,0,' , . ~ L =Liquid ifT7pI1',-/ . . ;§ M =Miscellaneous ~C ia17Cr)
81',(1 1'4 ~'A YrY¥lX, I I I t4~,) I/'lI!J~S:;: (!1)1o,~d~ 51~1 I~I"A'IRI I .I I I I 6t0 IjlLl+,(u.,(~tbpM~ 3 1'>4 I><1Yf'A)(I~ I I I 6w I -rp~ ? I'll IXI'AYI~1 I I I I I L;]I,0 I/fllf;:1ltt-~ =: (!.-, K. J
~ 1'Y.1 Ixl)(1'A1IYI I I I I I hw 11f1!{, Ntt j r: j.. .(~ z I~I It1 ~I I'XI I Il I I 6uJ I Ib, /Vi ,211 -1
7.;; -I, I-h fA N .!:-~
/'. /.~-L~ .c.~._"~
W'tlk-~6qUD Relinquished By (sign) Print Name / Company Date /Time Received By (sign) Print"Name / Company
N'
~bJ~c.lb 6 /21/1(/ /4'cf5l~~~rf '-- i.?1.utp(b .1\tt\:~. LC~J C. ~. /!I-vtj)Lh ~~~#o /;J~o rflJ!J)r( /littiL. /' /I IIYilV2 -~'/ / ~
I (JfJYt!CldWl(t[~ ",...."
(For Lab Use Only) Sample)ptegriW Upon Rec~iptiAcceptance Criteria ____ { Lab No, _
Sample(s) Submitted on Ice? ~ -, "" Sample meets laboratory acceptance criteria? No ~, ~) No
Custody Seal(s) Intact? 6 ~"No( ~ Permission to continue: ~ No Logged in By/Date: _ Sample(s) Intact? ~ No' Deviation/Notes: _
Page of _Temperature: °C 0 Cooler Blank Signature/Date: ,.. ., Rev.3/09

6bt:Ll<-lDtv~~
~ APPLIED SPECIATION 18804 Northcreek Parkway Phone (425) 483-3300
AND CONSULTING, LLC Bothell, WA 98011 Fax (425) 483-9818
Company Name: ...-r;fj?fr;1-.JfJJ.-} Ktf)QCb ASC Project Manager: Li/OIA 1!;t2£AV6 Contact Person: /"f'~ F-'.
~
By submitting of samples the client agrees to all terms and conditions set Address: .-7__ ~....., rv?fhH ~ 1r: .:Su-; 'iF Sl:o forth in the quotation provided by the ASC project manager. If you are not
f::-l~IO£ . 0 'crZc;o/ familiar with the term and conditions associated with your project, please
Phone Number: PJ57 .?;1{~ - 'I'""'r1 c; contact your ASC representative as soon as possible (425) 483-3300.
Fax Number: Requested Turn Around Time: /4!:tt:n~
Email Address: /J .$;~..~. /J, • U?--. eJ nU Method of Sample Delivery: tftJ6 C{)~)q#7
ProiectName: Bib ('i/A! ~_ ..:5J/)LLJ2L'~~V All;.,. Courier Tracking Number:
Proiect Number: (
Confirmation of Sample Reception: B'Yes o No PO Number:
Matrix .
Sample ID Botde ID Date and Time Volume Preservative Initials Requested Analytes and Methods Comments
1'J~- Plee r-If I e£e-p/p-rw 6/2/ 1095 lAJaler /JpJJ& ~ - ~ ·B/.f6t>1oeL~~ t Se.- ~/I:A -
l-r~ flt!oar:N-ble- S::... bee -PIa - (.-;24 &f.-Plgcg(Jp h/ZI /I?D ~JA.-. !U~;tJe- ~i:J "IJ1~50I-Ve:D Se..--'Px:.£ - Niihr tuv'Cd?- I ff{i.:~-~~ ~ &/ZI /Z-f).o J~ lI1o~ ~ 7A~~u-lED 5e
DP'r/N
h::L £/lffii-- UNienird'h If" ' . .A~ &, izl /IS:> ~..LL- /v~;tJ£ r%-M -rol, ~-~iK-Y1Lb/e~
b/:75dlId-&<-~~61'
8CJAJ - VIJ('J.r .... 5r- Ho4 Igc~~T~r Il>b/ 1ZZ5 ~ AJ~t0£ ~ -:Pi5~uJef:::> ~ /
8('...<N fbe:r SJ- H-M fXw--PDiCr ~/2-1 1235 !. '.-'7J:: ~ ~ "'Di :f;,~5e-
Relinquished by: f.$ia'"fl) .-r - /~~" (print) !ZL1y;a DatefTime: blz:zjto /;;;-;;?-O comments:P/~-, /" / I
Received by: (sign) (print) DatelTime: ~PRmP rv*)tp~ Comments:
Relinquished by: (sign) (print) DatefTime:
Received by: (sign) (print) DatelTime: Temp:
Please account for each sample bottle as a seperate line item for verificatton purposes.
'Matrix: Air, Freshwater (FW), seawater (SW), groundwater (GW), wastewater (WW), soil (SL), sediment (SO), tissue (TS), product (P). other (0)
~ 2£:lVP IlDtfO/C£ --ro eJ;/3
Rey 1.1 (April 2005)

Selenium in Big Canyon Wash Watershed DRAFT 02-28-11
SURFACE WATER SAMPLES
---------- ....~
(b~) ~/A£m(:.£ tVA/£7L.- le;4Jl'{4J.4D 61 00 Quail Valley Court Riverside, CA 92507E.S.BABCOCK&Sons,lnc, Chain of Custody & Sample Information Record (951)653-3351 • FAX (951) 653-1662
Environmental Laboratories..,[ 1906 www.babcocklabs.com
Client -s4,~wt¥tJe;; Contact/f'el',2J ~.aIA:;::f!.-- Fax No. I Additional Reporting Requests
I Phone No. C/51 - Include QC Data Package: DYes D No , FAX Results: DYes D No
Project Name: *48 Hour Rush *24 Hour Rush Email Results: DYes DNo . ' . * ., State EDT: DYes DNo
Pro ect Location: Additional Charges Apply (Include Source Number in Notes)
: samp~er Information . " . f? Analysis Requested Matrix Notes Y' I .4". ") -:" " Ie? //, J ~ I .S:! ~ *"~""yle..J fOOW =Drinking Water sz=
Name. ' t e~bC- r" I e ~]j ww =WasteWater dML ~I~ -.fe 1A::/} I. \ /'i;( d. _ "C ~ a GW = Ground Water .<:.. ....1 nO... , /V.4J.r-+r.'f
Employer: K bV'-fV g! « U _ . p"f viI<. oJ /"'.Q ,.. ~ _ ...~ c s-s~r? , H: I ' l& 0 t::! 0 SG = Sludge /ffPL-lGD Signature: ~Vi ! ,i LC ~ c3 0'" cJ) I I U ~ ~ L = Liquid .....:::.i]~ /' A.....-->o • /
, C/) - '-'I 0 0 ~ U til ,.-/rc-,'--- ".-,-/ /. ,.., c: '-'I U Z til til til I -0 ~ M' IISample 10 ::::> I I I Z Z Z Z ~ F - - Iscenaneous J. . - t:>tlrf-oit.~~r .".u L
'8cw -58 - (Illfrl N (tt-J')I t/!tI 112: 00 '1 t ~'fl n ::)1<;; - Il//{t1; 1-Vt:?le> /-U;t L
-' '?JCw-frlfJ'flYtJN (*~)ILI;llt,.?oI612J 1/111111191~rnl~I~V1111 ,;U - Ib,l~~'-fe.:,~£~',~·'/le_ " 6ew ]:;U'e/:~l~ (#~) -, ~Jj/l /1;~olL/1~l7l nil I 1-1~11 I I 6JJ It~/;mA1Pr>f
&.1",.>- AI/?- lMn..' (Ji~) Ii/:;.l I/~rrITl n q ~I~I~)(I Il 6J,J - I IJD' ".JI
, I I I I I I I I I I I I I I I I I I I IT
(Ii> fOV(ttJb , 4L~ VI T.{'OV
Dn v
II¥! {\
Print Name / Company Date/Time (V,R,e~eived By (sign) T/! /J .-pri~~AoM~t/~7
~~~~~--- f-f t?tlC~ /i!1Jfcl3' 6/~:J./;() ~ WI)).. ~1/1:1'/lI{l/Jmlf[ J" ~ R~nquished By (sign)
........ ...~ 1'-'c.v/" r- . / I 7
(For Lab Use Only) Sample 1Q!egrity Upon Rec,eipt , Lab ~C)t6s
. Lab No. _Sample(s) Submitted on Ice~(,',"-~ N0 ---- Tem~rature Custody Seal(s) Intact?,f. es NA ) °C
Page of _6Sample(s) Intact:(( Yes ) D Coo er Blank Rev. 6/07

L&~-eiL) IJ1t( L-r/ ..- /l1~/A- --n:::/f}vl fJA--n?k!4i.4D 6100 Quail Valley Court Riverside, CA 92507E.S.BABCOCK&Sons,lnc. (951) 653-3351 • FAX (951) 653-1662 Chain of Custody & Sample Information Record
Environmental Laboratories ..,/1906 www.babcocklabs.com
Client: 54i'tJQc 6 Contact: -(U-t21 ,..-Ket't.:.xa<- Fax No. I Additional Reporting Requests Phone No. Include ac Data Package: 0 Yes 0 No
FAX Results: 0 Yes 0 No Project Name: Turn Around Time: *48 Hour Rush * Email Results: 0 Yes 0 No
P · L '.rOlect ocatlon. *L b TAT A I' a I, " pprova. *A " Chddltlonal arges Apply State EDT: DYes ONo(Include Source Number in Notes) . # of Containers Sample
Sampler Information & Pr ervatives "'Ji e Analysis Requested Matrix Notes . 00
Name: ~itl ~1JGJl-- 2.~ ~ ~ it DW=DrinkingWater .Jfc~hLf)e~ it" ~ / -ffi ~ -0 ww = Waste Water (J1l.tdl./5t ? -/V. tK ~ Ii ~
. /2 fA} /0 ( 6 "0 () § GW = Ground Water . I' L J.- L •EmpIoyer....,.- !l! « () S _ S fl/t'rnLAf" ..70 ..... c _ - ource l/ j._
. +•.r;,:- ~ v 8 ~ _ « ~ SG = Sludge If /pt I~ D I Slgna}U,e. l!? 0 8 cf.) J: J: () « - L - L' 'd .r:/ /A17 D/l
+---::~--,,£-----,l-'------.-----~----l ~ U z ~ ~ ~ I () ~ - I~UI :5Pt?c Sample 10 :::> J: J: J: Z Z Z Z ~ t2~~~eJ~~~.."('" _~J4
8Ce1C-LAJtc3-N~ {p"1211/?~~ 11I 1TTf~X1 1j~1 II II 6w I /lIlJ.<1pleS
i?:JcCY:.- - (fiJL~ 3- 7/A~1". Ibizi 1/~s~1l11/1 I I I I I I I I 1/ I I ~ 1}(lxl 1)(J)<lxl I I 6W INill Ix tdkr~ CctY2 -I- 1'11££ 5- ItJ~1 ,)z,[/sjvnILJlzl III I I I I 1111')(1 I IXfXl><JXI I I .I I~ I ~4J 11" tht: ~/l!Jpt'l1-hl'lf Ibc~ - LA~ '5 - rJA-'L-r, I t'lz I 1/~~f71 11nTTl ,I I I ~ 1'1\)(1 ~ 1 ~N l-r~f~~~ i3e-rc - Ou,Puw - tv~ I1kl ~'Ic~141 zl III I I I I I 11"-1)(1 I I'XJ~)(IXI I I I I I ?l/v I~~~~ ~ ft2.cc- - Vt~7P;-lvW - v;r~t:1 6.f21IJq~1/1 I I I I I I I I II I I ~I I'lJil IXlXIXI I I bfA.' I~7V\e~jA AbC~(!W-"3~-HtJA/P_;V*'blzll.~-t>~ 1-/ ~I rTT!6pJ IT f7
f;f:w-?fj-t!lJNP- Pi1-I!r. It';21 I~~I JI I I I I I I I I 1I 1I 11\ I I I IXI><1~ I I oW I I I
vTI+\ Relinquished By (sign) Date/TimePrint Name / Company I~eceived By (sign) h 1.1) _ Plinl. Nqm~/~~P;t:6~
/,r--~_~.t:'4 6/2Z/lfJ l~)\ l~LL---- ~ II IJ;IN!JtfrJafl/YJ}~ewf:j>c6 '- -{ -7.;77-
' .....'"
(For Lab Use Only) Sampl~9rity Upon ReceipVAcceptance Criteria /./,,' Lab No. _
Sample(s) Submitted on Ice? ~ Nt(---~-'\ Sample meets laboratory acceptance criteria? / Yes.)\ No Custody Seal(s) Intact? ~¥es- N y- NA ) Permission to continue: ~NO Logged in By/Date: $
Sample(s) Intact? a Yes N ~ Deviation/Notes: _ Page of --,-~__T~mperature: :J 0 Cooler Blank Signature/Date:
Rev, 3/09

~U(~ tJlIIU'- 7l3fbt(
18804 Northcreek Parkway Phone (425) 483-3300 Bothell, WA 98011 Fax (425) 483-9818 i" ~~~~N~~~'t~~~~C
Company Name: ~I}-N{)/- MA- Kw~ IASCProjectManager: Li/PIA- 6~
1f~~!!~~~:::l.J~ygLI:::.~~~~~::...-----::------------------------lBy submitting of samples the client agrees to all terms and conditions set Address: ..5"llo forth in the quotation provided by the ASC project manager. If you are not
1- ~=1...!::.!=~;:=:::~:..:::;-+...::::::..L.....,.....,.:::t-~=::..L------------------------__1familiarwith the term and conditions associated with your project, please contact your ASC representative as soon as possible (425) 483-3300.
Fax Number: IRequested Turn Around Time: £tu"171'1£ Email Address: ~Jf?~er&~r~/zf0, 8l. C:::;Ov' IMethod of Sample Delivery: W& [)tJ.e vYU atrt-
Project Name: Ofe, eVA/. ~ :Soa4L£ ~~ ICourier Tracking Number: v IProject Number: I IConfu:mation of Sample Reception: lRJIyes 0 No PO Number: ¥' Sample ID I Bottle ID IDate and Time I Matrix* Volume I Preservative Comments
/lIJR.-I;>t;;.tFA/: '\ I I . I£;Ct-{)-?/b-I'11f.Jr1ll C$..i) f.£iiJ-5i?-tn't1;.! b/Zt /2l%J M'Jd:rV. NoP& P!:, -""'-" /)
IA __ ~ .... -.. J A iI'<--
~- 1U6-mA-IN (iFz;t&?J~~~AlI6/Zi 1/30 I~.uz..-.
"&AN- Nb-MAiAi {ftB)~~~Jb!zl 1/0/ I ~
1fr?tu,frtf'--fY1Aifl/ {#'~)I&iP-NI2>-IM1NI?/zl /I~ I/;(,~r ~~ I~p II
/lfo,..lE
N~jJ£.
!JDIIJ% I
~
-rok.1 a&ve /?tb!e.-~ Ti~oftrU-- ~
~ii·ltJ(2, &.c
~.~ II
LJUJ_ ~wlt1VlP v/LVi~ .. ~.d;;
o
(print), _
Temp:
~ IComments: I
DatefTime: ~/z:zjro DatefTime: _
(print>::::L:: ~Relinquished by: ~A-----,r--- . /
Received by: (sign), _
Comments:
(print)
Relinquished by: (sign) _
Received by: (sign)
(print) _ DatefTime: _
DatefTime: Temp:
Please account for each sample bottle as a seperate line item for verification purposes.
'Matrix: Air, Freshwater (FW), seawater (SW), groundwater (GW), wastewater (WW), soil (SL), sediment (SD), tissue (IS), product (P), other (0)
~£ .seND /AJiftJ/CE ~ ~
Rey 1.1 (April 2005)

Selenium in Big Canyon Wash Watershed DRAFT 02-28-11
PARTICULATES, SEDIMENT, ALGAE, & TISSUE SAMPLES

II !Yl~!~lYleDiA- 7l=71M- W~
APPLIED SPECIATION 18804 Northcreek Parkway Phone (425) 483-3300
" AND CONSULTING, LLC Bothell, WA 98011 Fax (425) 483-9818
&f,Company Name:n/,AJfi) {!A - _-<'frN1A- ANA- k:!E3b/ f)N ASC Project ManaRer: LVDI.4 /' /I
1Q~~!"!:~~~,,,,:::::='(1.~~~./5,~~~~~ ~ ~By submitting of samples the client agrees to all terms and conditions set
Address: forth in the quotation provided by the ASC project manager. If you are not
I- --'~::L.!::..::::I~~~==+_.-"-l.....,..~~....:::::....::...:....------------------------_Ifamiliarwith the term and conditions associated with your project, please contact your ASC representative as ~oon as possible (425) 483-3300.
Fax Number: IRequested Turn Around Time: Ut<..:nIlJ& Email Address: --f::ypp---ipy-/i))IA~;./:vAJ!l...,,(J.A.t:A.., q"d IMethod of Sample Delivery: uP::; I)tJv'-J~r Project Name: 3{; /'\.IN :S"__...:;"'-'~ ~~,..,p;, ICourier TrackinRNumber: U
IProiect Number: I IConftrrnation of Sample Reception: 1f'"j( Yes [J No PO Number: P'
Initials I Requested Analytes and Methods I Comments
~ I~ in.. D!rl7a~fP--b . ~I'.f?_ I dtM.04/t..-k&.. ",-"I"j~ I ('~~ Df1
l-w..f m~'v~1e- :5e-. ~ 1;2... 2?~. /1--- Ie
In46 :Se--. ~ :5Dti!~ 1\ U A/),
U I~ I~_ilL -"DA.voh__~~b . J3;.5 I J.
. l IlJrI" D. (I ~<-P'/_M~ {CJ,'&,Ah, y~p,2:nj;",
-7P1, re/l--Ovw..h/t:-'~ I 1 I I 11),;6, 6e:.-, ~ ~.4;'A
Comments:
(print}
Relinquished by: (sign) _
Received by: (sign}
(print). _
DatefTime:
DatefTime: _
Temp: Please account for each sample bottle as a seperate line item for verificanon purposes.
'Matrix: Air, Freshwater (FW), seawater (SW), gmundwater (GW). wastewater (WW), soil (SL). sediment (SD). tissue (IS), product (P), other (0) Rev 1.1 (April 2005)
?~ :SeND /Il!{/t)/CE 70 ES13 ---==-
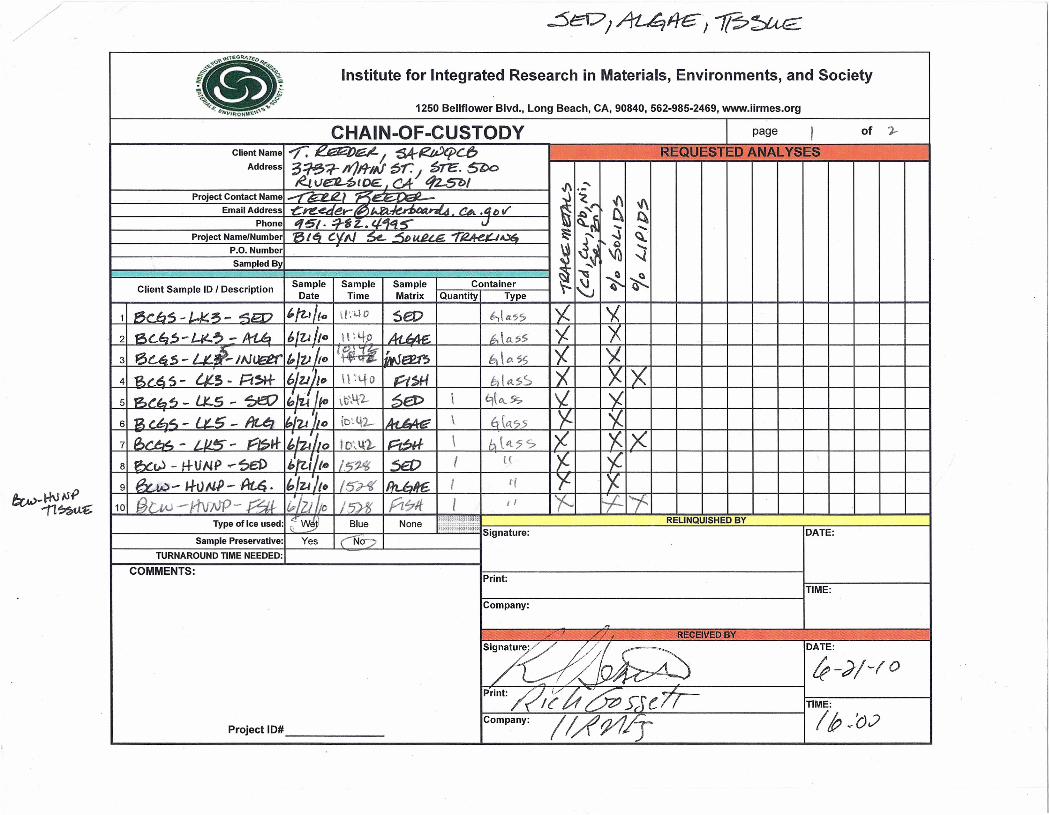
/-:
fa-=>~l:(,~ ~~
Institute for Integrated Research in Materials, Environments, and Society~ '-"Ii! sa;; i:~ ~-s "!>,,~~.~~,\ ..••. 1250 Bellflower Blvd., Long Beach, CA, 90840, 562-985-2469, www.iirmes.org
CHAIN-OF-CUSTODY page I of J...-
Client Name -r: Ve12nr&.li- I SA,tzt,)tj>C6 REQUESTED ANALYSESAddress 3~":l-H)lruJer:J $rE. Sl>o
~1.I~~t()E:. CA t12..sb1
i"'Project Contact Name I .-r ;:;c:z. .1 '< .f\
'"Email Address -Cn!~ e;-t.~t..& ~.4DV ~'"~ ~Phone "151· -:r8 • q.."1"'~ J ~~ ~.•..•.
Project Name/Number 1316, OIN ~ ~~ -r~1U6 ~ J~ <:\.:P.O. Number
~
'"Q~Sampled By ~~ ~
'"'S~ e.
Client Sample ID I Description Sample Sample Sample Container~Date Time Matrix Quantity Type
1 '-2_L; -J...k.~- ~ED 'fz-" (-0 \I', i..I0 SeD 1"1\a.'SS '/. y.2 Bc.65-Lil.? - A-t..6 6Jz., I \ I ~4-0 L1.t LA& 6. \as$ 'I X10
3 6L6S - U~;'INIJE1!f'blv (0 L~ WsE£f3 ~\a.SS X Y-4 8t"..6 S- US· Pt~H- MullD W'fo t:1~ hll etSS X X X5 ~t'i::t'" - LK-S - ~ hhf fo ~\J\4-'2.- Set> i 9t&\..9>
"-'/.
6 g U:-,t; - U$ - ftU:J b1uiJD (D~42- L1.t Lie: i q\ct.55 'f- 'X7 (J..", ~ - LIL"'i' - '::1$H- 6';/'0 IO:,4"l.- i~ \ hltl.5S X- X X8 ~~ - H-U'NP ..•.?eP ~lLf lID [ern 5€f) I l( '/- -c9 ~- '·h)NP-ALq. Mu '/0 IS'~ I a.. ~IJ.C I I( 'f- X
10 ~Lw·-HwJP- ~ t:.1Z/bo 1.'7Y15 fi~1f I IIy.... +r
Type of Ice used: :w~ Blue None__ Signature:
RELINQUISHED BYDATE:
Sample Preservative: Yes CN()")
TURNAROUND TIME NEEDED:
COMMENTS:Print:
TIME:
Company:
n
/' /1 RECEIVED BYSl7~)£:~ DATE:
Ie-;)/~(O.1..>'" rl/" - .••.
Print: /?!rIt&s:-r c?T- TIME:
Company: /U?1/T I» ~{):JProject 10#

-.#~.;Ii(O 09~J'~
Institute for Integrated Research in Materials, Environments, and Societyg ~. ~ f.
~ ~o$"<~ ~N~E.'''''~'''" 1250 Bellflower Blvd., Long Beach, CA, 90840, 562-985-2469, www.iirmes.org
CHAIN-OF-CUSTODY page"2-
of "2-
Client Name T. ~\:>6-a., ~A. P-~ t:>,C-'f. REQUESTED ANALYSESAddress <3, "3"7 "-'.""\..:> S"t I S,,\E S=
tL\ Ve-P-<;,. •.b <:;; , LiA 9."2-<;;"0 (~\Project Contact Name -rG~ ~~~
iEmail Address -ere .••.,,!. [email protected] .••.\-e"\..,0,•.."6:>- Ct.<·c,.:'.1 'Zt: \I) SPhone "t S- t - I '3"2- - 4-'1 q('" ...ol'l-lPo
Project Name/Number "Bi f'\ c...ytJ Se Sovv~C.C;; "t"lZ-AL\'" ,;...:x;......• ~
J ~- .,(u ..J
P.O. Number - .•.' 'v)Sampled By ~ eJ'" Il ••
Sample Sample Sample Container !; S- f"Client Sample ID I Description ..•
Date Time Matrix Quantity Type --1 ~ (...f:-...•S .- ~C;~5~ -f.5\-\ L, j Zlllo If): L\ 1.- PI s.~ ! q\.£\SS 'f.. 'f.. X2 '"i!> (;6) S - Uc- >" ~S..\-~ \NV~ iI? 12.-1 II 0 \O:l\.'"l- INve-e:r I flU'lS5 )( X.3 'ilub,5 - lJC..~ £ ()..c}r' f\i l:;J1\E:. vt-,»; iD~\.h f.>i.6~ I bjJt:6S X X4 ~C--~ - p-,-zq IWZlJlv {t ~LfD C-.or£..!l.. { ~ lC i- -c.5
I I
6
7
8
9
10Type of Ice used: ?Ney B~,e None RELINQUISHED BY
Signature: DATE:Sample Preservative: -.......,es L~
TURNAROUND TIME NEEDED:
COMMENTS:Print:
TIME:
Company:
// RECEIVED BYs;g""M~~ DATE:
(p~;)/ ~(O
Print: /?I ~1J b)J~!T TIME:
Company: 1/!?/J1PS lit !{/0Project 10#

Bttw - $L..$t>UI24e" ~/~
fYIUL17 -lYNZDtA- ~P'-l~
Other
*PurposeFailure:
*Protocol:
2: (RB I LB I BB I US I OS 1##)
3: (RB I LB I BB I US I OS 1##)
TUrbidity (ntu)
Salinity (ppt)
Unknown, <1", >1", None
DISTANCE FROM BANK (m):
OCCUPATION METHOD: Walk-in Bridge RN
DlFfCATION: None, Bridge, Pipes, ConcreteChannel, GradeControl, Culvert, erialZipline, Other LOCATION (to sample): US I OS I WI I
PHOTOS (RB & LB assigned when facing 1: (RB / LB / BB I US I OS I ##) downstream; RENAME to / L ~.s
StationCodej'yyy-mm_dd_uniquecode~ T
None, Fog, Drizzle, Rain, Snow
No, <1 year, <5 years
O2 (%)
w+, s
lllrB7SBEAUFORT SCALE (see attachment):
PRECIPITATION (last 24 hrs):
PRECIPITATION:
g,~ !1/tJ.S ISuS
O2 (mg/L)pH
'3. 2':;2S,~(),'61'1
Entered in d-base (initial/date) Pg I of (Pgs
*Agency:
WIND SKY CODE: artly Cloudy, Overcast, Fog, Smoky, Hazy DIRECTION
OTHERPRESENCE: Vascular Nnnvasclliar Oilv~hp-p-nl=namTrashOthp-r (from):
DOMINANTSUBSTRATE:
WATERODOR:
WATERCLARITY:
SUBSURF/MIDI I '2llll BOTTOMIREP , f i/ ..,..,
SUBSURFIMIDI BOTTOMIREP
SUBSURF/MIDI BOTTOMIREP
ToXicityTotal Metal Total Hg
Field Cup YES I NO: (SampieType =Grab I Integrated; LABEL_IO =FieldQA; create collection record upon data entry
Chi a Bacteria
Sub/Surface COMMENTS:

Selenium, Hydrogeology, and Water Quality, BCW Watershed FINAL REPORT
Appendix 3E – Quality Assurance Report

PNV October 2010 1
Quality Assurance Report –
Analytical Results for the June 21, 2010 Big Canyon Watershed Sampling Event
Introduction This summarizes the quality assurance procedures followed by the contract laboratories for the Big Canyon Watershed Sampling Project. The Project included the analyses of water, tissue, and sediment samples. The quality control samples were compared to the quality assurance procedures listed in the Big Canyon Watershed Preliminary Selenium Source Tracking Studies Big Canyon Country Club and Upstream Tributaries Scope of Work and Sampling and Analyses Plan (June 18, 2010). These procedures were taken from the Surface Water Ambient Monitoring Program quality assurance criteria (SWAMP, September 1, 2008). The quality control procedures were communicated to E.S. Babcock and Sons, Inc Environmental Laboratories via electronic mail directly to Lorenzo Rodriguez. The main contract laboratory for this project was E.S. Babcock and Sons, Inc. Environmental Laboratories. Two other laboratories subcontracted with E.S. Babcock and Sons, Inc. Environmental Laboratories for some of the analyses. In all, three laboratories were involved in the analyses of the samples collected for this project: E.S. Babcock and Sons, Inc. Environmental Laboratories analyzed aqueous samples for cations, anions, total and dissolved organic carbon, total dissolved solids, and dissolved trace metals concentrations; IIRMES Laboratory based at California State University Long Beach analyzed the sediment and tissue samples for selenium and trace metals; and Applied Speciation and Consulting Laboratory analyzed the aqueous samples for total and dissolved selenium concentrations and selenium species, and the particulate samples for selenium and trace metal concentrations as well as total suspended solids.
The objectives of this study were the following:
1. Assess potential sources of selenium and flows upstream of the Big Canyon Country Club golf course.
2. Determine where and how selenium conversions are occurring upstream of the golf course.
3. Compare selenium concentrations and loads in the main tributaries of Big Canyon creek that enter and exit the BCCC golf course to the concentrations measured in 2009 by CH2MHill.
4. Determine selenium cycling and potential impacts to aquatic life in the golf course ponds and the Harbor View Nature Park.

PNV October 2010 2
5. Provide data to help build a conceptual model for selenium for the Big Canyon subwatershed.
6. Determine if preliminary estimates of potential sources of water and selenium (e.g., irrigation, leaking potable water lines) can be made based on general chemical parameters (i.e., use of Piper diagrams or Stiff plots).
7. Provide additional information that can be used in assessing potential selenium source controls and treatment options.
8. Collect data to aid in designing a long-term selenium monitoring and management program for the Big Canyon watershed.
9. Provide additional data that can be used to refine the Newport Bay watershed biodynamic model for the Big Canyon subwatershed.
Based on these objectives, the measurement quality objectives that are critical for this project are accuracy, precision, and completeness. The samples that were collected consisted of 19 aqueous samples sent to E.S. Babcock and Sons, Inc. Environmental Laboratories for cation, anion, dissolved organic carbon, total organic carbon, total dissolved solids, and dissolved trace metals (Cd, Cu, Pb, Ni, and Zn) analyses. Fourteen (14) aqueous samples were sent to Applied Speciation and Consulting Laboratory for total and dissolved selenium and selenium speciation analyses. Four (4) of the surface water samples were filtered and the particulates (filtrate solids) were analyzed for total selenium and trace metals (Cd, Cu, Pb, Ni, and Zn) concentrations. Finally, 3 sediment and 11 tissue samples (algae, crayfish, mosquitofish, and African-clawed frogs) were sent to IIRMES Laboratory for analysis of total selenium and five trace metals (Cd, Cu, Pb, Ni, and Zn), as well as percent solids.
I. Accuracy:
1. Laboratory Control Samples (LCS) The SWAMP quality control criteria require that an LCS be analyzed for every 10 analytical runs with a recovery between 80% to 120%. Analyses by E.S. Babcock and Sons, Inc. Environmental Laboratories: Cations - The cation analyses (calcium, magnesium, sodium, and potassium) in batch 0F28047-200.7 had LCS and LCS duplicate recoveries well within the 80%-120% recovery criteria. Anions - The anion analyses (nitrate as nitrogen) in batches 0F22033, 0F22054, sulfate and chloride in batch 0F23051, total alkalinity, hydroxide, carbonate, and bicarbonate in batch 0F29015, total alkalinity, hydroxide, carbonate, and bicarbonate in batch 0G01015had LCS recoveries within the 80%-120% criteria.

PNV October 2010 3
Solids1
– The total dissolved solids in batch 0F25017 and total suspended solids from batch 0F28032 had LCS recoveries within the 80%-120% criteria. SWAMP does not require analyses of LCS for solids or organics.
Organics – The LCS for dissolved organic carbon in batch 0F25037 and in batch 0F30005 and the two LCS for total organic carbon in batch 0F30004 had recoveries within the SWAMP criteria. Metals – The LCS and LCS duplicate for batch 0F24025 have recoveries within the SWAMP criteria. Analyses by Applied Speciation and Consulting Laboratory: Total Metals and Selenium speciation - LCS information was not reported. Analyses by IIRMES Laboratory: Sediment analyses - LCS information was not reported. Tissue analyses - LCS information was not reported.
2. Certified Reference Material (CRM) Analyses by E.S. Babcock and Sons, Inc. Environmental Laboratories: None were used for the water chemistry samples analyzed by E.S. Babcock and Sons, Inc Environmental Laboratories. Analyses by Applied Speciation and Consulting Laboratory: Total and Dissolved Selenium, Selenium Species, and Trace Metals – all the CRM recoveries were within the SWAMP criteria of 80%-120%. Analyses by IIRMES Laboratory: Tissue analyses - all the CRM recoveries were within the SWAMP criteria of 80%-120%.
3. Blanks The SWAMP criteria for blanks require these to be less than the reporting limit for the target analyte. Analyses by E.S. Babcock and Sons, Inc. Environmental Laboratories: Cations - The blanks for cation analyses (sodium, potassium) in batch 0F28047-200.7 were below the reporting limit. Anions – The blanks for anion analyses (nitrate as nitrogen) in batches 0F22033, 0F22054, sulfate and chloride in batch 0F23051, total alkalinity,
1 SWAMP does not require analyses of LCS for solids or organics.

PNV October 2010 4
hydroxide, carbonate, bicarbonate in batch 0F29015, total alkalinity, hydroxide, carbonate, bicarbonate in batch 0G01015 were below the reporting limit. Solids - The total dissolved solids blank in batch 0F25017 and the total suspended solids blank in batch 0F28032 were below the reporting limit. Organic Compounds – The blanks, one for dissolved organic carbon in batch 0F25037, and one in batch 0F30005 and two for total organic carbon in batch 0F30004 were below the reporting limit. Metals – Three blank samples were analyzed for trace metals (cadmium, copper, lead, nickel, and zinc) in batch 0F24025-200.8. These blanks were below the reporting limit. One of the blanks, however, showed zinc at a concentration (0.983 µg/L) very close to the reporting limit (1 µg/L). A subsequent blank (batch 0G09022 and EPA Method 1638) for this trace metal was analyzed showing a zinc concentration below the reporting limit. Copper results in the blanks were all reported as below the reporting limit, but were closer to the reporting limit than they should have been; however, the copper results in the samples collected at Big Canyon were much higher than the reporting limit and higher than the detections in the blanks. Analyses by Applied Speciation and Consulting Laboratory: Total and Dissolved Selenium, Selenium Species, Trace Metals, Total Suspended Solids – Four preparation blanks were conducted for these analyses. According to the laboratory, the reporting limit for the trace metals analyses is 0.4 µg/L. Except for the zinc preparation blank, all the metal preparation blanks had detections below the reporting limit. The zinc detections in the preparation blanks ranged between 1.2 µg/L to 3.2 µg/L with a mean of 1.8 µg/L and a standard deviation of 0.9. The zinc results in the various samples ranged between 2.1 µg/L to 7.5 µg/L. The high detected concentrations in zinc in the preparation blanks indicate that the sample results will be biased high due to possible zinc contamination. Analyses by IIRMES Laboratory: Tissue analyses – The detections in the blanks were below the reporting limit. Sediment analyses – The detections in the blanks were below the reporting limit.

PNV October 2010 5
II. Precision:
1. Matrix Spikes (MS) The SWAMP criteria require that one MS and one MSD sample be analyzed per constituent and that the recovery should be within 80%-120% with an RPD less than 25%. Analyses by E.S. Babcock and Sons, Inc. Environmental Laboratories: Cations - Contrary to SWAMP guidelines, two distinct MS samples were analyzed instead of an MS and MSD. One of the MS for the cation analyses (calcium, magnesium, sodium, and potassium) in batch 0F28047-200.7 had MS recoveries within the SWAMP criteria. The second MS for cation analyses (for only sodium, and potassium) in batch 0F28047-200.7 had MS recoveries within the SWAMP criteria. The calcium and magnesium analyses for the second MS, on the other hand, were outside the criteria with low recoveries of 64.3% and 70% respectively. This could be due to the fact that the spike concentration was too low (22.1 mg/L).
Anions - Two MS were analyzed for the anion analysis (nitrate as nitrogen) in batches 0F22033, 0F22054, and sulfate and chloride in batch 0F23051. All MS had recoveries within the SWAMP criteria. Solids – MS were not analyzed. Organics – The recovery for MS for dissolved organic carbon in batch 0F25037 was not reported and is presumed to be outside the SWAMP criteria. The recoveries for the dissolved organic carbon in batch 0F30005 and for total organic carbon in batch 0F30004 were within the SWAMP criteria. Metals – Two MS were analyzed for batch 0F24025. Except for the recovery for zinc, the recoveries for the trace metals in batch 0F24025 meet the SWAMP criteria. The zinc recovery was 75.5% Analyses by Applied Speciation and Consulting Laboratory: Total and Dissolved Selenium, Selenium Species, and Trace Metals Analyses – The MS for the selenium, selenium species, and all of the trace metals had recoveries within the SWAMP criteria. Analyses by IIRMES Laboratory: Sediment and Tissue Analyses – For sediment, none were analyzed. Laboratory blank spikes were used to determine precision. These laboratory blank spikes had recoveries within the SWAMP criteria. For tissue, all results were within the SWAMP criteria.

PNV October 2010 6
2. Matrix Spike Duplicates (MSD) The SWAMP criteria for MSD are 80%-120% recovery and relative percent difference (RPD) less than 25%. Analyses by E.S. Babcock and Sons, Inc. Environmental Laboratories: Cations - Contrary to the SWAMP criteria, MSD were not analyzed for the cation samples. Anions - The MSD analyzed for the anion samples (nitrate as nitrogen) in batches 0F22033, 0F22054, and sulfate and chloride in batch 0F23051 were within the SWAMP recovery and RPD criteria. Solids – MSD were not analyzed. Organics – The recovery for the MSD for dissolved organic carbon in batch 0F25037 was not reported and presumed to be outside of the SWAMP criteria; the recoveries for dissolved organic carbon in batch 0F30005 and for total organic carbon in batch 0F30004 were within the SWAMP criteria. The RPD for batches 0F25037, 0F30005 (dissolved organic carbon) and 0F30004 (total organic carbon) were reported to be within the SWAMP criteria. Analyses by Applied Speciation and Consulting Laboratory: Total and Dissolved Selenium , Selenium Species, and Trace Metals – The MSD and RPD for selenium, selenium species, and all of the metals had recoveries within the SWAMP criteria. Analyses by IIRMES Laboratory: Tissue analyses – The MS and MSD were within the SWAMP criteria. Sediment analyses – MSD were not analyzed. In lieu of the MSD, the laboratory ran two blank spikes which had recoveries ranging from 84% to 98% in one laboratory blank spike and 82% to 97% in the second. The preferable indicators of precision are MS and MSD because they indicate the ability to detect the spiked concentrations in the sample matrix. The laboratory spikes analyses were performed on aqueous media which is very different from the sediment matrix in the samples collected from Big Canyon.
3. Laboratory Duplicates The SWAMP criteria for laboratory duplicates state that these should be done per 20 samples, or per analytical batch, with an RPD less than 25%.

PNV October 2010 7
Analyses by E.S. Babcock and Sons, Inc. Environmental Laboratories: Anions - The duplicates for the anion analyses (total alkalinity, hydroxide, carbonate, and bicarbonate) in batch 0F29015, one of the duplicates for total alkalinity, hydroxide, carbonate and bicarbonate in batch 0G01015 were within the RPD criteria. Two duplicates were analyzed for batch 0G01015. The RPD for carbonate from one the duplicates was 40% and this does not meet the SWAMP criteria for this analyte. Solids – The one duplicate analyzed for total dissolved solids in batch 0F25017 met the RPD criteria; both duplicates analyzed for total suspended solids in batch 0F28032 met the RPD criteria. Analyses by Applied Speciation and Consulting Laboratory: Total Selenium, Selenium Species, and Trace Metals – The duplicates for the metals had RPD within the SWAMP criteria. Analyses by IIRMES Laboratory: Sediment and Tissue analyses – The duplicates had RPD within the SWAMP criteria.
4. Relative Percent Difference (RPD) between the LCS and LCS Duplicate The cation analyses (calcium, magnesium, sodium, and potassium) performed by E.S. Babcock and Sons, Inc. Environmental Laboratories in batch 0F28047-200.7 had LCS and LCS duplicate RPD within acceptable limits (less than 25%). The LCS and LCS duplicates were not performed on the data by either Applied Speciation and Consulting or the IIRMES Laboratories.
III. Completeness The completeness requirement of 90% was met.
IV. Conclusion The quality assurance procedures (SWAMP QA procedures) stipulated for this project were not completely followed. For example, the target reporting limits used by the E.S. Babcock and Sons were higher than the SWAMP recommended reporting limits. However, the analytes in the samples were found in high enough concentrations that “non-detect” data was kept to a minimum. Lead, carbonate and hydroxide were the only analytes found below the laboratory’s reporting limit.

PNV October 2010 8
In addition, MSD analyses were not conducted for the metals, solids, and cation analyses performed by E.S. Babcock and Sons. The MS recovery for zinc was low in one of the batches analyzed by E.S. Babcock and Sons, Inc. Environmental Laboratories. The hard copy reports from E.S. Babcock and Sons, Inc Environmental Laboratories did not specify which samples correspond to which quality assurance batch. The high detected concentrations of zinc in the preparation blanks used by Applied Speciation and Consulting indicate that the sample results will be biased high due to possible zinc contamination. Data that should not be used for the project’s intended purpose because it did not meet all the precision criteria:
• Zinc data from the analyses performed by Applied Speciation and Consulting Laboratory should not be used. The detections in the preparation blank indicate that this data is biased high and did not meet the accuracy criteria.
Data that may be used for the project’s intended purpose because it met all the quality assurance criteria:
• Except for the zinc data that was analyzed by Applied Speciation and Consulting Laboratory, all the trace metals data may be used.
• The total suspended solids analyses performed by Applied Speciation and Consulting can be used.
• The total dissolved solids data from the analyses performed by E.S. Babcock and Sons, Inc Environmental Laboratories may be used.
Data that should be used with caution (in that it may be used for the project’s objective number 6 because it is a preliminary analyses not a regulatory one) because it met most of the quality assurance criteria:
• Cations, total alkalinity, hydroxide, carbonate and bicarbonate, dissolved organic carbon, total organic carbon and dissolved organic carbon, and metals data from the analyses performed by E.S. Babcock and Sons, Inc Environmental Laboratories. This data may be used for preliminary assessment purposes and to design future sampling activities, but may not be used to determine compliance with water quality criteria because of poor precision.
• The sediment data from IIRMES Laboratory lacked MS and MSD but the precision criterion was somewhat met from the two laboratory blank spike analyses. The laboratory blank consisted of laboratory blank water and is not a perfect surrogate for the matrix in the samples but serves to illustrate that the laboratory, at a minimum, is capable of detecting the metals at the spiked concentrations.