APPENDIX MID RANGE PLAN FISCAL YEARS 2012–2015 SEPTEMBER 8, 2011.
13
APPENDIX MID RANGE PLAN FISCAL YEARS 2012–2015 SEPTEMBER 8, 2011
-
Upload
alexia-austin -
Category
Documents
-
view
216 -
download
0
Transcript of APPENDIX MID RANGE PLAN FISCAL YEARS 2012–2015 SEPTEMBER 8, 2011.

APPENDIXMID RANGE PLANFISCAL YEARS 2012–2015
SEPTEMBER 8, 2011

SPT Cash Flow by Division
($ MM) Cash FlowFY12 FY13 FY14 FY15
Budget Q2 Fcst Variance PY MRP MRP Variance PY MRP MRP Variance MRP
Networks 10 42 32 13 63 50 82 144 62 207US Distribution 712 714 2 783 705 (78) 801 704 (97) 716Int'l Distribution 1,130 1,247 117 1,186 1,321 135 1,275 1,413 138 1,460US Production & Ad Sales (362) (425) (63) (277) (406) (129) (231) (401) (170) (393)Int'l Production (49) (27) 22 (10) (36) (26) 4 (15) (19) (8)
TOTAL 1,441 1,551 110 1,695 1,647 (48) 1,931 1,845 (86) 1,982
3D Networks (9) (11) (2) (6) (6) 0 (1) (2) (1) 0
2
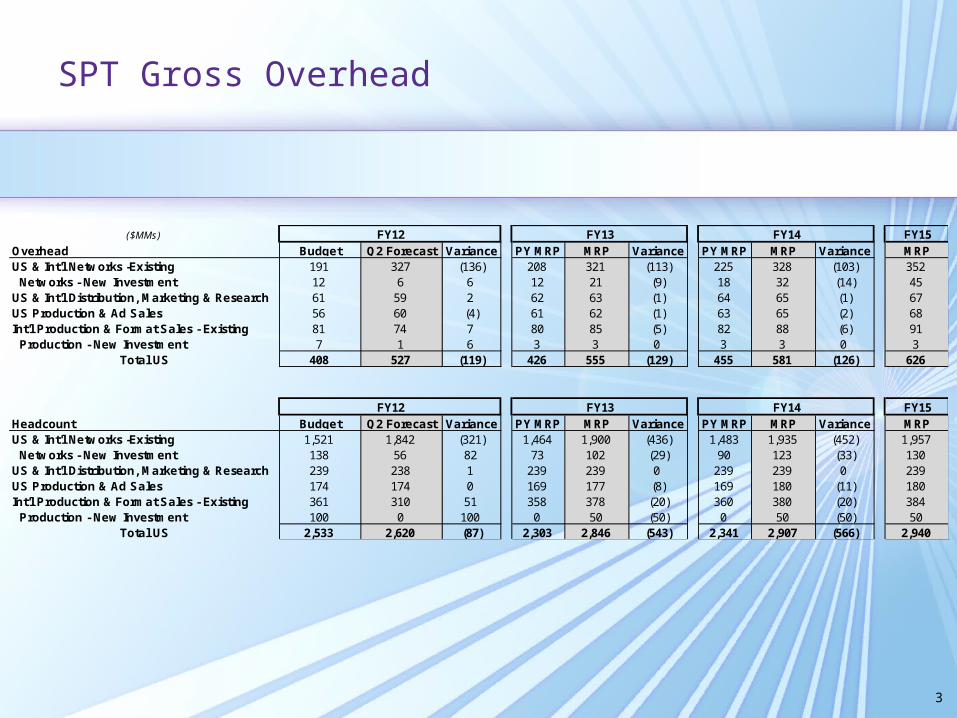
SPT Gross Overhead
3
($MMs) FY15Overhead Budget Q2 Forecast Variance PY MRP MRP Variance PY MRP MRP Variance MRPUS & Int'l Networks -Existing 191 327 (136) 208 321 (113) 225 328 (103) 352 Networks - New Investment 12 6 6 12 21 (9) 18 32 (14) 45US & Int'l Distribution, Marketing & Research 61 59 2 62 63 (1) 64 65 (1) 67US Production & Ad Sales 56 60 (4) 61 62 (1) 63 65 (2) 68Int'l Production & Format Sales - Existing 81 74 7 80 85 (5) 82 88 (6) 91 Production - New Investment 7 1 6 3 3 0 3 3 0 3
Total US 408 527 (119) 426 555 (129) 455 581 (126) 626
FY15Headcount Budget Q2 Forecast Variance PY MRP MRP Variance PY MRP MRP Variance MRPUS & Int'l Networks -Existing 1,521 1,842 (321) 1,464 1,900 (436) 1,483 1,935 (452) 1,957 Networks - New Investment 138 56 82 73 102 (29) 90 123 (33) 130US & Int'l Distribution, Marketing & Research 239 238 1 239 239 0 239 239 0 239US Production & Ad Sales 174 174 0 169 177 (8) 169 180 (11) 180Int'l Production & Format Sales - Existing 361 310 51 358 378 (20) 360 380 (20) 384 Production - New Investment 100 0 100 0 50 (50) 0 50 (50) 50
Total US 2,533 2,620 (87) 2,303 2,846 (543) 2,341 2,907 (566) 2,940
FY12 FY13 FY14
FY12 FY13 FY14

SPT Net Overhead
4
($MMs) FY15US Budget Q2 Forecast Variance PY MRP MRP Variance PY MRP MRP Variance MRPUS & Int'l Networks -Existing 191 327 (136) 208 321 (113) 225 328 (103) 352 Networks - New Investment 12 6 6 12 21 (9) 18 32 (14) 45US & Int'l Distribution 56 55 1 59 60 (1) 60 62 (2) 65US Production & Ad Sales 35 42 (7) 40 42 (2) 41 43 (2) 43Int'l Production & Format Sales - Existing 67 71 (4) 69 78 (9) 71 81 (10) 84 Production - New Investment 8 1 7 3 3 0 3 3 0 3Total US 369 502 (133) 391 525 (134) 418 549 (131) 592
FY12 FY13 FY14

International Produced Program Line-Up
UK: Victory UK: Gogglebox Russia: SPT & LEAN-M
• Who Wants to be a Millionaire: ITV1• Beyonce Special: ITV1• Will Young Special: ITV1• Alicia Keyes Special: ITV2• MSN: Corporate website• Exit List: ITV1
• Impossible I: Five• Impossible celebrity specials: Five• Breakout: I BBC2• Plain Jane I: MTV• The Exit List I: ITV1• Tommy Cooper special: Channel 4
• Voronins/Raymond: CTC• Happy Together: TNT• King of Queens: TNT• Lavrova’s Method aka Search, Woman!:
CTC• Prosecutors Office: NTV• Gold Reserve aka Platina 3: NTV• Disco of the 80’s: CTC• Phantom Hotel: TV3• Crossroads: TV3• The Brave: REN• First Love: Rossiya• Plain Jane: CTC
Arabia Italy: Toro Germany
• Amira: Al Aan• Jeopardy (Pilot): MBC• Everybody Loves Raymond: Dream TV• Everybody Loves Raymond: MTV
• Lives of the Others: LA7• Dating in the Dark: SKY• Crazy Parade (ex Bloopers show): Rai Due• InsideOut: Rai Due• Chain Reaction: Rai Due• My First 40 Years: LEI• The Substitute: MTV• Pet Detectives: Cielo• The Voice of… Rai Due
• Der Lehrer (pilot): RTL• NRW Duell VI: WDR• ZDFneo show (pilot): ZDFneo• Böse Mädchen IV: RTL• Trödel-King (X & XI): WDR• Bangers & Cash I: VOX• Cover Me I: VOX
5
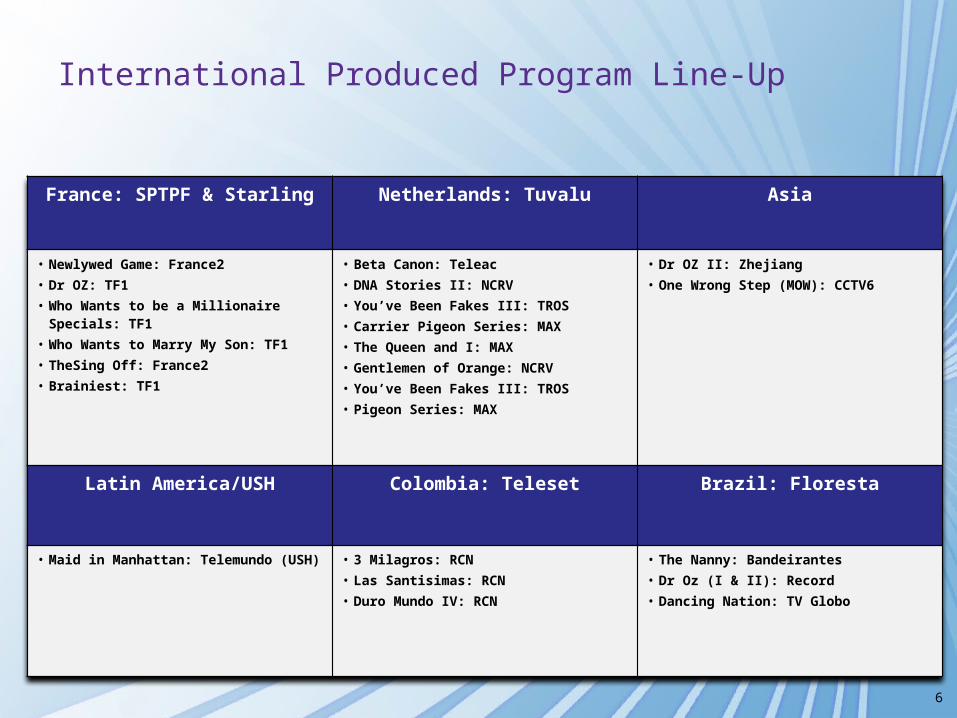
International Produced Program Line-Up
France: SPTPF & Starling Netherlands: Tuvalu Asia
• Newlywed Game: France2• Dr OZ: TF1• Who Wants to be a Millionaire Specials:
TF1• Who Wants to Marry My Son: TF1• TheSing Off: France2• Brainiest: TF1
• Beta Canon: Teleac• DNA Stories II: NCRV• You’ve Been Fakes III: TROS• Carrier Pigeon Series: MAX• The Queen and I: MAX• Gentlemen of Orange: NCRV• You’ve Been Fakes III: TROS• Pigeon Series: MAX
• Dr OZ II: Zhejiang• One Wrong Step (MOW): CCTV6
Latin America/USH Colombia: Teleset Brazil: Floresta
• Maid in Manhattan: Telemundo (USH) • 3 Milagros: RCN• Las Santisimas: RCN• Duro Mundo IV: RCN
• The Nanny: Bandeirantes• Dr Oz (I & II): Record• Dancing Nation: TV Globo
6

Scripted Non-Scripted Other
Drama Comedy Game Show Reality/Talk MOWs / Mini
Network • Days of our Lives (NBC)
• Young & the Restless (CBS)
• Charlie’s Angels (ABC)
• Pan Am (ABC)
• Unforgettable (CBS)
• Community (NBC)
• Rules of Engagement (CBS)
• Happy Endings (ABC)
• Breaking In (FBC)
• Shark Tank (ABC)
• The Sing-Off (NBC)
• Plain Jane (CW)
• Remodeled (CW)
• Jesse Stone: Innocence Lost (CBS)
• Jesse Stone: Benefit of the Doubt (CBS)
Cable • Breaking Bad (AMC)
• Rescue Me (FX)
• Damages (FX)
• Justified (FX)
• HawthoRNe (TNT)
• Drop Dead Diva (Lifetime)
• Franklin & Bash (TNT)
• Necessary Roughness (USA)
• Big C (Showtime)
• Boondocks (Cartoon Network)
• Newlywed Game (GSN) • Pretend Time (Comedy Central)
• Substitute (MTV)
• Bag of Bones (A&E)
• Unforgiven: The Drew Peterson Story (Lifetime)
• Hannah’s Law (Hallmark)
• Hatfields & McCoys (History)
• Witchslayer (Syfy)
• Battle for Pegasus (Syfy)
• The Last Jinn (Syfy)
• Justice For Natalie (Lifetime)
• Close Quarters (Lifetime)
• Five (Lifetime)
Syndi-cation
• Wheel of Fortune
• Jeopardy!
• Dr. Oz
• Nate Berkus
U.S. Production – Current Program Lineup
More than 1,600 episodes produced per year
7
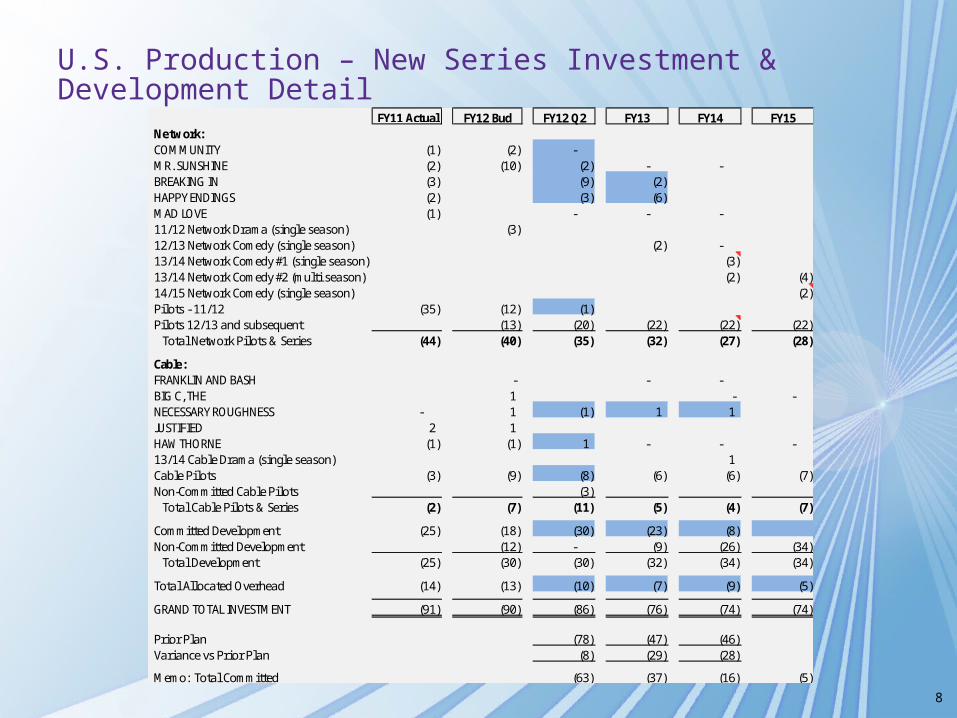
U.S. Production – New Series Investment & Development Detail
8
FY11 Actual FY12 Bud FY12 Q2 FY13 FY14 FY15Network:COMMUNITY (1) (2) - MR. SUNSHINE (2) (10) (2) - - BREAKING IN (3) (9) (2) HAPPY ENDINGS (2) (3) (6) MAD LOVE (1) - - - 11/12 Network Drama (single season) (3) 12/13 Network Comedy (single season) (2) - 13/14 Network Comedy #1 (single season) (3) 13/14 Network Comedy #2 (multi season) (2) (4) 14/15 Network Comedy (single season) (2) Pilots - 11/12 (35) (12) (1) Pilots 12/13 and subsequent (13) (20) (22) (22) (22)
Total Network Pilots & Series (44) (40) (35) (32) (27) (28)
Cable:FRANKLIN AND BASH - - - BIG C, THE 1 - - NECESSARY ROUGHNESS - 1 (1) 1 1 JUSTIFIED 2 1 HAWTHORNE (1) (1) 1 - - - 13/14 Cable Drama (single season) 1 Cable Pilots (3) (9) (8) (6) (6) (7) Non-Committed Cable Pilots (3)
Total Cable Pilots & Series (2) (7) (11) (5) (4) (7)
Committed Development (25) (18) (30) (23) (8) Non-Committed Development (12) - (9) (26) (34)
Total Development (25) (30) (30) (32) (34) (34)
Total Allocated Overhead (14) (13) (10) (7) (9) (5)
GRAND TOTAL INVESTMENT (91) (90) (86) (76) (74) (74)
Prior Plan (78) (47) (46) Variance vs Prior Plan (8) (29) (28)
Memo: Total Committed (63) (37) (16) (5)
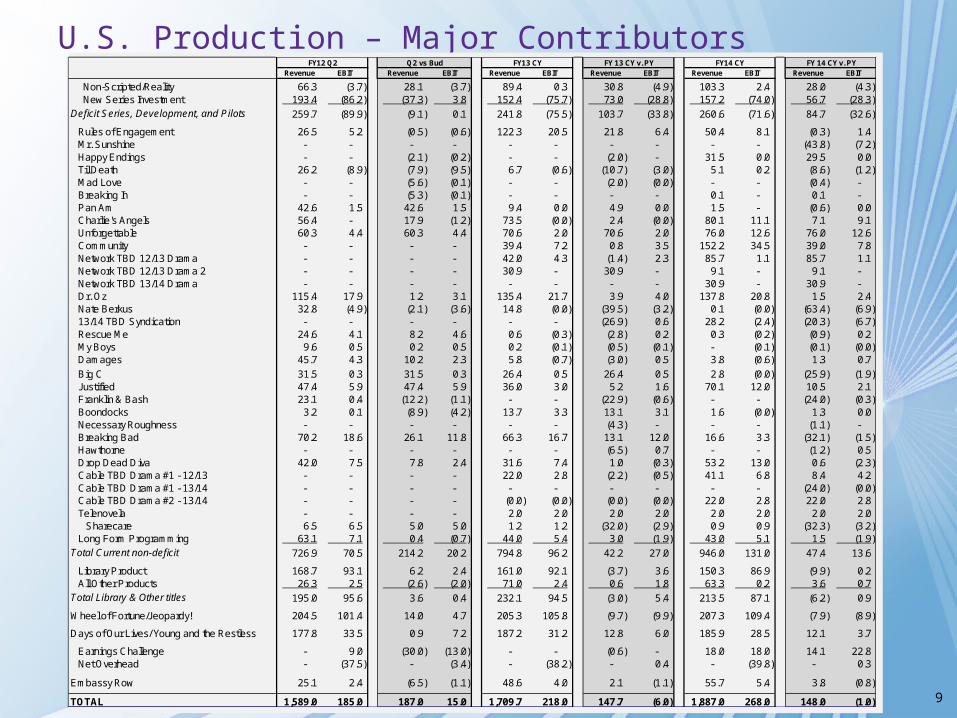
U.S. Production – Major ContributorsFY12 Q2 Q2 vs Bud FY13 CY FY 13 CY v. PY FY14 CY FY 14 CY v. PY Variance
Revenue EBIT Revenue EBIT Revenue EBIT Revenue EBIT Revenue EBIT Revenue EBIT
Non-Scripted/Reality 66.3 (3.7) 28.1 (3.7) 89.4 0.3 30.8 (4.9) 103.3 2.4 28.0 (4.3) New Series Investment 193.4 (86.2) (37.3) 3.8 152.4 (75.7) 73.0 (28.8) 157.2 (74.0) 56.7 (28.3) Deficit Series, Development, and Pilots 259.7 (89.9) (9.1) 0.1 241.8 (75.5) 103.7 (33.8) 260.6 (71.6) 84.7 (32.6)
Rules of Engagement 26.5 5.2 (0.5) (0.6) 122.3 20.5 21.8 6.4 50.4 8.1 (0.3) 1.4 Mr. Sunshine - - - - - - - - - - (43.8) (7.2) Happy Endings - - (2.1) (0.2) - - (2.0) - 31.5 0.0 29.5 0.0 Til Death 26.2 (8.9) (7.9) (9.5) 6.7 (0.6) (10.7) (3.0) 5.1 0.2 (8.6) (1.2) Mad Love - - (5.6) (0.1) - - (2.0) (0.0) - - (0.4) - Breaking In - - (5.3) (0.1) - - - - 0.1 - 0.1 - Pan Am 42.6 1.5 42.6 1.5 9.4 0.0 4.9 0.0 1.5 - (0.6) 0.0 Charlie's Angels 56.4 - 17.9 (1.2) 73.5 (0.0) 2.4 (0.0) 80.1 11.1 7.1 9.1 Unforgettable 60.3 4.4 60.3 4.4 70.6 2.0 70.6 2.0 76.0 12.6 76.0 12.6 Community - - - - 39.4 7.2 0.8 3.5 152.2 34.5 39.0 7.8 Network TBD 12/13 Drama - - - - 42.0 4.3 (1.4) 2.3 85.7 1.1 85.7 1.1 Network TBD 12/13 Drama 2 - - - - 30.9 - 30.9 - 9.1 - 9.1 - Network TBD 13/14 Drama - - - - - - - - 30.9 - 30.9 - Dr. Oz 115.4 17.9 1.2 3.1 135.4 21.7 3.9 4.0 137.8 20.8 1.5 2.4 Nate Berkus 32.8 (4.9) (2.1) (3.6) 14.8 (0.0) (39.5) (3.2) 0.1 (0.0) (63.4) (6.9) 13/14 TBD Syndication - - - - - - (26.9) 0.6 28.2 (2.4) (20.3) (6.7) Rescue Me 24.6 4.1 8.2 4.6 0.6 (0.3) (2.8) 0.2 0.3 (0.2) (0.9) 0.2 My Boys 9.6 0.5 0.2 0.5 0.2 (0.1) (0.5) (0.1) - (0.1) (0.1) (0.0) Damages 45.7 4.3 10.2 2.3 5.8 (0.7) (3.0) 0.5 3.8 (0.6) 1.3 0.7
Big C 31.5 0.3 31.5 0.3 26.4 0.5 26.4 0.5 2.8 (0.0) (25.9) (1.9) Justified 47.4 5.9 47.4 5.9 36.0 3.0 5.2 1.6 70.1 12.0 10.5 2.1 Franklin & Bash 23.1 0.4 (12.2) (1.1) - - (22.9) (0.6) - - (24.0) (0.3) Boondocks 3.2 0.1 (8.9) (4.2) 13.7 3.3 13.1 3.1 1.6 (0.0) 1.3 0.0 Necessary Roughness - - - - - - (4.3) - - - (1.1) - Breaking Bad 70.2 18.6 26.1 11.8 66.3 16.7 13.1 12.0 16.6 3.3 (32.1) (1.5) Hawthorne - - - - - - (6.5) 0.7 - - (1.2) 0.5 Drop Dead Diva 42.0 7.5 7.8 2.4 31.6 7.4 1.0 (0.3) 53.2 13.0 0.6 (2.3) Cable TBD Drama #1 - 12/13 - - - - 22.0 2.8 (2.2) (0.5) 41.1 6.8 8.4 4.2 Cable TBD Drama #1 - 13/14 - - - - - - - - - - (24.0) (0.0) Cable TBD Drama #2 - 13/14 - - - - (0.0) (0.0) (0.0) (0.0) 22.0 2.8 22.0 2.8 Telenovela - - - - 2.0 2.0 2.0 2.0 2.0 2.0 2.0 2.0 Sharecare 6.5 6.5 5.0 5.0 1.2 1.2 (32.0) (2.9) 0.9 0.9 (32.3) (3.2)
Long Form Programming 63.1 7.1 0.4 (0.7) 44.0 5.4 3.0 (1.9) 43.0 5.1 1.5 (1.9) Total Current non-deficit 726.9 70.5 214.2 20.2 794.8 96.2 42.2 27.0 946.0 131.0 47.4 13.6
Library Product 168.7 93.1 6.2 2.4 161.0 92.1 (3.7) 3.6 150.3 86.9 (9.9) 0.2 All Other Products 26.3 2.5 (2.6) (2.0) 71.0 2.4 0.6 1.8 63.3 0.2 3.6 0.7
Total Library & Other titles 195.0 95.6 3.6 0.4 232.1 94.5 (3.0) 5.4 213.5 87.1 (6.2) 0.9
Wheel of Fortune/Jeopardy! 204.5 101.4 14.0 4.7 205.3 105.8 (9.7) (9.9) 207.3 109.4 (7.9) (8.9)
Days of Our Lives/ Young and the Restless 177.8 33.5 0.9 7.2 187.2 31.2 12.8 6.0 185.9 28.5 12.1 3.7
Earnings Challenge - 9.0 (30.0) (13.0) - - (0.6) - 18.0 18.0 14.1 22.8 Net Overhead - (37.5) - (3.4) - (38.2) - 0.4 - (39.8) - 0.3
Embassy Row 25.1 2.4 (6.5) (1.1) 48.6 4.0 2.1 (1.1) 55.7 5.4 3.8 (0.8)
TOTAL 1,589.0 185.0 187.0 15.0 1,709.7 218.0 147.7 (6.0) 1,887.0 268.0 148.0 (1.0) 9

U.S. Production – Major Contributors (Year-Over-Year)FY12 Q2 FY13 CY FY14 CY FY15 CY Variance
Revenue EBIT Revenue EBIT Revenue EBIT Revenue EBIT
Non-Scripted/Reality 66.3 (3.7) 89.4 0.3 103.3 2.4 105.1 2.4 New Series Investment 193.4 (86.2) 152.4 (75.7) 157.2 (74.0) 146.7 (74.0) Deficit Series, Development, and Pilots 259.7 (89.9) 241.8 (75.5) 260.6 (71.6) 251.8 (71.6)
Rules of Engagement 26.5 5.2 122.3 20.5 50.4 8.1 28.7 1.8 Happy Endings - - - - 31.5 0.0 70.4 19.0 Til Death 26.2 (8.9) 6.7 (0.6) 5.1 0.2 4.7 - Breaking In - - - - 0.1 - 0.2 - Pan Am 42.6 1.5 9.4 0.0 1.5 - 1.4 (0.0) Charlie's Angels 56.4 - 73.5 (0.0) 80.1 11.1 86.6 21.9 Unforgettable 60.3 4.4 70.6 2.0 76.0 12.6 81.6 22.8 Community - - 39.4 7.2 152.2 34.5 114.2 17.3 Network TBD 12/13 Comedy - - - - - - 3.0 0.3 Network TBD 12/13 Drama - - 42.0 4.3 85.7 1.1 78.4 (0.0) Network TBD 12/13 Drama 2 - - 30.9 - 9.1 - 1.2 - Network TBD 13/14 Drama - - - - 30.9 - 9.1 (0.0) Network TBD 14/15 Drama - - - - - - 45.7 1.9 Network TBD 14/15 Drama 2 - - - - - - 28.8 - Dr. Oz 115.4 17.9 135.4 21.7 137.8 20.8 150.1 23.2 Nate Berkus 32.8 (4.9) 14.8 (0.0) 0.1 (0.0) 0.1 (0.0) 13/14 TBD Syndication - - - - 28.2 (2.4) 54.5 1.6 14/15 TBD Syndication - - - - - - 16.1 (2.1) Rescue Me 24.6 4.1 0.6 (0.3) 0.3 (0.2) 0.2 (0.2) My Boys 9.6 0.5 0.2 (0.1) - (0.1) - (0.1) Damages 45.7 4.3 5.8 (0.7) 3.8 (0.6) 6.9 (0.1)
Big C 31.5 0.3 26.4 0.5 2.8 (0.0) - - Justified 47.4 5.9 36.0 3.0 70.1 12.0 10.1 1.1 Franklin & Bash 23.1 0.4 - - - - 36.1 6.7 Boondocks 3.2 0.1 13.7 3.3 1.6 (0.0) 3.6 (0.1) Breaking Bad 70.2 18.6 66.3 16.7 16.6 3.3 3.8 0.2 Drop Dead Diva 42.0 7.5 31.6 7.4 53.2 13.0 9.1 2.1 Cable TBD Drama #1 - 12/13 - - 22.0 2.8 41.1 6.8 38.7 0.8 Cable TBD Drama #2 - 13/14 - - (0.0) (0.0) 22.0 2.8 41.1 1.2 Cable TBD Drama #1 - 14/15 - - - - - - 22.6 2.7 Cable TBD Drama #2 - 14/15 - - (0.0) (0.0) - - 20.9 - Telenovela - - 2.0 2.0 2.0 2.0 2.0 2.0 Sharecare 6.5 6.5 1.2 1.2 0.9 0.9 - -
Long Form Programming 63.1 7.1 44.0 5.4 43.0 5.1 42.7 5.0 Total Current non-deficit 726.9 70.5 794.8 96.2 946.0 131.0 1,012.4 129.0
Library Product 168.7 93.1 161.0 92.1 150.3 86.9 145.1 85.7 All Other Products 26.3 2.5 71.0 2.4 63.3 0.2 105.0 7.4
Total Library & Other titles 195.0 95.6 232.1 94.5 213.5 87.1 250.1 93.2
Wheel of Fortune/Jeopardy! 204.5 101.4 205.3 105.8 207.3 109.4 211.0 120.8
Days of Our Lives/ Young and the Restless 177.8 33.5 187.2 31.2 185.9 28.5 187.1 28.2
Earnings Challenge - 9.0 - - 18.0 18.0 6.0 6.0 Net Overhead - (37.5) - (38.2) - (39.8) - (41.0)
Embassy Row 25.1 2.4 48.6 4.0 55.7 5.4 74.6 7.4
TOTAL 1,589.0 185.0 1,709.7 218.0 1,887.0 268.0 1,993.0 272.0 10
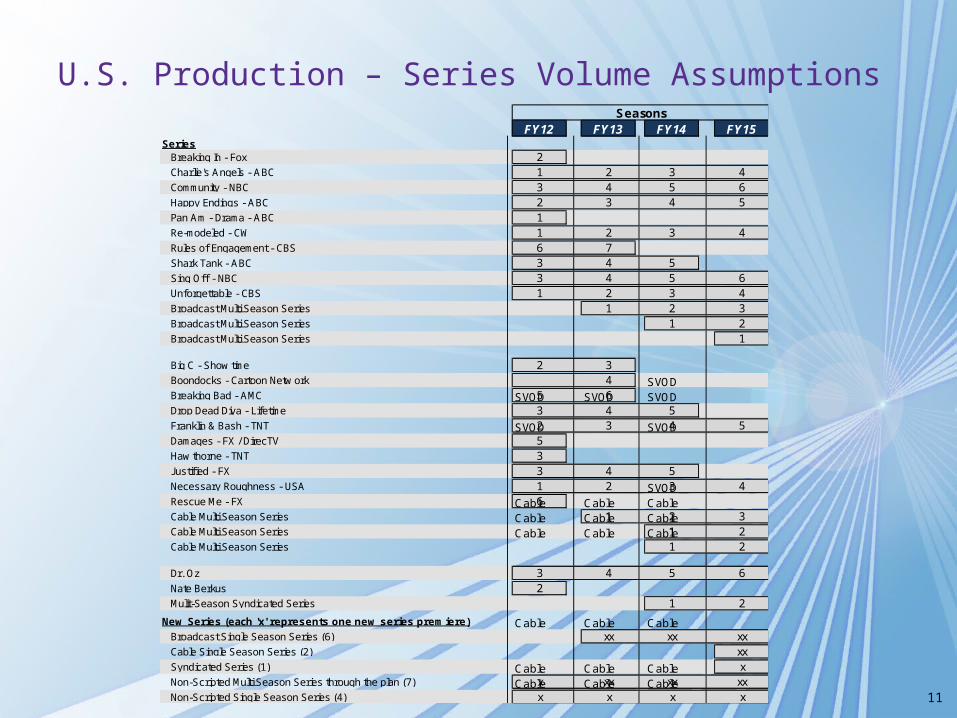
U.S. Production – Series Volume AssumptionsSeasons
FY12 FY13 FY14 FY15Series
Breaking In - Fox 2Charlie's Angels - ABC 1 2 3 4Community - NBC 3 4 5 6Happy Endings - ABC 2 3 4 5Pan Am - Drama - ABC 1Re-modeled - CW 1 2 3 4Rules of Engagement - CBS 6 7Shark Tank - ABC 3 4 5Sing Off - NBC 3 4 5 6Unforgettable - CBS 1 2 3 4Broadcast Multi Season Series 1 2 3Broadcast Multi Season Series 1 2Broadcast Multi Season Series 1
Big C - Show time 2 3Boondocks - Cartoon Netw ork 4 SVODBreaking Bad - AMC 5 6SVOD SVOD SVODDrop Dead Diva - Lifetime 3 4 5Franklin & Bash - TNT 2 3 4 5SVOD SVODDamages - FX / DirecTV 5Haw thorne - TNT 3Justif ied - FX 3 4 5Necessary Roughness - USA 1 2 3 4SVODRescue Me - FX 6Cable Cable CableCable Multi Season Series 1 2 3Cable Cable CableCable Multi Season Series 1 2Cable Cable CableCable Multi Season Series 1 2
Dr. Oz 3 4 5 6Nate Berkus 2Mulit-Season Syndicated Series 1 2
New Series (each 'x' represents one new series premiere) Cable Cable CableBroadcast Single Season Series (6) xx xx xxCable Single Season Series (2) xxSyndicated Series (1) xCable Cable CableNon-Scripted Multi Season Series through the plan (7) x xx xx xxCable Cable CableNon-Scripted Single Season Series (4) x x x x 11
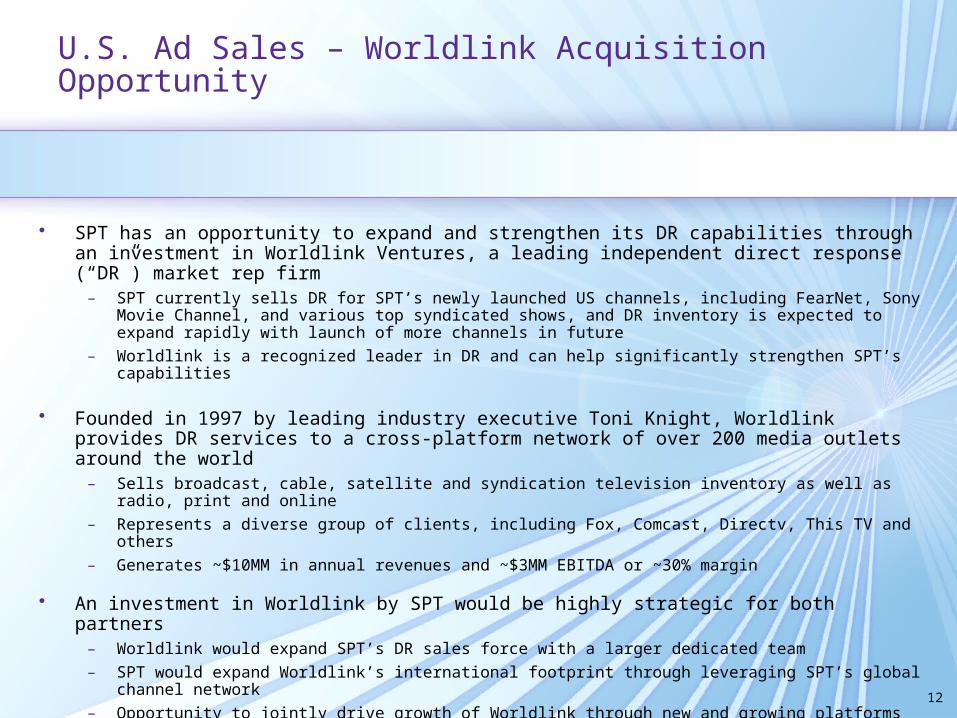
U.S. Ad Sales – Worldlink Acquisition Opportunity
• SPT has an opportunity to expand and strengthen its DR capabilities through an investment in Worldlink Ventures, a leading independent direct response (“DR”) market rep firm
– SPT currently sells DR for SPT’s newly launched US channels, including FearNet, Sony Movie Channel, and various top syndicated shows, and DR inventory is expected to expand rapidly with launch of more channels in future
– Worldlink is a recognized leader in DR and can help significantly strengthen SPT’s capabilities
• Founded in 1997 by leading industry executive Toni Knight, Worldlink provides DR services to a cross-platform network of over 200 media outlets around the world
– Sells broadcast, cable, satellite and syndication television inventory as well as radio, print and online
– Represents a diverse group of clients, including Fox, Comcast, Directv, This TV and others– Generates ~$10MM in annual revenues and ~$3MM EBITDA or ~30% margin
• An investment in Worldlink by SPT would be highly strategic for both partners– Worldlink would expand SPT’s DR sales force with a larger dedicated team– SPT would expand Worldlink’s international footprint through leveraging SPT’s global channel
network– Opportunity to jointly drive growth of Worldlink through new and growing platforms for DR (i.e.,
digital networks, online and gaming)– Anticipate a $18-20MM investment for an 80% stake in Worldlink, an implied enterprise valuation of
$22-25MM or appr. 7.5x to 8.5x EBITDA reflecting a control premium and potential earnouts 12

U.S. Ad Sales – Worldlink Acquisition Opportunity
Preliminary Projections($MM) 2010A 2011E 2012E 2013E 2014E 2015E
Total Revenue $9.8 $9.8 $10.3 $10.8 $11.3 $11.9Revenue Growth % 1% 0% 5% 5% 5% 5%
Operating Expenses (6.6) (6.3) (6.6) (6.8) (7.1) (7.5)
EBITDA 3.2 3.5 3.7 4.0 4.2 4.4 Margin % 32% 35% 36% 37% 37% 37%
Depreciation & Amortization (0.1) (0.1) (0.1) (0.1) (0.1) (0.1)
EBIT Before PPA 3.1 3.4 3.6 3.9 4.1 4.4 Margin % 32% 35% 35% 36% 37% 37%
Purchase Price Amortization (3.2) (3.2) (1.6) (1.6) (1.3)
EBIT 3.1 0.1 0.4 2.3 2.5 3.0
SONY FISCAL YEAR
FY12 FY13 FY14 FY15
Total Revenue $2.6 $10.4 $10.9 $11.5
Operating Expenses (1.6) (6.6) (6.9) (7.2)
EBITDA 0.9 3.8 4.1 4.3
Depreciation & Amortization (0.0) (0.1) (0.1) (0.1)
EBIT Before PPA 0.9 3.7 4.0 4.2
Purchase Price Amortization (0.8) (2.8) (1.6) (1.5)
EBIT 0.1 0.9 2.4 2.7
13