Appendix - jnnp.bmj.com
17
Appendix
Transcript of Appendix - jnnp.bmj.com

Appendix
Tables e1a-d. Diagnostic and drug codes for the identification of the multiple sclerosis
population, DMT exposures, and study outcomes
Table e-1a Multiple sclerosis and demyelinating disease related codes and drug
identification numbers of the disease-modifying therapies‡
Key: ‡The DMTs listed represented all those available (approved) for use in MS by Health Canada at some point
during the study
ICD-91 ICD-10 Drug
identification
number
Multiple sclerosis
Multiple sclerosis 340 G35 Demyelinating disease
Optic neuritis 377.3 H46 Acute transverse myelitis 323.82
341.2 G37.3
Acute disseminated encephalomyelitis
323 G36.9
Demyelinating disease of CNS unspecified
341.9 G37.8
Other acute disseminated
demyelination
G36
Neuromyelitis optica 341.0 G36.0
Disease-modifying therapy Betaseron® (IFNB-1b) 02169649 Extavia® (IFNB-1b) 02337819
Avonex (IFNB-1a) 02237770 02269201
Rebif (IFNB-1a) 02281708 02277492 02237317
02237319 02237320 02318253
02318261 Copaxone (glatiramer acetate) 02233014
02245619 Tysabri (natalizumab) 02286386 Gilenya (fingolimod) 02365480
Tecfidera (dimethyl fumarate)
02404508
Aubagio (teriflunomide) 02416328 Lemtrada (alemtuzumab) 02418320
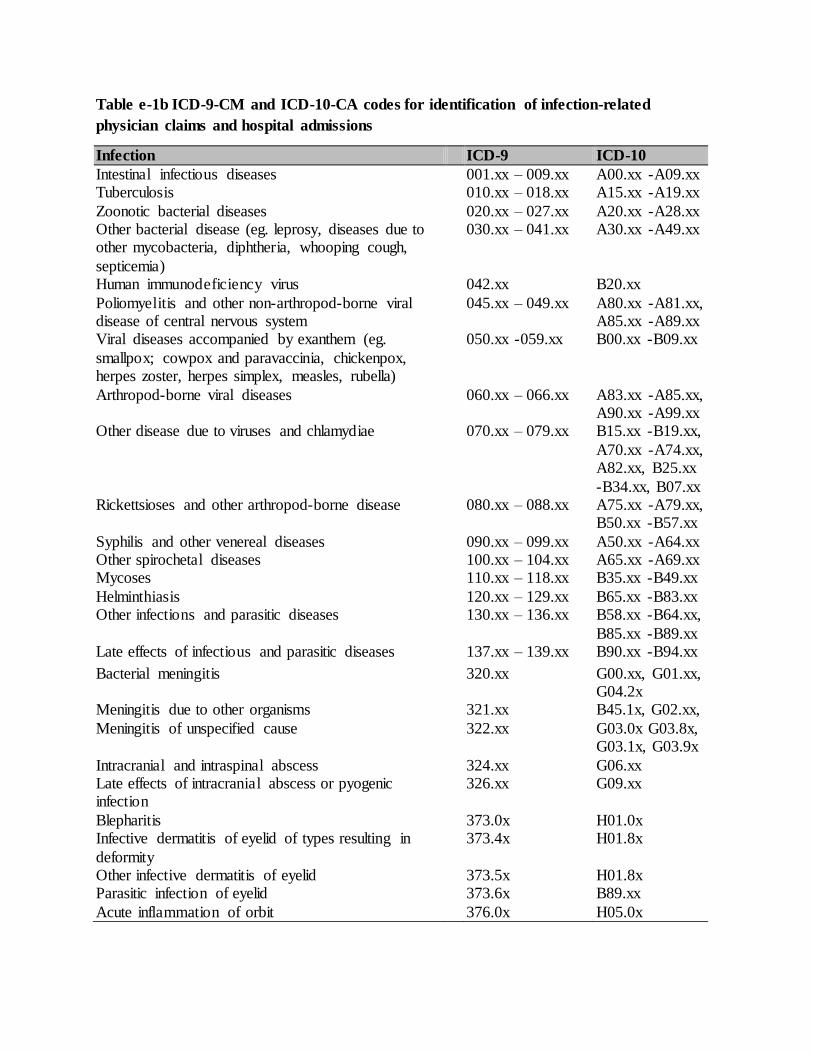
Table e-1b ICD-9-CM and ICD-10-CA codes for identification of infection-related
physician claims and hospital admissions
Infection ICD-9 ICD-10
Intestinal infectious diseases 001.xx – 009.xx A00.xx -A09.xx Tuberculosis 010.xx – 018.xx A15.xx -A19.xx
Zoonotic bacterial diseases 020.xx – 027.xx A20.xx -A28.xx Other bacterial disease (eg. leprosy, diseases due to other mycobacteria, diphtheria, whooping cough,
septicemia)
030.xx – 041.xx A30.xx -A49.xx
Human immunodeficiency virus 042.xx B20.xx
Poliomyelitis and other non-arthropod-borne viral disease of central nervous system
045.xx – 049.xx A80.xx -A81.xx, A85.xx -A89.xx
Viral diseases accompanied by exanthem (eg.
smallpox; cowpox and paravaccinia, chickenpox, herpes zoster, herpes simplex, measles, rubella)
050.xx -059.xx
B00.xx -B09.xx
Arthropod-borne viral diseases 060.xx – 066.xx A83.xx -A85.xx, A90.xx -A99.xx
Other disease due to viruses and chlamydiae 070.xx – 079.xx B15.xx -B19.xx,
A70.xx -A74.xx, A82.xx, B25.xx
-B34.xx, B07.xx Rickettsioses and other arthropod-borne disease 080.xx – 088.xx A75.xx -A79.xx,
B50.xx -B57.xx
Syphilis and other venereal diseases 090.xx – 099.xx A50.xx -A64.xx Other spirochetal diseases 100.xx – 104.xx A65.xx -A69.xx Mycoses 110.xx – 118.xx B35.xx -B49.xx
Helminthiasis 120.xx – 129.xx B65.xx -B83.xx Other infections and parasitic diseases 130.xx – 136.xx B58.xx -B64.xx,
B85.xx -B89.xx Late effects of infectious and parasitic diseases 137.xx – 139.xx B90.xx -B94.xx
Bacterial meningitis 320.xx G00.xx, G01.xx, G04.2x
Meningitis due to other organisms 321.xx B45.1x, G02.xx,
Meningitis of unspecified cause 322.xx G03.0x G03.8x, G03.1x, G03.9x
Intracranial and intraspinal abscess 324.xx G06.xx Late effects of intracranial abscess or pyogenic infection
326.xx G09.xx
Blepharitis 373.0x H01.0x Infective dermatitis of eyelid of types resulting in
deformity
373.4x H01.8x
Other infective dermatitis of eyelid 373.5x H01.8x Parasitic infection of eyelid 373.6x B89.xx
Acute inflammation of orbit 376.0x H05.0x

Table e-1b ICD-9-CM and ICD-10-CA codes for identification of infection-related
physician claims and hospital admissions (continued)
Infection ICD-9 ICD-10
Infective otitis externa 380.1x H60.0x, H60.1x, H60.2x, H60.3x,
H62.4x Suppurative and unspecified otitis media 382.xx H66.xx
Acute mastoiditis 383.0x H70.0x Acute nasopharyngitis (common cold) 460.xx J00.xx Acute sinusitis 461.xx J01.xx
Acute pharyngitis 462.xx J02.xx Acute tonsillitis 463.xx J03.xx
Acute laryngitis and tracheitis 464.xx J04.xx, J05.xx Acute upper respiratory tract infection of multiple or unspecified sites
465.xx J06.xx
Acute bronchitis and bronchiolitis 466.xx J20.xx, J21.xx Chronic sinusitis 473.xx J32.xx
Chronic disease of tonsils and adenoids 474.xx J35.xx Chronic laryngitis and laryngotracheitis 476.xx J37.xx Viral pneumonia 480.xx J12.xx
Pneumococcal pneumonia 481.xx J13.xx, J18.1x Other bacterial pneumonia 482.xx J15x, J14x
Pneumonia due to other specified organism 483.xx J16.xx Pneumonia in infectious diseases classified elsewhere 484.xx J17.xx Bronchopneumonia, organism unspecified 485.xx J18.0x
Pneumonia, organism unspecified 486.xx J18.xx Influenza 487.xx J11.xx, J10.xx,
J09.xx Bronchitis, not specified as acute or chronic 490.xx J40.xx Infections of the kidney 590.xx N10.xx, N11. xx,
N12.xx,, N15.1x, N28.84, N28.85,
N28.86, N16.xx Cystitis 595.xx N30.xx Urethritis not sexually transmitted 597.xx N34.xx
Urinary tract infection, site not specified 599.0x N39.0x Inflammatory disease of prostate (prostatitis) 601.xx N41.xx
Carbuncle and furuncle 680.xx L02.xx Cellulitis and abscess of finger and toe 681.xx L03.xx Other cellulitis and abscess 682.xx L03.xx
Acute lymphadenitis 683.xx L04.xx Impetigo 684.xx L01.xx
Other local infections of skin and subcutaneous tissue 686.xx L08.xx, L88.xx, L98.0x,
Septic arthritis 711.0x M00.xx, M01.xx
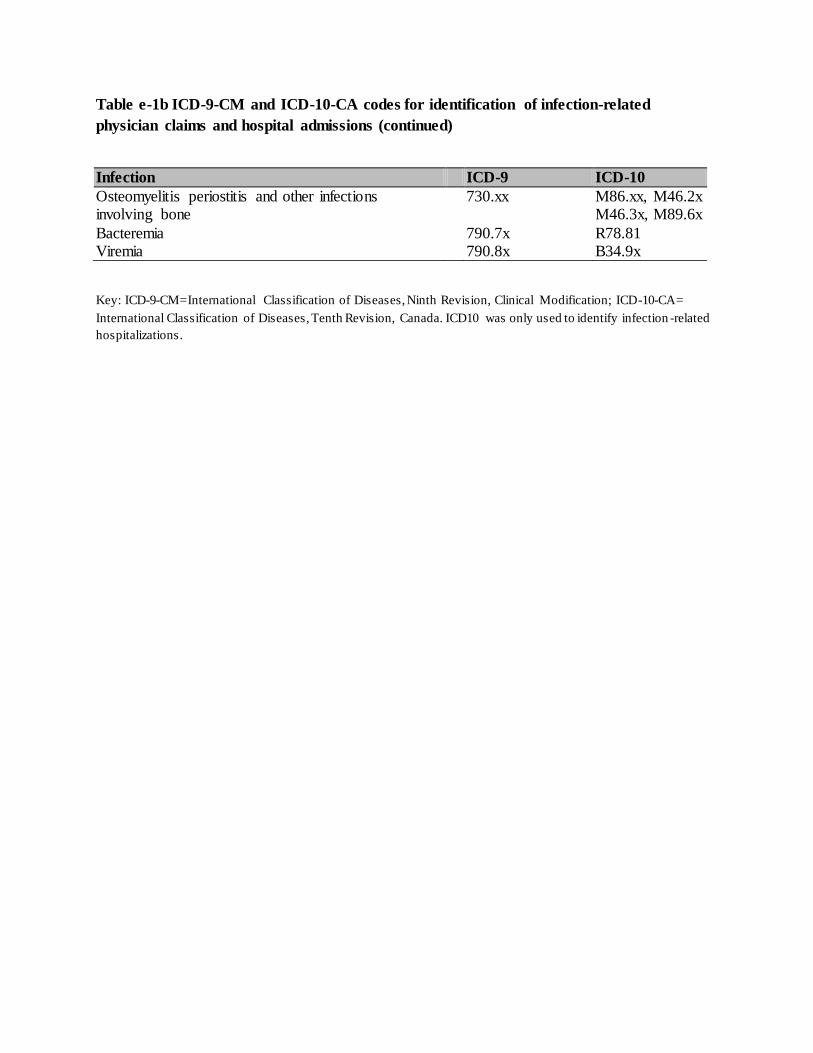
Table e-1b ICD-9-CM and ICD-10-CA codes for identification of infection-related
physician claims and hospital admissions (continued)
Key: ICD-9-CM=International Classification of Diseases, Ninth Revision, Clinical Modification; ICD-10-CA=
International Classification of Diseases, Tenth Revision, Canada. ICD10 was only used to identify infection -related
hospitalizations.
Infection ICD-9 ICD-10
Osteomyelitis periostitis and other infections involving bone
730.xx M86.xx, M46.2x M46.3x, M89.6x
Bacteremia 790.7x R78.81 Viremia 790.8x B34.9x
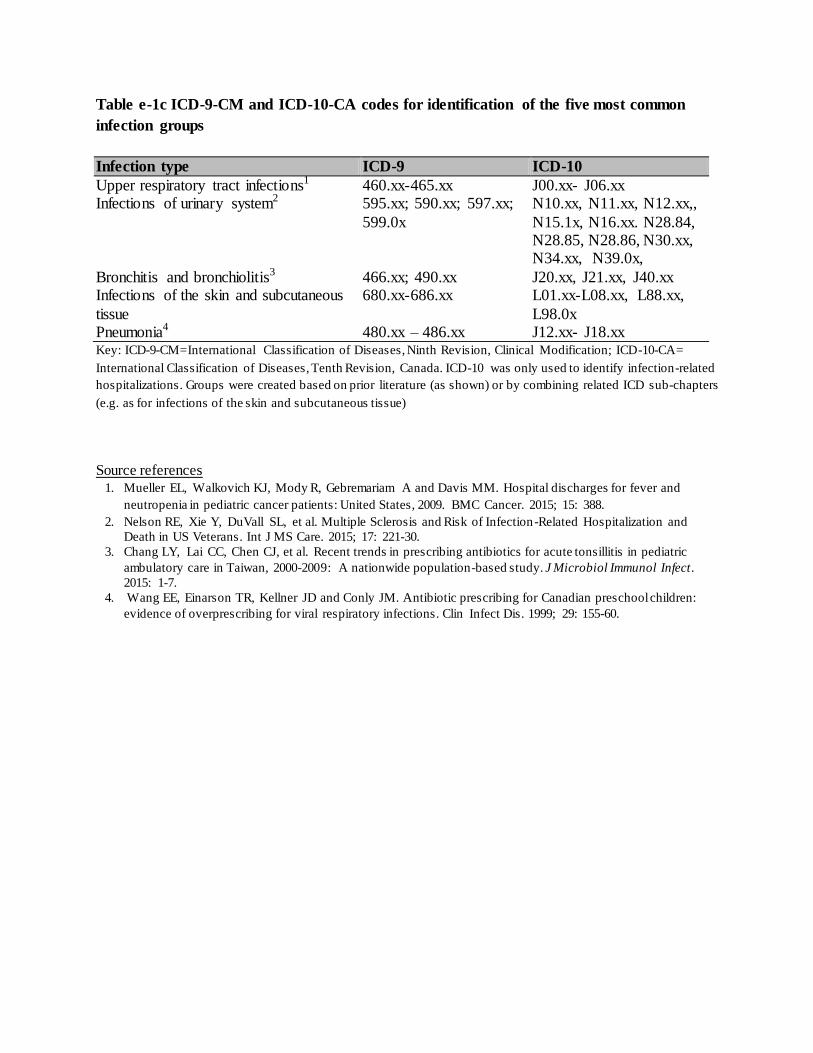
Table e-1c ICD-9-CM and ICD-10-CA codes for identification of the five most common
infection groups
Key: ICD-9-CM=International Classification of Diseases, Ninth Revision, Clinical Modification; ICD-10-CA=
International Classification of Diseases, Tenth Revision, Canada. ICD-10 was only used to identify infection-related
hospitalizations. Groups were created based on prior literature (as shown) or by combining related ICD sub-chapters
(e.g. as for infections of the skin and subcutaneous tissue)
Source references 1. Mueller EL, Walkovich KJ, Mody R, Gebremariam A and Davis MM. Hospital discharges for fever and
neutropenia in pediatric cancer patients: United States, 2009. BMC Cancer. 2015; 15: 388.
2. Nelson RE, Xie Y, DuVall SL, et al. Multiple Sclerosis and Risk of Infection-Related Hospitalization and
Death in US Veterans. Int J MS Care. 2015; 17: 221-30.
3. Chang LY, Lai CC, Chen CJ, et al. Recent trends in prescribing antibiotics for acute tonsillitis in pediatric
ambulatory care in Taiwan, 2000-2009: A nationwide population-based study. J Microbiol Immunol Infect.
2015: 1-7.
4. Wang EE, Einarson TR, Kellner JD and Conly JM. Antibiotic prescribing for Canadian preschool children:
evidence of overprescribing for viral respiratory infections. Clin Infect Dis. 1999; 29: 155-60.
Infection type ICD-9 ICD-10
Upper respiratory tract infections1 460.xx-465.xx J00.xx- J06.xx Infections of urinary system2 595.xx; 590.xx; 597.xx;
599.0x
N10.xx, N11.xx, N12.xx,,
N15.1x, N16.xx. N28.84, N28.85, N28.86, N30.xx, N34.xx, N39.0x,
Bronchitis and bronchiolitis3 466.xx; 490.xx J20.xx, J21.xx, J40.xx Infections of the skin and subcutaneous
tissue
680.xx-686.xx L01.xx-L08.xx, L88.xx,
L98.0x Pneumonia4 480.xx – 486.xx J12.xx- J18.xx
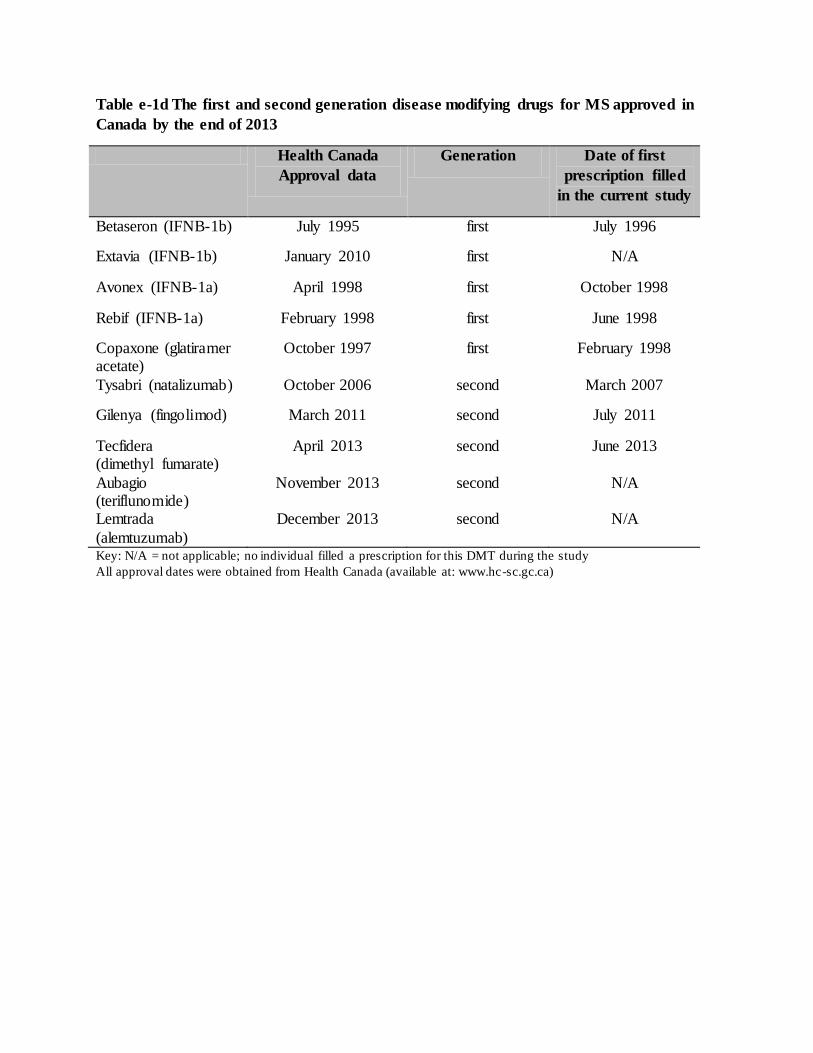
Table e-1d The first and second generation disease modifying drugs for MS approved in
Canada by the end of 2013
Health Canada
Approval data
Generation Date of first
prescription filled
in the current study
Betaseron (IFNB-1b) July 1995 first July 1996
Extavia (IFNB-1b) January 2010 first N/A
Avonex (IFNB-1a) April 1998 first October 1998
Rebif (IFNB-1a) February 1998 first June 1998
Copaxone (glatiramer acetate)
October 1997 first February 1998
Tysabri (natalizumab) October 2006 second March 2007
Gilenya (fingolimod) March 2011 second July 2011
Tecfidera (dimethyl fumarate)
April 2013 second June 2013
Aubagio (teriflunomide)
November 2013 second N/A
Lemtrada
(alemtuzumab)
December 2013 second N/A
Key: N/A = not applicable; no individual filled a prescription for this DMT during the study
All approval dates were obtained from Health Canada (available at: www.hc-sc.gc.ca)
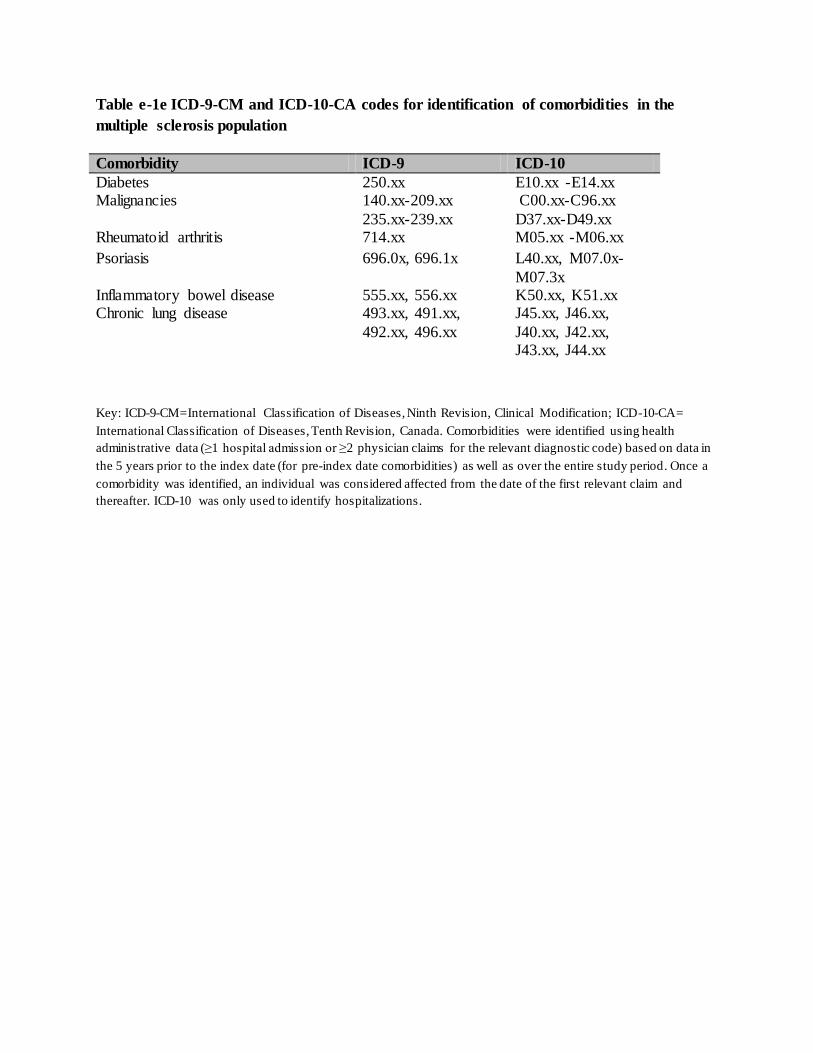
Table e-1e ICD-9-CM and ICD-10-CA codes for identification of comorbidities in the
multiple sclerosis population
Key: ICD-9-CM=International Classification of Diseases, Ninth Revision, Clinical Modification; ICD-10-CA=
International Classification of Diseases, Tenth Revision, Canada. Comorbidities were identified using health
administrative data (≥1 hospital admission or ≥2 physician claims for the relevant diagnostic code) based on data in
the 5 years prior to the index date (for pre-index date comorbidities) as well as over the entire study period. Once a
comorbidity was identified, an individual was considered affected from the date of the first relevant claim and
thereafter. ICD-10 was only used to identify hospitalizations.
Comorbidity ICD-9 ICD-10
Diabetes 250.xx E10.xx -E14.xx Malignancies 140.xx-209.xx
235.xx-239.xx
C00.xx-C96.xx
D37.xx-D49.xx Rheumatoid arthritis 714.xx M05.xx -M06.xx
Psoriasis 696.0x, 696.1x L40.xx, M07.0x-
M07.3x Inflammatory bowel disease 555.xx, 556.xx K50.xx, K51.xx Chronic lung disease
493.xx, 491.xx,
492.xx, 496.xx
J45.xx, J46.xx,
J40.xx, J42.xx, J43.xx, J44.xx

Table e-2 Characteristics of the multiple sclerosis study population at the index date by subsequent disease -modifying treatment
exposure
Characteristics Unexposed ≥1 DMT Any beta-
interferon
Glatiramer
acetate
Natalizumab
Any oral
DMT†
1st and 2nd
generation
combined
1st generation 1st generation 2nd generation 2nd generation
N=5077 N=1716 N=1386 N=656 N=100 N=98
Age (yrs), mean (SD) 47.8 (13.5) 38.2 (9.4) 38.0 (9.4) 37.7 (9.2) 34.5 (9.6) 35.3 (9.1)
Women, N (%) 3712 (73.1) 1287 (75.0) 1039 (75.0) 500 (76.2) 71 (71.0) 76 (77.6)
Index year, N (%)
1996-2001 1777 (35.0) 642 (37.4) 569 (41.1) 189 (28.8) 23 (23.0) 12 (12.2)
2002-2007 1859 (36.6) 659 (38.4) 541 (39.0) 278 (42.4) 60 (60.0) 38 (38.8)
2008-2013 1441 (28.4) 415 (24.2) 276 (19.9) 189 (28.8) 17 (17.0) 48 (49.0)
SES, N (%)
1 (lowest income quintile) 891 (17.5) 308 (17.9) 253 (18.3) 126 (19.2) 19 (19.0) 13 (13.3)
2 984 (19.4) 319 (18.6) 257 (18.5) 118 (18.0) 18 (18.0) 18 (18.4)
3 1052 (20.7) 359 (20.9) 296 (21.4) 142 (21.6) 19 (19.0) 19 (19.4)
4 1097 (21.6) 371 (21.6) 288 (20.8) 144 (22.0) 27 (27.0) 22 (22.4)
5 (highest income quintile) 1028 (20.2) 357 (20.8) 290 (20.9) 126 (19.2) 17 (17.0) 26 (26.5)
Unknown 25 (0.5) <6 <6 <6 <6 <6
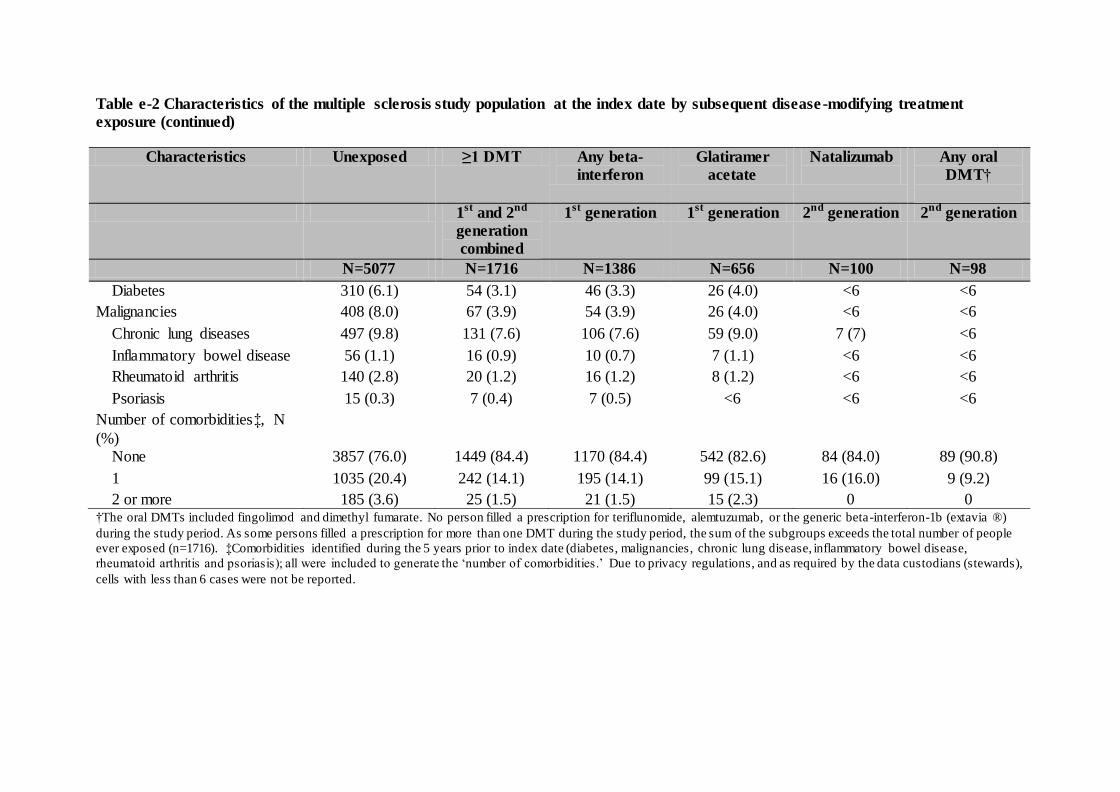
Table e-2 Characteristics of the multiple sclerosis study population at the index date by subsequent disease -modifying treatment
exposure (continued)
†The oral DMTs included fingolimod and dimethyl fumarate. No person filled a prescription for teriflunomide, alemtuzumab, or the generic beta-interferon-1b (extavia ®)
during the study period. As some persons filled a prescription for more than one DMT during the study period, the sum of the subgroups exceeds the total number of people
ever exposed (n=1716). ‡Comorbidities identified during the 5 years prior to index date (diabetes, malignancies, chronic lung disease, inflammatory bowel disease,
rheumatoid arthritis and psoriasis); all were included to generate the ‘number of comorbidities.’ Due to privacy regulations, and as required by the data custodians (stewards),
cells with less than 6 cases were not be reported.
Characteristics Unexposed ≥1 DMT Any beta-
interferon Glatiramer
acetate
Natalizumab
Any oral
DMT†
1st and 2nd
generation
combined
1st generation 1st generation 2nd generation 2nd generation
N=5077 N=1716 N=1386 N=656 N=100 N=98
Diabetes 310 (6.1) 54 (3.1) 46 (3.3) 26 (4.0) <6 <6
Malignancies 408 (8.0) 67 (3.9) 54 (3.9) 26 (4.0) <6 <6
Chronic lung diseases 497 (9.8) 131 (7.6) 106 (7.6) 59 (9.0) 7 (7) <6
Inflammatory bowel disease 56 (1.1) 16 (0.9) 10 (0.7) 7 (1.1) <6 <6
Rheumatoid arthritis 140 (2.8) 20 (1.2) 16 (1.2) 8 (1.2) <6 <6
Psoriasis 15 (0.3) 7 (0.4) 7 (0.5) <6 <6 <6
Number of comorbidities‡, N
(%)
None 3857 (76.0) 1449 (84.4) 1170 (84.4) 542 (82.6) 84 (84.0) 89 (90.8)
1 1035 (20.4) 242 (14.1) 195 (14.1) 99 (15.1) 16 (16.0) 9 (9.2)
2 or more 185 (3.6) 25 (1.5) 21 (1.5) 15 (2.3) 0 0

Table e-3 Adjusted hazard ratios of physician claims for specific infections by multiple sclerosis disease modifying treatment
Infection Model DMT exposure status Infection-related
physician claims
Person-years Crude rate
per 1000 PY (95%CI)
aHR (95%CI)
Upper respiratory
tract infection
Unexposed 9926 51,703.5 192.0 (188.2-195.8) reference
1 Any DMT 1416 6832.6 207.2 (196.6-218.3) 0.96 (0.88-1.05)
2 Any 1st generation DMT 1334 6577.0 202.8 (192.1-214.0) 0.94 (0.85-1.03)
2 Any 2nd generation DMT 82 255.6 320.8 (255.2-398.2) 1.58 (1.18-2.10)
3 Beta-interferon 1011 5019.2 201.4 (189.2-214.2) 0.92 (0.83-1.02)
3 Glatiramer acetate 323 1557.7 207.4 (185.4-231.3) 1.00 (0.85-1.17)
3 Natalizumab 64 177.6 360.4 (277.5-460.2) 1.77 (1.26-2.49)
Any 1st generation DMT 1334 6577.0 202.8 (192.1-214.0) reference
2 Any 2nd generation DMT 82 255.6 320.8 (255.2-398.2) 1.68 (1.25-2.26)
Infections of the
urinary system
Unexposed 6494 51640.9 125.8 (122.7-128.9) reference
1 Any DMT 849 7222.6 117.5 (109.8-125.7) 1.09 (0.96-1.23)
2 Any 1st generation DMT 815 6948.9 117.3 (109.4-125.6) 1.09 (0.95-1.24)
2 Any 2nd generation DMT 34 273.7 124.2 (86.0-173.6) 1.14 (0.79-1.63)
3 Beta-interferon 604 5259.4 114.8 (105.9-124.4) 1.06 (0.92-1.23)
3 Glatiramer acetate 211 1689.5 124.9 (108.6-142.9) 1.16 (0.89-1.51)
3 Natalizumab 25 192.9 129.6 (83.9-191.3) 1.21 (0.79-1.86)
Any 1st generation DMT 815 6948.9 117.3 (109.4-125.6) reference
2 Any 2nd generation DMT 34 273.7 124.2 (86.0-173.6) 1.05 (0.72-1.52)

Table e-3 Adjusted hazard ratios of physician claims for specific infections by multiple sclerosis disease modifying treatment (continued)
Infection Model DMT exposure status Infection-related
physician claims
Person-years Crude rate
per 1000 PY (95%CI)
aHR (95%CI)
Infections of the
skin and
subcutaneous
tissue
Unexposed 3981 51678.3 77.0 (74.7-79.5) reference
1 Any DMT 510 7418.5 68.7 (62.9-75.0) 1.03 (0.91-1.17)
2 Any 1st generation DMT 490 7123.6 68.8 (62.8-75.2) 1.03 (0.90-1.17)
2 Any 2nd generation DMT 20 294.9 67.8 (41.4-104.7) 1.04 (0.64-1.69)
3 Beta-interferon 390 5383.5 72.4 (65.4-80.0) 1.09 (0.94-1.26)
3 Glatiramer acetate 100 1740.1 57.5 (46.8-69.9) 0.85 (0.64-1.12)
3 Natalizumab 13 214.0 60.7 (32.3-103.9) 0.92 (0.49-1.72)
Any 1st generation DMT 490 7123.6 68.8 (62.8-75.2) reference
2 Any 2nd generation DMT 20 294.9 67.8 (41.4-104.7) 1.01 (0.62-1.65)
Bronchitis and
bronchiolitis
Unexposed 4163 51739.0 80.5 (78.0-82.9) reference
1 Any DMT 494 7344.6 67.3 (61.5-73.5) 0.93 (0.81-1.06)
2 Any 1st generation DMT 469 7063.1 66.4 (60.5-72.7) 0.91 (0.79-1.05)
2 Any 2nd generation DMT 25 281.5 88.8 (57.5-131.1) 1.38 (0.91-2.10)
3 Beta-interferon 360 5351.9 67.3 (60.5-74.6) 0.92 (0.78-1.07)
3 Glatiramer acetate 109 1711.2 63.7 (52.3-76.8) 0.89 (0.67-1.18)
3 Natalizumab 19 198.0 96.0 (57.8-150.0) 1.45 (0.89-2.36)
Any 1st generation DMT 469 7063.1 66.4 (60.5-72.7) reference
2 Any 2nd generation DMT 25 281.5 88.8 (57.5-131.1) 1.52 (0.99-2.34)

Table e-3 Adjusted hazard ratios of physician claims for specific infections by multiple sclerosis disease modifying treatment (continued)
Key: aHR=adjusted Hazard Ratio; CI= Confidence Interval; DMT= disease modifying treatment; PY=person -years. Models were adjusted for sex, age (continuous), index
year (continuous), SES (quintiles), number of comorbidities (none, 1, ≥2). Due to privacy regulations, and as required by the data custodians (stewards), cells with less than 6 cases were not be reported, nor were the corresponding crude rates. Oral DMTs were assessed only as part of the second generation drugs, i.e not as a separate class, due to the limited number of eve nts.
Infection Model DMT exposure status Infection-related
physician claims
Person-years Crude rate
per 1000 PY (95%CI)
aHR (95%CI)
Pneumonia
Unexposed 1362 51677.2 26.4 (25.0-27.8) Reference
1 Any DMT 92 7670.4 12.0 (9.7-14.7) 0.75 (0.59-0.95)
2 Any 1st generation DMT 85 7372.8 11.5 (9.2-14.3) 0.72 (0.56-0.92)
2 Any 2nd generation DMT 7 297.6 23.5 (9.5-48.5) 1.66 (0.78-3.56)
3 Beta-interferon 66 5570.6 11.8 (9.2-15.1) 0.74 (0.56-0.98)
3 Glatiramer acetate 19 1802.3 10.5 (6.3-16.5) 0.64 (0.39-1.04)
3 Natalizumab <6 214.7 - 1.29 (0.47-3.54)
Any 1st generation DMT 85 7372.8 11.5 (9.2-14.3) Reference
2 Any 2nd generation DMT 7 297.6 23.5 (9.5-48.5) 2.33(1.06-5.12)
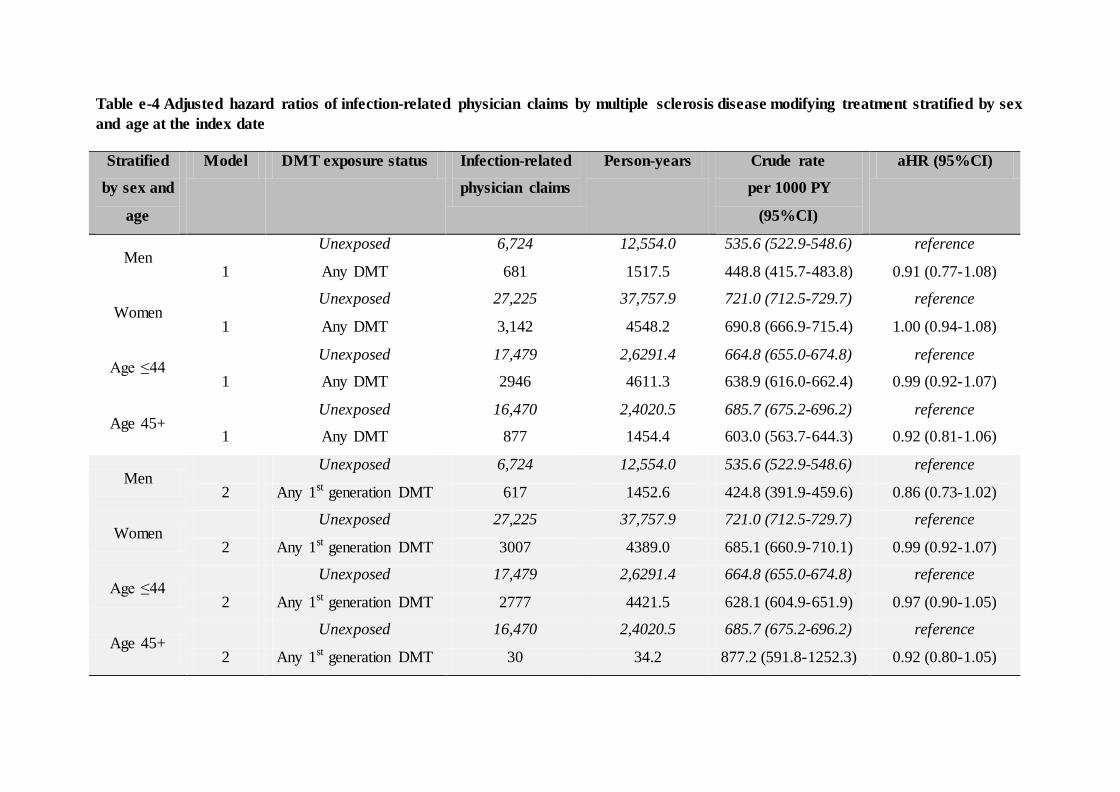
Table e-4 Adjusted hazard ratios of infection-related physician claims by multiple sclerosis disease modifying treatment stratified by sex
and age at the index date
Stratified
by sex and
age
Model DMT exposure status Infection-related
physician claims
Person-years Crude rate
per 1000 PY
(95%CI)
aHR (95%CI)
Men Unexposed 6,724 12,554.0 535.6 (522.9-548.6) reference
1 Any DMT 681 1517.5 448.8 (415.7-483.8) 0.91 (0.77-1.08)
Women Unexposed 27,225 37,757.9 721.0 (712.5-729.7) reference
1 Any DMT 3,142 4548.2 690.8 (666.9-715.4) 1.00 (0.94-1.08)
Age ≤44 Unexposed 17,479 2,6291.4 664.8 (655.0-674.8) reference
1 Any DMT 2946 4611.3 638.9 (616.0-662.4) 0.99 (0.92-1.07)
Age 45+ Unexposed 16,470 2,4020.5 685.7 (675.2-696.2) reference
1 Any DMT 877 1454.4 603.0 (563.7-644.3) 0.92 (0.81-1.06)
Men Unexposed 6,724 12,554.0 535.6 (522.9-548.6) reference
2 Any 1st generation DMT 617 1452.6 424.8 (391.9-459.6) 0.86 (0.73-1.02)
Women Unexposed 27,225 37,757.9 721.0 (712.5-729.7) reference
2 Any 1st generation DMT 3007 4389.0 685.1 (660.9-710.1) 0.99 (0.92-1.07)
Age ≤44 Unexposed 17,479 2,6291.4 664.8 (655.0-674.8) reference
2 Any 1st generation DMT 2777 4421.5 628.1 (604.9-651.9) 0.97 (0.90-1.05)
Age 45+ Unexposed 16,470 2,4020.5 685.7 (675.2-696.2) reference
2 Any 1st generation DMT 30 34.2 877.2 (591.8-1252.3) 0.92 (0.80-1.05)

Table e-4 Adjusted hazard ratios of infection-related physician claims by multiple sclerosis disease modifying treatment stratified by sex
and age at the index date (continued)
Stratified by
sex and age
Model DMT exposure status Infection-related
physician claims
Person-years Crude rate
per 1000 PY
(95%CI)
aHR (95%CI)
Men Unexposed 6,724 12,554.0 535.6 (522.9-548.6) reference
2 Any 2nd generation DMT 64 64.9 986.1 (759.4-1259.3) 2.09 (1.18-3.70)
Women Unexposed 27,225 37,757.9 721.0 (712.5-729.7) Reference
2 Any 2nd generation DMT 135 159.1 848.5 (711.4-1004.3) 1.32 (1.06-1.63)
Age ≤44 Unexposed 17,479 2,6291.4 664.8 (655.0-674.8) Reference
2 Any 2nd generation DMT 169 189.8 890.4 (761.2-1035.2) 1.52 (1.17-1.99)
Age 45+ Unexposed 16,470 2,4020.5 685.7 (675.2-696.2) Reference
2 Any 2nd generation DMT 30 34.2 877.2 (591.8-1252.3) 1.25 (0.83-1.87)
Men Unexposed 6,724 12,554.0 535.6 (522.9-548.6) reference
3 Beta-interferon 420 1037.3 404.9 (367.1-445.5) 0.81 (0.68-0.98)
Women Unexposed 27,225 37,757.9 721.0 (712.5-730.7) reference
3 Beta-interferon 2302 3441.4 668.9 (641.9-696.8) 0.97 (0.89-1.05)
Age ≤44 Unexposed 17,479 2,6291.4 664.8 (655.0-674.8) reference
3 Beta-interferon 2080 3347.9 621.3 (594.9-648.6) 0.95 (0.88-1.04)
Age 45+ Unexposed 16,470 2,4020.5 685.7 (675.2-696.2) reference
3 Beta-interferon 642 1130.8 567.7 (524.7-613.4) 0.88 (0.75-1.02)
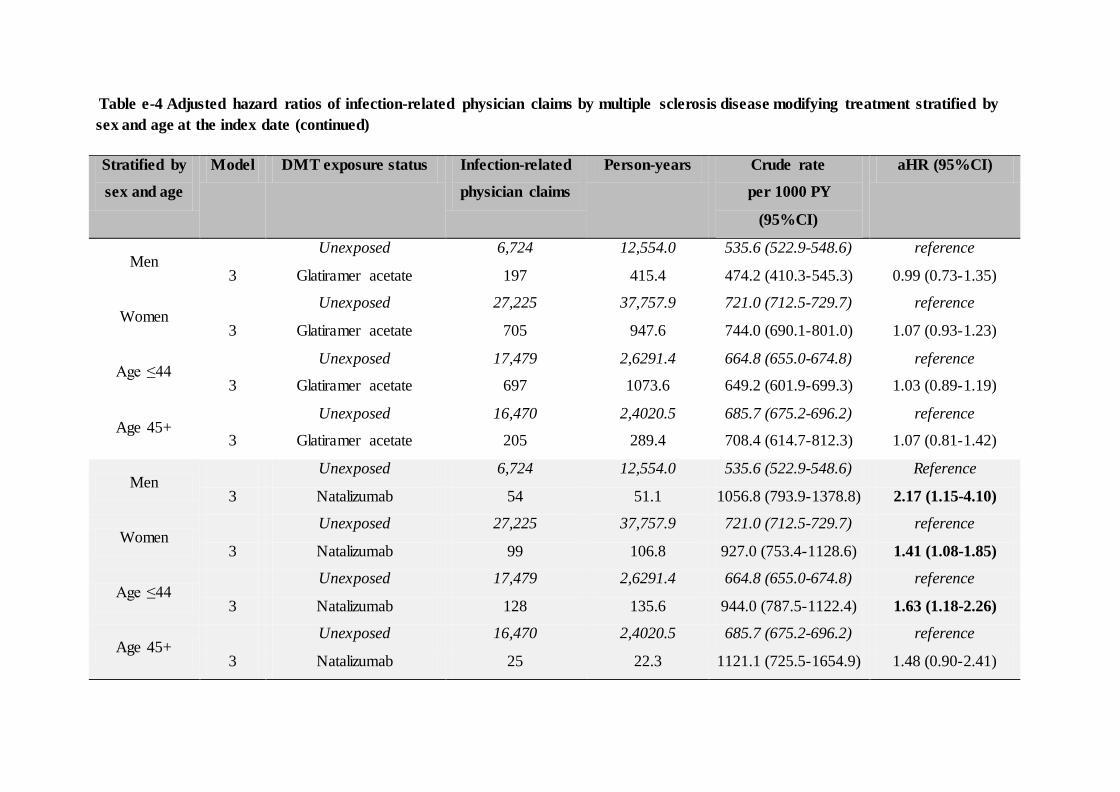
Table e-4 Adjusted hazard ratios of infection-related physician claims by multiple sclerosis disease modifying treatment stratified by
sex and age at the index date (continued)
Stratified by
sex and age
Model DMT exposure status Infection-related
physician claims
Person-years Crude rate
per 1000 PY
(95%CI)
aHR (95%CI)
Men Unexposed 6,724 12,554.0 535.6 (522.9-548.6) reference
3 Glatiramer acetate 197 415.4 474.2 (410.3-545.3) 0.99 (0.73-1.35)
Women Unexposed 27,225 37,757.9 721.0 (712.5-729.7) reference
3 Glatiramer acetate 705 947.6 744.0 (690.1-801.0) 1.07 (0.93-1.23)
Age ≤44 Unexposed 17,479 2,6291.4 664.8 (655.0-674.8) reference
3 Glatiramer acetate 697 1073.6 649.2 (601.9-699.3) 1.03 (0.89-1.19)
Age 45+ Unexposed 16,470 2,4020.5 685.7 (675.2-696.2) reference
3 Glatiramer acetate 205 289.4 708.4 (614.7-812.3) 1.07 (0.81-1.42)
Men Unexposed 6,724 12,554.0 535.6 (522.9-548.6) Reference
3 Natalizumab 54 51.1 1056.8 (793.9-1378.8) 2.17 (1.15-4.10)
Women Unexposed 27,225 37,757.9 721.0 (712.5-729.7) reference
3 Natalizumab 99 106.8 927.0 (753.4-1128.6) 1.41 (1.08-1.85)
Age ≤44 Unexposed 17,479 2,6291.4 664.8 (655.0-674.8) reference
3 Natalizumab 128 135.6 944.0 (787.5-1122.4) 1.63 (1.18-2.26)
Age 45+ Unexposed 16,470 2,4020.5 685.7 (675.2-696.2) reference
3 Natalizumab 25 22.3 1121.1 (725.5-1654.9) 1.48 (0.90-2.41)
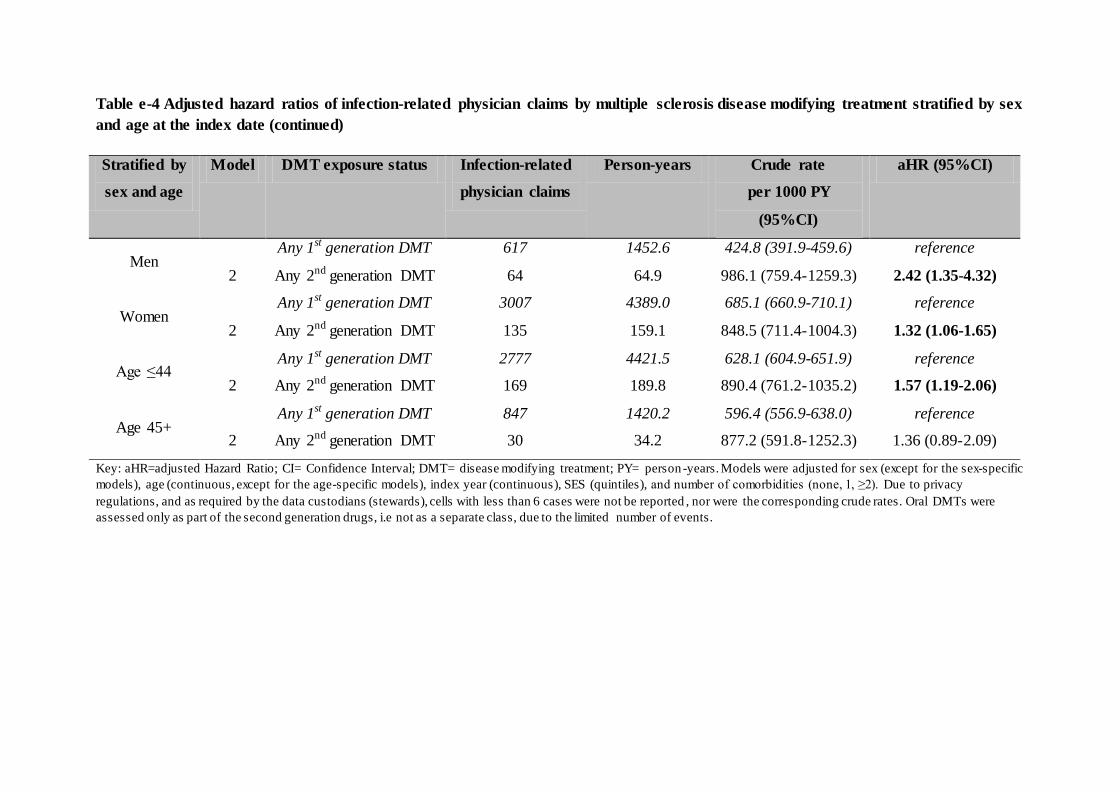
Table e-4 Adjusted hazard ratios of infection-related physician claims by multiple sclerosis disease modifying treatment stratified by sex
and age at the index date (continued)
Key: aHR=adjusted Hazard Ratio; CI= Confidence Interval; DMT= disease modifying treatment; PY= person -years. Models were adjusted for sex (except for the sex-specific
models), age (continuous, except for the age-specific models), index year (continuous), SES (quintiles), and number of comorbidities (none, 1, ≥2). Due to privacy
regulations, and as required by the data custodians (stewards), cells with less than 6 cases were not be reported , nor were the corresponding crude rates. Oral DMTs were
assessed only as part of the second generation drugs, i.e not as a separate class, due to the limited number of events.
Stratified by
sex and age
Model DMT exposure status Infection-related
physician claims
Person-years Crude rate
per 1000 PY
(95%CI)
aHR (95%CI)
Men Any 1st generation DMT 617 1452.6 424.8 (391.9-459.6) reference
2 Any 2nd generation DMT 64 64.9 986.1 (759.4-1259.3) 2.42 (1.35-4.32)
Women Any 1st generation DMT 3007 4389.0 685.1 (660.9-710.1) reference
2 Any 2nd generation DMT 135 159.1 848.5 (711.4-1004.3) 1.32 (1.06-1.65)
Age ≤44 Any 1st generation DMT 2777 4421.5 628.1 (604.9-651.9) reference
2 Any 2nd generation DMT 169 189.8 890.4 (761.2-1035.2) 1.57 (1.19-2.06)
Age 45+ Any 1st generation DMT 847 1420.2 596.4 (556.9-638.0) reference
2 Any 2nd generation DMT 30 34.2 877.2 (591.8-1252.3) 1.36 (0.89-2.09)


![Bbstracts. - jnnp.bmj.com · ABSTRACTS [2] Studies in the pathological anatomyof ' Landry's paralysis' (Studienzur pathologischen Anatomie der 'Landryschen Paralyse ').-GRUNE- WALD.](https://static.fdocuments.in/doc/165x107/5eabc93d3788374713509997/bbstracts-jnnpbmjcom-abstracts-2-studies-in-the-pathological-anatomyof-.jpg)