APPENDIX J Hercules ITC Traffic Impact Analysis Report
162
APPENDIX J Hercules ITC Traffic Impact Analysis Report
Transcript of APPENDIX J Hercules ITC Traffic Impact Analysis Report

APPENDIX J
Hercules ITC Traffic Impact Analysis Report


Administrative Draft Report
Hercules Intermodal Transit Center (HITC) Traffic Impact Analysis
Prepared for:
HDR, Inc
Prepared by:
1000 Broadway
Suite 450
Oakland, CA 94607‐4039
February 10, 2010


1000 Broadway Suite 450 Oakland, CA 94607-4039 (510) 763-2061 (510) 268-1739 fax www.dksassociates.com
February 10, 2010 Mr. John Meerscheidt Senior Environmental Project Manager HDR, Inc. 1610 Arden Way, Suite 175 Sacramento, CA 95815‐4041 Subject: Hercules Intermodal Transit Center
Traffic Impact Analysis – Administrative Draft Report P 09139‐000
Dear Mr. Meerscheidt:
DKS Associates is pleased to submit this Administrative Draft Traffic Impact Analysis Report for the proposed Hercules Intermodal Transit Center in Hercules, CA. The report includes an evaluation of potential transportation impacts associated with the proposed project, and makes recommendations to improve parking and vehicular circulation in the study area. Please do not hesitate to call with any questions regarding this report. DKS has enjoyed being of service on this project. Sincerely, DKS Associates A California Corporation
Mark Spencer, P.E. Principal

Hercules Intermodal Transit Center (HITC)
Page i
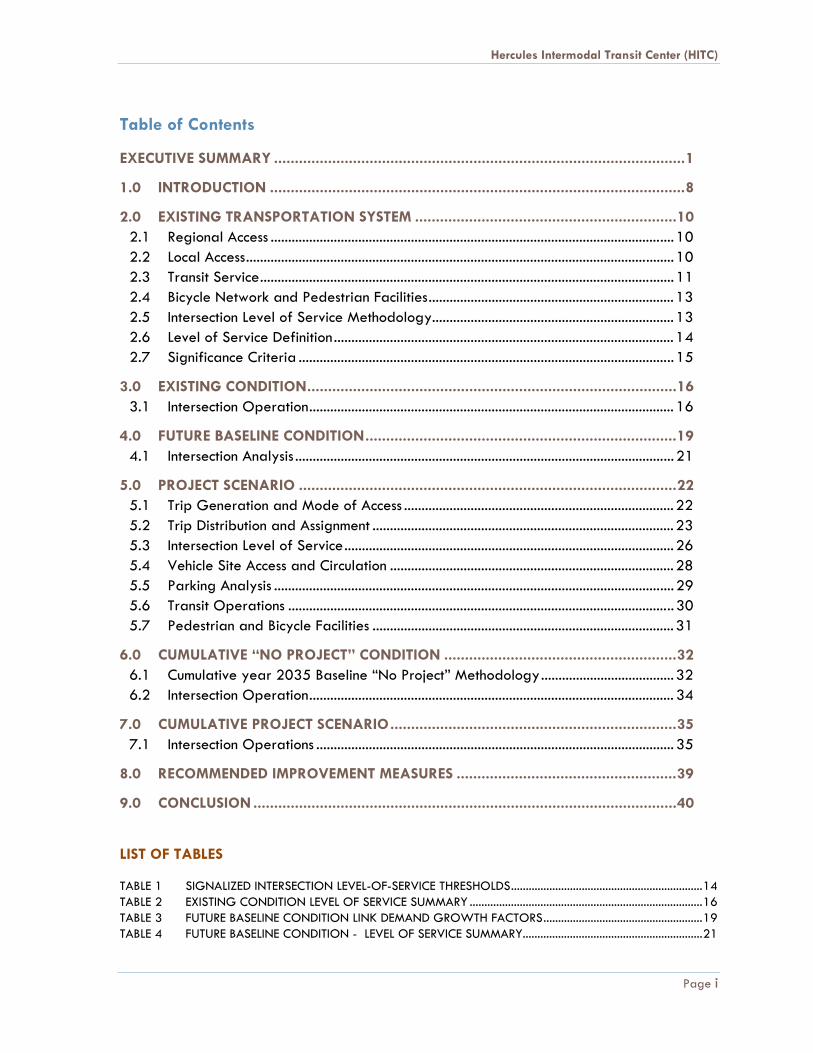
Table of Contents
EXECUTIVE SUMMARY ................................................................................................... 1
1.0 INTRODUCTION .................................................................................................... 8
2.0 EXISTING TRANSPORTATION SYSTEM ............................................................... 10 2.1 Regional Access ................................................................................................................... 10 2.2 Local Access .......................................................................................................................... 10 2.3 Transit Service ...................................................................................................................... 11 2.4 Bicycle Network and Pedestrian Facilities ...................................................................... 13 2.5 Intersection Level of Service Methodology..................................................................... 13 2.6 Level of Service Definition ................................................................................................. 14 2.7 Significance Criteria ........................................................................................................... 15
3.0 EXISTING CONDITION ......................................................................................... 16 3.1 Intersection Operation ........................................................................................................ 16
4.0 FUTURE BASELINE CONDITION ........................................................................... 19 4.1 Intersection Analysis ............................................................................................................ 21
5.0 PROJECT SCENARIO ........................................................................................... 22 5.1 Trip Generation and Mode of Access ............................................................................. 22 5.2 Trip Distribution and Assignment ...................................................................................... 23 5.3 Intersection Level of Service .............................................................................................. 26 5.4 Vehicle Site Access and Circulation ................................................................................. 28 5.5 Parking Analysis .................................................................................................................. 29 5.6 Transit Operations .............................................................................................................. 30 5.7 Pedestrian and Bicycle Facilities ...................................................................................... 31
6.0 CUMULATIVE “NO PROJECT” CONDITION ........................................................ 32 6.1 Cumulative year 2035 Baseline “No Project” Methodology ...................................... 32 6.2 Intersection Operation ........................................................................................................ 34
7.0 CUMULATIVE PROJECT SCENARIO ..................................................................... 35 7.1 Intersection Operations ...................................................................................................... 35
8.0 RECOMMENDED IMPROVEMENT MEASURES ..................................................... 39
9.0 CONCLUSION ...................................................................................................... 40
LIST OF TABLES
TABLE 1 SIGNALIZED INTERSECTION LEVEL-OF-SERVICE THRESHOLDS ................................................................. 14 TABLE 2 EXISTING CONDITION LEVEL OF SERVICE SUMMARY ............................................................................... 16 TABLE 3 FUTURE BASELINE CONDITION LINK DEMAND GROWTH FACTORS ...................................................... 19 TABLE 4 FUTURE BASELINE CONDITION - LEVEL OF SERVICE SUMMARY ............................................................. 21

Hercules Intermodal Transit Center (HITC)
Page ii
TABLE 5 RAIL BOARDINGS BY MODE OF ACCESS ..................................................................................................... 22 TABLE 6 HERCULES ITC TRIP DISTRIBUTION .................................................................................................................. 23 TABLE 7 PROJECT CONDITION - LEVEL OF SERVICE SUMMARY ............................................................................. 26 TABLE 8 LOS COMPARISON SUMMARY – A.M. PEAK ............................................................................................... 27 TABLE 9 LOS COMPARISON SUMMARY – P.M. PEAK ................................................................................................ 28 TABLE 10 PARKING SUPPLY SUMMARY .......................................................................................................................... 30 TABLE 11 CUMULATIVE NO PROJECT CONDITION LINK DEMAND GROWTH FACTORS .................................... 32 TABLE 12 CUMULATIVE “NO PROJECT” CONDITION - LEVEL OF SERVICE SUMMARY ......................................... 34 TABLE 13 CUMULATIVE “WITH PROJECT” CONDITION - LEVEL OF SERVICE SUMMARY ..................................... 35 TABLE 14 LOS COMPARISON SUMMARY – A.M. PEAK ............................................................................................... 37 TABLE 15 LOS COMPARISON SUMMARY – P.M. PEAK ................................................................................................ 38
LIST OF FIGURES
FIGURE 1 PROJECT SITE LOCATION AND STUDY INTERSECTIONS ............................................................................. 2 FIGURE 2 ALTERNATIVE 1 PROJECT SITE PLAN................................................................................................................ 3 FIGURE 3 ALTERNATIVE 2 PROJECT SITE PLAN................................................................................................................ 5 FIGURE 4 EXISTING STUDY INTERSECTIONS AND TRAFFIC CONTROL .................................................................... 17 FIGURE 5 EXISTING CONDITIONS PEAK HOUR VOLUMES ......................................................................................... 18 FIGURE 6 FUTURE BASELINE CONDITION PEAK HOUR VOLUMES ............................................................................ 20 FIGURE 7 PROJECT TRIPS ................................................................................................................................................... 24 FIGURE 8 PROJECT CONDITION INTERSECTION TRAFFIC VOLUMES ....................................................................... 25 FIGURE 9 YEAR 2035 “NO PROJECT” CONDITION PEAK HOUR VOLUMES ......................................................... 33 FIGURE 10 CUMULATIVE WITH PROJECT CONDITION – INTERSECTION TRAFFIC VOLUMES .............................. 36
APPENDICES
Appendix A Bicycle Network
Appendix B Intersection Level of Service Results
Existing Condition
Future Baseline Condition
Project Condition
Cumulative “No Project” Condition
Cumulative “Plus Project” Condition
Hercules Intermodal Transit Center (HITC)
Page 1
Hercules Intermodal Transit Center (HITC) T R A F F I C I M P A C T A N A L Y S I S
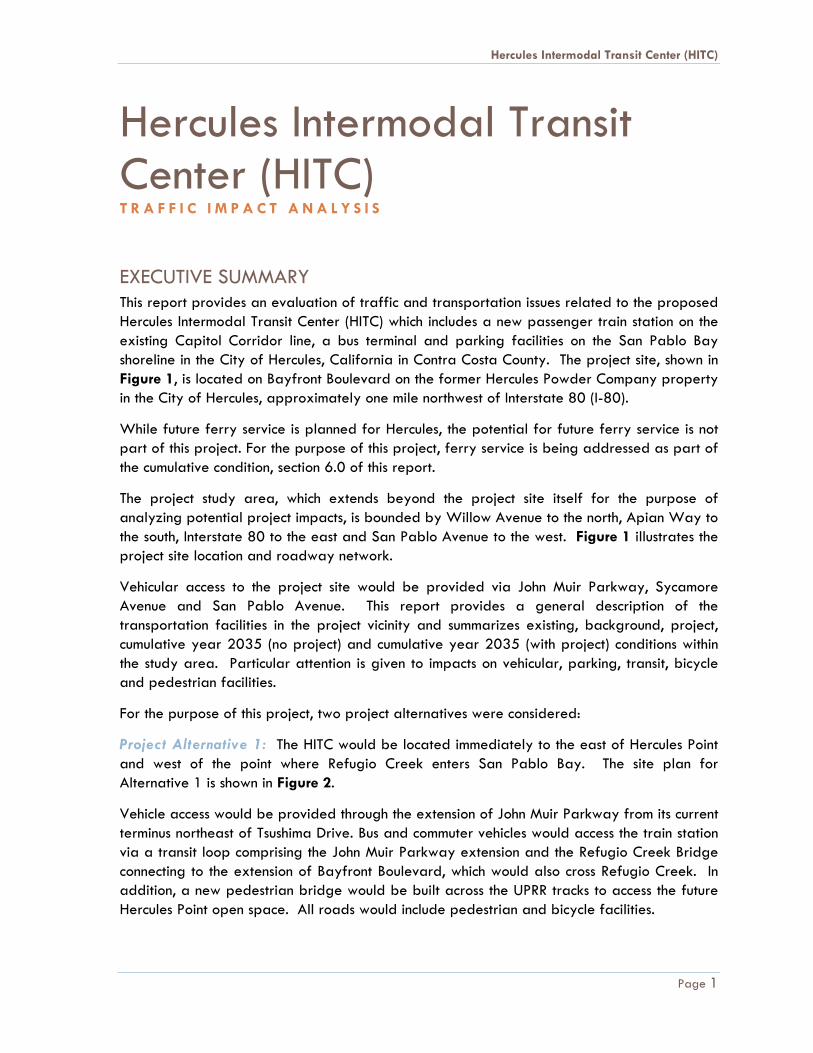
EXECUTIVE SUMMARY This report provides an evaluation of traffic and transportation issues related to the proposed Hercules Intermodal Transit Center (HITC) which includes a new passenger train station on the existing Capitol Corridor line, a bus terminal and parking facilities on the San Pablo Bay shoreline in the City of Hercules, California in Contra Costa County. The project site, shown in Figure 1, is located on Bayfront Boulevard on the former Hercules Powder Company property in the City of Hercules, approximately one mile northwest of Interstate 80 (I-80).
While future ferry service is planned for Hercules, the potential for future ferry service is not part of this project. For the purpose of this project, ferry service is being addressed as part of the cumulative condition, section 6.0 of this report.
The project study area, which extends beyond the project site itself for the purpose of analyzing potential project impacts, is bounded by Willow Avenue to the north, Apian Way to the south, Interstate 80 to the east and San Pablo Avenue to the west. Figure 1 illustrates the project site location and roadway network.
Vehicular access to the project site would be provided via John Muir Parkway, Sycamore Avenue and San Pablo Avenue. This report provides a general description of the transportation facilities in the project vicinity and summarizes existing, background, project, cumulative year 2035 (no project) and cumulative year 2035 (with project) conditions within the study area. Particular attention is given to impacts on vehicular, parking, transit, bicycle and pedestrian facilities.
For the purpose of this project, two project alternatives were considered:
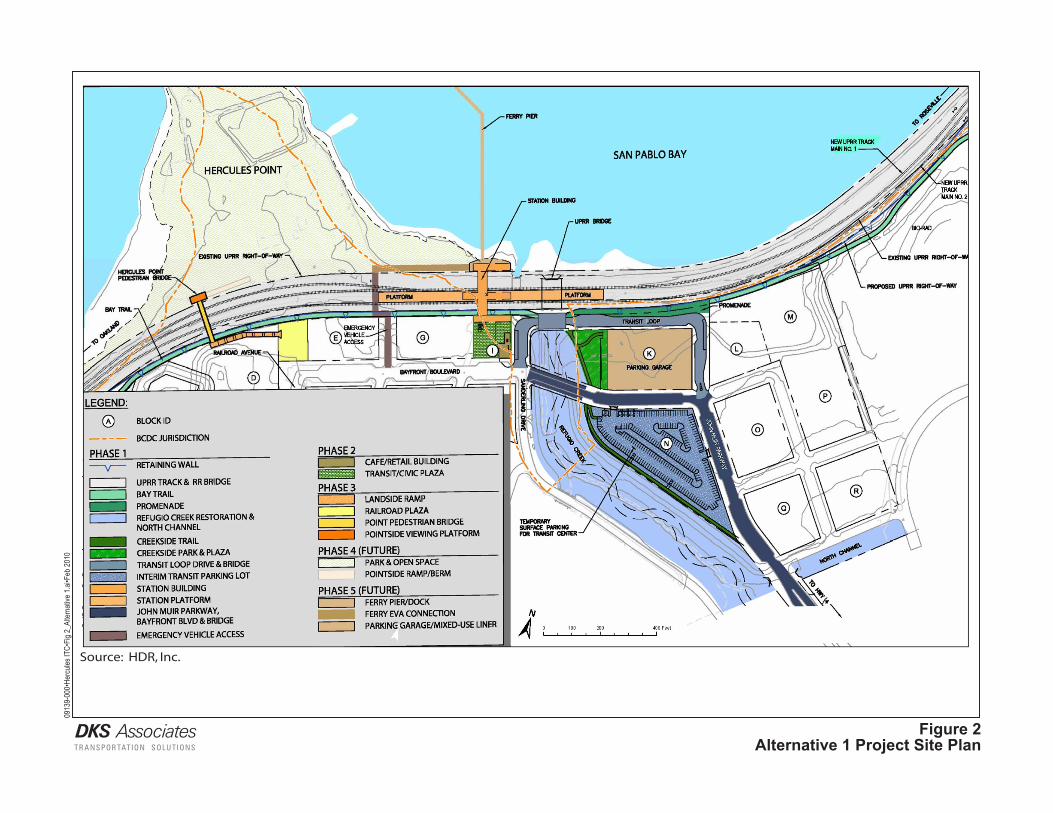
Project Alternative 1: The HITC would be located immediately to the east of Hercules Point and west of the point where Refugio Creek enters San Pablo Bay. The site plan for Alternative 1 is shown in Figure 2.
Vehicle access would be provided through the extension of John Muir Parkway from its current terminus northeast of Tsushima Drive. Bus and commuter vehicles would access the train station via a transit loop comprising the John Muir Parkway extension and the Refugio Creek Bridge connecting to the extension of Bayfront Boulevard, which would also cross Refugio Creek. In addition, a new pedestrian bridge would be built across the UPRR tracks to access the future Hercules Point open space. All roads would include pedestrian and bicycle facilities.

ProjectSite
Figure 1Site Location and Study Intersections
Existing RoadwayFuture RoadwayStudy Intersection
4
3
12
5
106
78
9
80
Muir
John
Uni
on P
acifi
c
S.F.R.R. &
Burlington Northern
Railro
ad A
ve.
San
Pab
lo A
ve.
Pauling
Linus Alfred Nobel
James
Pinole
Valley
Rd.
Bayberry
Willow
Ave.
Parker Ave.
Watson
Hercules
Ave.
SantaFe
Sycamore
Pkwy.
Ave.
San Pablo Ave.
Apia
n W
y.
Hercules City Limit
California St.
Sycamore Ave.
Partridge
Valley
Pheasant
Turquoise
Tennent Ave.
Hawth
orne
Dr.
San Pablo Bay
Hercules City Limit
Pinole City Limit
Rd.
Ave.
Sparrow
Redwood
LupineRefugio
Viewpointe
Canterbury
4
80
John Muir Pkwy. Ext.
0913
9-00
0•He
rcules
ITC•
Fig 1_
Hercu
les F
erry
Site
Loca
tion a
nd In
ts.ai•
Feb 2
010
T R A N S P O R TAT I O N S O LU T I O N S
DKS Associates
0913
9-00
0•He
rcules
ITC•
Fig 2_
Alter
nativ
e 1.ai
•Feb
2010
T R A N S P O R TAT I O N S O LU T I O N S
DKS Associates Figure 2Alternative 1 Project Site Plan
Source: Impact Sciences, April 2008
Source: HDR, Inc.
Hercules Intermodal Transit Center (HITC)
Page 4
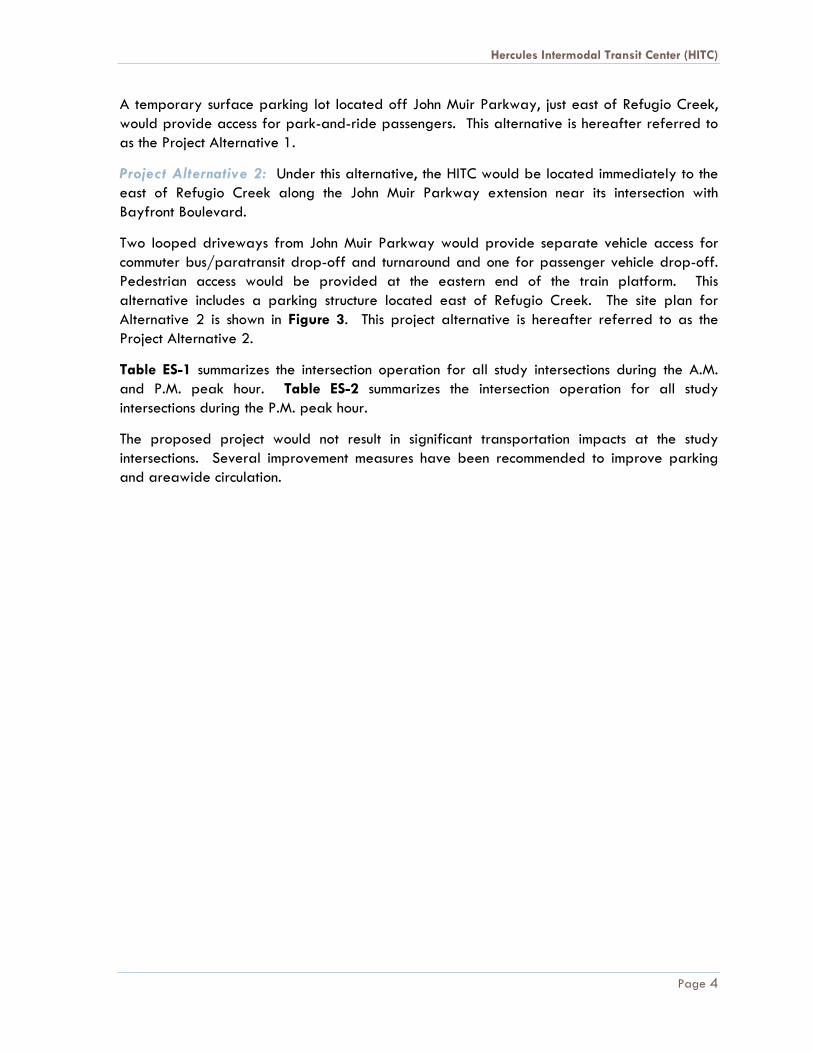
A temporary surface parking lot located off John Muir Parkway, just east of Refugio Creek, would provide access for park-and-ride passengers. This alternative is hereafter referred to as the Project Alternative 1.
Project Alternative 2: Under this alternative, the HITC would be located immediately to the east of Refugio Creek along the John Muir Parkway extension near its intersection with Bayfront Boulevard.
Two looped driveways from John Muir Parkway would provide separate vehicle access for commuter bus/paratransit drop-off and turnaround and one for passenger vehicle drop-off. Pedestrian access would be provided at the eastern end of the train platform. This alternative includes a parking structure located east of Refugio Creek. The site plan for Alternative 2 is shown in Figure 3. This project alternative is hereafter referred to as the Project Alternative 2.
Table ES-1 summarizes the intersection operation for all study intersections during the A.M. and P.M. peak hour. Table ES-2 summarizes the intersection operation for all study intersections during the P.M. peak hour.
The proposed project would not result in significant transportation impacts at the study intersections. Several improvement measures have been recommended to improve parking and areawide circulation.

0913
9-00
0•He
rcules
ITC•
Fig 3_
Alter
nativ
e 2.ai
•Feb
2010
T R A N S P O R T A T I O N S O L U T I O N S
D K S A s s o c i a t e s Figure 3Alternative 2 Project Site Plan
Source: HDR, Inc.

Hercules Intermodal Transit Center (HITC)
Page 6
TABLE ES 1 INTERSECTION LEVEL OF SERVICE SUMMARY – A.M. PEAK
Int # Intersection Name
Existing Background Project Cumulative 2035 “No Project”
Cumulative 2035 “With
Project” V/C LOS V/C LOS V/C LOS V/C LOS V/C LOS
1 Willow Ave /I-80 WB off-ramp
0.208 A 0.221 A 0.221 A 0.591 A 0.591 A
2 Willow Ave/Hawthorne Dr 0.284 A 0.301 A 0.301 A 0.781 C 0.781 C
3 San Pablo Ave/Willow Ave
0.244 A 0.218 A 0.22 A 0.806 D 0.807 D
4 San Pablo Ave/John Muir Pkwy 0.427 A 0.513 A 0.524 A 0.764 C 0.78 C
5 San Pablo Ave/Sycamore Ave
0.674 B 0.927 E 0.933 E 0.859 D 0.865 D
6 San Pablo Ave/Hercules Ave 0.507 A 0.598 A 0.598 A 0.758 C 0.758 C
7 San Pablo Ave/Pinole Valley Rd
0.378 A 0.48 A 0.48 A 0.889 D 0.889 D
8 San Pablo Ave/Tennent Ave 0.536 A 0.651 B 0.651 B 1.138 F 1.138 F
9 San Pablo Ave/Appian Wy
0.297 A 0.36 A 0.632 A 0.624 B 0.626 B
10 Sycamore Ave/Bayberry Ave 0.808 D 0.975 E 0.979 E 0.656 B 0.66 B
Notes: V/C: Volume to Capacity Ratio LOS: Level of Service
Intersections operating below acceptable LOS are bold.

Hercules Intermodal Transit Center (HITC)
Page 7
TABLE ES 2 INTERSECTION LEVEL OF SERVICE SUMMARY – P.M. PEAK
Int # Intersection Name
Existing Background Project Cumulative 2035 “No Project”
Cumulative 2035 “With
Project” V/C LOS V/C LOS V/C LOS V/C LOS V/C LOS
1 Willow Ave /I-80 WB off-ramp
0.280 A 0.308 A 0.308 A 0.938 E 0.938 E
2 Willow Ave/Hawthorne Dr
0.219 A 0.241 A 0.241 A 0.733 C 0.733 C
3 San Pablo Ave/Willow Ave
0.438 A 0.442 A 0.445 A 0.712 C 0.712 C
4 San Pablo Ave/John Muir Pkwy
0.594 A 0.706 C 0.720 C 1.239 F 1.253 F
5 San Pablo Ave/Sycamore Ave
0.616 B 0.830 D 0.833 D 1.103 F 1.110 F
6 San Pablo Ave/Hercules Ave
0.430 A 0.534 A 0.534 A 0.755 C 0.755 C
7 San Pablo Ave/Pinole Valley Rd
0.476 A 0.582 A 0.582 A 1.108 F 1.108 F
8 San Pablo Ave/Tennent Ave
0.559 A 0.709 C 0.709 C 1.259 F 1.259 F
9 San Pablo Ave/Appian Wy
0.565 A 0.683 B 0.683 B 1.366 F 1.366 F
10 Sycamore Ave/Bayberry Ave
0.865 D 1.098 F 1.098 F 0.762 C 0.762 C
Notes: V/C: Volume to Capacity Ratio LOS: Level of Service
Intersections operating below acceptable LOS are bold.
Hercules Intermodal Transit Center (HITC)
Page 8
1.0 INTRODUCTION This report provides an evaluation of traffic and transportation issues related to the proposed intermodal transit center, which includes a new passenger train station on the existing Capitol Corridor line, a bus terminal and parking facilities on the San Pablo Bay shoreline in the City of Hercules, California in Contra Costa County. The project site, shown in Figure 1, is located on Bayfront Boulevard on the former Hercules Powder Company property in the City of Hercules, approximately one mile northwest of Interstate 80 (I-80).
Note that a potential future ferry service is not part of this project. For the purpose of this project, ferry service is being addressed as part of the cumulative condition, section 6.0 of this report.
The project location, study intersections, and surrounding roadway network are illustrated in Figure 1. The alternative project site plans are shown in Figure 2 and Figure 3.
The transportation analysis represented in this study follows review and incorporation, where appropriate, of data provided by City of Hercules staff and the following transportation studies:
1. Hercules Bayfront Project EIR – Transportation and Circulation. Administrative Draft Report. Prepared for the City Hercules, by Fehr & Peers, December 11, 2009.
Consistent with prior studies in Hercules, the following 10 intersections were analyzed as part of the proposed ITC traffic impact analysis:
1. Willow Avenue/I-80 WB Ramp 2. Willow Avenue/Hawthorne Drive 3. San Pablo Avenue/Willow Avenue 4. San Pablo Avenue/John Muir Parkway 5. San Pablo Avenue/Sycamore Avenue 6. San Pablo Avenue/Hercules Avenue 7. San Pablo Avenue/Pinole Valley Road 8. San Pablo Avenue/Tennent Avenue 9. San Pablo Avenue/Appian Way 10. Sycamore Avenue/Bayberry Avenue
Operations of these intersections were analyzed during the weekday A.M. (7:00 A.M. – 9:00 A.M.) and weekday P.M. (4:00 P.M. – 6:00 P.M.) peak periods and evaluated for the following scenarios:
Scenario 1: Existing Condition: Level of Service based on existing peak hour volumes and existing intersection configurations.
Scenario 2: Future Baseline Condition: Existing peak-hour volumes plus growth from approved developments in the vicinity of the project. Approved developments may or may not be constructed as of this study but were approved or built after the existing

Hercules Intermodal Transit Center (HITC)
Page 9
scenario traffic counts were taken and would be completed prior to the proposed project.
Scenario 3: Project Condition: Future Baseline Scenario plus the project-generated traffic estimated for the proposed intermodal transit center.
Scenario 4: Cumulative “No Project” Condition: Level of service based on forecasted growth estimated by year 2035.
Scenario 5: Cumulative with Project Condition: Level of service based on Cumulative Year 2035 Baseline No Project volumes plus traffic generated by the proposed project.
In addition to intersection analysis, an evaluation of the site plan, on-site circulation, transit service, access and egress points, proposed parking supply and expected demand is contained in this report.
The following section presents an analysis of the existing conditions of various transportation system components. The components include roadways, intersections, transit service, bicycles, pedestrians, and parking.

Hercules Intermodal Transit Center (HITC)
Page 10
2.0 EXISTING TRANSPORTATION SYSTEM This section summarizes the existing conditions in the study area including a description of the roadway network, vehicular traffic conditions, and operational characteristics within the project vicinity.
Roadway Network
Regional access is provided by Interstate 80 and California State Route 4. Local access is provided by primarily by San Pablo Avenue, John Muir Parkway, and Sycamore Avenue along with other connecting roadways. These roadways are described below and are illustrated in Figure 1.
2.1 Regional Access
Interstate 80 is a six- to eight-lane freeway that travels in a northeast-southwest direction through the City of Hercules. Located just east of the project site, Interstate 80 connects to California State Route 4 to the north, and serves as the main artery to Oakland and San Francisco to the south (west). HOV lanes are provided in both directions south of SR-4, and are under construction from SR-4 to the Carquinez Bridge. Local access is provided off of Willow Avenue and Sycamore Avenue. In the vicinity of the project, the peak hour traffic volume is approximately 12,200 vehicles per hour and the average annual daily traffic (AADT) is 182,000 vehicles per day (Caltrans, 2008).
California State Route 4 is a 4-lane expressway east of I-80 that travels in an east-west direction. West of Interstate 80, the expressway terminates and becomes John Muir Parkway just northeast of the project site. Local access is provided off of John Muir Parkway. In the vicinity of the project, the peak hour traffic volume is approximately 3,300 vehicles per hour and the average annual daily traffic Is 37,000 vehicles per day (Caltrans, 20081).
2.2 Local Access
San Pablo Avenue. San Pablo Avenue extends through the City of Hercules in a north-south direction, running parallel to I-80 throughout western Contra Costa County and Alameda County. San Pablo Avenue serves as a reliever route to I-80, which is one of the most congested roadways in the Bay Area. Within the City of Hercules, San Pablo Avenue is a four lane arterial, with separate left turn lanes at major intersections. The posted speed limit is 45 miles per hour (mph).
John Muir Parkway. John Muir Parkway is a four-lane extension of the SR-4 terminus, located west of I-80. John Muir Parkway serves as a local roadway between the North Shore Business Park and San Pablo Avenue. East of San Pablo Avenue, access is provided to I-80 eastbound and westbound, and to SR-4 eastbound. John Muir Parkway has recently been extended west to the Hercules Intermodal Transit Center property line and a new bridge has
1 Traffic volumes are for the freeway segment east of the Pinole Valley interchange and west of the State Route 4 interchange. http://traffic‐counts.dot.ca.gov/2008all/r071‐80i.htm

Hercules Intermodal Transit Center (HITC)
Page 11
been constructed from John Muir Parkway to Tsushima Drive. SR-4 is commonly known as John Muir Parkway from the City of Hercules to the City of Martinez. John Muir Parkway has a posted speed limit of 35 mph.
Sycamore Avenue. This arterial generally runs east-west between San Pablo Avenue and SR-4. West of San Pablo Avenue, Sycamore Avenue is a two lane collector with a posted speed limit of 25 mph. Exclusive left turn lanes are provided at major intersections, and on-street parking is provided west of San Pablo Avenue. Sycamore Avenue has most of the retail/commercial activity in the City along its frontage.
Willow/Bayberry Avenue. Willow/Bayberry Avenue is a two-lane collector roadway primarily serving I-80 eastbound off-ramp traffic destined for Hercules. Willow Avenue runs east-west and currently extends between Sycamore Avenue and Palm Avenue. Vehicles exiting I-80 turn right onto Willow Avenue westbound to the Sycamore Avenue intersection. On-street parking is prohibited along the entire length of Willow Avenue. Willow Avenue is a four-lane arterial street that begins at San Pablo Avenue and ends at Sycamore Avenue. Willow Avenue provides access to I-80. It has a posted speed limit of 35 mph.
Hercules Avenue. Hercules Avenue is a two-lane local street serving primarily residential areas in the City of Hercules. In the vicinity of the project, Hercules Avenue connects Railroad Avenue to San Pablo Avenue.
Railroad Avenue. Railroad Avenue is a two-lane local street connecting Santa Fe and Bayfront Boulevard. This street currently fronts the proposed project site and is the western border of the existing housing development.
Santa Fe. Santa Fe is a two-lane local street serving residential areas that are in the vicinity of the project. This street connects Railroad Avenue to Hercules Avenue.
2.3 Transit Service2
The Western Contra Costa Transit Authority (WestCAT) has jurisdiction over public transit in Western Contra Costa County, including the City of Hercules. Currently, no service is provided to the waterfront area where the intermodal transit center is proposed to be located. However, most WestCAT bus routes operate out of the Hercules Transit Center which is located about one mile away at the junction of Interstate 80 and California State Route 4. Approximately 13 local, express, regional, and transbay routes are operated out of the.
Transbay Service. The Lynx is a new commuter bus route that serves the Transbay Terminal in San Francisco directly from the Hercules Transit Center. The Lynx also provides service to the Victoria by the Bay neighborhood near Rodeo. Weekday only service is provided at 15- to 30-minute headways from Hercules to San Francisco between 5:00 A.M. to 8:20 A.M. and from San Francisco to Hercules between 5:55 A.M. to 9:15 A.M. In the P.M., service is
2 Transit service schedule and maps based on timetables effective August 3, 2009. www.westcat.org/schedules/index.html

Hercules Intermodal Transit Center (HITC)
Page 12
provided from Hercules to San Francisco3 between 3:30 to 6:50 P.M. and from San Francisco to Hercules between 3:30 P.M. and 7:45 P.M.
Regional Service. The Martinez Link 30Z is a regional bus route that provides service to the Amtrak station and VA Hospital in Martinez, and the El Cerrito del Norte BART station via the Hercules Transit Center. Only weekday service is provided at 30 to 40-minute headways during commute times and 1-hour headways at all other times between 6:24 A.M. and 6:41 P.M.
Line C: Contra Costa College shuttle provides weekday only service is provided at 60-minute headways during commute times and 80-minute headways at all other times between 7:25 A.M. and 7:48 P.M. in the westbound direction and from 7:56 A.M. to 8:21 P.M. in the eastbound direction.
Express Service. WestCAT operates express service between the Hercules Transit Center and the Richmond BART Station and El Cerrito del Norte BART station, respectively.
Route JR/JL provides weekday service at 15- to 30-minute headways from 4:46 A.M. to 11:17 P.M. in the southbound direction. Weekend service is provided at 40-minute headways from 6:03 A.M. to 9:58 P.M. on Saturdays, and from 7:24 A.m. to 6:44 P.M. on Sundays.
In the northbound direction, weekday service is provided starting at 4:39 A.M. (from San Pablo/Oakridge) and continuing from the BART Del Norte Station at 5:17 A.M. until 12:05 A.M. Weekend service is provided at 40-minute headways from 6:40A.M. to 10:40 P.M. on Saturdays, and from 8:03 A.M. to 7:21 P.M. on Sundays.
JR travels via Richmond Parkway and Blume Drive and JL travels via Lakeside Drive.
Transfers to and from BART trains are coordinated with the schedule.
Route JX/JPX provides weekday service at 15- to 60-minute headways from 5:47 A.M. to 7:50 P.M. in the northbound direction. In the northbound direction, weekday service is provided from 5:24 A.M. to 7:41 P.M.
Local Service. Local service throughout the City of Hercules is provided from the Hercules Transit Center via eight bus routes. Destinations include the Hilltop Mall Shopping Center, the Richmond Parkway Transit Center, east Hercules, Rodeo, and Crockett. All routes run on weekdays only with the exception of Route 11 to Crockett/Rodeo (weekdays and Saturday) and Route 19 to Hilltop Mall (Saturday only).
3 Service begins at the Bio Rad Stop at 3:30 p.m. and 4:00 p.m., continues at 4:05 p.m. from Willow.

Hercules Intermodal Transit Center (HITC)
Page 13
2.4 Bicycle Network and Pedestrian Facilities
The existing bicycle system4 consists of three classifications of bicycle facilities:
Class I facilities (bike path) – are completely separated, with paved right of way (shared with pedestrians) which excludes general motor vehicle traffic.
Class II facilities (bike lane) – provides a striped and stenciled lane for one-way bike travel on a street or highway.
Class III facilities (bike route) – a shared use roadway with motor vehicle traffic and is only identified by signage.
In the vicinity of the project location, bicycle lanes are provided along San Pablo Avenue in Hercules. The proposed 2009 Countywide Bicycle and Pedestrian Plan5 includes existing and planned bikeways with the City of Hercules, including Class I facilities along San Pablo Avenue and John Muir Parkway. Appendix A includes the bikeway network for the City of Hercules.
The pedestrian network consist of sidewalks, crosswalks and curb ramps provided throughout the residential neighborhood surrounding the proposed site, and pedestrian push button signals are provided at the signalized intersections along San Pablo Avenue.
The Shoreline Trail runs adjacent to the railroad track near the project site.
2.5 Intersection Level of Service Methodology
To evaluate the existing traffic conditions the Level of Service (LOS) was evaluated at critical intersections using the Contra Costa Transportation Authority Level of Service Methodology (CCTALOS).
The Contra Costa Transportation Authority has adopted the Critical Lane Volume Planning Method described in Transportation Research Circular 212 to evaluate intersection levels of service (Transportation Research Board, 1980). The County has updated Circular 212 procedures to increase intersection capacity to 1,800 vehicles per hour from 1,500 vehicles per hour to account for local driving conditions (Contra Costa Transportation Authority, 1992a). Intersection levels of service using the critical lane concept are based on the volume of conflicting traffic (generally through movements versus opposing left turns) at the intersection during the peak hour of travel demand.
4 Based on the 2003 Countywide Bike and Pedestrian Plan. www.ccta.net/EN/main/bike/countywide.html 5 2009 Contra Costa Countywide Bicycle and Pedestrian Plan. Proposal for Adoption. September 17, 2009. http://www.ccta.net/assets/documents/Bike~and~Ped/CBPP%20%20l%20%20Admin%20final_08‐26‐09.pdf

Hercules Intermodal Transit Center (HITC)
Page 14
2.6 Level of Service Definition
Level of service (LOS) is a common measure of traffic operations using letters A through F to indicate the amount of congestion and delay. LOS A is free flow conditions, LOS D is typically considered acceptable for peak hour traffic periods in urban areas, LOS E is near or at capacity, and LOS F represents congested conditions above capacity.
The correlation between volume-to-capacity (v/c) ratios for signalized intersections is contained in Table 1.
TABLE 1 SIGNALIZED INTERSECTION LEVEL-OF-SERVICE THRESHOLDS
Level of Service (LOS)
Typical Operating Conditions Volume to Capacity
(V/C) Ratio
A
Describes a condition where the approach to an intersection appears quite open and turning movements are made easily. Little or no delay is experienced. No vehicles wait longer than one red traffic signal indication. The traffic operation can generally be described as excellent.
0.00-0.60
B
Describes a condition where the approach to an intersection is occasionally fully utilized and some delays may be encountered. Many drivers begin to feel somewhat restricted within groups of vehicles. The traffic operation can generally be described as very good.
0.61-0.70
C
Describes a condition where the approach to an intersection is often fully utilized and back-ups may occur behind turning vehicles. Most drivers feel somewhat restricted, but not objectionably so. The driver occasionally may have to wait more than one red traffic signal indication. The traffic operation can generally be described as good.
0.71-0.80
D
Describes a condition of increasing restriction causing substantial delays and queues of vehicles on approaches to the intersection during short times within the peak period. However, there are enough signal cycles with lower demand such that queues are periodically cleared, thus preventing excessive back-ups. The traffic operation can generally be described as fair.
0.81-0.90
E
Capacity occurs at Level of Service E. It represents the most vehicles that any particular intersection can accommodate. At capacity there may be long queues of vehicles waiting upstream of the intersection and vehicles may be delayed up to several signal cycles. The traffic operation can generally be described as poor.
0.91-1.00
F
Level of Service F represents a jammed condition. Back-ups from locations downstream or on the cross street may restrict or prevent movement of vehicles out of the approach under consideration. Hence, volumes of vehicles passing through the intersection vary from signal cycle to signal cycle. Because of the jammed condition, this volume would be less than capacity.
1.01+
Source: Transportation Research Board, Circular 212, 1980.

Hercules Intermodal Transit Center (HITC)
Page 15
2.7 Significance Criteria
In the City of Hercules, LOS D or better (LOS A, B, C or D) is the citywide standard for traffic operating conditions during peak hours on arterial streets and at signalized intersections. LOS D is the target service level most frequently adopted by jurisdictions in urban areas. However, the City has adopted LOS E as the target service level for signalized intersections on San Pablo Avenue.
The City of Hercules defines a traffic impact as significant if the addition of the project traffic causes an intersection operating at an acceptable LOS to operate at a lower LOS.

Hercules Intermodal Transit Center (HITC)
Page 16
3.0 EXISTING CONDITION Intersection turning movement counts for the A.M. and P.M. peak hours were provided by City of Hercules staff.
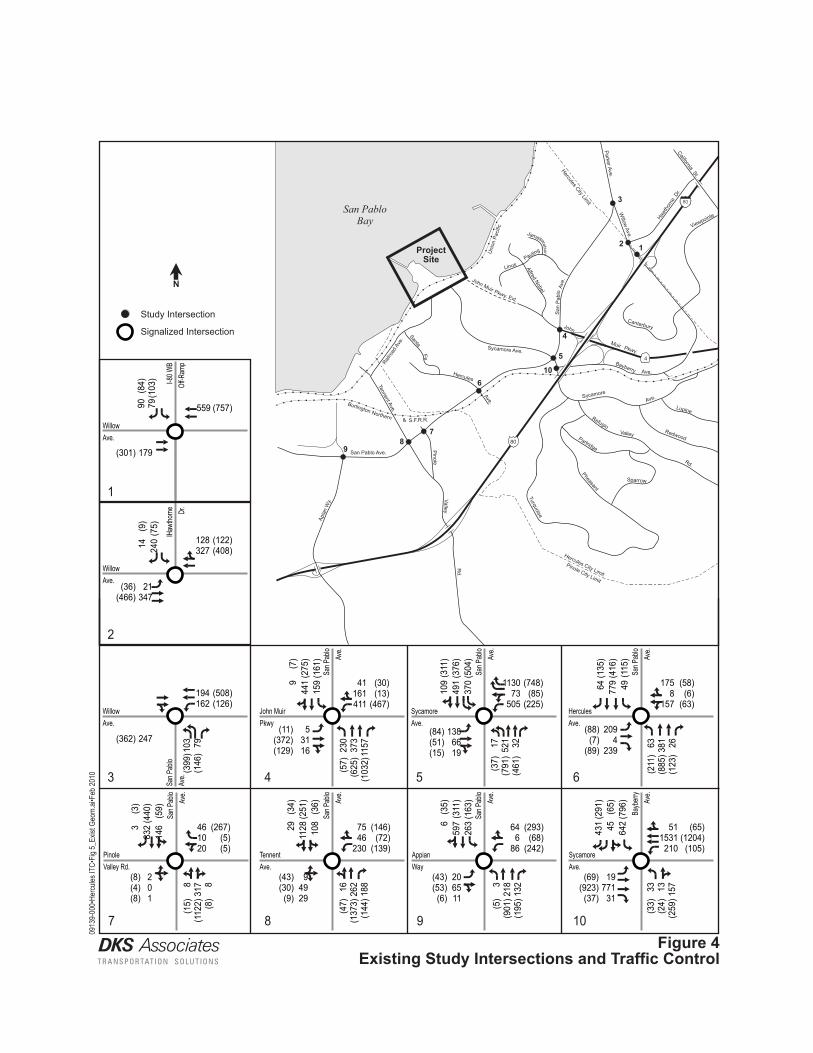
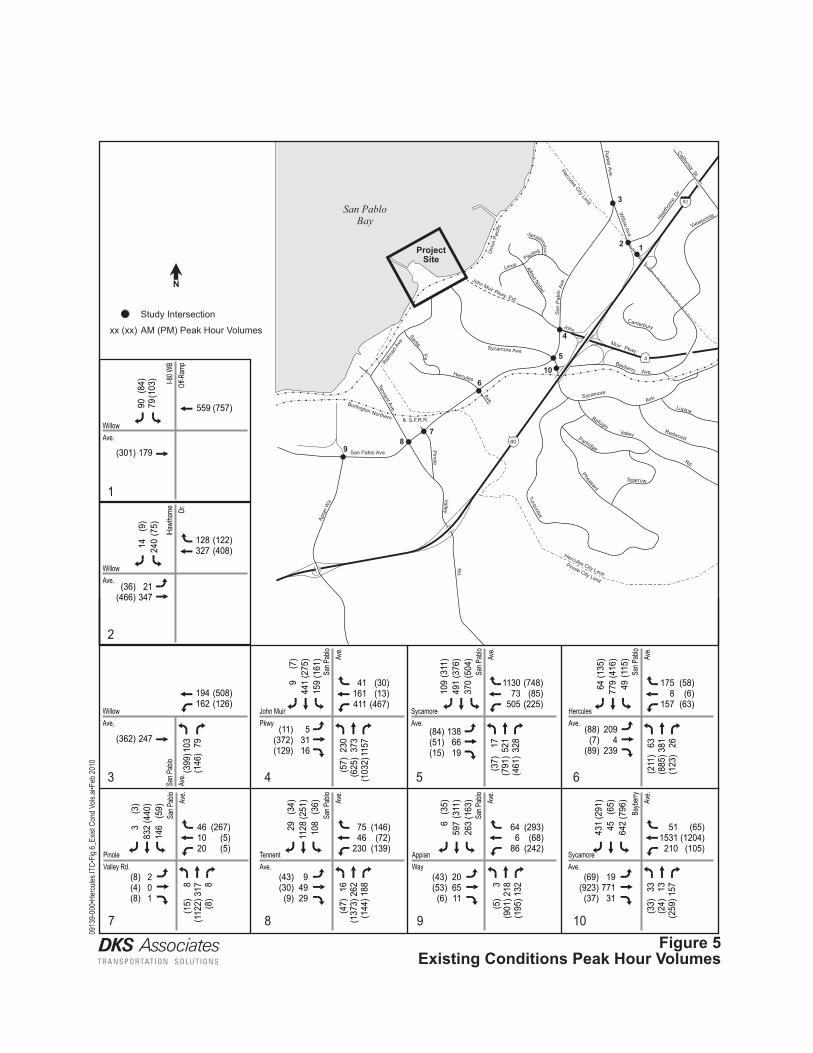
Figure 4 illustrates the current lane geometry and traffic control at each of the study area intersections. Figure 5 illustrates the existing traffic volumes at each of the study intersections. The intersections and their corresponding existing levels of service are presented in Table 2. Appendix B includes the detailed level of service analysis sheets, including the weekday A.M. and P.M. peak hours.
TABLE 2 EXISTING CONDITION LEVEL OF SERVICE SUMMARY
Int # Intersection Name A.M. PEAK P.M. PEAK
V/C LOS V/C LOS
1. Willow Avenue /I-80 WB off-ramp 0.208 A 0.280 A
2. Willow Avenue/Hawthorne Drive 0.284 A 0.219 A
3. San Pablo Avenue/Willow Avenue 0.244 A 0.438 A
4. San Pablo Avenue/John Muir Parkway 0.427 A 0.594 A
5. San Pablo Avenue/Sycamore Avenue 0.674 B 0.616 B
6. San Pablo Avenue/Hercules Avenue 0.507 A 0.430 A
7. San Pablo Avenue/Pinole Valley Road 0.378 A 0.476 A
8. San Pablo Avenue/Tennent Avenue 0.536 A 0.559 A
9. San Pablo Avenue/Appian Way 0.297 A 0.565 A
10. Sycamore Avenue/Bayberry Avenue 0.808 D 0.865 D
Notes: V/C: Volume to Capacity Ratio LOS: Level of Service
3.1 Intersection Operation
According to the City of Hercules intersection level of service standards, all study intersections operate at acceptable levels of service for the existing conditions. Although several intersections operate at LOS A, there are times when queues lead to delays at intersections. These delays are not reflected in an analysis based on the CCTA LOS methodology.
9
AppianWay
SycamoreAve.
10
65
SycamoreAve.
HerculesAve.
7
San P
ablo
Ave.
San P
ablo
Ave.
San P
ablo
Ave.
Bayb
erry
Ave.
Pinole Valley Rd.
8
TennentAve.
4
San P
ablo
Ave.
San P
ablo
Ave.
San P
ablo
Ave.
John MuirPkwy
3 San P
ablo
Ave.
WillowAve.
2
IHaw
thorne Dr
.
WillowAve.
1
I-80 W
BOf
f-Ram
p
WillowAve.
4
3
12
5
106
78
9
80
Muir
John
Uni
on P
acifi
c
S.F.R.R. &
Burlington Northern
Railro
ad A
ve.
San
Pab
lo A
ve.
Pauling
Linus Alfred Nobel
James
Pinole
Valley
Rd.
Bayberry
Willow
Ave.
Parker Ave.
Watson
Hercules
Ave.
SantaFe
Sycamore
Pkwy.
Ave.
San Pablo Ave.
Apia
n W
y.
Hercules City Limit
California St.
Sycamore Ave.
Partridge
Valley
Pheasant
Turquoise
Tennent Ave.
Hawth
orne
Dr.
San Pablo Bay
Hercules City Limit
Pinole City Limit
Rd.
Ave.
Sparrow
Redwood
LupineRefugio
Viewpointe
Canterbury
4
80
John Muir Pkwy. Ext.
N
Figure 4Existing Study Intersections and Traffic Control
0913
9-00
0•He
rcules
ITC•
Fig 5_
Exist
Geo
m.ai•
Feb 2
010
T R A N S P O R TAT I O N S O LU T I O N S
DKS Associates
(301)
(757)
179
(36)(466)
(122)(408)
21347
(11)(372)(129)
53116
128327
(30)(13)
(467)
41161411
(362)
(508)(126)
247
194162
(399
)(1
46)10
3 79
(57)
(625
)(1
032)
230
373
1157
559
(84)
(103
)90 79
(9)
(75)
14 240
(7)
(275
)(1
61)
944
115
9
(88)(7)
(89)
2094
239
(58)(6)
(63)
1758
157
(211
)(8
85)
(123
)
63 381 26
(135
)(4
16)
(115
)
64 779 49
(8)(4)(8)
201
(267)(5)(5)
461020
(15)
(112
2) (8)
831
7 8
(3)
(440
)(5
9)
383
214
6
(43)(30)(9)
94929
(146)(72)
(139)
7546
230
(47)
(137
3)(1
44)
16 262
188
(34)
(251
)(3
6)
2911
28 108
(43)(53)(6)
206511
(293)(68)
(242)
646
86
(5)
(901
)(1
95)
321
813
2
(35)
(311
)(1
63)
659
726
3
(69)(923)(37)
1977131
(65)(1204)(105)
511531210
(33)
(24)
(259
)
33 13 157
(291
)(6
5)(7
96)
431 45 642
(84)(51)(15)
1386619
(748)(85)
(225)
113073
505
(37)
(791
)(4
61)
17 521 32
(311
)(3
76)
(504
)
109
491
370
ProjectSite
Study Intersection
Signalized Intersection
9
AppianWay
10
SycamoreAve.
65
SycamoreAve.
HerculesAve.
7
San P
ablo
Ave.
San P
ablo
Ave.
San P
ablo
Ave.
Bayb
erry
Ave.
Pinole Valley Rd.
8
TennentAve.
4
San P
ablo
Ave.
San P
ablo
Ave.
San P
ablo
Ave.
John MuirPkwy
3 San P
ablo
Ave.
WillowAve.
2
IHaw
thorne Dr
.
WillowAve.
1
I-80 W
BOf
f-Ram
p
WillowAve.
4
3
12
5
106
78
9
80
Muir
John
Uni
on P
acifi
c
S.F.R.R. &
Burlington Northern
Railro
ad A
ve.
San
Pab
lo A
ve.
Pauling
Linus Alfred Nobel
James
Pinole
Valley
Rd.
Bayberry
Willow
Ave.
Parker Ave.
Watson
Hercules
Ave.
SantaFe
Sycamore
Pkwy.
Ave.
San Pablo Ave.
Apia
n W
y.
Hercules City Limit
California St.
Sycamore Ave.
Partridge
Valley
Pheasant
Turquoise
Tennent Ave.
Hawth
orne
Dr.
San Pablo Bay
Hercules City Limit
Pinole City Limit
Rd.
Ave.
Sparrow
Redwood
LupineRefugio
Viewpointe
Canterbury
4
80
John Muir Pkwy. Ext.
N
Figure 5Existing Conditions Peak Hour Volumes
0913
9-00
0•He
rcules
ITC•
Fig 6_
Exist
Con
d Vols
.ai•F
eb 20
10
T R A N S P O R TAT I O N S O LU T I O N S
DKS Associates
(301)
(757)
179
(36)(466)
(122)(408)
21347
(11)(372)(129)
53116
128327
(30)(13)
(467)
41161411
(362)
(508)(126)
247
194162
(399
)(1
46)10
3 79
(57)
(625
)(1
032)
230
373
1157
559
(84)
(103
)90 79
(9)
(75)
14 240
(7)
(275
)(1
61)
944
115
9
(88)(7)
(89)
2094
239
(58)(6)
(63)
1758
157
(211
)(8
85)
(123
)
63 381 26
(135
)(4
16)
(115
)
64 779 49
(8)(4)(8)
201
(267)(5)(5)
461020
(15)
(112
2) (8)
831
7 8
(3)
(440
)(5
9)
383
214
6
(43)(30)(9)
94929
(146)(72)
(139)
7546
230
(47)
(137
3)(1
44)
16 262
188
(34)
(251
)(3
6)
2911
28 108
(43)(53)(6)
206511
(293)(68)
(242)
646
86
(5)
(901
)(1
95)
321
813
2
(35)
(311
)(1
63)
659
726
3
(69)(923)(37)
1977131
(65)(1204)(105)
511531210
(33)
(24)
(259
)
33 13 157
(291
)(6
5)(7
96)
431 45 642
(84)(51)(15)
1386619
(748)(85)
(225)
113073
505
(37)
(791
)(4
61)
17 521
328
(311
)(3
76)
(504
)
109
491
370
ProjectSite
Study Intersection
AM (PM) Peak Hour Volumesxx (xx)

Hercules Intermodal Transit Center (HITC)
Page 19
4.0 FUTURE BASELINE CONDITION This section discusses the traffic operating conditions at the study intersections under the future baseline scenario. The future baseline scenario includes the traffic expected to be generated by projects approved by the City of Hercules prior to the completion of the proposed project as well as those already built and occupied after the existing condition traffic counts were completed.
To obtain the intersection turning movement volumes for the future baseline scenario, forecast results from the Contra Costa County Transportation Authority’s (CCTA) countywide travel demand model were analyzed. By virtue of the model forecast results, the growth factors for the intersection approaches on San Pablo Avenue and Sycamore Avenue were different from all other approaches and these are summarized in Table 3. Using these growth factors, the intersection turning movement volumes were factored up to year 2010 levels as illustrated in the following equation:
Future baseline scenario turning movement volumes = existing turning movement counts * (2010 model year link demand / 2006 interpolated model year link demand)
TABLE 3 FUTURE BASELINE CONDITION LINK DEMAND GROWTH FACTORS
Street 2006-2010 Annual Growth 2006-2010 P.M. Annual Growth
San Pablo Avenue 6.4% 6.4%
Sycamore Avenue 9.2% 9.2%
Other Streets 1.5% 2.4%
Figure 6 illustrates the future baseline scenario peak hour volumes. Intersection operational levels of service along with their associated delays and volume-to-capacity ratios are summarized in Table 4.

9
San P
ablo
Ave.
AppianWay
10
SycamoreAve.
65
SycamoreAve. Ext.
HerculesAve.
7
San P
ablo
Ave.
San P
ablo
Ave.
Bayb
erry
Ave.
Pinole Valley Rd.
8
TennentAve.
4
San P
ablo
Ave.
San P
ablo
Ave.
San P
ablo
Ave.
John MuirPkwy
3 San P
ablo
Ave.
WillowAve.
2
IHaw
thorne Dr
.
WillowAve.
1
I-80 W
BOf
f-Ram
p
WillowAve.
(331) 190
(92)
(113
)95 84
4
3
12
5
106
78
9
80
Muir
John
Uni
on P
acifi
c
S.F.R.R. &
Burlington Northern
Railro
ad A
ve.
San
Pab
lo A
ve.
Pauling
Linus Alfred Nobel
James
Pinole
Valley
Rd.
Bayberry
Willow
Ave.
Parker Ave.
Watson
Hercules
Ave.
SantaFe
Sycamore
Pkwy.
Ave.
San Pablo Ave.
Apia
n W
y.
Hercules City Limit
California St.
Sycamore Ave.
Partridge
Valley
Pheasant
Turquoise
Tennent Ave.
Hawth
orne
Dr.
San Pablo Bay
Hercules City Limit
Pinole City Limit
Rd.
Ave.
Sparrow
Redwood
LupineRefugio
Viewpointe
Canterbury
4
80
John Muir Pkwy. Ext.
N
Figure 6Future Baseline Conditions Peak Hour Volumes
0913
9-00
0•He
rcules
ITC•
Fig 7_
Futur
e Bas
e Vols
.ai•F
eb 20
10
T R A N S P O R TAT I O N S O LU T I O N S
DKS Associates
(40)(513)
(134)(449)
22368
136347
(398)
(559)(139)
262
206172
(511
)(1
87)13
210
1
(10)
(83)
15 254
(9)(4)(9)
201
(294)(6)(6)
491121
(19)
(143
6)(1
4)
10 406 10
(4)
(563
)(7
6)
410
65 187
(47)(33)(10)
105231
(161)(79)
(153)
8049
244
(60)
(175
7)(1
84)
20 335
241
(44)
(321
)(4
6)
3714
44 138
(47)(58)(7)
216912
(322)(75)
(266)
686
91
(6)
(115
3)(2
50)
427
916
9
(45)
(398
)(2
09)
676
433
7
(76)(1015)
(41)
2081733
(72)(1324)
(116)
541623223
(47)
(34)
(368
)
47 18 223
(413
)(9
2)(1
130)
612 64 912
(12)(409)(142)
53317
(33)(14)
(514)
43171436
(73)
(800
)(1
321)
294
477
1481
(9)
(352
)(2
06)
12 564
204
(97)(8)
(98)
2224
253
(64)(7)
(69)
1868
166
(270
)(1
133)
(157
)
81 488 33
(173
)(5
32)
(147
)
82 997 63
(119)(72)(21)
1969427
(1062)(121)(320)
1605104717
(47)
(101
2)(5
90)
22 667
420
(398
)(4
81)
(645
)
140
628
474
(833)593
ProjectSite
Study Intersection
AM (PM) Peak Hour Volumesxx (xx)

Hercules Intermodal Transit Center (HITC)
Page 21
TABLE 4 FUTURE BASELINE CONDITION - LEVEL OF SERVICE SUMMARY
Int # Intersection Name A.M. PEAK P.M. PEAK
V/C LOS V/C LOS
1. Willow Avenue /I-80 WB off-ramp 0.221 A 0.308 A
2. Willow Avenue/Hawthorne Drive 0.301 A 0.241 A
3. San Pablo Avenue/Willow Avenue 0.218 A 0.442 A
4. San Pablo Avenue/John Muir Parkway 0.513 A 0.706 C
5. San Pablo Avenue/Sycamore Avenue 0.927 E 0.830 D
6. San Pablo Avenue/Hercules Avenue 0.598 A 0.534 A
7. San Pablo Avenue/Pinole Valley Road 0.480 A 0.582 A
8. San Pablo Avenue/Tennent Avenue 0.651 B 0.709 C
9. San Pablo Avenue/Appian Way 0.360 A 0.683 B
10. Sycamore Avenue/Bayberry Avenue 0.975 E 1.098 F
Notes: V/C: Volume to Capacity Ratio LOS: Level of Service
Intersections operating below acceptable LOS are bold.
4.1 Intersection Analysis
All study intersections would continue to operate at acceptable levels of service under the future baseline scenario with one exception:
Sycamore Avenue/Bayberry Avenue
The Sycamore Avenue/Bayberry Avenue intersection would operate at LOS E during the A.M. peak hour and LOS F during the P.M. peak hour.
Appendix B includes the detailed level of service analysis sheets, including the weekday A.M. and P.M. peak hours.

Hercules Intermodal Transit Center (HITC)
Page 22
5.0 PROJECT SCENARIO As part of this analysis, DKS reviewed rail and bus ridership forecasts projections prepared by Fehr & Peers6 for the Hercules Intermodal Transit Center. These projections were assumed to take into account buildout of the Hercules Intermodal Transit Center, corresponding to year 2035. For the purpose of this analysis, ridership projections for the ferry terminal were not taken into account, as the ITC project consist only of rail and bus services.
5.1 Trip Generation and Mode of Access
Based on the projections prepared by Fehr & Peers, the daily rail ridership would produce 837 daily trips, with 232 A.M. peak period and 292 P.M. peak period daily boardings.
The mode of access table, as shown in Table 5, details how rail passengers are forecasted to access the intermodal transit center during the A.M. peak period. Note that the mode of access data is representative of the A.M. peak period (not peak hour) as it is the critical peak period in terms of peak parking demand. Assuming the percent splits for each mode and the estimated number of P.M. peak period boardings, DKS generated P.M. peak boardings for each mode. Table 5 list the number of rail boardings by mode access.
TABLE 5 RAIL BOARDINGS BY MODE OF ACCESS
Mode % Boardings # of Boardings Peak Period
A.M. 1 P.M.
Drive Alone 38.6% 90 113
Dropped Off/Picked Up 23.1% 54 67
Walk 16.5% 38 48
Bike 11.5% 27 34
Transit 2.45 6 7
Carpool2 7.9% 18 23
Total 100% 232 292
Source: Fehr & Peers, November 2009.
Notes: 1. # of boardings for the A.M. peak period were derived from the Fehr & Peers Memorandum.
December 2009. 2. Assumes a 2.5 occupancy per vehicle.
From the mode of access table, the peak period automobile trip generation, including park and ride, and kiss-and-ride trips, can be forecasted and distributed onto the local roadway
6 Hercules Transit Center Rail and Ferry Ridership and Parking Forecasts Memorandum. December 9, 2009. Fehr & Peers Transportation Consultants.
Hercules Intermodal Transit Center (HITC)
Page 23
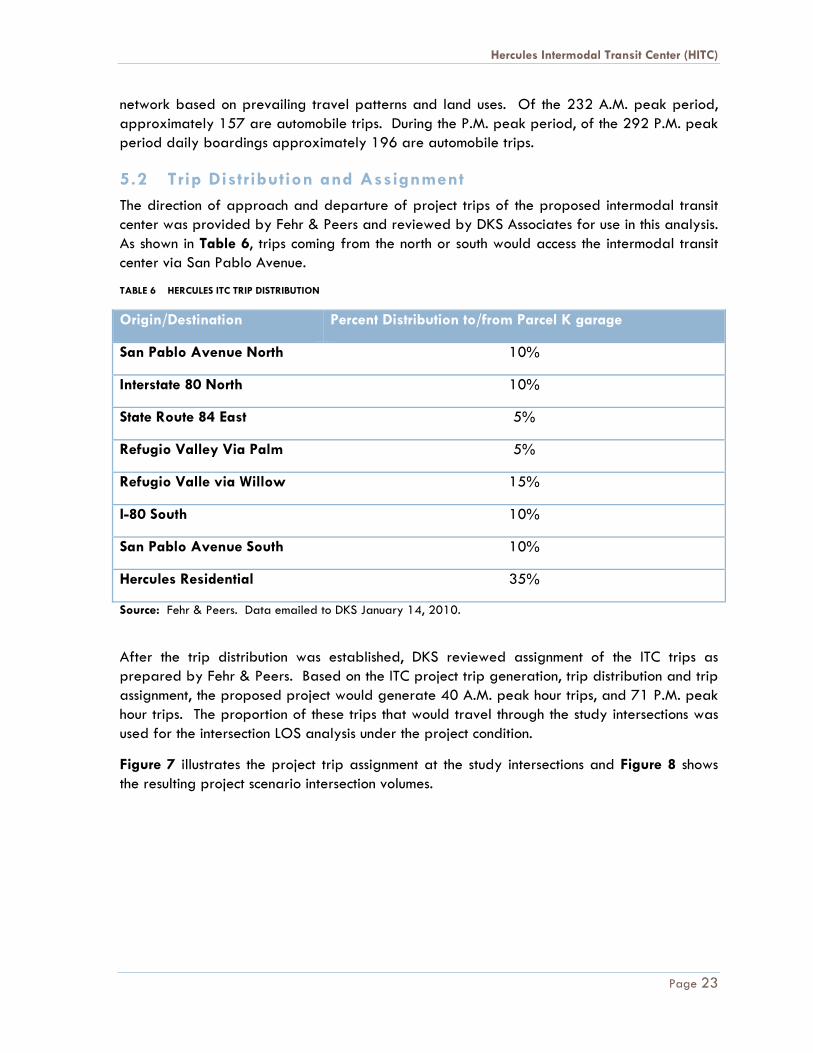
network based on prevailing travel patterns and land uses. Of the 232 A.M. peak period, approximately 157 are automobile trips. During the P.M. peak period, of the 292 P.M. peak period daily boardings approximately 196 are automobile trips.
5.2 Trip Distribution and Assignment
The direction of approach and departure of project trips of the proposed intermodal transit center was provided by Fehr & Peers and reviewed by DKS Associates for use in this analysis. As shown in Table 6, trips coming from the north or south would access the intermodal transit center via San Pablo Avenue.
TABLE 6 HERCULES ITC TRIP DISTRIBUTION
Origin/Destination Percent Distribution to/from Parcel K garage
San Pablo Avenue North 10%
Interstate 80 North 10%
State Route 84 East 5%
Refugio Valley Via Palm 5%
Refugio Valle via Willow 15%
I-80 South 10%
San Pablo Avenue South 10%
Hercules Residential 35%
Source: Fehr & Peers. Data emailed to DKS January 14, 2010.
After the trip distribution was established, DKS reviewed assignment of the ITC trips as prepared by Fehr & Peers. Based on the ITC project trip generation, trip distribution and trip assignment, the proposed project would generate 40 A.M. peak hour trips, and 71 P.M. peak hour trips. The proportion of these trips that would travel through the study intersections was used for the intersection LOS analysis under the project condition.
Figure 7 illustrates the project trip assignment at the study intersections and Figure 8 shows the resulting project scenario intersection volumes.

9 San P
ablo
Ave.
AppianWay
10
SycamoreAve.
65
SycamoreAve.
HerculesAve.
7 San P
ablo
Ave.
San P
ablo
Ave.
Bayb
erry
Ave.
Pinole Valley Rd.
8
TennentAve.
4
San P
ablo
Ave.
San P
ablo
Ave.
San P
ablo
Ave.
John MuirPkwy
3 San P
ablo
Ave.
WillowAve.
2
IHaw
thorne Dr
.
WillowAve.
1
I-80 W
BOf
f-Ram
p
WillowAve.
4
3
12
5
106
78
9
80
Muir
John
Uni
on P
acifi
c
S.F.R.R. &
Burlington Northern
Railro
ad A
ve.
San
Pab
lo A
ve.
Pauling
Linus Alfred Nobel
James
Pinole
Valley
Rd.
Bayberry
Willow
Ave.
Parker Ave.
Watson
Hercules
Ave.
SantaFe
Sycamore
Pkwy.
Ave.
San Pablo Ave.
Apia
n W
y.
Hercules City Limit
California St.
Sycamore Ave.
Partridge
Valley
Pheasant
Turquoise
Tennent Ave.
Hawth
orne
Dr.
San Pablo Bay
Hercules City Limit
Pinole City Limit
Rd.
Ave.
Sparrow
Redwood
LupineRefugio
Viewpointe
Canterbury
4
80
John Muir Pkwy. Ext.
N
Figure 7Peak Hour Project Trips
0913
9-00
0•He
rcules
ITC•
Fig 8_
PkHr
Pro
j Trip
s.ai•F
eb 20
10
T R A N S P O R TAT I O N S O LU T I O N S
DKS Associates
(11)
6
(11)
6 (22)
12
6
(27)(22)
9
18 6
(11)18
6
(22)
(11)
6
(11)
6
ProjectSite
Study Intersection
AM (PM) Peak Hour Volumesxx (xx)

9
San P
ablo
Ave.
AppianWay
10
SycamoreAve.
65
SycamoreAve. Ext.
HerculesAve.
7
San P
ablo
Ave.
San P
ablo
Ave.
Bayb
erry
Ave.
Pinole Valley Rd.
8
TennentAve.
4
San P
ablo
Ave.
San P
ablo
Ave.
San P
ablo
Ave.
John MuirPkwy
3 San P
ablo
Ave.
WillowAve.
2
IHaw
thorne Dr
.
WillowAve.
1
I-80 W
BOf
f-Ram
p
WillowAve.
4
3
12
5
106
78
9
80
Muir
John
Uni
on P
acifi
c
S.F.R.R. &
Burlington Northern
Railro
ad A
ve.
San
Pab
lo A
ve.
Pauling
Linus Alfred Nobel
James
Pinole
Valley
Rd.
Bayberry
Willow
Ave.
Parker Ave.
Watson
Hercules
Ave.
SantaFe
Sycamore
Pkwy.
Ave.
San Pablo Ave.
Apia
n W
y.
Hercules City Limit
California St.
Sycamore Ave.
Partridge
Valley
Pheasant
Turquoise
Tennent Ave.
Hawth
orne
Dr.
San Pablo Bay
Hercules City Limit
Pinole City Limit
Rd.
Ave.
Sparrow
Redwood
LupineRefugio
Viewpointe
Canterbury
4
80
John Muir Pkwy. Ext.
N
Figure 8Project Conditions Peak Hour Volumes
0913
9-00
0•He
rcules
ITC•
Fig 9_
Proje
ct Co
nd V
ols.ai
•Feb
2010
T R A N S P O R TAT I O N S O LU T I O N S
DKS Associates
(331)
(833)
190
(40)(513)
(134)(449)
22368
136347
(398)(0)
(559)(139)
2626
206172
(522
)(1
87)13
210
1
593
(92)
(113
)95 84
(10)
(83)
15 254
(9)(4)(9)
201
(294)(6)(6)
491121
(19)
(143
6)(1
4)
10 412 10
(4)
(574
)(7
6)
410
65 187
(47)(33)(10)
105231
(161)(79)
(153)
8049
244
(60)
(175
7)(1
84)
20 341
241
(44)
(332
)(4
6)
3714
44 138
(47)(58)(7)
216912
(322)(75)
(266)
686
91
(6)
(115
3)(2
50)
428
516
9
(45)
(409
)(2
09)
876
433
7
(76)(1037)
(41)
2081733
(72)(1324)
(116)
541635223
(47)
(34)
(368
)
47 18 223
(413
)(9
2)(1
130)
618 64 912
(12)(436)(164)
53317
(33)(14)
(514)
43180436
(73)
(800
)(1
321)
312
477
1481
(9)
(352
)(2
06)
12 564
204
(97)(8)
(98)
2224
253
(64)(7)
(69)
1868
166
(270
)(1
133)
(157
)
81 494 33
(173
)(5
43)
(147
)
82 997 63
(119)(72)(21)
1969427
(1062)(121)(320)
1623104717
(47)
(101
2)(5
90)
28 667
420
(398
)(4
81)
(667
)
140
628
474
ProjectSite
Study Intersection
AM (PM) Peak Hour Volumesxx (xx)

Hercules Intermodal Transit Center (HITC)
Page 26
5.3 Intersection Level of Service
According to the City of Hercules intersection level of service standards, all study intersections would continue to operate at acceptable levels of service for the project scenario with the exception of:
Sycamore Avenue/Bayberry Avenue.
The addition of project-related traffic would contribute to an already deficient level of service at this intersection. However, these project-related impacts are not considered significant. Therefore, the addition of project generated traffic would not result in a significant impact. Table 7 provides a level of service comparison for the A.M. and P.M. peak hours, respectively.
Appendix B includes the detailed level of service analysis sheets, including the weekday A.M. and P.M. peak hours.
TABLE 7 PROJECT CONDITION - LEVEL OF SERVICE SUMMARY
Int # Intersection Name A.M. PEAK P.M. PEAK
V/C LOS V/C LOS
1. Willow Avenue /I-80 WB off-ramp 0.221 A 0.308 A
2. Willow Avenue/Hawthorne Drive 0.301 A 0.241 A
3. San Pablo Avenue/Willow Avenue 0.220 A 0.445 A
4. San Pablo Avenue/John Muir Parkway 0.524 A 0.720 C
5. San Pablo Avenue/Sycamore Avenue 0.933 E 0.833 D
6. San Pablo Avenue/Hercules Avenue 0.598 A 0.534 A
7. San Pablo Avenue/Pinole Valley Road 0.480 A 0.582 A
8. San Pablo Avenue/Tennent Avenue 0.651 B 0.709 C
9. San Pablo Avenue/Appian Way 0.632 A 0.683 B
10. Sycamore Avenue/Bayberry Avenue 0.979 E 1.098 F
Notes: V/C: Volume to Capacity Ratio LOS: Level of Service Intersections operating below acceptable LOS are bold.

Hercules Intermodal Transit Center (HITC)
Page 27
Table 8 and Table 9 provides a level of service comparison for all study intersections during the A.M. and P.M. peak-hour, respectively.
TABLE 8 LOS COMPARISON SUMMARY – A.M. PEAK
# Intersection Background Project Difference Project-
Background
Potentially Significant
Impact? Delay LOS Delay LOS Delay
1. Willow Ave /I-80 WB off-ramp 0.221 A 0.221 A 0.000 No Impact
2. Willow Ave/Hawthorne Dr 0.301 A 0.301 A 0.000 No Impact
3. San Pablo Ave/Willow Ave 0.218 A 0.220 A 0.002 No Impact
4. San Pablo Ave/John Muir Pkwy 0.513 A 0.524 A 0.011 No Impact
5. San Pablo Ave/Sycamore Ave 0.927 E 0.933 E 0.006 No Impact
6. San Pablo Ave/Hercules Ave 0.598 A 0.598 A 0.000 No Impact
7. San Pablo Ave/Pinole Valley Rd 0.480 A 0.480 A 0.000 No Impact
8. San Pablo Ave/Tennent Ave 0.651 B 0.651 B 0.000 No Impact
9. San Pablo Ave/Appian Wy 0.360 A 0.632 A 0.272 No Impact
10. Sycamore Ave/Bayberry Ave 0.975 E 0.979 E 0.004 No Impact
Notes: V/C: Volume to Capacity Ratio LOS: Level of Service
Intersections operating below acceptable LOS are bold.

Hercules Intermodal Transit Center (HITC)
Page 28
TABLE 9 LOS COMPARISON SUMMARY – P.M. PEAK
5.4 Vehicle Site Access and Circulation
Project access and circulation were analyzed for both alternatives of the proposed project. The site plans (Figure 2 and Figure 3) indicate access from the John Muir Parkway extension and from Bayfront Boulevard. These roadways would allow for two-way vehicular circulation.
Under Alternative 1, vehicles traveling westbound on John Muir Parkway would turn left into the project site to park at the temporary surface parking lot while vehicles traveling eastbound on Bayfront Boulevard would turn right. Transit and kiss-n-ride vehicles would access the intermodal transit center from John Muir Parkway via a transit loop comprising the John Muir Parkway extension and the Refugio Creek Bridge connecting to the extension of Bayfront Boulevard. Transit loop drive would be a two-lane paved roadway.
For pedestrians and bicyclist, the project would include crosswalks and sidewalks. Both, pedestrians and bicyclists would be separated from vehicular traffic (by island or curbs), where feasible. A new pedestrian bridge would be built across the UPRR tracks to access the future Hercules Point open space. Pedestrian access to the platform would be provided from the pedestrian overpass by a combination of stairs, ramps, or elevators.
# Intersection Background Project Difference Project-
Background
Potentially Significant
Impact? Delay LOS Delay LOS Delay
1. Willow Ave /I-80 WB off-ramp 0.308 A 0.308 A 0.000 No Impact
2. Willow Ave/Hawthorne Dr 0.241 A 0.241 A 0.000 No Impact
3. San Pablo Ave/Willow Ave 0.442 A 0.445 A 0.003 No Impact
4. San Pablo Ave/John Muir Pkwy 0.706 C 0.720 C 0.014 No Impact
5. San Pablo Ave/Sycamore Ave 0.830 D 0.833 D 0.003 No Impact
6. San Pablo Ave/Hercules Ave 0.534 A 0.534 A 0.000 No Impact
7. San Pablo Ave/Pinole Valley Rd 0.582 A 0.582 A 0.000 No Impact
8. San Pablo Ave/Tennent Ave 0.709 C 0.709 C 0.000 No Impact
9. San Pablo Ave/Appian Wy 0.683 B 0.683 B 0.000 No Impact
10. Sycamore Ave/Bayberry Ave 1.098 F 1.098 F 0.000 No Impact
Notes: V/C: Volume to Capacity Ratio LOS: Level of Service
Intersections operating below acceptable LOS are bold.
Hercules Intermodal Transit Center (HITC)
Page 29
Emergency vehicles would have access from Bayfront Boulevard to the north into the UPRR right-of-way and connect to the west end of the station platform.
Under Alternative 2, vehicles traveling westbound on John Muir Parkway would turn right into the project site to park at the proposed parking structure while vehicles traveling eastbound on Bayfront Boulevard would turn left. Two looped driveways from John Muir Parkway would provide separate vehicle access for commuter bus/paratransit drop-off and turnaround and one for passenger vehicle drop-off. Pedestrian access would be provided at the eastern end of the train platform. This alternative includes a three-level parking structure located east of Refugio Creek.
The overall project internal design appears acceptable. No adverse internal circulation impacts related to the proposed project are anticipated.
5.5 Parking Analysis
The parking analysis consisted of an evaluation of the proposed parking supply and comparison to the anticipated demand. In the near term, a 150-space surface parking (Block N) lot located east of the planned intersection of John Muir Parkway and Bayfront Boulevard would provide temporary parking for train and bus patrons. Figure 2 identifies the surrounding parcels and their locations.
This parking lot would eventually be replaced by mixed-use and residential development as part of the proposed Bayfront Development project at Block K; replacement parking available to transit terminal commuters would be included in that development project.
Additional long-term parking would be provided in one or more multistory, mixed-use buildings on the waterfront parcels to the east and west of the proposed Alternative 1 site (identified as Block I on Figure 2). The public parking included in these buildings could be made available to transit center users.
Table 10 provides a summary of the public parking available within the vicinity of the proposed ITC Project.

Hercules Intermodal Transit Center (HITC)
Page 30
TABLE 10 PARKING SUPPLY SUMMARY
Block Number of Public Parking Spaces Number of resident-only spaces
Total # of Parking Spaces
N 150 150
K 347 91 438
G 157 55 212
E 152 55 207
D 62 101 163
Total
Source: Hercules ITC Project Description. HDR Inc.
According to the mode-of-access analysis in Section 6.1, there would be a park-and-ride demand of 150 vehicles during the A.M. peak and 189 during the P.M. peak period. Under Alternative 1, the proposed project would provide approximately 150 interim surface parking spaces. This would result in a deficit of 39 parking spaces during the P.M. peak period. Under Alternative 2, the proposed project would provide 385 parking spaces within a proposed three-level parking structure adjacent and east of the proposed ITC. With a projected park-and-ride demand of 150 vehicles during the A.M. peak period and 189 during the P.M. peak period, there would be a sufficient supply of parking.
5.6 Transit Operations
Together with the rail terminal there would be a proposed transit terminal for local and regional express bus service. Local and express service would be operated by the West Contra Costa Transit Authority (WestCAT) other area transit providers.
Under Alternative 1, all bus service would access the intermodal transit center via John Muir Parkway at Bayfront Boulevard and a planned transit loop roadway. A passenger loading and unloading area for local and regional buses would be provided along the transit loop roadway.
Under Alternative 2, the transit terminal would be located adjacent to the parking structure and would include bus layover spaces to serve intermodal transit center passengers. Bus service would be provided at the terminal located off of the John Muir Parkway extension, adjacent to the intermodal transit center and parking structure.
According to the trip generation and mode of access analysis presented in Section 6.1, approximately 2.4 percent of peak of peak period rail ridership would take transit to access the intermodal transit center. This equates to approximately 7 bus passengers during the peak period. Under either alternative, the increase in passenger demand should be

Hercules Intermodal Transit Center (HITC)
Page 31
accommodated by the additional, re-routed transit service at the intermodal transit center. No significant transit impacts are expected to occur due to the project.
5.7 Pedestrian and Bicycle Facilities
According to the trip generation and mode of access analysis presented in Section 6.1, approximately 28 percent of the peak period ridership (65 A.M. and 82 P.M. passengers) for the rail would access the intermodal transit center by non-motorized means. For pedestrians, access along the adjacent roadway network would continue to be accommodated by the provided sidewalks that connect the surrounding neighborhood to the intermodal transit center. For bicyclists, a bike lane is provided on San Pablo Avenue from Willow Avenue to Hercules Avenue. West of San Pablo Avenue, bicyclists would share Sycamore Avenue with motor vehicles to access the intermodal transit center.
The study intersections are currently signalized and equipped with pedestrian crossing signals and crosswalks. The expected increase in vehicular traffic volumes at these intersections would not significantly impact pedestrian or bicycle movements.
The proposed project includes extension of the Bay Trail and the Creekside Trail. The Bay Trail would extend from the Bio-Rad Campus on the east end of the project and connect to the existing Bay Trail head near the west end of the project. It would cross over Refugio Creek. The Creekside trail would provide bicyclist and pedestrian access from John Muir Parkway to the transit parking lot on Block N.
Hercules Intermodal Transit Center (HITC)
Page 32
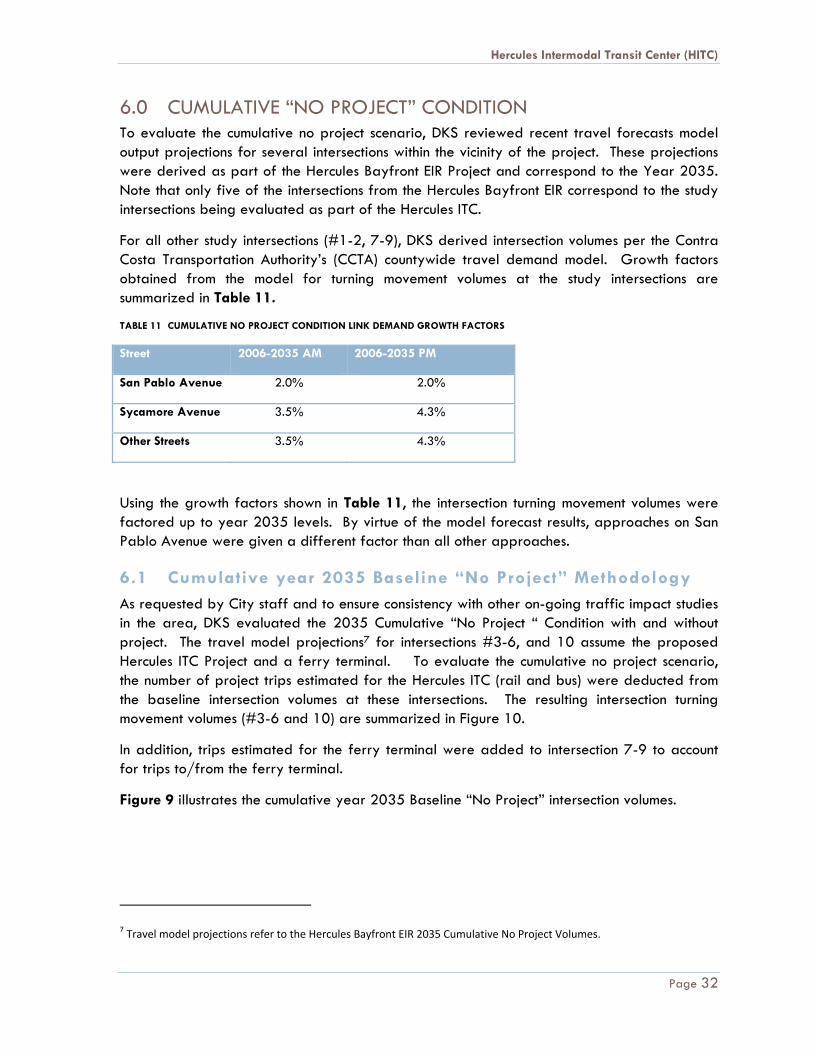
6.0 CUMULATIVE “NO PROJECT” CONDITION To evaluate the cumulative no project scenario, DKS reviewed recent travel forecasts model output projections for several intersections within the vicinity of the project. These projections were derived as part of the Hercules Bayfront EIR Project and correspond to the Year 2035. Note that only five of the intersections from the Hercules Bayfront EIR correspond to the study intersections being evaluated as part of the Hercules ITC.
For all other study intersections (#1-2, 7-9), DKS derived intersection volumes per the Contra Costa Transportation Authority’s (CCTA) countywide travel demand model. Growth factors obtained from the model for turning movement volumes at the study intersections are summarized in Table 11.
TABLE 11 CUMULATIVE NO PROJECT CONDITION LINK DEMAND GROWTH FACTORS
Street 2006-2035 AM 2006-2035 PM
San Pablo Avenue 2.0% 2.0%
Sycamore Avenue 3.5% 4.3%
Other Streets 3.5% 4.3%
Using the growth factors shown in Table 11, the intersection turning movement volumes were factored up to year 2035 levels. By virtue of the model forecast results, approaches on San Pablo Avenue were given a different factor than all other approaches.
6.1 Cumulative year 2035 Baseline “No Project” Methodology
As requested by City staff and to ensure consistency with other on-going traffic impact studies in the area, DKS evaluated the 2035 Cumulative “No Project “ Condition with and without project. The travel model projections7 for intersections #3-6, and 10 assume the proposed Hercules ITC Project and a ferry terminal. To evaluate the cumulative no project scenario, the number of project trips estimated for the Hercules ITC (rail and bus) were deducted from the baseline intersection volumes at these intersections. The resulting intersection turning movement volumes (#3-6 and 10) are summarized in Figure 10.
In addition, trips estimated for the ferry terminal were added to intersection 7-9 to account for trips to/from the ferry terminal.
Figure 9 illustrates the cumulative year 2035 Baseline “No Project” intersection volumes.
7 Travel model projections refer to the Hercules Bayfront EIR 2035 Cumulative No Project Volumes.

9
San P
ablo
Ave.
AppianWay
10
SycamoreAve.
65
SycamoreAve.
HerculesAve.
7
San P
ablo
Ave.
San P
ablo
Ave.
Bayb
erry
Ave.
Pinole Valley Rd.
8
TennentAve.
4
San P
ablo
Ave.
San P
ablo
Ave.
San P
ablo
Ave.
John MuirPkwy
3 San P
ablo
Ave.
WillowAve.
2
IHaw
thorne Dr
.
WillowAve.
1
I-80 W
BOf
f-Ram
p
WillowAve.
4
3
12
5
106
78
9
80
Muir
John
Uni
on P
acifi
c
S.F.R.R. &
Burlington Northern
Railro
ad A
ve.
San
Pab
lo A
ve.
Pauling
Linus Alfred Nobel
James
Pinole
Valley
Rd.
Bayberry
Willow
Ave.
Parker Ave.
Watson
Hercules
Ave.
SantaFe
Sycamore
Pkwy.
Ave.
San Pablo Ave.
Apia
n W
y.
Hercules City Limit
California St.
Sycamore Ave.
Partridge
Valley
Pheasant
Turquoise
Tennent Ave.
Hawth
orne
Dr.
San Pablo Bay
Hercules City Limit
Pinole City Limit
Rd.
Ave.
Sparrow
Redwood
LupineRefugio
Viewpointe
Canterbury
4
80
John Muir Pkwy. Ext.
N
Figure 9Year 2035 No Project Conditions Peak Hour Volumes
0913
9-00
0•He
rcules
ITC•
Fig 10
_203
5 No P
roj V
ols.ai
•Feb
2010
T R A N S P O R TAT I O N S O LU T I O N S
DKS Associates
(1008)
(2536)
492
(121)(1561)
(409)(1367)
58954
352899
(600)(290)
(640)(370)
560467
320630
(442
)(7
80)44
022
0
1537
(281
)(3
45)
248
217
(30)
(251
)39 660
(27)(13)(27)
603
(894)(17)(17)
1272855
(27)
(202
0)(2
0)
14 588 14
(5)
(804
)(1
06)
514
98 263
(144)(101)(30)
2513580
(489)(241)(466)
206127633
(85)
(247
1)(2
59)
29 489
338
(61)
(464
)(6
5)
5220
30 194
(144)(178)(20)
5517930
(982)(228)(811)
17617
237
(9)
(162
2)(3
51)
540
923
8
(63)
(572
)(2
93)
1110
75 473
(190)(1173)
(50)
6082040
(150)(1040)(100)
1001333180
(30)
(20)
(70)
30 30 40
(700
)(9
0)(7
40)
507 70 450
(40)(839)(223)
209050
(80)(80)
(950)
140305470
(150
)(1
060)
(120
0)
310
500
1610
(20)
(460
)(4
60)
70 900
190
(140)(10)
(100)
28020
190
(110)(10)(70)
25010
150
(220
)(1
550)
(150
)
60 857 30
(220
)(1
342)
(220
)
100
1320 110
(300)(140)(350)
220120120
(860)(310)(600)
1230160480
(220
)(1
120)
(530
)
217
850
410
(190
)(7
10)
(743
)
170
800
390
ProjectSite
Study Intersection
AM (PM) Peak Hour Volumesxx (xx)

Hercules Intermodal Transit Center (HITC)
Page 34
6.2 Intersection Operation
According to the City of Hercules intersection level of service standards, several of the study intersections would operate at less than acceptable levels of service for the cumulative no project scenario. Table 12 provides a level of service comparison for the A.M. and P.M. peak hours, respectively.
Appendix B includes the detailed level of service analysis sheets, including the weekday A.M. and P.M. peak hours.
TABLE 12 CUMULATIVE “NO PROJECT” CONDITION - LEVEL OF SERVICE SUMMARY
Int # Intersection Name A.M. PEAK P.M. PEAK
V/C LOS V/C LOS
1. Willow Avenue /I-80 WB off-ramp 0.591 A 0.938 E
2. Willow Avenue/Hawthorne Drive 0.781 C 0.733 C
3. San Pablo Avenue/Willow Avenue 0.806 D 0.712 C
4. San Pablo Avenue/John Muir Parkway 0.764 C 1.239 F
5. San Pablo Avenue/Sycamore Avenue 0.859 D 1.103 F
6. San Pablo Avenue/Hercules Avenue 0.758 C 0.755 C
7. San Pablo Avenue/Pinole Valley Road 0.889 D 1.108 F
8. San Pablo Avenue/Tennent Avenue 1.138 F 1.259 F
9. San Pablo Avenue/Appian Way 0.624 B 1.366 F
10. Sycamore Avenue/Bayberry Avenue 0.656 B 0.762 C
Notes: V/C: Volume to Capacity Ratio LOS: Level of Service
Intersections operating below acceptable LOS are bold.
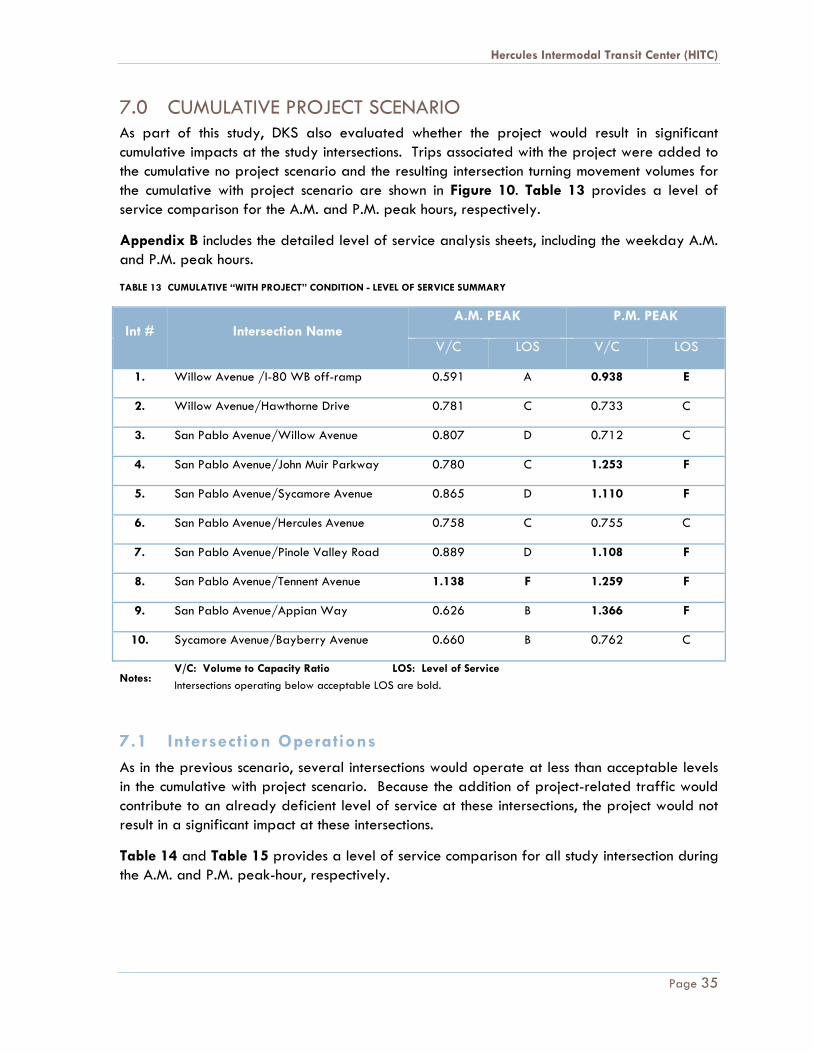
Hercules Intermodal Transit Center (HITC)
Page 35
7.0 CUMULATIVE PROJECT SCENARIO As part of this study, DKS also evaluated whether the project would result in significant cumulative impacts at the study intersections. Trips associated with the project were added to the cumulative no project scenario and the resulting intersection turning movement volumes for the cumulative with project scenario are shown in Figure 10. Table 13 provides a level of service comparison for the A.M. and P.M. peak hours, respectively.
Appendix B includes the detailed level of service analysis sheets, including the weekday A.M. and P.M. peak hours.
TABLE 13 CUMULATIVE “WITH PROJECT” CONDITION - LEVEL OF SERVICE SUMMARY
Int # Intersection Name A.M. PEAK P.M. PEAK
V/C LOS V/C LOS
1. Willow Avenue /I-80 WB off-ramp 0.591 A 0.938 E
2. Willow Avenue/Hawthorne Drive 0.781 C 0.733 C
3. San Pablo Avenue/Willow Avenue 0.807 D 0.712 C
4. San Pablo Avenue/John Muir Parkway 0.780 C 1.253 F
5. San Pablo Avenue/Sycamore Avenue 0.865 D 1.110 F
6. San Pablo Avenue/Hercules Avenue 0.758 C 0.755 C
7. San Pablo Avenue/Pinole Valley Road 0.889 D 1.108 F
8. San Pablo Avenue/Tennent Avenue 1.138 F 1.259 F
9. San Pablo Avenue/Appian Way 0.626 B 1.366 F
10. Sycamore Avenue/Bayberry Avenue 0.660 B 0.762 C
Notes: V/C: Volume to Capacity Ratio LOS: Level of Service
Intersections operating below acceptable LOS are bold.
7.1 Intersection Operations
As in the previous scenario, several intersections would operate at less than acceptable levels in the cumulative with project scenario. Because the addition of project-related traffic would contribute to an already deficient level of service at these intersections, the project would not result in a significant impact at these intersections.
Table 14 and Table 15 provides a level of service comparison for all study intersection during the A.M. and P.M. peak-hour, respectively.

9
San P
ablo
Ave.
AppianWay
10
SycamoreAve.
65
SycamoreAve.
HerculesAve.
7
San P
ablo
Ave.
San P
ablo
Ave.
Bayb
erry
Ave.
Pinole Valley Rd.
8
TennentAve.
4
San P
ablo
Ave.
San P
ablo
Ave.
San P
ablo
Ave.
John MuirPkwy
3 San P
ablo
Ave.
WillowAve.
2
IHaw
thorne Dr
.
WillowAve.
1
I-80 W
BOf
f-Ram
p
WillowAve.
4
3
12
5
106
78
9
80
Muir
John
Uni
on P
acifi
c
S.F.R.R. &
Burlington Northern
Railro
ad A
ve.
San
Pab
lo A
ve.
Pauling
Linus Alfred Nobel
James
Pinole
Valley
Rd.
Bayberry
Willow
Ave.
Parker Ave.
Watson
Hercules
Ave.
SantaFe
Sycamore
Pkwy.
Ave.
San Pablo Ave.
Apia
n W
y.
Hercules City Limit
California St.
Sycamore Ave.
Partridge
Valley
Pheasant
Turquoise
Tennent Ave.
Hawth
orne
Dr.
San Pablo Bay
Hercules City Limit
Pinole City Limit
Rd.
Ave.
Sparrow
Redwood
LupineRefugio
Viewpointe
Canterbury
4
80
John Muir Pkwy. Ext.
N
Figure 10Year 2035 Plus Project Conditions Peak Hour Volumes
0913
9-00
0•He
rcules
ITC•
Fig 11
_203
5 + P
roj V
ols.ai
•Feb
2010
T R A N S P O R TAT I O N S O LU T I O N S
DKS Associates
(1008)
(2536)
492
(121)(1561)
(409)(1367)
58954
352899
(600)(290)
(640)(370)
560473
320630
(453
)(7
80)44
022
0
1537
(281
)(3
45)
248
217
(30)
(251
)39 660
(27)(13)(27)
603
(894)(17)(17)
1272855
(27)
(202
0)(2
0)
14 594 14
(5)
(815
)(1
06)
514
98 263
(144)(101)(30)
2513580
(489)(241)(466)
206127633
(85)
(247
1)(2
59)
29 495
338
(61)
(475
)(6
5)
5220
30 194
(144)(178)(20)
5517930
(982)(228)(811)
17617
237
(9)
(162
2)(3
51)
541
523
8
(63)
(583
)(2
93)
1110
75 473
(190)(1195)
(50)
6082040
(150)(1040)(100)
1001345180
(30)
(20)
(70)
30 30 40
(700
)(9
0)(7
40)
513 70 450
(40)(866)(245)
209050
(80)(80)
(950)
140314470
(150
)(1
060)
(120
0)
328
500
1610
(20)
(460
)(4
60)
70 900
190
(140)(10)
(100)
28020
190
(110)(10)(70)
25010
150
(220
)(1
550)
(150
)
60 863 30
(220
)(1
353)
(220
)
100
1320 110
(300)(140)(350)
220120120
(860)(310)(600)
1248160480
(220
)(1
120)
(530
)
223
850
410
(190
)(7
10)
(765
)
170
800
390
ProjectSite
Study Intersection
AM (PM) Peak Hour Volumesxx (xx)

Hercules Intermodal Transit Center (HITC)
Page 37
TABLE 14 LOS COMPARISON SUMMARY – A.M. PEAK
# Intersection Cumulative No Project
Cumulative with Project
Difference Project vs. No Project
Potentially Significant
Impact? Delay LOS Delay LOS Delay
1. Willow Ave /I-80 WB off-ramp 0.591 A 0.591 A 0.000 No Impact
2. Willow Ave/Hawthorne Dr 0.781 C 0.781 C 0.000 No Impact
3. San Pablo Ave/Willow Ave 0.806 D 0.807 D 0.001 No Impact
4. San Pablo Ave/John Muir Pkwy 0.764 C 0.780 C 0.016 No Impact
5. San Pablo Ave/Sycamore Ave 0.859 D 0.865 D 0.006 No Impact
6. San Pablo Ave/Hercules Ave 0.758 C 0.758 C 0.000 No Impact
7. San Pablo Ave/Pinole Valley Rd 0.889 D 0.889 D 0.000 No Impact
8. San Pablo Ave/Tennent Ave 1.138 F 1.138 F 0.000 No Impact
9. San Pablo Ave/Appian Wy 0.624 B 0.626 B 0.002 No Impact
10. Sycamore Ave/Bayberry Ave 0.656 B 0.660 B 0.004 No Impact
Notes: V/C: Volume to Capacity Ratio LOS: Level of Service
Intersections operating below acceptable LOS are bold.

Hercules Intermodal Transit Center (HITC)
Page 38
TABLE 15 LOS COMPARISON SUMMARY – P.M. PEAK
# Intersection Cumulative No Project
Cumulative with Project
Difference Project vs. No Project
Potentially Significant
Impact? Delay LOS Delay LOS Delay
1. Willow Ave /I-80 WB off-ramp 0.938 E 0.938 E 0.000 No Impact
2. Willow Ave/Hawthorne Dr 0.733 C 0.733 C 0.000 No Impact
3. San Pablo Ave/Willow Ave 0.712 C 0.712 C 0.000 No Impact
4. San Pablo Ave/John Muir Pkwy 1.239 F 1.253 F 0.030 No Impact
5. San Pablo Ave/Sycamore Ave 1.103 F 1.110 F 0.015 No Impact
6. San Pablo Ave/Hercules Ave 0.755 C 0.755 C 0.000 No Impact
7. San Pablo Ave/Pinole Valley Rd 1.108 F 1.108 F 0.000 No Impact
8. San Pablo Ave/Tennent Ave 1.259 F 1.259 F 0.000 No Impact
9. San Pablo Ave/Appian Wy 1.366 F 1.366 F 0.000 No Impact
10. Sycamore Ave/Bayberry Ave 0.762 C 0.762 C 0.000 No Impact
Notes: V/C: Volume to Capacity Ratio LOS: Level of Service
Intersections operating below acceptable LOS are bold.

Hercules Intermodal Transit Center (HITC)
Page 39
8.0 RECOMMENDED IMPROVEMENT MEASURES While there were no significant transportation impacts identified, three recommended improvement measures were identified as a result of this study:
Parking
Under Alternative 1 of the Proposed Project, a parking deficiency may occur. The proposed 150 space interim surface parking lot would not meet the expected demand of 189 park-and-ride vehicles during the P.M. peak period. It is recommended that the lot be expanded to accommodate the expected demand and/or arrange for adjacent parking facilities to provide parking for ITC users.
Pedestrian and Bicycle Facilities
To improve access to the intermodal transit center for pedestrians and bicyclists, two recommended improvement measures have been identified:
1. It is recommended that the future John Muir Parkway extension include bicycle lanes.
2. Bicycle parking should be provided at the intermodal transit center to accommodate bicycle access.

APPENDICES

Appendix A
Bicycle Network

I0
I
IA
Hercules
Pinole
?ÙE
!"c$
!"c$
May
Rd
Manor Rd
2nd St
San Pablo Ave
Cas
tro R
anch
Rd
Pa
rker A
ve
Valley View R
d
Appian Way
6th St
3rd St
Pomona St
Cum
mings
Skw
y
Pinole Valley Rd
Willow
Ave
Refugio Valley Rd
Bayberry Ave
Alhambra Valley Rd
Sycamore Ave
Silv
era
do
Dr
Crockett Blvd
COUNTYWIDE BIKEWAY NETWORKHERCULES
FIGURE
DRAFTContra Costa County Overview
Current View
LEGENDBicycle Facilities
Existing Class IProposed Class IExisting Class IIProposed Class IIExisting Class IIIProposed Class III
Bay Area Ridge TrailBART StationBART RouteFuture BART StationFuture eBART Route
IA Park-and-Ride
Ib Rail Station
I0 Transit CenterDowntown/Town CenterCity LimitCounty BoundaryJ
The existing and proposed bicycle facilities on this map reflect plans adopted by the local jurisdiction.

Appendix B
INTERSECTION LEVEL OF SERVICE ANALYSIS

Existing Condition
A.M. Peak

Existing AM Mon Feb 1, 2010 16:36:41 Page 3-1 -------------------------------------------------------------------------------- -------------------------------------------------------------------------------- Level Of Service Computation Report CCTALOS Method (Future Volume Alternative) ******************************************************************************** Intersection #1 Willow Ave / I-80 WB Off-ramp ******************************************************************************** Cycle (sec): 90 Critical Vol./Cap.(X): 0.208 Loss Time (sec): 8 (Y+R=4.0 sec) Average Delay (sec/veh): xxxxxx Optimal Cycle: 22 Level Of Service: A ******************************************************************************** Street Name: I-80 WB Off-ramp Willow Ave Approach: North Bound South Bound East Bound West Bound Movement: L - T - R L - T - R L - T - R L - T - R ------------|---------------||---------------||---------------||---------------| Control: Protected Protected Protected Protected Rights: Include Include Ignore Ignore Min. Green: 5 5 5 5 5 5 5 5 5 5 5 5 Lanes: 0 0 0 0 0 1 0 0 0 1 0 0 2 0 0 0 0 2 0 0 ------------|---------------||---------------||---------------||---------------| Volume Module: >> Count Date: 23 Mar 2006 << Base Vol: 0 0 0 79 0 90 0 179 0 0 559 0 Growth Adj: 1.00 1.00 1.00 1.00 1.00 1.00 1.00 1.00 1.00 1.00 1.00 1.00 Initial Bse: 0 0 0 79 0 90 0 179 0 0 559 0 Added Vol: 0 0 0 0 0 0 0 0 0 0 0 0 PasserByVol: 0 0 0 0 0 0 0 0 0 0 0 0 Initial Fut: 0 0 0 79 0 90 0 179 0 0 559 0 User Adj: 1.00 1.00 1.00 1.00 1.00 1.00 1.00 1.00 1.00 1.00 1.00 1.00 PHF Adj: 1.00 1.00 1.00 1.00 1.00 1.00 1.00 1.00 1.00 1.00 1.00 1.00 PHF Volume: 0 0 0 79 0 90 0 179 0 0 559 0 Reduct Vol: 0 0 0 0 0 0 0 0 0 0 0 0 Reduced Vol: 0 0 0 79 0 90 0 179 0 0 559 0 RTOR Reduct: 0 0 0 0 0 0 0 0 0 0 0 0 RTOR Vol: 0 0 0 79 0 90 0 179 0 0 559 0 PCE Adj: 1.00 1.00 1.00 1.00 1.00 1.00 1.00 1.00 1.00 1.00 1.00 1.00 MLF Adj: 1.00 1.00 1.00 1.00 1.00 1.00 1.00 1.00 1.00 1.00 1.00 1.00 FinalVolume: 0 0 0 79 0 90 0 179 0 0 559 0 ------------|---------------||---------------||---------------||---------------| Saturation Flow Module: Sat/Lane: 1720 1720 1720 1720 1720 1720 1720 1720 1720 1720 1720 1720 Adjustment: 1.00 1.00 1.00 1.00 1.00 1.00 1.00 1.00 1.00 1.00 1.00 1.00 Lanes: 0.00 0.00 0.00 1.00 0.00 1.00 0.00 2.00 0.00 0.00 2.00 0.00 Final Sat.: 0 0 0 1720 0 1720 0 3440 0 0 3440 0 ------------|---------------||---------------||---------------||---------------| Capacity Analysis Module: Vol/Sat: 0.00 0.00 0.00 0.05 0.00 0.05 0.00 0.05 0.00 0.00 0.16 0.00 Crit Volume: 0 79 0 280 Crit Moves: **** **** **** ******************************************************************************** Traffix 7.9.0415 (c) 2007 Dowling Assoc. Licensed to DKS ASSOC., OAKLAND,CA
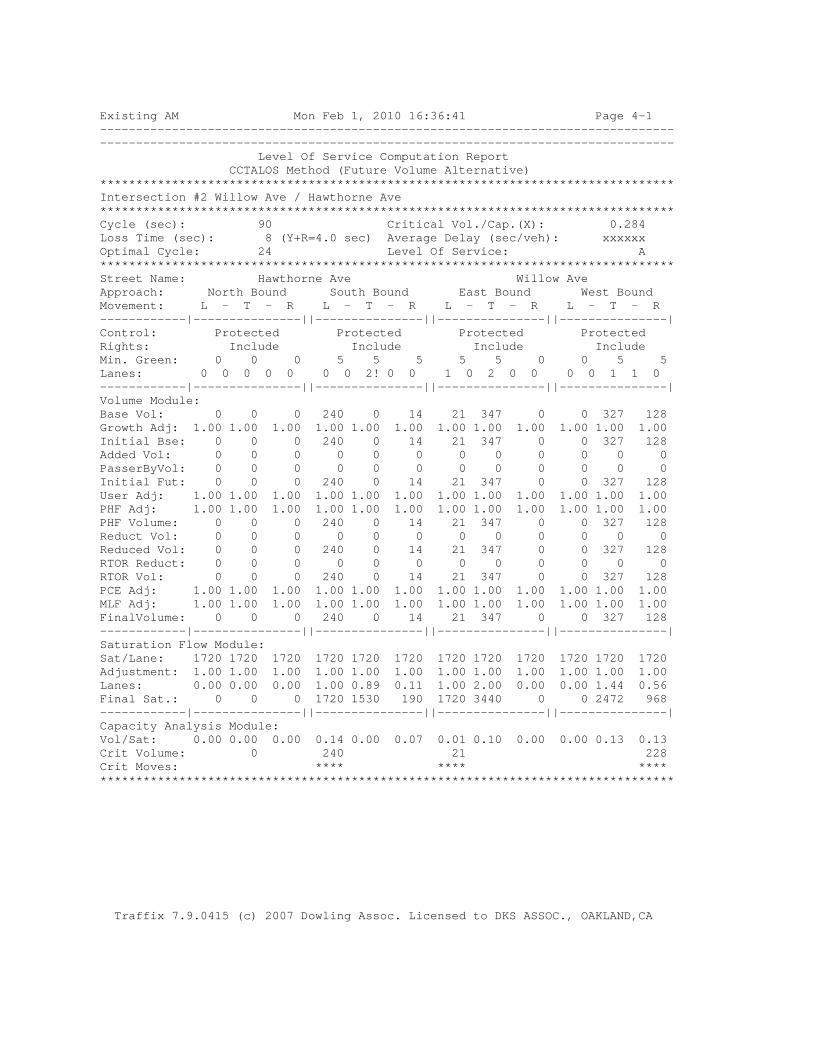
Existing AM Mon Feb 1, 2010 16:36:41 Page 4-1 -------------------------------------------------------------------------------- -------------------------------------------------------------------------------- Level Of Service Computation Report CCTALOS Method (Future Volume Alternative) ******************************************************************************** Intersection #2 Willow Ave / Hawthorne Ave ******************************************************************************** Cycle (sec): 90 Critical Vol./Cap.(X): 0.284 Loss Time (sec): 8 (Y+R=4.0 sec) Average Delay (sec/veh): xxxxxx Optimal Cycle: 24 Level Of Service: A ******************************************************************************** Street Name: Hawthorne Ave Willow Ave Approach: North Bound South Bound East Bound West Bound Movement: L - T - R L - T - R L - T - R L - T - R ------------|---------------||---------------||---------------||---------------| Control: Protected Protected Protected Protected Rights: Include Include Include Include Min. Green: 0 0 0 5 5 5 5 5 0 0 5 5 Lanes: 0 0 0 0 0 0 0 2! 0 0 1 0 2 0 0 0 0 1 1 0 ------------|---------------||---------------||---------------||---------------| Volume Module: Base Vol: 0 0 0 240 0 14 21 347 0 0 327 128 Growth Adj: 1.00 1.00 1.00 1.00 1.00 1.00 1.00 1.00 1.00 1.00 1.00 1.00 Initial Bse: 0 0 0 240 0 14 21 347 0 0 327 128 Added Vol: 0 0 0 0 0 0 0 0 0 0 0 0 PasserByVol: 0 0 0 0 0 0 0 0 0 0 0 0 Initial Fut: 0 0 0 240 0 14 21 347 0 0 327 128 User Adj: 1.00 1.00 1.00 1.00 1.00 1.00 1.00 1.00 1.00 1.00 1.00 1.00 PHF Adj: 1.00 1.00 1.00 1.00 1.00 1.00 1.00 1.00 1.00 1.00 1.00 1.00 PHF Volume: 0 0 0 240 0 14 21 347 0 0 327 128 Reduct Vol: 0 0 0 0 0 0 0 0 0 0 0 0 Reduced Vol: 0 0 0 240 0 14 21 347 0 0 327 128 RTOR Reduct: 0 0 0 0 0 0 0 0 0 0 0 0 RTOR Vol: 0 0 0 240 0 14 21 347 0 0 327 128 PCE Adj: 1.00 1.00 1.00 1.00 1.00 1.00 1.00 1.00 1.00 1.00 1.00 1.00 MLF Adj: 1.00 1.00 1.00 1.00 1.00 1.00 1.00 1.00 1.00 1.00 1.00 1.00 FinalVolume: 0 0 0 240 0 14 21 347 0 0 327 128 ------------|---------------||---------------||---------------||---------------| Saturation Flow Module: Sat/Lane: 1720 1720 1720 1720 1720 1720 1720 1720 1720 1720 1720 1720 Adjustment: 1.00 1.00 1.00 1.00 1.00 1.00 1.00 1.00 1.00 1.00 1.00 1.00 Lanes: 0.00 0.00 0.00 1.00 0.89 0.11 1.00 2.00 0.00 0.00 1.44 0.56 Final Sat.: 0 0 0 1720 1530 190 1720 3440 0 0 2472 968 ------------|---------------||---------------||---------------||---------------| Capacity Analysis Module: Vol/Sat: 0.00 0.00 0.00 0.14 0.00 0.07 0.01 0.10 0.00 0.00 0.13 0.13 Crit Volume: 0 240 21 228 Crit Moves: **** **** **** ******************************************************************************** Traffix 7.9.0415 (c) 2007 Dowling Assoc. Licensed to DKS ASSOC., OAKLAND,CA

Existing AM Mon Feb 1, 2010 16:36:41 Page 5-1 -------------------------------------------------------------------------------- -------------------------------------------------------------------------------- Level Of Service Computation Report CCTALOS Method (Future Volume Alternative) ******************************************************************************** Intersection #3 San Pablo Ave / Willow Ave ******************************************************************************** Cycle (sec): 90 Critical Vol./Cap.(X): 0.244 Loss Time (sec): 12 (Y+R=4.0 sec) Average Delay (sec/veh): xxxxxx Optimal Cycle: 30 Level Of Service: A ******************************************************************************** Street Name: San Pablo Ave Willow Ave Approach: North Bound South Bound East Bound West Bound Movement: L - T - R L - T - R L - T - R L - T - R ------------|---------------||---------------||---------------||---------------| Control: Permitted Permitted Split Phase Split Phase Rights: Include Include Ignore Include Min. Green: 5 5 5 5 5 5 5 5 5 5 5 5 Lanes: 2 0 0 0 1 0 0 0 0 0 0 0 1 1 0 1 0 2 0 0 ------------|---------------||---------------||---------------||---------------| Volume Module: >> Count Date: 23 Mar 2006 << Base Vol: 103 0 79 0 0 0 0 247 155 162 194 0 Growth Adj: 1.00 1.00 1.00 1.00 1.00 1.00 1.00 1.00 1.00 1.00 1.00 1.00 Initial Bse: 103 0 79 0 0 0 0 247 155 162 194 0 Added Vol: 0 0 0 0 0 0 0 0 0 0 0 0 PasserByVol: 0 0 0 0 0 0 0 0 0 0 0 0 Initial Fut: 103 0 79 0 0 0 0 247 155 162 194 0 User Adj: 1.00 1.00 1.00 1.00 1.00 1.00 1.00 1.00 1.00 1.00 1.00 1.00 PHF Adj: 1.00 1.00 1.00 1.00 1.00 1.00 1.00 1.00 1.00 1.00 1.00 1.00 PHF Volume: 103 0 79 0 0 0 0 247 155 162 194 0 Reduct Vol: 0 0 0 0 0 0 0 0 0 0 0 0 Reduced Vol: 103 0 79 0 0 0 0 247 155 162 194 0 RTOR Reduct: 0 0 79 0 0 0 0 0 0 0 0 0 RTOR Vol: 103 0 0 0 0 0 0 247 155 162 194 0 PCE Adj: 1.00 1.00 1.00 1.00 1.00 1.00 1.00 1.00 1.00 1.00 1.00 1.00 MLF Adj: 1.00 1.00 1.00 1.00 1.00 1.00 1.00 1.00 1.00 1.00 1.00 1.00 FinalVolume: 103 0 0 0 0 0 0 247 155 162 194 0 ------------|---------------||---------------||---------------||---------------| Saturation Flow Module: Sat/Lane: 1720 1720 1720 1720 1720 1720 1720 1720 1720 1720 1720 1720 Adjustment: 0.91 1.00 1.00 1.00 1.00 1.00 1.00 1.00 1.00 1.00 1.00 1.00 Lanes: 2.00 0.00 1.00 0.00 0.00 0.00 0.00 1.23 0.77 1.00 2.00 0.00 Final Sat.: 3127 0 1720 0 0 0 0 2114 1326 1720 3440 0 ------------|---------------||---------------||---------------||---------------| Capacity Analysis Module: Vol/Sat: 0.03 0.00 0.00 0.00 0.00 0.00 0.00 0.12 0.12 0.09 0.06 0.00 Crit Volume: 52 0 201 162 Crit Moves: **** **** **** ******************************************************************************** Traffix 7.9.0415 (c) 2007 Dowling Assoc. Licensed to DKS ASSOC., OAKLAND,CA

Existing AM Mon Feb 1, 2010 16:36:41 Page 6-1 -------------------------------------------------------------------------------- -------------------------------------------------------------------------------- Level Of Service Computation Report CCTALOS Method (Future Volume Alternative) ******************************************************************************** Intersection #4 San Pablo Ave / John Muir Pkwy ******************************************************************************** Cycle (sec): 120 Critical Vol./Cap.(X): 0.427 Loss Time (sec): 16 (Y+R=4.0 sec) Average Delay (sec/veh): xxxxxx Optimal Cycle: 50 Level Of Service: A ******************************************************************************** Street Name: San Pablo Ave John Muir Pkwy Approach: North Bound South Bound East Bound West Bound Movement: L - T - R L - T - R L - T - R L - T - R ------------|---------------||---------------||---------------||---------------| Control: Protected Protected Protected Protected Rights: Ignore Include Include Include Min. Green: 5 5 5 5 5 5 5 5 5 5 5 5 Lanes: 1 0 2 0 1 1 0 1 1 0 1 0 1 1 0 2 0 0 1 0 ------------|---------------||---------------||---------------||---------------| Volume Module: >> Count Date: 23 Mar 2006 << Base Vol: 230 373 1157 159 441 9 5 31 16 411 161 41 Growth Adj: 1.00 1.00 1.00 1.00 1.00 1.00 1.00 1.00 1.00 1.00 1.00 1.00 Initial Bse: 230 373 1157 159 441 9 5 31 16 411 161 41 Added Vol: 0 0 0 0 0 0 0 0 0 0 0 0 PasserByVol: 0 0 0 0 0 0 0 0 0 0 0 0 Initial Fut: 230 373 1157 159 441 9 5 31 16 411 161 41 User Adj: 1.00 1.00 1.00 1.00 1.00 1.00 1.00 1.00 1.00 1.00 1.00 1.00 PHF Adj: 1.00 1.00 1.00 1.00 1.00 1.00 1.00 1.00 1.00 1.00 1.00 1.00 PHF Volume: 230 373 1157 159 441 9 5 31 16 411 161 41 Reduct Vol: 0 0 0 0 0 0 0 0 0 0 0 0 Reduced Vol: 230 373 1157 159 441 9 5 31 16 411 161 41 RTOR Reduct: 0 0 0 0 0 0 0 0 0 0 0 0 RTOR Vol: 230 373 1157 159 441 9 5 31 16 411 161 41 PCE Adj: 1.00 1.00 1.00 1.00 1.00 1.00 1.00 1.00 1.00 1.00 1.00 1.00 MLF Adj: 1.00 1.00 1.00 1.00 1.00 1.00 1.00 1.00 1.00 1.00 1.00 1.00 FinalVolume: 230 373 1157 159 441 9 5 31 16 411 161 41 ------------|---------------||---------------||---------------||---------------| Saturation Flow Module: Sat/Lane: 1650 1650 1650 1650 1650 1650 1650 1650 1650 1650 1650 1650 Adjustment: 1.00 1.00 1.00 1.00 1.00 1.00 1.00 1.00 1.00 0.91 1.00 1.00 Lanes: 1.00 2.00 1.00 1.00 1.96 0.04 1.00 1.32 0.68 2.00 0.80 0.20 Final Sat.: 1650 3300 1650 1650 3234 66 1650 2177 1123 3000 1315 335 ------------|---------------||---------------||---------------||---------------| Capacity Analysis Module: Vol/Sat: 0.14 0.11 0.70 0.10 0.14 0.14 0.00 0.01 0.01 0.14 0.12 0.12 Crit Volume: 230 225 24 206 Crit Moves: **** **** **** **** ******************************************************************************** Traffix 7.9.0415 (c) 2007 Dowling Assoc. Licensed to DKS ASSOC., OAKLAND,CA

Existing AM Mon Feb 1, 2010 16:36:41 Page 7-1 -------------------------------------------------------------------------------- -------------------------------------------------------------------------------- Level Of Service Computation Report CCTALOS Method (Future Volume Alternative) ******************************************************************************** Intersection #5 San Pablo Ave / Sycamore Ave ******************************************************************************** Cycle (sec): 120 Critical Vol./Cap.(X): 0.674 Loss Time (sec): 16 (Y+R=4.0 sec) Average Delay (sec/veh): xxxxxx Optimal Cycle: 87 Level Of Service: B ******************************************************************************** Street Name: San Pablo Ave Sycamore Ave Approach: North Bound South Bound East Bound West Bound Movement: L - T - R L - T - R L - T - R L - T - R ------------|---------------||---------------||---------------||---------------| Control: Protected Protected Split Phase Split Phase Rights: Include Include Include Include Min. Green: 5 5 5 5 5 5 5 5 5 5 5 5 Lanes: 2 0 2 0 1 2 0 1 1 0 1 0 1 1 0 1 1 0 0 2 ------------|---------------||---------------||---------------||---------------| Volume Module: >> Count Date: 23 Mar 2006 << AM Base Vol: 17 521 328 370 491 109 138 66 19 505 73 1130 Growth Adj: 1.00 1.00 1.00 1.00 1.00 1.00 1.00 1.00 1.00 1.00 1.00 1.00 Initial Bse: 17 521 328 370 491 109 138 66 19 505 73 1130 Added Vol: 0 0 0 0 0 0 0 0 0 0 0 0 PasserByVol: 0 0 0 0 0 0 0 0 0 0 0 0 Initial Fut: 17 521 328 370 491 109 138 66 19 505 73 1130 User Adj: 1.00 1.00 1.00 1.00 1.00 1.00 1.00 1.00 1.00 1.00 1.00 1.00 PHF Adj: 1.00 1.00 1.00 1.00 1.00 1.00 1.00 1.00 1.00 1.00 1.00 1.00 PHF Volume: 17 521 328 370 491 109 138 66 19 505 73 1130 Reduct Vol: 0 0 0 0 0 0 0 0 0 0 0 0 Reduced Vol: 17 521 328 370 491 109 138 66 19 505 73 1130 RTOR Reduct: 0 0 278 0 0 0 0 0 0 0 0 204 RTOR Vol: 17 521 50 370 491 109 138 66 19 505 73 927 PCE Adj: 1.00 1.00 1.00 1.00 1.00 1.00 1.00 1.00 1.00 1.00 1.00 1.00 MLF Adj: 1.00 1.00 1.00 1.00 1.00 1.00 1.00 1.00 1.00 1.00 1.00 1.00 FinalVolume: 17 521 50 370 491 109 138 66 19 505 73 927 ------------|---------------||---------------||---------------||---------------| Saturation Flow Module: Sat/Lane: 1650 1650 1650 1650 1650 1650 1650 1650 1650 1650 1650 1650 Adjustment: 0.91 1.00 1.00 0.91 1.00 1.00 1.00 1.00 1.00 0.91 1.00 0.91 Lanes: 2.00 2.00 1.00 2.00 1.64 0.36 1.00 1.55 0.45 1.75 0.25 2.00 Final Sat.: 3000 3300 1650 3000 2701 600 1650 2562 738 2621 417 3000 ------------|---------------||---------------||---------------||---------------| Capacity Analysis Module: Vol/Sat: 0.01 0.16 0.03 0.12 0.18 0.18 0.08 0.03 0.03 0.19 0.18 0.31 Crit Volume: 261 185 138 463 Crit Moves: **** **** **** **** ******************************************************************************** Traffix 7.9.0415 (c) 2007 Dowling Assoc. Licensed to DKS ASSOC., OAKLAND,CA

Existing AM Mon Feb 1, 2010 16:36:41 Page 8-1 -------------------------------------------------------------------------------- -------------------------------------------------------------------------------- Level Of Service Computation Report CCTALOS Method (Future Volume Alternative) ******************************************************************************** Intersection #6 San Pablo Ave / Hercules Ave ******************************************************************************** Cycle (sec): 120 Critical Vol./Cap.(X): 0.507 Loss Time (sec): 16 (Y+R=4.0 sec) Average Delay (sec/veh): xxxxxx Optimal Cycle: 58 Level Of Service: A ******************************************************************************** Street Name: San Pablo Ave Hercules Ave Approach: North Bound South Bound East Bound West Bound Movement: L - T - R L - T - R L - T - R L - T - R ------------|---------------||---------------||---------------||---------------| Control: Protected Protected Split Phase Split Phase Rights: Include Include Include Include Min. Green: 5 5 5 5 5 5 5 5 5 5 5 5 Lanes: 1 0 2 0 1 1 0 2 0 1 1 0 1 0 1 0 1 0 1 0 ------------|---------------||---------------||---------------||---------------| Volume Module: >> Count Date: 23 Mar 2006 << Base Vol: 63 381 26 49 779 64 209 4 239 157 8 175 Growth Adj: 1.00 1.00 1.00 1.00 1.00 1.00 1.00 1.00 1.00 1.00 1.00 1.00 Initial Bse: 63 381 26 49 779 64 209 4 239 157 8 175 Added Vol: 0 0 0 0 0 0 0 0 0 0 0 0 PasserByVol: 0 0 0 0 0 0 0 0 0 0 0 0 Initial Fut: 63 381 26 49 779 64 209 4 239 157 8 175 User Adj: 1.00 1.00 1.00 1.00 1.00 1.00 1.00 1.00 1.00 1.00 1.00 1.00 PHF Adj: 1.00 1.00 1.00 1.00 1.00 1.00 1.00 1.00 1.00 1.00 1.00 1.00 PHF Volume: 63 381 26 49 779 64 209 4 239 157 8 175 Reduct Vol: 0 0 0 0 0 0 0 0 0 0 0 0 Reduced Vol: 63 381 26 49 779 64 209 4 239 157 8 175 RTOR Reduct: 0 0 26 0 0 64 0 0 63 0 0 0 RTOR Vol: 63 381 0 49 779 0 209 4 176 157 8 175 PCE Adj: 1.00 1.00 1.00 1.00 1.00 1.00 1.00 1.00 1.00 1.00 1.00 1.00 MLF Adj: 1.00 1.00 1.00 1.00 1.00 1.00 1.00 1.00 1.00 1.00 1.00 1.00 FinalVolume: 63 381 0 49 779 0 209 4 176 157 8 175 ------------|---------------||---------------||---------------||---------------| Saturation Flow Module: Sat/Lane: 1650 1650 1650 1650 1650 1650 1650 1650 1650 1650 1650 1650 Adjustment: 1.00 1.00 1.00 1.00 1.00 1.00 1.00 1.00 1.00 1.00 1.00 1.00 Lanes: 1.00 2.00 1.00 1.00 2.00 1.00 1.00 1.00 1.00 0.92 0.08 1.00 Final Sat.: 1650 3300 1650 1650 3300 1650 1650 1650 1650 1524 126 1650 ------------|---------------||---------------||---------------||---------------| Capacity Analysis Module: Vol/Sat: 0.04 0.12 0.00 0.03 0.24 0.00 0.13 0.00 0.11 0.10 0.06 0.11 Crit Volume: 63 390 209 175 Crit Moves: **** **** **** **** ******************************************************************************** Traffix 7.9.0415 (c) 2007 Dowling Assoc. Licensed to DKS ASSOC., OAKLAND,CA
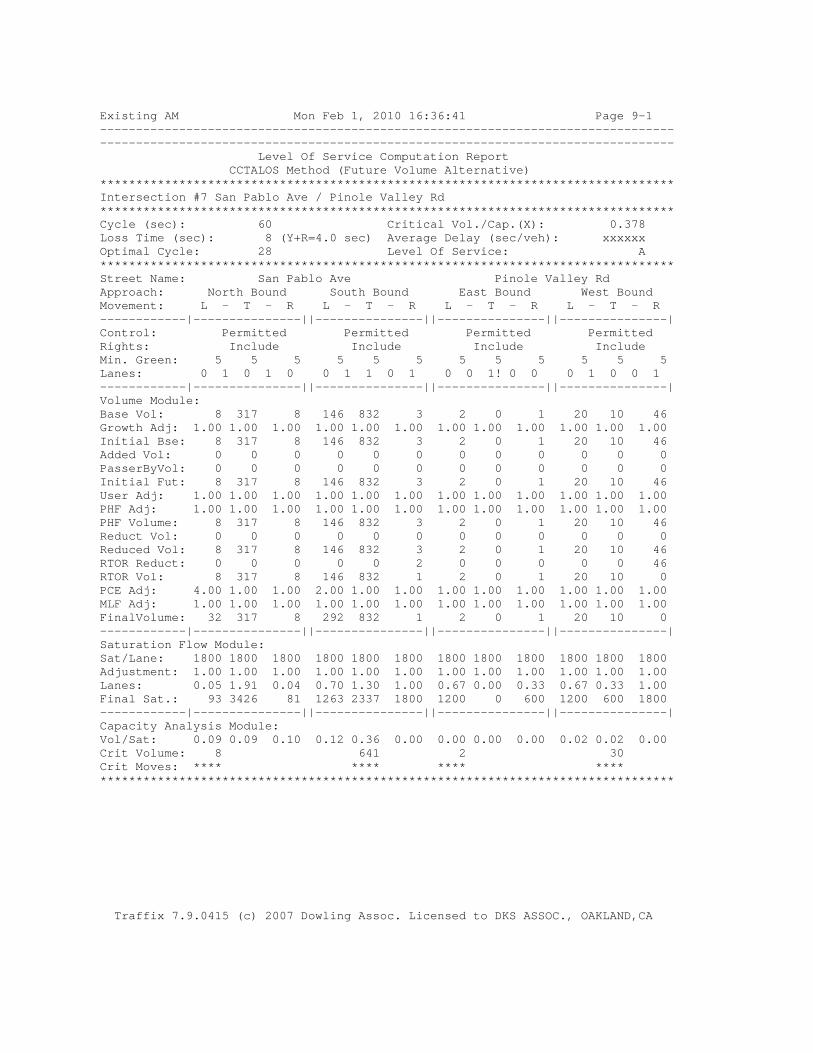
Existing AM Mon Feb 1, 2010 16:36:41 Page 9-1 -------------------------------------------------------------------------------- -------------------------------------------------------------------------------- Level Of Service Computation Report CCTALOS Method (Future Volume Alternative) ******************************************************************************** Intersection #7 San Pablo Ave / Pinole Valley Rd ******************************************************************************** Cycle (sec): 60 Critical Vol./Cap.(X): 0.378 Loss Time (sec): 8 (Y+R=4.0 sec) Average Delay (sec/veh): xxxxxx Optimal Cycle: 28 Level Of Service: A ******************************************************************************** Street Name: San Pablo Ave Pinole Valley Rd Approach: North Bound South Bound East Bound West Bound Movement: L - T - R L - T - R L - T - R L - T - R ------------|---------------||---------------||---------------||---------------| Control: Permitted Permitted Permitted Permitted Rights: Include Include Include Include Min. Green: 5 5 5 5 5 5 5 5 5 5 5 5 Lanes: 0 1 0 1 0 0 1 1 0 1 0 0 1! 0 0 0 1 0 0 1 ------------|---------------||---------------||---------------||---------------| Volume Module: Base Vol: 8 317 8 146 832 3 2 0 1 20 10 46 Growth Adj: 1.00 1.00 1.00 1.00 1.00 1.00 1.00 1.00 1.00 1.00 1.00 1.00 Initial Bse: 8 317 8 146 832 3 2 0 1 20 10 46 Added Vol: 0 0 0 0 0 0 0 0 0 0 0 0 PasserByVol: 0 0 0 0 0 0 0 0 0 0 0 0 Initial Fut: 8 317 8 146 832 3 2 0 1 20 10 46 User Adj: 1.00 1.00 1.00 1.00 1.00 1.00 1.00 1.00 1.00 1.00 1.00 1.00 PHF Adj: 1.00 1.00 1.00 1.00 1.00 1.00 1.00 1.00 1.00 1.00 1.00 1.00 PHF Volume: 8 317 8 146 832 3 2 0 1 20 10 46 Reduct Vol: 0 0 0 0 0 0 0 0 0 0 0 0 Reduced Vol: 8 317 8 146 832 3 2 0 1 20 10 46 RTOR Reduct: 0 0 0 0 0 2 0 0 0 0 0 46 RTOR Vol: 8 317 8 146 832 1 2 0 1 20 10 0 PCE Adj: 4.00 1.00 1.00 2.00 1.00 1.00 1.00 1.00 1.00 1.00 1.00 1.00 MLF Adj: 1.00 1.00 1.00 1.00 1.00 1.00 1.00 1.00 1.00 1.00 1.00 1.00 FinalVolume: 32 317 8 292 832 1 2 0 1 20 10 0 ------------|---------------||---------------||---------------||---------------| Saturation Flow Module: Sat/Lane: 1800 1800 1800 1800 1800 1800 1800 1800 1800 1800 1800 1800 Adjustment: 1.00 1.00 1.00 1.00 1.00 1.00 1.00 1.00 1.00 1.00 1.00 1.00 Lanes: 0.05 1.91 0.04 0.70 1.30 1.00 0.67 0.00 0.33 0.67 0.33 1.00 Final Sat.: 93 3426 81 1263 2337 1800 1200 0 600 1200 600 1800 ------------|---------------||---------------||---------------||---------------| Capacity Analysis Module: Vol/Sat: 0.09 0.09 0.10 0.12 0.36 0.00 0.00 0.00 0.00 0.02 0.02 0.00 Crit Volume: 8 641 2 30 Crit Moves: **** **** **** **** ******************************************************************************** Traffix 7.9.0415 (c) 2007 Dowling Assoc. Licensed to DKS ASSOC., OAKLAND,CA

Existing AM Mon Feb 1, 2010 16:36:41 Page 10-1 -------------------------------------------------------------------------------- -------------------------------------------------------------------------------- Level Of Service Computation Report CCTALOS Method (Future Volume Alternative) ******************************************************************************** Intersection #8 San Pablo Ave / Tennent Ave ******************************************************************************** Cycle (sec): 60 Critical Vol./Cap.(X): 0.536 Loss Time (sec): 8 (Y+R=4.0 sec) Average Delay (sec/veh): xxxxxx Optimal Cycle: 37 Level Of Service: A ******************************************************************************** Street Name: San Pablo Ave Tennent Ave Approach: North Bound South Bound East Bound West Bound Movement: L - T - R L - T - R L - T - R L - T - R ------------|---------------||---------------||---------------||---------------| Control: Permitted Permitted Permitted Permitted Rights: Ignore Ignore Ignore Ignore Min. Green: 0 0 0 0 0 0 0 0 0 0 0 0 Lanes: 0 1 1 0 1 0 1 0 1 0 0 0 1! 0 0 1 0 0 1 0 ------------|---------------||---------------||---------------||---------------| Volume Module: Base Vol: 16 262 188 108 1128 29 9 49 29 230 46 75 Growth Adj: 1.00 1.00 1.00 1.00 1.00 1.00 1.00 1.00 1.00 1.00 1.00 1.00 Initial Bse: 16 262 188 108 1128 29 9 49 29 230 46 75 Added Vol: 0 0 0 0 0 0 0 0 0 0 0 0 PasserByVol: 0 0 0 0 0 0 0 0 0 0 0 0 Initial Fut: 16 262 188 108 1128 29 9 49 29 230 46 75 User Adj: 1.00 1.00 1.00 1.00 1.00 1.00 1.00 1.00 1.00 1.00 1.00 1.00 PHF Adj: 1.00 1.00 1.00 1.00 1.00 1.00 1.00 1.00 1.00 1.00 1.00 1.00 PHF Volume: 16 262 188 108 1128 29 9 49 29 230 46 75 Reduct Vol: 0 0 0 0 0 0 0 0 0 0 0 0 Reduced Vol: 16 262 188 108 1128 29 9 49 29 230 46 75 RTOR Reduct: 0 0 0 0 0 0 0 0 0 0 0 0 RTOR Vol: 16 262 188 108 1128 29 9 49 29 230 46 75 PCE Adj: 6.00 1.00 1.00 1.00 1.00 1.00 1.00 1.00 1.00 1.00 1.00 1.00 MLF Adj: 1.00 1.00 1.00 1.00 1.00 1.00 1.00 1.00 1.00 1.00 1.00 1.00 FinalVolume: 96 262 188 108 1128 29 9 49 29 230 46 75 ------------|---------------||---------------||---------------||---------------| Saturation Flow Module: Sat/Lane: 1800 1800 1800 1800 1800 1800 1800 1800 1800 1800 1800 1800 Adjustment: 1.00 1.00 1.00 1.00 1.00 1.00 1.00 1.00 1.00 1.00 1.00 1.00 Lanes: 0.97 1.03 1.00 0.17 1.78 0.05 0.10 0.57 0.33 1.00 0.38 0.62 Final Sat.: 1745 1855 1800 307 3210 83 186 1014 600 1800 684 1116 ------------|---------------||---------------||---------------||---------------| Capacity Analysis Module: Vol/Sat: 0.01 0.14 0.10 0.35 0.35 0.35 0.05 0.05 0.05 0.13 0.07 0.07 Crit Volume: 16 632 87 230 Crit Moves: **** **** **** **** ******************************************************************************** Traffix 7.9.0415 (c) 2007 Dowling Assoc. Licensed to DKS ASSOC., OAKLAND,CA

Existing AM Mon Feb 1, 2010 16:36:41 Page 11-1 -------------------------------------------------------------------------------- -------------------------------------------------------------------------------- Level Of Service Computation Report CCTALOS Method (Future Volume Alternative) ******************************************************************************** Intersection #9 San Pablo Ave / Appian Wy ******************************************************************************** Cycle (sec): 60 Critical Vol./Cap.(X): 0.297 Loss Time (sec): 8 (Y+R=4.0 sec) Average Delay (sec/veh): xxxxxx Optimal Cycle: 24 Level Of Service: A ******************************************************************************** Street Name: San Pablo Ave Appian Wy Approach: North Bound South Bound East Bound West Bound Movement: L - T - R L - T - R L - T - R L - T - R ------------|---------------||---------------||---------------||---------------| Control: Permitted Permitted Permitted Permitted Rights: Include Include Include Include Min. Green: 0 0 0 0 0 0 0 0 0 0 0 0 Lanes: 1 0 2 0 1 1 0 1 1 0 1 0 0 1 0 1 0 0 1 0 ------------|---------------||---------------||---------------||---------------| Volume Module: Base Vol: 3 218 132 263 597 6 20 65 11 86 6 64 Growth Adj: 1.00 1.00 1.00 1.00 1.00 1.00 1.00 1.00 1.00 1.00 1.00 1.00 Initial Bse: 3 218 132 263 597 6 20 65 11 86 6 64 Added Vol: 0 0 0 0 0 0 0 0 0 0 0 0 PasserByVol: 0 0 0 0 0 0 0 0 0 0 0 0 Initial Fut: 3 218 132 263 597 6 20 65 11 86 6 64 User Adj: 1.00 1.00 1.00 1.00 1.00 1.00 1.00 1.00 1.00 1.00 1.00 1.00 PHF Adj: 1.00 1.00 1.00 1.00 1.00 1.00 1.00 1.00 1.00 1.00 1.00 1.00 PHF Volume: 3 218 132 263 597 6 20 65 11 86 6 64 Reduct Vol: 0 0 0 0 0 0 0 0 0 0 0 0 Reduced Vol: 3 218 132 263 597 6 20 65 11 86 6 64 RTOR Reduct: 0 0 86 0 0 0 0 0 0 0 0 0 RTOR Vol: 3 218 46 263 597 6 20 65 11 86 6 64 PCE Adj: 1.00 1.00 1.00 1.00 1.00 1.00 1.00 1.00 1.00 1.00 1.00 1.00 MLF Adj: 1.00 1.00 1.00 1.00 1.00 1.00 1.00 1.00 1.00 1.00 1.00 1.00 FinalVolume: 3 218 46 263 597 6 20 65 11 86 6 64 ------------|---------------||---------------||---------------||---------------| Saturation Flow Module: Sat/Lane: 1800 1800 1800 1800 1800 1800 1800 1800 1800 1800 1800 1800 Adjustment: 1.00 1.00 1.00 1.00 1.00 1.00 1.00 1.00 1.00 1.00 1.00 1.00 Lanes: 1.00 2.00 1.00 1.00 1.98 0.02 1.00 0.86 0.14 1.00 0.09 0.91 Final Sat.: 1800 3600 1800 1800 3564 36 1800 1539 261 1800 154 1646 ------------|---------------||---------------||---------------||---------------| Capacity Analysis Module: Vol/Sat: 0.00 0.06 0.03 0.15 0.17 0.17 0.01 0.04 0.04 0.05 0.04 0.04 Crit Volume: 109 263 76 86 Crit Moves: **** **** **** **** ******************************************************************************** Traffix 7.9.0415 (c) 2007 Dowling Assoc. Licensed to DKS ASSOC., OAKLAND,CA
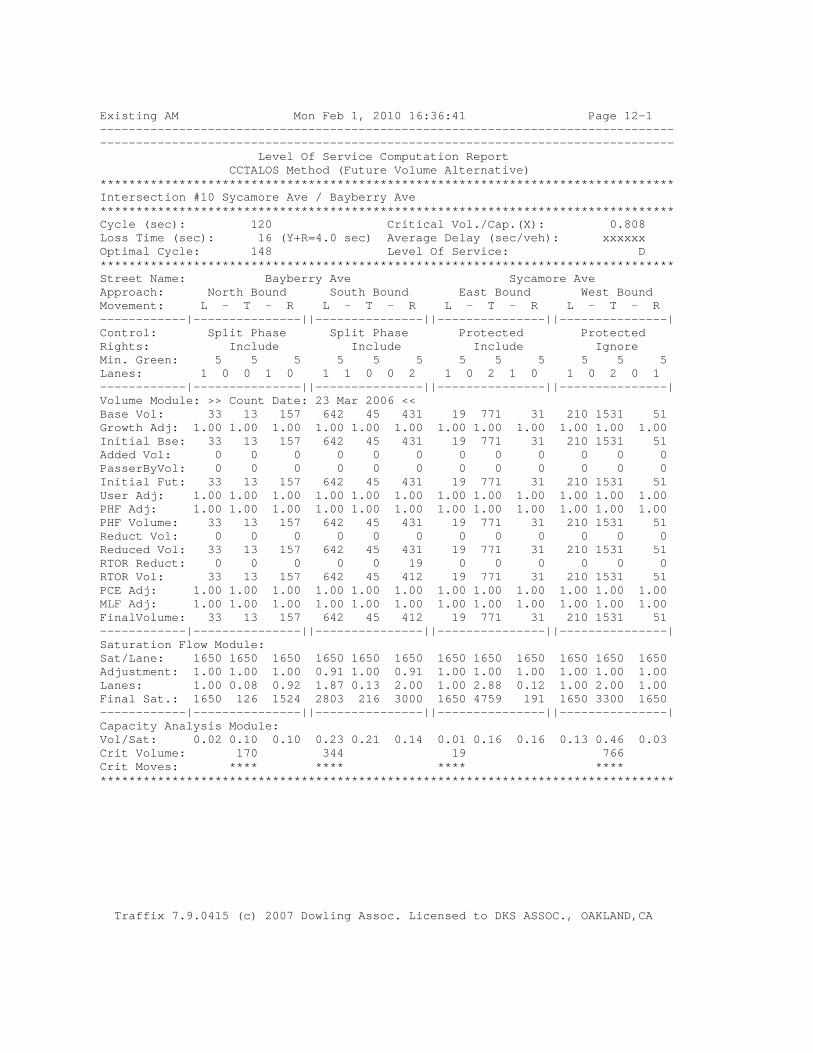
Existing AM Mon Feb 1, 2010 16:36:41 Page 12-1 -------------------------------------------------------------------------------- -------------------------------------------------------------------------------- Level Of Service Computation Report CCTALOS Method (Future Volume Alternative) ******************************************************************************** Intersection #10 Sycamore Ave / Bayberry Ave ******************************************************************************** Cycle (sec): 120 Critical Vol./Cap.(X): 0.808 Loss Time (sec): 16 (Y+R=4.0 sec) Average Delay (sec/veh): xxxxxx Optimal Cycle: 148 Level Of Service: D ******************************************************************************** Street Name: Bayberry Ave Sycamore Ave Approach: North Bound South Bound East Bound West Bound Movement: L - T - R L - T - R L - T - R L - T - R ------------|---------------||---------------||---------------||---------------| Control: Split Phase Split Phase Protected Protected Rights: Include Include Include Ignore Min. Green: 5 5 5 5 5 5 5 5 5 5 5 5 Lanes: 1 0 0 1 0 1 1 0 0 2 1 0 2 1 0 1 0 2 0 1 ------------|---------------||---------------||---------------||---------------| Volume Module: >> Count Date: 23 Mar 2006 << Base Vol: 33 13 157 642 45 431 19 771 31 210 1531 51 Growth Adj: 1.00 1.00 1.00 1.00 1.00 1.00 1.00 1.00 1.00 1.00 1.00 1.00 Initial Bse: 33 13 157 642 45 431 19 771 31 210 1531 51 Added Vol: 0 0 0 0 0 0 0 0 0 0 0 0 PasserByVol: 0 0 0 0 0 0 0 0 0 0 0 0 Initial Fut: 33 13 157 642 45 431 19 771 31 210 1531 51 User Adj: 1.00 1.00 1.00 1.00 1.00 1.00 1.00 1.00 1.00 1.00 1.00 1.00 PHF Adj: 1.00 1.00 1.00 1.00 1.00 1.00 1.00 1.00 1.00 1.00 1.00 1.00 PHF Volume: 33 13 157 642 45 431 19 771 31 210 1531 51 Reduct Vol: 0 0 0 0 0 0 0 0 0 0 0 0 Reduced Vol: 33 13 157 642 45 431 19 771 31 210 1531 51 RTOR Reduct: 0 0 0 0 0 19 0 0 0 0 0 0 RTOR Vol: 33 13 157 642 45 412 19 771 31 210 1531 51 PCE Adj: 1.00 1.00 1.00 1.00 1.00 1.00 1.00 1.00 1.00 1.00 1.00 1.00 MLF Adj: 1.00 1.00 1.00 1.00 1.00 1.00 1.00 1.00 1.00 1.00 1.00 1.00 FinalVolume: 33 13 157 642 45 412 19 771 31 210 1531 51 ------------|---------------||---------------||---------------||---------------| Saturation Flow Module: Sat/Lane: 1650 1650 1650 1650 1650 1650 1650 1650 1650 1650 1650 1650 Adjustment: 1.00 1.00 1.00 0.91 1.00 0.91 1.00 1.00 1.00 1.00 1.00 1.00 Lanes: 1.00 0.08 0.92 1.87 0.13 2.00 1.00 2.88 0.12 1.00 2.00 1.00 Final Sat.: 1650 126 1524 2803 216 3000 1650 4759 191 1650 3300 1650 ------------|---------------||---------------||---------------||---------------| Capacity Analysis Module: Vol/Sat: 0.02 0.10 0.10 0.23 0.21 0.14 0.01 0.16 0.16 0.13 0.46 0.03 Crit Volume: 170 344 19 766 Crit Moves: **** **** **** **** ******************************************************************************** Traffix 7.9.0415 (c) 2007 Dowling Assoc. Licensed to DKS ASSOC., OAKLAND,CA

P.M. PEAK

Existing PM Mon Feb 1, 2010 16:36:52 Page 3-1 -------------------------------------------------------------------------------- -------------------------------------------------------------------------------- Level Of Service Computation Report CCTALOS Method (Future Volume Alternative) ******************************************************************************** Intersection #1 Willow Ave / I-80 WB Off-ramp ******************************************************************************** Cycle (sec): 90 Critical Vol./Cap.(X): 0.280 Loss Time (sec): 8 (Y+R=4.0 sec) Average Delay (sec/veh): xxxxxx Optimal Cycle: 24 Level Of Service: A ******************************************************************************** Street Name: I-80 WB Off-ramp Willow Ave Approach: North Bound South Bound East Bound West Bound Movement: L - T - R L - T - R L - T - R L - T - R ------------|---------------||---------------||---------------||---------------| Control: Protected Protected Protected Protected Rights: Include Include Ignore Ignore Min. Green: 5 5 5 5 5 5 5 5 5 5 5 5 Lanes: 0 0 0 0 0 1 0 0 0 1 0 0 2 0 0 0 0 2 0 0 ------------|---------------||---------------||---------------||---------------| Volume Module: Base Vol: 0 0 0 103 0 84 0 301 0 0 757 0 Growth Adj: 1.00 1.00 1.00 1.00 1.00 1.00 1.00 1.00 1.00 1.00 1.00 1.00 Initial Bse: 0 0 0 103 0 84 0 301 0 0 757 0 Added Vol: 0 0 0 0 0 0 0 0 0 0 0 0 PasserByVol: 0 0 0 0 0 0 0 0 0 0 0 0 Initial Fut: 0 0 0 103 0 84 0 301 0 0 757 0 User Adj: 1.00 1.00 1.00 1.00 1.00 1.00 1.00 1.00 1.00 1.00 1.00 1.00 PHF Adj: 1.00 1.00 1.00 1.00 1.00 1.00 1.00 1.00 1.00 1.00 1.00 1.00 PHF Volume: 0 0 0 103 0 84 0 301 0 0 757 0 Reduct Vol: 0 0 0 0 0 0 0 0 0 0 0 0 Reduced Vol: 0 0 0 103 0 84 0 301 0 0 757 0 RTOR Reduct: 0 0 0 0 0 0 0 0 0 0 0 0 RTOR Vol: 0 0 0 103 0 84 0 301 0 0 757 0 PCE Adj: 1.00 1.00 1.00 1.00 1.00 1.00 1.00 1.00 1.00 1.00 1.00 1.00 MLF Adj: 1.00 1.00 1.00 1.00 1.00 1.00 1.00 1.00 1.00 1.00 1.00 1.00 FinalVolume: 0 0 0 103 0 84 0 301 0 0 757 0 ------------|---------------||---------------||---------------||---------------| Saturation Flow Module: Sat/Lane: 1720 1720 1720 1720 1720 1720 1720 1720 1720 1720 1720 1720 Adjustment: 1.00 1.00 1.00 1.00 1.00 1.00 1.00 1.00 1.00 1.00 1.00 1.00 Lanes: 0.00 0.00 0.00 1.00 0.00 1.00 0.00 2.00 0.00 0.00 2.00 0.00 Final Sat.: 0 0 0 1720 0 1720 0 3440 0 0 3440 0 ------------|---------------||---------------||---------------||---------------| Capacity Analysis Module: Vol/Sat: 0.00 0.00 0.00 0.06 0.00 0.05 0.00 0.09 0.00 0.00 0.22 0.00 Crit Volume: 0 103 0 379 Crit Moves: **** **** **** ******************************************************************************** Traffix 7.9.0415 (c) 2007 Dowling Assoc. Licensed to DKS ASSOC., OAKLAND,CA

Existing PM Mon Feb 1, 2010 16:36:52 Page 4-1 -------------------------------------------------------------------------------- -------------------------------------------------------------------------------- Level Of Service Computation Report CCTALOS Method (Future Volume Alternative) ******************************************************************************** Intersection #2 Willow Ave / Hawthorne Ave ******************************************************************************** Cycle (sec): 90 Critical Vol./Cap.(X): 0.219 Loss Time (sec): 8 (Y+R=4.0 sec) Average Delay (sec/veh): xxxxxx Optimal Cycle: 23 Level Of Service: A ******************************************************************************** Street Name: Hawthorne Ave Willow Ave Approach: North Bound South Bound East Bound West Bound Movement: L - T - R L - T - R L - T - R L - T - R ------------|---------------||---------------||---------------||---------------| Control: Protected Protected Protected Protected Rights: Include Include Include Include Min. Green: 0 0 0 5 5 5 5 5 0 0 5 5 Lanes: 0 0 0 0 0 0 0 2! 0 0 1 0 2 0 0 0 0 1 1 0 ------------|---------------||---------------||---------------||---------------| Volume Module: Base Vol: 0 0 0 75 0 9 36 466 0 0 408 122 Growth Adj: 1.00 1.00 1.00 1.00 1.00 1.00 1.00 1.00 1.00 1.00 1.00 1.00 Initial Bse: 0 0 0 75 0 9 36 466 0 0 408 122 Added Vol: 0 0 0 0 0 0 0 0 0 0 0 0 PasserByVol: 0 0 0 0 0 0 0 0 0 0 0 0 Initial Fut: 0 0 0 75 0 9 36 466 0 0 408 122 User Adj: 1.00 1.00 1.00 1.00 1.00 1.00 1.00 1.00 1.00 1.00 1.00 1.00 PHF Adj: 1.00 1.00 1.00 1.00 1.00 1.00 1.00 1.00 1.00 1.00 1.00 1.00 PHF Volume: 0 0 0 75 0 9 36 466 0 0 408 122 Reduct Vol: 0 0 0 0 0 0 0 0 0 0 0 0 Reduced Vol: 0 0 0 75 0 9 36 466 0 0 408 122 RTOR Reduct: 0 0 0 0 0 0 0 0 0 0 0 0 RTOR Vol: 0 0 0 75 0 9 36 466 0 0 408 122 PCE Adj: 1.00 1.00 1.00 1.00 1.00 1.00 1.00 1.00 1.00 1.00 1.00 1.00 MLF Adj: 1.00 1.00 1.00 1.00 1.00 1.00 1.00 1.00 1.00 1.00 1.00 1.00 FinalVolume: 0 0 0 75 0 9 36 466 0 0 408 122 ------------|---------------||---------------||---------------||---------------| Saturation Flow Module: Sat/Lane: 1720 1720 1720 1720 1720 1720 1720 1720 1720 1720 1720 1720 Adjustment: 1.00 1.00 1.00 1.00 1.00 1.00 1.00 1.00 1.00 1.00 1.00 1.00 Lanes: 0.00 0.00 0.00 1.00 0.79 0.21 1.00 2.00 0.00 0.00 1.54 0.46 Final Sat.: 0 0 0 1720 1351 369 1720 3440 0 0 2648 792 ------------|---------------||---------------||---------------||---------------| Capacity Analysis Module: Vol/Sat: 0.00 0.00 0.00 0.04 0.00 0.02 0.02 0.14 0.00 0.00 0.15 0.15 Crit Volume: 0 75 36 265 Crit Moves: **** **** **** ******************************************************************************** Traffix 7.9.0415 (c) 2007 Dowling Assoc. Licensed to DKS ASSOC., OAKLAND,CA

Existing PM Mon Feb 1, 2010 16:36:53 Page 5-1 -------------------------------------------------------------------------------- -------------------------------------------------------------------------------- Level Of Service Computation Report CCTALOS Method (Future Volume Alternative) ******************************************************************************** Intersection #3 San Pablo Ave / Willow Ave ******************************************************************************** Cycle (sec): 90 Critical Vol./Cap.(X): 0.438 Loss Time (sec): 12 (Y+R=4.0 sec) Average Delay (sec/veh): xxxxxx Optimal Cycle: 41 Level Of Service: A ******************************************************************************** Street Name: San Pablo Ave Willow Ave Approach: North Bound South Bound East Bound West Bound Movement: L - T - R L - T - R L - T - R L - T - R ------------|---------------||---------------||---------------||---------------| Control: Permitted Permitted Split Phase Split Phase Rights: Include Include Ignore Include Min. Green: 5 5 5 5 5 5 5 5 5 5 5 5 Lanes: 2 0 0 0 1 0 0 0 0 0 0 0 1 1 0 1 0 2 0 0 ------------|---------------||---------------||---------------||---------------| Volume Module: Base Vol: 399 0 146 0 0 0 0 362 199 126 508 0 Growth Adj: 1.00 1.00 1.00 1.00 1.00 1.00 1.00 1.00 1.00 1.00 1.00 1.00 Initial Bse: 399 0 146 0 0 0 0 362 199 126 508 0 Added Vol: 0 0 0 0 0 0 0 0 0 0 0 0 PasserByVol: 0 0 0 0 0 0 0 0 0 0 0 0 Initial Fut: 399 0 146 0 0 0 0 362 199 126 508 0 User Adj: 1.00 1.00 1.00 1.00 1.00 1.00 1.00 1.00 1.00 1.00 1.00 1.00 PHF Adj: 1.00 1.00 1.00 1.00 1.00 1.00 1.00 1.00 1.00 1.00 1.00 1.00 PHF Volume: 399 0 146 0 0 0 0 362 199 126 508 0 Reduct Vol: 0 0 0 0 0 0 0 0 0 0 0 0 Reduced Vol: 399 0 146 0 0 0 0 362 199 126 508 0 RTOR Reduct: 0 0 126 0 0 0 0 0 0 0 0 0 RTOR Vol: 399 0 20 0 0 0 0 362 199 126 508 0 PCE Adj: 1.00 1.00 1.00 1.00 1.00 1.00 1.00 1.00 1.00 1.00 1.00 1.00 MLF Adj: 1.00 1.00 1.00 1.00 1.00 1.00 1.00 1.00 1.00 1.00 1.00 1.00 FinalVolume: 399 0 20 0 0 0 0 362 199 126 508 0 ------------|---------------||---------------||---------------||---------------| Saturation Flow Module: Sat/Lane: 1720 1720 1720 1720 1720 1720 1720 1720 1720 1720 1720 1720 Adjustment: 0.91 1.00 1.00 1.00 1.00 1.00 1.00 1.00 1.00 1.00 1.00 1.00 Lanes: 2.00 0.00 1.00 0.00 0.00 0.00 0.00 1.29 0.71 1.00 2.00 0.00 Final Sat.: 3127 0 1720 0 0 0 0 2220 1220 1720 3440 0 ------------|---------------||---------------||---------------||---------------| Capacity Analysis Module: Vol/Sat: 0.13 0.00 0.01 0.00 0.00 0.00 0.00 0.16 0.16 0.07 0.15 0.00 Crit Volume: 200 0 280 254 Crit Moves: **** **** **** ******************************************************************************** Traffix 7.9.0415 (c) 2007 Dowling Assoc. Licensed to DKS ASSOC., OAKLAND,CA

Existing PM Mon Feb 1, 2010 16:36:53 Page 6-1 -------------------------------------------------------------------------------- -------------------------------------------------------------------------------- Level Of Service Computation Report CCTALOS Method (Future Volume Alternative) ******************************************************************************** Intersection #4 San Pablo Ave / John Muir Pkwy ******************************************************************************** Cycle (sec): 120 Critical Vol./Cap.(X): 0.594 Loss Time (sec): 16 (Y+R=4.0 sec) Average Delay (sec/veh): xxxxxx Optimal Cycle: 70 Level Of Service: A ******************************************************************************** Street Name: San Pablo Ave John Muir Pkwy Approach: North Bound South Bound East Bound West Bound Movement: L - T - R L - T - R L - T - R L - T - R ------------|---------------||---------------||---------------||---------------| Control: Protected Protected Protected Protected Rights: Ignore Include Include Include Min. Green: 5 5 5 5 5 5 5 5 5 5 5 5 Lanes: 1 0 2 0 1 1 0 1 1 0 1 0 1 1 0 2 0 0 1 0 ------------|---------------||---------------||---------------||---------------| Volume Module: Base Vol: 57 625 1032 161 275 7 11 372 129 467 13 30 Growth Adj: 1.00 1.00 1.00 1.00 1.00 1.00 1.00 1.00 1.00 1.00 1.00 1.00 Initial Bse: 57 625 1032 161 275 7 11 372 129 467 13 30 Added Vol: 0 0 0 0 0 0 0 0 0 0 0 0 PasserByVol: 0 0 0 0 0 0 0 0 0 0 0 0 Initial Fut: 57 625 1032 161 275 7 11 372 129 467 13 30 User Adj: 1.00 1.00 1.00 1.00 1.00 1.00 1.00 1.00 1.00 1.00 1.00 1.00 PHF Adj: 1.00 1.00 1.00 1.00 1.00 1.00 1.00 1.00 1.00 1.00 1.00 1.00 PHF Volume: 57 625 1032 161 275 7 11 372 129 467 13 30 Reduct Vol: 0 0 0 0 0 0 0 0 0 0 0 0 Reduced Vol: 57 625 1032 161 275 7 11 372 129 467 13 30 RTOR Reduct: 0 0 0 0 0 0 0 0 0 0 0 0 RTOR Vol: 57 625 1032 161 275 7 11 372 129 467 13 30 PCE Adj: 1.00 1.00 1.00 1.00 1.00 1.00 1.00 1.00 1.00 1.00 1.00 1.00 MLF Adj: 1.00 1.00 1.00 1.00 1.00 1.00 1.00 1.00 1.00 1.00 1.00 1.00 FinalVolume: 57 625 1032 161 275 7 11 372 129 467 13 30 ------------|---------------||---------------||---------------||---------------| Saturation Flow Module: Sat/Lane: 1650 1650 1650 1650 1650 1650 1650 1650 1650 1650 1650 1650 Adjustment: 1.00 1.00 1.00 1.00 1.00 1.00 1.00 1.00 1.00 0.91 1.00 1.00 Lanes: 1.00 2.00 1.00 1.00 1.95 0.05 1.00 1.49 0.51 2.00 0.30 0.70 Final Sat.: 1650 3300 1650 1650 3218 82 1650 2450 850 3000 499 1151 ------------|---------------||---------------||---------------||---------------| Capacity Analysis Module: Vol/Sat: 0.03 0.19 0.63 0.10 0.09 0.09 0.01 0.15 0.15 0.16 0.03 0.03 Crit Volume: 313 161 251 234 Crit Moves: **** **** **** **** ******************************************************************************** Traffix 7.9.0415 (c) 2007 Dowling Assoc. Licensed to DKS ASSOC., OAKLAND,CA

Existing PM Mon Feb 1, 2010 16:36:53 Page 7-1 -------------------------------------------------------------------------------- -------------------------------------------------------------------------------- Level Of Service Computation Report CCTALOS Method (Future Volume Alternative) ******************************************************************************** Intersection #5 San Pablo Ave / Sycamore Ave ******************************************************************************** Cycle (sec): 120 Critical Vol./Cap.(X): 0.616 Loss Time (sec): 16 (Y+R=4.0 sec) Average Delay (sec/veh): xxxxxx Optimal Cycle: 74 Level Of Service: B ******************************************************************************** Street Name: San Pablo Ave Sycamore Ave Approach: North Bound South Bound East Bound West Bound Movement: L - T - R L - T - R L - T - R L - T - R ------------|---------------||---------------||---------------||---------------| Control: Protected Protected Split Phase Split Phase Rights: Include Include Include Include Min. Green: 5 5 5 5 5 5 5 5 5 5 5 5 Lanes: 2 0 2 0 1 2 0 1 1 0 1 0 1 1 0 1 1 0 0 2 ------------|---------------||---------------||---------------||---------------| Volume Module: Base Vol: 37 791 461 504 376 311 84 51 15 225 85 748 Growth Adj: 1.00 1.00 1.00 1.00 1.00 1.00 1.00 1.00 1.00 1.00 1.00 1.00 Initial Bse: 37 791 461 504 376 311 84 51 15 225 85 748 Added Vol: 0 0 0 0 0 0 0 0 0 0 0 0 PasserByVol: 0 0 0 0 0 0 0 0 0 0 0 0 Initial Fut: 37 791 461 504 376 311 84 51 15 225 85 748 User Adj: 1.00 1.00 1.00 1.00 1.00 1.00 1.00 1.00 1.00 1.00 1.00 1.00 PHF Adj: 1.00 1.00 1.00 1.00 1.00 1.00 1.00 1.00 1.00 1.00 1.00 1.00 PHF Volume: 37 791 461 504 376 311 84 51 15 225 85 748 Reduct Vol: 0 0 0 0 0 0 0 0 0 0 0 0 Reduced Vol: 37 791 461 504 376 311 84 51 15 225 85 748 RTOR Reduct: 0 0 124 0 0 0 0 0 0 0 0 277 RTOR Vol: 37 791 337 504 376 311 84 51 15 225 85 471 PCE Adj: 1.00 1.00 1.00 1.00 1.00 1.00 1.00 1.00 1.00 1.00 1.00 1.00 MLF Adj: 1.00 1.00 1.00 1.00 1.00 1.00 1.00 1.00 1.00 1.00 1.00 1.00 FinalVolume: 37 791 337 504 376 311 84 51 15 225 85 471 ------------|---------------||---------------||---------------||---------------| Saturation Flow Module: Sat/Lane: 1650 1650 1650 1650 1650 1650 1650 1650 1650 1650 1650 1650 Adjustment: 0.91 1.00 1.00 0.91 1.00 1.00 1.00 1.00 1.00 0.91 1.00 0.91 Lanes: 2.00 2.00 1.00 2.00 1.09 0.91 1.00 1.55 0.45 1.45 0.55 2.00 Final Sat.: 3000 3300 1650 3000 1806 1494 1650 2550 750 2177 905 3000 ------------|---------------||---------------||---------------||---------------| Capacity Analysis Module: Vol/Sat: 0.01 0.24 0.20 0.17 0.21 0.21 0.05 0.02 0.02 0.10 0.09 0.16 Crit Volume: 396 252 84 235 Crit Moves: **** **** **** **** ******************************************************************************** Traffix 7.9.0415 (c) 2007 Dowling Assoc. Licensed to DKS ASSOC., OAKLAND,CA

Existing PM Mon Feb 1, 2010 16:36:53 Page 8-1 -------------------------------------------------------------------------------- -------------------------------------------------------------------------------- Level Of Service Computation Report CCTALOS Method (Future Volume Alternative) ******************************************************************************** Intersection #6 San Pablo Ave / Hercules Ave ******************************************************************************** Cycle (sec): 120 Critical Vol./Cap.(X): 0.430 Loss Time (sec): 16 (Y+R=4.0 sec) Average Delay (sec/veh): xxxxxx Optimal Cycle: 50 Level Of Service: A ******************************************************************************** Street Name: San Pablo Ave Hercules Ave Approach: North Bound South Bound East Bound West Bound Movement: L - T - R L - T - R L - T - R L - T - R ------------|---------------||---------------||---------------||---------------| Control: Protected Protected Split Phase Split Phase Rights: Include Include Include Include Min. Green: 5 5 5 5 5 5 5 5 5 5 5 5 Lanes: 1 0 2 0 1 1 0 2 0 1 1 0 1 0 1 0 1 0 1 0 ------------|---------------||---------------||---------------||---------------| Volume Module: Base Vol: 211 885 123 115 416 135 88 7 89 63 6 58 Growth Adj: 1.00 1.00 1.00 1.00 1.00 1.00 1.00 1.00 1.00 1.00 1.00 1.00 Initial Bse: 211 885 123 115 416 135 88 7 89 63 6 58 Added Vol: 0 0 0 0 0 0 0 0 0 0 0 0 PasserByVol: 0 0 0 0 0 0 0 0 0 0 0 0 Initial Fut: 211 885 123 115 416 135 88 7 89 63 6 58 User Adj: 1.00 1.00 1.00 1.00 1.00 1.00 1.00 1.00 1.00 1.00 1.00 1.00 PHF Adj: 1.00 1.00 1.00 1.00 1.00 1.00 1.00 1.00 1.00 1.00 1.00 1.00 PHF Volume: 211 885 123 115 416 135 88 7 89 63 6 58 Reduct Vol: 0 0 0 0 0 0 0 0 0 0 0 0 Reduced Vol: 211 885 123 115 416 135 88 7 89 63 6 58 RTOR Reduct: 0 0 63 0 0 88 0 0 89 0 0 0 RTOR Vol: 211 885 60 115 416 47 88 7 0 63 6 58 PCE Adj: 1.00 1.00 1.00 1.00 1.00 1.00 1.00 1.00 1.00 1.00 1.00 1.00 MLF Adj: 1.00 1.00 1.00 1.00 1.00 1.00 1.00 1.00 1.00 1.00 1.00 1.00 FinalVolume: 211 885 60 115 416 47 88 7 0 63 6 58 ------------|---------------||---------------||---------------||---------------| Saturation Flow Module: Sat/Lane: 1650 1650 1650 1650 1650 1650 1650 1650 1650 1650 1650 1650 Adjustment: 1.00 1.00 1.00 1.00 1.00 1.00 1.00 1.00 1.00 1.00 1.00 1.00 Lanes: 1.00 2.00 1.00 1.00 2.00 1.00 1.00 1.00 1.00 1.00 0.09 0.91 Final Sat.: 1650 3300 1650 1650 3300 1650 1650 1650 1650 1637 156 1507 ------------|---------------||---------------||---------------||---------------| Capacity Analysis Module: Vol/Sat: 0.13 0.27 0.04 0.07 0.13 0.03 0.05 0.00 0.00 0.04 0.04 0.04 Crit Volume: 443 115 88 64 Crit Moves: **** **** **** **** ******************************************************************************** Traffix 7.9.0415 (c) 2007 Dowling Assoc. Licensed to DKS ASSOC., OAKLAND,CA
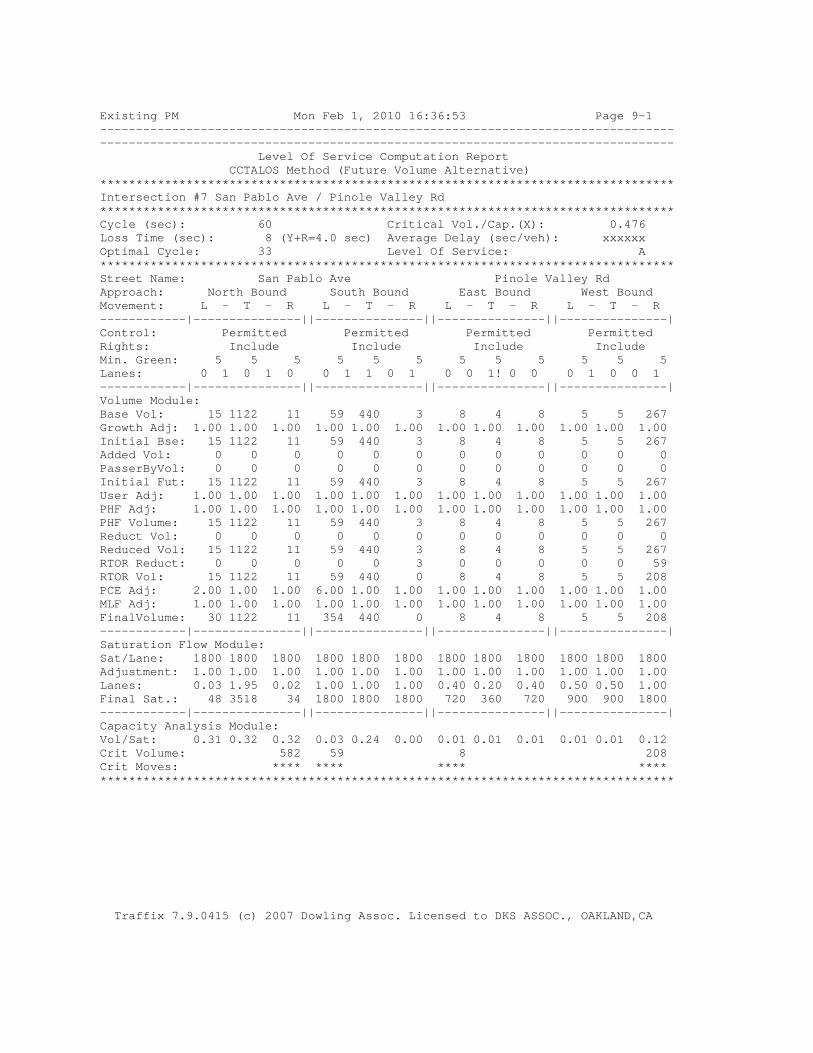
Existing PM Mon Feb 1, 2010 16:36:53 Page 9-1 -------------------------------------------------------------------------------- -------------------------------------------------------------------------------- Level Of Service Computation Report CCTALOS Method (Future Volume Alternative) ******************************************************************************** Intersection #7 San Pablo Ave / Pinole Valley Rd ******************************************************************************** Cycle (sec): 60 Critical Vol./Cap.(X): 0.476 Loss Time (sec): 8 (Y+R=4.0 sec) Average Delay (sec/veh): xxxxxx Optimal Cycle: 33 Level Of Service: A ******************************************************************************** Street Name: San Pablo Ave Pinole Valley Rd Approach: North Bound South Bound East Bound West Bound Movement: L - T - R L - T - R L - T - R L - T - R ------------|---------------||---------------||---------------||---------------| Control: Permitted Permitted Permitted Permitted Rights: Include Include Include Include Min. Green: 5 5 5 5 5 5 5 5 5 5 5 5 Lanes: 0 1 0 1 0 0 1 1 0 1 0 0 1! 0 0 0 1 0 0 1 ------------|---------------||---------------||---------------||---------------| Volume Module: Base Vol: 15 1122 11 59 440 3 8 4 8 5 5 267 Growth Adj: 1.00 1.00 1.00 1.00 1.00 1.00 1.00 1.00 1.00 1.00 1.00 1.00 Initial Bse: 15 1122 11 59 440 3 8 4 8 5 5 267 Added Vol: 0 0 0 0 0 0 0 0 0 0 0 0 PasserByVol: 0 0 0 0 0 0 0 0 0 0 0 0 Initial Fut: 15 1122 11 59 440 3 8 4 8 5 5 267 User Adj: 1.00 1.00 1.00 1.00 1.00 1.00 1.00 1.00 1.00 1.00 1.00 1.00 PHF Adj: 1.00 1.00 1.00 1.00 1.00 1.00 1.00 1.00 1.00 1.00 1.00 1.00 PHF Volume: 15 1122 11 59 440 3 8 4 8 5 5 267 Reduct Vol: 0 0 0 0 0 0 0 0 0 0 0 0 Reduced Vol: 15 1122 11 59 440 3 8 4 8 5 5 267 RTOR Reduct: 0 0 0 0 0 3 0 0 0 0 0 59 RTOR Vol: 15 1122 11 59 440 0 8 4 8 5 5 208 PCE Adj: 2.00 1.00 1.00 6.00 1.00 1.00 1.00 1.00 1.00 1.00 1.00 1.00 MLF Adj: 1.00 1.00 1.00 1.00 1.00 1.00 1.00 1.00 1.00 1.00 1.00 1.00 FinalVolume: 30 1122 11 354 440 0 8 4 8 5 5 208 ------------|---------------||---------------||---------------||---------------| Saturation Flow Module: Sat/Lane: 1800 1800 1800 1800 1800 1800 1800 1800 1800 1800 1800 1800 Adjustment: 1.00 1.00 1.00 1.00 1.00 1.00 1.00 1.00 1.00 1.00 1.00 1.00 Lanes: 0.03 1.95 0.02 1.00 1.00 1.00 0.40 0.20 0.40 0.50 0.50 1.00 Final Sat.: 48 3518 34 1800 1800 1800 720 360 720 900 900 1800 ------------|---------------||---------------||---------------||---------------| Capacity Analysis Module: Vol/Sat: 0.31 0.32 0.32 0.03 0.24 0.00 0.01 0.01 0.01 0.01 0.01 0.12 Crit Volume: 582 59 8 208 Crit Moves: **** **** **** **** ******************************************************************************** Traffix 7.9.0415 (c) 2007 Dowling Assoc. Licensed to DKS ASSOC., OAKLAND,CA

Existing PM Mon Feb 1, 2010 16:36:53 Page 10-1 -------------------------------------------------------------------------------- -------------------------------------------------------------------------------- Level Of Service Computation Report CCTALOS Method (Future Volume Alternative) ******************************************************************************** Intersection #8 San Pablo Ave / Tennent Ave ******************************************************************************** Cycle (sec): 60 Critical Vol./Cap.(X): 0.559 Loss Time (sec): 8 (Y+R=4.0 sec) Average Delay (sec/veh): xxxxxx Optimal Cycle: 39 Level Of Service: A ******************************************************************************** Street Name: San Pablo Ave Tennent Ave Approach: North Bound South Bound East Bound West Bound Movement: L - T - R L - T - R L - T - R L - T - R ------------|---------------||---------------||---------------||---------------| Control: Permitted Permitted Permitted Permitted Rights: Ignore Ignore Ignore Ignore Min. Green: 0 0 0 0 0 0 0 0 0 0 0 0 Lanes: 0 1 1 0 1 0 1 0 1 0 0 0 1! 0 0 1 0 0 1 0 ------------|---------------||---------------||---------------||---------------| Volume Module: Base Vol: 47 1373 144 36 251 34 43 30 9 139 72 146 Growth Adj: 1.00 1.00 1.00 1.00 1.00 1.00 1.00 1.00 1.00 1.00 1.00 1.00 Initial Bse: 47 1373 144 36 251 34 43 30 9 139 72 146 Added Vol: 0 0 0 0 0 0 0 0 0 0 0 0 PasserByVol: 0 0 0 0 0 0 0 0 0 0 0 0 Initial Fut: 47 1373 144 36 251 34 43 30 9 139 72 146 User Adj: 1.00 1.00 1.00 1.00 1.00 1.00 1.00 1.00 1.00 1.00 1.00 1.00 PHF Adj: 1.00 1.00 1.00 1.00 1.00 1.00 1.00 1.00 1.00 1.00 1.00 1.00 PHF Volume: 47 1373 144 36 251 34 43 30 9 139 72 146 Reduct Vol: 0 0 0 0 0 0 0 0 0 0 0 0 Reduced Vol: 47 1373 144 36 251 34 43 30 9 139 72 146 RTOR Reduct: 0 0 0 0 0 0 0 0 0 0 0 0 RTOR Vol: 47 1373 144 36 251 34 43 30 9 139 72 146 PCE Adj: 1.00 1.00 1.00 6.00 1.00 1.00 1.00 1.00 1.00 1.00 1.00 1.00 MLF Adj: 1.00 1.00 1.00 1.00 1.00 1.00 1.00 1.00 1.00 1.00 1.00 1.00 FinalVolume: 47 1373 144 216 251 34 43 30 9 139 72 146 ------------|---------------||---------------||---------------||---------------| Saturation Flow Module: Sat/Lane: 1800 1800 1800 1800 1800 1800 1800 1800 1800 1800 1800 1800 Adjustment: 1.00 1.00 1.00 1.00 1.00 1.00 1.00 1.00 1.00 1.00 1.00 1.00 Lanes: 0.07 1.93 1.00 0.51 1.35 0.14 0.52 0.37 0.11 1.00 0.33 0.67 Final Sat.: 119 3481 1800 919 2437 244 944 659 198 1800 594 1206 ------------|---------------||---------------||---------------||---------------| Capacity Analysis Module: Vol/Sat: 0.39 0.39 0.08 0.04 0.10 0.14 0.05 0.05 0.05 0.08 0.12 0.12 Crit Volume: 710 36 43 218 Crit Moves: **** **** **** **** ******************************************************************************** Traffix 7.9.0415 (c) 2007 Dowling Assoc. Licensed to DKS ASSOC., OAKLAND,CA

Existing PM Mon Feb 1, 2010 16:36:53 Page 11-1 -------------------------------------------------------------------------------- -------------------------------------------------------------------------------- Level Of Service Computation Report CCTALOS Method (Future Volume Alternative) ******************************************************************************** Intersection #9 San Pablo Ave / Appian Wy ******************************************************************************** Cycle (sec): 60 Critical Vol./Cap.(X): 0.565 Loss Time (sec): 8 (Y+R=4.0 sec) Average Delay (sec/veh): xxxxxx Optimal Cycle: 40 Level Of Service: A ******************************************************************************** Street Name: San Pablo Ave Appian Wy Approach: North Bound South Bound East Bound West Bound Movement: L - T - R L - T - R L - T - R L - T - R ------------|---------------||---------------||---------------||---------------| Control: Permitted Permitted Permitted Permitted Rights: Include Include Include Include Min. Green: 0 0 0 0 0 0 0 0 0 0 0 0 Lanes: 1 0 2 0 1 1 0 1 1 0 1 0 0 1 0 1 0 0 1 0 ------------|---------------||---------------||---------------||---------------| Volume Module: Base Vol: 5 901 195 163 311 35 43 53 6 242 68 293 Growth Adj: 1.00 1.00 1.00 1.00 1.00 1.00 1.00 1.00 1.00 1.00 1.00 1.00 Initial Bse: 5 901 195 163 311 35 43 53 6 242 68 293 Added Vol: 0 0 0 0 0 0 0 0 0 0 0 0 PasserByVol: 0 0 0 0 0 0 0 0 0 0 0 0 Initial Fut: 5 901 195 163 311 35 43 53 6 242 68 293 User Adj: 1.00 1.00 1.00 1.00 1.00 1.00 1.00 1.00 1.00 1.00 1.00 1.00 PHF Adj: 1.00 1.00 1.00 1.00 1.00 1.00 1.00 1.00 1.00 1.00 1.00 1.00 PHF Volume: 5 901 195 163 311 35 43 53 6 242 68 293 Reduct Vol: 0 0 0 0 0 0 0 0 0 0 0 0 Reduced Vol: 5 901 195 163 311 35 43 53 6 242 68 293 RTOR Reduct: 0 0 195 0 0 0 0 0 0 0 0 0 RTOR Vol: 5 901 0 163 311 35 43 53 6 242 68 293 PCE Adj: 1.00 1.00 1.00 1.00 1.00 1.00 1.00 1.00 1.00 1.00 1.00 1.00 MLF Adj: 1.00 1.00 1.00 1.00 1.00 1.00 1.00 1.00 1.00 1.00 1.00 1.00 FinalVolume: 5 901 0 163 311 35 43 53 6 242 68 293 ------------|---------------||---------------||---------------||---------------| Saturation Flow Module: Sat/Lane: 1800 1800 1800 1800 1800 1800 1800 1800 1800 1800 1800 1800 Adjustment: 1.00 1.00 1.00 1.00 1.00 1.00 1.00 1.00 1.00 1.00 1.00 1.00 Lanes: 1.00 2.00 1.00 1.00 1.80 0.20 1.00 0.90 0.10 1.00 0.19 0.81 Final Sat.: 1800 3600 1800 1800 3236 364 1800 1617 183 1800 339 1461 ------------|---------------||---------------||---------------||---------------| Capacity Analysis Module: Vol/Sat: 0.00 0.25 0.00 0.09 0.10 0.10 0.02 0.03 0.03 0.13 0.20 0.20 Crit Volume: 451 163 43 361 Crit Moves: **** **** **** **** ******************************************************************************** Traffix 7.9.0415 (c) 2007 Dowling Assoc. Licensed to DKS ASSOC., OAKLAND,CA

Existing PM Mon Feb 1, 2010 16:36:53 Page 12-1 -------------------------------------------------------------------------------- -------------------------------------------------------------------------------- Level Of Service Computation Report CCTALOS Method (Future Volume Alternative) ******************************************************************************** Intersection #10 Sycamore Ave / Bayberry Ave ******************************************************************************** Cycle (sec): 120 Critical Vol./Cap.(X): 0.865 Loss Time (sec): 16 (Y+R=4.0 sec) Average Delay (sec/veh): xxxxxx Optimal Cycle: 180 Level Of Service: D ******************************************************************************** Street Name: Bayberry Ave Sycamore Ave Approach: North Bound South Bound East Bound West Bound Movement: L - T - R L - T - R L - T - R L - T - R ------------|---------------||---------------||---------------||---------------| Control: Split Phase Split Phase Protected Protected Rights: Include Include Include Ignore Min. Green: 5 5 5 5 5 5 5 5 5 5 5 5 Lanes: 1 0 0 1 0 1 1 0 0 2 1 0 2 1 0 1 0 2 0 1 ------------|---------------||---------------||---------------||---------------| Volume Module: Base Vol: 33 24 259 796 65 291 69 923 37 105 1204 65 Growth Adj: 1.00 1.00 1.00 1.00 1.00 1.00 1.00 1.00 1.00 1.00 1.00 1.00 Initial Bse: 33 24 259 796 65 291 69 923 37 105 1204 65 Added Vol: 0 0 0 0 0 0 0 0 0 0 0 0 PasserByVol: 0 0 0 0 0 0 0 0 0 0 0 0 Initial Fut: 33 24 259 796 65 291 69 923 37 105 1204 65 User Adj: 1.00 1.00 1.00 1.00 1.00 1.00 1.00 1.00 1.00 1.00 1.00 1.00 PHF Adj: 1.00 1.00 1.00 1.00 1.00 1.00 1.00 1.00 1.00 1.00 1.00 1.00 PHF Volume: 33 24 259 796 65 291 69 923 37 105 1204 65 Reduct Vol: 0 0 0 0 0 0 0 0 0 0 0 0 Reduced Vol: 33 24 259 796 65 291 69 923 37 105 1204 65 RTOR Reduct: 0 0 0 0 0 69 0 0 0 0 0 0 RTOR Vol: 33 24 259 796 65 222 69 923 37 105 1204 65 PCE Adj: 1.00 1.00 1.00 1.00 1.00 1.00 1.00 1.00 1.00 1.00 1.00 1.00 MLF Adj: 1.00 1.00 1.00 1.00 1.00 1.00 1.00 1.00 1.00 1.00 1.00 1.00 FinalVolume: 33 24 259 796 65 222 69 923 37 105 1204 65 ------------|---------------||---------------||---------------||---------------| Saturation Flow Module: Sat/Lane: 1650 1650 1650 1650 1650 1650 1650 1650 1650 1650 1650 1650 Adjustment: 1.00 1.00 1.00 0.91 1.00 0.91 1.00 1.00 1.00 1.00 1.00 1.00 Lanes: 1.00 0.08 0.92 1.85 0.15 2.00 1.00 2.88 0.12 1.00 2.00 1.00 Final Sat.: 1650 140 1510 2773 249 3000 1650 4759 191 1650 3300 1650 ------------|---------------||---------------||---------------||---------------| Capacity Analysis Module: Vol/Sat: 0.02 0.17 0.17 0.29 0.26 0.07 0.04 0.19 0.19 0.06 0.36 0.04 Crit Volume: 283 431 69 602 Crit Moves: **** **** **** **** ******************************************************************************** Traffix 7.9.0415 (c) 2007 Dowling Assoc. Licensed to DKS ASSOC., OAKLAND,CA
Background Condition
A.M. Peak

Background AM Mon Feb 1, 2010 16:37:06 Page 3-1 -------------------------------------------------------------------------------- -------------------------------------------------------------------------------- Level Of Service Computation Report CCTALOS Method (Future Volume Alternative) ******************************************************************************** Intersection #1 Willow Ave / I-80 WB Off-ramp ******************************************************************************** Cycle (sec): 90 Critical Vol./Cap.(X): 0.221 Loss Time (sec): 8 (Y+R=4.0 sec) Average Delay (sec/veh): xxxxxx Optimal Cycle: 22 Level Of Service: A ******************************************************************************** Street Name: I-80 WB Off-ramp Willow Ave Approach: North Bound South Bound East Bound West Bound Movement: L - T - R L - T - R L - T - R L - T - R ------------|---------------||---------------||---------------||---------------| Control: Protected Protected Protected Protected Rights: Include Include Ignore Ignore Min. Green: 5 5 5 5 5 5 5 5 5 5 5 5 Lanes: 0 0 0 0 0 1 0 0 0 1 0 0 2 0 0 0 0 2 0 0 ------------|---------------||---------------||---------------||---------------| Volume Module: Base Vol: 0 0 0 84 0 95 0 190 0 0 593 0 Growth Adj: 1.00 1.00 1.00 1.00 1.00 1.00 1.00 1.00 1.00 1.00 1.00 1.00 Initial Bse: 0 0 0 84 0 95 0 190 0 0 593 0 Added Vol: 0 0 0 0 0 0 0 0 0 0 0 0 PasserByVol: 0 0 0 0 0 0 0 0 0 0 0 0 Initial Fut: 0 0 0 84 0 95 0 190 0 0 593 0 User Adj: 1.00 1.00 1.00 1.00 1.00 1.00 1.00 1.00 1.00 1.00 1.00 1.00 PHF Adj: 1.00 1.00 1.00 1.00 1.00 1.00 1.00 1.00 1.00 1.00 1.00 1.00 PHF Volume: 0 0 0 84 0 95 0 190 0 0 593 0 Reduct Vol: 0 0 0 0 0 0 0 0 0 0 0 0 Reduced Vol: 0 0 0 84 0 95 0 190 0 0 593 0 RTOR Reduct: 0 0 0 0 0 0 0 0 0 0 0 0 RTOR Vol: 0 0 0 84 0 95 0 190 0 0 593 0 PCE Adj: 1.00 1.00 1.00 1.00 1.00 1.00 1.00 1.00 1.00 1.00 1.00 1.00 MLF Adj: 1.00 1.00 1.00 1.00 1.00 1.00 1.00 1.00 1.00 1.00 1.00 1.00 FinalVolume: 0 0 0 84 0 95 0 190 0 0 593 0 ------------|---------------||---------------||---------------||---------------| Saturation Flow Module: Sat/Lane: 1720 1720 1720 1720 1720 1720 1720 1720 1720 1720 1720 1720 Adjustment: 1.00 1.00 1.00 1.00 1.00 1.00 1.00 1.00 1.00 1.00 1.00 1.00 Lanes: 0.00 0.00 0.00 1.00 0.00 1.00 0.00 2.00 0.00 0.00 2.00 0.00 Final Sat.: 0 0 0 1720 0 1720 0 3440 0 0 3440 0 ------------|---------------||---------------||---------------||---------------| Capacity Analysis Module: Vol/Sat: 0.00 0.00 0.00 0.05 0.00 0.06 0.00 0.06 0.00 0.00 0.17 0.00 Crit Volume: 0 84 0 297 Crit Moves: **** **** **** ******************************************************************************** Traffix 7.9.0415 (c) 2007 Dowling Assoc. Licensed to DKS ASSOC., OAKLAND,CA

Background AM Mon Feb 1, 2010 16:37:06 Page 4-1 -------------------------------------------------------------------------------- -------------------------------------------------------------------------------- Level Of Service Computation Report CCTALOS Method (Future Volume Alternative) ******************************************************************************** Intersection #2 Willow Ave / Hawthorne Ave ******************************************************************************** Cycle (sec): 90 Critical Vol./Cap.(X): 0.301 Loss Time (sec): 8 (Y+R=4.0 sec) Average Delay (sec/veh): xxxxxx Optimal Cycle: 25 Level Of Service: A ******************************************************************************** Street Name: Hawthorne Ave Willow Ave Approach: North Bound South Bound East Bound West Bound Movement: L - T - R L - T - R L - T - R L - T - R ------------|---------------||---------------||---------------||---------------| Control: Protected Protected Protected Protected Rights: Include Include Include Include Min. Green: 0 0 0 5 5 5 5 5 0 0 5 5 Lanes: 0 0 0 0 0 0 0 2! 0 0 1 0 2 0 0 0 0 1 1 0 ------------|---------------||---------------||---------------||---------------| Volume Module: Base Vol: 0 0 0 254 0 15 22 368 0 0 347 136 Growth Adj: 1.00 1.00 1.00 1.00 1.00 1.00 1.00 1.00 1.00 1.00 1.00 1.00 Initial Bse: 0 0 0 254 0 15 22 368 0 0 347 136 Added Vol: 0 0 0 0 0 0 0 0 0 0 0 0 PasserByVol: 0 0 0 0 0 0 0 0 0 0 0 0 Initial Fut: 0 0 0 254 0 15 22 368 0 0 347 136 User Adj: 1.00 1.00 1.00 1.00 1.00 1.00 1.00 1.00 1.00 1.00 1.00 1.00 PHF Adj: 1.00 1.00 1.00 1.00 1.00 1.00 1.00 1.00 1.00 1.00 1.00 1.00 PHF Volume: 0 0 0 254 0 15 22 368 0 0 347 136 Reduct Vol: 0 0 0 0 0 0 0 0 0 0 0 0 Reduced Vol: 0 0 0 254 0 15 22 368 0 0 347 136 RTOR Reduct: 0 0 0 0 0 0 0 0 0 0 0 0 RTOR Vol: 0 0 0 254 0 15 22 368 0 0 347 136 PCE Adj: 1.00 1.00 1.00 1.00 1.00 1.00 1.00 1.00 1.00 1.00 1.00 1.00 MLF Adj: 1.00 1.00 1.00 1.00 1.00 1.00 1.00 1.00 1.00 1.00 1.00 1.00 FinalVolume: 0 0 0 254 0 15 22 368 0 0 347 136 ------------|---------------||---------------||---------------||---------------| Saturation Flow Module: Sat/Lane: 1720 1720 1720 1720 1720 1720 1720 1720 1720 1720 1720 1720 Adjustment: 1.00 1.00 1.00 1.00 1.00 1.00 1.00 1.00 1.00 1.00 1.00 1.00 Lanes: 0.00 0.00 0.00 1.00 0.89 0.11 1.00 2.00 0.00 0.00 1.44 0.56 Final Sat.: 0 0 0 1720 1528 192 1720 3440 0 0 2471 969 ------------|---------------||---------------||---------------||---------------| Capacity Analysis Module: Vol/Sat: 0.00 0.00 0.00 0.15 0.00 0.08 0.01 0.11 0.00 0.00 0.14 0.14 Crit Volume: 0 254 22 242 Crit Moves: **** **** **** ******************************************************************************** Traffix 7.9.0415 (c) 2007 Dowling Assoc. Licensed to DKS ASSOC., OAKLAND,CA

Background AM Mon Feb 1, 2010 16:37:06 Page 5-1 -------------------------------------------------------------------------------- -------------------------------------------------------------------------------- Level Of Service Computation Report CCTALOS Method (Future Volume Alternative) ******************************************************************************** Intersection #3 San Pablo Ave / Willow Ave ******************************************************************************** Cycle (sec): 90 Critical Vol./Cap.(X): 0.218 Loss Time (sec): 12 (Y+R=4.0 sec) Average Delay (sec/veh): xxxxxx Optimal Cycle: 29 Level Of Service: A ******************************************************************************** Street Name: San Pablo Ave Willow Ave Approach: North Bound South Bound East Bound West Bound Movement: L - T - R L - T - R L - T - R L - T - R ------------|---------------||---------------||---------------||---------------| Control: Permitted Permitted Split Phase Split Phase Rights: Include Include Ignore Include Min. Green: 5 5 5 5 5 5 5 5 5 5 5 5 Lanes: 2 0 0 0 1 0 0 0 0 0 0 0 1 1 0 1 0 2 0 0 ------------|---------------||---------------||---------------||---------------| Volume Module: Base Vol: 132 0 101 0 0 0 0 262 0 172 206 0 Growth Adj: 1.00 1.00 1.00 1.00 1.00 1.00 1.00 1.00 1.00 1.00 1.00 1.00 Initial Bse: 132 0 101 0 0 0 0 262 0 172 206 0 Added Vol: 0 0 0 0 0 0 0 0 0 0 0 0 PasserByVol: 0 0 0 0 0 0 0 0 0 0 0 0 Initial Fut: 132 0 101 0 0 0 0 262 0 172 206 0 User Adj: 1.00 1.00 1.00 1.00 1.00 1.00 1.00 1.00 1.00 1.00 1.00 1.00 PHF Adj: 1.00 1.00 1.00 1.00 1.00 1.00 1.00 1.00 1.00 1.00 1.00 1.00 PHF Volume: 132 0 101 0 0 0 0 262 0 172 206 0 Reduct Vol: 0 0 0 0 0 0 0 0 0 0 0 0 Reduced Vol: 132 0 101 0 0 0 0 262 0 172 206 0 RTOR Reduct: 0 0 101 0 0 0 0 0 0 0 0 0 RTOR Vol: 132 0 0 0 0 0 0 262 0 172 206 0 PCE Adj: 1.00 1.00 1.00 1.00 1.00 1.00 1.00 1.00 1.00 1.00 1.00 1.00 MLF Adj: 1.00 1.00 1.00 1.00 1.00 1.00 1.00 1.00 1.00 1.00 1.00 1.00 FinalVolume: 132 0 0 0 0 0 0 262 0 172 206 0 ------------|---------------||---------------||---------------||---------------| Saturation Flow Module: Sat/Lane: 1720 1720 1720 1720 1720 1720 1720 1720 1720 1720 1720 1720 Adjustment: 0.91 1.00 1.00 1.00 1.00 1.00 1.00 1.00 1.00 1.00 1.00 1.00 Lanes: 2.00 0.00 1.00 0.00 0.00 0.00 0.00 2.00 0.00 1.00 2.00 0.00 Final Sat.: 3127 0 1720 0 0 0 0 3440 0 1720 3440 0 ------------|---------------||---------------||---------------||---------------| Capacity Analysis Module: Vol/Sat: 0.04 0.00 0.00 0.00 0.00 0.00 0.00 0.08 0.00 0.10 0.06 0.00 Crit Volume: 66 0 131 172 Crit Moves: **** **** **** ******************************************************************************** Traffix 7.9.0415 (c) 2007 Dowling Assoc. Licensed to DKS ASSOC., OAKLAND,CA

Background AM Mon Feb 1, 2010 16:37:07 Page 6-1 -------------------------------------------------------------------------------- -------------------------------------------------------------------------------- Level Of Service Computation Report CCTALOS Method (Future Volume Alternative) ******************************************************************************** Intersection #4 San Pablo Ave / John Muir Pkwy ******************************************************************************** Cycle (sec): 120 Critical Vol./Cap.(X): 0.513 Loss Time (sec): 16 (Y+R=4.0 sec) Average Delay (sec/veh): xxxxxx Optimal Cycle: 58 Level Of Service: A ******************************************************************************** Street Name: San Pablo Ave John Muir Pkwy Approach: North Bound South Bound East Bound West Bound Movement: L - T - R L - T - R L - T - R L - T - R ------------|---------------||---------------||---------------||---------------| Control: Protected Protected Protected Protected Rights: Ignore Include Include Include Min. Green: 5 5 5 5 5 5 5 5 5 5 5 5 Lanes: 1 0 2 0 1 1 0 1 1 0 1 0 1 1 0 2 0 0 1 0 ------------|---------------||---------------||---------------||---------------| Volume Module: Base Vol: 294 477 1481 204 564 12 5 33 17 436 171 43 Growth Adj: 1.00 1.00 1.00 1.00 1.00 1.00 1.00 1.00 1.00 1.00 1.00 1.00 Initial Bse: 294 477 1481 204 564 12 5 33 17 436 171 43 Added Vol: 0 0 0 0 0 0 0 0 0 0 0 0 PasserByVol: 0 0 0 0 0 0 0 0 0 0 0 0 Initial Fut: 294 477 1481 204 564 12 5 33 17 436 171 43 User Adj: 1.00 1.00 1.00 1.00 1.00 1.00 1.00 1.00 1.00 1.00 1.00 1.00 PHF Adj: 1.00 1.00 1.00 1.00 1.00 1.00 1.00 1.00 1.00 1.00 1.00 1.00 PHF Volume: 294 477 1481 204 564 12 5 33 17 436 171 43 Reduct Vol: 0 0 0 0 0 0 0 0 0 0 0 0 Reduced Vol: 294 477 1481 204 564 12 5 33 17 436 171 43 RTOR Reduct: 0 0 0 0 0 0 0 0 0 0 0 0 RTOR Vol: 294 477 1481 204 564 12 5 33 17 436 171 43 PCE Adj: 1.00 1.00 1.00 1.00 1.00 1.00 1.00 1.00 1.00 1.00 1.00 1.00 MLF Adj: 1.00 1.00 1.00 1.00 1.00 1.00 1.00 1.00 1.00 1.00 1.00 1.00 FinalVolume: 294 477 1481 204 564 12 5 33 17 436 171 43 ------------|---------------||---------------||---------------||---------------| Saturation Flow Module: Sat/Lane: 1650 1650 1650 1650 1650 1650 1650 1650 1650 1650 1650 1650 Adjustment: 1.00 1.00 1.00 1.00 1.00 1.00 1.00 1.00 1.00 0.91 1.00 1.00 Lanes: 1.00 2.00 1.00 1.00 1.96 0.04 1.00 1.32 0.68 2.00 0.80 0.20 Final Sat.: 1650 3300 1650 1650 3231 69 1650 2178 1122 3000 1318 332 ------------|---------------||---------------||---------------||---------------| Capacity Analysis Module: Vol/Sat: 0.18 0.14 0.90 0.12 0.17 0.17 0.00 0.02 0.02 0.15 0.13 0.13 Crit Volume: 294 288 25 218 Crit Moves: **** **** **** **** ******************************************************************************** Traffix 7.9.0415 (c) 2007 Dowling Assoc. Licensed to DKS ASSOC., OAKLAND,CA
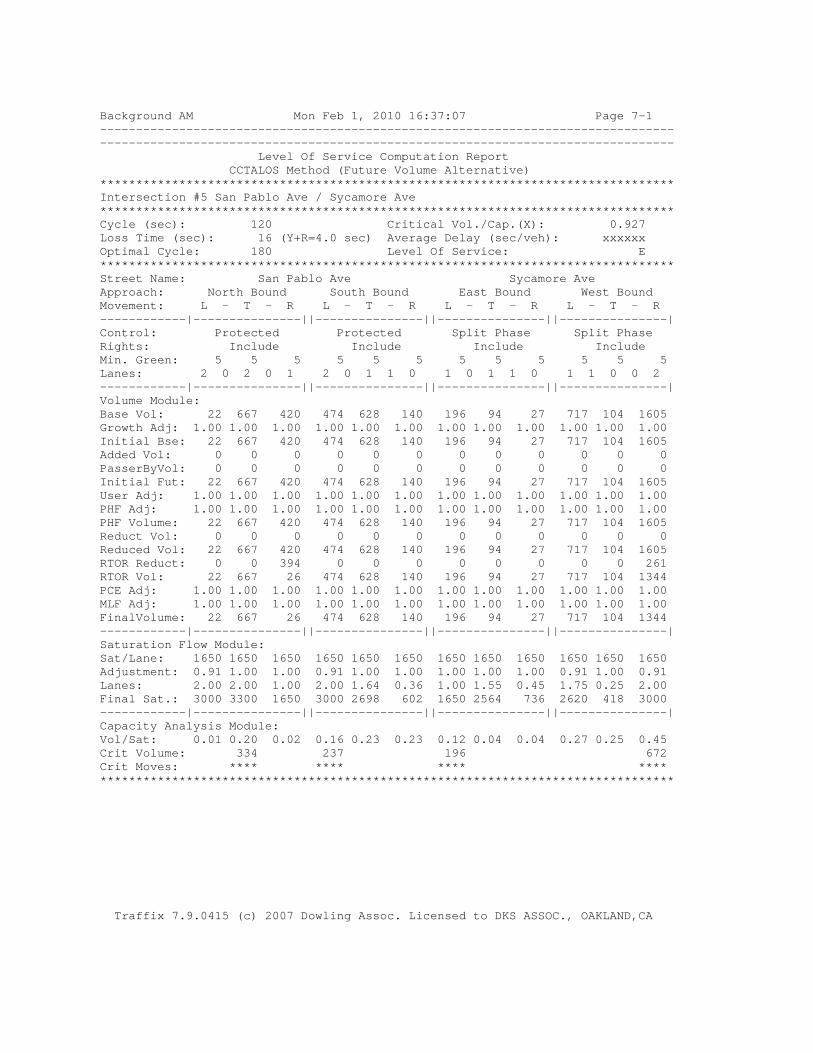
Background AM Mon Feb 1, 2010 16:37:07 Page 7-1 -------------------------------------------------------------------------------- -------------------------------------------------------------------------------- Level Of Service Computation Report CCTALOS Method (Future Volume Alternative) ******************************************************************************** Intersection #5 San Pablo Ave / Sycamore Ave ******************************************************************************** Cycle (sec): 120 Critical Vol./Cap.(X): 0.927 Loss Time (sec): 16 (Y+R=4.0 sec) Average Delay (sec/veh): xxxxxx Optimal Cycle: 180 Level Of Service: E ******************************************************************************** Street Name: San Pablo Ave Sycamore Ave Approach: North Bound South Bound East Bound West Bound Movement: L - T - R L - T - R L - T - R L - T - R ------------|---------------||---------------||---------------||---------------| Control: Protected Protected Split Phase Split Phase Rights: Include Include Include Include Min. Green: 5 5 5 5 5 5 5 5 5 5 5 5 Lanes: 2 0 2 0 1 2 0 1 1 0 1 0 1 1 0 1 1 0 0 2 ------------|---------------||---------------||---------------||---------------| Volume Module: Base Vol: 22 667 420 474 628 140 196 94 27 717 104 1605 Growth Adj: 1.00 1.00 1.00 1.00 1.00 1.00 1.00 1.00 1.00 1.00 1.00 1.00 Initial Bse: 22 667 420 474 628 140 196 94 27 717 104 1605 Added Vol: 0 0 0 0 0 0 0 0 0 0 0 0 PasserByVol: 0 0 0 0 0 0 0 0 0 0 0 0 Initial Fut: 22 667 420 474 628 140 196 94 27 717 104 1605 User Adj: 1.00 1.00 1.00 1.00 1.00 1.00 1.00 1.00 1.00 1.00 1.00 1.00 PHF Adj: 1.00 1.00 1.00 1.00 1.00 1.00 1.00 1.00 1.00 1.00 1.00 1.00 PHF Volume: 22 667 420 474 628 140 196 94 27 717 104 1605 Reduct Vol: 0 0 0 0 0 0 0 0 0 0 0 0 Reduced Vol: 22 667 420 474 628 140 196 94 27 717 104 1605 RTOR Reduct: 0 0 394 0 0 0 0 0 0 0 0 261 RTOR Vol: 22 667 26 474 628 140 196 94 27 717 104 1344 PCE Adj: 1.00 1.00 1.00 1.00 1.00 1.00 1.00 1.00 1.00 1.00 1.00 1.00 MLF Adj: 1.00 1.00 1.00 1.00 1.00 1.00 1.00 1.00 1.00 1.00 1.00 1.00 FinalVolume: 22 667 26 474 628 140 196 94 27 717 104 1344 ------------|---------------||---------------||---------------||---------------| Saturation Flow Module: Sat/Lane: 1650 1650 1650 1650 1650 1650 1650 1650 1650 1650 1650 1650 Adjustment: 0.91 1.00 1.00 0.91 1.00 1.00 1.00 1.00 1.00 0.91 1.00 0.91 Lanes: 2.00 2.00 1.00 2.00 1.64 0.36 1.00 1.55 0.45 1.75 0.25 2.00 Final Sat.: 3000 3300 1650 3000 2698 602 1650 2564 736 2620 418 3000 ------------|---------------||---------------||---------------||---------------| Capacity Analysis Module: Vol/Sat: 0.01 0.20 0.02 0.16 0.23 0.23 0.12 0.04 0.04 0.27 0.25 0.45 Crit Volume: 334 237 196 672 Crit Moves: **** **** **** **** ******************************************************************************** Traffix 7.9.0415 (c) 2007 Dowling Assoc. Licensed to DKS ASSOC., OAKLAND,CA

Background AM Mon Feb 1, 2010 16:37:07 Page 8-1 -------------------------------------------------------------------------------- -------------------------------------------------------------------------------- Level Of Service Computation Report CCTALOS Method (Future Volume Alternative) ******************************************************************************** Intersection #6 San Pablo Ave / Hercules Ave ******************************************************************************** Cycle (sec): 120 Critical Vol./Cap.(X): 0.598 Loss Time (sec): 16 (Y+R=4.0 sec) Average Delay (sec/veh): xxxxxx Optimal Cycle: 71 Level Of Service: A ******************************************************************************** Street Name: San Pablo Ave Hercules Ave Approach: North Bound South Bound East Bound West Bound Movement: L - T - R L - T - R L - T - R L - T - R ------------|---------------||---------------||---------------||---------------| Control: Protected Protected Split Phase Split Phase Rights: Include Include Include Include Min. Green: 5 5 5 5 5 5 5 5 5 5 5 5 Lanes: 1 0 2 0 1 1 0 2 0 1 1 0 1 0 1 0 1 0 1 0 ------------|---------------||---------------||---------------||---------------| Volume Module: Base Vol: 81 488 33 63 997 82 222 4 253 166 8 186 Growth Adj: 1.00 1.00 1.00 1.00 1.00 1.00 1.00 1.00 1.00 1.00 1.00 1.00 Initial Bse: 81 488 33 63 997 82 222 4 253 166 8 186 Added Vol: 0 0 0 0 0 0 0 0 0 0 0 0 PasserByVol: 0 0 0 0 0 0 0 0 0 0 0 0 Initial Fut: 81 488 33 63 997 82 222 4 253 166 8 186 User Adj: 1.00 1.00 1.00 1.00 1.00 1.00 1.00 1.00 1.00 1.00 1.00 1.00 PHF Adj: 1.00 1.00 1.00 1.00 1.00 1.00 1.00 1.00 1.00 1.00 1.00 1.00 PHF Volume: 81 488 33 63 997 82 222 4 253 166 8 186 Reduct Vol: 0 0 0 0 0 0 0 0 0 0 0 0 Reduced Vol: 81 488 33 63 997 82 222 4 253 166 8 186 RTOR Reduct: 0 0 33 0 0 82 0 0 81 0 0 0 RTOR Vol: 81 488 0 63 997 0 222 4 172 166 8 186 PCE Adj: 1.00 1.00 1.00 1.00 1.00 1.00 1.00 1.00 1.00 1.00 1.00 1.00 MLF Adj: 1.00 1.00 1.00 1.00 1.00 1.00 1.00 1.00 1.00 1.00 1.00 1.00 FinalVolume: 81 488 0 63 997 0 222 4 172 166 8 186 ------------|---------------||---------------||---------------||---------------| Saturation Flow Module: Sat/Lane: 1650 1650 1650 1650 1650 1650 1650 1650 1650 1650 1650 1650 Adjustment: 1.00 1.00 1.00 1.00 1.00 1.00 1.00 1.00 1.00 1.00 1.00 1.00 Lanes: 1.00 2.00 1.00 1.00 2.00 1.00 1.00 1.00 1.00 0.92 0.08 1.00 Final Sat.: 1650 3300 1650 1650 3300 1650 1650 1650 1650 1522 128 1650 ------------|---------------||---------------||---------------||---------------| Capacity Analysis Module: Vol/Sat: 0.05 0.15 0.00 0.04 0.30 0.00 0.13 0.00 0.10 0.11 0.06 0.11 Crit Volume: 81 499 222 186 Crit Moves: **** **** **** **** ******************************************************************************** Traffix 7.9.0415 (c) 2007 Dowling Assoc. Licensed to DKS ASSOC., OAKLAND,CA

Background AM Mon Feb 1, 2010 16:37:07 Page 9-1 -------------------------------------------------------------------------------- -------------------------------------------------------------------------------- Level Of Service Computation Report CCTALOS Method (Future Volume Alternative) ******************************************************************************** Intersection #7 San Pablo Ave / Pinole Valley Rd ******************************************************************************** Cycle (sec): 60 Critical Vol./Cap.(X): 0.480 Loss Time (sec): 8 (Y+R=4.0 sec) Average Delay (sec/veh): xxxxxx Optimal Cycle: 33 Level Of Service: A ******************************************************************************** Street Name: San Pablo Ave Pinole Valley Rd Approach: North Bound South Bound East Bound West Bound Movement: L - T - R L - T - R L - T - R L - T - R ------------|---------------||---------------||---------------||---------------| Control: Permitted Permitted Permitted Permitted Rights: Include Include Include Include Min. Green: 5 5 5 5 5 5 5 5 5 5 5 5 Lanes: 0 1 0 1 0 0 1 1 0 1 0 0 1! 0 0 0 1 0 0 1 ------------|---------------||---------------||---------------||---------------| Volume Module: Base Vol: 10 406 10 187 1065 4 2 0 1 21 11 49 Growth Adj: 1.00 1.00 1.00 1.00 1.00 1.00 1.00 1.00 1.00 1.00 1.00 1.00 Initial Bse: 10 406 10 187 1065 4 2 0 1 21 11 49 Added Vol: 0 0 0 0 0 0 0 0 0 0 0 0 PasserByVol: 0 0 0 0 0 0 0 0 0 0 0 0 Initial Fut: 10 406 10 187 1065 4 2 0 1 21 11 49 User Adj: 1.00 1.00 1.00 1.00 1.00 1.00 1.00 1.00 1.00 1.00 1.00 1.00 PHF Adj: 1.00 1.00 1.00 1.00 1.00 1.00 1.00 1.00 1.00 1.00 1.00 1.00 PHF Volume: 10 406 10 187 1065 4 2 0 1 21 11 49 Reduct Vol: 0 0 0 0 0 0 0 0 0 0 0 0 Reduced Vol: 10 406 10 187 1065 4 2 0 1 21 11 49 RTOR Reduct: 0 0 0 0 0 2 0 0 0 0 0 49 RTOR Vol: 10 406 10 187 1065 2 2 0 1 21 11 0 PCE Adj: 6.00 1.00 1.00 2.00 1.00 1.00 1.00 1.00 1.00 1.00 1.00 1.00 MLF Adj: 1.00 1.00 1.00 1.00 1.00 1.00 1.00 1.00 1.00 1.00 1.00 1.00 FinalVolume: 60 406 10 374 1065 2 2 0 1 21 11 0 ------------|---------------||---------------||---------------||---------------| Saturation Flow Module: Sat/Lane: 1800 1800 1800 1800 1800 1800 1800 1800 1800 1800 1800 1800 Adjustment: 1.00 1.00 1.00 1.00 1.00 1.00 1.00 1.00 1.00 1.00 1.00 1.00 Lanes: 0.05 1.91 0.04 0.70 1.30 1.00 0.67 0.00 0.33 0.66 0.34 1.00 Final Sat.: 96 3429 76 1264 2336 1800 1200 0 600 1181 619 1800 ------------|---------------||---------------||---------------||---------------| Capacity Analysis Module: Vol/Sat: 0.10 0.12 0.13 0.15 0.46 0.00 0.00 0.00 0.00 0.02 0.02 0.00 Crit Volume: 10 821 2 32 Crit Moves: **** **** **** **** ******************************************************************************** Traffix 7.9.0415 (c) 2007 Dowling Assoc. Licensed to DKS ASSOC., OAKLAND,CA

Background AM Mon Feb 1, 2010 16:37:07 Page 10-1 -------------------------------------------------------------------------------- -------------------------------------------------------------------------------- Level Of Service Computation Report CCTALOS Method (Future Volume Alternative) ******************************************************************************** Intersection #8 San Pablo Ave / Tennent Ave ******************************************************************************** Cycle (sec): 60 Critical Vol./Cap.(X): 0.651 Loss Time (sec): 8 (Y+R=4.0 sec) Average Delay (sec/veh): xxxxxx Optimal Cycle: 49 Level Of Service: B ******************************************************************************** Street Name: San Pablo Ave Tennent Ave Approach: North Bound South Bound East Bound West Bound Movement: L - T - R L - T - R L - T - R L - T - R ------------|---------------||---------------||---------------||---------------| Control: Permitted Permitted Permitted Permitted Rights: Ignore Ignore Ignore Ignore Min. Green: 0 0 0 0 0 0 0 0 0 0 0 0 Lanes: 0 1 1 0 1 0 1 0 1 0 0 0 1! 0 0 1 0 0 1 0 ------------|---------------||---------------||---------------||---------------| Volume Module: Base Vol: 20 335 241 138 1444 37 10 52 31 244 49 80 Growth Adj: 1.00 1.00 1.00 1.00 1.00 1.00 1.00 1.00 1.00 1.00 1.00 1.00 Initial Bse: 20 335 241 138 1444 37 10 52 31 244 49 80 Added Vol: 0 0 0 0 0 0 0 0 0 0 0 0 PasserByVol: 0 0 0 0 0 0 0 0 0 0 0 0 Initial Fut: 20 335 241 138 1444 37 10 52 31 244 49 80 User Adj: 1.00 1.00 1.00 1.00 1.00 1.00 1.00 1.00 1.00 1.00 1.00 1.00 PHF Adj: 1.00 1.00 1.00 1.00 1.00 1.00 1.00 1.00 1.00 1.00 1.00 1.00 PHF Volume: 20 335 241 138 1444 37 10 52 31 244 49 80 Reduct Vol: 0 0 0 0 0 0 0 0 0 0 0 0 Reduced Vol: 20 335 241 138 1444 37 10 52 31 244 49 80 RTOR Reduct: 0 0 0 0 0 0 0 0 0 0 0 0 RTOR Vol: 20 335 241 138 1444 37 10 52 31 244 49 80 PCE Adj: 6.00 1.00 1.00 2.00 1.00 1.00 1.00 1.00 1.00 1.00 1.00 1.00 MLF Adj: 1.00 1.00 1.00 1.00 1.00 1.00 1.00 1.00 1.00 1.00 1.00 1.00 FinalVolume: 120 335 241 276 1444 37 10 52 31 244 49 80 ------------|---------------||---------------||---------------||---------------| Saturation Flow Module: Sat/Lane: 1800 1800 1800 1800 1800 1800 1800 1800 1800 1800 1800 1800 Adjustment: 1.00 1.00 1.00 1.00 1.00 1.00 1.00 1.00 1.00 1.00 1.00 1.00 Lanes: 0.94 1.06 1.00 0.19 1.77 0.04 0.11 0.56 0.33 1.00 0.38 0.62 Final Sat.: 1694 1906 1800 335 3189 76 194 1006 600 1800 684 1116 ------------|---------------||---------------||---------------||---------------| Capacity Analysis Module: Vol/Sat: 0.01 0.18 0.13 0.41 0.45 0.49 0.05 0.05 0.05 0.14 0.07 0.07 Crit Volume: 20 815 93 244 Crit Moves: **** **** **** **** ******************************************************************************** Traffix 7.9.0415 (c) 2007 Dowling Assoc. Licensed to DKS ASSOC., OAKLAND,CA

Background AM Mon Feb 1, 2010 16:37:07 Page 11-1 -------------------------------------------------------------------------------- -------------------------------------------------------------------------------- Level Of Service Computation Report CCTALOS Method (Future Volume Alternative) ******************************************************************************** Intersection #9 San Pablo Ave / Appian Wy ******************************************************************************** Cycle (sec): 60 Critical Vol./Cap.(X): 0.360 Loss Time (sec): 8 (Y+R=4.0 sec) Average Delay (sec/veh): xxxxxx Optimal Cycle: 27 Level Of Service: A ******************************************************************************** Street Name: San Pablo Ave Appian Wy Approach: North Bound South Bound East Bound West Bound Movement: L - T - R L - T - R L - T - R L - T - R ------------|---------------||---------------||---------------||---------------| Control: Permitted Permitted Permitted Permitted Rights: Include Include Include Include Min. Green: 0 0 0 0 0 0 0 0 0 0 0 0 Lanes: 1 0 2 0 1 1 0 1 1 0 1 0 0 1 0 1 0 0 1 0 ------------|---------------||---------------||---------------||---------------| Volume Module: Base Vol: 4 279 169 337 764 8 21 69 12 91 6 68 Growth Adj: 1.00 1.00 1.00 1.00 1.00 1.00 1.00 1.00 1.00 1.00 1.00 1.00 Initial Bse: 4 279 169 337 764 8 21 69 12 91 6 68 Added Vol: 0 0 0 0 0 0 0 0 0 0 0 0 PasserByVol: 0 0 0 0 0 0 0 0 0 0 0 0 Initial Fut: 4 279 169 337 764 8 21 69 12 91 6 68 User Adj: 1.00 1.00 1.00 1.00 1.00 1.00 1.00 1.00 1.00 1.00 1.00 1.00 PHF Adj: 1.00 1.00 1.00 1.00 1.00 1.00 1.00 1.00 1.00 1.00 1.00 1.00 PHF Volume: 4 279 169 337 764 8 21 69 12 91 6 68 Reduct Vol: 0 0 0 0 0 0 0 0 0 0 0 0 Reduced Vol: 4 279 169 337 764 8 21 69 12 91 6 68 RTOR Reduct: 0 0 91 0 0 0 0 0 0 0 0 0 RTOR Vol: 4 279 78 337 764 8 21 69 12 91 6 68 PCE Adj: 1.00 1.00 1.00 1.00 1.00 1.00 1.00 1.00 1.00 1.00 1.00 1.00 MLF Adj: 1.00 1.00 1.00 1.00 1.00 1.00 1.00 1.00 1.00 1.00 1.00 1.00 FinalVolume: 4 279 78 337 764 8 21 69 12 91 6 68 ------------|---------------||---------------||---------------||---------------| Saturation Flow Module: Sat/Lane: 1800 1800 1800 1800 1800 1800 1800 1800 1800 1800 1800 1800 Adjustment: 1.00 1.00 1.00 1.00 1.00 1.00 1.00 1.00 1.00 1.00 1.00 1.00 Lanes: 1.00 2.00 1.00 1.00 1.98 0.02 1.00 0.85 0.15 1.00 0.08 0.92 Final Sat.: 1800 3600 1800 1800 3563 37 1800 1533 267 1800 146 1654 ------------|---------------||---------------||---------------||---------------| Capacity Analysis Module: Vol/Sat: 0.00 0.08 0.04 0.19 0.21 0.21 0.01 0.05 0.04 0.05 0.04 0.04 Crit Volume: 140 337 81 91 Crit Moves: **** **** **** **** ******************************************************************************** Traffix 7.9.0415 (c) 2007 Dowling Assoc. Licensed to DKS ASSOC., OAKLAND,CA

Background AM Mon Feb 1, 2010 16:37:07 Page 12-1 -------------------------------------------------------------------------------- -------------------------------------------------------------------------------- Level Of Service Computation Report CCTALOS Method (Future Volume Alternative) ******************************************************************************** Intersection #10 Sycamore Ave / Bayberry Ave ******************************************************************************** Cycle (sec): 120 Critical Vol./Cap.(X): 0.975 Loss Time (sec): 16 (Y+R=4.0 sec) Average Delay (sec/veh): xxxxxx Optimal Cycle: 180 Level Of Service: E ******************************************************************************** Street Name: Bayberry Ave Sycamore Ave Approach: North Bound South Bound East Bound West Bound Movement: L - T - R L - T - R L - T - R L - T - R ------------|---------------||---------------||---------------||---------------| Control: Split Phase Split Phase Protected Protected Rights: Include Include Include Ignore Min. Green: 5 5 5 5 5 5 5 5 5 5 5 5 Lanes: 1 0 0 1 0 1 1 0 0 2 1 0 2 1 0 1 0 2 0 1 ------------|---------------||---------------||---------------||---------------| Volume Module: Base Vol: 47 18 223 912 64 612 20 817 33 223 1623 54 Growth Adj: 1.00 1.00 1.00 1.00 1.00 1.00 1.00 1.00 1.00 1.00 1.00 1.00 Initial Bse: 47 18 223 912 64 612 20 817 33 223 1623 54 Added Vol: 0 0 0 0 0 0 0 0 0 0 0 0 PasserByVol: 0 0 0 0 0 0 0 0 0 0 0 0 Initial Fut: 47 18 223 912 64 612 20 817 33 223 1623 54 User Adj: 1.00 1.00 1.00 1.00 1.00 1.00 1.00 1.00 1.00 1.00 1.00 1.00 PHF Adj: 1.00 1.00 1.00 1.00 1.00 1.00 1.00 1.00 1.00 1.00 1.00 1.00 PHF Volume: 47 18 223 912 64 612 20 817 33 223 1623 54 Reduct Vol: 0 0 0 0 0 0 0 0 0 0 0 0 Reduced Vol: 47 18 223 912 64 612 20 817 33 223 1623 54 RTOR Reduct: 0 0 0 0 0 20 0 0 0 0 0 0 RTOR Vol: 47 18 223 912 64 592 20 817 33 223 1623 54 PCE Adj: 1.00 1.00 1.00 1.00 1.00 1.00 1.00 1.00 1.00 1.00 1.00 1.00 MLF Adj: 1.00 1.00 1.00 1.00 1.00 1.00 1.00 1.00 1.00 1.00 1.00 1.00 FinalVolume: 47 18 223 912 64 592 20 817 33 223 1623 54 ------------|---------------||---------------||---------------||---------------| Saturation Flow Module: Sat/Lane: 1650 1650 1650 1650 1650 1650 1650 1650 1650 1650 1650 1650 Adjustment: 1.00 1.00 1.00 0.91 1.00 0.91 1.00 1.00 1.00 1.00 1.00 1.00 Lanes: 1.00 0.07 0.93 1.87 0.13 2.00 1.00 2.88 0.12 1.00 2.00 1.00 Final Sat.: 1650 123 1527 2803 216 3000 1650 4758 192 1650 3300 1650 ------------|---------------||---------------||---------------||---------------| Capacity Analysis Module: Vol/Sat: 0.03 0.15 0.15 0.33 0.30 0.20 0.01 0.17 0.17 0.14 0.49 0.03 Crit Volume: 241 488 20 812 Crit Moves: **** **** **** **** ******************************************************************************** Traffix 7.9.0415 (c) 2007 Dowling Assoc. Licensed to DKS ASSOC., OAKLAND,CA

P.M. PEAK

Background PM Mon Feb 1, 2010 16:37:34 Page 3-1 -------------------------------------------------------------------------------- -------------------------------------------------------------------------------- Level Of Service Computation Report CCTALOS Method (Future Volume Alternative) ******************************************************************************** Intersection #1 Willow Ave / I-80 WB Off-ramp ******************************************************************************** Cycle (sec): 90 Critical Vol./Cap.(X): 0.308 Loss Time (sec): 8 (Y+R=4.0 sec) Average Delay (sec/veh): xxxxxx Optimal Cycle: 25 Level Of Service: A ******************************************************************************** Street Name: I-80 WB Off-ramp Willow Ave Approach: North Bound South Bound East Bound West Bound Movement: L - T - R L - T - R L - T - R L - T - R ------------|---------------||---------------||---------------||---------------| Control: Protected Protected Protected Protected Rights: Include Include Ignore Ignore Min. Green: 5 5 5 5 5 5 5 5 5 5 5 5 Lanes: 0 0 0 0 0 1 0 0 0 1 0 0 2 0 0 0 0 2 0 0 ------------|---------------||---------------||---------------||---------------| Volume Module: Base Vol: 0 0 0 113 0 92 0 331 0 0 833 0 Growth Adj: 1.00 1.00 1.00 1.00 1.00 1.00 1.00 1.00 1.00 1.00 1.00 1.00 Initial Bse: 0 0 0 113 0 92 0 331 0 0 833 0 Added Vol: 0 0 0 0 0 0 0 0 0 0 0 0 PasserByVol: 0 0 0 0 0 0 0 0 0 0 0 0 Initial Fut: 0 0 0 113 0 92 0 331 0 0 833 0 User Adj: 1.00 1.00 1.00 1.00 1.00 1.00 1.00 1.00 1.00 1.00 1.00 1.00 PHF Adj: 1.00 1.00 1.00 1.00 1.00 1.00 1.00 1.00 1.00 1.00 1.00 1.00 PHF Volume: 0 0 0 113 0 92 0 331 0 0 833 0 Reduct Vol: 0 0 0 0 0 0 0 0 0 0 0 0 Reduced Vol: 0 0 0 113 0 92 0 331 0 0 833 0 RTOR Reduct: 0 0 0 0 0 0 0 0 0 0 0 0 RTOR Vol: 0 0 0 113 0 92 0 331 0 0 833 0 PCE Adj: 1.00 1.00 1.00 1.00 1.00 1.00 1.00 1.00 1.00 1.00 1.00 1.00 MLF Adj: 1.00 1.00 1.00 1.00 1.00 1.00 1.00 1.00 1.00 1.00 1.00 1.00 FinalVolume: 0 0 0 113 0 92 0 331 0 0 833 0 ------------|---------------||---------------||---------------||---------------| Saturation Flow Module: Sat/Lane: 1720 1720 1720 1720 1720 1720 1720 1720 1720 1720 1720 1720 Adjustment: 1.00 1.00 1.00 1.00 1.00 1.00 1.00 1.00 1.00 1.00 1.00 1.00 Lanes: 0.00 0.00 0.00 1.00 0.00 1.00 0.00 2.00 0.00 0.00 2.00 0.00 Final Sat.: 0 0 0 1720 0 1720 0 3440 0 0 3440 0 ------------|---------------||---------------||---------------||---------------| Capacity Analysis Module: Vol/Sat: 0.00 0.00 0.00 0.07 0.00 0.05 0.00 0.10 0.00 0.00 0.24 0.00 Crit Volume: 0 113 0 417 Crit Moves: **** **** **** ******************************************************************************** Traffix 7.9.0415 (c) 2007 Dowling Assoc. Licensed to DKS ASSOC., OAKLAND,CA

Background PM Mon Feb 1, 2010 16:37:34 Page 4-1 -------------------------------------------------------------------------------- -------------------------------------------------------------------------------- Level Of Service Computation Report CCTALOS Method (Future Volume Alternative) ******************************************************************************** Intersection #2 Willow Ave / Hawthorne Ave ******************************************************************************** Cycle (sec): 90 Critical Vol./Cap.(X): 0.241 Loss Time (sec): 8 (Y+R=4.0 sec) Average Delay (sec/veh): xxxxxx Optimal Cycle: 23 Level Of Service: A ******************************************************************************** Street Name: Hawthorne Ave Willow Ave Approach: North Bound South Bound East Bound West Bound Movement: L - T - R L - T - R L - T - R L - T - R ------------|---------------||---------------||---------------||---------------| Control: Protected Protected Protected Protected Rights: Include Include Include Include Min. Green: 0 0 0 5 5 5 5 5 0 0 5 5 Lanes: 0 0 0 0 0 0 0 2! 0 0 1 0 2 0 0 0 0 1 1 0 ------------|---------------||---------------||---------------||---------------| Volume Module: Base Vol: 0 0 0 83 0 10 40 513 0 0 449 134 Growth Adj: 1.00 1.00 1.00 1.00 1.00 1.00 1.00 1.00 1.00 1.00 1.00 1.00 Initial Bse: 0 0 0 83 0 10 40 513 0 0 449 134 Added Vol: 0 0 0 0 0 0 0 0 0 0 0 0 PasserByVol: 0 0 0 0 0 0 0 0 0 0 0 0 Initial Fut: 0 0 0 83 0 10 40 513 0 0 449 134 User Adj: 1.00 1.00 1.00 1.00 1.00 1.00 1.00 1.00 1.00 1.00 1.00 1.00 PHF Adj: 1.00 1.00 1.00 1.00 1.00 1.00 1.00 1.00 1.00 1.00 1.00 1.00 PHF Volume: 0 0 0 83 0 10 40 513 0 0 449 134 Reduct Vol: 0 0 0 0 0 0 0 0 0 0 0 0 Reduced Vol: 0 0 0 83 0 10 40 513 0 0 449 134 RTOR Reduct: 0 0 0 0 0 0 0 0 0 0 0 0 RTOR Vol: 0 0 0 83 0 10 40 513 0 0 449 134 PCE Adj: 1.00 1.00 1.00 1.00 1.00 1.00 1.00 1.00 1.00 1.00 1.00 1.00 MLF Adj: 1.00 1.00 1.00 1.00 1.00 1.00 1.00 1.00 1.00 1.00 1.00 1.00 FinalVolume: 0 0 0 83 0 10 40 513 0 0 449 134 ------------|---------------||---------------||---------------||---------------| Saturation Flow Module: Sat/Lane: 1720 1720 1720 1720 1720 1720 1720 1720 1720 1720 1720 1720 Adjustment: 1.00 1.00 1.00 1.00 1.00 1.00 1.00 1.00 1.00 1.00 1.00 1.00 Lanes: 0.00 0.00 0.00 1.00 0.78 0.22 1.00 2.00 0.00 0.00 1.54 0.46 Final Sat.: 0 0 0 1720 1350 370 1720 3440 0 0 2649 791 ------------|---------------||---------------||---------------||---------------| Capacity Analysis Module: Vol/Sat: 0.00 0.00 0.00 0.05 0.00 0.03 0.02 0.15 0.00 0.00 0.17 0.17 Crit Volume: 0 83 40 292 Crit Moves: **** **** **** ******************************************************************************** Traffix 7.9.0415 (c) 2007 Dowling Assoc. Licensed to DKS ASSOC., OAKLAND,CA

Background PM Mon Feb 1, 2010 16:37:34 Page 5-1 -------------------------------------------------------------------------------- -------------------------------------------------------------------------------- Level Of Service Computation Report CCTALOS Method (Future Volume Alternative) ******************************************************************************** Intersection #3 San Pablo Ave / Willow Ave ******************************************************************************** Cycle (sec): 90 Critical Vol./Cap.(X): 0.442 Loss Time (sec): 12 (Y+R=4.0 sec) Average Delay (sec/veh): xxxxxx Optimal Cycle: 41 Level Of Service: A ******************************************************************************** Street Name: San Pablo Ave Willow Ave Approach: North Bound South Bound East Bound West Bound Movement: L - T - R L - T - R L - T - R L - T - R ------------|---------------||---------------||---------------||---------------| Control: Permitted Permitted Split Phase Split Phase Rights: Include Include Ignore Include Min. Green: 5 5 5 5 5 5 5 5 5 5 5 5 Lanes: 2 0 0 0 1 0 0 0 0 0 0 0 1 1 0 1 0 2 0 0 ------------|---------------||---------------||---------------||---------------| Volume Module: Base Vol: 511 0 187 0 0 0 0 398 0 139 559 0 Growth Adj: 1.00 1.00 1.00 1.00 1.00 1.00 1.00 1.00 1.00 1.00 1.00 1.00 Initial Bse: 511 0 187 0 0 0 0 398 0 139 559 0 Added Vol: 0 0 0 0 0 0 0 0 0 0 0 0 PasserByVol: 0 0 0 0 0 0 0 0 0 0 0 0 Initial Fut: 511 0 187 0 0 0 0 398 0 139 559 0 User Adj: 1.00 1.00 1.00 1.00 1.00 1.00 1.00 1.00 1.00 1.00 1.00 1.00 PHF Adj: 1.00 1.00 1.00 1.00 1.00 1.00 1.00 1.00 1.00 1.00 1.00 1.00 PHF Volume: 511 0 187 0 0 0 0 398 0 139 559 0 Reduct Vol: 0 0 0 0 0 0 0 0 0 0 0 0 Reduced Vol: 511 0 187 0 0 0 0 398 0 139 559 0 RTOR Reduct: 0 0 139 0 0 0 0 0 0 0 0 0 RTOR Vol: 511 0 48 0 0 0 0 398 0 139 559 0 PCE Adj: 1.00 1.00 1.00 1.00 1.00 1.00 1.00 1.00 1.00 1.00 1.00 1.00 MLF Adj: 1.00 1.00 1.00 1.00 1.00 1.00 1.00 1.00 1.00 1.00 1.00 1.00 FinalVolume: 511 0 48 0 0 0 0 398 0 139 559 0 ------------|---------------||---------------||---------------||---------------| Saturation Flow Module: Sat/Lane: 1720 1720 1720 1720 1720 1720 1720 1720 1720 1720 1720 1720 Adjustment: 0.91 1.00 1.00 1.00 1.00 1.00 1.00 1.00 1.00 1.00 1.00 1.00 Lanes: 2.00 0.00 1.00 0.00 0.00 0.00 0.00 2.00 0.00 1.00 2.00 0.00 Final Sat.: 3127 0 1720 0 0 0 0 3440 0 1720 3440 0 ------------|---------------||---------------||---------------||---------------| Capacity Analysis Module: Vol/Sat: 0.16 0.00 0.03 0.00 0.00 0.00 0.00 0.12 0.00 0.08 0.16 0.00 Crit Volume: 256 0 199 280 Crit Moves: **** **** **** ******************************************************************************** Traffix 7.9.0415 (c) 2007 Dowling Assoc. Licensed to DKS ASSOC., OAKLAND,CA

Background PM Mon Feb 1, 2010 16:37:34 Page 6-1 -------------------------------------------------------------------------------- -------------------------------------------------------------------------------- Level Of Service Computation Report CCTALOS Method (Future Volume Alternative) ******************************************************************************** Intersection #4 San Pablo Ave / John Muir Pkwy ******************************************************************************** Cycle (sec): 120 Critical Vol./Cap.(X): 0.706 Loss Time (sec): 16 (Y+R=4.0 sec) Average Delay (sec/veh): xxxxxx Optimal Cycle: 96 Level Of Service: C ******************************************************************************** Street Name: San Pablo Ave John Muir Pkwy Approach: North Bound South Bound East Bound West Bound Movement: L - T - R L - T - R L - T - R L - T - R ------------|---------------||---------------||---------------||---------------| Control: Protected Protected Protected Protected Rights: Ignore Include Include Include Min. Green: 5 5 5 5 5 5 5 5 5 5 5 5 Lanes: 1 0 2 0 1 1 0 1 1 0 1 0 1 1 0 2 0 0 1 0 ------------|---------------||---------------||---------------||---------------| Volume Module: Base Vol: 73 800 1321 206 352 9 12 409 142 514 14 33 Growth Adj: 1.00 1.00 1.00 1.00 1.00 1.00 1.00 1.00 1.00 1.00 1.00 1.00 Initial Bse: 73 800 1321 206 352 9 12 409 142 514 14 33 Added Vol: 0 0 0 0 0 0 0 0 0 0 0 0 PasserByVol: 0 0 0 0 0 0 0 0 0 0 0 0 Initial Fut: 73 800 1321 206 352 9 12 409 142 514 14 33 User Adj: 1.00 1.00 1.00 1.00 1.00 1.00 1.00 1.00 1.00 1.00 1.00 1.00 PHF Adj: 1.00 1.00 1.00 1.00 1.00 1.00 1.00 1.00 1.00 1.00 1.00 1.00 PHF Volume: 73 800 1321 206 352 9 12 409 142 514 14 33 Reduct Vol: 0 0 0 0 0 0 0 0 0 0 0 0 Reduced Vol: 73 800 1321 206 352 9 12 409 142 514 14 33 RTOR Reduct: 0 0 0 0 0 0 0 0 0 0 0 0 RTOR Vol: 73 800 1321 206 352 9 12 409 142 514 14 33 PCE Adj: 1.00 1.00 1.00 1.00 1.00 1.00 1.00 1.00 1.00 1.00 1.00 1.00 MLF Adj: 1.00 1.00 1.00 1.00 1.00 1.00 1.00 1.00 1.00 1.00 1.00 1.00 FinalVolume: 73 800 1321 206 352 9 12 409 142 514 14 33 ------------|---------------||---------------||---------------||---------------| Saturation Flow Module: Sat/Lane: 1650 1650 1650 1650 1650 1650 1650 1650 1650 1650 1650 1650 Adjustment: 1.00 1.00 1.00 1.00 1.00 1.00 1.00 1.00 1.00 0.91 1.00 1.00 Lanes: 1.00 2.00 1.00 1.00 1.95 0.05 1.00 1.48 0.52 2.00 0.30 0.70 Final Sat.: 1650 3300 1650 1650 3218 82 1650 2450 850 3000 491 1159 ------------|---------------||---------------||---------------||---------------| Capacity Analysis Module: Vol/Sat: 0.04 0.24 0.80 0.12 0.11 0.11 0.01 0.17 0.17 0.17 0.03 0.03 Crit Volume: 400 206 276 257 Crit Moves: **** **** **** **** ******************************************************************************** Traffix 7.9.0415 (c) 2007 Dowling Assoc. Licensed to DKS ASSOC., OAKLAND,CA
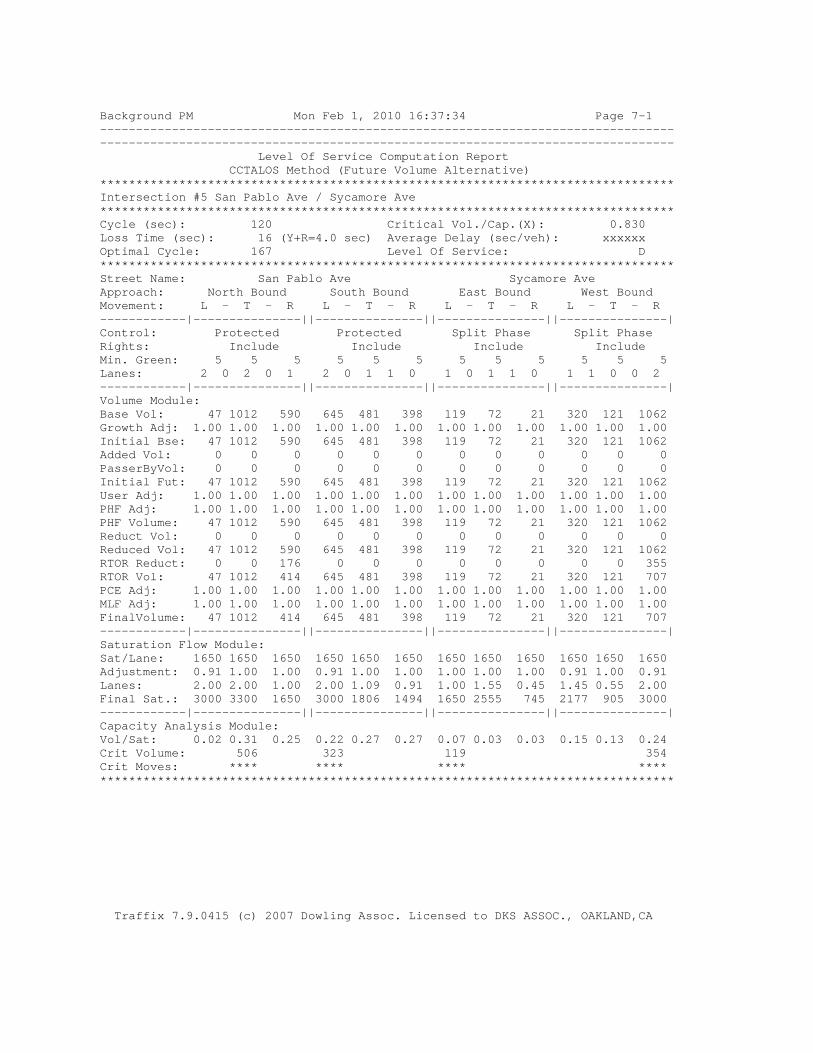
Background PM Mon Feb 1, 2010 16:37:34 Page 7-1 -------------------------------------------------------------------------------- -------------------------------------------------------------------------------- Level Of Service Computation Report CCTALOS Method (Future Volume Alternative) ******************************************************************************** Intersection #5 San Pablo Ave / Sycamore Ave ******************************************************************************** Cycle (sec): 120 Critical Vol./Cap.(X): 0.830 Loss Time (sec): 16 (Y+R=4.0 sec) Average Delay (sec/veh): xxxxxx Optimal Cycle: 167 Level Of Service: D ******************************************************************************** Street Name: San Pablo Ave Sycamore Ave Approach: North Bound South Bound East Bound West Bound Movement: L - T - R L - T - R L - T - R L - T - R ------------|---------------||---------------||---------------||---------------| Control: Protected Protected Split Phase Split Phase Rights: Include Include Include Include Min. Green: 5 5 5 5 5 5 5 5 5 5 5 5 Lanes: 2 0 2 0 1 2 0 1 1 0 1 0 1 1 0 1 1 0 0 2 ------------|---------------||---------------||---------------||---------------| Volume Module: Base Vol: 47 1012 590 645 481 398 119 72 21 320 121 1062 Growth Adj: 1.00 1.00 1.00 1.00 1.00 1.00 1.00 1.00 1.00 1.00 1.00 1.00 Initial Bse: 47 1012 590 645 481 398 119 72 21 320 121 1062 Added Vol: 0 0 0 0 0 0 0 0 0 0 0 0 PasserByVol: 0 0 0 0 0 0 0 0 0 0 0 0 Initial Fut: 47 1012 590 645 481 398 119 72 21 320 121 1062 User Adj: 1.00 1.00 1.00 1.00 1.00 1.00 1.00 1.00 1.00 1.00 1.00 1.00 PHF Adj: 1.00 1.00 1.00 1.00 1.00 1.00 1.00 1.00 1.00 1.00 1.00 1.00 PHF Volume: 47 1012 590 645 481 398 119 72 21 320 121 1062 Reduct Vol: 0 0 0 0 0 0 0 0 0 0 0 0 Reduced Vol: 47 1012 590 645 481 398 119 72 21 320 121 1062 RTOR Reduct: 0 0 176 0 0 0 0 0 0 0 0 355 RTOR Vol: 47 1012 414 645 481 398 119 72 21 320 121 707 PCE Adj: 1.00 1.00 1.00 1.00 1.00 1.00 1.00 1.00 1.00 1.00 1.00 1.00 MLF Adj: 1.00 1.00 1.00 1.00 1.00 1.00 1.00 1.00 1.00 1.00 1.00 1.00 FinalVolume: 47 1012 414 645 481 398 119 72 21 320 121 707 ------------|---------------||---------------||---------------||---------------| Saturation Flow Module: Sat/Lane: 1650 1650 1650 1650 1650 1650 1650 1650 1650 1650 1650 1650 Adjustment: 0.91 1.00 1.00 0.91 1.00 1.00 1.00 1.00 1.00 0.91 1.00 0.91 Lanes: 2.00 2.00 1.00 2.00 1.09 0.91 1.00 1.55 0.45 1.45 0.55 2.00 Final Sat.: 3000 3300 1650 3000 1806 1494 1650 2555 745 2177 905 3000 ------------|---------------||---------------||---------------||---------------| Capacity Analysis Module: Vol/Sat: 0.02 0.31 0.25 0.22 0.27 0.27 0.07 0.03 0.03 0.15 0.13 0.24 Crit Volume: 506 323 119 354 Crit Moves: **** **** **** **** ******************************************************************************** Traffix 7.9.0415 (c) 2007 Dowling Assoc. Licensed to DKS ASSOC., OAKLAND,CA
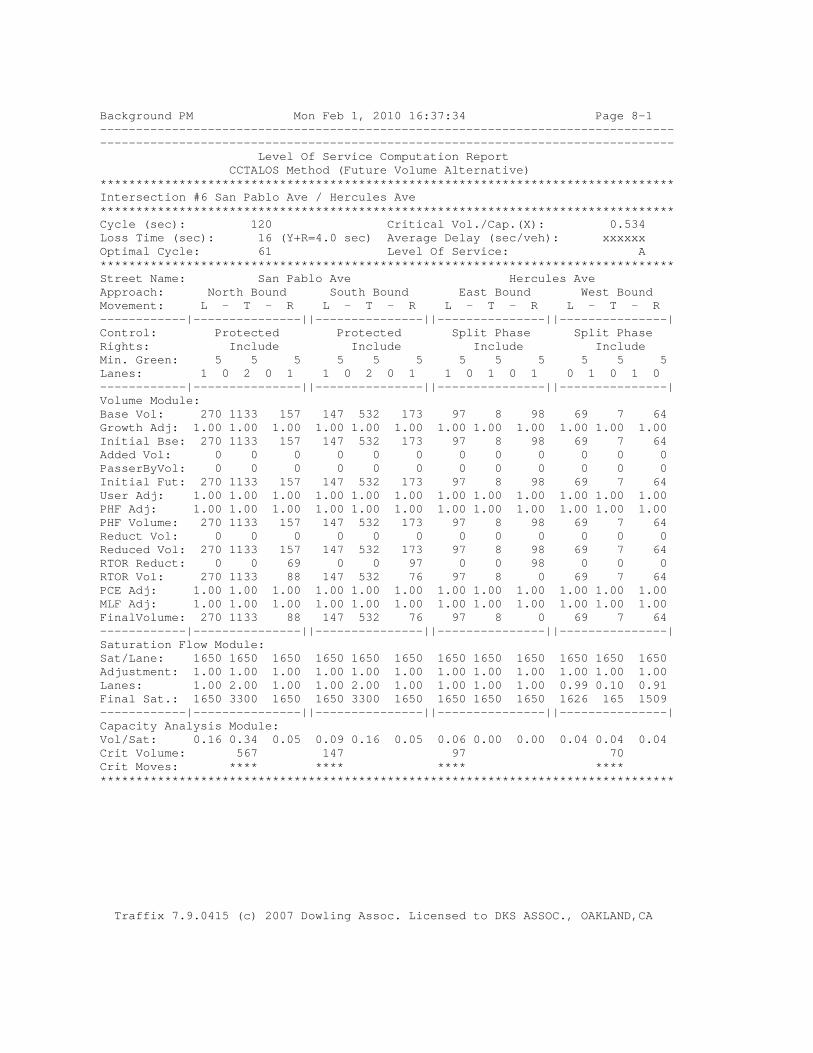
Background PM Mon Feb 1, 2010 16:37:34 Page 8-1 -------------------------------------------------------------------------------- -------------------------------------------------------------------------------- Level Of Service Computation Report CCTALOS Method (Future Volume Alternative) ******************************************************************************** Intersection #6 San Pablo Ave / Hercules Ave ******************************************************************************** Cycle (sec): 120 Critical Vol./Cap.(X): 0.534 Loss Time (sec): 16 (Y+R=4.0 sec) Average Delay (sec/veh): xxxxxx Optimal Cycle: 61 Level Of Service: A ******************************************************************************** Street Name: San Pablo Ave Hercules Ave Approach: North Bound South Bound East Bound West Bound Movement: L - T - R L - T - R L - T - R L - T - R ------------|---------------||---------------||---------------||---------------| Control: Protected Protected Split Phase Split Phase Rights: Include Include Include Include Min. Green: 5 5 5 5 5 5 5 5 5 5 5 5 Lanes: 1 0 2 0 1 1 0 2 0 1 1 0 1 0 1 0 1 0 1 0 ------------|---------------||---------------||---------------||---------------| Volume Module: Base Vol: 270 1133 157 147 532 173 97 8 98 69 7 64 Growth Adj: 1.00 1.00 1.00 1.00 1.00 1.00 1.00 1.00 1.00 1.00 1.00 1.00 Initial Bse: 270 1133 157 147 532 173 97 8 98 69 7 64 Added Vol: 0 0 0 0 0 0 0 0 0 0 0 0 PasserByVol: 0 0 0 0 0 0 0 0 0 0 0 0 Initial Fut: 270 1133 157 147 532 173 97 8 98 69 7 64 User Adj: 1.00 1.00 1.00 1.00 1.00 1.00 1.00 1.00 1.00 1.00 1.00 1.00 PHF Adj: 1.00 1.00 1.00 1.00 1.00 1.00 1.00 1.00 1.00 1.00 1.00 1.00 PHF Volume: 270 1133 157 147 532 173 97 8 98 69 7 64 Reduct Vol: 0 0 0 0 0 0 0 0 0 0 0 0 Reduced Vol: 270 1133 157 147 532 173 97 8 98 69 7 64 RTOR Reduct: 0 0 69 0 0 97 0 0 98 0 0 0 RTOR Vol: 270 1133 88 147 532 76 97 8 0 69 7 64 PCE Adj: 1.00 1.00 1.00 1.00 1.00 1.00 1.00 1.00 1.00 1.00 1.00 1.00 MLF Adj: 1.00 1.00 1.00 1.00 1.00 1.00 1.00 1.00 1.00 1.00 1.00 1.00 FinalVolume: 270 1133 88 147 532 76 97 8 0 69 7 64 ------------|---------------||---------------||---------------||---------------| Saturation Flow Module: Sat/Lane: 1650 1650 1650 1650 1650 1650 1650 1650 1650 1650 1650 1650 Adjustment: 1.00 1.00 1.00 1.00 1.00 1.00 1.00 1.00 1.00 1.00 1.00 1.00 Lanes: 1.00 2.00 1.00 1.00 2.00 1.00 1.00 1.00 1.00 0.99 0.10 0.91 Final Sat.: 1650 3300 1650 1650 3300 1650 1650 1650 1650 1626 165 1509 ------------|---------------||---------------||---------------||---------------| Capacity Analysis Module: Vol/Sat: 0.16 0.34 0.05 0.09 0.16 0.05 0.06 0.00 0.00 0.04 0.04 0.04 Crit Volume: 567 147 97 70 Crit Moves: **** **** **** **** ******************************************************************************** Traffix 7.9.0415 (c) 2007 Dowling Assoc. Licensed to DKS ASSOC., OAKLAND,CA

Background PM Mon Feb 1, 2010 16:37:34 Page 9-1 -------------------------------------------------------------------------------- -------------------------------------------------------------------------------- Level Of Service Computation Report CCTALOS Method (Future Volume Alternative) ******************************************************************************** Intersection #7 San Pablo Ave / Pinole Valley Rd ******************************************************************************** Cycle (sec): 60 Critical Vol./Cap.(X): 0.582 Loss Time (sec): 8 (Y+R=4.0 sec) Average Delay (sec/veh): xxxxxx Optimal Cycle: 41 Level Of Service: A ******************************************************************************** Street Name: San Pablo Ave Pinole Valley Rd Approach: North Bound South Bound East Bound West Bound Movement: L - T - R L - T - R L - T - R L - T - R ------------|---------------||---------------||---------------||---------------| Control: Permitted Permitted Permitted Permitted Rights: Include Include Include Include Min. Green: 5 5 5 5 5 5 5 5 5 5 5 5 Lanes: 0 1 0 1 0 0 1 1 0 1 0 0 1! 0 0 0 1 0 0 1 ------------|---------------||---------------||---------------||---------------| Volume Module: Base Vol: 19 1436 14 76 563 4 9 4 9 6 6 294 Growth Adj: 1.00 1.00 1.00 1.00 1.00 1.00 1.00 1.00 1.00 1.00 1.00 1.00 Initial Bse: 19 1436 14 76 563 4 9 4 9 6 6 294 Added Vol: 0 0 0 0 0 0 0 0 0 0 0 0 PasserByVol: 0 0 0 0 0 0 0 0 0 0 0 0 Initial Fut: 19 1436 14 76 563 4 9 4 9 6 6 294 User Adj: 1.00 1.00 1.00 1.00 1.00 1.00 1.00 1.00 1.00 1.00 1.00 1.00 PHF Adj: 1.00 1.00 1.00 1.00 1.00 1.00 1.00 1.00 1.00 1.00 1.00 1.00 PHF Volume: 19 1436 14 76 563 4 9 4 9 6 6 294 Reduct Vol: 0 0 0 0 0 0 0 0 0 0 0 0 Reduced Vol: 19 1436 14 76 563 4 9 4 9 6 6 294 RTOR Reduct: 0 0 0 0 0 4 0 0 0 0 0 76 RTOR Vol: 19 1436 14 76 563 0 9 4 9 6 6 218 PCE Adj: 2.00 1.00 1.00 6.00 1.00 1.00 1.00 1.00 1.00 1.00 1.00 1.00 MLF Adj: 1.00 1.00 1.00 1.00 1.00 1.00 1.00 1.00 1.00 1.00 1.00 1.00 FinalVolume: 38 1436 14 456 563 0 9 4 9 6 6 218 ------------|---------------||---------------||---------------||---------------| Saturation Flow Module: Sat/Lane: 1800 1800 1800 1800 1800 1800 1800 1800 1800 1800 1800 1800 Adjustment: 1.00 1.00 1.00 1.00 1.00 1.00 1.00 1.00 1.00 1.00 1.00 1.00 Lanes: 0.03 1.95 0.02 1.00 1.00 1.00 0.41 0.18 0.41 0.50 0.50 1.00 Final Sat.: 47 3519 34 1800 1800 1800 736 327 736 900 900 1800 ------------|---------------||---------------||---------------||---------------| Capacity Analysis Module: Vol/Sat: 0.40 0.41 0.41 0.04 0.31 0.00 0.01 0.01 0.01 0.01 0.01 0.12 Crit Volume: 744 76 9 218 Crit Moves: **** **** **** **** ******************************************************************************** Traffix 7.9.0415 (c) 2007 Dowling Assoc. Licensed to DKS ASSOC., OAKLAND,CA

Background PM Mon Feb 1, 2010 16:37:34 Page 10-1 -------------------------------------------------------------------------------- -------------------------------------------------------------------------------- Level Of Service Computation Report CCTALOS Method (Future Volume Alternative) ******************************************************************************** Intersection #8 San Pablo Ave / Tennent Ave ******************************************************************************** Cycle (sec): 60 Critical Vol./Cap.(X): 0.709 Loss Time (sec): 8 (Y+R=4.0 sec) Average Delay (sec/veh): xxxxxx Optimal Cycle: 59 Level Of Service: C ******************************************************************************** Street Name: San Pablo Ave Tennent Ave Approach: North Bound South Bound East Bound West Bound Movement: L - T - R L - T - R L - T - R L - T - R ------------|---------------||---------------||---------------||---------------| Control: Permitted Permitted Permitted Permitted Rights: Ignore Ignore Ignore Ignore Min. Green: 0 0 0 0 0 0 0 0 0 0 0 0 Lanes: 0 1 1 0 1 0 1 0 1 0 0 0 1! 0 0 1 0 0 1 0 ------------|---------------||---------------||---------------||---------------| Volume Module: Base Vol: 60 1757 184 46 321 44 47 33 10 153 79 161 Growth Adj: 1.00 1.00 1.00 1.00 1.00 1.00 1.00 1.00 1.00 1.00 1.00 1.00 Initial Bse: 60 1757 184 46 321 44 47 33 10 153 79 161 Added Vol: 0 0 0 0 0 0 0 0 0 0 0 0 PasserByVol: 0 0 0 0 0 0 0 0 0 0 0 0 Initial Fut: 60 1757 184 46 321 44 47 33 10 153 79 161 User Adj: 1.00 1.00 1.00 1.00 1.00 1.00 1.00 1.00 1.00 1.00 1.00 1.00 PHF Adj: 1.00 1.00 1.00 1.00 1.00 1.00 1.00 1.00 1.00 1.00 1.00 1.00 PHF Volume: 60 1757 184 46 321 44 47 33 10 153 79 161 Reduct Vol: 0 0 0 0 0 0 0 0 0 0 0 0 Reduced Vol: 60 1757 184 46 321 44 47 33 10 153 79 161 RTOR Reduct: 0 0 0 0 0 0 0 0 0 0 0 0 RTOR Vol: 60 1757 184 46 321 44 47 33 10 153 79 161 PCE Adj: 2.00 1.00 1.00 6.00 1.00 1.00 1.00 1.00 1.00 1.00 1.00 1.00 MLF Adj: 1.00 1.00 1.00 1.00 1.00 1.00 1.00 1.00 1.00 1.00 1.00 1.00 FinalVolume: 120 1757 184 276 321 44 47 33 10 153 79 161 ------------|---------------||---------------||---------------||---------------| Saturation Flow Module: Sat/Lane: 1800 1800 1800 1800 1800 1800 1800 1800 1800 1800 1800 1800 Adjustment: 1.00 1.00 1.00 1.00 1.00 1.00 1.00 1.00 1.00 1.00 1.00 1.00 Lanes: 0.14 1.86 1.00 0.51 1.35 0.14 0.52 0.37 0.11 1.00 0.33 0.67 Final Sat.: 246 3354 1800 915 2438 247 940 660 200 1800 593 1208 ------------|---------------||---------------||---------------||---------------| Capacity Analysis Module: Vol/Sat: 0.24 0.52 0.10 0.05 0.13 0.18 0.05 0.05 0.05 0.09 0.13 0.13 Crit Volume: 943 46 47 240 Crit Moves: **** **** **** **** ******************************************************************************** Traffix 7.9.0415 (c) 2007 Dowling Assoc. Licensed to DKS ASSOC., OAKLAND,CA

Background PM Mon Feb 1, 2010 16:37:34 Page 11-1 -------------------------------------------------------------------------------- -------------------------------------------------------------------------------- Level Of Service Computation Report CCTALOS Method (Future Volume Alternative) ******************************************************************************** Intersection #9 San Pablo Ave / Appian Wy ******************************************************************************** Cycle (sec): 60 Critical Vol./Cap.(X): 0.683 Loss Time (sec): 8 (Y+R=4.0 sec) Average Delay (sec/veh): xxxxxx Optimal Cycle: 54 Level Of Service: B ******************************************************************************** Street Name: San Pablo Ave Appian Wy Approach: North Bound South Bound East Bound West Bound Movement: L - T - R L - T - R L - T - R L - T - R ------------|---------------||---------------||---------------||---------------| Control: Permitted Permitted Permitted Permitted Rights: Include Include Include Include Min. Green: 0 0 0 0 0 0 0 0 0 0 0 0 Lanes: 1 0 2 0 1 1 0 1 1 0 1 0 0 1 0 1 0 0 1 0 ------------|---------------||---------------||---------------||---------------| Volume Module: Base Vol: 6 1153 250 209 398 45 47 58 7 266 75 322 Growth Adj: 1.00 1.00 1.00 1.00 1.00 1.00 1.00 1.00 1.00 1.00 1.00 1.00 Initial Bse: 6 1153 250 209 398 45 47 58 7 266 75 322 Added Vol: 0 0 0 0 0 0 0 0 0 0 0 0 PasserByVol: 0 0 0 0 0 0 0 0 0 0 0 0 Initial Fut: 6 1153 250 209 398 45 47 58 7 266 75 322 User Adj: 1.00 1.00 1.00 1.00 1.00 1.00 1.00 1.00 1.00 1.00 1.00 1.00 PHF Adj: 1.00 1.00 1.00 1.00 1.00 1.00 1.00 1.00 1.00 1.00 1.00 1.00 PHF Volume: 6 1153 250 209 398 45 47 58 7 266 75 322 Reduct Vol: 0 0 0 0 0 0 0 0 0 0 0 0 Reduced Vol: 6 1153 250 209 398 45 47 58 7 266 75 322 RTOR Reduct: 0 0 250 0 0 0 0 0 0 0 0 0 RTOR Vol: 6 1153 0 209 398 45 47 58 7 266 75 322 PCE Adj: 1.00 1.00 1.00 1.00 1.00 1.00 1.00 1.00 1.00 1.00 1.00 1.00 MLF Adj: 1.00 1.00 1.00 1.00 1.00 1.00 1.00 1.00 1.00 1.00 1.00 1.00 FinalVolume: 6 1153 0 209 398 45 47 58 7 266 75 322 ------------|---------------||---------------||---------------||---------------| Saturation Flow Module: Sat/Lane: 1800 1800 1800 1800 1800 1800 1800 1800 1800 1800 1800 1800 Adjustment: 1.00 1.00 1.00 1.00 1.00 1.00 1.00 1.00 1.00 1.00 1.00 1.00 Lanes: 1.00 2.00 1.00 1.00 1.80 0.20 1.00 0.89 0.11 1.00 0.19 0.81 Final Sat.: 1800 3600 1800 1800 3234 366 1800 1606 194 1800 340 1460 ------------|---------------||---------------||---------------||---------------| Capacity Analysis Module: Vol/Sat: 0.00 0.32 0.00 0.12 0.12 0.12 0.03 0.04 0.04 0.15 0.22 0.22 Crit Volume: 577 209 47 397 Crit Moves: **** **** **** **** ******************************************************************************** Traffix 7.9.0415 (c) 2007 Dowling Assoc. Licensed to DKS ASSOC., OAKLAND,CA

Background PM Mon Feb 1, 2010 16:37:34 Page 12-1 -------------------------------------------------------------------------------- -------------------------------------------------------------------------------- Level Of Service Computation Report CCTALOS Method (Future Volume Alternative) ******************************************************************************** Intersection #10 Sycamore Ave / Bayberry Ave ******************************************************************************** Cycle (sec): 120 Critical Vol./Cap.(X): 1.098 Loss Time (sec): 16 (Y+R=4.0 sec) Average Delay (sec/veh): xxxxxx Optimal Cycle: 180 Level Of Service: F ******************************************************************************** Street Name: Bayberry Ave Sycamore Ave Approach: North Bound South Bound East Bound West Bound Movement: L - T - R L - T - R L - T - R L - T - R ------------|---------------||---------------||---------------||---------------| Control: Split Phase Split Phase Protected Protected Rights: Include Include Include Ignore Min. Green: 5 5 5 5 5 5 5 5 5 5 5 5 Lanes: 1 0 0 1 0 1 1 0 0 2 1 0 2 1 0 1 0 2 0 1 ------------|---------------||---------------||---------------||---------------| Volume Module: Base Vol: 47 34 368 1130 92 413 76 1015 41 116 1324 72 Growth Adj: 1.00 1.00 1.00 1.00 1.00 1.00 1.00 1.00 1.00 1.00 1.00 1.00 Initial Bse: 47 34 368 1130 92 413 76 1015 41 116 1324 72 Added Vol: 0 0 0 0 0 0 0 0 0 0 0 0 PasserByVol: 0 0 0 0 0 0 0 0 0 0 0 0 Initial Fut: 47 34 368 1130 92 413 76 1015 41 116 1324 72 User Adj: 1.00 1.00 1.00 1.00 1.00 1.00 1.00 1.00 1.00 1.00 1.00 1.00 PHF Adj: 1.00 1.00 1.00 1.00 1.00 1.00 1.00 1.00 1.00 1.00 1.00 1.00 PHF Volume: 47 34 368 1130 92 413 76 1015 41 116 1324 72 Reduct Vol: 0 0 0 0 0 0 0 0 0 0 0 0 Reduced Vol: 47 34 368 1130 92 413 76 1015 41 116 1324 72 RTOR Reduct: 0 0 0 0 0 76 0 0 0 0 0 0 RTOR Vol: 47 34 368 1130 92 337 76 1015 41 116 1324 72 PCE Adj: 1.00 1.00 1.00 1.00 1.00 1.00 1.00 1.00 1.00 1.00 1.00 1.00 MLF Adj: 1.00 1.00 1.00 1.00 1.00 1.00 1.00 1.00 1.00 1.00 1.00 1.00 FinalVolume: 47 34 368 1130 92 337 76 1015 41 116 1324 72 ------------|---------------||---------------||---------------||---------------| Saturation Flow Module: Sat/Lane: 1650 1650 1650 1650 1650 1650 1650 1650 1650 1650 1650 1650 Adjustment: 1.00 1.00 1.00 0.91 1.00 0.91 1.00 1.00 1.00 1.00 1.00 1.00 Lanes: 1.00 0.08 0.92 1.85 0.15 2.00 1.00 2.88 0.12 1.00 2.00 1.00 Final Sat.: 1650 140 1510 2774 248 3000 1650 4758 192 1650 3300 1650 ------------|---------------||---------------||---------------||---------------| Capacity Analysis Module: Vol/Sat: 0.03 0.24 0.24 0.41 0.37 0.11 0.05 0.21 0.21 0.07 0.40 0.04 Crit Volume: 402 611 76 662 Crit Moves: **** **** **** **** ******************************************************************************** Traffix 7.9.0415 (c) 2007 Dowling Assoc. Licensed to DKS ASSOC., OAKLAND,CA
Project Condition
A.M. Peak
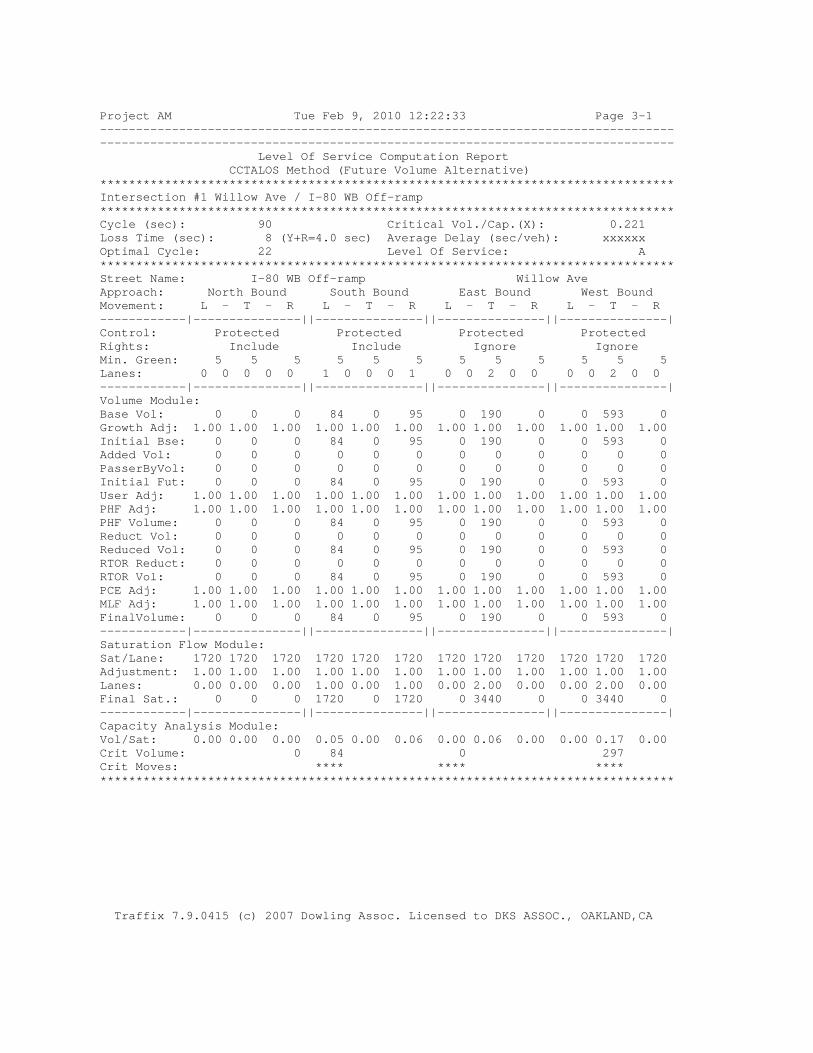
Project AM Tue Feb 9, 2010 12:22:33 Page 3-1 -------------------------------------------------------------------------------- -------------------------------------------------------------------------------- Level Of Service Computation Report CCTALOS Method (Future Volume Alternative) ******************************************************************************** Intersection #1 Willow Ave / I-80 WB Off-ramp ******************************************************************************** Cycle (sec): 90 Critical Vol./Cap.(X): 0.221 Loss Time (sec): 8 (Y+R=4.0 sec) Average Delay (sec/veh): xxxxxx Optimal Cycle: 22 Level Of Service: A ******************************************************************************** Street Name: I-80 WB Off-ramp Willow Ave Approach: North Bound South Bound East Bound West Bound Movement: L - T - R L - T - R L - T - R L - T - R ------------|---------------||---------------||---------------||---------------| Control: Protected Protected Protected Protected Rights: Include Include Ignore Ignore Min. Green: 5 5 5 5 5 5 5 5 5 5 5 5 Lanes: 0 0 0 0 0 1 0 0 0 1 0 0 2 0 0 0 0 2 0 0 ------------|---------------||---------------||---------------||---------------| Volume Module: Base Vol: 0 0 0 84 0 95 0 190 0 0 593 0 Growth Adj: 1.00 1.00 1.00 1.00 1.00 1.00 1.00 1.00 1.00 1.00 1.00 1.00 Initial Bse: 0 0 0 84 0 95 0 190 0 0 593 0 Added Vol: 0 0 0 0 0 0 0 0 0 0 0 0 PasserByVol: 0 0 0 0 0 0 0 0 0 0 0 0 Initial Fut: 0 0 0 84 0 95 0 190 0 0 593 0 User Adj: 1.00 1.00 1.00 1.00 1.00 1.00 1.00 1.00 1.00 1.00 1.00 1.00 PHF Adj: 1.00 1.00 1.00 1.00 1.00 1.00 1.00 1.00 1.00 1.00 1.00 1.00 PHF Volume: 0 0 0 84 0 95 0 190 0 0 593 0 Reduct Vol: 0 0 0 0 0 0 0 0 0 0 0 0 Reduced Vol: 0 0 0 84 0 95 0 190 0 0 593 0 RTOR Reduct: 0 0 0 0 0 0 0 0 0 0 0 0 RTOR Vol: 0 0 0 84 0 95 0 190 0 0 593 0 PCE Adj: 1.00 1.00 1.00 1.00 1.00 1.00 1.00 1.00 1.00 1.00 1.00 1.00 MLF Adj: 1.00 1.00 1.00 1.00 1.00 1.00 1.00 1.00 1.00 1.00 1.00 1.00 FinalVolume: 0 0 0 84 0 95 0 190 0 0 593 0 ------------|---------------||---------------||---------------||---------------| Saturation Flow Module: Sat/Lane: 1720 1720 1720 1720 1720 1720 1720 1720 1720 1720 1720 1720 Adjustment: 1.00 1.00 1.00 1.00 1.00 1.00 1.00 1.00 1.00 1.00 1.00 1.00 Lanes: 0.00 0.00 0.00 1.00 0.00 1.00 0.00 2.00 0.00 0.00 2.00 0.00 Final Sat.: 0 0 0 1720 0 1720 0 3440 0 0 3440 0 ------------|---------------||---------------||---------------||---------------| Capacity Analysis Module: Vol/Sat: 0.00 0.00 0.00 0.05 0.00 0.06 0.00 0.06 0.00 0.00 0.17 0.00 Crit Volume: 0 84 0 297 Crit Moves: **** **** **** ******************************************************************************** Traffix 7.9.0415 (c) 2007 Dowling Assoc. Licensed to DKS ASSOC., OAKLAND,CA

Project AM Tue Feb 9, 2010 12:22:34 Page 4-1 -------------------------------------------------------------------------------- -------------------------------------------------------------------------------- Level Of Service Computation Report CCTALOS Method (Future Volume Alternative) ******************************************************************************** Intersection #2 Willow Ave / Hawthorne Ave ******************************************************************************** Cycle (sec): 90 Critical Vol./Cap.(X): 0.301 Loss Time (sec): 8 (Y+R=4.0 sec) Average Delay (sec/veh): xxxxxx Optimal Cycle: 25 Level Of Service: A ******************************************************************************** Street Name: Hawthorne Ave Willow Ave Approach: North Bound South Bound East Bound West Bound Movement: L - T - R L - T - R L - T - R L - T - R ------------|---------------||---------------||---------------||---------------| Control: Protected Protected Protected Protected Rights: Include Include Include Include Min. Green: 0 0 0 5 5 5 5 5 0 0 5 5 Lanes: 0 0 0 0 0 0 0 2! 0 0 1 0 2 0 0 0 0 1 1 0 ------------|---------------||---------------||---------------||---------------| Volume Module: Base Vol: 0 0 0 254 0 15 22 368 0 0 347 136 Growth Adj: 1.00 1.00 1.00 1.00 1.00 1.00 1.00 1.00 1.00 1.00 1.00 1.00 Initial Bse: 0 0 0 254 0 15 22 368 0 0 347 136 Added Vol: 0 0 0 0 0 0 0 0 0 0 0 0 PasserByVol: 0 0 0 0 0 0 0 0 0 0 0 0 Initial Fut: 0 0 0 254 0 15 22 368 0 0 347 136 User Adj: 1.00 1.00 1.00 1.00 1.00 1.00 1.00 1.00 1.00 1.00 1.00 1.00 PHF Adj: 1.00 1.00 1.00 1.00 1.00 1.00 1.00 1.00 1.00 1.00 1.00 1.00 PHF Volume: 0 0 0 254 0 15 22 368 0 0 347 136 Reduct Vol: 0 0 0 0 0 0 0 0 0 0 0 0 Reduced Vol: 0 0 0 254 0 15 22 368 0 0 347 136 RTOR Reduct: 0 0 0 0 0 0 0 0 0 0 0 0 RTOR Vol: 0 0 0 254 0 15 22 368 0 0 347 136 PCE Adj: 1.00 1.00 1.00 1.00 1.00 1.00 1.00 1.00 1.00 1.00 1.00 1.00 MLF Adj: 1.00 1.00 1.00 1.00 1.00 1.00 1.00 1.00 1.00 1.00 1.00 1.00 FinalVolume: 0 0 0 254 0 15 22 368 0 0 347 136 ------------|---------------||---------------||---------------||---------------| Saturation Flow Module: Sat/Lane: 1720 1720 1720 1720 1720 1720 1720 1720 1720 1720 1720 1720 Adjustment: 1.00 1.00 1.00 1.00 1.00 1.00 1.00 1.00 1.00 1.00 1.00 1.00 Lanes: 0.00 0.00 0.00 1.00 0.89 0.11 1.00 2.00 0.00 0.00 1.44 0.56 Final Sat.: 0 0 0 1720 1528 192 1720 3440 0 0 2471 969 ------------|---------------||---------------||---------------||---------------| Capacity Analysis Module: Vol/Sat: 0.00 0.00 0.00 0.15 0.00 0.08 0.01 0.11 0.00 0.00 0.14 0.14 Crit Volume: 0 254 22 242 Crit Moves: **** **** **** ******************************************************************************** Traffix 7.9.0415 (c) 2007 Dowling Assoc. Licensed to DKS ASSOC., OAKLAND,CA

Project AM Tue Feb 9, 2010 12:22:34 Page 5-1 -------------------------------------------------------------------------------- -------------------------------------------------------------------------------- Level Of Service Computation Report CCTALOS Method (Future Volume Alternative) ******************************************************************************** Intersection #3 San Pablo Ave / Willow Ave ******************************************************************************** Cycle (sec): 90 Critical Vol./Cap.(X): 0.220 Loss Time (sec): 12 (Y+R=4.0 sec) Average Delay (sec/veh): xxxxxx Optimal Cycle: 29 Level Of Service: A ******************************************************************************** Street Name: San Pablo Ave Willow Ave Approach: North Bound South Bound East Bound West Bound Movement: L - T - R L - T - R L - T - R L - T - R ------------|---------------||---------------||---------------||---------------| Control: Permitted Permitted Split Phase Split Phase Rights: Include Include Ignore Include Min. Green: 5 5 5 5 5 5 5 5 5 5 5 5 Lanes: 2 0 0 0 1 0 0 0 0 0 0 0 1 1 0 1 0 2 0 0 ------------|---------------||---------------||---------------||---------------| Volume Module: Base Vol: 132 0 101 0 0 0 0 262 6 172 206 0 Growth Adj: 1.00 1.00 1.00 1.00 1.00 1.00 1.00 1.00 1.00 1.00 1.00 1.00 Initial Bse: 132 0 101 0 0 0 0 262 6 172 206 0 Added Vol: 0 0 0 0 0 0 0 0 0 0 0 0 PasserByVol: 0 0 0 0 0 0 0 0 0 0 0 0 Initial Fut: 132 0 101 0 0 0 0 262 6 172 206 0 User Adj: 1.00 1.00 1.00 1.00 1.00 1.00 1.00 1.00 1.00 1.00 1.00 1.00 PHF Adj: 1.00 1.00 1.00 1.00 1.00 1.00 1.00 1.00 1.00 1.00 1.00 1.00 PHF Volume: 132 0 101 0 0 0 0 262 6 172 206 0 Reduct Vol: 0 0 0 0 0 0 0 0 0 0 0 0 Reduced Vol: 132 0 101 0 0 0 0 262 6 172 206 0 RTOR Reduct: 0 0 101 0 0 0 0 0 0 0 0 0 RTOR Vol: 132 0 0 0 0 0 0 262 6 172 206 0 PCE Adj: 1.00 1.00 1.00 1.00 1.00 1.00 1.00 1.00 1.00 1.00 1.00 1.00 MLF Adj: 1.00 1.00 1.00 1.00 1.00 1.00 1.00 1.00 1.00 1.00 1.00 1.00 FinalVolume: 132 0 0 0 0 0 0 262 6 172 206 0 ------------|---------------||---------------||---------------||---------------| Saturation Flow Module: Sat/Lane: 1720 1720 1720 1720 1720 1720 1720 1720 1720 1720 1720 1720 Adjustment: 0.91 1.00 1.00 1.00 1.00 1.00 1.00 1.00 1.00 1.00 1.00 1.00 Lanes: 2.00 0.00 1.00 0.00 0.00 0.00 0.00 1.96 0.04 1.00 2.00 0.00 Final Sat.: 3127 0 1720 0 0 0 0 3363 77 1720 3440 0 ------------|---------------||---------------||---------------||---------------| Capacity Analysis Module: Vol/Sat: 0.04 0.00 0.00 0.00 0.00 0.00 0.00 0.08 0.08 0.10 0.06 0.00 Crit Volume: 66 0 134 172 Crit Moves: **** **** **** ******************************************************************************** Traffix 7.9.0415 (c) 2007 Dowling Assoc. Licensed to DKS ASSOC., OAKLAND,CA

Project AM Tue Feb 9, 2010 12:22:34 Page 6-1 -------------------------------------------------------------------------------- -------------------------------------------------------------------------------- Level Of Service Computation Report CCTALOS Method (Future Volume Alternative) ******************************************************************************** Intersection #4 San Pablo Ave / John Muir Pkwy ******************************************************************************** Cycle (sec): 120 Critical Vol./Cap.(X): 0.524 Loss Time (sec): 16 (Y+R=4.0 sec) Average Delay (sec/veh): xxxxxx Optimal Cycle: 60 Level Of Service: A ******************************************************************************** Street Name: San Pablo Ave John Muir Pkwy Approach: North Bound South Bound East Bound West Bound Movement: L - T - R L - T - R L - T - R L - T - R ------------|---------------||---------------||---------------||---------------| Control: Protected Protected Protected Protected Rights: Ignore Include Include Include Min. Green: 5 5 5 5 5 5 5 5 5 5 5 5 Lanes: 1 0 2 0 1 1 0 1 1 0 1 0 1 1 0 2 0 0 1 0 ------------|---------------||---------------||---------------||---------------| Volume Module: Base Vol: 312 477 1481 204 564 12 5 33 17 436 180 43 Growth Adj: 1.00 1.00 1.00 1.00 1.00 1.00 1.00 1.00 1.00 1.00 1.00 1.00 Initial Bse: 312 477 1481 204 564 12 5 33 17 436 180 43 Added Vol: 0 0 0 0 0 0 0 0 0 0 0 0 PasserByVol: 0 0 0 0 0 0 0 0 0 0 0 0 Initial Fut: 312 477 1481 204 564 12 5 33 17 436 180 43 User Adj: 1.00 1.00 1.00 1.00 1.00 1.00 1.00 1.00 1.00 1.00 1.00 1.00 PHF Adj: 1.00 1.00 1.00 1.00 1.00 1.00 1.00 1.00 1.00 1.00 1.00 1.00 PHF Volume: 312 477 1481 204 564 12 5 33 17 436 180 43 Reduct Vol: 0 0 0 0 0 0 0 0 0 0 0 0 Reduced Vol: 312 477 1481 204 564 12 5 33 17 436 180 43 RTOR Reduct: 0 0 0 0 0 0 0 0 0 0 0 0 RTOR Vol: 312 477 1481 204 564 12 5 33 17 436 180 43 PCE Adj: 1.00 1.00 1.00 1.00 1.00 1.00 1.00 1.00 1.00 1.00 1.00 1.00 MLF Adj: 1.00 1.00 1.00 1.00 1.00 1.00 1.00 1.00 1.00 1.00 1.00 1.00 FinalVolume: 312 477 1481 204 564 12 5 33 17 436 180 43 ------------|---------------||---------------||---------------||---------------| Saturation Flow Module: Sat/Lane: 1650 1650 1650 1650 1650 1650 1650 1650 1650 1650 1650 1650 Adjustment: 1.00 1.00 1.00 1.00 1.00 1.00 1.00 1.00 1.00 0.91 1.00 1.00 Lanes: 1.00 2.00 1.00 1.00 1.96 0.04 1.00 1.32 0.68 2.00 0.81 0.19 Final Sat.: 1650 3300 1650 1650 3231 69 1650 2178 1122 3000 1332 318 ------------|---------------||---------------||---------------||---------------| Capacity Analysis Module: Vol/Sat: 0.19 0.14 0.90 0.12 0.17 0.17 0.00 0.02 0.02 0.15 0.14 0.14 Crit Volume: 312 288 25 218 Crit Moves: **** **** **** **** ******************************************************************************** Traffix 7.9.0415 (c) 2007 Dowling Assoc. Licensed to DKS ASSOC., OAKLAND,CA

Project AM Tue Feb 9, 2010 12:22:34 Page 7-1 -------------------------------------------------------------------------------- -------------------------------------------------------------------------------- Level Of Service Computation Report CCTALOS Method (Future Volume Alternative) ******************************************************************************** Intersection #5 San Pablo Ave / Sycamore Ave ******************************************************************************** Cycle (sec): 120 Critical Vol./Cap.(X): 0.933 Loss Time (sec): 16 (Y+R=4.0 sec) Average Delay (sec/veh): xxxxxx Optimal Cycle: 180 Level Of Service: E ******************************************************************************** Street Name: San Pablo Ave Sycamore Ave Approach: North Bound South Bound East Bound West Bound Movement: L - T - R L - T - R L - T - R L - T - R ------------|---------------||---------------||---------------||---------------| Control: Protected Protected Split Phase Split Phase Rights: Include Include Include Include Min. Green: 5 5 5 5 5 5 5 5 5 5 5 5 Lanes: 2 0 2 0 1 2 0 1 1 0 1 0 1 1 0 1 1 0 0 2 ------------|---------------||---------------||---------------||---------------| Volume Module: Base Vol: 28 667 420 474 628 140 196 94 27 717 104 1623 Growth Adj: 1.00 1.00 1.00 1.00 1.00 1.00 1.00 1.00 1.00 1.00 1.00 1.00 Initial Bse: 28 667 420 474 628 140 196 94 27 717 104 1623 Added Vol: 0 0 0 0 0 0 0 0 0 0 0 0 PasserByVol: 0 0 0 0 0 0 0 0 0 0 0 0 Initial Fut: 28 667 420 474 628 140 196 94 27 717 104 1623 User Adj: 1.00 1.00 1.00 1.00 1.00 1.00 1.00 1.00 1.00 1.00 1.00 1.00 PHF Adj: 1.00 1.00 1.00 1.00 1.00 1.00 1.00 1.00 1.00 1.00 1.00 1.00 PHF Volume: 28 667 420 474 628 140 196 94 27 717 104 1623 Reduct Vol: 0 0 0 0 0 0 0 0 0 0 0 0 Reduced Vol: 28 667 420 474 628 140 196 94 27 717 104 1623 RTOR Reduct: 0 0 394 0 0 0 0 0 0 0 0 261 RTOR Vol: 28 667 26 474 628 140 196 94 27 717 104 1362 PCE Adj: 1.00 1.00 1.00 1.00 1.00 1.00 1.00 1.00 1.00 1.00 1.00 1.00 MLF Adj: 1.00 1.00 1.00 1.00 1.00 1.00 1.00 1.00 1.00 1.00 1.00 1.00 FinalVolume: 28 667 26 474 628 140 196 94 27 717 104 1362 ------------|---------------||---------------||---------------||---------------| Saturation Flow Module: Sat/Lane: 1650 1650 1650 1650 1650 1650 1650 1650 1650 1650 1650 1650 Adjustment: 0.91 1.00 1.00 0.91 1.00 1.00 1.00 1.00 1.00 0.91 1.00 0.91 Lanes: 2.00 2.00 1.00 2.00 1.64 0.36 1.00 1.55 0.45 1.75 0.25 2.00 Final Sat.: 3000 3300 1650 3000 2698 602 1650 2564 736 2620 418 3000 ------------|---------------||---------------||---------------||---------------| Capacity Analysis Module: Vol/Sat: 0.01 0.20 0.02 0.16 0.23 0.23 0.12 0.04 0.04 0.27 0.25 0.45 Crit Volume: 334 237 196 681 Crit Moves: **** **** **** **** ******************************************************************************** Traffix 7.9.0415 (c) 2007 Dowling Assoc. Licensed to DKS ASSOC., OAKLAND,CA

Project AM Tue Feb 9, 2010 12:22:34 Page 8-1 -------------------------------------------------------------------------------- -------------------------------------------------------------------------------- Level Of Service Computation Report CCTALOS Method (Future Volume Alternative) ******************************************************************************** Intersection #6 San Pablo Ave / Hercules Ave ******************************************************************************** Cycle (sec): 120 Critical Vol./Cap.(X): 0.598 Loss Time (sec): 16 (Y+R=4.0 sec) Average Delay (sec/veh): xxxxxx Optimal Cycle: 71 Level Of Service: A ******************************************************************************** Street Name: San Pablo Ave Hercules Ave Approach: North Bound South Bound East Bound West Bound Movement: L - T - R L - T - R L - T - R L - T - R ------------|---------------||---------------||---------------||---------------| Control: Protected Protected Split Phase Split Phase Rights: Include Include Include Include Min. Green: 5 5 5 5 5 5 5 5 5 5 5 5 Lanes: 1 0 2 0 1 1 0 2 0 1 1 0 1 0 1 0 1 0 1 0 ------------|---------------||---------------||---------------||---------------| Volume Module: Base Vol: 81 494 33 63 997 82 222 4 253 166 8 186 Growth Adj: 1.00 1.00 1.00 1.00 1.00 1.00 1.00 1.00 1.00 1.00 1.00 1.00 Initial Bse: 81 494 33 63 997 82 222 4 253 166 8 186 Added Vol: 0 0 0 0 0 0 0 0 0 0 0 0 PasserByVol: 0 0 0 0 0 0 0 0 0 0 0 0 Initial Fut: 81 494 33 63 997 82 222 4 253 166 8 186 User Adj: 1.00 1.00 1.00 1.00 1.00 1.00 1.00 1.00 1.00 1.00 1.00 1.00 PHF Adj: 1.00 1.00 1.00 1.00 1.00 1.00 1.00 1.00 1.00 1.00 1.00 1.00 PHF Volume: 81 494 33 63 997 82 222 4 253 166 8 186 Reduct Vol: 0 0 0 0 0 0 0 0 0 0 0 0 Reduced Vol: 81 494 33 63 997 82 222 4 253 166 8 186 RTOR Reduct: 0 0 33 0 0 82 0 0 81 0 0 0 RTOR Vol: 81 494 0 63 997 0 222 4 172 166 8 186 PCE Adj: 1.00 1.00 1.00 1.00 1.00 1.00 1.00 1.00 1.00 1.00 1.00 1.00 MLF Adj: 1.00 1.00 1.00 1.00 1.00 1.00 1.00 1.00 1.00 1.00 1.00 1.00 FinalVolume: 81 494 0 63 997 0 222 4 172 166 8 186 ------------|---------------||---------------||---------------||---------------| Saturation Flow Module: Sat/Lane: 1650 1650 1650 1650 1650 1650 1650 1650 1650 1650 1650 1650 Adjustment: 1.00 1.00 1.00 1.00 1.00 1.00 1.00 1.00 1.00 1.00 1.00 1.00 Lanes: 1.00 2.00 1.00 1.00 2.00 1.00 1.00 1.00 1.00 0.92 0.08 1.00 Final Sat.: 1650 3300 1650 1650 3300 1650 1650 1650 1650 1522 128 1650 ------------|---------------||---------------||---------------||---------------| Capacity Analysis Module: Vol/Sat: 0.05 0.15 0.00 0.04 0.30 0.00 0.13 0.00 0.10 0.11 0.06 0.11 Crit Volume: 81 499 222 186 Crit Moves: **** **** **** **** ******************************************************************************** Traffix 7.9.0415 (c) 2007 Dowling Assoc. Licensed to DKS ASSOC., OAKLAND,CA

Project AM Tue Feb 9, 2010 12:22:34 Page 9-1 -------------------------------------------------------------------------------- -------------------------------------------------------------------------------- Level Of Service Computation Report CCTALOS Method (Future Volume Alternative) ******************************************************************************** Intersection #7 San Pablo Ave / Pinole Valley Rd ******************************************************************************** Cycle (sec): 60 Critical Vol./Cap.(X): 0.480 Loss Time (sec): 8 (Y+R=4.0 sec) Average Delay (sec/veh): xxxxxx Optimal Cycle: 33 Level Of Service: A ******************************************************************************** Street Name: San Pablo Ave Pinole Valley Rd Approach: North Bound South Bound East Bound West Bound Movement: L - T - R L - T - R L - T - R L - T - R ------------|---------------||---------------||---------------||---------------| Control: Permitted Permitted Permitted Permitted Rights: Include Include Include Include Min. Green: 5 5 5 5 5 5 5 5 5 5 5 5 Lanes: 0 1 0 1 0 0 1 1 0 1 0 0 1! 0 0 0 1 0 0 1 ------------|---------------||---------------||---------------||---------------| Volume Module: Base Vol: 10 412 10 187 1065 4 2 0 1 21 11 49 Growth Adj: 1.00 1.00 1.00 1.00 1.00 1.00 1.00 1.00 1.00 1.00 1.00 1.00 Initial Bse: 10 412 10 187 1065 4 2 0 1 21 11 49 Added Vol: 0 0 0 0 0 0 0 0 0 0 0 0 PasserByVol: 0 0 0 0 0 0 0 0 0 0 0 0 Initial Fut: 10 412 10 187 1065 4 2 0 1 21 11 49 User Adj: 1.00 1.00 1.00 1.00 1.00 1.00 1.00 1.00 1.00 1.00 1.00 1.00 PHF Adj: 1.00 1.00 1.00 1.00 1.00 1.00 1.00 1.00 1.00 1.00 1.00 1.00 PHF Volume: 10 412 10 187 1065 4 2 0 1 21 11 49 Reduct Vol: 0 0 0 0 0 0 0 0 0 0 0 0 Reduced Vol: 10 412 10 187 1065 4 2 0 1 21 11 49 RTOR Reduct: 0 0 0 0 0 2 0 0 0 0 0 49 RTOR Vol: 10 412 10 187 1065 2 2 0 1 21 11 0 PCE Adj: 6.00 1.00 1.00 2.00 1.00 1.00 1.00 1.00 1.00 1.00 1.00 1.00 MLF Adj: 1.00 1.00 1.00 1.00 1.00 1.00 1.00 1.00 1.00 1.00 1.00 1.00 FinalVolume: 60 412 10 374 1065 2 2 0 1 21 11 0 ------------|---------------||---------------||---------------||---------------| Saturation Flow Module: Sat/Lane: 1800 1800 1800 1800 1800 1800 1800 1800 1800 1800 1800 1800 Adjustment: 1.00 1.00 1.00 1.00 1.00 1.00 1.00 1.00 1.00 1.00 1.00 1.00 Lanes: 0.05 1.91 0.04 0.70 1.30 1.00 0.67 0.00 0.33 0.66 0.34 1.00 Final Sat.: 94 3431 75 1264 2336 1800 1200 0 600 1181 619 1800 ------------|---------------||---------------||---------------||---------------| Capacity Analysis Module: Vol/Sat: 0.11 0.12 0.13 0.15 0.46 0.00 0.00 0.00 0.00 0.02 0.02 0.00 Crit Volume: 10 821 2 32 Crit Moves: **** **** **** **** ******************************************************************************** Traffix 7.9.0415 (c) 2007 Dowling Assoc. Licensed to DKS ASSOC., OAKLAND,CA

Project AM Tue Feb 9, 2010 12:22:34 Page 10-1 -------------------------------------------------------------------------------- -------------------------------------------------------------------------------- Level Of Service Computation Report CCTALOS Method (Future Volume Alternative) ******************************************************************************** Intersection #8 San Pablo Ave / Tennent Ave ******************************************************************************** Cycle (sec): 60 Critical Vol./Cap.(X): 0.651 Loss Time (sec): 8 (Y+R=4.0 sec) Average Delay (sec/veh): xxxxxx Optimal Cycle: 49 Level Of Service: B ******************************************************************************** Street Name: San Pablo Ave Tennent Ave Approach: North Bound South Bound East Bound West Bound Movement: L - T - R L - T - R L - T - R L - T - R ------------|---------------||---------------||---------------||---------------| Control: Permitted Permitted Permitted Permitted Rights: Ignore Ignore Ignore Ignore Min. Green: 0 0 0 0 0 0 0 0 0 0 0 0 Lanes: 0 1 1 0 1 0 1 0 1 0 0 0 1! 0 0 1 0 0 1 0 ------------|---------------||---------------||---------------||---------------| Volume Module: Base Vol: 20 341 241 138 1444 37 10 52 31 244 49 80 Growth Adj: 1.00 1.00 1.00 1.00 1.00 1.00 1.00 1.00 1.00 1.00 1.00 1.00 Initial Bse: 20 341 241 138 1444 37 10 52 31 244 49 80 Added Vol: 0 0 0 0 0 0 0 0 0 0 0 0 PasserByVol: 0 0 0 0 0 0 0 0 0 0 0 0 Initial Fut: 20 341 241 138 1444 37 10 52 31 244 49 80 User Adj: 1.00 1.00 1.00 1.00 1.00 1.00 1.00 1.00 1.00 1.00 1.00 1.00 PHF Adj: 1.00 1.00 1.00 1.00 1.00 1.00 1.00 1.00 1.00 1.00 1.00 1.00 PHF Volume: 20 341 241 138 1444 37 10 52 31 244 49 80 Reduct Vol: 0 0 0 0 0 0 0 0 0 0 0 0 Reduced Vol: 20 341 241 138 1444 37 10 52 31 244 49 80 RTOR Reduct: 0 0 0 0 0 0 0 0 0 0 0 0 RTOR Vol: 20 341 241 138 1444 37 10 52 31 244 49 80 PCE Adj: 6.00 1.00 1.00 2.00 1.00 1.00 1.00 1.00 1.00 1.00 1.00 1.00 MLF Adj: 1.00 1.00 1.00 1.00 1.00 1.00 1.00 1.00 1.00 1.00 1.00 1.00 FinalVolume: 120 341 241 276 1444 37 10 52 31 244 49 80 ------------|---------------||---------------||---------------||---------------| Saturation Flow Module: Sat/Lane: 1800 1800 1800 1800 1800 1800 1800 1800 1800 1800 1800 1800 Adjustment: 1.00 1.00 1.00 1.00 1.00 1.00 1.00 1.00 1.00 1.00 1.00 1.00 Lanes: 0.92 1.08 1.00 0.19 1.77 0.04 0.11 0.56 0.33 1.00 0.38 0.62 Final Sat.: 1655 1945 1800 335 3189 76 194 1006 600 1800 684 1116 ------------|---------------||---------------||---------------||---------------| Capacity Analysis Module: Vol/Sat: 0.01 0.18 0.13 0.41 0.45 0.49 0.05 0.05 0.05 0.14 0.07 0.07 Crit Volume: 20 815 93 244 Crit Moves: **** **** **** **** ******************************************************************************** Traffix 7.9.0415 (c) 2007 Dowling Assoc. Licensed to DKS ASSOC., OAKLAND,CA

Project AM Tue Feb 9, 2010 12:22:34 Page 11-1 -------------------------------------------------------------------------------- -------------------------------------------------------------------------------- Level Of Service Computation Report CCTALOS Method (Future Volume Alternative) ******************************************************************************** Intersection #9 San Pablo Ave / Appian Wy ******************************************************************************** Cycle (sec): 60 Critical Vol./Cap.(X): 0.362 Loss Time (sec): 8 (Y+R=4.0 sec) Average Delay (sec/veh): xxxxxx Optimal Cycle: 27 Level Of Service: A ******************************************************************************** Street Name: San Pablo Ave Appian Wy Approach: North Bound South Bound East Bound West Bound Movement: L - T - R L - T - R L - T - R L - T - R ------------|---------------||---------------||---------------||---------------| Control: Permitted Permitted Permitted Permitted Rights: Include Include Include Include Min. Green: 0 0 0 0 0 0 0 0 0 0 0 0 Lanes: 1 0 2 0 1 1 0 1 1 0 1 0 0 1 0 1 0 0 1 0 ------------|---------------||---------------||---------------||---------------| Volume Module: Base Vol: 4 285 169 337 764 8 21 69 12 91 6 68 Growth Adj: 1.00 1.00 1.00 1.00 1.00 1.00 1.00 1.00 1.00 1.00 1.00 1.00 Initial Bse: 4 285 169 337 764 8 21 69 12 91 6 68 Added Vol: 0 0 0 0 0 0 0 0 0 0 0 0 PasserByVol: 0 0 0 0 0 0 0 0 0 0 0 0 Initial Fut: 4 285 169 337 764 8 21 69 12 91 6 68 User Adj: 1.00 1.00 1.00 1.00 1.00 1.00 1.00 1.00 1.00 1.00 1.00 1.00 PHF Adj: 1.00 1.00 1.00 1.00 1.00 1.00 1.00 1.00 1.00 1.00 1.00 1.00 PHF Volume: 4 285 169 337 764 8 21 69 12 91 6 68 Reduct Vol: 0 0 0 0 0 0 0 0 0 0 0 0 Reduced Vol: 4 285 169 337 764 8 21 69 12 91 6 68 RTOR Reduct: 0 0 91 0 0 0 0 0 0 0 0 0 RTOR Vol: 4 285 78 337 764 8 21 69 12 91 6 68 PCE Adj: 1.00 1.00 1.00 1.00 1.00 1.00 1.00 1.00 1.00 1.00 1.00 1.00 MLF Adj: 1.00 1.00 1.00 1.00 1.00 1.00 1.00 1.00 1.00 1.00 1.00 1.00 FinalVolume: 4 285 78 337 764 8 21 69 12 91 6 68 ------------|---------------||---------------||---------------||---------------| Saturation Flow Module: Sat/Lane: 1800 1800 1800 1800 1800 1800 1800 1800 1800 1800 1800 1800 Adjustment: 1.00 1.00 1.00 1.00 1.00 1.00 1.00 1.00 1.00 1.00 1.00 1.00 Lanes: 1.00 2.00 1.00 1.00 1.98 0.02 1.00 0.85 0.15 1.00 0.08 0.92 Final Sat.: 1800 3600 1800 1800 3563 37 1800 1533 267 1800 146 1654 ------------|---------------||---------------||---------------||---------------| Capacity Analysis Module: Vol/Sat: 0.00 0.08 0.04 0.19 0.21 0.21 0.01 0.05 0.04 0.05 0.04 0.04 Crit Volume: 143 337 81 91 Crit Moves: **** **** **** **** ******************************************************************************** Traffix 7.9.0415 (c) 2007 Dowling Assoc. Licensed to DKS ASSOC., OAKLAND,CA

Project AM Tue Feb 9, 2010 12:22:34 Page 12-1 -------------------------------------------------------------------------------- -------------------------------------------------------------------------------- Level Of Service Computation Report CCTALOS Method (Future Volume Alternative) ******************************************************************************** Intersection #10 Sycamore Ave / Bayberry Ave ******************************************************************************** Cycle (sec): 120 Critical Vol./Cap.(X): 0.979 Loss Time (sec): 16 (Y+R=4.0 sec) Average Delay (sec/veh): xxxxxx Optimal Cycle: 180 Level Of Service: E ******************************************************************************** Street Name: Bayberry Ave Sycamore Ave Approach: North Bound South Bound East Bound West Bound Movement: L - T - R L - T - R L - T - R L - T - R ------------|---------------||---------------||---------------||---------------| Control: Split Phase Split Phase Protected Protected Rights: Include Include Include Ignore Min. Green: 5 5 5 5 5 5 5 5 5 5 5 5 Lanes: 1 0 0 1 0 1 1 0 0 2 1 0 2 1 0 1 0 2 0 1 ------------|---------------||---------------||---------------||---------------| Volume Module: Base Vol: 47 18 223 912 64 618 20 817 33 223 1635 54 Growth Adj: 1.00 1.00 1.00 1.00 1.00 1.00 1.00 1.00 1.00 1.00 1.00 1.00 Initial Bse: 47 18 223 912 64 618 20 817 33 223 1635 54 Added Vol: 0 0 0 0 0 0 0 0 0 0 0 0 PasserByVol: 0 0 0 0 0 0 0 0 0 0 0 0 Initial Fut: 47 18 223 912 64 618 20 817 33 223 1635 54 User Adj: 1.00 1.00 1.00 1.00 1.00 1.00 1.00 1.00 1.00 1.00 1.00 1.00 PHF Adj: 1.00 1.00 1.00 1.00 1.00 1.00 1.00 1.00 1.00 1.00 1.00 1.00 PHF Volume: 47 18 223 912 64 618 20 817 33 223 1635 54 Reduct Vol: 0 0 0 0 0 0 0 0 0 0 0 0 Reduced Vol: 47 18 223 912 64 618 20 817 33 223 1635 54 RTOR Reduct: 0 0 0 0 0 20 0 0 0 0 0 0 RTOR Vol: 47 18 223 912 64 598 20 817 33 223 1635 54 PCE Adj: 1.00 1.00 1.00 1.00 1.00 1.00 1.00 1.00 1.00 1.00 1.00 1.00 MLF Adj: 1.00 1.00 1.00 1.00 1.00 1.00 1.00 1.00 1.00 1.00 1.00 1.00 FinalVolume: 47 18 223 912 64 598 20 817 33 223 1635 54 ------------|---------------||---------------||---------------||---------------| Saturation Flow Module: Sat/Lane: 1650 1650 1650 1650 1650 1650 1650 1650 1650 1650 1650 1650 Adjustment: 1.00 1.00 1.00 0.91 1.00 0.91 1.00 1.00 1.00 1.00 1.00 1.00 Lanes: 1.00 0.07 0.93 1.87 0.13 2.00 1.00 2.88 0.12 1.00 2.00 1.00 Final Sat.: 1650 123 1527 2803 216 3000 1650 4758 192 1650 3300 1650 ------------|---------------||---------------||---------------||---------------| Capacity Analysis Module: Vol/Sat: 0.03 0.15 0.15 0.33 0.30 0.20 0.01 0.17 0.17 0.14 0.50 0.03 Crit Volume: 241 488 20 818 Crit Moves: **** **** **** **** ******************************************************************************** Traffix 7.9.0415 (c) 2007 Dowling Assoc. Licensed to DKS ASSOC., OAKLAND,CA

P.M. PEAK

Project PM Tue Feb 9, 2010 12:22:44 Page 3-1 -------------------------------------------------------------------------------- -------------------------------------------------------------------------------- Level Of Service Computation Report CCTALOS Method (Future Volume Alternative) ******************************************************************************** Intersection #1 Willow Ave / I-80 WB Off-ramp ******************************************************************************** Cycle (sec): 90 Critical Vol./Cap.(X): 0.308 Loss Time (sec): 8 (Y+R=4.0 sec) Average Delay (sec/veh): xxxxxx Optimal Cycle: 25 Level Of Service: A ******************************************************************************** Street Name: I-80 WB Off-ramp Willow Ave Approach: North Bound South Bound East Bound West Bound Movement: L - T - R L - T - R L - T - R L - T - R ------------|---------------||---------------||---------------||---------------| Control: Protected Protected Protected Protected Rights: Include Include Ignore Ignore Min. Green: 5 5 5 5 5 5 5 5 5 5 5 5 Lanes: 0 0 0 0 0 1 0 0 0 1 0 0 2 0 0 0 0 2 0 0 ------------|---------------||---------------||---------------||---------------| Volume Module: Base Vol: 0 0 0 113 0 92 0 331 0 0 833 0 Growth Adj: 1.00 1.00 1.00 1.00 1.00 1.00 1.00 1.00 1.00 1.00 1.00 1.00 Initial Bse: 0 0 0 113 0 92 0 331 0 0 833 0 Added Vol: 0 0 0 0 0 0 0 0 0 0 0 0 PasserByVol: 0 0 0 0 0 0 0 0 0 0 0 0 Initial Fut: 0 0 0 113 0 92 0 331 0 0 833 0 User Adj: 1.00 1.00 1.00 1.00 1.00 1.00 1.00 1.00 1.00 1.00 1.00 1.00 PHF Adj: 1.00 1.00 1.00 1.00 1.00 1.00 1.00 1.00 1.00 1.00 1.00 1.00 PHF Volume: 0 0 0 113 0 92 0 331 0 0 833 0 Reduct Vol: 0 0 0 0 0 0 0 0 0 0 0 0 Reduced Vol: 0 0 0 113 0 92 0 331 0 0 833 0 RTOR Reduct: 0 0 0 0 0 0 0 0 0 0 0 0 RTOR Vol: 0 0 0 113 0 92 0 331 0 0 833 0 PCE Adj: 1.00 1.00 1.00 1.00 1.00 1.00 1.00 1.00 1.00 1.00 1.00 1.00 MLF Adj: 1.00 1.00 1.00 1.00 1.00 1.00 1.00 1.00 1.00 1.00 1.00 1.00 FinalVolume: 0 0 0 113 0 92 0 331 0 0 833 0 ------------|---------------||---------------||---------------||---------------| Saturation Flow Module: Sat/Lane: 1720 1720 1720 1720 1720 1720 1720 1720 1720 1720 1720 1720 Adjustment: 1.00 1.00 1.00 1.00 1.00 1.00 1.00 1.00 1.00 1.00 1.00 1.00 Lanes: 0.00 0.00 0.00 1.00 0.00 1.00 0.00 2.00 0.00 0.00 2.00 0.00 Final Sat.: 0 0 0 1720 0 1720 0 3440 0 0 3440 0 ------------|---------------||---------------||---------------||---------------| Capacity Analysis Module: Vol/Sat: 0.00 0.00 0.00 0.07 0.00 0.05 0.00 0.10 0.00 0.00 0.24 0.00 Crit Volume: 0 113 0 417 Crit Moves: **** **** **** ******************************************************************************** Traffix 7.9.0415 (c) 2007 Dowling Assoc. Licensed to DKS ASSOC., OAKLAND,CA

Project PM Tue Feb 9, 2010 12:22:44 Page 4-1 -------------------------------------------------------------------------------- -------------------------------------------------------------------------------- Level Of Service Computation Report CCTALOS Method (Future Volume Alternative) ******************************************************************************** Intersection #2 Willow Ave / Hawthorne Ave ******************************************************************************** Cycle (sec): 90 Critical Vol./Cap.(X): 0.241 Loss Time (sec): 8 (Y+R=4.0 sec) Average Delay (sec/veh): xxxxxx Optimal Cycle: 23 Level Of Service: A ******************************************************************************** Street Name: Hawthorne Ave Willow Ave Approach: North Bound South Bound East Bound West Bound Movement: L - T - R L - T - R L - T - R L - T - R ------------|---------------||---------------||---------------||---------------| Control: Protected Protected Protected Protected Rights: Include Include Include Include Min. Green: 0 0 0 5 5 5 5 5 0 0 5 5 Lanes: 0 0 0 0 0 0 0 2! 0 0 1 0 2 0 0 0 0 1 1 0 ------------|---------------||---------------||---------------||---------------| Volume Module: Base Vol: 0 0 0 83 0 10 40 513 0 0 449 134 Growth Adj: 1.00 1.00 1.00 1.00 1.00 1.00 1.00 1.00 1.00 1.00 1.00 1.00 Initial Bse: 0 0 0 83 0 10 40 513 0 0 449 134 Added Vol: 0 0 0 0 0 0 0 0 0 0 0 0 PasserByVol: 0 0 0 0 0 0 0 0 0 0 0 0 Initial Fut: 0 0 0 83 0 10 40 513 0 0 449 134 User Adj: 1.00 1.00 1.00 1.00 1.00 1.00 1.00 1.00 1.00 1.00 1.00 1.00 PHF Adj: 1.00 1.00 1.00 1.00 1.00 1.00 1.00 1.00 1.00 1.00 1.00 1.00 PHF Volume: 0 0 0 83 0 10 40 513 0 0 449 134 Reduct Vol: 0 0 0 0 0 0 0 0 0 0 0 0 Reduced Vol: 0 0 0 83 0 10 40 513 0 0 449 134 RTOR Reduct: 0 0 0 0 0 0 0 0 0 0 0 0 RTOR Vol: 0 0 0 83 0 10 40 513 0 0 449 134 PCE Adj: 1.00 1.00 1.00 1.00 1.00 1.00 1.00 1.00 1.00 1.00 1.00 1.00 MLF Adj: 1.00 1.00 1.00 1.00 1.00 1.00 1.00 1.00 1.00 1.00 1.00 1.00 FinalVolume: 0 0 0 83 0 10 40 513 0 0 449 134 ------------|---------------||---------------||---------------||---------------| Saturation Flow Module: Sat/Lane: 1720 1720 1720 1720 1720 1720 1720 1720 1720 1720 1720 1720 Adjustment: 1.00 1.00 1.00 1.00 1.00 1.00 1.00 1.00 1.00 1.00 1.00 1.00 Lanes: 0.00 0.00 0.00 1.00 0.78 0.22 1.00 2.00 0.00 0.00 1.54 0.46 Final Sat.: 0 0 0 1720 1350 370 1720 3440 0 0 2649 791 ------------|---------------||---------------||---------------||---------------| Capacity Analysis Module: Vol/Sat: 0.00 0.00 0.00 0.05 0.00 0.03 0.02 0.15 0.00 0.00 0.17 0.17 Crit Volume: 0 83 40 292 Crit Moves: **** **** **** ******************************************************************************** Traffix 7.9.0415 (c) 2007 Dowling Assoc. Licensed to DKS ASSOC., OAKLAND,CA

Project PM Tue Feb 9, 2010 12:22:44 Page 5-1 -------------------------------------------------------------------------------- -------------------------------------------------------------------------------- Level Of Service Computation Report CCTALOS Method (Future Volume Alternative) ******************************************************************************** Intersection #3 San Pablo Ave / Willow Ave ******************************************************************************** Cycle (sec): 90 Critical Vol./Cap.(X): 0.445 Loss Time (sec): 12 (Y+R=4.0 sec) Average Delay (sec/veh): xxxxxx Optimal Cycle: 41 Level Of Service: A ******************************************************************************** Street Name: San Pablo Ave Willow Ave Approach: North Bound South Bound East Bound West Bound Movement: L - T - R L - T - R L - T - R L - T - R ------------|---------------||---------------||---------------||---------------| Control: Permitted Permitted Split Phase Split Phase Rights: Include Include Ignore Include Min. Green: 5 5 5 5 5 5 5 5 5 5 5 5 Lanes: 2 0 0 0 1 0 0 0 0 0 0 0 1 1 0 1 0 2 0 0 ------------|---------------||---------------||---------------||---------------| Volume Module: Base Vol: 522 0 187 0 0 0 0 398 0 139 559 0 Growth Adj: 1.00 1.00 1.00 1.00 1.00 1.00 1.00 1.00 1.00 1.00 1.00 1.00 Initial Bse: 522 0 187 0 0 0 0 398 0 139 559 0 Added Vol: 0 0 0 0 0 0 0 0 0 0 0 0 PasserByVol: 0 0 0 0 0 0 0 0 0 0 0 0 Initial Fut: 522 0 187 0 0 0 0 398 0 139 559 0 User Adj: 1.00 1.00 1.00 1.00 1.00 1.00 1.00 1.00 1.00 1.00 1.00 1.00 PHF Adj: 1.00 1.00 1.00 1.00 1.00 1.00 1.00 1.00 1.00 1.00 1.00 1.00 PHF Volume: 522 0 187 0 0 0 0 398 0 139 559 0 Reduct Vol: 0 0 0 0 0 0 0 0 0 0 0 0 Reduced Vol: 522 0 187 0 0 0 0 398 0 139 559 0 RTOR Reduct: 0 0 139 0 0 0 0 0 0 0 0 0 RTOR Vol: 522 0 48 0 0 0 0 398 0 139 559 0 PCE Adj: 1.00 1.00 1.00 1.00 1.00 1.00 1.00 1.00 1.00 1.00 1.00 1.00 MLF Adj: 1.00 1.00 1.00 1.00 1.00 1.00 1.00 1.00 1.00 1.00 1.00 1.00 FinalVolume: 522 0 48 0 0 0 0 398 0 139 559 0 ------------|---------------||---------------||---------------||---------------| Saturation Flow Module: Sat/Lane: 1720 1720 1720 1720 1720 1720 1720 1720 1720 1720 1720 1720 Adjustment: 0.91 1.00 1.00 1.00 1.00 1.00 1.00 1.00 1.00 1.00 1.00 1.00 Lanes: 2.00 0.00 1.00 0.00 0.00 0.00 0.00 2.00 0.00 1.00 2.00 0.00 Final Sat.: 3127 0 1720 0 0 0 0 3440 0 1720 3440 0 ------------|---------------||---------------||---------------||---------------| Capacity Analysis Module: Vol/Sat: 0.17 0.00 0.03 0.00 0.00 0.00 0.00 0.12 0.00 0.08 0.16 0.00 Crit Volume: 261 0 199 280 Crit Moves: **** **** **** ******************************************************************************** Traffix 7.9.0415 (c) 2007 Dowling Assoc. Licensed to DKS ASSOC., OAKLAND,CA
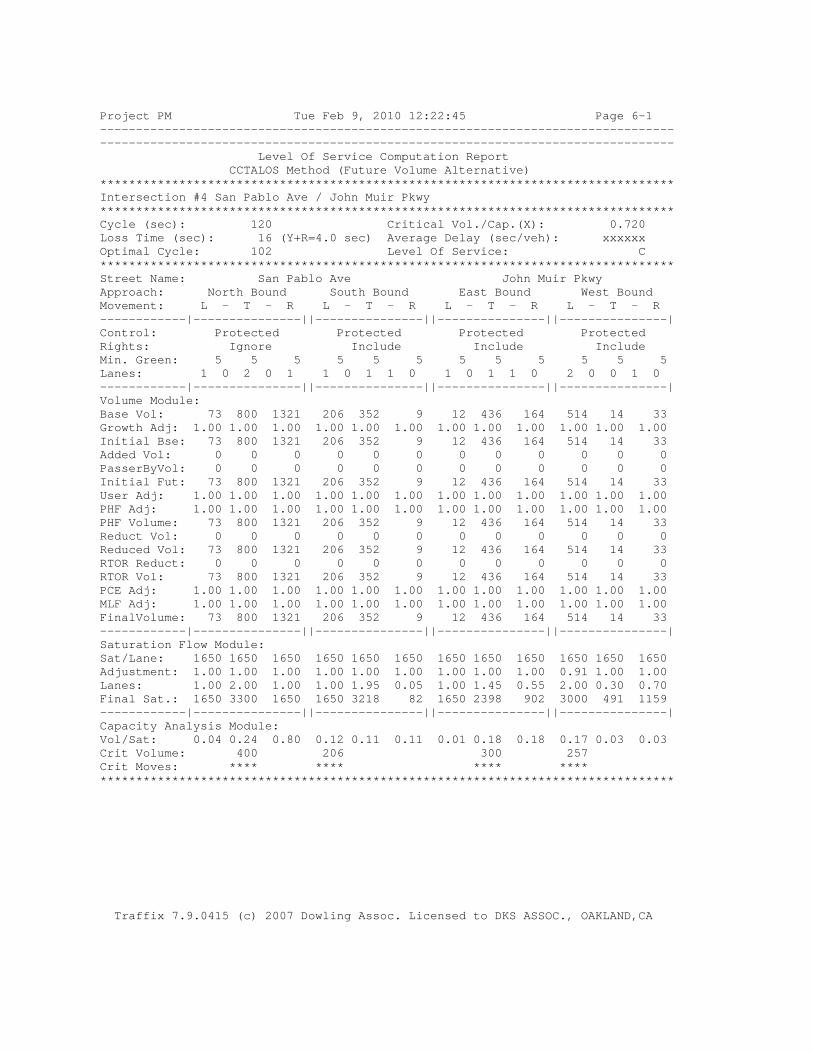
Project PM Tue Feb 9, 2010 12:22:45 Page 6-1 -------------------------------------------------------------------------------- -------------------------------------------------------------------------------- Level Of Service Computation Report CCTALOS Method (Future Volume Alternative) ******************************************************************************** Intersection #4 San Pablo Ave / John Muir Pkwy ******************************************************************************** Cycle (sec): 120 Critical Vol./Cap.(X): 0.720 Loss Time (sec): 16 (Y+R=4.0 sec) Average Delay (sec/veh): xxxxxx Optimal Cycle: 102 Level Of Service: C ******************************************************************************** Street Name: San Pablo Ave John Muir Pkwy Approach: North Bound South Bound East Bound West Bound Movement: L - T - R L - T - R L - T - R L - T - R ------------|---------------||---------------||---------------||---------------| Control: Protected Protected Protected Protected Rights: Ignore Include Include Include Min. Green: 5 5 5 5 5 5 5 5 5 5 5 5 Lanes: 1 0 2 0 1 1 0 1 1 0 1 0 1 1 0 2 0 0 1 0 ------------|---------------||---------------||---------------||---------------| Volume Module: Base Vol: 73 800 1321 206 352 9 12 436 164 514 14 33 Growth Adj: 1.00 1.00 1.00 1.00 1.00 1.00 1.00 1.00 1.00 1.00 1.00 1.00 Initial Bse: 73 800 1321 206 352 9 12 436 164 514 14 33 Added Vol: 0 0 0 0 0 0 0 0 0 0 0 0 PasserByVol: 0 0 0 0 0 0 0 0 0 0 0 0 Initial Fut: 73 800 1321 206 352 9 12 436 164 514 14 33 User Adj: 1.00 1.00 1.00 1.00 1.00 1.00 1.00 1.00 1.00 1.00 1.00 1.00 PHF Adj: 1.00 1.00 1.00 1.00 1.00 1.00 1.00 1.00 1.00 1.00 1.00 1.00 PHF Volume: 73 800 1321 206 352 9 12 436 164 514 14 33 Reduct Vol: 0 0 0 0 0 0 0 0 0 0 0 0 Reduced Vol: 73 800 1321 206 352 9 12 436 164 514 14 33 RTOR Reduct: 0 0 0 0 0 0 0 0 0 0 0 0 RTOR Vol: 73 800 1321 206 352 9 12 436 164 514 14 33 PCE Adj: 1.00 1.00 1.00 1.00 1.00 1.00 1.00 1.00 1.00 1.00 1.00 1.00 MLF Adj: 1.00 1.00 1.00 1.00 1.00 1.00 1.00 1.00 1.00 1.00 1.00 1.00 FinalVolume: 73 800 1321 206 352 9 12 436 164 514 14 33 ------------|---------------||---------------||---------------||---------------| Saturation Flow Module: Sat/Lane: 1650 1650 1650 1650 1650 1650 1650 1650 1650 1650 1650 1650 Adjustment: 1.00 1.00 1.00 1.00 1.00 1.00 1.00 1.00 1.00 0.91 1.00 1.00 Lanes: 1.00 2.00 1.00 1.00 1.95 0.05 1.00 1.45 0.55 2.00 0.30 0.70 Final Sat.: 1650 3300 1650 1650 3218 82 1650 2398 902 3000 491 1159 ------------|---------------||---------------||---------------||---------------| Capacity Analysis Module: Vol/Sat: 0.04 0.24 0.80 0.12 0.11 0.11 0.01 0.18 0.18 0.17 0.03 0.03 Crit Volume: 400 206 300 257 Crit Moves: **** **** **** **** ******************************************************************************** Traffix 7.9.0415 (c) 2007 Dowling Assoc. Licensed to DKS ASSOC., OAKLAND,CA

Project PM Tue Feb 9, 2010 12:22:45 Page 7-1 -------------------------------------------------------------------------------- -------------------------------------------------------------------------------- Level Of Service Computation Report CCTALOS Method (Future Volume Alternative) ******************************************************************************** Intersection #5 San Pablo Ave / Sycamore Ave ******************************************************************************** Cycle (sec): 120 Critical Vol./Cap.(X): 0.833 Loss Time (sec): 16 (Y+R=4.0 sec) Average Delay (sec/veh): xxxxxx Optimal Cycle: 170 Level Of Service: D ******************************************************************************** Street Name: San Pablo Ave Sycamore Ave Approach: North Bound South Bound East Bound West Bound Movement: L - T - R L - T - R L - T - R L - T - R ------------|---------------||---------------||---------------||---------------| Control: Protected Protected Split Phase Split Phase Rights: Include Include Include Include Min. Green: 5 5 5 5 5 5 5 5 5 5 5 5 Lanes: 2 0 2 0 1 2 0 1 1 0 1 0 1 1 0 1 1 0 0 2 ------------|---------------||---------------||---------------||---------------| Volume Module: Base Vol: 47 1012 590 667 481 398 119 72 21 320 121 1062 Growth Adj: 1.00 1.00 1.00 1.00 1.00 1.00 1.00 1.00 1.00 1.00 1.00 1.00 Initial Bse: 47 1012 590 667 481 398 119 72 21 320 121 1062 Added Vol: 0 0 0 0 0 0 0 0 0 0 0 0 PasserByVol: 0 0 0 0 0 0 0 0 0 0 0 0 Initial Fut: 47 1012 590 667 481 398 119 72 21 320 121 1062 User Adj: 1.00 1.00 1.00 1.00 1.00 1.00 1.00 1.00 1.00 1.00 1.00 1.00 PHF Adj: 1.00 1.00 1.00 1.00 1.00 1.00 1.00 1.00 1.00 1.00 1.00 1.00 PHF Volume: 47 1012 590 667 481 398 119 72 21 320 121 1062 Reduct Vol: 0 0 0 0 0 0 0 0 0 0 0 0 Reduced Vol: 47 1012 590 667 481 398 119 72 21 320 121 1062 RTOR Reduct: 0 0 176 0 0 0 0 0 0 0 0 367 RTOR Vol: 47 1012 414 667 481 398 119 72 21 320 121 695 PCE Adj: 1.00 1.00 1.00 1.00 1.00 1.00 1.00 1.00 1.00 1.00 1.00 1.00 MLF Adj: 1.00 1.00 1.00 1.00 1.00 1.00 1.00 1.00 1.00 1.00 1.00 1.00 FinalVolume: 47 1012 414 667 481 398 119 72 21 320 121 695 ------------|---------------||---------------||---------------||---------------| Saturation Flow Module: Sat/Lane: 1650 1650 1650 1650 1650 1650 1650 1650 1650 1650 1650 1650 Adjustment: 0.91 1.00 1.00 0.91 1.00 1.00 1.00 1.00 1.00 0.91 1.00 0.91 Lanes: 2.00 2.00 1.00 2.00 1.09 0.91 1.00 1.55 0.45 1.45 0.55 2.00 Final Sat.: 3000 3300 1650 3000 1806 1494 1650 2555 745 2177 905 3000 ------------|---------------||---------------||---------------||---------------| Capacity Analysis Module: Vol/Sat: 0.02 0.31 0.25 0.22 0.27 0.27 0.07 0.03 0.03 0.15 0.13 0.23 Crit Volume: 506 334 119 348 Crit Moves: **** **** **** **** ******************************************************************************** Traffix 7.9.0415 (c) 2007 Dowling Assoc. Licensed to DKS ASSOC., OAKLAND,CA

Project PM Tue Feb 9, 2010 12:22:45 Page 8-1 -------------------------------------------------------------------------------- -------------------------------------------------------------------------------- Level Of Service Computation Report CCTALOS Method (Future Volume Alternative) ******************************************************************************** Intersection #6 San Pablo Ave / Hercules Ave ******************************************************************************** Cycle (sec): 120 Critical Vol./Cap.(X): 0.534 Loss Time (sec): 16 (Y+R=4.0 sec) Average Delay (sec/veh): xxxxxx Optimal Cycle: 61 Level Of Service: A ******************************************************************************** Street Name: San Pablo Ave Hercules Ave Approach: North Bound South Bound East Bound West Bound Movement: L - T - R L - T - R L - T - R L - T - R ------------|---------------||---------------||---------------||---------------| Control: Protected Protected Split Phase Split Phase Rights: Include Include Include Include Min. Green: 5 5 5 5 5 5 5 5 5 5 5 5 Lanes: 1 0 2 0 1 1 0 2 0 1 1 0 1 0 1 0 1 0 1 0 ------------|---------------||---------------||---------------||---------------| Volume Module: Base Vol: 270 1133 157 147 543 173 97 8 98 69 7 64 Growth Adj: 1.00 1.00 1.00 1.00 1.00 1.00 1.00 1.00 1.00 1.00 1.00 1.00 Initial Bse: 270 1133 157 147 543 173 97 8 98 69 7 64 Added Vol: 0 0 0 0 0 0 0 0 0 0 0 0 PasserByVol: 0 0 0 0 0 0 0 0 0 0 0 0 Initial Fut: 270 1133 157 147 543 173 97 8 98 69 7 64 User Adj: 1.00 1.00 1.00 1.00 1.00 1.00 1.00 1.00 1.00 1.00 1.00 1.00 PHF Adj: 1.00 1.00 1.00 1.00 1.00 1.00 1.00 1.00 1.00 1.00 1.00 1.00 PHF Volume: 270 1133 157 147 543 173 97 8 98 69 7 64 Reduct Vol: 0 0 0 0 0 0 0 0 0 0 0 0 Reduced Vol: 270 1133 157 147 543 173 97 8 98 69 7 64 RTOR Reduct: 0 0 69 0 0 97 0 0 98 0 0 0 RTOR Vol: 270 1133 88 147 543 76 97 8 0 69 7 64 PCE Adj: 1.00 1.00 1.00 1.00 1.00 1.00 1.00 1.00 1.00 1.00 1.00 1.00 MLF Adj: 1.00 1.00 1.00 1.00 1.00 1.00 1.00 1.00 1.00 1.00 1.00 1.00 FinalVolume: 270 1133 88 147 543 76 97 8 0 69 7 64 ------------|---------------||---------------||---------------||---------------| Saturation Flow Module: Sat/Lane: 1650 1650 1650 1650 1650 1650 1650 1650 1650 1650 1650 1650 Adjustment: 1.00 1.00 1.00 1.00 1.00 1.00 1.00 1.00 1.00 1.00 1.00 1.00 Lanes: 1.00 2.00 1.00 1.00 2.00 1.00 1.00 1.00 1.00 0.99 0.10 0.91 Final Sat.: 1650 3300 1650 1650 3300 1650 1650 1650 1650 1626 165 1509 ------------|---------------||---------------||---------------||---------------| Capacity Analysis Module: Vol/Sat: 0.16 0.34 0.05 0.09 0.16 0.05 0.06 0.00 0.00 0.04 0.04 0.04 Crit Volume: 567 147 97 70 Crit Moves: **** **** **** **** ******************************************************************************** Traffix 7.9.0415 (c) 2007 Dowling Assoc. Licensed to DKS ASSOC., OAKLAND,CA

Project PM Tue Feb 9, 2010 12:22:45 Page 9-1 -------------------------------------------------------------------------------- -------------------------------------------------------------------------------- Level Of Service Computation Report CCTALOS Method (Future Volume Alternative) ******************************************************************************** Intersection #7 San Pablo Ave / Pinole Valley Rd ******************************************************************************** Cycle (sec): 60 Critical Vol./Cap.(X): 0.582 Loss Time (sec): 8 (Y+R=4.0 sec) Average Delay (sec/veh): xxxxxx Optimal Cycle: 41 Level Of Service: A ******************************************************************************** Street Name: San Pablo Ave Pinole Valley Rd Approach: North Bound South Bound East Bound West Bound Movement: L - T - R L - T - R L - T - R L - T - R ------------|---------------||---------------||---------------||---------------| Control: Permitted Permitted Permitted Permitted Rights: Include Include Include Include Min. Green: 5 5 5 5 5 5 5 5 5 5 5 5 Lanes: 0 1 0 1 0 0 1 1 0 1 0 0 1! 0 0 0 1 0 0 1 ------------|---------------||---------------||---------------||---------------| Volume Module: Base Vol: 19 1436 14 76 574 4 9 4 9 6 6 294 Growth Adj: 1.00 1.00 1.00 1.00 1.00 1.00 1.00 1.00 1.00 1.00 1.00 1.00 Initial Bse: 19 1436 14 76 574 4 9 4 9 6 6 294 Added Vol: 0 0 0 0 0 0 0 0 0 0 0 0 PasserByVol: 0 0 0 0 0 0 0 0 0 0 0 0 Initial Fut: 19 1436 14 76 574 4 9 4 9 6 6 294 User Adj: 1.00 1.00 1.00 1.00 1.00 1.00 1.00 1.00 1.00 1.00 1.00 1.00 PHF Adj: 1.00 1.00 1.00 1.00 1.00 1.00 1.00 1.00 1.00 1.00 1.00 1.00 PHF Volume: 19 1436 14 76 574 4 9 4 9 6 6 294 Reduct Vol: 0 0 0 0 0 0 0 0 0 0 0 0 Reduced Vol: 19 1436 14 76 574 4 9 4 9 6 6 294 RTOR Reduct: 0 0 0 0 0 4 0 0 0 0 0 76 RTOR Vol: 19 1436 14 76 574 0 9 4 9 6 6 218 PCE Adj: 2.00 1.00 1.00 6.00 1.00 1.00 1.00 1.00 1.00 1.00 1.00 1.00 MLF Adj: 1.00 1.00 1.00 1.00 1.00 1.00 1.00 1.00 1.00 1.00 1.00 1.00 FinalVolume: 38 1436 14 456 574 0 9 4 9 6 6 218 ------------|---------------||---------------||---------------||---------------| Saturation Flow Module: Sat/Lane: 1800 1800 1800 1800 1800 1800 1800 1800 1800 1800 1800 1800 Adjustment: 1.00 1.00 1.00 1.00 1.00 1.00 1.00 1.00 1.00 1.00 1.00 1.00 Lanes: 0.03 1.95 0.02 1.00 1.00 1.00 0.41 0.18 0.41 0.50 0.50 1.00 Final Sat.: 47 3519 34 1800 1800 1800 736 327 736 900 900 1800 ------------|---------------||---------------||---------------||---------------| Capacity Analysis Module: Vol/Sat: 0.40 0.41 0.41 0.04 0.32 0.00 0.01 0.01 0.01 0.01 0.01 0.12 Crit Volume: 744 76 9 218 Crit Moves: **** **** **** **** ******************************************************************************** Traffix 7.9.0415 (c) 2007 Dowling Assoc. Licensed to DKS ASSOC., OAKLAND,CA

Project PM Tue Feb 9, 2010 12:22:45 Page 10-1 -------------------------------------------------------------------------------- -------------------------------------------------------------------------------- Level Of Service Computation Report CCTALOS Method (Future Volume Alternative) ******************************************************************************** Intersection #8 San Pablo Ave / Tennent Ave ******************************************************************************** Cycle (sec): 60 Critical Vol./Cap.(X): 0.709 Loss Time (sec): 8 (Y+R=4.0 sec) Average Delay (sec/veh): xxxxxx Optimal Cycle: 59 Level Of Service: C ******************************************************************************** Street Name: San Pablo Ave Tennent Ave Approach: North Bound South Bound East Bound West Bound Movement: L - T - R L - T - R L - T - R L - T - R ------------|---------------||---------------||---------------||---------------| Control: Permitted Permitted Permitted Permitted Rights: Ignore Ignore Ignore Ignore Min. Green: 0 0 0 0 0 0 0 0 0 0 0 0 Lanes: 0 1 1 0 1 0 1 0 1 0 0 0 1! 0 0 1 0 0 1 0 ------------|---------------||---------------||---------------||---------------| Volume Module: Base Vol: 60 1757 184 46 332 44 47 33 10 153 79 161 Growth Adj: 1.00 1.00 1.00 1.00 1.00 1.00 1.00 1.00 1.00 1.00 1.00 1.00 Initial Bse: 60 1757 184 46 332 44 47 33 10 153 79 161 Added Vol: 0 0 0 0 0 0 0 0 0 0 0 0 PasserByVol: 0 0 0 0 0 0 0 0 0 0 0 0 Initial Fut: 60 1757 184 46 332 44 47 33 10 153 79 161 User Adj: 1.00 1.00 1.00 1.00 1.00 1.00 1.00 1.00 1.00 1.00 1.00 1.00 PHF Adj: 1.00 1.00 1.00 1.00 1.00 1.00 1.00 1.00 1.00 1.00 1.00 1.00 PHF Volume: 60 1757 184 46 332 44 47 33 10 153 79 161 Reduct Vol: 0 0 0 0 0 0 0 0 0 0 0 0 Reduced Vol: 60 1757 184 46 332 44 47 33 10 153 79 161 RTOR Reduct: 0 0 0 0 0 0 0 0 0 0 0 0 RTOR Vol: 60 1757 184 46 332 44 47 33 10 153 79 161 PCE Adj: 2.00 1.00 1.00 6.00 1.00 1.00 1.00 1.00 1.00 1.00 1.00 1.00 MLF Adj: 1.00 1.00 1.00 1.00 1.00 1.00 1.00 1.00 1.00 1.00 1.00 1.00 FinalVolume: 120 1757 184 276 332 44 47 33 10 153 79 161 ------------|---------------||---------------||---------------||---------------| Saturation Flow Module: Sat/Lane: 1800 1800 1800 1800 1800 1800 1800 1800 1800 1800 1800 1800 Adjustment: 1.00 1.00 1.00 1.00 1.00 1.00 1.00 1.00 1.00 1.00 1.00 1.00 Lanes: 0.14 1.86 1.00 0.48 1.39 0.13 0.52 0.37 0.11 1.00 0.33 0.67 Final Sat.: 246 3354 1800 863 2495 243 940 660 200 1800 593 1208 ------------|---------------||---------------||---------------||---------------| Capacity Analysis Module: Vol/Sat: 0.24 0.52 0.10 0.05 0.13 0.18 0.05 0.05 0.05 0.09 0.13 0.13 Crit Volume: 943 46 47 240 Crit Moves: **** **** **** **** ******************************************************************************** Traffix 7.9.0415 (c) 2007 Dowling Assoc. Licensed to DKS ASSOC., OAKLAND,CA
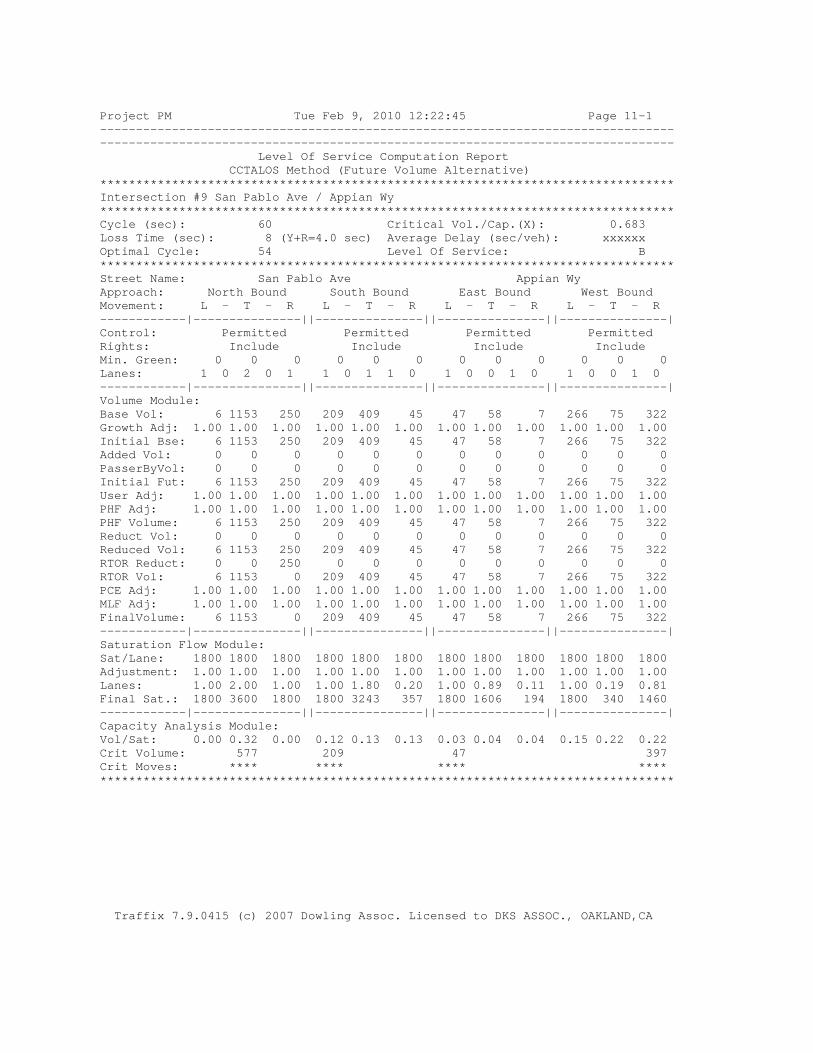
Project PM Tue Feb 9, 2010 12:22:45 Page 11-1 -------------------------------------------------------------------------------- -------------------------------------------------------------------------------- Level Of Service Computation Report CCTALOS Method (Future Volume Alternative) ******************************************************************************** Intersection #9 San Pablo Ave / Appian Wy ******************************************************************************** Cycle (sec): 60 Critical Vol./Cap.(X): 0.683 Loss Time (sec): 8 (Y+R=4.0 sec) Average Delay (sec/veh): xxxxxx Optimal Cycle: 54 Level Of Service: B ******************************************************************************** Street Name: San Pablo Ave Appian Wy Approach: North Bound South Bound East Bound West Bound Movement: L - T - R L - T - R L - T - R L - T - R ------------|---------------||---------------||---------------||---------------| Control: Permitted Permitted Permitted Permitted Rights: Include Include Include Include Min. Green: 0 0 0 0 0 0 0 0 0 0 0 0 Lanes: 1 0 2 0 1 1 0 1 1 0 1 0 0 1 0 1 0 0 1 0 ------------|---------------||---------------||---------------||---------------| Volume Module: Base Vol: 6 1153 250 209 409 45 47 58 7 266 75 322 Growth Adj: 1.00 1.00 1.00 1.00 1.00 1.00 1.00 1.00 1.00 1.00 1.00 1.00 Initial Bse: 6 1153 250 209 409 45 47 58 7 266 75 322 Added Vol: 0 0 0 0 0 0 0 0 0 0 0 0 PasserByVol: 0 0 0 0 0 0 0 0 0 0 0 0 Initial Fut: 6 1153 250 209 409 45 47 58 7 266 75 322 User Adj: 1.00 1.00 1.00 1.00 1.00 1.00 1.00 1.00 1.00 1.00 1.00 1.00 PHF Adj: 1.00 1.00 1.00 1.00 1.00 1.00 1.00 1.00 1.00 1.00 1.00 1.00 PHF Volume: 6 1153 250 209 409 45 47 58 7 266 75 322 Reduct Vol: 0 0 0 0 0 0 0 0 0 0 0 0 Reduced Vol: 6 1153 250 209 409 45 47 58 7 266 75 322 RTOR Reduct: 0 0 250 0 0 0 0 0 0 0 0 0 RTOR Vol: 6 1153 0 209 409 45 47 58 7 266 75 322 PCE Adj: 1.00 1.00 1.00 1.00 1.00 1.00 1.00 1.00 1.00 1.00 1.00 1.00 MLF Adj: 1.00 1.00 1.00 1.00 1.00 1.00 1.00 1.00 1.00 1.00 1.00 1.00 FinalVolume: 6 1153 0 209 409 45 47 58 7 266 75 322 ------------|---------------||---------------||---------------||---------------| Saturation Flow Module: Sat/Lane: 1800 1800 1800 1800 1800 1800 1800 1800 1800 1800 1800 1800 Adjustment: 1.00 1.00 1.00 1.00 1.00 1.00 1.00 1.00 1.00 1.00 1.00 1.00 Lanes: 1.00 2.00 1.00 1.00 1.80 0.20 1.00 0.89 0.11 1.00 0.19 0.81 Final Sat.: 1800 3600 1800 1800 3243 357 1800 1606 194 1800 340 1460 ------------|---------------||---------------||---------------||---------------| Capacity Analysis Module: Vol/Sat: 0.00 0.32 0.00 0.12 0.13 0.13 0.03 0.04 0.04 0.15 0.22 0.22 Crit Volume: 577 209 47 397 Crit Moves: **** **** **** **** ******************************************************************************** Traffix 7.9.0415 (c) 2007 Dowling Assoc. Licensed to DKS ASSOC., OAKLAND,CA

Project PM Tue Feb 9, 2010 12:22:45 Page 12-1 -------------------------------------------------------------------------------- -------------------------------------------------------------------------------- Level Of Service Computation Report CCTALOS Method (Future Volume Alternative) ******************************************************************************** Intersection #10 Sycamore Ave / Bayberry Ave ******************************************************************************** Cycle (sec): 120 Critical Vol./Cap.(X): 1.098 Loss Time (sec): 16 (Y+R=4.0 sec) Average Delay (sec/veh): xxxxxx Optimal Cycle: 180 Level Of Service: F ******************************************************************************** Street Name: Bayberry Ave Sycamore Ave Approach: North Bound South Bound East Bound West Bound Movement: L - T - R L - T - R L - T - R L - T - R ------------|---------------||---------------||---------------||---------------| Control: Split Phase Split Phase Protected Protected Rights: Include Include Include Ignore Min. Green: 5 5 5 5 5 5 5 5 5 5 5 5 Lanes: 1 0 0 1 0 1 1 0 0 2 1 0 2 1 0 1 0 2 0 1 ------------|---------------||---------------||---------------||---------------| Volume Module: Base Vol: 47 34 368 1130 92 413 76 1037 41 116 1324 72 Growth Adj: 1.00 1.00 1.00 1.00 1.00 1.00 1.00 1.00 1.00 1.00 1.00 1.00 Initial Bse: 47 34 368 1130 92 413 76 1037 41 116 1324 72 Added Vol: 0 0 0 0 0 0 0 0 0 0 0 0 PasserByVol: 0 0 0 0 0 0 0 0 0 0 0 0 Initial Fut: 47 34 368 1130 92 413 76 1037 41 116 1324 72 User Adj: 1.00 1.00 1.00 1.00 1.00 1.00 1.00 1.00 1.00 1.00 1.00 1.00 PHF Adj: 1.00 1.00 1.00 1.00 1.00 1.00 1.00 1.00 1.00 1.00 1.00 1.00 PHF Volume: 47 34 368 1130 92 413 76 1037 41 116 1324 72 Reduct Vol: 0 0 0 0 0 0 0 0 0 0 0 0 Reduced Vol: 47 34 368 1130 92 413 76 1037 41 116 1324 72 RTOR Reduct: 0 0 0 0 0 76 0 0 0 0 0 0 RTOR Vol: 47 34 368 1130 92 337 76 1037 41 116 1324 72 PCE Adj: 1.00 1.00 1.00 1.00 1.00 1.00 1.00 1.00 1.00 1.00 1.00 1.00 MLF Adj: 1.00 1.00 1.00 1.00 1.00 1.00 1.00 1.00 1.00 1.00 1.00 1.00 FinalVolume: 47 34 368 1130 92 337 76 1037 41 116 1324 72 ------------|---------------||---------------||---------------||---------------| Saturation Flow Module: Sat/Lane: 1650 1650 1650 1650 1650 1650 1650 1650 1650 1650 1650 1650 Adjustment: 1.00 1.00 1.00 0.91 1.00 0.91 1.00 1.00 1.00 1.00 1.00 1.00 Lanes: 1.00 0.08 0.92 1.85 0.15 2.00 1.00 2.89 0.11 1.00 2.00 1.00 Final Sat.: 1650 140 1510 2774 248 3000 1650 4762 188 1650 3300 1650 ------------|---------------||---------------||---------------||---------------| Capacity Analysis Module: Vol/Sat: 0.03 0.24 0.24 0.41 0.37 0.11 0.05 0.22 0.22 0.07 0.40 0.04 Crit Volume: 402 611 76 662 Crit Moves: **** **** **** **** ******************************************************************************** Traffix 7.9.0415 (c) 2007 Dowling Assoc. Licensed to DKS ASSOC., OAKLAND,CA

Year 2035 Cumulative Baseline
Condition
A.M. Peak

Cumulative AM Tue Feb 9, 2010 12:23:11 Page 3-1 -------------------------------------------------------------------------------- -------------------------------------------------------------------------------- Level Of Service Computation Report CCTALOS Method (Future Volume Alternative) ******************************************************************************** Intersection #1 Willow Ave / I-80 WB Off-ramp ******************************************************************************** Cycle (sec): 90 Critical Vol./Cap.(X): 0.591 Loss Time (sec): 8 (Y+R=4.0 sec) Average Delay (sec/veh): xxxxxx Optimal Cycle: 42 Level Of Service: A ******************************************************************************** Street Name: I-80 WB Off-ramp Willow Ave Approach: North Bound South Bound East Bound West Bound Movement: L - T - R L - T - R L - T - R L - T - R ------------|---------------||---------------||---------------||---------------| Control: Protected Protected Protected Protected Rights: Include Include Ignore Ignore Min. Green: 5 5 5 5 5 5 5 5 5 5 5 5 Lanes: 0 0 0 0 0 1 0 0 0 1 0 0 2 0 0 0 0 2 0 0 ------------|---------------||---------------||---------------||---------------| Volume Module: Base Vol: 0 0 0 217 0 248 0 492 0 0 1537 0 Growth Adj: 1.00 1.00 1.00 1.00 1.00 1.00 1.00 1.00 1.00 1.00 1.00 1.00 Initial Bse: 0 0 0 217 0 248 0 492 0 0 1537 0 Added Vol: 0 0 0 0 0 0 0 0 0 0 0 0 PasserByVol: 0 0 0 0 0 0 0 0 0 0 0 0 Initial Fut: 0 0 0 217 0 248 0 492 0 0 1537 0 User Adj: 1.00 1.00 1.00 1.00 1.00 1.00 1.00 1.00 1.00 1.00 1.00 1.00 PHF Adj: 1.00 1.00 1.00 1.00 1.00 1.00 1.00 1.00 1.00 1.00 1.00 1.00 PHF Volume: 0 0 0 217 0 248 0 492 0 0 1537 0 Reduct Vol: 0 0 0 0 0 0 0 0 0 0 0 0 Reduced Vol: 0 0 0 217 0 248 0 492 0 0 1537 0 RTOR Reduct: 0 0 0 0 0 0 0 0 0 0 0 0 RTOR Vol: 0 0 0 217 0 248 0 492 0 0 1537 0 PCE Adj: 1.00 1.00 1.00 1.00 1.00 1.00 1.00 1.00 1.00 1.00 1.00 1.00 MLF Adj: 1.00 1.00 1.00 1.00 1.00 1.00 1.00 1.00 1.00 1.00 1.00 1.00 FinalVolume: 0 0 0 217 0 248 0 492 0 0 1537 0 ------------|---------------||---------------||---------------||---------------| Saturation Flow Module: Sat/Lane: 1720 1720 1720 1720 1720 1720 1720 1720 1720 1720 1720 1720 Adjustment: 1.00 1.00 1.00 1.00 1.00 1.00 1.00 1.00 1.00 1.00 1.00 1.00 Lanes: 0.00 0.00 0.00 1.00 0.00 1.00 0.00 2.00 0.00 0.00 2.00 0.00 Final Sat.: 0 0 0 1720 0 1720 0 3440 0 0 3440 0 ------------|---------------||---------------||---------------||---------------| Capacity Analysis Module: Vol/Sat: 0.00 0.00 0.00 0.13 0.00 0.14 0.00 0.14 0.00 0.00 0.45 0.00 Crit Volume: 0 248 0 769 Crit Moves: **** **** **** ******************************************************************************** Traffix 7.9.0415 (c) 2007 Dowling Assoc. Licensed to DKS ASSOC., OAKLAND,CA

Cumulative AM Tue Feb 9, 2010 12:23:11 Page 4-1 -------------------------------------------------------------------------------- -------------------------------------------------------------------------------- Level Of Service Computation Report CCTALOS Method (Future Volume Alternative) ******************************************************************************** Intersection #2 Willow Ave / Hawthorne Ave ******************************************************************************** Cycle (sec): 90 Critical Vol./Cap.(X): 0.781 Loss Time (sec): 8 (Y+R=4.0 sec) Average Delay (sec/veh): xxxxxx Optimal Cycle: 79 Level Of Service: C ******************************************************************************** Street Name: Hawthorne Ave Willow Ave Approach: North Bound South Bound East Bound West Bound Movement: L - T - R L - T - R L - T - R L - T - R ------------|---------------||---------------||---------------||---------------| Control: Protected Protected Protected Protected Rights: Include Include Include Include Min. Green: 0 0 0 5 5 5 5 5 0 0 5 5 Lanes: 0 0 0 0 0 0 0 2! 0 0 1 0 2 0 0 0 0 1 1 0 ------------|---------------||---------------||---------------||---------------| Volume Module: Base Vol: 0 0 0 660 0 39 58 954 0 0 899 352 Growth Adj: 1.00 1.00 1.00 1.00 1.00 1.00 1.00 1.00 1.00 1.00 1.00 1.00 Initial Bse: 0 0 0 660 0 39 58 954 0 0 899 352 Added Vol: 0 0 0 0 0 0 0 0 0 0 0 0 PasserByVol: 0 0 0 0 0 0 0 0 0 0 0 0 Initial Fut: 0 0 0 660 0 39 58 954 0 0 899 352 User Adj: 1.00 1.00 1.00 1.00 1.00 1.00 1.00 1.00 1.00 1.00 1.00 1.00 PHF Adj: 1.00 1.00 1.00 1.00 1.00 1.00 1.00 1.00 1.00 1.00 1.00 1.00 PHF Volume: 0 0 0 660 0 39 58 954 0 0 899 352 Reduct Vol: 0 0 0 0 0 0 0 0 0 0 0 0 Reduced Vol: 0 0 0 660 0 39 58 954 0 0 899 352 RTOR Reduct: 0 0 0 0 0 0 0 0 0 0 0 0 RTOR Vol: 0 0 0 660 0 39 58 954 0 0 899 352 PCE Adj: 1.00 1.00 1.00 1.00 1.00 1.00 1.00 1.00 1.00 1.00 1.00 1.00 MLF Adj: 1.00 1.00 1.00 1.00 1.00 1.00 1.00 1.00 1.00 1.00 1.00 1.00 FinalVolume: 0 0 0 660 0 39 58 954 0 0 899 352 ------------|---------------||---------------||---------------||---------------| Saturation Flow Module: Sat/Lane: 1720 1720 1720 1720 1720 1720 1720 1720 1720 1720 1720 1720 Adjustment: 1.00 1.00 1.00 1.00 1.00 1.00 1.00 1.00 1.00 1.00 1.00 1.00 Lanes: 0.00 0.00 0.00 1.00 0.89 0.11 1.00 2.00 0.00 0.00 1.44 0.56 Final Sat.: 0 0 0 1720 1528 192 1720 3440 0 0 2472 968 ------------|---------------||---------------||---------------||---------------| Capacity Analysis Module: Vol/Sat: 0.00 0.00 0.00 0.38 0.00 0.20 0.03 0.28 0.00 0.00 0.36 0.36 Crit Volume: 0 660 58 626 Crit Moves: **** **** **** ******************************************************************************** Traffix 7.9.0415 (c) 2007 Dowling Assoc. Licensed to DKS ASSOC., OAKLAND,CA
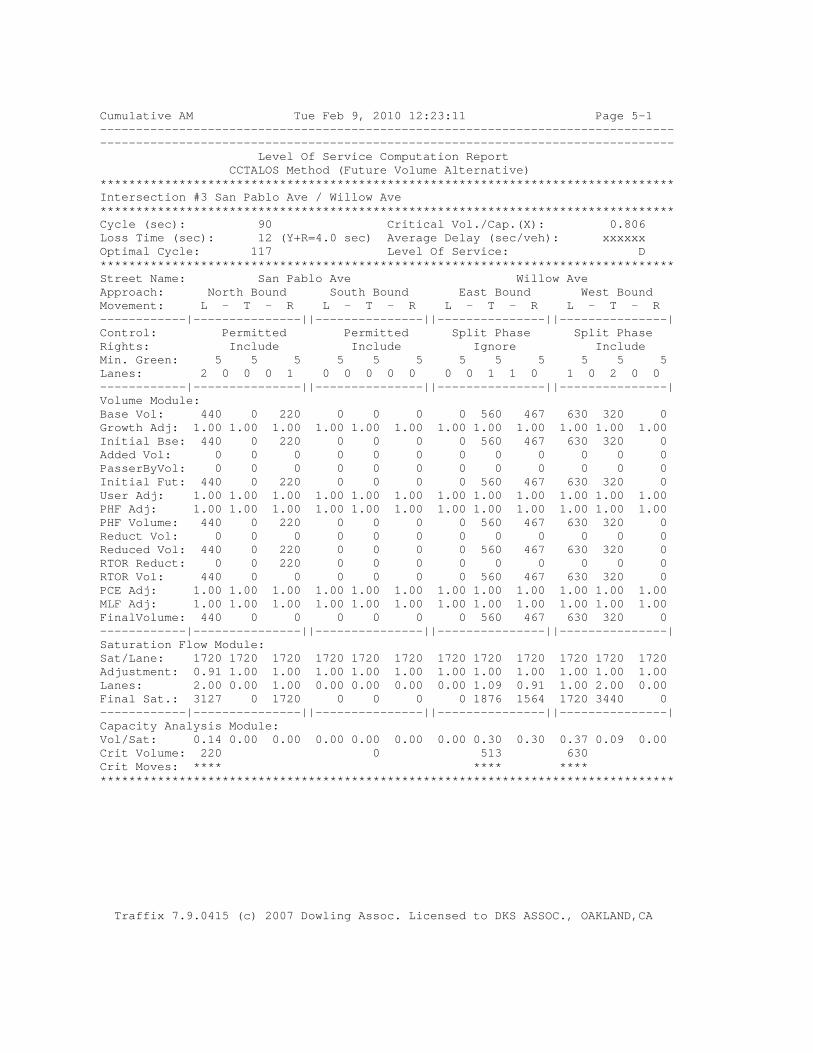
Cumulative AM Tue Feb 9, 2010 12:23:11 Page 5-1 -------------------------------------------------------------------------------- -------------------------------------------------------------------------------- Level Of Service Computation Report CCTALOS Method (Future Volume Alternative) ******************************************************************************** Intersection #3 San Pablo Ave / Willow Ave ******************************************************************************** Cycle (sec): 90 Critical Vol./Cap.(X): 0.806 Loss Time (sec): 12 (Y+R=4.0 sec) Average Delay (sec/veh): xxxxxx Optimal Cycle: 117 Level Of Service: D ******************************************************************************** Street Name: San Pablo Ave Willow Ave Approach: North Bound South Bound East Bound West Bound Movement: L - T - R L - T - R L - T - R L - T - R ------------|---------------||---------------||---------------||---------------| Control: Permitted Permitted Split Phase Split Phase Rights: Include Include Ignore Include Min. Green: 5 5 5 5 5 5 5 5 5 5 5 5 Lanes: 2 0 0 0 1 0 0 0 0 0 0 0 1 1 0 1 0 2 0 0 ------------|---------------||---------------||---------------||---------------| Volume Module: Base Vol: 440 0 220 0 0 0 0 560 467 630 320 0 Growth Adj: 1.00 1.00 1.00 1.00 1.00 1.00 1.00 1.00 1.00 1.00 1.00 1.00 Initial Bse: 440 0 220 0 0 0 0 560 467 630 320 0 Added Vol: 0 0 0 0 0 0 0 0 0 0 0 0 PasserByVol: 0 0 0 0 0 0 0 0 0 0 0 0 Initial Fut: 440 0 220 0 0 0 0 560 467 630 320 0 User Adj: 1.00 1.00 1.00 1.00 1.00 1.00 1.00 1.00 1.00 1.00 1.00 1.00 PHF Adj: 1.00 1.00 1.00 1.00 1.00 1.00 1.00 1.00 1.00 1.00 1.00 1.00 PHF Volume: 440 0 220 0 0 0 0 560 467 630 320 0 Reduct Vol: 0 0 0 0 0 0 0 0 0 0 0 0 Reduced Vol: 440 0 220 0 0 0 0 560 467 630 320 0 RTOR Reduct: 0 0 220 0 0 0 0 0 0 0 0 0 RTOR Vol: 440 0 0 0 0 0 0 560 467 630 320 0 PCE Adj: 1.00 1.00 1.00 1.00 1.00 1.00 1.00 1.00 1.00 1.00 1.00 1.00 MLF Adj: 1.00 1.00 1.00 1.00 1.00 1.00 1.00 1.00 1.00 1.00 1.00 1.00 FinalVolume: 440 0 0 0 0 0 0 560 467 630 320 0 ------------|---------------||---------------||---------------||---------------| Saturation Flow Module: Sat/Lane: 1720 1720 1720 1720 1720 1720 1720 1720 1720 1720 1720 1720 Adjustment: 0.91 1.00 1.00 1.00 1.00 1.00 1.00 1.00 1.00 1.00 1.00 1.00 Lanes: 2.00 0.00 1.00 0.00 0.00 0.00 0.00 1.09 0.91 1.00 2.00 0.00 Final Sat.: 3127 0 1720 0 0 0 0 1876 1564 1720 3440 0 ------------|---------------||---------------||---------------||---------------| Capacity Analysis Module: Vol/Sat: 0.14 0.00 0.00 0.00 0.00 0.00 0.00 0.30 0.30 0.37 0.09 0.00 Crit Volume: 220 0 513 630 Crit Moves: **** **** **** ******************************************************************************** Traffix 7.9.0415 (c) 2007 Dowling Assoc. Licensed to DKS ASSOC., OAKLAND,CA

Cumulative AM Tue Feb 9, 2010 12:23:11 Page 6-1 -------------------------------------------------------------------------------- -------------------------------------------------------------------------------- Level Of Service Computation Report CCTALOS Method (Future Volume Alternative) ******************************************************************************** Intersection #4 San Pablo Ave / John Muir Pkwy ******************************************************************************** Cycle (sec): 120 Critical Vol./Cap.(X): 0.764 Loss Time (sec): 16 (Y+R=4.0 sec) Average Delay (sec/veh): xxxxxx Optimal Cycle: 120 Level Of Service: C ******************************************************************************** Street Name: San Pablo Ave John Muir Pkwy Approach: North Bound South Bound East Bound West Bound Movement: L - T - R L - T - R L - T - R L - T - R ------------|---------------||---------------||---------------||---------------| Control: Protected Protected Protected Protected Rights: Ignore Include Include Include Min. Green: 5 5 5 5 5 5 5 5 5 5 5 5 Lanes: 1 0 2 0 1 1 0 1 1 0 1 0 1 1 0 2 0 0 1 0 ------------|---------------||---------------||---------------||---------------| Volume Module: Base Vol: 310 500 1610 190 900 70 20 90 50 470 305 140 Growth Adj: 1.00 1.00 1.00 1.00 1.00 1.00 1.00 1.00 1.00 1.00 1.00 1.00 Initial Bse: 310 500 1610 190 900 70 20 90 50 470 305 140 Added Vol: 0 0 0 0 0 0 0 0 0 0 0 0 PasserByVol: 0 0 0 0 0 0 0 0 0 0 0 0 Initial Fut: 310 500 1610 190 900 70 20 90 50 470 305 140 User Adj: 1.00 1.00 1.00 1.00 1.00 1.00 1.00 1.00 1.00 1.00 1.00 1.00 PHF Adj: 1.00 1.00 1.00 1.00 1.00 1.00 1.00 1.00 1.00 1.00 1.00 1.00 PHF Volume: 310 500 1610 190 900 70 20 90 50 470 305 140 Reduct Vol: 0 0 0 0 0 0 0 0 0 0 0 0 Reduced Vol: 310 500 1610 190 900 70 20 90 50 470 305 140 RTOR Reduct: 0 0 0 0 0 0 0 0 0 0 0 0 RTOR Vol: 310 500 1610 190 900 70 20 90 50 470 305 140 PCE Adj: 1.00 1.00 1.00 1.00 1.00 1.00 1.00 1.00 1.00 1.00 1.00 1.00 MLF Adj: 1.00 1.00 1.00 1.00 1.00 1.00 1.00 1.00 1.00 1.00 1.00 1.00 FinalVolume: 310 500 1610 190 900 70 20 90 50 470 305 140 ------------|---------------||---------------||---------------||---------------| Saturation Flow Module: Sat/Lane: 1650 1650 1650 1650 1650 1650 1650 1650 1650 1650 1650 1650 Adjustment: 1.00 1.00 1.00 1.00 1.00 1.00 1.00 1.00 1.00 0.91 1.00 1.00 Lanes: 1.00 2.00 1.00 1.00 1.86 0.14 1.00 1.29 0.71 2.00 0.69 0.31 Final Sat.: 1650 3300 1650 1650 3062 238 1650 2121 1179 3000 1131 519 ------------|---------------||---------------||---------------||---------------| Capacity Analysis Module: Vol/Sat: 0.19 0.15 0.98 0.12 0.29 0.29 0.01 0.04 0.04 0.16 0.27 0.27 Crit Volume: 310 485 20 445 Crit Moves: **** **** **** **** ******************************************************************************** Traffix 7.9.0415 (c) 2007 Dowling Assoc. Licensed to DKS ASSOC., OAKLAND,CA

Cumulative AM Tue Feb 9, 2010 12:23:11 Page 7-1 -------------------------------------------------------------------------------- -------------------------------------------------------------------------------- Level Of Service Computation Report CCTALOS Method (Future Volume Alternative) ******************************************************************************** Intersection #5 San Pablo Ave / Sycamore Ave ******************************************************************************** Cycle (sec): 120 Critical Vol./Cap.(X): 0.859 Loss Time (sec): 16 (Y+R=4.0 sec) Average Delay (sec/veh): xxxxxx Optimal Cycle: 180 Level Of Service: D ******************************************************************************** Street Name: San Pablo Ave Sycamore Ave Approach: North Bound South Bound East Bound West Bound Movement: L - T - R L - T - R L - T - R L - T - R ------------|---------------||---------------||---------------||---------------| Control: Protected Protected Split Phase Split Phase Rights: Include Include Include Include Min. Green: 5 5 5 5 5 5 5 5 5 5 5 5 Lanes: 2 0 2 0 1 2 0 1 1 0 1 0 1 1 0 1 1 0 0 2 ------------|---------------||---------------||---------------||---------------| Volume Module: Base Vol: 217 850 410 390 800 170 220 120 120 480 160 1230 Growth Adj: 1.00 1.00 1.00 1.00 1.00 1.00 1.00 1.00 1.00 1.00 1.00 1.00 Initial Bse: 217 850 410 390 800 170 220 120 120 480 160 1230 Added Vol: 0 0 0 0 0 0 0 0 0 0 0 0 PasserByVol: 0 0 0 0 0 0 0 0 0 0 0 0 Initial Fut: 217 850 410 390 800 170 220 120 120 480 160 1230 User Adj: 1.00 1.00 1.00 1.00 1.00 1.00 1.00 1.00 1.00 1.00 1.00 1.00 PHF Adj: 1.00 1.00 1.00 1.00 1.00 1.00 1.00 1.00 1.00 1.00 1.00 1.00 PHF Volume: 217 850 410 390 800 170 220 120 120 480 160 1230 Reduct Vol: 0 0 0 0 0 0 0 0 0 0 0 0 Reduced Vol: 217 850 410 390 800 170 220 120 120 480 160 1230 RTOR Reduct: 0 0 264 0 0 0 0 0 0 0 0 215 RTOR Vol: 217 850 146 390 800 170 220 120 120 480 160 1016 PCE Adj: 1.00 1.00 1.00 1.00 1.00 1.00 1.00 1.00 1.00 1.00 1.00 1.00 MLF Adj: 1.00 1.00 1.00 1.00 1.00 1.00 1.00 1.00 1.00 1.00 1.00 1.00 FinalVolume: 217 850 146 390 800 170 220 120 120 480 160 1016 ------------|---------------||---------------||---------------||---------------| Saturation Flow Module: Sat/Lane: 1650 1650 1650 1650 1650 1650 1650 1650 1650 1650 1650 1650 Adjustment: 0.91 1.00 1.00 0.91 1.00 1.00 1.00 1.00 1.00 0.91 1.00 0.91 Lanes: 2.00 2.00 1.00 2.00 1.65 0.35 1.00 1.00 1.00 1.50 0.50 2.00 Final Sat.: 3000 3300 1650 3000 2722 578 1650 1650 1650 2250 825 3000 ------------|---------------||---------------||---------------||---------------| Capacity Analysis Module: Vol/Sat: 0.07 0.26 0.09 0.13 0.29 0.29 0.13 0.07 0.07 0.21 0.19 0.34 Crit Volume: 425 195 220 508 Crit Moves: **** **** **** **** ******************************************************************************** Traffix 7.9.0415 (c) 2007 Dowling Assoc. Licensed to DKS ASSOC., OAKLAND,CA

Cumulative AM Tue Feb 9, 2010 12:23:12 Page 8-1 -------------------------------------------------------------------------------- -------------------------------------------------------------------------------- Level Of Service Computation Report CCTALOS Method (Future Volume Alternative) ******************************************************************************** Intersection #6 San Pablo Ave / Hercules Ave ******************************************************************************** Cycle (sec): 120 Critical Vol./Cap.(X): 0.758 Loss Time (sec): 16 (Y+R=4.0 sec) Average Delay (sec/veh): xxxxxx Optimal Cycle: 117 Level Of Service: C ******************************************************************************** Street Name: San Pablo Ave Hercules Ave Approach: North Bound South Bound East Bound West Bound Movement: L - T - R L - T - R L - T - R L - T - R ------------|---------------||---------------||---------------||---------------| Control: Protected Protected Split Phase Split Phase Rights: Include Include Include Include Min. Green: 5 5 5 5 5 5 5 5 5 5 5 5 Lanes: 1 0 2 0 1 1 0 2 0 1 1 0 1 0 1 0 1 0 1 0 ------------|---------------||---------------||---------------||---------------| Volume Module: Base Vol: 60 857 30 110 1320 100 280 20 190 150 10 250 Growth Adj: 1.00 1.00 1.00 1.00 1.00 1.00 1.00 1.00 1.00 1.00 1.00 1.00 Initial Bse: 60 857 30 110 1320 100 280 20 190 150 10 250 Added Vol: 0 0 0 0 0 0 0 0 0 0 0 0 PasserByVol: 0 0 0 0 0 0 0 0 0 0 0 0 Initial Fut: 60 857 30 110 1320 100 280 20 190 150 10 250 User Adj: 1.00 1.00 1.00 1.00 1.00 1.00 1.00 1.00 1.00 1.00 1.00 1.00 PHF Adj: 1.00 1.00 1.00 1.00 1.00 1.00 1.00 1.00 1.00 1.00 1.00 1.00 PHF Volume: 60 857 30 110 1320 100 280 20 190 150 10 250 Reduct Vol: 0 0 0 0 0 0 0 0 0 0 0 0 Reduced Vol: 60 857 30 110 1320 100 280 20 190 150 10 250 RTOR Reduct: 0 0 30 0 0 100 0 0 60 0 0 0 RTOR Vol: 60 857 0 110 1320 0 280 20 130 150 10 250 PCE Adj: 1.00 1.00 1.00 1.00 1.00 1.00 1.00 1.00 1.00 1.00 1.00 1.00 MLF Adj: 1.00 1.00 1.00 1.00 1.00 1.00 1.00 1.00 1.00 1.00 1.00 1.00 FinalVolume: 60 857 0 110 1320 0 280 20 130 150 10 250 ------------|---------------||---------------||---------------||---------------| Saturation Flow Module: Sat/Lane: 1650 1650 1650 1650 1650 1650 1650 1650 1650 1650 1650 1650 Adjustment: 1.00 1.00 1.00 1.00 1.00 1.00 1.00 1.00 1.00 1.00 1.00 1.00 Lanes: 1.00 2.00 1.00 1.00 2.00 1.00 1.00 1.00 1.00 0.73 0.27 1.00 Final Sat.: 1650 3300 1650 1650 3300 1650 1650 1650 1650 1207 443 1650 ------------|---------------||---------------||---------------||---------------| Capacity Analysis Module: Vol/Sat: 0.04 0.26 0.00 0.07 0.40 0.00 0.17 0.01 0.08 0.12 0.02 0.15 Crit Volume: 60 660 280 250 Crit Moves: **** **** **** **** ******************************************************************************** Traffix 7.9.0415 (c) 2007 Dowling Assoc. Licensed to DKS ASSOC., OAKLAND,CA

Cumulative AM Tue Feb 9, 2010 12:23:12 Page 9-1 -------------------------------------------------------------------------------- -------------------------------------------------------------------------------- Level Of Service Computation Report CCTALOS Method (Future Volume Alternative) ******************************************************************************** Intersection #7 San Pablo Ave / Pinole Valley Rd ******************************************************************************** Cycle (sec): 60 Critical Vol./Cap.(X): 0.889 Loss Time (sec): 8 (Y+R=4.0 sec) Average Delay (sec/veh): xxxxxx Optimal Cycle: 156 Level Of Service: D ******************************************************************************** Street Name: San Pablo Ave Pinole Valley Rd Approach: North Bound South Bound East Bound West Bound Movement: L - T - R L - T - R L - T - R L - T - R ------------|---------------||---------------||---------------||---------------| Control: Permitted Permitted Permitted Permitted Rights: Include Include Include Include Min. Green: 5 5 5 5 5 5 5 5 5 5 5 5 Lanes: 0 1 0 1 0 0 1 1 0 1 0 0 1! 0 0 0 1 0 0 1 ------------|---------------||---------------||---------------||---------------| Volume Module: Base Vol: 14 588 14 263 1498 5 6 0 3 55 28 127 Growth Adj: 1.00 1.00 1.00 1.00 1.00 1.00 1.00 1.00 1.00 1.00 1.00 1.00 Initial Bse: 14 588 14 263 1498 5 6 0 3 55 28 127 Added Vol: 0 0 0 0 0 0 0 0 0 0 0 0 PasserByVol: 0 0 0 0 0 0 0 0 0 0 0 0 Initial Fut: 14 588 14 263 1498 5 6 0 3 55 28 127 User Adj: 1.00 1.00 1.00 1.00 1.00 1.00 1.00 1.00 1.00 1.00 1.00 1.00 PHF Adj: 1.00 1.00 1.00 1.00 1.00 1.00 1.00 1.00 1.00 1.00 1.00 1.00 PHF Volume: 14 588 14 263 1498 5 6 0 3 55 28 127 Reduct Vol: 0 0 0 0 0 0 0 0 0 0 0 0 Reduced Vol: 14 588 14 263 1498 5 6 0 3 55 28 127 RTOR Reduct: 0 0 0 0 0 5 0 0 0 0 0 127 RTOR Vol: 14 588 14 263 1498 0 6 0 3 55 28 0 PCE Adj: 6.00 1.00 1.00 4.00 1.00 1.00 1.00 1.00 1.00 1.00 1.00 1.00 MLF Adj: 1.00 1.00 1.00 1.00 1.00 1.00 1.00 1.00 1.00 1.00 1.00 1.00 FinalVolume: 84 588 14 1052 1498 0 6 0 3 55 28 0 ------------|---------------||---------------||---------------||---------------| Saturation Flow Module: Sat/Lane: 1800 1800 1800 1800 1800 1800 1800 1800 1800 1800 1800 1800 Adjustment: 1.00 1.00 1.00 1.00 1.00 1.00 1.00 1.00 1.00 1.00 1.00 1.00 Lanes: 0.05 1.91 0.04 1.00 1.00 1.00 0.67 0.00 0.33 0.66 0.34 1.00 Final Sat.: 92 3434 73 1800 1800 1800 1200 0 600 1193 607 1800 ------------|---------------||---------------||---------------||---------------| Capacity Analysis Module: Vol/Sat: 0.15 0.17 0.19 0.15 0.83 0.00 0.01 0.00 0.01 0.05 0.05 0.00 Crit Volume: 14 1498 6 83 Crit Moves: **** **** **** **** ******************************************************************************** Traffix 7.9.0415 (c) 2007 Dowling Assoc. Licensed to DKS ASSOC., OAKLAND,CA

Cumulative AM Tue Feb 9, 2010 12:23:12 Page 10-1 -------------------------------------------------------------------------------- -------------------------------------------------------------------------------- Level Of Service Computation Report CCTALOS Method (Future Volume Alternative) ******************************************************************************** Intersection #8 San Pablo Ave / Tennent Ave ******************************************************************************** Cycle (sec): 60 Critical Vol./Cap.(X): 1.138 Loss Time (sec): 8 (Y+R=4.0 sec) Average Delay (sec/veh): xxxxxx Optimal Cycle: 180 Level Of Service: F ******************************************************************************** Street Name: San Pablo Ave Tennent Ave Approach: North Bound South Bound East Bound West Bound Movement: L - T - R L - T - R L - T - R L - T - R ------------|---------------||---------------||---------------||---------------| Control: Permitted Permitted Permitted Permitted Rights: Ignore Ignore Ignore Ignore Min. Green: 0 0 0 0 0 0 0 0 0 0 0 0 Lanes: 0 1 1 0 1 0 1 0 1 0 0 0 1! 0 0 1 0 0 1 0 ------------|---------------||---------------||---------------||---------------| Volume Module: Base Vol: 29 489 338 194 2030 52 25 135 80 633 127 206 Growth Adj: 1.00 1.00 1.00 1.00 1.00 1.00 1.00 1.00 1.00 1.00 1.00 1.00 Initial Bse: 29 489 338 194 2030 52 25 135 80 633 127 206 Added Vol: 0 0 0 0 0 0 0 0 0 0 0 0 PasserByVol: 0 0 0 0 0 0 0 0 0 0 0 0 Initial Fut: 29 489 338 194 2030 52 25 135 80 633 127 206 User Adj: 1.00 1.00 1.00 1.00 1.00 1.00 1.00 1.00 1.00 1.00 1.00 1.00 PHF Adj: 1.00 1.00 1.00 1.00 1.00 1.00 1.00 1.00 1.00 1.00 1.00 1.00 PHF Volume: 29 489 338 194 2030 52 25 135 80 633 127 206 Reduct Vol: 0 0 0 0 0 0 0 0 0 0 0 0 Reduced Vol: 29 489 338 194 2030 52 25 135 80 633 127 206 RTOR Reduct: 0 0 0 0 0 0 0 0 0 0 0 0 RTOR Vol: 29 489 338 194 2030 52 25 135 80 633 127 206 PCE Adj: 6.00 1.00 1.00 2.00 1.00 1.00 1.00 1.00 1.00 1.00 1.00 1.00 MLF Adj: 1.00 1.00 1.00 1.00 1.00 1.00 1.00 1.00 1.00 1.00 1.00 1.00 FinalVolume: 174 489 338 388 2030 52 25 135 80 633 127 206 ------------|---------------||---------------||---------------||---------------| Saturation Flow Module: Sat/Lane: 1800 1800 1800 1800 1800 1800 1800 1800 1800 1800 1800 1800 Adjustment: 1.00 1.00 1.00 1.00 1.00 1.00 1.00 1.00 1.00 1.00 1.00 1.00 Lanes: 0.93 1.07 1.00 0.19 1.77 0.04 0.10 0.57 0.33 1.00 0.38 0.62 Final Sat.: 1679 1921 1800 335 3189 76 188 1013 600 1800 686 1114 ------------|---------------||---------------||---------------||---------------| Capacity Analysis Module: Vol/Sat: 0.02 0.25 0.19 0.58 0.64 0.69 0.13 0.13 0.13 0.35 0.18 0.19 Crit Volume: 29 1146 240 633 Crit Moves: **** **** **** **** ******************************************************************************** Traffix 7.9.0415 (c) 2007 Dowling Assoc. Licensed to DKS ASSOC., OAKLAND,CA

Cumulative AM Tue Feb 9, 2010 12:23:12 Page 11-1 -------------------------------------------------------------------------------- -------------------------------------------------------------------------------- Level Of Service Computation Report CCTALOS Method (Future Volume Alternative) ******************************************************************************** Intersection #9 San Pablo Ave / Appian Wy ******************************************************************************** Cycle (sec): 60 Critical Vol./Cap.(X): 0.624 Loss Time (sec): 8 (Y+R=4.0 sec) Average Delay (sec/veh): xxxxxx Optimal Cycle: 46 Level Of Service: B ******************************************************************************** Street Name: San Pablo Ave Appian Wy Approach: North Bound South Bound East Bound West Bound Movement: L - T - R L - T - R L - T - R L - T - R ------------|---------------||---------------||---------------||---------------| Control: Permitted Permitted Permitted Permitted Rights: Include Include Include Include Min. Green: 0 0 0 0 0 0 0 0 0 0 0 0 Lanes: 1 0 2 0 1 1 0 1 1 0 1 0 0 1 0 1 0 0 1 0 ------------|---------------||---------------||---------------||---------------| Volume Module: Base Vol: 5 409 238 473 1075 11 55 179 30 237 17 176 Growth Adj: 1.00 1.00 1.00 1.00 1.00 1.00 1.00 1.00 1.00 1.00 1.00 1.00 Initial Bse: 5 409 238 473 1075 11 55 179 30 237 17 176 Added Vol: 0 0 0 0 0 0 0 0 0 0 0 0 PasserByVol: 0 0 0 0 0 0 0 0 0 0 0 0 Initial Fut: 5 409 238 473 1075 11 55 179 30 237 17 176 User Adj: 1.00 1.00 1.00 1.00 1.00 1.00 1.00 1.00 1.00 1.00 1.00 1.00 PHF Adj: 1.00 1.00 1.00 1.00 1.00 1.00 1.00 1.00 1.00 1.00 1.00 1.00 PHF Volume: 5 409 238 473 1075 11 55 179 30 237 17 176 Reduct Vol: 0 0 0 0 0 0 0 0 0 0 0 0 Reduced Vol: 5 409 238 473 1075 11 55 179 30 237 17 176 RTOR Reduct: 0 0 237 0 0 0 0 0 0 0 0 0 RTOR Vol: 5 409 1 473 1075 11 55 179 30 237 17 176 PCE Adj: 1.00 1.00 1.00 1.00 1.00 1.00 1.00 1.00 1.00 1.00 1.00 1.00 MLF Adj: 1.00 1.00 1.00 1.00 1.00 1.00 1.00 1.00 1.00 1.00 1.00 1.00 FinalVolume: 5 409 1 473 1075 11 55 179 30 237 17 176 ------------|---------------||---------------||---------------||---------------| Saturation Flow Module: Sat/Lane: 1800 1800 1800 1800 1800 1800 1800 1800 1800 1800 1800 1800 Adjustment: 1.00 1.00 1.00 1.00 1.00 1.00 1.00 1.00 1.00 1.00 1.00 1.00 Lanes: 1.00 2.00 1.00 1.00 1.98 0.02 1.00 0.86 0.14 1.00 0.09 0.91 Final Sat.: 1800 3600 1800 1800 3564 36 1800 1542 258 1800 159 1641 ------------|---------------||---------------||---------------||---------------| Capacity Analysis Module: Vol/Sat: 0.00 0.11 0.00 0.26 0.30 0.30 0.03 0.12 0.12 0.13 0.11 0.11 Crit Volume: 205 473 209 237 Crit Moves: **** **** **** **** ******************************************************************************** Traffix 7.9.0415 (c) 2007 Dowling Assoc. Licensed to DKS ASSOC., OAKLAND,CA

Cumulative AM Tue Feb 9, 2010 12:23:12 Page 12-1 -------------------------------------------------------------------------------- -------------------------------------------------------------------------------- Level Of Service Computation Report CCTALOS Method (Future Volume Alternative) ******************************************************************************** Intersection #10 Sycamore Ave / Bayberry Ave ******************************************************************************** Cycle (sec): 120 Critical Vol./Cap.(X): 0.656 Loss Time (sec): 16 (Y+R=4.0 sec) Average Delay (sec/veh): xxxxxx Optimal Cycle: 83 Level Of Service: B ******************************************************************************** Street Name: Bayberry Ave Sycamore Ave Approach: North Bound South Bound East Bound West Bound Movement: L - T - R L - T - R L - T - R L - T - R ------------|---------------||---------------||---------------||---------------| Control: Split Phase Split Phase Protected Protected Rights: Include Include Include Ignore Min. Green: 5 5 5 5 5 5 5 5 5 5 5 5 Lanes: 1 0 0 1 0 1 1 0 0 2 1 0 2 1 0 1 0 2 0 1 ------------|---------------||---------------||---------------||---------------| Volume Module: Base Vol: 30 30 40 450 70 507 60 820 40 180 1333 100 Growth Adj: 1.00 1.00 1.00 1.00 1.00 1.00 1.00 1.00 1.00 1.00 1.00 1.00 Initial Bse: 30 30 40 450 70 507 60 820 40 180 1333 100 Added Vol: 0 0 0 0 0 0 0 0 0 0 0 0 PasserByVol: 0 0 0 0 0 0 0 0 0 0 0 0 Initial Fut: 30 30 40 450 70 507 60 820 40 180 1333 100 User Adj: 1.00 1.00 1.00 1.00 1.00 1.00 1.00 1.00 1.00 1.00 1.00 1.00 PHF Adj: 1.00 1.00 1.00 1.00 1.00 1.00 1.00 1.00 1.00 1.00 1.00 1.00 PHF Volume: 30 30 40 450 70 507 60 820 40 180 1333 100 Reduct Vol: 0 0 0 0 0 0 0 0 0 0 0 0 Reduced Vol: 30 30 40 450 70 507 60 820 40 180 1333 100 RTOR Reduct: 0 0 0 0 0 60 0 0 0 0 0 0 RTOR Vol: 30 30 40 450 70 447 60 820 40 180 1333 100 PCE Adj: 1.00 1.00 1.00 1.00 1.00 1.00 1.00 1.00 1.00 1.00 1.00 1.00 MLF Adj: 1.00 1.00 1.00 1.00 1.00 1.00 1.00 1.00 1.00 1.00 1.00 1.00 FinalVolume: 30 30 40 450 70 447 60 820 40 180 1333 100 ------------|---------------||---------------||---------------||---------------| Saturation Flow Module: Sat/Lane: 1650 1650 1650 1650 1650 1650 1650 1650 1650 1650 1650 1650 Adjustment: 1.00 1.00 1.00 0.91 1.00 0.91 1.00 1.00 1.00 1.00 1.00 1.00 Lanes: 1.00 0.43 0.57 1.73 0.27 2.00 1.00 2.86 0.14 1.00 2.00 1.00 Final Sat.: 1650 707 943 2596 444 3000 1650 4720 230 1650 3300 1650 ------------|---------------||---------------||---------------||---------------| Capacity Analysis Module: Vol/Sat: 0.02 0.04 0.04 0.17 0.16 0.15 0.04 0.17 0.17 0.11 0.40 0.06 Crit Volume: 70 260 60 667 Crit Moves: **** **** **** **** ******************************************************************************** Traffix 7.9.0415 (c) 2007 Dowling Assoc. Licensed to DKS ASSOC., OAKLAND,CA
P.M. PEAK

Cumulative PM Tue Feb 9, 2010 12:25:16 Page 3-1 -------------------------------------------------------------------------------- -------------------------------------------------------------------------------- Level Of Service Computation Report CCTALOS Method (Future Volume Alternative) ******************************************************************************** Intersection #1 Willow Ave / I-80 WB Off-ramp ******************************************************************************** Cycle (sec): 90 Critical Vol./Cap.(X): 0.938 Loss Time (sec): 8 (Y+R=4.0 sec) Average Delay (sec/veh): xxxxxx Optimal Cycle: 180 Level Of Service: E ******************************************************************************** Street Name: I-80 WB Off-ramp Willow Ave Approach: North Bound South Bound East Bound West Bound Movement: L - T - R L - T - R L - T - R L - T - R ------------|---------------||---------------||---------------||---------------| Control: Protected Protected Protected Protected Rights: Include Include Ignore Ignore Min. Green: 5 5 5 5 5 5 5 5 5 5 5 5 Lanes: 0 0 0 0 0 1 0 0 0 1 0 0 2 0 0 0 0 2 0 0 ------------|---------------||---------------||---------------||---------------| Volume Module: Base Vol: 0 0 0 345 0 281 0 1008 0 0 2536 0 Growth Adj: 1.00 1.00 1.00 1.00 1.00 1.00 1.00 1.00 1.00 1.00 1.00 1.00 Initial Bse: 0 0 0 345 0 281 0 1008 0 0 2536 0 Added Vol: 0 0 0 0 0 0 0 0 0 0 0 0 PasserByVol: 0 0 0 0 0 0 0 0 0 0 0 0 Initial Fut: 0 0 0 345 0 281 0 1008 0 0 2536 0 User Adj: 1.00 1.00 1.00 1.00 1.00 1.00 1.00 1.00 1.00 1.00 1.00 1.00 PHF Adj: 1.00 1.00 1.00 1.00 1.00 1.00 1.00 1.00 1.00 1.00 1.00 1.00 PHF Volume: 0 0 0 345 0 281 0 1008 0 0 2536 0 Reduct Vol: 0 0 0 0 0 0 0 0 0 0 0 0 Reduced Vol: 0 0 0 345 0 281 0 1008 0 0 2536 0 RTOR Reduct: 0 0 0 0 0 0 0 0 0 0 0 0 RTOR Vol: 0 0 0 345 0 281 0 1008 0 0 2536 0 PCE Adj: 1.00 1.00 1.00 1.00 1.00 1.00 1.00 1.00 1.00 1.00 1.00 1.00 MLF Adj: 1.00 1.00 1.00 1.00 1.00 1.00 1.00 1.00 1.00 1.00 1.00 1.00 FinalVolume: 0 0 0 345 0 281 0 1008 0 0 2536 0 ------------|---------------||---------------||---------------||---------------| Saturation Flow Module: Sat/Lane: 1720 1720 1720 1720 1720 1720 1720 1720 1720 1720 1720 1720 Adjustment: 1.00 1.00 1.00 1.00 1.00 1.00 1.00 1.00 1.00 1.00 1.00 1.00 Lanes: 0.00 0.00 0.00 1.00 0.00 1.00 0.00 2.00 0.00 0.00 2.00 0.00 Final Sat.: 0 0 0 1720 0 1720 0 3440 0 0 3440 0 ------------|---------------||---------------||---------------||---------------| Capacity Analysis Module: Vol/Sat: 0.00 0.00 0.00 0.20 0.00 0.16 0.00 0.29 0.00 0.00 0.74 0.00 Crit Volume: 0 345 0 1268 Crit Moves: **** **** **** ******************************************************************************** Traffix 7.9.0415 (c) 2007 Dowling Assoc. Licensed to DKS ASSOC., OAKLAND,CA
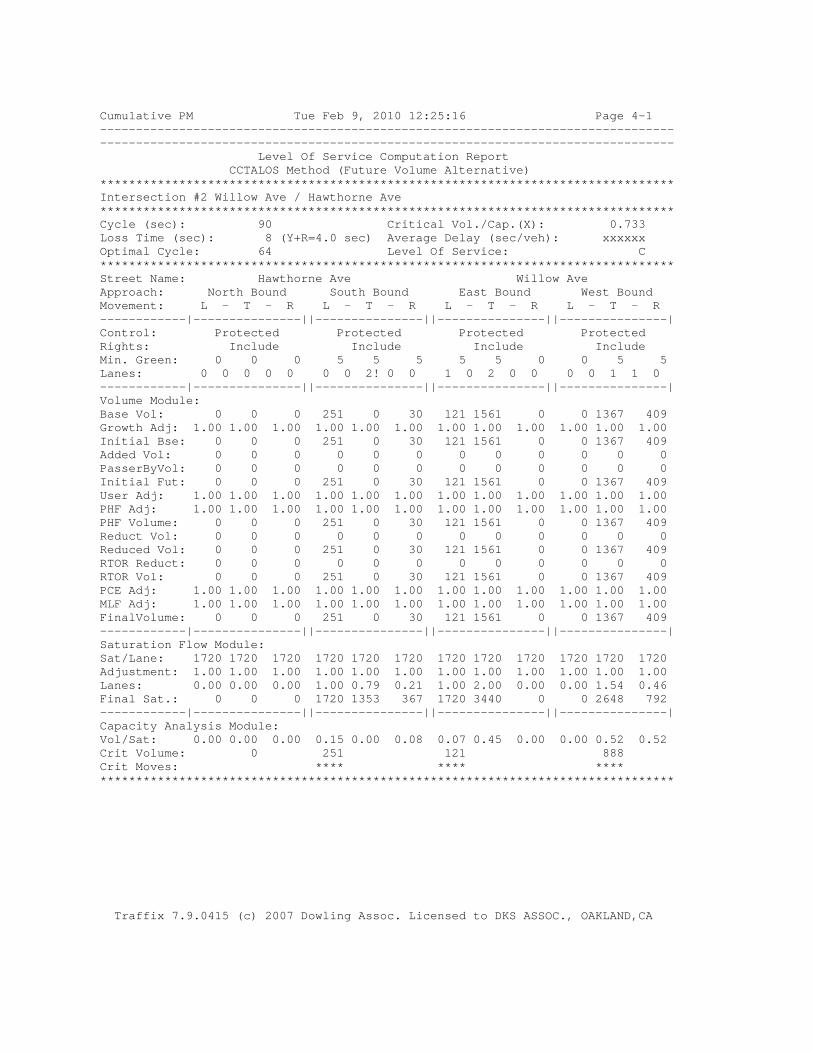
Cumulative PM Tue Feb 9, 2010 12:25:16 Page 4-1 -------------------------------------------------------------------------------- -------------------------------------------------------------------------------- Level Of Service Computation Report CCTALOS Method (Future Volume Alternative) ******************************************************************************** Intersection #2 Willow Ave / Hawthorne Ave ******************************************************************************** Cycle (sec): 90 Critical Vol./Cap.(X): 0.733 Loss Time (sec): 8 (Y+R=4.0 sec) Average Delay (sec/veh): xxxxxx Optimal Cycle: 64 Level Of Service: C ******************************************************************************** Street Name: Hawthorne Ave Willow Ave Approach: North Bound South Bound East Bound West Bound Movement: L - T - R L - T - R L - T - R L - T - R ------------|---------------||---------------||---------------||---------------| Control: Protected Protected Protected Protected Rights: Include Include Include Include Min. Green: 0 0 0 5 5 5 5 5 0 0 5 5 Lanes: 0 0 0 0 0 0 0 2! 0 0 1 0 2 0 0 0 0 1 1 0 ------------|---------------||---------------||---------------||---------------| Volume Module: Base Vol: 0 0 0 251 0 30 121 1561 0 0 1367 409 Growth Adj: 1.00 1.00 1.00 1.00 1.00 1.00 1.00 1.00 1.00 1.00 1.00 1.00 Initial Bse: 0 0 0 251 0 30 121 1561 0 0 1367 409 Added Vol: 0 0 0 0 0 0 0 0 0 0 0 0 PasserByVol: 0 0 0 0 0 0 0 0 0 0 0 0 Initial Fut: 0 0 0 251 0 30 121 1561 0 0 1367 409 User Adj: 1.00 1.00 1.00 1.00 1.00 1.00 1.00 1.00 1.00 1.00 1.00 1.00 PHF Adj: 1.00 1.00 1.00 1.00 1.00 1.00 1.00 1.00 1.00 1.00 1.00 1.00 PHF Volume: 0 0 0 251 0 30 121 1561 0 0 1367 409 Reduct Vol: 0 0 0 0 0 0 0 0 0 0 0 0 Reduced Vol: 0 0 0 251 0 30 121 1561 0 0 1367 409 RTOR Reduct: 0 0 0 0 0 0 0 0 0 0 0 0 RTOR Vol: 0 0 0 251 0 30 121 1561 0 0 1367 409 PCE Adj: 1.00 1.00 1.00 1.00 1.00 1.00 1.00 1.00 1.00 1.00 1.00 1.00 MLF Adj: 1.00 1.00 1.00 1.00 1.00 1.00 1.00 1.00 1.00 1.00 1.00 1.00 FinalVolume: 0 0 0 251 0 30 121 1561 0 0 1367 409 ------------|---------------||---------------||---------------||---------------| Saturation Flow Module: Sat/Lane: 1720 1720 1720 1720 1720 1720 1720 1720 1720 1720 1720 1720 Adjustment: 1.00 1.00 1.00 1.00 1.00 1.00 1.00 1.00 1.00 1.00 1.00 1.00 Lanes: 0.00 0.00 0.00 1.00 0.79 0.21 1.00 2.00 0.00 0.00 1.54 0.46 Final Sat.: 0 0 0 1720 1353 367 1720 3440 0 0 2648 792 ------------|---------------||---------------||---------------||---------------| Capacity Analysis Module: Vol/Sat: 0.00 0.00 0.00 0.15 0.00 0.08 0.07 0.45 0.00 0.00 0.52 0.52 Crit Volume: 0 251 121 888 Crit Moves: **** **** **** ******************************************************************************** Traffix 7.9.0415 (c) 2007 Dowling Assoc. Licensed to DKS ASSOC., OAKLAND,CA

Cumulative PM Tue Feb 9, 2010 12:25:16 Page 5-1 -------------------------------------------------------------------------------- -------------------------------------------------------------------------------- Level Of Service Computation Report CCTALOS Method (Future Volume Alternative) ******************************************************************************** Intersection #3 San Pablo Ave / Willow Ave ******************************************************************************** Cycle (sec): 90 Critical Vol./Cap.(X): 0.712 Loss Time (sec): 12 (Y+R=4.0 sec) Average Delay (sec/veh): xxxxxx Optimal Cycle: 79 Level Of Service: C ******************************************************************************** Street Name: San Pablo Ave Willow Ave Approach: North Bound South Bound East Bound West Bound Movement: L - T - R L - T - R L - T - R L - T - R ------------|---------------||---------------||---------------||---------------| Control: Permitted Permitted Split Phase Split Phase Rights: Include Include Ignore Include Min. Green: 5 5 5 5 5 5 5 5 5 5 5 5 Lanes: 2 0 0 0 1 0 0 0 0 0 0 0 1 1 0 1 0 2 0 0 ------------|---------------||---------------||---------------||---------------| Volume Module: Base Vol: 442 0 780 0 0 0 0 600 290 370 640 0 Growth Adj: 1.00 1.00 1.00 1.00 1.00 1.00 1.00 1.00 1.00 1.00 1.00 1.00 Initial Bse: 442 0 780 0 0 0 0 600 290 370 640 0 Added Vol: 0 0 0 0 0 0 0 0 0 0 0 0 PasserByVol: 0 0 0 0 0 0 0 0 0 0 0 0 Initial Fut: 442 0 780 0 0 0 0 600 290 370 640 0 User Adj: 1.00 1.00 1.00 1.00 1.00 1.00 1.00 1.00 1.00 1.00 1.00 1.00 PHF Adj: 1.00 1.00 1.00 1.00 1.00 1.00 1.00 1.00 1.00 1.00 1.00 1.00 PHF Volume: 442 0 780 0 0 0 0 600 290 370 640 0 Reduct Vol: 0 0 0 0 0 0 0 0 0 0 0 0 Reduced Vol: 442 0 780 0 0 0 0 600 290 370 640 0 RTOR Reduct: 0 0 370 0 0 0 0 0 0 0 0 0 RTOR Vol: 442 0 410 0 0 0 0 600 290 370 640 0 PCE Adj: 1.00 1.00 1.00 1.00 1.00 1.00 1.00 1.00 1.00 1.00 1.00 1.00 MLF Adj: 1.00 1.00 1.00 1.00 1.00 1.00 1.00 1.00 1.00 1.00 1.00 1.00 FinalVolume: 442 0 410 0 0 0 0 600 290 370 640 0 ------------|---------------||---------------||---------------||---------------| Saturation Flow Module: Sat/Lane: 1720 1720 1720 1720 1720 1720 1720 1720 1720 1720 1720 1720 Adjustment: 0.91 1.00 1.00 1.00 1.00 1.00 1.00 1.00 1.00 1.00 1.00 1.00 Lanes: 2.00 0.00 1.00 0.00 0.00 0.00 0.00 1.35 0.65 1.00 2.00 0.00 Final Sat.: 3127 0 1720 0 0 0 0 2319 1121 1720 3440 0 ------------|---------------||---------------||---------------||---------------| Capacity Analysis Module: Vol/Sat: 0.14 0.00 0.24 0.00 0.00 0.00 0.00 0.26 0.26 0.22 0.19 0.00 Crit Volume: 410 0 445 370 Crit Moves: **** **** **** ******************************************************************************** Traffix 7.9.0415 (c) 2007 Dowling Assoc. Licensed to DKS ASSOC., OAKLAND,CA

Cumulative PM Tue Feb 9, 2010 12:25:16 Page 6-1 -------------------------------------------------------------------------------- -------------------------------------------------------------------------------- Level Of Service Computation Report CCTALOS Method (Future Volume Alternative) ******************************************************************************** Intersection #4 San Pablo Ave / John Muir Pkwy ******************************************************************************** Cycle (sec): 120 Critical Vol./Cap.(X): 1.239 Loss Time (sec): 16 (Y+R=4.0 sec) Average Delay (sec/veh): xxxxxx Optimal Cycle: 180 Level Of Service: F ******************************************************************************** Street Name: San Pablo Ave John Muir Pkwy Approach: North Bound South Bound East Bound West Bound Movement: L - T - R L - T - R L - T - R L - T - R ------------|---------------||---------------||---------------||---------------| Control: Protected Protected Protected Protected Rights: Ignore Include Include Include Min. Green: 5 5 5 5 5 5 5 5 5 5 5 5 Lanes: 1 0 2 0 1 1 0 1 1 0 1 0 1 1 0 2 0 0 1 0 ------------|---------------||---------------||---------------||---------------| Volume Module: Base Vol: 150 1060 1200 460 460 20 40 839 223 950 80 80 Growth Adj: 1.00 1.00 1.00 1.00 1.00 1.00 1.00 1.00 1.00 1.00 1.00 1.00 Initial Bse: 150 1060 1200 460 460 20 40 839 223 950 80 80 Added Vol: 0 0 0 0 0 0 0 0 0 0 0 0 PasserByVol: 0 0 0 0 0 0 0 0 0 0 0 0 Initial Fut: 150 1060 1200 460 460 20 40 839 223 950 80 80 User Adj: 1.00 1.00 1.00 1.00 1.00 1.00 1.00 1.00 1.00 1.00 1.00 1.00 PHF Adj: 1.00 1.00 1.00 1.00 1.00 1.00 1.00 1.00 1.00 1.00 1.00 1.00 PHF Volume: 150 1060 1200 460 460 20 40 839 223 950 80 80 Reduct Vol: 0 0 0 0 0 0 0 0 0 0 0 0 Reduced Vol: 150 1060 1200 460 460 20 40 839 223 950 80 80 RTOR Reduct: 0 0 0 0 0 0 0 0 0 0 0 0 RTOR Vol: 150 1060 1200 460 460 20 40 839 223 950 80 80 PCE Adj: 1.00 1.00 1.00 1.00 1.00 1.00 1.00 1.00 1.00 1.00 1.00 1.00 MLF Adj: 1.00 1.00 1.00 1.00 1.00 1.00 1.00 1.00 1.00 1.00 1.00 1.00 FinalVolume: 150 1060 1200 460 460 20 40 839 223 950 80 80 ------------|---------------||---------------||---------------||---------------| Saturation Flow Module: Sat/Lane: 1650 1650 1650 1650 1650 1650 1650 1650 1650 1650 1650 1650 Adjustment: 1.00 1.00 1.00 1.00 1.00 1.00 1.00 1.00 1.00 0.91 1.00 1.00 Lanes: 1.00 2.00 1.00 1.00 1.92 0.08 1.00 1.58 0.42 2.00 0.50 0.50 Final Sat.: 1650 3300 1650 1650 3163 138 1650 2607 693 3000 825 825 ------------|---------------||---------------||---------------||---------------| Capacity Analysis Module: Vol/Sat: 0.09 0.32 0.73 0.28 0.15 0.15 0.02 0.32 0.32 0.32 0.10 0.10 Crit Volume: 530 460 531 475 Crit Moves: **** **** **** **** ******************************************************************************** Traffix 7.9.0415 (c) 2007 Dowling Assoc. Licensed to DKS ASSOC., OAKLAND,CA

Cumulative PM Tue Feb 9, 2010 12:25:16 Page 7-1 -------------------------------------------------------------------------------- -------------------------------------------------------------------------------- Level Of Service Computation Report CCTALOS Method (Future Volume Alternative) ******************************************************************************** Intersection #5 San Pablo Ave / Sycamore Ave ******************************************************************************** Cycle (sec): 120 Critical Vol./Cap.(X): 1.103 Loss Time (sec): 16 (Y+R=4.0 sec) Average Delay (sec/veh): xxxxxx Optimal Cycle: 180 Level Of Service: F ******************************************************************************** Street Name: San Pablo Ave Sycamore Ave Approach: North Bound South Bound East Bound West Bound Movement: L - T - R L - T - R L - T - R L - T - R ------------|---------------||---------------||---------------||---------------| Control: Protected Protected Split Phase Split Phase Rights: Include Include Include Include Min. Green: 5 5 5 5 5 5 5 5 5 5 5 5 Lanes: 2 0 2 0 1 2 0 1 1 0 1 0 1 1 0 1 1 0 0 2 ------------|---------------||---------------||---------------||---------------| Volume Module: Base Vol: 220 1120 530 743 710 190 300 140 350 600 310 860 Growth Adj: 1.00 1.00 1.00 1.00 1.00 1.00 1.00 1.00 1.00 1.00 1.00 1.00 Initial Bse: 220 1120 530 743 710 190 300 140 350 600 310 860 Added Vol: 0 0 0 0 0 0 0 0 0 0 0 0 PasserByVol: 0 0 0 0 0 0 0 0 0 0 0 0 Initial Fut: 220 1120 530 743 710 190 300 140 350 600 310 860 User Adj: 1.00 1.00 1.00 1.00 1.00 1.00 1.00 1.00 1.00 1.00 1.00 1.00 PHF Adj: 1.00 1.00 1.00 1.00 1.00 1.00 1.00 1.00 1.00 1.00 1.00 1.00 PHF Volume: 220 1120 530 743 710 190 300 140 350 600 310 860 Reduct Vol: 0 0 0 0 0 0 0 0 0 0 0 0 Reduced Vol: 220 1120 530 743 710 190 300 140 350 600 310 860 RTOR Reduct: 0 0 330 0 0 0 0 0 0 0 0 409 RTOR Vol: 220 1120 200 743 710 190 300 140 350 600 310 451 PCE Adj: 1.00 1.00 1.00 1.00 1.00 1.00 1.00 1.00 1.00 1.00 1.00 1.00 MLF Adj: 1.00 1.00 1.00 1.00 1.00 1.00 1.00 1.00 1.00 1.00 1.00 1.00 FinalVolume: 220 1120 200 743 710 190 300 140 350 600 310 451 ------------|---------------||---------------||---------------||---------------| Saturation Flow Module: Sat/Lane: 1650 1650 1650 1650 1650 1650 1650 1650 1650 1650 1650 1650 Adjustment: 0.91 1.00 1.00 0.91 1.00 1.00 1.00 1.00 1.00 0.91 1.00 0.91 Lanes: 2.00 2.00 1.00 2.00 1.58 0.42 1.00 1.00 1.00 1.32 0.68 2.00 Final Sat.: 3000 3300 1650 3000 2603 697 1650 1650 1650 1978 1124 3000 ------------|---------------||---------------||---------------||---------------| Capacity Analysis Module: Vol/Sat: 0.07 0.34 0.12 0.25 0.27 0.27 0.18 0.08 0.21 0.30 0.28 0.15 Crit Volume: 560 372 350 455 Crit Moves: **** **** **** **** ******************************************************************************** Traffix 7.9.0415 (c) 2007 Dowling Assoc. Licensed to DKS ASSOC., OAKLAND,CA

Cumulative PM Tue Feb 9, 2010 12:25:16 Page 8-1 -------------------------------------------------------------------------------- -------------------------------------------------------------------------------- Level Of Service Computation Report CCTALOS Method (Future Volume Alternative) ******************************************************************************** Intersection #6 San Pablo Ave / Hercules Ave ******************************************************************************** Cycle (sec): 120 Critical Vol./Cap.(X): 0.755 Loss Time (sec): 16 (Y+R=4.0 sec) Average Delay (sec/veh): xxxxxx Optimal Cycle: 116 Level Of Service: C ******************************************************************************** Street Name: San Pablo Ave Hercules Ave Approach: North Bound South Bound East Bound West Bound Movement: L - T - R L - T - R L - T - R L - T - R ------------|---------------||---------------||---------------||---------------| Control: Protected Protected Split Phase Split Phase Rights: Include Include Include Include Min. Green: 5 5 5 5 5 5 5 5 5 5 5 5 Lanes: 1 0 2 0 1 1 0 2 0 1 1 0 1 0 1 0 1 0 1 0 ------------|---------------||---------------||---------------||---------------| Volume Module: Base Vol: 220 1550 150 220 1342 220 140 10 100 70 10 110 Growth Adj: 1.00 1.00 1.00 1.00 1.00 1.00 1.00 1.00 1.00 1.00 1.00 1.00 Initial Bse: 220 1550 150 220 1342 220 140 10 100 70 10 110 Added Vol: 0 0 0 0 0 0 0 0 0 0 0 0 PasserByVol: 0 0 0 0 0 0 0 0 0 0 0 0 Initial Fut: 220 1550 150 220 1342 220 140 10 100 70 10 110 User Adj: 1.00 1.00 1.00 1.00 1.00 1.00 1.00 1.00 1.00 1.00 1.00 1.00 PHF Adj: 1.00 1.00 1.00 1.00 1.00 1.00 1.00 1.00 1.00 1.00 1.00 1.00 PHF Volume: 220 1550 150 220 1342 220 140 10 100 70 10 110 Reduct Vol: 0 0 0 0 0 0 0 0 0 0 0 0 Reduced Vol: 220 1550 150 220 1342 220 140 10 100 70 10 110 RTOR Reduct: 0 0 70 0 0 140 0 0 100 0 0 0 RTOR Vol: 220 1550 80 220 1342 80 140 10 0 70 10 110 PCE Adj: 1.00 1.00 1.00 1.00 1.00 1.00 1.00 1.00 1.00 1.00 1.00 1.00 MLF Adj: 1.00 1.00 1.00 1.00 1.00 1.00 1.00 1.00 1.00 1.00 1.00 1.00 FinalVolume: 220 1550 80 220 1342 80 140 10 0 70 10 110 ------------|---------------||---------------||---------------||---------------| Saturation Flow Module: Sat/Lane: 1650 1650 1650 1650 1650 1650 1650 1650 1650 1650 1650 1650 Adjustment: 1.00 1.00 1.00 1.00 1.00 1.00 1.00 1.00 1.00 1.00 1.00 1.00 Lanes: 1.00 2.00 1.00 1.00 2.00 1.00 1.00 1.00 1.00 0.74 0.26 1.00 Final Sat.: 1650 3300 1650 1650 3300 1650 1650 1650 1650 1216 434 1650 ------------|---------------||---------------||---------------||---------------| Capacity Analysis Module: Vol/Sat: 0.13 0.47 0.05 0.13 0.41 0.05 0.08 0.01 0.00 0.06 0.02 0.07 Crit Volume: 775 220 140 110 Crit Moves: **** **** **** **** ******************************************************************************** Traffix 7.9.0415 (c) 2007 Dowling Assoc. Licensed to DKS ASSOC., OAKLAND,CA

Cumulative PM Tue Feb 9, 2010 12:25:16 Page 9-1 -------------------------------------------------------------------------------- -------------------------------------------------------------------------------- Level Of Service Computation Report CCTALOS Method (Future Volume Alternative) ******************************************************************************** Intersection #7 San Pablo Ave / Pinole Valley Rd ******************************************************************************** Cycle (sec): 60 Critical Vol./Cap.(X): 1.108 Loss Time (sec): 8 (Y+R=4.0 sec) Average Delay (sec/veh): xxxxxx Optimal Cycle: 180 Level Of Service: F ******************************************************************************** Street Name: San Pablo Ave Pinole Valley Rd Approach: North Bound South Bound East Bound West Bound Movement: L - T - R L - T - R L - T - R L - T - R ------------|---------------||---------------||---------------||---------------| Control: Permitted Permitted Permitted Permitted Rights: Include Include Include Include Min. Green: 5 5 5 5 5 5 5 5 5 5 5 5 Lanes: 0 1 0 1 0 0 1 1 0 1 0 0 1! 0 0 0 1 0 0 1 ------------|---------------||---------------||---------------||---------------| Volume Module: Base Vol: 27 2020 20 106 804 5 27 13 27 17 17 894 Growth Adj: 1.00 1.00 1.00 1.00 1.00 1.00 1.00 1.00 1.00 1.00 1.00 1.00 Initial Bse: 27 2020 20 106 804 5 27 13 27 17 17 894 Added Vol: 0 0 0 0 0 0 0 0 0 0 0 0 PasserByVol: 0 0 0 0 0 0 0 0 0 0 0 0 Initial Fut: 27 2020 20 106 804 5 27 13 27 17 17 894 User Adj: 1.00 1.00 1.00 1.00 1.00 1.00 1.00 1.00 1.00 1.00 1.00 1.00 PHF Adj: 1.00 1.00 1.00 1.00 1.00 1.00 1.00 1.00 1.00 1.00 1.00 1.00 PHF Volume: 27 2020 20 106 804 5 27 13 27 17 17 894 Reduct Vol: 0 0 0 0 0 0 0 0 0 0 0 0 Reduced Vol: 27 2020 20 106 804 5 27 13 27 17 17 894 RTOR Reduct: 0 0 0 0 0 5 0 0 0 0 0 106 RTOR Vol: 27 2020 20 106 804 0 27 13 27 17 17 788 PCE Adj: 4.00 1.00 1.00 6.00 1.00 1.00 1.00 1.00 1.00 1.00 1.00 1.00 MLF Adj: 1.00 1.00 1.00 1.00 1.00 1.00 1.00 1.00 1.00 1.00 1.00 1.00 FinalVolume: 108 2020 20 636 804 0 27 13 27 17 17 788 ------------|---------------||---------------||---------------||---------------| Saturation Flow Module: Sat/Lane: 1800 1800 1800 1800 1800 1800 1800 1800 1800 1800 1800 1800 Adjustment: 1.00 1.00 1.00 1.00 1.00 1.00 1.00 1.00 1.00 1.00 1.00 1.00 Lanes: 0.03 1.95 0.02 1.00 1.00 1.00 0.41 0.19 0.40 0.50 0.50 1.00 Final Sat.: 49 3518 34 1800 1800 1800 725 349 725 900 900 1800 ------------|---------------||---------------||---------------||---------------| Capacity Analysis Module: Vol/Sat: 0.55 0.57 0.60 0.06 0.45 0.00 0.04 0.04 0.04 0.02 0.02 0.44 Crit Volume: 1074 106 27 788 Crit Moves: **** **** **** **** ******************************************************************************** Traffix 7.9.0415 (c) 2007 Dowling Assoc. Licensed to DKS ASSOC., OAKLAND,CA

Cumulative PM Tue Feb 9, 2010 12:25:16 Page 10-1 -------------------------------------------------------------------------------- -------------------------------------------------------------------------------- Level Of Service Computation Report CCTALOS Method (Future Volume Alternative) ******************************************************************************** Intersection #8 San Pablo Ave / Tennent Ave ******************************************************************************** Cycle (sec): 60 Critical Vol./Cap.(X): 1.259 Loss Time (sec): 8 (Y+R=4.0 sec) Average Delay (sec/veh): xxxxxx Optimal Cycle: 180 Level Of Service: F ******************************************************************************** Street Name: San Pablo Ave Tennent Ave Approach: North Bound South Bound East Bound West Bound Movement: L - T - R L - T - R L - T - R L - T - R ------------|---------------||---------------||---------------||---------------| Control: Permitted Permitted Permitted Permitted Rights: Ignore Ignore Ignore Ignore Min. Green: 0 0 0 0 0 0 0 0 0 0 0 0 Lanes: 0 1 1 0 1 0 1 0 1 0 0 0 1! 0 0 1 0 0 1 0 ------------|---------------||---------------||---------------||---------------| Volume Module: Base Vol: 85 2471 259 65 464 61 144 101 30 466 241 489 Growth Adj: 1.00 1.00 1.00 1.00 1.00 1.00 1.00 1.00 1.00 1.00 1.00 1.00 Initial Bse: 85 2471 259 65 464 61 144 101 30 466 241 489 Added Vol: 0 0 0 0 0 0 0 0 0 0 0 0 PasserByVol: 0 0 0 0 0 0 0 0 0 0 0 0 Initial Fut: 85 2471 259 65 464 61 144 101 30 466 241 489 User Adj: 1.00 1.00 1.00 1.00 1.00 1.00 1.00 1.00 1.00 1.00 1.00 1.00 PHF Adj: 1.00 1.00 1.00 1.00 1.00 1.00 1.00 1.00 1.00 1.00 1.00 1.00 PHF Volume: 85 2471 259 65 464 61 144 101 30 466 241 489 Reduct Vol: 0 0 0 0 0 0 0 0 0 0 0 0 Reduced Vol: 85 2471 259 65 464 61 144 101 30 466 241 489 RTOR Reduct: 0 0 0 0 0 0 0 0 0 0 0 0 RTOR Vol: 85 2471 259 65 464 61 144 101 30 466 241 489 PCE Adj: 2.00 1.00 1.00 6.00 1.00 1.00 1.00 1.00 1.00 1.00 1.00 1.00 MLF Adj: 1.00 1.00 1.00 1.00 1.00 1.00 1.00 1.00 1.00 1.00 1.00 1.00 FinalVolume: 170 2471 259 390 464 61 144 101 30 466 241 489 ------------|---------------||---------------||---------------||---------------| Saturation Flow Module: Sat/Lane: 1800 1800 1800 1800 1800 1800 1800 1800 1800 1800 1800 1800 Adjustment: 1.00 1.00 1.00 1.00 1.00 1.00 1.00 1.00 1.00 1.00 1.00 1.00 Lanes: 0.14 1.86 1.00 0.49 1.38 0.13 0.52 0.37 0.11 1.00 0.33 0.67 Final Sat.: 248 3352 1800 883 2477 240 943 661 196 1800 594 1206 ------------|---------------||---------------||---------------||---------------| Capacity Analysis Module: Vol/Sat: 0.34 0.74 0.14 0.07 0.19 0.25 0.15 0.15 0.15 0.26 0.41 0.41 Crit Volume: 1327 65 144 730 Crit Moves: **** **** **** **** ******************************************************************************** Traffix 7.9.0415 (c) 2007 Dowling Assoc. Licensed to DKS ASSOC., OAKLAND,CA
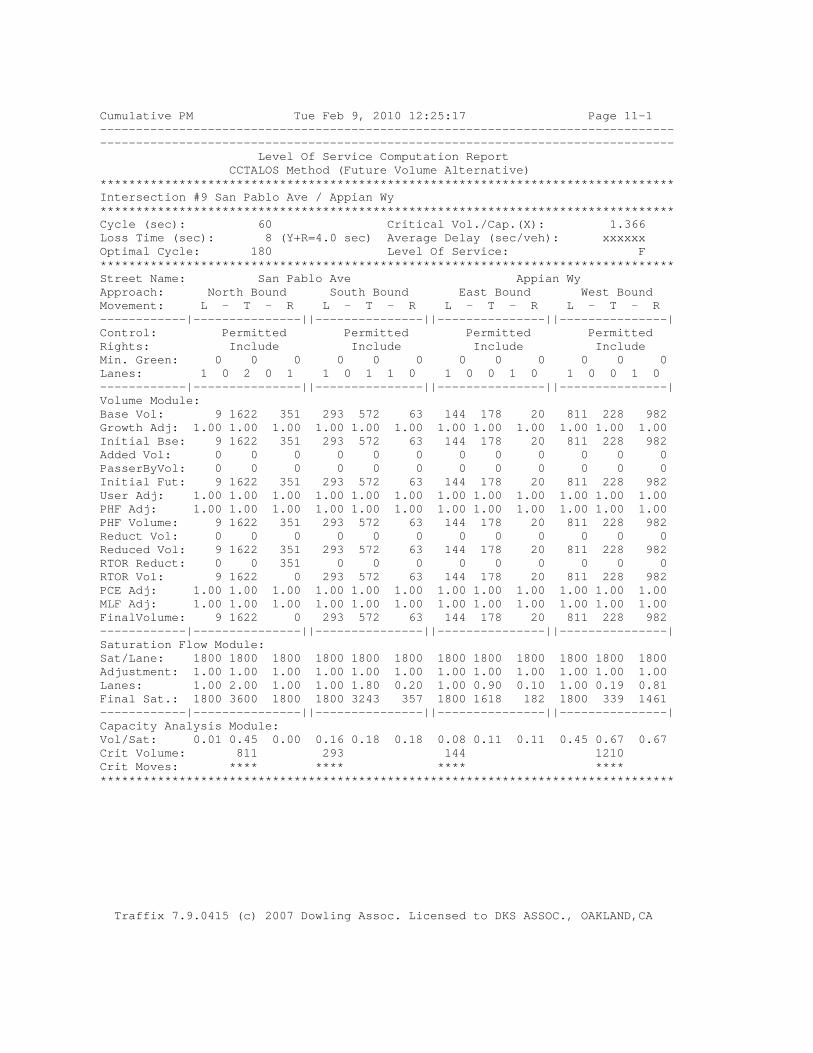
Cumulative PM Tue Feb 9, 2010 12:25:17 Page 11-1 -------------------------------------------------------------------------------- -------------------------------------------------------------------------------- Level Of Service Computation Report CCTALOS Method (Future Volume Alternative) ******************************************************************************** Intersection #9 San Pablo Ave / Appian Wy ******************************************************************************** Cycle (sec): 60 Critical Vol./Cap.(X): 1.366 Loss Time (sec): 8 (Y+R=4.0 sec) Average Delay (sec/veh): xxxxxx Optimal Cycle: 180 Level Of Service: F ******************************************************************************** Street Name: San Pablo Ave Appian Wy Approach: North Bound South Bound East Bound West Bound Movement: L - T - R L - T - R L - T - R L - T - R ------------|---------------||---------------||---------------||---------------| Control: Permitted Permitted Permitted Permitted Rights: Include Include Include Include Min. Green: 0 0 0 0 0 0 0 0 0 0 0 0 Lanes: 1 0 2 0 1 1 0 1 1 0 1 0 0 1 0 1 0 0 1 0 ------------|---------------||---------------||---------------||---------------| Volume Module: Base Vol: 9 1622 351 293 572 63 144 178 20 811 228 982 Growth Adj: 1.00 1.00 1.00 1.00 1.00 1.00 1.00 1.00 1.00 1.00 1.00 1.00 Initial Bse: 9 1622 351 293 572 63 144 178 20 811 228 982 Added Vol: 0 0 0 0 0 0 0 0 0 0 0 0 PasserByVol: 0 0 0 0 0 0 0 0 0 0 0 0 Initial Fut: 9 1622 351 293 572 63 144 178 20 811 228 982 User Adj: 1.00 1.00 1.00 1.00 1.00 1.00 1.00 1.00 1.00 1.00 1.00 1.00 PHF Adj: 1.00 1.00 1.00 1.00 1.00 1.00 1.00 1.00 1.00 1.00 1.00 1.00 PHF Volume: 9 1622 351 293 572 63 144 178 20 811 228 982 Reduct Vol: 0 0 0 0 0 0 0 0 0 0 0 0 Reduced Vol: 9 1622 351 293 572 63 144 178 20 811 228 982 RTOR Reduct: 0 0 351 0 0 0 0 0 0 0 0 0 RTOR Vol: 9 1622 0 293 572 63 144 178 20 811 228 982 PCE Adj: 1.00 1.00 1.00 1.00 1.00 1.00 1.00 1.00 1.00 1.00 1.00 1.00 MLF Adj: 1.00 1.00 1.00 1.00 1.00 1.00 1.00 1.00 1.00 1.00 1.00 1.00 FinalVolume: 9 1622 0 293 572 63 144 178 20 811 228 982 ------------|---------------||---------------||---------------||---------------| Saturation Flow Module: Sat/Lane: 1800 1800 1800 1800 1800 1800 1800 1800 1800 1800 1800 1800 Adjustment: 1.00 1.00 1.00 1.00 1.00 1.00 1.00 1.00 1.00 1.00 1.00 1.00 Lanes: 1.00 2.00 1.00 1.00 1.80 0.20 1.00 0.90 0.10 1.00 0.19 0.81 Final Sat.: 1800 3600 1800 1800 3243 357 1800 1618 182 1800 339 1461 ------------|---------------||---------------||---------------||---------------| Capacity Analysis Module: Vol/Sat: 0.01 0.45 0.00 0.16 0.18 0.18 0.08 0.11 0.11 0.45 0.67 0.67 Crit Volume: 811 293 144 1210 Crit Moves: **** **** **** **** ******************************************************************************** Traffix 7.9.0415 (c) 2007 Dowling Assoc. Licensed to DKS ASSOC., OAKLAND,CA

Cumulative PM Tue Feb 9, 2010 12:25:17 Page 12-1 -------------------------------------------------------------------------------- -------------------------------------------------------------------------------- Level Of Service Computation Report CCTALOS Method (Future Volume Alternative) ******************************************************************************** Intersection #10 Sycamore Ave / Bayberry Ave ******************************************************************************** Cycle (sec): 120 Critical Vol./Cap.(X): 0.762 Loss Time (sec): 16 (Y+R=4.0 sec) Average Delay (sec/veh): xxxxxx Optimal Cycle: 119 Level Of Service: C ******************************************************************************** Street Name: Bayberry Ave Sycamore Ave Approach: North Bound South Bound East Bound West Bound Movement: L - T - R L - T - R L - T - R L - T - R ------------|---------------||---------------||---------------||---------------| Control: Split Phase Split Phase Protected Protected Rights: Include Include Include Ignore Min. Green: 5 5 5 5 5 5 5 5 5 5 5 5 Lanes: 1 0 0 1 0 1 1 0 0 2 1 0 2 1 0 1 0 2 0 1 ------------|---------------||---------------||---------------||---------------| Volume Module: Base Vol: 30 20 70 740 90 700 190 1173 50 100 1040 150 Growth Adj: 1.00 1.00 1.00 1.00 1.00 1.00 1.00 1.00 1.00 1.00 1.00 1.00 Initial Bse: 30 20 70 740 90 700 190 1173 50 100 1040 150 Added Vol: 0 0 0 0 0 0 0 0 0 0 0 0 PasserByVol: 0 0 0 0 0 0 0 0 0 0 0 0 Initial Fut: 30 20 70 740 90 700 190 1173 50 100 1040 150 User Adj: 1.00 1.00 1.00 1.00 1.00 1.00 1.00 1.00 1.00 1.00 1.00 1.00 PHF Adj: 1.00 1.00 1.00 1.00 1.00 1.00 1.00 1.00 1.00 1.00 1.00 1.00 PHF Volume: 30 20 70 740 90 700 190 1173 50 100 1040 150 Reduct Vol: 0 0 0 0 0 0 0 0 0 0 0 0 Reduced Vol: 30 20 70 740 90 700 190 1173 50 100 1040 150 RTOR Reduct: 0 0 0 0 0 190 0 0 0 0 0 0 RTOR Vol: 30 20 70 740 90 510 190 1173 50 100 1040 150 PCE Adj: 1.00 1.00 1.00 1.00 1.00 1.00 1.00 1.00 1.00 1.00 1.00 1.00 MLF Adj: 1.00 1.00 1.00 1.00 1.00 1.00 1.00 1.00 1.00 1.00 1.00 1.00 FinalVolume: 30 20 70 740 90 510 190 1173 50 100 1040 150 ------------|---------------||---------------||---------------||---------------| Saturation Flow Module: Sat/Lane: 1650 1650 1650 1650 1650 1650 1650 1650 1650 1650 1650 1650 Adjustment: 1.00 1.00 1.00 0.91 1.00 0.91 1.00 1.00 1.00 1.00 1.00 1.00 Lanes: 1.00 0.22 0.78 1.78 0.22 2.00 1.00 2.88 0.12 1.00 2.00 1.00 Final Sat.: 1650 367 1283 2674 358 3000 1650 4748 202 1650 3300 1650 ------------|---------------||---------------||---------------||---------------| Capacity Analysis Module: Vol/Sat: 0.02 0.05 0.05 0.28 0.25 0.17 0.12 0.25 0.25 0.06 0.32 0.09 Crit Volume: 90 415 190 520 Crit Moves: **** **** **** **** ******************************************************************************** Traffix 7.9.0415 (c) 2007 Dowling Assoc. Licensed to DKS ASSOC., OAKLAND,CA

Year 2035 Cumulative Baseline
with Project Condition
A.M. Peak

Cumulative Project AM Tue Feb 9, 2010 12:27:09 Page 3-1 -------------------------------------------------------------------------------- -------------------------------------------------------------------------------- Level Of Service Computation Report CCTALOS Method (Future Volume Alternative) ******************************************************************************** Intersection #1 Willow Ave / I-80 WB Off-ramp ******************************************************************************** Cycle (sec): 90 Critical Vol./Cap.(X): 0.591 Loss Time (sec): 8 (Y+R=4.0 sec) Average Delay (sec/veh): xxxxxx Optimal Cycle: 42 Level Of Service: A ******************************************************************************** Street Name: I-80 WB Off-ramp Willow Ave Approach: North Bound South Bound East Bound West Bound Movement: L - T - R L - T - R L - T - R L - T - R ------------|---------------||---------------||---------------||---------------| Control: Protected Protected Protected Protected Rights: Include Include Ignore Ignore Min. Green: 5 5 5 5 5 5 5 5 5 5 5 5 Lanes: 0 0 0 0 0 1 0 0 0 1 0 0 2 0 0 0 0 2 0 0 ------------|---------------||---------------||---------------||---------------| Volume Module: Base Vol: 0 0 0 217 0 248 0 492 0 0 1537 0 Growth Adj: 1.00 1.00 1.00 1.00 1.00 1.00 1.00 1.00 1.00 1.00 1.00 1.00 Initial Bse: 0 0 0 217 0 248 0 492 0 0 1537 0 Added Vol: 0 0 0 0 0 0 0 0 0 0 0 0 PasserByVol: 0 0 0 0 0 0 0 0 0 0 0 0 Initial Fut: 0 0 0 217 0 248 0 492 0 0 1537 0 User Adj: 1.00 1.00 1.00 1.00 1.00 1.00 1.00 1.00 1.00 1.00 1.00 1.00 PHF Adj: 1.00 1.00 1.00 1.00 1.00 1.00 1.00 1.00 1.00 1.00 1.00 1.00 PHF Volume: 0 0 0 217 0 248 0 492 0 0 1537 0 Reduct Vol: 0 0 0 0 0 0 0 0 0 0 0 0 Reduced Vol: 0 0 0 217 0 248 0 492 0 0 1537 0 RTOR Reduct: 0 0 0 0 0 0 0 0 0 0 0 0 RTOR Vol: 0 0 0 217 0 248 0 492 0 0 1537 0 PCE Adj: 1.00 1.00 1.00 1.00 1.00 1.00 1.00 1.00 1.00 1.00 1.00 1.00 MLF Adj: 1.00 1.00 1.00 1.00 1.00 1.00 1.00 1.00 1.00 1.00 1.00 1.00 FinalVolume: 0 0 0 217 0 248 0 492 0 0 1537 0 ------------|---------------||---------------||---------------||---------------| Saturation Flow Module: Sat/Lane: 1720 1720 1720 1720 1720 1720 1720 1720 1720 1720 1720 1720 Adjustment: 1.00 1.00 1.00 1.00 1.00 1.00 1.00 1.00 1.00 1.00 1.00 1.00 Lanes: 0.00 0.00 0.00 1.00 0.00 1.00 0.00 2.00 0.00 0.00 2.00 0.00 Final Sat.: 0 0 0 1720 0 1720 0 3440 0 0 3440 0 ------------|---------------||---------------||---------------||---------------| Capacity Analysis Module: Vol/Sat: 0.00 0.00 0.00 0.13 0.00 0.14 0.00 0.14 0.00 0.00 0.45 0.00 Crit Volume: 0 248 0 769 Crit Moves: **** **** **** ******************************************************************************** Traffix 7.9.0415 (c) 2007 Dowling Assoc. Licensed to DKS ASSOC., OAKLAND,CA

Cumulative Project AM Tue Feb 9, 2010 12:27:09 Page 4-1 -------------------------------------------------------------------------------- -------------------------------------------------------------------------------- Level Of Service Computation Report CCTALOS Method (Future Volume Alternative) ******************************************************************************** Intersection #2 Willow Ave / Hawthorne Ave ******************************************************************************** Cycle (sec): 90 Critical Vol./Cap.(X): 0.781 Loss Time (sec): 8 (Y+R=4.0 sec) Average Delay (sec/veh): xxxxxx Optimal Cycle: 79 Level Of Service: C ******************************************************************************** Street Name: Hawthorne Ave Willow Ave Approach: North Bound South Bound East Bound West Bound Movement: L - T - R L - T - R L - T - R L - T - R ------------|---------------||---------------||---------------||---------------| Control: Protected Protected Protected Protected Rights: Include Include Include Include Min. Green: 0 0 0 5 5 5 5 5 0 0 5 5 Lanes: 0 0 0 0 0 0 0 2! 0 0 1 0 2 0 0 0 0 1 1 0 ------------|---------------||---------------||---------------||---------------| Volume Module: Base Vol: 0 0 0 660 0 39 58 954 0 0 899 352 Growth Adj: 1.00 1.00 1.00 1.00 1.00 1.00 1.00 1.00 1.00 1.00 1.00 1.00 Initial Bse: 0 0 0 660 0 39 58 954 0 0 899 352 Added Vol: 0 0 0 0 0 0 0 0 0 0 0 0 PasserByVol: 0 0 0 0 0 0 0 0 0 0 0 0 Initial Fut: 0 0 0 660 0 39 58 954 0 0 899 352 User Adj: 1.00 1.00 1.00 1.00 1.00 1.00 1.00 1.00 1.00 1.00 1.00 1.00 PHF Adj: 1.00 1.00 1.00 1.00 1.00 1.00 1.00 1.00 1.00 1.00 1.00 1.00 PHF Volume: 0 0 0 660 0 39 58 954 0 0 899 352 Reduct Vol: 0 0 0 0 0 0 0 0 0 0 0 0 Reduced Vol: 0 0 0 660 0 39 58 954 0 0 899 352 RTOR Reduct: 0 0 0 0 0 0 0 0 0 0 0 0 RTOR Vol: 0 0 0 660 0 39 58 954 0 0 899 352 PCE Adj: 1.00 1.00 1.00 1.00 1.00 1.00 1.00 1.00 1.00 1.00 1.00 1.00 MLF Adj: 1.00 1.00 1.00 1.00 1.00 1.00 1.00 1.00 1.00 1.00 1.00 1.00 FinalVolume: 0 0 0 660 0 39 58 954 0 0 899 352 ------------|---------------||---------------||---------------||---------------| Saturation Flow Module: Sat/Lane: 1720 1720 1720 1720 1720 1720 1720 1720 1720 1720 1720 1720 Adjustment: 1.00 1.00 1.00 1.00 1.00 1.00 1.00 1.00 1.00 1.00 1.00 1.00 Lanes: 0.00 0.00 0.00 1.00 0.89 0.11 1.00 2.00 0.00 0.00 1.44 0.56 Final Sat.: 0 0 0 1720 1528 192 1720 3440 0 0 2472 968 ------------|---------------||---------------||---------------||---------------| Capacity Analysis Module: Vol/Sat: 0.00 0.00 0.00 0.38 0.00 0.20 0.03 0.28 0.00 0.00 0.36 0.36 Crit Volume: 0 660 58 626 Crit Moves: **** **** **** ******************************************************************************** Traffix 7.9.0415 (c) 2007 Dowling Assoc. Licensed to DKS ASSOC., OAKLAND,CA
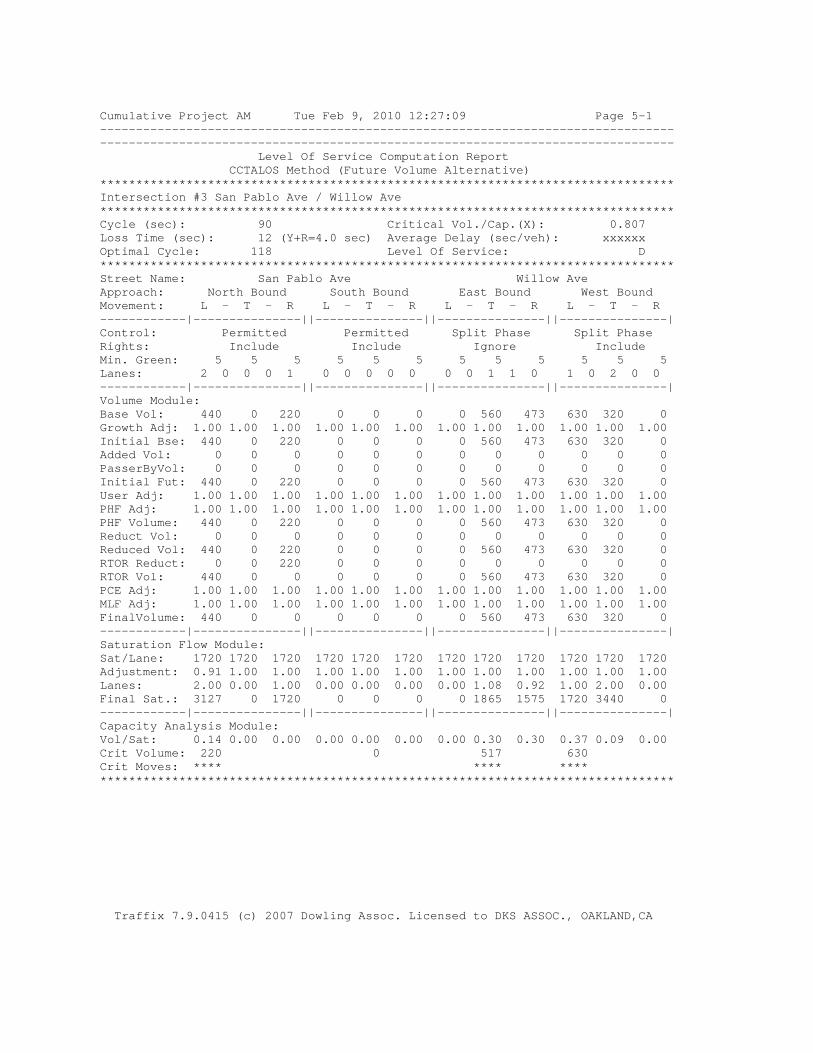
Cumulative Project AM Tue Feb 9, 2010 12:27:09 Page 5-1 -------------------------------------------------------------------------------- -------------------------------------------------------------------------------- Level Of Service Computation Report CCTALOS Method (Future Volume Alternative) ******************************************************************************** Intersection #3 San Pablo Ave / Willow Ave ******************************************************************************** Cycle (sec): 90 Critical Vol./Cap.(X): 0.807 Loss Time (sec): 12 (Y+R=4.0 sec) Average Delay (sec/veh): xxxxxx Optimal Cycle: 118 Level Of Service: D ******************************************************************************** Street Name: San Pablo Ave Willow Ave Approach: North Bound South Bound East Bound West Bound Movement: L - T - R L - T - R L - T - R L - T - R ------------|---------------||---------------||---------------||---------------| Control: Permitted Permitted Split Phase Split Phase Rights: Include Include Ignore Include Min. Green: 5 5 5 5 5 5 5 5 5 5 5 5 Lanes: 2 0 0 0 1 0 0 0 0 0 0 0 1 1 0 1 0 2 0 0 ------------|---------------||---------------||---------------||---------------| Volume Module: Base Vol: 440 0 220 0 0 0 0 560 473 630 320 0 Growth Adj: 1.00 1.00 1.00 1.00 1.00 1.00 1.00 1.00 1.00 1.00 1.00 1.00 Initial Bse: 440 0 220 0 0 0 0 560 473 630 320 0 Added Vol: 0 0 0 0 0 0 0 0 0 0 0 0 PasserByVol: 0 0 0 0 0 0 0 0 0 0 0 0 Initial Fut: 440 0 220 0 0 0 0 560 473 630 320 0 User Adj: 1.00 1.00 1.00 1.00 1.00 1.00 1.00 1.00 1.00 1.00 1.00 1.00 PHF Adj: 1.00 1.00 1.00 1.00 1.00 1.00 1.00 1.00 1.00 1.00 1.00 1.00 PHF Volume: 440 0 220 0 0 0 0 560 473 630 320 0 Reduct Vol: 0 0 0 0 0 0 0 0 0 0 0 0 Reduced Vol: 440 0 220 0 0 0 0 560 473 630 320 0 RTOR Reduct: 0 0 220 0 0 0 0 0 0 0 0 0 RTOR Vol: 440 0 0 0 0 0 0 560 473 630 320 0 PCE Adj: 1.00 1.00 1.00 1.00 1.00 1.00 1.00 1.00 1.00 1.00 1.00 1.00 MLF Adj: 1.00 1.00 1.00 1.00 1.00 1.00 1.00 1.00 1.00 1.00 1.00 1.00 FinalVolume: 440 0 0 0 0 0 0 560 473 630 320 0 ------------|---------------||---------------||---------------||---------------| Saturation Flow Module: Sat/Lane: 1720 1720 1720 1720 1720 1720 1720 1720 1720 1720 1720 1720 Adjustment: 0.91 1.00 1.00 1.00 1.00 1.00 1.00 1.00 1.00 1.00 1.00 1.00 Lanes: 2.00 0.00 1.00 0.00 0.00 0.00 0.00 1.08 0.92 1.00 2.00 0.00 Final Sat.: 3127 0 1720 0 0 0 0 1865 1575 1720 3440 0 ------------|---------------||---------------||---------------||---------------| Capacity Analysis Module: Vol/Sat: 0.14 0.00 0.00 0.00 0.00 0.00 0.00 0.30 0.30 0.37 0.09 0.00 Crit Volume: 220 0 517 630 Crit Moves: **** **** **** ******************************************************************************** Traffix 7.9.0415 (c) 2007 Dowling Assoc. Licensed to DKS ASSOC., OAKLAND,CA

Cumulative Project AM Tue Feb 9, 2010 12:27:09 Page 6-1 -------------------------------------------------------------------------------- -------------------------------------------------------------------------------- Level Of Service Computation Report CCTALOS Method (Future Volume Alternative) ******************************************************************************** Intersection #4 San Pablo Ave / John Muir Pkwy ******************************************************************************** Cycle (sec): 120 Critical Vol./Cap.(X): 0.780 Loss Time (sec): 16 (Y+R=4.0 sec) Average Delay (sec/veh): xxxxxx Optimal Cycle: 129 Level Of Service: C ******************************************************************************** Street Name: San Pablo Ave John Muir Pkwy Approach: North Bound South Bound East Bound West Bound Movement: L - T - R L - T - R L - T - R L - T - R ------------|---------------||---------------||---------------||---------------| Control: Protected Protected Protected Protected Rights: Ignore Include Include Include Min. Green: 5 5 5 5 5 5 5 5 5 5 5 5 Lanes: 1 0 2 0 1 1 0 1 1 0 1 0 1 1 0 2 0 0 1 0 ------------|---------------||---------------||---------------||---------------| Volume Module: Base Vol: 328 500 1610 190 900 70 20 90 50 470 314 140 Growth Adj: 1.00 1.00 1.00 1.00 1.00 1.00 1.00 1.00 1.00 1.00 1.00 1.00 Initial Bse: 328 500 1610 190 900 70 20 90 50 470 314 140 Added Vol: 0 0 0 0 0 0 0 0 0 0 0 0 PasserByVol: 0 0 0 0 0 0 0 0 0 0 0 0 Initial Fut: 328 500 1610 190 900 70 20 90 50 470 314 140 User Adj: 1.00 1.00 1.00 1.00 1.00 1.00 1.00 1.00 1.00 1.00 1.00 1.00 PHF Adj: 1.00 1.00 1.00 1.00 1.00 1.00 1.00 1.00 1.00 1.00 1.00 1.00 PHF Volume: 328 500 1610 190 900 70 20 90 50 470 314 140 Reduct Vol: 0 0 0 0 0 0 0 0 0 0 0 0 Reduced Vol: 328 500 1610 190 900 70 20 90 50 470 314 140 RTOR Reduct: 0 0 0 0 0 0 0 0 0 0 0 0 RTOR Vol: 328 500 1610 190 900 70 20 90 50 470 314 140 PCE Adj: 1.00 1.00 1.00 1.00 1.00 1.00 1.00 1.00 1.00 1.00 1.00 1.00 MLF Adj: 1.00 1.00 1.00 1.00 1.00 1.00 1.00 1.00 1.00 1.00 1.00 1.00 FinalVolume: 328 500 1610 190 900 70 20 90 50 470 314 140 ------------|---------------||---------------||---------------||---------------| Saturation Flow Module: Sat/Lane: 1650 1650 1650 1650 1650 1650 1650 1650 1650 1650 1650 1650 Adjustment: 1.00 1.00 1.00 1.00 1.00 1.00 1.00 1.00 1.00 0.91 1.00 1.00 Lanes: 1.00 2.00 1.00 1.00 1.86 0.14 1.00 1.29 0.71 2.00 0.69 0.31 Final Sat.: 1650 3300 1650 1650 3062 238 1650 2121 1179 3000 1141 509 ------------|---------------||---------------||---------------||---------------| Capacity Analysis Module: Vol/Sat: 0.20 0.15 0.98 0.12 0.29 0.29 0.01 0.04 0.04 0.16 0.28 0.28 Crit Volume: 328 485 20 454 Crit Moves: **** **** **** **** ******************************************************************************** Traffix 7.9.0415 (c) 2007 Dowling Assoc. Licensed to DKS ASSOC., OAKLAND,CA

Cumulative Project AM Tue Feb 9, 2010 12:27:09 Page 7-1 -------------------------------------------------------------------------------- -------------------------------------------------------------------------------- Level Of Service Computation Report CCTALOS Method (Future Volume Alternative) ******************************************************************************** Intersection #5 San Pablo Ave / Sycamore Ave ******************************************************************************** Cycle (sec): 120 Critical Vol./Cap.(X): 0.865 Loss Time (sec): 16 (Y+R=4.0 sec) Average Delay (sec/veh): xxxxxx Optimal Cycle: 180 Level Of Service: D ******************************************************************************** Street Name: San Pablo Ave Sycamore Ave Approach: North Bound South Bound East Bound West Bound Movement: L - T - R L - T - R L - T - R L - T - R ------------|---------------||---------------||---------------||---------------| Control: Protected Protected Split Phase Split Phase Rights: Include Include Include Include Min. Green: 5 5 5 5 5 5 5 5 5 5 5 5 Lanes: 2 0 2 0 1 2 0 1 1 0 1 0 1 1 0 1 1 0 0 2 ------------|---------------||---------------||---------------||---------------| Volume Module: Base Vol: 223 850 410 390 800 170 220 120 120 480 160 1248 Growth Adj: 1.00 1.00 1.00 1.00 1.00 1.00 1.00 1.00 1.00 1.00 1.00 1.00 Initial Bse: 223 850 410 390 800 170 220 120 120 480 160 1248 Added Vol: 0 0 0 0 0 0 0 0 0 0 0 0 PasserByVol: 0 0 0 0 0 0 0 0 0 0 0 0 Initial Fut: 223 850 410 390 800 170 220 120 120 480 160 1248 User Adj: 1.00 1.00 1.00 1.00 1.00 1.00 1.00 1.00 1.00 1.00 1.00 1.00 PHF Adj: 1.00 1.00 1.00 1.00 1.00 1.00 1.00 1.00 1.00 1.00 1.00 1.00 PHF Volume: 223 850 410 390 800 170 220 120 120 480 160 1248 Reduct Vol: 0 0 0 0 0 0 0 0 0 0 0 0 Reduced Vol: 223 850 410 390 800 170 220 120 120 480 160 1248 RTOR Reduct: 0 0 264 0 0 0 0 0 0 0 0 215 RTOR Vol: 223 850 146 390 800 170 220 120 120 480 160 1034 PCE Adj: 1.00 1.00 1.00 1.00 1.00 1.00 1.00 1.00 1.00 1.00 1.00 1.00 MLF Adj: 1.00 1.00 1.00 1.00 1.00 1.00 1.00 1.00 1.00 1.00 1.00 1.00 FinalVolume: 223 850 146 390 800 170 220 120 120 480 160 1034 ------------|---------------||---------------||---------------||---------------| Saturation Flow Module: Sat/Lane: 1650 1650 1650 1650 1650 1650 1650 1650 1650 1650 1650 1650 Adjustment: 0.91 1.00 1.00 0.91 1.00 1.00 1.00 1.00 1.00 0.91 1.00 0.91 Lanes: 2.00 2.00 1.00 2.00 1.65 0.35 1.00 1.00 1.00 1.50 0.50 2.00 Final Sat.: 3000 3300 1650 3000 2722 578 1650 1650 1650 2250 825 3000 ------------|---------------||---------------||---------------||---------------| Capacity Analysis Module: Vol/Sat: 0.07 0.26 0.09 0.13 0.29 0.29 0.13 0.07 0.07 0.21 0.19 0.34 Crit Volume: 425 195 220 517 Crit Moves: **** **** **** **** ******************************************************************************** Traffix 7.9.0415 (c) 2007 Dowling Assoc. Licensed to DKS ASSOC., OAKLAND,CA

Cumulative Project AM Tue Feb 9, 2010 12:27:09 Page 8-1 -------------------------------------------------------------------------------- -------------------------------------------------------------------------------- Level Of Service Computation Report CCTALOS Method (Future Volume Alternative) ******************************************************************************** Intersection #6 San Pablo Ave / Hercules Ave ******************************************************************************** Cycle (sec): 120 Critical Vol./Cap.(X): 0.758 Loss Time (sec): 16 (Y+R=4.0 sec) Average Delay (sec/veh): xxxxxx Optimal Cycle: 117 Level Of Service: C ******************************************************************************** Street Name: San Pablo Ave Hercules Ave Approach: North Bound South Bound East Bound West Bound Movement: L - T - R L - T - R L - T - R L - T - R ------------|---------------||---------------||---------------||---------------| Control: Protected Protected Split Phase Split Phase Rights: Include Include Include Include Min. Green: 5 5 5 5 5 5 5 5 5 5 5 5 Lanes: 1 0 2 0 1 1 0 2 0 1 1 0 1 0 1 0 1 0 1 0 ------------|---------------||---------------||---------------||---------------| Volume Module: Base Vol: 60 863 30 110 1320 100 280 20 190 150 10 250 Growth Adj: 1.00 1.00 1.00 1.00 1.00 1.00 1.00 1.00 1.00 1.00 1.00 1.00 Initial Bse: 60 863 30 110 1320 100 280 20 190 150 10 250 Added Vol: 0 0 0 0 0 0 0 0 0 0 0 0 PasserByVol: 0 0 0 0 0 0 0 0 0 0 0 0 Initial Fut: 60 863 30 110 1320 100 280 20 190 150 10 250 User Adj: 1.00 1.00 1.00 1.00 1.00 1.00 1.00 1.00 1.00 1.00 1.00 1.00 PHF Adj: 1.00 1.00 1.00 1.00 1.00 1.00 1.00 1.00 1.00 1.00 1.00 1.00 PHF Volume: 60 863 30 110 1320 100 280 20 190 150 10 250 Reduct Vol: 0 0 0 0 0 0 0 0 0 0 0 0 Reduced Vol: 60 863 30 110 1320 100 280 20 190 150 10 250 RTOR Reduct: 0 0 30 0 0 100 0 0 60 0 0 0 RTOR Vol: 60 863 0 110 1320 0 280 20 130 150 10 250 PCE Adj: 1.00 1.00 1.00 1.00 1.00 1.00 1.00 1.00 1.00 1.00 1.00 1.00 MLF Adj: 1.00 1.00 1.00 1.00 1.00 1.00 1.00 1.00 1.00 1.00 1.00 1.00 FinalVolume: 60 863 0 110 1320 0 280 20 130 150 10 250 ------------|---------------||---------------||---------------||---------------| Saturation Flow Module: Sat/Lane: 1650 1650 1650 1650 1650 1650 1650 1650 1650 1650 1650 1650 Adjustment: 1.00 1.00 1.00 1.00 1.00 1.00 1.00 1.00 1.00 1.00 1.00 1.00 Lanes: 1.00 2.00 1.00 1.00 2.00 1.00 1.00 1.00 1.00 0.73 0.27 1.00 Final Sat.: 1650 3300 1650 1650 3300 1650 1650 1650 1650 1207 443 1650 ------------|---------------||---------------||---------------||---------------| Capacity Analysis Module: Vol/Sat: 0.04 0.26 0.00 0.07 0.40 0.00 0.17 0.01 0.08 0.12 0.02 0.15 Crit Volume: 60 660 280 250 Crit Moves: **** **** **** **** ******************************************************************************** Traffix 7.9.0415 (c) 2007 Dowling Assoc. Licensed to DKS ASSOC., OAKLAND,CA

Cumulative Project AM Tue Feb 9, 2010 12:27:09 Page 9-1 -------------------------------------------------------------------------------- -------------------------------------------------------------------------------- Level Of Service Computation Report CCTALOS Method (Future Volume Alternative) ******************************************************************************** Intersection #7 San Pablo Ave / Pinole Valley Rd ******************************************************************************** Cycle (sec): 60 Critical Vol./Cap.(X): 0.889 Loss Time (sec): 8 (Y+R=4.0 sec) Average Delay (sec/veh): xxxxxx Optimal Cycle: 156 Level Of Service: D ******************************************************************************** Street Name: San Pablo Ave Pinole Valley Rd Approach: North Bound South Bound East Bound West Bound Movement: L - T - R L - T - R L - T - R L - T - R ------------|---------------||---------------||---------------||---------------| Control: Permitted Permitted Permitted Permitted Rights: Include Include Include Include Min. Green: 5 5 5 5 5 5 5 5 5 5 5 5 Lanes: 0 1 0 1 0 0 1 1 0 1 0 0 1! 0 0 0 1 0 0 1 ------------|---------------||---------------||---------------||---------------| Volume Module: Base Vol: 14 594 14 263 1498 5 6 0 3 55 28 127 Growth Adj: 1.00 1.00 1.00 1.00 1.00 1.00 1.00 1.00 1.00 1.00 1.00 1.00 Initial Bse: 14 594 14 263 1498 5 6 0 3 55 28 127 Added Vol: 0 0 0 0 0 0 0 0 0 0 0 0 PasserByVol: 0 0 0 0 0 0 0 0 0 0 0 0 Initial Fut: 14 594 14 263 1498 5 6 0 3 55 28 127 User Adj: 1.00 1.00 1.00 1.00 1.00 1.00 1.00 1.00 1.00 1.00 1.00 1.00 PHF Adj: 1.00 1.00 1.00 1.00 1.00 1.00 1.00 1.00 1.00 1.00 1.00 1.00 PHF Volume: 14 594 14 263 1498 5 6 0 3 55 28 127 Reduct Vol: 0 0 0 0 0 0 0 0 0 0 0 0 Reduced Vol: 14 594 14 263 1498 5 6 0 3 55 28 127 RTOR Reduct: 0 0 0 0 0 5 0 0 0 0 0 127 RTOR Vol: 14 594 14 263 1498 0 6 0 3 55 28 0 PCE Adj: 6.00 1.00 1.00 4.00 1.00 1.00 1.00 1.00 1.00 1.00 1.00 1.00 MLF Adj: 1.00 1.00 1.00 1.00 1.00 1.00 1.00 1.00 1.00 1.00 1.00 1.00 FinalVolume: 84 594 14 1052 1498 0 6 0 3 55 28 0 ------------|---------------||---------------||---------------||---------------| Saturation Flow Module: Sat/Lane: 1800 1800 1800 1800 1800 1800 1800 1800 1800 1800 1800 1800 Adjustment: 1.00 1.00 1.00 1.00 1.00 1.00 1.00 1.00 1.00 1.00 1.00 1.00 Lanes: 0.05 1.91 0.04 1.00 1.00 1.00 0.67 0.00 0.33 0.66 0.34 1.00 Final Sat.: 91 3436 73 1800 1800 1800 1200 0 600 1193 607 1800 ------------|---------------||---------------||---------------||---------------| Capacity Analysis Module: Vol/Sat: 0.15 0.17 0.19 0.15 0.83 0.00 0.01 0.00 0.01 0.05 0.05 0.00 Crit Volume: 14 1498 6 83 Crit Moves: **** **** **** **** ******************************************************************************** Traffix 7.9.0415 (c) 2007 Dowling Assoc. Licensed to DKS ASSOC., OAKLAND,CA
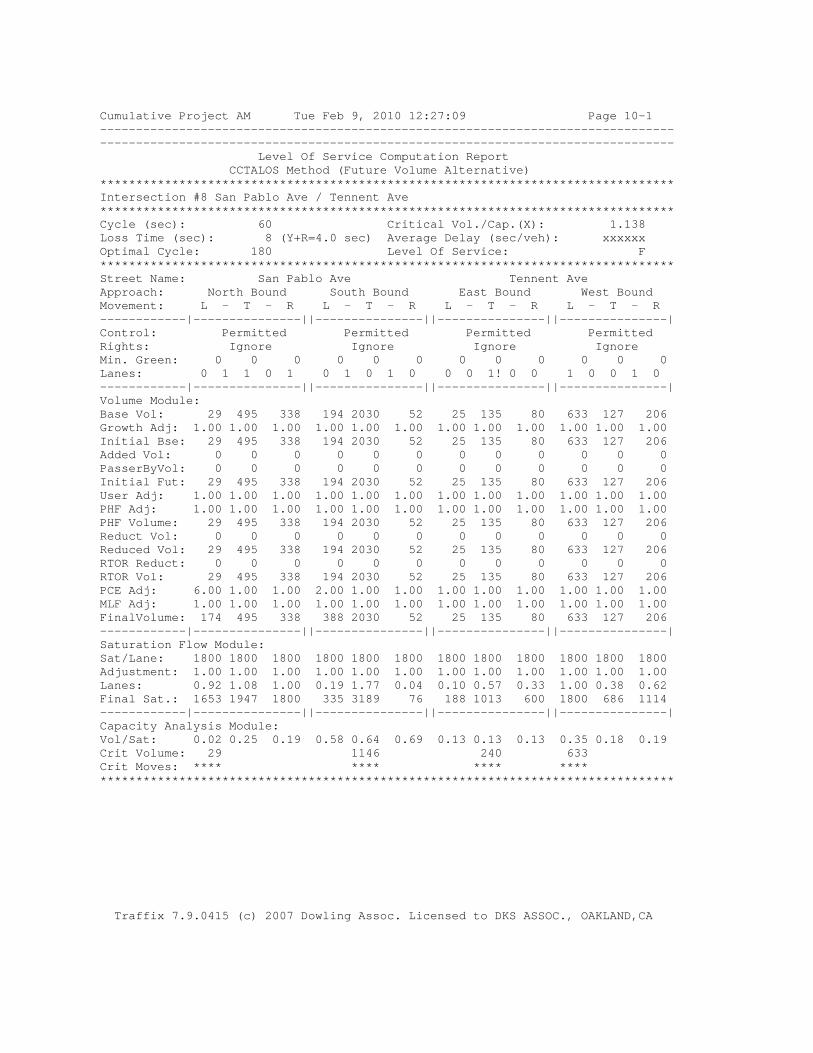
Cumulative Project AM Tue Feb 9, 2010 12:27:09 Page 10-1 -------------------------------------------------------------------------------- -------------------------------------------------------------------------------- Level Of Service Computation Report CCTALOS Method (Future Volume Alternative) ******************************************************************************** Intersection #8 San Pablo Ave / Tennent Ave ******************************************************************************** Cycle (sec): 60 Critical Vol./Cap.(X): 1.138 Loss Time (sec): 8 (Y+R=4.0 sec) Average Delay (sec/veh): xxxxxx Optimal Cycle: 180 Level Of Service: F ******************************************************************************** Street Name: San Pablo Ave Tennent Ave Approach: North Bound South Bound East Bound West Bound Movement: L - T - R L - T - R L - T - R L - T - R ------------|---------------||---------------||---------------||---------------| Control: Permitted Permitted Permitted Permitted Rights: Ignore Ignore Ignore Ignore Min. Green: 0 0 0 0 0 0 0 0 0 0 0 0 Lanes: 0 1 1 0 1 0 1 0 1 0 0 0 1! 0 0 1 0 0 1 0 ------------|---------------||---------------||---------------||---------------| Volume Module: Base Vol: 29 495 338 194 2030 52 25 135 80 633 127 206 Growth Adj: 1.00 1.00 1.00 1.00 1.00 1.00 1.00 1.00 1.00 1.00 1.00 1.00 Initial Bse: 29 495 338 194 2030 52 25 135 80 633 127 206 Added Vol: 0 0 0 0 0 0 0 0 0 0 0 0 PasserByVol: 0 0 0 0 0 0 0 0 0 0 0 0 Initial Fut: 29 495 338 194 2030 52 25 135 80 633 127 206 User Adj: 1.00 1.00 1.00 1.00 1.00 1.00 1.00 1.00 1.00 1.00 1.00 1.00 PHF Adj: 1.00 1.00 1.00 1.00 1.00 1.00 1.00 1.00 1.00 1.00 1.00 1.00 PHF Volume: 29 495 338 194 2030 52 25 135 80 633 127 206 Reduct Vol: 0 0 0 0 0 0 0 0 0 0 0 0 Reduced Vol: 29 495 338 194 2030 52 25 135 80 633 127 206 RTOR Reduct: 0 0 0 0 0 0 0 0 0 0 0 0 RTOR Vol: 29 495 338 194 2030 52 25 135 80 633 127 206 PCE Adj: 6.00 1.00 1.00 2.00 1.00 1.00 1.00 1.00 1.00 1.00 1.00 1.00 MLF Adj: 1.00 1.00 1.00 1.00 1.00 1.00 1.00 1.00 1.00 1.00 1.00 1.00 FinalVolume: 174 495 338 388 2030 52 25 135 80 633 127 206 ------------|---------------||---------------||---------------||---------------| Saturation Flow Module: Sat/Lane: 1800 1800 1800 1800 1800 1800 1800 1800 1800 1800 1800 1800 Adjustment: 1.00 1.00 1.00 1.00 1.00 1.00 1.00 1.00 1.00 1.00 1.00 1.00 Lanes: 0.92 1.08 1.00 0.19 1.77 0.04 0.10 0.57 0.33 1.00 0.38 0.62 Final Sat.: 1653 1947 1800 335 3189 76 188 1013 600 1800 686 1114 ------------|---------------||---------------||---------------||---------------| Capacity Analysis Module: Vol/Sat: 0.02 0.25 0.19 0.58 0.64 0.69 0.13 0.13 0.13 0.35 0.18 0.19 Crit Volume: 29 1146 240 633 Crit Moves: **** **** **** **** ******************************************************************************** Traffix 7.9.0415 (c) 2007 Dowling Assoc. Licensed to DKS ASSOC., OAKLAND,CA
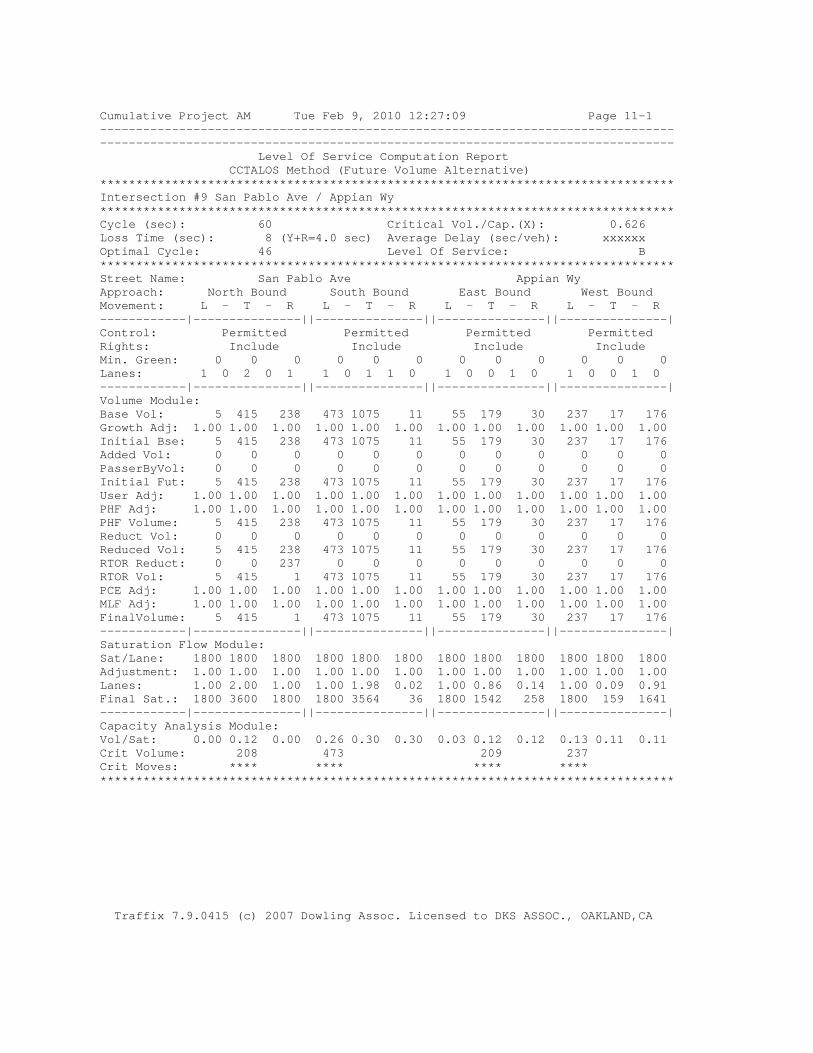
Cumulative Project AM Tue Feb 9, 2010 12:27:09 Page 11-1 -------------------------------------------------------------------------------- -------------------------------------------------------------------------------- Level Of Service Computation Report CCTALOS Method (Future Volume Alternative) ******************************************************************************** Intersection #9 San Pablo Ave / Appian Wy ******************************************************************************** Cycle (sec): 60 Critical Vol./Cap.(X): 0.626 Loss Time (sec): 8 (Y+R=4.0 sec) Average Delay (sec/veh): xxxxxx Optimal Cycle: 46 Level Of Service: B ******************************************************************************** Street Name: San Pablo Ave Appian Wy Approach: North Bound South Bound East Bound West Bound Movement: L - T - R L - T - R L - T - R L - T - R ------------|---------------||---------------||---------------||---------------| Control: Permitted Permitted Permitted Permitted Rights: Include Include Include Include Min. Green: 0 0 0 0 0 0 0 0 0 0 0 0 Lanes: 1 0 2 0 1 1 0 1 1 0 1 0 0 1 0 1 0 0 1 0 ------------|---------------||---------------||---------------||---------------| Volume Module: Base Vol: 5 415 238 473 1075 11 55 179 30 237 17 176 Growth Adj: 1.00 1.00 1.00 1.00 1.00 1.00 1.00 1.00 1.00 1.00 1.00 1.00 Initial Bse: 5 415 238 473 1075 11 55 179 30 237 17 176 Added Vol: 0 0 0 0 0 0 0 0 0 0 0 0 PasserByVol: 0 0 0 0 0 0 0 0 0 0 0 0 Initial Fut: 5 415 238 473 1075 11 55 179 30 237 17 176 User Adj: 1.00 1.00 1.00 1.00 1.00 1.00 1.00 1.00 1.00 1.00 1.00 1.00 PHF Adj: 1.00 1.00 1.00 1.00 1.00 1.00 1.00 1.00 1.00 1.00 1.00 1.00 PHF Volume: 5 415 238 473 1075 11 55 179 30 237 17 176 Reduct Vol: 0 0 0 0 0 0 0 0 0 0 0 0 Reduced Vol: 5 415 238 473 1075 11 55 179 30 237 17 176 RTOR Reduct: 0 0 237 0 0 0 0 0 0 0 0 0 RTOR Vol: 5 415 1 473 1075 11 55 179 30 237 17 176 PCE Adj: 1.00 1.00 1.00 1.00 1.00 1.00 1.00 1.00 1.00 1.00 1.00 1.00 MLF Adj: 1.00 1.00 1.00 1.00 1.00 1.00 1.00 1.00 1.00 1.00 1.00 1.00 FinalVolume: 5 415 1 473 1075 11 55 179 30 237 17 176 ------------|---------------||---------------||---------------||---------------| Saturation Flow Module: Sat/Lane: 1800 1800 1800 1800 1800 1800 1800 1800 1800 1800 1800 1800 Adjustment: 1.00 1.00 1.00 1.00 1.00 1.00 1.00 1.00 1.00 1.00 1.00 1.00 Lanes: 1.00 2.00 1.00 1.00 1.98 0.02 1.00 0.86 0.14 1.00 0.09 0.91 Final Sat.: 1800 3600 1800 1800 3564 36 1800 1542 258 1800 159 1641 ------------|---------------||---------------||---------------||---------------| Capacity Analysis Module: Vol/Sat: 0.00 0.12 0.00 0.26 0.30 0.30 0.03 0.12 0.12 0.13 0.11 0.11 Crit Volume: 208 473 209 237 Crit Moves: **** **** **** **** ******************************************************************************** Traffix 7.9.0415 (c) 2007 Dowling Assoc. Licensed to DKS ASSOC., OAKLAND,CA

Cumulative Project AM Tue Feb 9, 2010 12:27:09 Page 12-1 -------------------------------------------------------------------------------- -------------------------------------------------------------------------------- Level Of Service Computation Report CCTALOS Method (Future Volume Alternative) ******************************************************************************** Intersection #10 Sycamore Ave / Bayberry Ave ******************************************************************************** Cycle (sec): 120 Critical Vol./Cap.(X): 0.660 Loss Time (sec): 16 (Y+R=4.0 sec) Average Delay (sec/veh): xxxxxx Optimal Cycle: 83 Level Of Service: B ******************************************************************************** Street Name: Bayberry Ave Sycamore Ave Approach: North Bound South Bound East Bound West Bound Movement: L - T - R L - T - R L - T - R L - T - R ------------|---------------||---------------||---------------||---------------| Control: Split Phase Split Phase Protected Protected Rights: Include Include Include Ignore Min. Green: 5 5 5 5 5 5 5 5 5 5 5 5 Lanes: 1 0 0 1 0 1 1 0 0 2 1 0 2 1 0 1 0 2 0 1 ------------|---------------||---------------||---------------||---------------| Volume Module: Base Vol: 30 30 40 450 70 513 60 820 40 180 1345 100 Growth Adj: 1.00 1.00 1.00 1.00 1.00 1.00 1.00 1.00 1.00 1.00 1.00 1.00 Initial Bse: 30 30 40 450 70 513 60 820 40 180 1345 100 Added Vol: 0 0 0 0 0 0 0 0 0 0 0 0 PasserByVol: 0 0 0 0 0 0 0 0 0 0 0 0 Initial Fut: 30 30 40 450 70 513 60 820 40 180 1345 100 User Adj: 1.00 1.00 1.00 1.00 1.00 1.00 1.00 1.00 1.00 1.00 1.00 1.00 PHF Adj: 1.00 1.00 1.00 1.00 1.00 1.00 1.00 1.00 1.00 1.00 1.00 1.00 PHF Volume: 30 30 40 450 70 513 60 820 40 180 1345 100 Reduct Vol: 0 0 0 0 0 0 0 0 0 0 0 0 Reduced Vol: 30 30 40 450 70 513 60 820 40 180 1345 100 RTOR Reduct: 0 0 0 0 0 60 0 0 0 0 0 0 RTOR Vol: 30 30 40 450 70 453 60 820 40 180 1345 100 PCE Adj: 1.00 1.00 1.00 1.00 1.00 1.00 1.00 1.00 1.00 1.00 1.00 1.00 MLF Adj: 1.00 1.00 1.00 1.00 1.00 1.00 1.00 1.00 1.00 1.00 1.00 1.00 FinalVolume: 30 30 40 450 70 453 60 820 40 180 1345 100 ------------|---------------||---------------||---------------||---------------| Saturation Flow Module: Sat/Lane: 1650 1650 1650 1650 1650 1650 1650 1650 1650 1650 1650 1650 Adjustment: 1.00 1.00 1.00 0.91 1.00 0.91 1.00 1.00 1.00 1.00 1.00 1.00 Lanes: 1.00 0.43 0.57 1.73 0.27 2.00 1.00 2.86 0.14 1.00 2.00 1.00 Final Sat.: 1650 707 943 2596 444 3000 1650 4720 230 1650 3300 1650 ------------|---------------||---------------||---------------||---------------| Capacity Analysis Module: Vol/Sat: 0.02 0.04 0.04 0.17 0.16 0.15 0.04 0.17 0.17 0.11 0.41 0.06 Crit Volume: 70 260 60 673 Crit Moves: **** **** **** **** ******************************************************************************** Traffix 7.9.0415 (c) 2007 Dowling Assoc. Licensed to DKS ASSOC., OAKLAND,CA

P.M. PEAK

Cumulative Project PM Tue Feb 9, 2010 12:27:21 Page 3-1 -------------------------------------------------------------------------------- -------------------------------------------------------------------------------- Level Of Service Computation Report CCTALOS Method (Future Volume Alternative) ******************************************************************************** Intersection #1 Willow Ave / I-80 WB Off-ramp ******************************************************************************** Cycle (sec): 90 Critical Vol./Cap.(X): 0.938 Loss Time (sec): 8 (Y+R=4.0 sec) Average Delay (sec/veh): xxxxxx Optimal Cycle: 180 Level Of Service: E ******************************************************************************** Street Name: I-80 WB Off-ramp Willow Ave Approach: North Bound South Bound East Bound West Bound Movement: L - T - R L - T - R L - T - R L - T - R ------------|---------------||---------------||---------------||---------------| Control: Protected Protected Protected Protected Rights: Include Include Ignore Ignore Min. Green: 5 5 5 5 5 5 5 5 5 5 5 5 Lanes: 0 0 0 0 0 1 0 0 0 1 0 0 2 0 0 0 0 2 0 0 ------------|---------------||---------------||---------------||---------------| Volume Module: Base Vol: 0 0 0 345 0 281 0 1008 0 0 2536 0 Growth Adj: 1.00 1.00 1.00 1.00 1.00 1.00 1.00 1.00 1.00 1.00 1.00 1.00 Initial Bse: 0 0 0 345 0 281 0 1008 0 0 2536 0 Added Vol: 0 0 0 0 0 0 0 0 0 0 0 0 PasserByVol: 0 0 0 0 0 0 0 0 0 0 0 0 Initial Fut: 0 0 0 345 0 281 0 1008 0 0 2536 0 User Adj: 1.00 1.00 1.00 1.00 1.00 1.00 1.00 1.00 1.00 1.00 1.00 1.00 PHF Adj: 1.00 1.00 1.00 1.00 1.00 1.00 1.00 1.00 1.00 1.00 1.00 1.00 PHF Volume: 0 0 0 345 0 281 0 1008 0 0 2536 0 Reduct Vol: 0 0 0 0 0 0 0 0 0 0 0 0 Reduced Vol: 0 0 0 345 0 281 0 1008 0 0 2536 0 RTOR Reduct: 0 0 0 0 0 0 0 0 0 0 0 0 RTOR Vol: 0 0 0 345 0 281 0 1008 0 0 2536 0 PCE Adj: 1.00 1.00 1.00 1.00 1.00 1.00 1.00 1.00 1.00 1.00 1.00 1.00 MLF Adj: 1.00 1.00 1.00 1.00 1.00 1.00 1.00 1.00 1.00 1.00 1.00 1.00 FinalVolume: 0 0 0 345 0 281 0 1008 0 0 2536 0 ------------|---------------||---------------||---------------||---------------| Saturation Flow Module: Sat/Lane: 1720 1720 1720 1720 1720 1720 1720 1720 1720 1720 1720 1720 Adjustment: 1.00 1.00 1.00 1.00 1.00 1.00 1.00 1.00 1.00 1.00 1.00 1.00 Lanes: 0.00 0.00 0.00 1.00 0.00 1.00 0.00 2.00 0.00 0.00 2.00 0.00 Final Sat.: 0 0 0 1720 0 1720 0 3440 0 0 3440 0 ------------|---------------||---------------||---------------||---------------| Capacity Analysis Module: Vol/Sat: 0.00 0.00 0.00 0.20 0.00 0.16 0.00 0.29 0.00 0.00 0.74 0.00 Crit Volume: 0 345 0 1268 Crit Moves: **** **** **** ******************************************************************************** Traffix 7.9.0415 (c) 2007 Dowling Assoc. Licensed to DKS ASSOC., OAKLAND,CA

Cumulative Project PM Tue Feb 9, 2010 12:27:21 Page 4-1 -------------------------------------------------------------------------------- -------------------------------------------------------------------------------- Level Of Service Computation Report CCTALOS Method (Future Volume Alternative) ******************************************************************************** Intersection #2 Willow Ave / Hawthorne Ave ******************************************************************************** Cycle (sec): 90 Critical Vol./Cap.(X): 0.733 Loss Time (sec): 8 (Y+R=4.0 sec) Average Delay (sec/veh): xxxxxx Optimal Cycle: 64 Level Of Service: C ******************************************************************************** Street Name: Hawthorne Ave Willow Ave Approach: North Bound South Bound East Bound West Bound Movement: L - T - R L - T - R L - T - R L - T - R ------------|---------------||---------------||---------------||---------------| Control: Protected Protected Protected Protected Rights: Include Include Include Include Min. Green: 0 0 0 5 5 5 5 5 0 0 5 5 Lanes: 0 0 0 0 0 0 0 2! 0 0 1 0 2 0 0 0 0 1 1 0 ------------|---------------||---------------||---------------||---------------| Volume Module: Base Vol: 0 0 0 251 0 30 121 1561 0 0 1367 409 Growth Adj: 1.00 1.00 1.00 1.00 1.00 1.00 1.00 1.00 1.00 1.00 1.00 1.00 Initial Bse: 0 0 0 251 0 30 121 1561 0 0 1367 409 Added Vol: 0 0 0 0 0 0 0 0 0 0 0 0 PasserByVol: 0 0 0 0 0 0 0 0 0 0 0 0 Initial Fut: 0 0 0 251 0 30 121 1561 0 0 1367 409 User Adj: 1.00 1.00 1.00 1.00 1.00 1.00 1.00 1.00 1.00 1.00 1.00 1.00 PHF Adj: 1.00 1.00 1.00 1.00 1.00 1.00 1.00 1.00 1.00 1.00 1.00 1.00 PHF Volume: 0 0 0 251 0 30 121 1561 0 0 1367 409 Reduct Vol: 0 0 0 0 0 0 0 0 0 0 0 0 Reduced Vol: 0 0 0 251 0 30 121 1561 0 0 1367 409 RTOR Reduct: 0 0 0 0 0 0 0 0 0 0 0 0 RTOR Vol: 0 0 0 251 0 30 121 1561 0 0 1367 409 PCE Adj: 1.00 1.00 1.00 1.00 1.00 1.00 1.00 1.00 1.00 1.00 1.00 1.00 MLF Adj: 1.00 1.00 1.00 1.00 1.00 1.00 1.00 1.00 1.00 1.00 1.00 1.00 FinalVolume: 0 0 0 251 0 30 121 1561 0 0 1367 409 ------------|---------------||---------------||---------------||---------------| Saturation Flow Module: Sat/Lane: 1720 1720 1720 1720 1720 1720 1720 1720 1720 1720 1720 1720 Adjustment: 1.00 1.00 1.00 1.00 1.00 1.00 1.00 1.00 1.00 1.00 1.00 1.00 Lanes: 0.00 0.00 0.00 1.00 0.79 0.21 1.00 2.00 0.00 0.00 1.54 0.46 Final Sat.: 0 0 0 1720 1353 367 1720 3440 0 0 2648 792 ------------|---------------||---------------||---------------||---------------| Capacity Analysis Module: Vol/Sat: 0.00 0.00 0.00 0.15 0.00 0.08 0.07 0.45 0.00 0.00 0.52 0.52 Crit Volume: 0 251 121 888 Crit Moves: **** **** **** ******************************************************************************** Traffix 7.9.0415 (c) 2007 Dowling Assoc. Licensed to DKS ASSOC., OAKLAND,CA
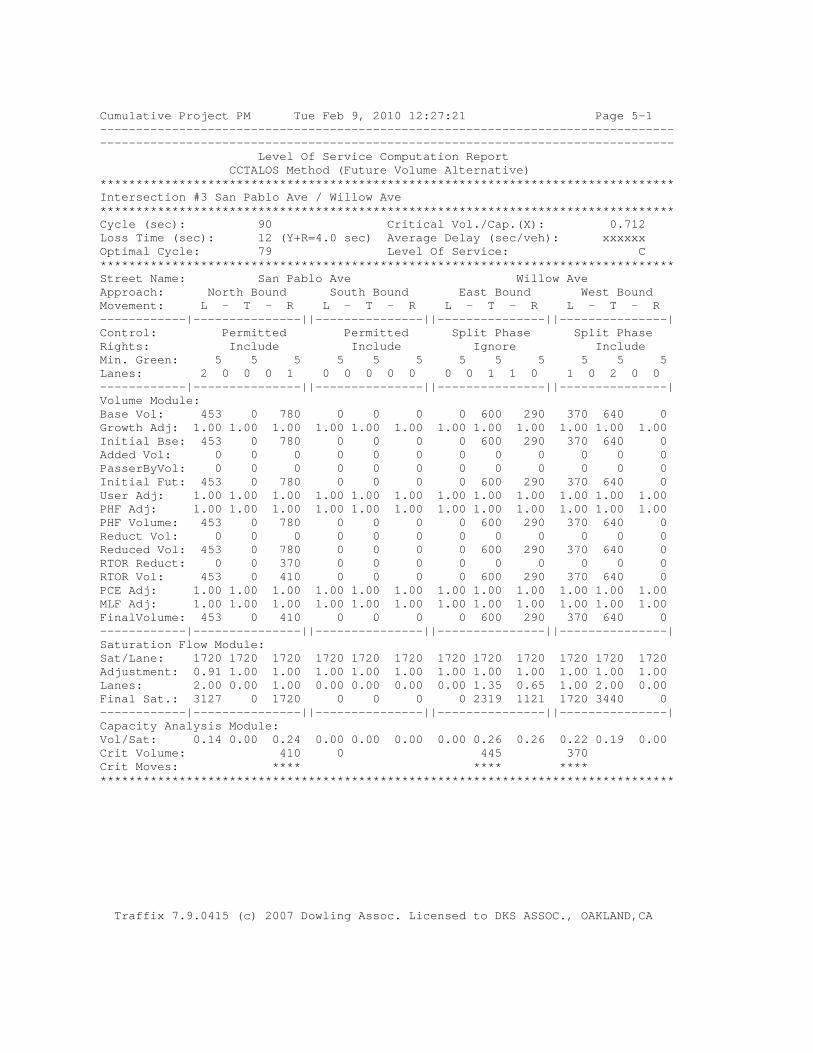
Cumulative Project PM Tue Feb 9, 2010 12:27:21 Page 5-1 -------------------------------------------------------------------------------- -------------------------------------------------------------------------------- Level Of Service Computation Report CCTALOS Method (Future Volume Alternative) ******************************************************************************** Intersection #3 San Pablo Ave / Willow Ave ******************************************************************************** Cycle (sec): 90 Critical Vol./Cap.(X): 0.712 Loss Time (sec): 12 (Y+R=4.0 sec) Average Delay (sec/veh): xxxxxx Optimal Cycle: 79 Level Of Service: C ******************************************************************************** Street Name: San Pablo Ave Willow Ave Approach: North Bound South Bound East Bound West Bound Movement: L - T - R L - T - R L - T - R L - T - R ------------|---------------||---------------||---------------||---------------| Control: Permitted Permitted Split Phase Split Phase Rights: Include Include Ignore Include Min. Green: 5 5 5 5 5 5 5 5 5 5 5 5 Lanes: 2 0 0 0 1 0 0 0 0 0 0 0 1 1 0 1 0 2 0 0 ------------|---------------||---------------||---------------||---------------| Volume Module: Base Vol: 453 0 780 0 0 0 0 600 290 370 640 0 Growth Adj: 1.00 1.00 1.00 1.00 1.00 1.00 1.00 1.00 1.00 1.00 1.00 1.00 Initial Bse: 453 0 780 0 0 0 0 600 290 370 640 0 Added Vol: 0 0 0 0 0 0 0 0 0 0 0 0 PasserByVol: 0 0 0 0 0 0 0 0 0 0 0 0 Initial Fut: 453 0 780 0 0 0 0 600 290 370 640 0 User Adj: 1.00 1.00 1.00 1.00 1.00 1.00 1.00 1.00 1.00 1.00 1.00 1.00 PHF Adj: 1.00 1.00 1.00 1.00 1.00 1.00 1.00 1.00 1.00 1.00 1.00 1.00 PHF Volume: 453 0 780 0 0 0 0 600 290 370 640 0 Reduct Vol: 0 0 0 0 0 0 0 0 0 0 0 0 Reduced Vol: 453 0 780 0 0 0 0 600 290 370 640 0 RTOR Reduct: 0 0 370 0 0 0 0 0 0 0 0 0 RTOR Vol: 453 0 410 0 0 0 0 600 290 370 640 0 PCE Adj: 1.00 1.00 1.00 1.00 1.00 1.00 1.00 1.00 1.00 1.00 1.00 1.00 MLF Adj: 1.00 1.00 1.00 1.00 1.00 1.00 1.00 1.00 1.00 1.00 1.00 1.00 FinalVolume: 453 0 410 0 0 0 0 600 290 370 640 0 ------------|---------------||---------------||---------------||---------------| Saturation Flow Module: Sat/Lane: 1720 1720 1720 1720 1720 1720 1720 1720 1720 1720 1720 1720 Adjustment: 0.91 1.00 1.00 1.00 1.00 1.00 1.00 1.00 1.00 1.00 1.00 1.00 Lanes: 2.00 0.00 1.00 0.00 0.00 0.00 0.00 1.35 0.65 1.00 2.00 0.00 Final Sat.: 3127 0 1720 0 0 0 0 2319 1121 1720 3440 0 ------------|---------------||---------------||---------------||---------------| Capacity Analysis Module: Vol/Sat: 0.14 0.00 0.24 0.00 0.00 0.00 0.00 0.26 0.26 0.22 0.19 0.00 Crit Volume: 410 0 445 370 Crit Moves: **** **** **** ******************************************************************************** Traffix 7.9.0415 (c) 2007 Dowling Assoc. Licensed to DKS ASSOC., OAKLAND,CA

Cumulative Project PM Tue Feb 9, 2010 12:27:21 Page 6-1 -------------------------------------------------------------------------------- -------------------------------------------------------------------------------- Level Of Service Computation Report CCTALOS Method (Future Volume Alternative) ******************************************************************************** Intersection #4 San Pablo Ave / John Muir Pkwy ******************************************************************************** Cycle (sec): 120 Critical Vol./Cap.(X): 1.253 Loss Time (sec): 16 (Y+R=4.0 sec) Average Delay (sec/veh): xxxxxx Optimal Cycle: 180 Level Of Service: F ******************************************************************************** Street Name: San Pablo Ave John Muir Pkwy Approach: North Bound South Bound East Bound West Bound Movement: L - T - R L - T - R L - T - R L - T - R ------------|---------------||---------------||---------------||---------------| Control: Protected Protected Protected Protected Rights: Ignore Include Include Include Min. Green: 5 5 5 5 5 5 5 5 5 5 5 5 Lanes: 1 0 2 0 1 1 0 1 1 0 1 0 1 1 0 2 0 0 1 0 ------------|---------------||---------------||---------------||---------------| Volume Module: Base Vol: 150 1060 1200 460 460 20 40 866 245 950 80 80 Growth Adj: 1.00 1.00 1.00 1.00 1.00 1.00 1.00 1.00 1.00 1.00 1.00 1.00 Initial Bse: 150 1060 1200 460 460 20 40 866 245 950 80 80 Added Vol: 0 0 0 0 0 0 0 0 0 0 0 0 PasserByVol: 0 0 0 0 0 0 0 0 0 0 0 0 Initial Fut: 150 1060 1200 460 460 20 40 866 245 950 80 80 User Adj: 1.00 1.00 1.00 1.00 1.00 1.00 1.00 1.00 1.00 1.00 1.00 1.00 PHF Adj: 1.00 1.00 1.00 1.00 1.00 1.00 1.00 1.00 1.00 1.00 1.00 1.00 PHF Volume: 150 1060 1200 460 460 20 40 866 245 950 80 80 Reduct Vol: 0 0 0 0 0 0 0 0 0 0 0 0 Reduced Vol: 150 1060 1200 460 460 20 40 866 245 950 80 80 RTOR Reduct: 0 0 0 0 0 0 0 0 0 0 0 0 RTOR Vol: 150 1060 1200 460 460 20 40 866 245 950 80 80 PCE Adj: 1.00 1.00 1.00 1.00 1.00 1.00 1.00 1.00 1.00 1.00 1.00 1.00 MLF Adj: 1.00 1.00 1.00 1.00 1.00 1.00 1.00 1.00 1.00 1.00 1.00 1.00 FinalVolume: 150 1060 1200 460 460 20 40 866 245 950 80 80 ------------|---------------||---------------||---------------||---------------| Saturation Flow Module: Sat/Lane: 1650 1650 1650 1650 1650 1650 1650 1650 1650 1650 1650 1650 Adjustment: 1.00 1.00 1.00 1.00 1.00 1.00 1.00 1.00 1.00 0.91 1.00 1.00 Lanes: 1.00 2.00 1.00 1.00 1.92 0.08 1.00 1.56 0.44 2.00 0.50 0.50 Final Sat.: 1650 3300 1650 1650 3163 138 1650 2572 728 3000 825 825 ------------|---------------||---------------||---------------||---------------| Capacity Analysis Module: Vol/Sat: 0.09 0.32 0.73 0.28 0.15 0.15 0.02 0.34 0.34 0.32 0.10 0.10 Crit Volume: 530 460 556 475 Crit Moves: **** **** **** **** ******************************************************************************** Traffix 7.9.0415 (c) 2007 Dowling Assoc. Licensed to DKS ASSOC., OAKLAND,CA

Cumulative Project PM Tue Feb 9, 2010 12:27:21 Page 7-1 -------------------------------------------------------------------------------- -------------------------------------------------------------------------------- Level Of Service Computation Report CCTALOS Method (Future Volume Alternative) ******************************************************************************** Intersection #5 San Pablo Ave / Sycamore Ave ******************************************************************************** Cycle (sec): 120 Critical Vol./Cap.(X): 1.110 Loss Time (sec): 16 (Y+R=4.0 sec) Average Delay (sec/veh): xxxxxx Optimal Cycle: 180 Level Of Service: F ******************************************************************************** Street Name: San Pablo Ave Sycamore Ave Approach: North Bound South Bound East Bound West Bound Movement: L - T - R L - T - R L - T - R L - T - R ------------|---------------||---------------||---------------||---------------| Control: Protected Protected Split Phase Split Phase Rights: Include Include Include Include Min. Green: 5 5 5 5 5 5 5 5 5 5 5 5 Lanes: 2 0 2 0 1 2 0 1 1 0 1 0 1 1 0 1 1 0 0 2 ------------|---------------||---------------||---------------||---------------| Volume Module: Base Vol: 220 1120 530 765 710 190 300 140 350 600 310 860 Growth Adj: 1.00 1.00 1.00 1.00 1.00 1.00 1.00 1.00 1.00 1.00 1.00 1.00 Initial Bse: 220 1120 530 765 710 190 300 140 350 600 310 860 Added Vol: 0 0 0 0 0 0 0 0 0 0 0 0 PasserByVol: 0 0 0 0 0 0 0 0 0 0 0 0 Initial Fut: 220 1120 530 765 710 190 300 140 350 600 310 860 User Adj: 1.00 1.00 1.00 1.00 1.00 1.00 1.00 1.00 1.00 1.00 1.00 1.00 PHF Adj: 1.00 1.00 1.00 1.00 1.00 1.00 1.00 1.00 1.00 1.00 1.00 1.00 PHF Volume: 220 1120 530 765 710 190 300 140 350 600 310 860 Reduct Vol: 0 0 0 0 0 0 0 0 0 0 0 0 Reduced Vol: 220 1120 530 765 710 190 300 140 350 600 310 860 RTOR Reduct: 0 0 330 0 0 0 0 0 0 0 0 421 RTOR Vol: 220 1120 200 765 710 190 300 140 350 600 310 439 PCE Adj: 1.00 1.00 1.00 1.00 1.00 1.00 1.00 1.00 1.00 1.00 1.00 1.00 MLF Adj: 1.00 1.00 1.00 1.00 1.00 1.00 1.00 1.00 1.00 1.00 1.00 1.00 FinalVolume: 220 1120 200 765 710 190 300 140 350 600 310 439 ------------|---------------||---------------||---------------||---------------| Saturation Flow Module: Sat/Lane: 1650 1650 1650 1650 1650 1650 1650 1650 1650 1650 1650 1650 Adjustment: 0.91 1.00 1.00 0.91 1.00 1.00 1.00 1.00 1.00 0.91 1.00 0.91 Lanes: 2.00 2.00 1.00 2.00 1.58 0.42 1.00 1.00 1.00 1.32 0.68 2.00 Final Sat.: 3000 3300 1650 3000 2603 697 1650 1650 1650 1978 1124 3000 ------------|---------------||---------------||---------------||---------------| Capacity Analysis Module: Vol/Sat: 0.07 0.34 0.12 0.26 0.27 0.27 0.18 0.08 0.21 0.30 0.28 0.15 Crit Volume: 560 383 350 455 Crit Moves: **** **** **** **** ******************************************************************************** Traffix 7.9.0415 (c) 2007 Dowling Assoc. Licensed to DKS ASSOC., OAKLAND,CA

Cumulative Project PM Tue Feb 9, 2010 12:27:21 Page 8-1 -------------------------------------------------------------------------------- -------------------------------------------------------------------------------- Level Of Service Computation Report CCTALOS Method (Future Volume Alternative) ******************************************************************************** Intersection #6 San Pablo Ave / Hercules Ave ******************************************************************************** Cycle (sec): 120 Critical Vol./Cap.(X): 0.755 Loss Time (sec): 16 (Y+R=4.0 sec) Average Delay (sec/veh): xxxxxx Optimal Cycle: 116 Level Of Service: C ******************************************************************************** Street Name: San Pablo Ave Hercules Ave Approach: North Bound South Bound East Bound West Bound Movement: L - T - R L - T - R L - T - R L - T - R ------------|---------------||---------------||---------------||---------------| Control: Protected Protected Split Phase Split Phase Rights: Include Include Include Include Min. Green: 5 5 5 5 5 5 5 5 5 5 5 5 Lanes: 1 0 2 0 1 1 0 2 0 1 1 0 1 0 1 0 1 0 1 0 ------------|---------------||---------------||---------------||---------------| Volume Module: Base Vol: 220 1550 150 220 1353 220 140 10 100 70 10 110 Growth Adj: 1.00 1.00 1.00 1.00 1.00 1.00 1.00 1.00 1.00 1.00 1.00 1.00 Initial Bse: 220 1550 150 220 1353 220 140 10 100 70 10 110 Added Vol: 0 0 0 0 0 0 0 0 0 0 0 0 PasserByVol: 0 0 0 0 0 0 0 0 0 0 0 0 Initial Fut: 220 1550 150 220 1353 220 140 10 100 70 10 110 User Adj: 1.00 1.00 1.00 1.00 1.00 1.00 1.00 1.00 1.00 1.00 1.00 1.00 PHF Adj: 1.00 1.00 1.00 1.00 1.00 1.00 1.00 1.00 1.00 1.00 1.00 1.00 PHF Volume: 220 1550 150 220 1353 220 140 10 100 70 10 110 Reduct Vol: 0 0 0 0 0 0 0 0 0 0 0 0 Reduced Vol: 220 1550 150 220 1353 220 140 10 100 70 10 110 RTOR Reduct: 0 0 70 0 0 140 0 0 100 0 0 0 RTOR Vol: 220 1550 80 220 1353 80 140 10 0 70 10 110 PCE Adj: 1.00 1.00 1.00 1.00 1.00 1.00 1.00 1.00 1.00 1.00 1.00 1.00 MLF Adj: 1.00 1.00 1.00 1.00 1.00 1.00 1.00 1.00 1.00 1.00 1.00 1.00 FinalVolume: 220 1550 80 220 1353 80 140 10 0 70 10 110 ------------|---------------||---------------||---------------||---------------| Saturation Flow Module: Sat/Lane: 1650 1650 1650 1650 1650 1650 1650 1650 1650 1650 1650 1650 Adjustment: 1.00 1.00 1.00 1.00 1.00 1.00 1.00 1.00 1.00 1.00 1.00 1.00 Lanes: 1.00 2.00 1.00 1.00 2.00 1.00 1.00 1.00 1.00 0.74 0.26 1.00 Final Sat.: 1650 3300 1650 1650 3300 1650 1650 1650 1650 1216 434 1650 ------------|---------------||---------------||---------------||---------------| Capacity Analysis Module: Vol/Sat: 0.13 0.47 0.05 0.13 0.41 0.05 0.08 0.01 0.00 0.06 0.02 0.07 Crit Volume: 775 220 140 110 Crit Moves: **** **** **** **** ******************************************************************************** Traffix 7.9.0415 (c) 2007 Dowling Assoc. Licensed to DKS ASSOC., OAKLAND,CA

Cumulative Project PM Tue Feb 9, 2010 12:27:21 Page 9-1 -------------------------------------------------------------------------------- -------------------------------------------------------------------------------- Level Of Service Computation Report CCTALOS Method (Future Volume Alternative) ******************************************************************************** Intersection #7 San Pablo Ave / Pinole Valley Rd ******************************************************************************** Cycle (sec): 60 Critical Vol./Cap.(X): 1.108 Loss Time (sec): 8 (Y+R=4.0 sec) Average Delay (sec/veh): xxxxxx Optimal Cycle: 180 Level Of Service: F ******************************************************************************** Street Name: San Pablo Ave Pinole Valley Rd Approach: North Bound South Bound East Bound West Bound Movement: L - T - R L - T - R L - T - R L - T - R ------------|---------------||---------------||---------------||---------------| Control: Permitted Permitted Permitted Permitted Rights: Include Include Include Include Min. Green: 5 5 5 5 5 5 5 5 5 5 5 5 Lanes: 0 1 0 1 0 0 1 1 0 1 0 0 1! 0 0 0 1 0 0 1 ------------|---------------||---------------||---------------||---------------| Volume Module: Base Vol: 27 2020 20 106 815 5 27 13 27 17 17 894 Growth Adj: 1.00 1.00 1.00 1.00 1.00 1.00 1.00 1.00 1.00 1.00 1.00 1.00 Initial Bse: 27 2020 20 106 815 5 27 13 27 17 17 894 Added Vol: 0 0 0 0 0 0 0 0 0 0 0 0 PasserByVol: 0 0 0 0 0 0 0 0 0 0 0 0 Initial Fut: 27 2020 20 106 815 5 27 13 27 17 17 894 User Adj: 1.00 1.00 1.00 1.00 1.00 1.00 1.00 1.00 1.00 1.00 1.00 1.00 PHF Adj: 1.00 1.00 1.00 1.00 1.00 1.00 1.00 1.00 1.00 1.00 1.00 1.00 PHF Volume: 27 2020 20 106 815 5 27 13 27 17 17 894 Reduct Vol: 0 0 0 0 0 0 0 0 0 0 0 0 Reduced Vol: 27 2020 20 106 815 5 27 13 27 17 17 894 RTOR Reduct: 0 0 0 0 0 5 0 0 0 0 0 106 RTOR Vol: 27 2020 20 106 815 0 27 13 27 17 17 788 PCE Adj: 4.00 1.00 1.00 6.00 1.00 1.00 1.00 1.00 1.00 1.00 1.00 1.00 MLF Adj: 1.00 1.00 1.00 1.00 1.00 1.00 1.00 1.00 1.00 1.00 1.00 1.00 FinalVolume: 108 2020 20 636 815 0 27 13 27 17 17 788 ------------|---------------||---------------||---------------||---------------| Saturation Flow Module: Sat/Lane: 1800 1800 1800 1800 1800 1800 1800 1800 1800 1800 1800 1800 Adjustment: 1.00 1.00 1.00 1.00 1.00 1.00 1.00 1.00 1.00 1.00 1.00 1.00 Lanes: 0.03 1.95 0.02 1.00 1.00 1.00 0.41 0.19 0.40 0.50 0.50 1.00 Final Sat.: 49 3518 34 1800 1800 1800 725 349 725 900 900 1800 ------------|---------------||---------------||---------------||---------------| Capacity Analysis Module: Vol/Sat: 0.55 0.57 0.60 0.06 0.45 0.00 0.04 0.04 0.04 0.02 0.02 0.44 Crit Volume: 1074 106 27 788 Crit Moves: **** **** **** **** ******************************************************************************** Traffix 7.9.0415 (c) 2007 Dowling Assoc. Licensed to DKS ASSOC., OAKLAND,CA

Cumulative Project PM Tue Feb 9, 2010 12:27:21 Page 10-1 -------------------------------------------------------------------------------- -------------------------------------------------------------------------------- Level Of Service Computation Report CCTALOS Method (Future Volume Alternative) ******************************************************************************** Intersection #8 San Pablo Ave / Tennent Ave ******************************************************************************** Cycle (sec): 60 Critical Vol./Cap.(X): 1.259 Loss Time (sec): 8 (Y+R=4.0 sec) Average Delay (sec/veh): xxxxxx Optimal Cycle: 180 Level Of Service: F ******************************************************************************** Street Name: San Pablo Ave Tennent Ave Approach: North Bound South Bound East Bound West Bound Movement: L - T - R L - T - R L - T - R L - T - R ------------|---------------||---------------||---------------||---------------| Control: Permitted Permitted Permitted Permitted Rights: Ignore Ignore Ignore Ignore Min. Green: 0 0 0 0 0 0 0 0 0 0 0 0 Lanes: 0 1 1 0 1 0 1 0 1 0 0 0 1! 0 0 1 0 0 1 0 ------------|---------------||---------------||---------------||---------------| Volume Module: Base Vol: 85 2471 259 65 475 61 144 101 30 466 241 489 Growth Adj: 1.00 1.00 1.00 1.00 1.00 1.00 1.00 1.00 1.00 1.00 1.00 1.00 Initial Bse: 85 2471 259 65 475 61 144 101 30 466 241 489 Added Vol: 0 0 0 0 0 0 0 0 0 0 0 0 PasserByVol: 0 0 0 0 0 0 0 0 0 0 0 0 Initial Fut: 85 2471 259 65 475 61 144 101 30 466 241 489 User Adj: 1.00 1.00 1.00 1.00 1.00 1.00 1.00 1.00 1.00 1.00 1.00 1.00 PHF Adj: 1.00 1.00 1.00 1.00 1.00 1.00 1.00 1.00 1.00 1.00 1.00 1.00 PHF Volume: 85 2471 259 65 475 61 144 101 30 466 241 489 Reduct Vol: 0 0 0 0 0 0 0 0 0 0 0 0 Reduced Vol: 85 2471 259 65 475 61 144 101 30 466 241 489 RTOR Reduct: 0 0 0 0 0 0 0 0 0 0 0 0 RTOR Vol: 85 2471 259 65 475 61 144 101 30 466 241 489 PCE Adj: 2.00 1.00 1.00 6.00 1.00 1.00 1.00 1.00 1.00 1.00 1.00 1.00 MLF Adj: 1.00 1.00 1.00 1.00 1.00 1.00 1.00 1.00 1.00 1.00 1.00 1.00 FinalVolume: 170 2471 259 390 475 61 144 101 30 466 241 489 ------------|---------------||---------------||---------------||---------------| Saturation Flow Module: Sat/Lane: 1800 1800 1800 1800 1800 1800 1800 1800 1800 1800 1800 1800 Adjustment: 1.00 1.00 1.00 1.00 1.00 1.00 1.00 1.00 1.00 1.00 1.00 1.00 Lanes: 0.14 1.86 1.00 0.47 1.40 0.13 0.52 0.37 0.11 1.00 0.33 0.67 Final Sat.: 248 3352 1800 848 2515 237 943 661 196 1800 594 1206 ------------|---------------||---------------||---------------||---------------| Capacity Analysis Module: Vol/Sat: 0.34 0.74 0.14 0.08 0.19 0.26 0.15 0.15 0.15 0.26 0.41 0.41 Crit Volume: 1327 65 144 730 Crit Moves: **** **** **** **** ******************************************************************************** Traffix 7.9.0415 (c) 2007 Dowling Assoc. Licensed to DKS ASSOC., OAKLAND,CA

Cumulative Project PM Tue Feb 9, 2010 12:27:21 Page 11-1 -------------------------------------------------------------------------------- -------------------------------------------------------------------------------- Level Of Service Computation Report CCTALOS Method (Future Volume Alternative) ******************************************************************************** Intersection #9 San Pablo Ave / Appian Wy ******************************************************************************** Cycle (sec): 60 Critical Vol./Cap.(X): 1.366 Loss Time (sec): 8 (Y+R=4.0 sec) Average Delay (sec/veh): xxxxxx Optimal Cycle: 180 Level Of Service: F ******************************************************************************** Street Name: San Pablo Ave Appian Wy Approach: North Bound South Bound East Bound West Bound Movement: L - T - R L - T - R L - T - R L - T - R ------------|---------------||---------------||---------------||---------------| Control: Permitted Permitted Permitted Permitted Rights: Include Include Include Include Min. Green: 0 0 0 0 0 0 0 0 0 0 0 0 Lanes: 1 0 2 0 1 1 0 1 1 0 1 0 0 1 0 1 0 0 1 0 ------------|---------------||---------------||---------------||---------------| Volume Module: Base Vol: 9 1622 351 293 583 63 144 178 20 811 228 982 Growth Adj: 1.00 1.00 1.00 1.00 1.00 1.00 1.00 1.00 1.00 1.00 1.00 1.00 Initial Bse: 9 1622 351 293 583 63 144 178 20 811 228 982 Added Vol: 0 0 0 0 0 0 0 0 0 0 0 0 PasserByVol: 0 0 0 0 0 0 0 0 0 0 0 0 Initial Fut: 9 1622 351 293 583 63 144 178 20 811 228 982 User Adj: 1.00 1.00 1.00 1.00 1.00 1.00 1.00 1.00 1.00 1.00 1.00 1.00 PHF Adj: 1.00 1.00 1.00 1.00 1.00 1.00 1.00 1.00 1.00 1.00 1.00 1.00 PHF Volume: 9 1622 351 293 583 63 144 178 20 811 228 982 Reduct Vol: 0 0 0 0 0 0 0 0 0 0 0 0 Reduced Vol: 9 1622 351 293 583 63 144 178 20 811 228 982 RTOR Reduct: 0 0 351 0 0 0 0 0 0 0 0 0 RTOR Vol: 9 1622 0 293 583 63 144 178 20 811 228 982 PCE Adj: 1.00 1.00 1.00 1.00 1.00 1.00 1.00 1.00 1.00 1.00 1.00 1.00 MLF Adj: 1.00 1.00 1.00 1.00 1.00 1.00 1.00 1.00 1.00 1.00 1.00 1.00 FinalVolume: 9 1622 0 293 583 63 144 178 20 811 228 982 ------------|---------------||---------------||---------------||---------------| Saturation Flow Module: Sat/Lane: 1800 1800 1800 1800 1800 1800 1800 1800 1800 1800 1800 1800 Adjustment: 1.00 1.00 1.00 1.00 1.00 1.00 1.00 1.00 1.00 1.00 1.00 1.00 Lanes: 1.00 2.00 1.00 1.00 1.80 0.20 1.00 0.90 0.10 1.00 0.19 0.81 Final Sat.: 1800 3600 1800 1800 3249 351 1800 1618 182 1800 339 1461 ------------|---------------||---------------||---------------||---------------| Capacity Analysis Module: Vol/Sat: 0.01 0.45 0.00 0.16 0.18 0.18 0.08 0.11 0.11 0.45 0.67 0.67 Crit Volume: 811 293 144 1210 Crit Moves: **** **** **** **** ******************************************************************************** Traffix 7.9.0415 (c) 2007 Dowling Assoc. Licensed to DKS ASSOC., OAKLAND,CA

Cumulative Project PM Tue Feb 9, 2010 12:27:21 Page 12-1 -------------------------------------------------------------------------------- -------------------------------------------------------------------------------- Level Of Service Computation Report CCTALOS Method (Future Volume Alternative) ******************************************************************************** Intersection #10 Sycamore Ave / Bayberry Ave ******************************************************************************** Cycle (sec): 120 Critical Vol./Cap.(X): 0.762 Loss Time (sec): 16 (Y+R=4.0 sec) Average Delay (sec/veh): xxxxxx Optimal Cycle: 119 Level Of Service: C ******************************************************************************** Street Name: Bayberry Ave Sycamore Ave Approach: North Bound South Bound East Bound West Bound Movement: L - T - R L - T - R L - T - R L - T - R ------------|---------------||---------------||---------------||---------------| Control: Split Phase Split Phase Protected Protected Rights: Include Include Include Ignore Min. Green: 5 5 5 5 5 5 5 5 5 5 5 5 Lanes: 1 0 0 1 0 1 1 0 0 2 1 0 2 1 0 1 0 2 0 1 ------------|---------------||---------------||---------------||---------------| Volume Module: Base Vol: 30 20 70 740 90 700 190 1195 50 100 1040 150 Growth Adj: 1.00 1.00 1.00 1.00 1.00 1.00 1.00 1.00 1.00 1.00 1.00 1.00 Initial Bse: 30 20 70 740 90 700 190 1195 50 100 1040 150 Added Vol: 0 0 0 0 0 0 0 0 0 0 0 0 PasserByVol: 0 0 0 0 0 0 0 0 0 0 0 0 Initial Fut: 30 20 70 740 90 700 190 1195 50 100 1040 150 User Adj: 1.00 1.00 1.00 1.00 1.00 1.00 1.00 1.00 1.00 1.00 1.00 1.00 PHF Adj: 1.00 1.00 1.00 1.00 1.00 1.00 1.00 1.00 1.00 1.00 1.00 1.00 PHF Volume: 30 20 70 740 90 700 190 1195 50 100 1040 150 Reduct Vol: 0 0 0 0 0 0 0 0 0 0 0 0 Reduced Vol: 30 20 70 740 90 700 190 1195 50 100 1040 150 RTOR Reduct: 0 0 0 0 0 190 0 0 0 0 0 0 RTOR Vol: 30 20 70 740 90 510 190 1195 50 100 1040 150 PCE Adj: 1.00 1.00 1.00 1.00 1.00 1.00 1.00 1.00 1.00 1.00 1.00 1.00 MLF Adj: 1.00 1.00 1.00 1.00 1.00 1.00 1.00 1.00 1.00 1.00 1.00 1.00 FinalVolume: 30 20 70 740 90 510 190 1195 50 100 1040 150 ------------|---------------||---------------||---------------||---------------| Saturation Flow Module: Sat/Lane: 1650 1650 1650 1650 1650 1650 1650 1650 1650 1650 1650 1650 Adjustment: 1.00 1.00 1.00 0.91 1.00 0.91 1.00 1.00 1.00 1.00 1.00 1.00 Lanes: 1.00 0.22 0.78 1.78 0.22 2.00 1.00 2.88 0.12 1.00 2.00 1.00 Final Sat.: 1650 367 1283 2674 358 3000 1650 4751 199 1650 3300 1650 ------------|---------------||---------------||---------------||---------------| Capacity Analysis Module: Vol/Sat: 0.02 0.05 0.05 0.28 0.25 0.17 0.12 0.25 0.25 0.06 0.32 0.09 Crit Volume: 90 415 190 520 Crit Moves: **** **** **** **** ******************************************************************************** Traffix 7.9.0415 (c) 2007 Dowling Assoc. Licensed to DKS ASSOC., OAKLAND,CA

Hercules Intermodal Transit Center (HITC)
Page 40
9.0 CONCLUSION Under both alternatives of the intermodal transit center, the Proposed Project would generate 40 A.M. peak hour trips and 71 P.M. peak hour trips. All vehicle trips were assumed to be inbound to the intermodal transit center during the A.M. peak hour and outbound during the P.M. peak hour.
Under the City of Hercules traffic impact analysis guidelines, the proposed project would not result in any significant transportation impacts at the study intersections. While there were no significant transportation impacts identified, three recommended improvement measures were identified as a result of this study.