Appendix J Data Validation - defence.gov.au
17
Appendix J - Data Validation RAAF Base Darwin PFAS Ecological Risk Assessment
Transcript of Appendix J Data Validation - defence.gov.au

Appendix J - Data Validation
RAAF Base Darwin PFAS Ecological Risk Assessment

Appendix J – Data Validation
RAAF Base Darwin PFAS Ecological Risk Assessment
1
1. BIOTA SAMPLING – Terrestrial Invertebrates(December 2017)
The Terrestrial Invertebrates sampled during this period included beetles, cicadas, cockroaches,moths, flies, dragonfly, ants, caterpillars, spiders, worms, praying mantis, crickets.
1.1. QA/QC General
1.1.1. Precision / Accuracy
ITEM QUESTION YES NO (Comment below)
1 Was a NATA registered laboratory used?
2 Did the laboratory perform the requested tests?
3 Were the laboratory methods adopted consistent with
NEPM principles?
4 Were the appropriate test procedures followed?
5 Were the reporting limits satisfactory?
6 Was the NATA Seal on the reports?
7 Were the reports signed by an authorised person?
Comments
At the start of the investigation Australian analytical labs were not NATA certified for PFAS analysis inbiota. Coffey initially used National Measurement Institute for biota analysis and then transitionedprimary analysis to Eurofins, maintaining NMI as secondary laboratory. In February 2018 Eurofinsbecame NATA certified for PFAS analysis in some biota media (including fish flesh and fruit). Coffeytransitioned to ALS as secondary laboratory in March 2018, who also became NATA certified forPFAS analysis in biota in 2018.
Precision / Accuracy of the Laboratory Report
Satisfactory
Partially Satisfactory
Unsatisfactory
1.1.2. Sample handling
ITEM QUESTION YES NO (Comment
below)
1 Were the sample holding times met?
2 Were the samples in proper custody between the field and reaching
the laboratory?
3 Were the samples properly and adequately preserved?

Appendix J – Data Validation
2
This includes keeping the samples chilled, where applicable.
4 Were the samples received by the laboratory in good condition?
Comments
Nil
Sample Handling was:
Satisfactory
Partially Satisfactory
Unsatisfactory
1.2. Field QA/QC
1.2.1. Type of QA/QC Samples Collected
Primary Samples 30 composite terrestrial invertebrate samples
Days of sampling 3 days
Field Duplicates (at least 1 in 10 samples)2 spilt samples created and submitted to NMI for
secondary laboratory analysis
Trip Blanks (at least 1 per sampling event) 0
Equipment Rinsate (at least
1/day/matrix/equipment)
No equipment rinsates as no re-usable equipment. Two
samples of the ethylene glycol solution used to preserve
the samples were collected for analysis. This included
one sample of unstrained coolant and one sample of
strained coolant. The ethylene glycol samples collected
and analysed were samples of preservative that were
used in a pit fall trap. This included one sample of
ethylene glycol directly from the pit (unstrained) and
another sample after it had been strained.
1.2.2. Samples Analysed
Composite terrestrial invertebrate samples were created by combining collected invertebrates of various species. Prior to submission to the laboratory the composite samples were rinsed with PFAS free deionised water. At the laboratory the composite samples were homogenised prior to analysis.
Two split samples were created at the primary laboratory and submitted to the secondary laboratory for analysis.
No re-usable equipment was used in the field, as such no equipment rinsate samples were collected. Two samples of the ethylene glycol preservative used for the terrestrial invertebrate sampling were submitted for analysis as described in the table above.
RAAF Base Darwin PFAS Ecological Risk Assessment

Appendix J – Data Validation
RAAF Base Darwin PFAS Ecological Risk Assessment
3
Field Duplicates
ITEM QUESTION YES NO (Comment
below)
1 Were an Adequate Number of field duplicates analysed for each
chemical?
2 Were RPDs within Control Limits?
< 30% for concentrations
Comments
The number of split samples (field duplicates) (2) was less than 1 in 10 primary samples. This wasdue to difficulties in obtaining representative split composite samples of the terrestrial invertebrates.Where RPDs were outside the acceptable range, sampling procedures, laboratory analytical methodsand laboratory results were investigated.
There were two duplicate pair analyses for PFOS and PFOA. Concentrations in the duplicate pairswere within the acceptance target of 30% RPD, with the exception of one pair for PFOS as shown inthe table below.
Table 1. RPDs outside Acceptable Range
Primary sample Duplicate
sample
Lab Analyte RPD
%
Higher
than
Primary
(Y/N)
1302_IV129_171209
(composite terrestrial
invertebrate)
Interlab –
Split
NMI Perfluoro-n-octane sulfonic acid (PFOS) 50 Y
The RPD discrepancy observed was attributed to the split sample not being a true duplicate. Althoughan elevated RPD was reported, the concentration in the split sample was in the same range as theprimary sample and adoption of either result would not affect the interpretation. Therefore, the RPDsare likely to reflect the variability in concentration within the media. This highlights the need forsufficient results to develop statistical exposure concentrations where exposure is interpreted likely tobe high. Despite the discrepancy observed, the results from the December 2017 terrestrialinvertebrate sampling was considered acceptable and able to be relied on for the report, wheninterpreted statistically.

Appendix J – Data Validation
RAAF Base Darwin PFAS Ecological Risk Assessment
4
Rinsate Blanks
ITEM QUESTION YES NO (Comment
below)
1 Were Equipment Rinsates collected and analysed every day?
2 Were the Equipment Rinsates free of contaminants?
(If no, comment whether the contaminants present are also detected
in the samples and whether they are common laboratory chemicals.)
Not Applicable
Comments
No rinsate samples were collected as no re-usable equipment was used. However, two samples ofthe ethylene glycol solution used to preserve the invertebrate samples were collected. This includedtwo samples of ethylene glycol that had come in contact with the invertebrates during the fieldsampling program. This was undertaken to evaluate whether the coolant was likely to be extractingPFAS compounds from the invertebrates. Coffey submitted a sample of ‘fresh’ ethylene glycolsolution, that had not come in contact with invertebrate samples, to the laboratory prior to conductingthe field sampling to determine if it contained any PFAS compounds or other components which mayinterfere with the PFAS analysis. The laboratory advised that no PFAS compounds were present inthe ethylene glycol solution.
Both the strained and unstrained ethylene glycol samples were reported to contain concentrations ofPFTrDA (0.05 to 0.12 µg/L) and 6:2 FTS (0.28 to 0.35 µg/L). It is noted that these PFAS compoundswere detected in some of the terrestrial invertebrate samples analysed. It is considered possible thatthe ethylene glycol solution removed traces of the PFTrDA and 6:2 FTS from the invertebrate samplesthat it came in contact with.
It is noted that PFOS and PFOA, the two PFAS compounds specifically evaluated in the ERA, werenot reported at detectable concentrations in the ethylene glycol used, as such the integrity of thePFOS and PFOA terrestrial invertebrate data does not appear to be compromised.
1.2.3. Trip Blanks
ITEM QUESTION YES NO (Comment
below)
1 Was a trip blank collected on each day of sample?
2 Were the Trip Blanks free of contaminants?
(If no, comment whether the contaminants present are also detected
in the samples and whether they are common laboratory chemicals.)
Comments
Specific trip blanks were not transported with the samples as due to the nature of the PFAScompounds (i.e. non-volatile) it was considered that cross contamination was unlikely to occur duringsample storage and transport.
In summary, the field QC results are considered generally acceptable for the purposes of thisinvestigation.
Field QA/QC was:Satisfactory
Partially Satisfactory

Appendix J – Data Validation
5
Unsatisfactory
1.3. Laboratory QA/QC
ITEM QUESTION YES NO (Comment
below)
1 Were the laboratory blanks/reagents blanks free of contamination?
2 Were the spike recoveries within control limits?
3 Were the RPDs of the laboratory duplicates within control limits?
4 Were the surrogate recoveries within control limits?
1.3.1. Laboratory Blanks.
All laboratory method blank results reported concentrations of contaminants below the laboratoryreporting limits.
1.3.2. Laboratory Duplicates
All internal laboratory duplicates analysed by Eurofins and NMI were within acceptable limits (<30%RPD).
1.3.3. Laboratory Control Samples
None of the laboratory control sample analyses were performed by Eurofins and none were outside ofthe target range (>50%).
1.3.4. Matrix Spikes
Matrix spike analyses were performed by Eurofins and NMI. A total of 12 Matrix spikes were outside of the adopted 70% – 130% acceptability criteria adopted, but all were within 50-150%. indicating the matrix spike results for PFAS compounds was acceptable.
1.3.5. Surrogate recoveries
The laboratories reported surrogate recoveries for all PFAS compounds. For the purpose of this report we evaluated the surrogate recoveries for PFOS and PFOA, the two risk-driving PFAS compounds evaluated in the ERA. Only two surrogates for PFOA and one surrogate for PFOS were outside of the acceptable range of 50 – 150 %. This represents a small proportion of the total number of surrogates determined. The discrepancies were related to surrogate analysis being below the recovery limit of 50%, this which would lead the quantification following adjustment to a low recovery, to be an overestimate.
A summary of the internal laboratory quality control results is provided in the table below.
Overall completeness of internal laboratory QC was less than 95%. Many surrogate recoveries were identified out of the 50-150% acceptance range, but typically for precursor compounds, which were not typically reported above reporting limits in samples, and were not used quantitatively.
Internal laboratory QC indicates acceptable laboratory data quality.
RAAF Base Darwin PFAS Ecological Risk Assessment

Appendix J – Data Validation
RAAF Base Darwin PFAS Ecological Risk Assessment
6
Laboratory internal QA/QC was:
Satisfactory
Partially Satisfactory
Unsatisfactory
1.4. Summary of Terrestrial Invertebrate Sampling(December 2017) Data Quality Review
In general, the data quality of the terrestrial invertebrate sampling undertaken in December 2018 wasconsidered to be acceptable. Concentrations of 6:2 FTS and PFTrDA is samples of the ethyleneglycol preservative that had come in contact in invertebrate samples, however PFOS and PFOA werenot detected, hence this results for the compounds relied on for the ERA are not considered to becompromised. A small proportion of surrogate recovery discrepancies were noted for PFOS andPFOA. The QC results were considered to indicate acceptable data quality and allow data to be reliedon to support the outcome of the assessment.

RAAF Base Darwin ERA
Terrestrial Invertebrates Quality Control RPD Summary Table
Department of Defence
Field Duplicates (SOIL) Lab Report Number 578763 578763Field ID 1302_IV118_171209 0990_IV118_171209 RPD 1302_IV129_171209 0990_IV129_171209 RPDSampled Date/Time 09-12-17 09-12-17 09-12-17 09-12-17
Chem_Group ChemName Units EQL
PFAS Perfluoro pentanoic acid (PFPA or PFPeA) µg/kg 0.5 <0.5 <0.5 0 <0.5 <0.5 0Perfluoro-n-hexanoic acid (PFHxA) µg/kg 0.5 <0.5 <0.5 0 <0.5 <0.5 0Perfluoro-n-heptanoic acid (PFHpA) µg/kg 0.5 <0.5 <0.5 0 <0.5 <0.5 0Perfluoro-n-octanoate acid (PFOA) µg/kg 0.5 (Primary): 0.3 (Interlab) <0.5 <0.3 0 <0.5 <0.3 0Perfluoro-n-nonanoic acid (PFNA) µg/kg 0.5 <0.5 <0.5 0 <0.5 <0.5 0Perfluoro-n-decanoic acid (PFDA) µg/kg 0.5 <0.5 <0.5 0 <0.5 <0.5 0Perfluoro-n-undecanoic acid (PFUnDA) µg/kg 0.5 <0.5 <0.5 0 <0.5 <0.5 0Perfluoro-n-dodecanoic acid (PFDoDA) µg/kg 0.5 <0.5 <0.5 0 <0.5 <0.5 0Perfluorobutane sulfonic acid (PFBS) µg/kg 0.5 <0.5 <0.5 0 <0.5 <0.5 0Perfluoro-n-octane sulfonic acid (PFOS) µg/kg 0.3 0.6 0.75 22 0.6 1.0 501H.1H.2H.2H-perfluorooctanesulfonic acid (6:2 FTS) µg/kg 0.5 1.2 <0.5 82 <0.5 <0.5 01H.1H.2H.2H-perfluorodecanesulfonic acid (8:2 FTS) µg/kg 0.5 <0.5 <0.5 0 <0.5 <0.5 0
*RPDs have only been considered where a concentration is greater than 0 times the EQL.**High RPDs are in bold (Acceptable RPDs for each EQL multiplier range are: 25 (0-10 x EQL); 25 (10-20 x EQL); 10 ( > 20 x EQL) )***Interlab Duplicates are matched on a per compound basis as methods vary between laboratories. Any methods in the row header relate to those used in the primary laboratory
Filter: Lab_Report_Number in('578675','578763')
754-MELEN199421 1 of 1

RAAF Base Darwin ERA
Terrestrial Invertebrates Field Blank Summary Table
Department of Defence
WATER Lab Report Number 578675 578675Field ID 1302_QC1IV_171210 1302_QC2IV_171210Sampled Date 10-12-17 10-12-17Sample Type Rinsate Rinsate
Chem Group ChemName Units LOR
PFAS Perfluorobutanoic acid (PFBA) µg/L 0.05 <2 <2Perfluoro pentanoic acid (PFPA or PFPeA) µg/L 0.01 <2 <2Perfluoro-n-hexanoic acid (PFHxA) µg/L 0.01 <2 <2Perfluoro-n-heptanoic acid (PFHpA) µg/L 0.01 <2 <2Perfluoro-n-octanoate acid (PFOA) µg/L 0.01 <2 <2Perfluoro-n-nonanoic acid (PFNA) µg/L 0.01 <2 <2Perfluoro-n-decanoic acid (PFDA) µg/L 0.01 <2 <2Perfluoro-n-undecanoic acid (PFUnDA) µg/L 0.01 <2 <2Perfluoro-n-dodecanoic acid (PFDoDA) µg/L 0.01 <2 <2Perfluoro-n-tridecanoic acid (PFTriDA) µg/L 0.01 0.05 0.12Perfluoro-n-tetradecanoic acid (PFTeDA) µg/L 0.01 <2 <2Perfluorobutane sulfonic acid (PFBS) µg/L 0.01 <2 <2Perfluoro-n-hexane sulfonic acid (PFHxS) µg/L 0.01 <2 <2Perfluoro-n-heptane sulfonic acid (PFHpS) µg/L 0.01 <2 <2Perfluoro-n-octane sulfonic acid (PFOS) µg/L 0.01 <2 <2Perfluoro-n-decane sulfonic acid (PFDS) µg/L 0.01 <2 <2PFHxS + PFOS µg/L 0.01 <0.01 <0.01Perfluoro-n-pentane sulfonic acid (PFPeS) µg/L 0.01 <2 <2Perfluorooctane sulfonamide (PFOSA) µg/L 0.05 <2 <2N-Methylperfluoro-1-octane sulfonamide (N-MeFOSA) µg/L 0.05 <2 <2N-Ethylperfluoro-1-octane sulfonamide (N-EtFOSA) µg/L 0.05 <2 <22-(N-Methylperfluoro-1-octane sulfonamide)-ethanol µg/L 0.05 <2 <22-(N-Ethylperfluoro-1-octane sulfonamide)-ethanol µg/L 0.05 <2 <2N-Methyl perfluorooctane sulfonamidoacetic acid µg/L 0.05 <2 <2N-Ethyl perfluorooctane sulfonamidoacetic acid µg/L 0.05 <2 <21H.1H.2H.2H-Perfluorohexanesulfonic Acid (4:2 FTS) µg/L 0.01 <2 <21H.1H.2H.2H-perfluorooctanesulfonic acid (6:2 FTS) µg/L 0.05 0.28 0.351H.1H.2H.2H-perfluorodecanesulfonic acid (8:2 FTS) µg/L 0.01 <2 <21H.1H.2H.2H-dodecanesulfonic acid (10:2 FTS) µg/L 0.01 <2 <2Sum of PFASs (n=28) µg/L 0.1 0.33 0.47Sum of WA DER PFAS (n=10) µg/L 0.05 0.28 0.35
754-MELEN199421 1 of 1

Appendix J – Data Validation
RAAF Base Darwin PFAS Ecological Risk Assessment
1. BIOTA SAMPLING – Terrestrial Vertebrates(March 2018)
The Terrestrial Vertebrates sampled during this period included:
• Small mammals
• Reptiles
• Amphibians
The samples submitted for analysis including whole organisms, composite samples and tissue / organsamples. Some serum samples were also collected.
1.1. QA/QC General
1.1.1. Precision / Accuracy
ITEM QUESTION YES NO (Comment below)
1 Was a NATA registered laboratory used?
2 Did the laboratory perform the requested tests?
3 Were the laboratory methods adopted consistent with
NEPM principles?
4 Were the appropriate test procedures followed?
5 Were the reporting limits satisfactory?
6 Was the NATA Seal on the reports?
7 Were the reports signed by an authorised person?
Comments
At the start of the investigation Australian analytical labs were not NATA certified for PFAS analysis inbiota. Coffey initially used National Measurement Institute for biota analysis and then transitionedprimary analysis to Eurofins, maintaining NMI as secondary laboratory. In February 2018 Eurofinsbecame NATA certified for PFAS analysis in some biota media (including fish flesh and fruit). Coffeytransitioned to ALS as secondary laboratory in March 2018, who also became NATA certified forPFAS analysis in biota in 2018.
Precision / Accuracy of the Laboratory Report
Satisfactory
Partially Satisfactory
Unsatisfactory
Appendix J – Data Validation
RAAF Base Darwin PFAS Ecological Risk Assessment
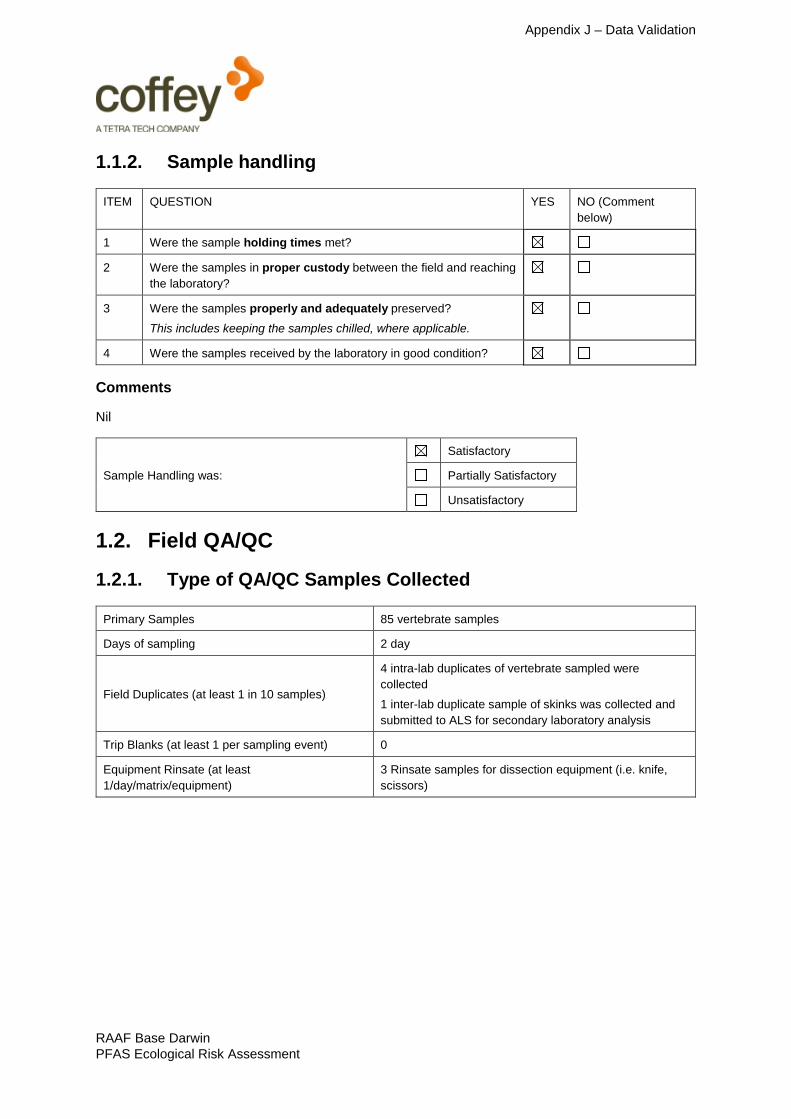
1.1.2. Sample handling
ITEM QUESTION YES NO (Comment
below)
1 Were the sample holding times met?
2 Were the samples in proper custody between the field and reaching
the laboratory?
3 Were the samples properly and adequately preserved?
This includes keeping the samples chilled, where applicable.
4 Were the samples received by the laboratory in good condition?
Comments
Nil
Sample Handling was:
Satisfactory
Partially Satisfactory
Unsatisfactory
1.2. Field QA/QC
1.2.1. Type of QA/QC Samples Collected
Primary Samples 85 vertebrate samples
Days of sampling 2 day
Field Duplicates (at least 1 in 10 samples)
4 intra-lab duplicates of vertebrate sampled were
collected
1 inter-lab duplicate sample of skinks was collected and
submitted to ALS for secondary laboratory analysis
Trip Blanks (at least 1 per sampling event) 0
Equipment Rinsate (at least
1/day/matrix/equipment)
3 Rinsate samples for dissection equipment (i.e. knife,
scissors)

Appendix J – Data Validation
1.2.2. Samples Analysed
Vertebrate samples analysed were either single whole body organisms, composite whole bodysamples, or specific tissue, organs or segments of organisms. Larger organisms were dissected priorto submission to the laboratory to create specific tissue, organ or segment samples for the organismscollected. Samples were homogenised by the laboratory prior to analysis.
Serum samples were collected from some terrestrial vertebrates captured, this were analysed by thelaboratory (Envirolab) as blood plasma samples.
Four quasi field intra-laboratory duplicate samples were collected and analysed including:
• 1302_TVC03_180322: Different sections of a Children’s Python collected from the same location
• 1302_TVC03_180322: Different sections of a Keelback snake collected from the same location
• 1302_TVC06_180322: Groups of similar skinks caught at the same location
• 1302_TV114_180322: Similar green-tree frogs caught at the same location.
One field inter-laboratory duplicate sample was collected and analysed including:
• 1302_TVC04_180322: Groups of similar skinks caught in the same area
No duplicate serum samples were able to be collected.
Rinsate samples were collected for analysis from dissection equipment used to dissect largervertebrate samples collected. No other re-usable sampling equipment was used that could haveresulted in cross-contamination of other biota samples.
Field Duplicates
ITEM QUESTION YES NO (Comment
below)
1 Were an Adequate Number of field duplicates analysed for each
chemical?
2 Were RPDs within Control Limits?
< 30% for concentrations
Comments
The number of intra and inter laboratory field duplicates was less than 1 in 10 primary samples. This was due to difficulties in obtaining representative samples of similar organisms from the same location to be consider quasi field duplicates. Where RPDs were outside the acceptable range, sampling procedures, laboratory analytical methods and laboratory results were investigated
There were four intra-laboratory duplicate pair samples and one inter-laboratory duplicate pair sample. In relation to PFOS and PFOA the RPDs of the duplicate pairs were within the acceptance target of 30%, with the exception of three pairs for PFOS.
The RPD discrepancies observed were attributed to the duplicate samples being quasi duplicates rather than true duplicate samples due to difficulties in obtaining similar vertebrate samples from the same location. The concentrations in the duplicate samples were generally in a similar range to the primary sample, therefore the RPDs are likely to reflect the variability in concentration within the media. This highlights the need for sufficient results to develop statistical exposure concentrations
RAAF Base DarwinPFAS Ecological Risk Assessment

Appendix J – Data Validation
where exposure is interpreted likely to be high. Despite the discrepancy observed, the results from theMarch 2018 terrestrial vertebrate sampling was considered acceptable and able to be relied on for thereport, when interpreted statistically.
Table 1. RPDs outside Acceptable Range
Primary sample Duplicate
sample
Lab Analyte RPD
%
Higher
than
Primary
(Y/N)
1302_TVC05_180322 1302_TVC06_180322 Eurofins Perfluoro-n-octane sulfonic
acid (PFOS)
43 Y
1302_TVC05_180322 1302_TVC04_180322 ALS Perfluoro-n-octane sulfonic
acid (PFOS)
59 N
1302_TV113_180322 1302_TV114_180322 Eurofins Perfluoro-n-octane sulfonic
acid (PFOS)
133 N
Rinsate Blanks
ITEM QUESTION YES NO (Comment
below)
1 Were Equipment Rinsates collected and analysed every day?
2 Were the Equipment Rinsates free of contaminants?
(If no, comment whether the contaminants present are also detected
in the samples and whether they are common laboratory chemicals.)
Not Applicable
Comments
Three rinsate samples were collected from the equipment used for dissection / sample preparationprior to submission to the laboratory. Concentrations of PFAS compounds in all three rinsate sampleswere below the detectable limits. As such is it considered unlikely that any cross-contaminationoccurred.
1.2.3. Trip Blanks
ITEM QUESTION YES NO (Comment
below)
1 Was a trip blank collected on each day of sample?
2 Were the Trip Blanks free of contaminants?
(If no, comment whether the contaminants present are also detected
in the samples and whether they are common laboratory chemicals.)
Comments
RAAF Base Darwin PFAS Ecological Risk Assessment

Appendix J – Data Validation
Specific trip blanks were not transported with the samples as due to the nature of the PFAScompounds (i.e. non-volatile) it was considered that cross contamination was unlikely to occur duringsample storage and transport.
In summary, the field QC results are considered generally acceptable for the purposes of thisinvestigation.
Field QA/QC was:
Satisfactory
Partially Satisfactory
Unsatisfactory
1.3. Laboratory QA/QC
ITEM QUESTION YES NO (Comment
below)
1 Were the laboratory blanks/reagents blanks free of contamination?
2 Were the spike recoveries within control limits?
3 Were the RPDs of the laboratory duplicates within control limits?
4 Were the surrogate recoveries within control limits?
1.3.1. Laboratory Blanks.
All laboratory method blank results reported concentrations of contaminants below the laboratoryreporting limits.
1.3.2. Laboratory Duplicates
A ll internal laboratory duplicates were analysed were within acceptable limits (<30% RPD).
1.3.3. Laboratory Control Samples
None of the laboratory control sample analyses performed were outside of the target range (>50%).
1.3.4. Matrix Spikes
Matrix spike analyses were performed by the laboratories, with 20 matrix spikes being outside of the adopted 70% – 130% acceptability criteria adopted, but all were within 50-150%. indicating the matrix spike results for PFAS compounds was acceptable.
1.3.5. Surrogate recoveries
The laboratories reported surrogate recoveries for all PFAS compounds. For the purpose of this report we evaluated the surrogate recoveries for PFOS and PFOA, the two risk-driving PFAS compounds evaluated in the ERA. A total of 31 surrogates for PFOA and one surrogate for PFOS were outside of the acceptable range of 50 – 150 %. This represents a small proportion of the total number of surrogates determined. The discrepancies were predominately related to surrogate analysis being
RAAF Base Darwin PFAS Ecological Risk Assessment

Appendix J – Data Validation
RAAF Base Darwin PFAS Ecological Risk Assessment
below the recovery limit of 50%, this which would lead the quantification following adjustment to a lowrecovery, to be an overestimate.
Overall completeness of internal laboratory QC was less than 95%. Many surrogate recoveries wereidentified out of the 50-150% acceptance range, but typically for precursor compounds, which werenot typically reported above reporting limits in samples, and were not used quantitatively.
Internal laboratory QC indicates acceptable laboratory data quality.
Laboratory internal QA/QC was:
Satisfactory
Partially Satisfactory
Unsatisfactory
1.4. Summary of Terrestrial Vertebrate Sampling (March2018) Data Quality Review
In general, the data quality of the terrestrial invertebrate sampling undertaken in December 2018 wasconsidered to be acceptable. Surrogate recovery discrepancies were identified for PFOS and PFOA,these represented a small proportion of the total number of surrogates determined, in particular forPFOS, the main risk driving PFAS evaluated in the ERA. The QC results were considered to indicateacceptable data quality and allow data to be relied on to support the outcome of the assessment.

RAAF Base Darwin
ERA
Terrestrial Vertebrates
Quality Control RPD Summary Table
Department of Defence
Lab Report Number 592567 592567 592567 592567 592567 592567 594583 594583 592567 ES1810306
Field ID 1302_TV026_180322 1302_TVC03_180322 RPD 1302_TVC05_180322 1302_TVC06_180322 RPD 1302_TV045_180322 1302_TVC08_180322 RPD 1302_TV113_180409 1302_TV114_180409 RPD 1302_TVC05_180322 1302_TVC04_180322 RPDSample Date 23-03-18 23-03-18 23-03-18 23-03-18 23-03-18 23-03-18 09-04-18 09-04-18 23-03-18 23-03-18
Chem Group ChemName Units LOR
PFAS Perfluorobutanoic acid (PFBA) µg/kg 0.5 (Primary): 5 (Interlab) <0.5 <0.5 0 <0.5 <0.5 0 <0.5 <0.5 0 <0.5 <0.5 0 <0.5 <5.0 0
Perfluoro pentanoic acid (PFPA or PFPeA) µg/kg 0.5 (Primary): 2 (Interlab) <0.5 <0.5 0 <0.5 <0.5 0 <0.5 <0.5 0 <0.5 <0.5 0 <0.5 <2.0 0
Perfluoro-n-hexanoic acid (PFHxA) µg/kg 0.5 (Primary): 1 (Interlab) <0.5 <0.5 0 <0.5 <0.5 0 <0.5 <0.5 0 <0.5 <0.5 0 <0.5 <1.0 0
Perfluoro-n-heptanoic acid (PFHpA) µg/kg 0.5 (Primary): 1 (Interlab) <0.5 <0.5 0 <0.5 <0.5 0 <0.5 <0.5 0 <0.5 <0.5 0 <0.5 <1.0 0
Perfluoro-n-octanoate acid (PFOA) µg/kg 0.5 (Primary): 1 (Interlab) <0.5 <0.5 0 <0.5 <0.5 0 <0.5 <0.5 0 <0.5 <0.5 0 <0.5 <1.0 0
Perfluoro-n-nonanoic acid (PFNA) µg/kg 0.5 (Primary): 1 (Interlab) <0.5 <0.5 0 <0.5 <0.5 0 3.6 3.5 3 <0.5 <0.5 0 <0.5 <1.0 0
Perfluoro-n-decanoic acid (PFDA) µg/kg 0.5 (Primary): 1 (Interlab) <0.5 <0.5 0 <0.5 <0.5 0 1.5 1.4 7 <0.5 <0.5 0 <0.5 <1.0 0
Perfluoro-n-undecanoic acid (PFUnDA) µg/kg 0.5 (Primary): 1 (Interlab) <0.5 <0.5 0 <0.5 <0.5 0 1.5 1.3 14 <0.5 <0.5 0 <0.5 <1.0 0
Perfluoro-n-dodecanoic acid (PFDoDA) µg/kg 0.5 (Primary): 2 (Interlab) <0.5 <0.5 0 <0.5 <0.5 0 5.7 5.2 9 <0.5 <0.5 0 <0.5 <2.0 0
Perfluoro-n-tridecanoic acid (PFTriDA) µg/kg 0.5 (Primary): 2 (Interlab) <0.5 <0.5 0 <0.5 <0.5 0 2.2 2.1 5 <0.5 <0.5 0 <0.5 <2.0 0
Perfluoro-n-tetradecanoic acid (PFTeDA) µg/kg 0.5 (Primary): 2 (Interlab) <0.5 <0.5 0 <0.5 <0.5 0 10.0 9.5 5 <0.5 <0.5 0 <0.5 <2.0 0
Perfluorobutane sulfonic acid (PFBS) µg/kg 0.5 (Primary): 1 (Interlab) <0.5 <0.5 0 <0.5 <0.5 0 <0.5 <0.5 0 0.6 <0.5 18 <0.5 <1.0 0
Perfluoro-n-hexane sulfonic acid (PFHxS) µg/kg 0.3 (Primary): 1 (Interlab) 3.4 2.6 27 0.8 1.6 67 54.0 42.0 25 14.0 2.9 131 0.8 1.0 22
Perfluoro-n-heptane sulfonic acid (PFHpS) µg/kg 0.5 (Primary): 1 (Interlab) <0.5 <0.5 0 <0.5 <0.5 0 13.0 12.0 8 4.2 1.0 123 <0.5 <1.0 0
Perfluoro-n-octane sulfonic acid (PFOS) µg/kg 0.3 (Primary): 1 (Interlab) 37.0 41.0 10 22.0 34.0 43 2800.0 2500.0 11 260.0 52.0 133 22.0 12.0 59
Perfluoro-n-decane sulfonic acid (PFDS) µg/kg 0.5 (Primary): 2 (Interlab) <0.5 <0.5 0 <0.5 <0.5 0 6.8 6.4 6 <0.5 <0.5 0 <0.5 <2.0 0
PFHxS + PFOS µg/kg 0.5 40.4 43.6 8 22.8 35.6 44 2854.0 2542.0 12 274.0 54.9 133 22.8
Perfluoro-n-pentane sulfonic acid (PFPeS) µg/kg 0.5 (Primary): 1 (Interlab) <0.5 <0.5 0 <0.5 <0.5 0 1.1 1.2 9 <0.5 <0.5 0 <0.5 <1.0 0
Perfluorooctane sulfonamide (PFOSA) µg/kg 0.5 (Primary): 5 (Interlab) <0.5 <0.5 0 <0.5 <0.5 0 <0.5 <0.5 0 <0.5 <0.5 0 <0.5 <5.0 0
N-Methylperfluoro-1-octane sulfonamide (N-MeFOSA) µg/kg 0.5 (Primary): 5 (Interlab) <0.5 <0.5 0 <0.5 <0.5 0 <0.5 <0.5 0 <0.5 <0.5 0 <0.5 <5.0 0
N-Ethylperfluoro-1-octane sulfonamide (N-EtFOSA) µg/kg 0.5 (Primary): 2 (Interlab) <0.5 <0.5 0 <0.5 <0.5 0 <0.5 <0.5 0 <0.5 <0.5 0 <0.5 <2.0 0
2-(N-Methylperfluoro-1-octane sulfonamide)-ethanol µg/kg 0.5 (Primary): 2 (Interlab) <0.5 <0.5 0 <0.5 <0.5 0 <0.5 <0.5 0 <0.5 <0.5 0 <0.5 <2.0 0
2-(N-Ethylperfluoro-1-octane sulfonamide)-ethanol µg/kg 0.5 (Primary): 2 (Interlab) <0.5 <0.5 0 <0.5 <0.5 0 <0.5 <0.5 0 <0.5 <0.5 0 <0.5 <2.0 0
N-Methyl perfluorooctane sulfonamidoacetic acid µg/kg 0.5 (Primary): 1 (Interlab) <0.5 <0.5 0 <0.5 <0.5 0 <0.5 <0.5 0 <0.5 <0.5 0 <0.5 <1.0 0
N-Ethyl perfluorooctane sulfonamidoacetic acid µg/kg 0.5 (Primary): 1 (Interlab) <0.5 <0.5 0 <0.5 <0.5 0 <0.5 <0.5 0 <0.5 <0.5 0 <0.5 <1.0 0
1H.1H.2H.2H-Perfluorohexanesulfonic Acid (4:2 FTS) µg/kg 0.5 (Primary): 2 (Interlab) <0.5 <0.5 0 <0.5 <0.5 0 <0.5 <0.5 0 <0.5 <0.5 0 <0.5 <2.0 0
1H.1H.2H.2H-perfluorooctanesulfonic acid (6:2 FTS) µg/kg 0.5 (Primary): 2 (Interlab) <0.5 <0.5 0 <0.5 <0.5 0 <0.5 <0.5 0 <0.5 <0.5 0 <0.5 <2.0 0
1H.1H.2H.2H-perfluorodecanesulfonic acid (8:2 FTS) µg/kg 0.5 (Primary): 2 (Interlab) <0.5 <0.5 0 <0.5 <0.5 0 <0.5 <0.5 0 <0.5 <0.5 0 <0.5 <2.0 0
1H.1H.2H.2H-dodecanesulfonic acid (10:2 FTS) µg/kg 0.5 (Primary): 2 (Interlab) <0.5 <0.5 0 <0.5 <0.5 0 <0.5 <0.5 0 <0.5 <0.5 0 <0.5 <2.0 0
Sum of PFASs (n=28) µg/kg 0.5 (Primary): 1 (Interlab) 40.4 43.6 8 22.8 35.6 44 2899.4 2584.6 11 278.8 55.9 133 22.8 13.0 55Sum of WA DER PFAS (n=10) µg/kg 0.5 40.4 43.6 8 22.8 35.6 44 2854.0 2542.0 12 274.6 54.9 133 22.8
*RPDs have only been considered where a concentration is greater than 0 times the EQL.
**High RPDs are in bold (Acceptable RPDs for each EQL multiplier range are: 25 (0-10 x EQL); 25 (10-20 x EQL); 10 ( > 20 x EQL) )
***Interlab Duplicates are matched on a per compound basis as methods vary between laboratories. Any methods in the row header relate to those used in the primary laboratory
754-MELEN199421 1 of 1

RAAF Base DarwinERA
Terrestrial Vertabrates Field Blank Summary Table
Department of Defence
Field_ID 1302_QCTV001_180323 1302_QCTV002_180323 1302_QCTV003_180323
LocCode 1302_QCTV001 1302_QCTV002 1302_QCTV003
Sample Type Rinsate Rinsate Rinsate
Sample Date 23-Mar-18 23-Mar-18 23-Mar-18
Chem Group ChemName Units LOR
Perfluorobutanoic acid (PFBA) µg/L 0.05 <0.05 <0.05 <0.05
Perfluoro pentanoic acid (PFPA or PFPeA) µg/L 0.01 <0.01 <0.01 <0.01
Perfluoro-n-hexanoic acid (PFHxA) µg/L 0.01 <0.01 <0.01 <0.01
Perfluoro-n-heptanoic acid (PFHpA) µg/L 0.01 <0.01 <0.01 <0.01
Perfluoro-n-octanoate acid (PFOA) µg/L 0.01 <0.01 <0.01 <0.01
Perfluoro-n-nonanoic acid (PFNA) µg/L 0.01 <0.01 <0.01 <0.01
Perfluoro-n-decanoic acid (PFDA) µg/L 0.01 <0.01 <0.01 <0.01
Perfluoro-n-undecanoic acid (PFUnDA) µg/L 0.01 <0.01 <0.01 <0.01
Perfluoro-n-dodecanoic acid (PFDoDA) µg/L 0.01 <0.01 <0.01 <0.01
Perfluoro-n-tridecanoic acid (PFTriDA) µg/L 0.01 <0.01 <0.01 <0.01
Perfluoro-n-tetradecanoic acid (PFTeDA) µg/L 0.01 <0.01 <0.01 <0.01
Perfluorobutane sulfonic acid (PFBS) µg/L 0.01 <0.01 <0.01 <0.01
Perfluoro-n-hexane sulfonic acid (PFHxS) µg/L 0.01 <0.01 <0.01 <0.01
Perfluoro-n-heptane sulfonic acid (PFHpS) µg/L 0.01 <0.01 <0.01 <0.01
Perfluoro-n-octane sulfonic acid (PFOS) µg/L 0.01 <0.01 <0.01 <0.01
Perfluoro-n-decane sulfonic acid (PFDS) µg/L 0.01 <0.01 <0.01 <0.01
PFHxS + PFOS µg/L 0.01 <0.01 <0.01 <0.01
Perfluoro-n-pentane sulfonic acid (PFPeS) µg/L 0.01 <0.01 <0.01 <0.01
Perfluorooctane sulfonamide (PFOSA) µg/L 0.05 <0.05 <0.05 <0.05
N-Methylperfluoro-1-octane sulfonamide (N-MeFOSA) µg/L 0.05 <0.05 <0.05 <0.05
N-Ethylperfluoro-1-octane sulfonamide (N-EtFOSA) µg/L 0.05 <0.05 <0.05 <0.05
2-(N-Methylperfluoro-1-octane sulfonamide)-ethanol µg/L 0.05 <0.05 <0.05 <0.05
2-(N-Ethylperfluoro-1-octane sulfonamide)-ethanol µg/L 0.05 <0.05 <0.05 <0.05
N-Methyl perfluorooctane sulfonamidoacetic acid µg/L 0.05 <0.05 <0.05 <0.05
N-Ethyl perfluorooctane sulfonamidoacetic acid µg/L 0.05 <0.05 <0.05 <0.05
1H.1H.2H.2H-Perfluorohexanesulfonic Acid (4:2 FTS) µg/L 0.01 <0.01 <0.01 <0.01
1H.1H.2H.2H-perfluorooctanesulfonic acid (6:2 FTS) µg/L 0.05 <0.05 <0.05 <0.05
1H.1H.2H.2H-perfluorodecanesulfonic acid (8:2 FTS) µg/L 0.01 <0.01 <0.01 <0.01
1H.1H.2H.2H-dodecanesulfonic acid (10:2 FTS) µg/L 0.01 <0.01 <0.01 <0.01
Sum of PFASs (n=28) µg/L 0.1 <0.1 <0.1 <0.1
Sum of WA DER PFAS (n=10) µg/L 0.05 <0.05 <0.05 <0.05
PFAS
754-MELEN199421 1 of 1