Appendix I: Assessment of Cleanfill and Managed Fill in ...
9
Auckland’s Waste Assessment 2017 Appendix I: Assessment of Cleanfill and Managed Fill in Auckland
Transcript of Appendix I: Assessment of Cleanfill and Managed Fill in ...
Auckland’s Waste Assessment 2017
Appendix I: Assessment of Cleanfill and Managed Fill in Auckland

Tonkin & Taylor Ltd | ASB Tower, Level 4, 2 Hunter Street, Wellington 6011, New Zealand | PO Box 2083, Wellington 6140 P +64-4-381 8560 F +64-9-307 0265 E [email protected]
Job No: 1001887 16 March 2017
Auckland Council Private Bag 92300 Victoria Street West Auckland 1142 Attention: Michael Backhurst Dear Michael
Clean and Managed Fill in Auckland
Auckland Council has engaged Tonkin + Taylor Limited (T+T) to assist in developing an estimate of waste disposal of clean fill and managed fill in the Auckland Region1. The scope of work involved:
Reviewing available data on identified sites (Auckland Council consents team spreadsheet, consent files for major sites)
Examine council data on earthworks activity to see if we can develop an estimate of inert material movements/disposal
Look at public domain information on clean fill movements (as per Urban Quarry example)
Drafting (this) brief summary note outlining the approach taken and outcome of data collection and analysis.
This letter report sets out the approach adopted and results of the analysis.
1 Available information
As noted above there are multiple sources of information on the disposal of clean and managed fill from the Auckland Region. For larger facilities, typically covered by detailed regulatory requirements, a reasonable amount of information is available. For smaller facilities, or where materials are moving across regional boundaries, the information is less complete. Even larger facilities may be relatively transient - completed within only a few years - reflecting the relatively low cost of establishing and operating clean fills in particular.
Developing estimates of the quantity of clean and managed fill generated in the Auckland Region involves compiling and comparing data from multiple sources and making some educated guesses to address gaps in the data. This means it is important to present the information carefully to avoid an estimate being treated with too much confidence.
1 As defined in the Auckland Unitary Plan (J1 Definitions)

2
Tonkin & Taylor Ltd Clean and Managed Fill in Auckland Auckland Council
16 March 2017 Job No: 1001887
Data sources consulted in developing the estimates presented in this summary note include:
Auckland Council consent information:
Summary data for consents relating to managed or clean fill operations.
Consent files for identified managed or clean fill operations currently operating including various reports, design information and management plans.
Consent files generally include an indication of total fill area, anticipated fill volume and time of operation.
Other data sources included:
Advertising for clean or managed fill services in the Auckland Region.
Data on managed or clean fills close to the Auckland Region e.g. in northern Waikato.
Various estimates of clean and managed fill generation in Auckland and across New Zealand.
2 Developing estimates of clean and managed fill
Estimates based on data in Auckland Council consent files were developed as follows:
1 Where information on file indicated the quantity of material accepted on an annual basis this was taken as the annual amount over the life of the operation.
2 Where information on file indicated a total capacity and a period of operation this was used to calculate an average annual quantity accepted for the life of the operation.
3 Where information on file provided a total capacity but no period of operation this was used with the consent period to calculate an average annual quantity accepted2.
Using this approach it is possible to allocate capacity for individual sites across the assumed operating period and then look at average capacity available within the Auckland Region over a 5 to 10 year period. This can be correlated with measures of economic or overall construction activity.
A complicating factor is that clean fill operators will fill their sites as quickly as possible to maximise revenue for their relatively fixed (daily) operating costs. This means that while a specific site may have consent for 10 years they may choose to complete the site within a much shorter period, say 5 years, if material is available. Without universal reporting on the quantity of material received or remaining capacity it is difficult to estimate annual quantities for individual sites with a high level of confidence.
Anecdotal information suggests some clean and managed fill is exported from the Auckland Region. In addition to sites very close to the Auckland Council boundary (for example the Bombay Quarry) some material is likely to be backloaded to quarry sites supplying aggregate to the Auckland market. With no reporting on the source of material disposed of at individual clean or managed fill sites in Auckland or other Regions it is difficult to develop detailed estimates. Comparing the data on sites within the Auckland Council area with other methods for estimating total quantities of material (see bullet list below) provides a basis for estimating the quantity of material exported.
Once the available data has been manipulated it is useful to step back from the detailed analysis and make sure that the estimates are sensible. Several waste data projects have attempted to estimate the quantity of clean and managed fill generated. These include:
Waste stocktakes completed in Auckland, Waikato and Bay of Plenty. The Auckland stocktake (2009) estimated clean and managed fill made up around 56 % of the total landfill waste
2 For more recent consents the consent period is generally correlated to the expected period of operation. In some case older consents appear to have been granted for the maximum (35 year) term.

3
Tonkin & Taylor Ltd Clean and Managed Fill in Auckland Auckland Council
16 March 2017 Job No: 1001887
stream. The most recent work in Waikato and Bay of Plenty (2013) estimated clean and managed fills accepted made up around 70 % of material landfilled.
The MfE commissioned a study of waste composition and construction waste data in 2006 (Waste Not Consulting, 2006). The study reviewed data on clean fill tonnages mainly in Christchurch, Auckland, Tauranga and Western Bay of Plenty Region and converted the results into a figure for tonnes per capita per annum. Based on the weighted average of the data, the quantity of waste disposed to clean fill was in the range of 0.65 to 0.91 tonnes/capita/annum.
T+T completed a study for MfE in 2015 that developed estimates for non municipal landfill numbers and associated quantities of material disposed on an annual basis. For Auckland the estimated quantity was 595,000 tonnes in 2015 with growth rate of around 2.5 % per annum.
3 Results
The initial, or best guess, estimates for materials disposed in the Auckland Region are presented in Table 1. The estimates for clean and managed fill disposal in Auckland are based on information from Auckland Council files developed as outlined above.
Table 1 Estimates of clean and managed fill from the Auckland Region (tonnes per year)
2013 2014 2015 2016 2017 2018
Fill - to sites in Auckland 1,685,402 1,685,402 1,932,446 1,900,302 1,545,402 1,545,402
While data is presented for several years, the estimates for 2015 and 2016 are considered the most representative. Smaller sites (that may be significant in aggregate) that closed prior to 2015 are less likely to have been picked up in the review of Council files. The lead time for development of new sites is relatively short so even sites coming on stream in 2017 may not have a formal consent record yet. Table 2 summarises the numbers generated if some of the alternative methods for estimating clean and managed fill volumes are used. Population and waste disposed of to municipal landfills are also presented because they are used to develop or ‘escalate’ some of the estimates. The third cluster of figures in Table 2 provides summary statistics for the various estimates presented.
Table 2 Alternative approaches to developing estimates of clean and managed fill for Auckland (T per year)
2013 2014 2015 2016 2017 2018
Population 1,493,200 1,534,540 1,575,880 1,617,220 1,658,560 1,699,900
MSW estimate (T) 1,522,564 1,564,717 1,606,870 1,649,023 1,691,176 1,733,328
GDP (Auckland) 1,400,551 1,441,069 1,481,303 1,521,247 1,560,894 1,600,236
Building Consents (Auckland)
11,206 13,375 15,524 17,785 23,120.5 26,677.5
Estimate 595,000 in 2015 566,330 580,488 595,000 609,875 625,122 640,750
Clean fill at 0.65 T/cap.yr 740,580 767,451 794,322 821,193 848,064 874,935
Clean fill at 0.91 T/cap,yr 1,128,812 1,166,431 1,204,051 1,241,670 1,279,290 1,316,909
1:2 ratio to MSW 1,677,808 1,731,458 1,785,107 1,838,756 1,892,405 1,946,054
‘Best’ estimate (Table 1) 1,685,402 1,685,402 1,932,446 1,900,302 1,545,402 1,545,402
MfE Facilities survey 2,109,705 2,168,113 2,226,521 2,284,929 2,343,338 2,401,746
4
Tonkin & Taylor Ltd Clean and Managed Fill in Auckland Auckland Council
16 March 2017 Job No: 1001887
2013 2014 2015 2016 2017 2018
Mean 1,318,106 1,349,890 1,422,908 1,449,454 1,422,270 1,454,299
Median 1,403,310 1,425,917 1,494,579 1,540,213 1,412,346 1,431,156
95th Percentile 2,001,731 2,058,949 2,116,167 2,173,386 2,230,604 2,287,823
5th Percentile 601,180 617,880 634,864 652,139 669,710 687,587
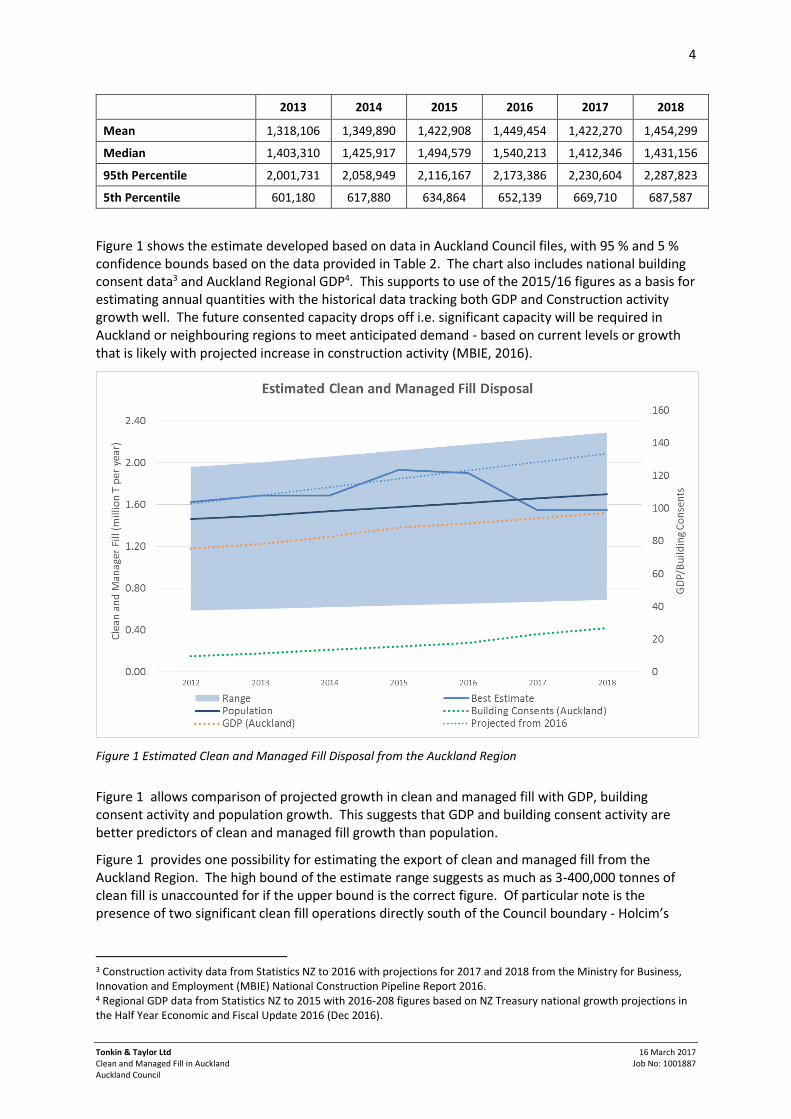
Figure 1 shows the estimate developed based on data in Auckland Council files, with 95 % and 5 % confidence bounds based on the data provided in Table 2. The chart also includes national building consent data3 and Auckland Regional GDP4. This supports to use of the 2015/16 figures as a basis for estimating annual quantities with the historical data tracking both GDP and Construction activity growth well. The future consented capacity drops off i.e. significant capacity will be required in Auckland or neighbouring regions to meet anticipated demand - based on current levels or growth that is likely with projected increase in construction activity (MBIE, 2016).
Figure 1 Estimated Clean and Managed Fill Disposal from the Auckland Region
Figure 1 allows comparison of projected growth in clean and managed fill with GDP, building consent activity and population growth. This suggests that GDP and building consent activity are better predictors of clean and managed fill growth than population.
Figure 1 provides one possibility for estimating the export of clean and managed fill from the Auckland Region. The high bound of the estimate range suggests as much as 3-400,000 tonnes of clean fill is unaccounted for if the upper bound is the correct figure. Of particular note is the presence of two significant clean fill operations directly south of the Council boundary - Holcim’s
3 Construction activity data from Statistics NZ to 2016 with projections for 2017 and 2018 from the Ministry for Business, Innovation and Employment (MBIE) National Construction Pipeline Report 2016. 4 Regional GDP data from Statistics NZ to 2015 with 2016-208 figures based on NZ Treasury national growth projections in the Half Year Economic and Fiscal Update 2016 (Dec 2016).

5
Tonkin & Taylor Ltd Clean and Managed Fill in Auckland Auckland Council
16 March 2017 Job No: 1001887
Bombay Quarry5 and the Ridge Road Quarry6. In contrast to large sites in Huntley and close to Hamilton, these sites are likely to be drawing the majority of their material from the Auckland Council area.
Another indicator of materials moving between regions is to consider predictors of clean and managed fill generation (Regional GDP, construction activity, population) and look for significant differences between regional figures that are publically available.
Tonnes per capita data, drawing on the data summarised here and previous work completed for MfE, suggests the Waikato Region is receiving more clean and managed fill than the population would suggest7. Using the higher national average per capital figure (1.22 T/capita) suggests around 145,000 tonnes of fill is imported into the Waikato each year, most likely from the Auckland Region.
Fill per unit of GDP also suggests Waikato is generating more clean and managed fill than would be expected8. Using an average of the Auckland and Waikato tonnes per GDP figures suggests around 135,000 tonnes of fill is imported into the Waikato each year.
Based on the indicators of export quantities noted above, a figure of 150,000 tonnes exported in 2016 is considered a reasonable estimate. This is consistent with two 50-60,000 tonnes/year clean fill operations directly south of the Council boundary and materials being transported further south.
4 Conclusion
Table 3 presents the final estimate of clean and managed fill from the Auckland Region based on the information presented in this summary note. As outlined in the discussion and illustrated in Figure 1 these figures are a best estimate only. The data is better presented as a range with the best estimate being in the range + 15% / - 65 % based on the data currently available.
Table 3 Final estimate of clean and managed fill from the Auckland Region
2013 2014 2015 2016 2017 2018
Auckland Council file data 1,685,402 - 1,932,446 1,900,302 - -
Projections (2017-2018) - 1,765,000 - - 1,980,000 2,060,000
Estimated export9 140,000 143,000 146,000 150,000 154,000 158,000
Total 1,825,402 1,908,000 2,078,446 2,050,302 2,134,000 2,218,000
Uncertainty (P95/P5) +15/-65 % +15/-65 % +15/-65 % +15/-65 % +15/-65 % +15/-65 %
The uncertainty in the data is significant and has some impact on estimating overall waste disposal and diversion in the Auckland Region. There are several ways that the estimates developed for this summary note could be refined or improved.
Making further use of existing information:
5 Total capacity 500,000 m3 (Waikato Regional Council files) 6 700,000 m3 total capacity (Waikato Regional Council files) 7 Auckland generates an estimated 1.17 T per capita of clean and managed fill, Waikato generates an estimated 1.56 T per capita. The average generation is in the range 0.9 to 1.22 T per capita. 8 Auckland generated around 0.022 T of fill per $ of Regional GDP, Waikato generates around 0.037 T of fill per $ of Regional GDP. 9 Estimated 2.5% growth, similar to clean and managed fill

6
Tonkin & Taylor Ltd Clean and Managed Fill in Auckland Auckland Council
16 March 2017 Job No: 1001887
The allocation of available capacity in the Auckland Region over time could be refined further drawing on more detailed review of information on Auckland Council files and/or discussion with individual consent holders.
There may be value in mapping existing consents for clean fill disposal alongside development activity (also covered by consents). With fill disposal likely to occur at a combination of lowest transport and disposal costs Council may be able to identify gaps in the consented capacity in parts of the Region.
The information on movement of materials out of Auckland Region could be refined by reviewing data available on Waikato Regional Council and/or Northland Regional Council files - to gain a more detail understanding of available capacity and likely annual utilisation of that capacity.
Further data collection or change to consent compliance and enforcement activity:
Reporting on consents is focussed on tracking the disposal of potential low level contaminated material and management of erosion and sediment. Some of the reporting provides a basis for estimating the quantity of material disposed of at a specific site but there is potential to refine the reporting to make it easier to extract and summarise this information for region wide reporting purposes.
5 Applicability
This report has been prepared for the exclusive use of our client Auckland Council, with respect to the particular brief given to us and it may not be relied upon in other contexts or for any other purpose, or by any person other than our client, without our prior written agreement.
Tonkin & Taylor Ltd
Environmental and Engineering Consultants
Report prepared by: Authorised for Tonkin & Taylor Ltd by:
.......................................................... ...........................….......…...............
Chris Purchas Simonne Eldridge Senior Consultant Project Director
CHP t:\wellington\tt projects\1001887\issueddocuments\briefing note - ac cleanfill v1.0.docx

Appendix A : Data Sources
Auckland Council Resource Consent Files
Statistics New Zealand
Regional GDP
Construction activity
Ministry for Business, Innovation and Employment (MBIE)
Waikato Regional Council Resource Consent data

Find out more: phone 09 301 0101 or visit aucklandcouncil.govt.nz
Auckland Council (2018). Auckland's Waste Assessment 2017 Appendix.
ISBN:
978-1-98-855540-9 (Print)
978-1-98-855541-6 (PDF)