
APPENDIX G - Lodi
80
APPENDIX G
Transcript of APPENDIX G - Lodi

APPENDIX G

CITY OF LODI
SURFACE POND PERCOLATION REPORT
WHITE SLOUGH WATER POLLUTION CONTROL FACILITY
LODI, CALIFORNIA
PROJECT NUMBER: 2016-00001
SEPTEMBER 23, 2016
This document and its use is intended for the recipient and specific identified users contained within. Any unauthorized use of this report
without prior consent is strictly prohibited.
City of Lodi Project No. 2016-00001 Page 1 of 33 November 23, 2016
CITY OF LODI SURFACE POND PERCOLATION REPORT
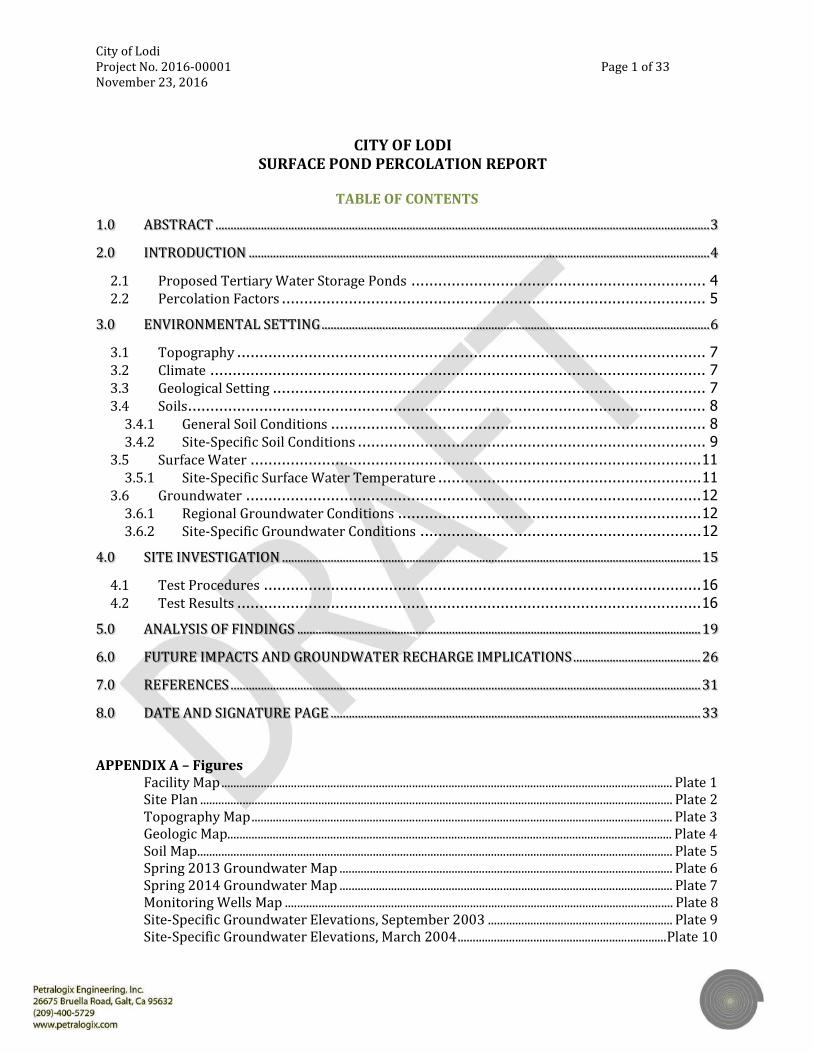
TABLE OF CONTENTS
1.0 ABSTRACT ................................................................................................................................................................... 3
2.0 INTRODUCTION ........................................................................................................................................................ 4
2.1 Proposed Tertiary Water Storage Ponds .................................................................. 4 2.2 Percolation Factors ............................................................................................... 5
3.0 ENVIRONMENTAL SETTING ................................................................................................................................ 6
3.1 Topography ......................................................................................................... 7 3.2 Climate ............................................................................................................... 7 3.3 Geological Setting ................................................................................................. 7 3.4 Soils .................................................................................................................... 8
3.4.1 General Soil Conditions .................................................................................... 8 3.4.2 Site-Specific Soil Conditions .............................................................................. 9
3.5 Surface Water ..................................................................................................... 11 3.5.1 Site-Specific Surface Water Temperature ........................................................... 11
3.6 Groundwater ...................................................................................................... 12 3.6.1 Regional Groundwater Conditions .................................................................... 12 3.6.2 Site-Specific Groundwater Conditions ............................................................... 12
4.0 SITE INVESTIGATION .......................................................................................................................................... 15
4.1 Test Procedures .................................................................................................. 16 4.2 Test Results ........................................................................................................ 16
5.0 ANALYSIS OF FINDINGS ..................................................................................................................................... 19
6.0 FUTURE IMPACTS AND GROUNDWATER RECHARGE IMPLICATIONS .......................................... 26
7.0 REFERENCES ........................................................................................................................................................... 31
8.0 DATE AND SIGNATURE PAGE .......................................................................................................................... 33
APPENDIX A – Figures
Facility Map ..................................................................................................................................................... Plate 1 Site Plan ............................................................................................................................................................ Plate 2 Topography Map ........................................................................................................................................... Plate 3 Geologic Map................................................................................................................................................... Plate 4 Soil Map............................................................................................................................................................. Plate 5 Spring 2013 Groundwater Map .............................................................................................................. Plate 6 Spring 2014 Groundwater Map .............................................................................................................. Plate 7 Monitoring Wells Map ................................................................................................................................ Plate 8 Site-Specific Groundwater Elevations, September 2003 ............................................................. Plate 9 Site-Specific Groundwater Elevations, March 2004 ..................................................................... Plate 10

City of Lodi Project No. 2016-00001 Page 2 of 33 November 23, 2016
Site-Specific Groundwater Elevations, July 2014 .......................................................................... Plate 11 Expansion Pond Groundwater Elevations, Spring 2016 ............................................................ Plate 12 APPENDIX B Soil Logs APPENDIX C
Percolation Field Test Data APPENDIX D
Percolation Calculations

City of Lodi Project No. 2016-00001 Page 3 of 33 November 23, 2016
1.0 ABSTRACT In 2015, the City of Lodi was awarded a grant from the Department of Water Resources (DWR) in the amount of $4,600,000. The grant was intended to facilitate projects which would improve drinking water and agricultural water intakes. The City of Lodi had a stated need which included an enlarged tertiary treated surface water holding ponds. The current onsite practice is to allow tertiary treated waters to exit the Water Pollution Control Facility (WPCF) and enter into Dredger Cut (a small slough which connects to the Delta). Benefits of keeping this water onsite rather than continuing to discharge it to Dredger Cut include decreased risk of impacts from tertiary treated waters released to this natural slough. Water quality improvements within the slough directly improve downstream drinking water intakes, while also increasing habitat conditions to various aquatic life-forms. A secondary benefit to this project would include in-lieu groundwater recharge. By using the stored water for irrigation, long-term pumping of the groundwater for agriculture could be significantly reduced. This report is part of the overall analysis for the proposed ponds. In part, it is intended to aid in the geological and geotechnical investigation of subsurface conditions and facilitate engineering design considerations. It is also intended to be used to address hydrological impacts of the proposed ponds for environmental process review via the California Environmental Quality Act (CEQA). Lastly, this report acts as a preliminary recharge assessment for percolation and infiltration the proposed ponds may have the potential to create over the long-term.

City of Lodi Project No. 2016-00001 Page 4 of 33 November 23, 2016
2.0 INTRODUCTION
2.1 Proposed Tertiary Water Storage Ponds The White Slough Water Pollution Control Facility (WPCF) is located in unincorporated northern San Joaquin County, approximately 6.5 miles west of the City of Lodi at 12751 North Thornton Road, Lodi, California (Facility Map, Plate 1, Appendix A). The City of Lodi (City) proposes the construction of four unlined storage ponds at the WPCF totaling 70-acres, along with the necessary conveyance infrastructure, to store disinfected, Title 22 tertiary treated effluent produced by the facility. The City currently discharges un-disinfected secondary treated municipal and untreated industrial effluent to four existing onsite storage ponds for application to the surrounding City-owned agricultural fields (790 acres) during irrigation months (mid-April through September). During non-irrigation months, the wastewater discharge at the facility exceeds the existing ponds storage capacity and overages of tertiary treated effluent are released to Dredger Cut, a dead end slough of the Sacramento-San Joaquin Delta (Delta), at a rate of approximately 3.5 million gallons per day (MGD). The proposed unlined storage ponds will store the higher quality tertiary treated, UV disinfected wastewater that was previously discharged to the Delta during the winter months. This tertiary treated wastewater will be used to irrigate the on-site agricultural fields during the irrigation season. The preferred location for these ponds is currently the site of three agricultural fields, totaling approximately 80 acres, approximately 1,100 feet west of the existing onsite storage ponds. The agricultural fields and associated irrigation infrastructure in and around the ponds would be reconfigured to accommodate the project, while also minimizing the overall reduction of the agricultural production area. The ponds will occupy approximately 70 acres, with the remaining acreage containing a tail water ditch to serve as a buffer between the proposed ponds and the existing Giant Garter Snake habitat easement directly west of the ponds. The locations and layout of the ponds, labeled as Pond A, B, C and D, are provided in the Site Plan (Plate 2, Appendix A). Based on the conceptual plan provided in the West Yost Associates (WYA) Draft Technical Memorandum, Preliminary Design of the White Slough Water Pollution Control Facility Storage Expansion and Surface, Agricultural, and Groundwater Supply Improvement Project, dated July 12, 2016 (WYA Technical Memorandum), the approximate storage capacity of all four ponds is 307 acre-feet. Pond A will have a storage capacity of approximately 64 acre-feet, Ponds B and D will have approximate storage capacities of 67 acre-feet each, and Pond C will have an approximate storage capacity of 109 acre-feet. At full capacity, the ponds will have an approximate water depth of 6 feet, including two feet of freeboard. Each of the four ponds will have perimeter levees, with a 12-foot top width and 2:1 slopes. A 12-inch thick layer of rock rip-rap will be placed on pond interior slopes and a 4-inch thick layer of fiber-reinforced shotcrete will be placed on pond exterior slopes. The ponds will be excavated at depths less than 2 feet to the extent practical, based on the shallow groundwater depth in the area. According to WYA’s Tertiary Storage Pond Earthwork Estimate (Figure 5, WYA’s Technical Memorandum), the average excavation depth for Pond A is 0.88 feet, Pond B is 1.59 feet, Pond C is 1.65 feet, and Pond D is 0.85 feet. The top 6 inches of existing soil onsite will be unsuitable for fill material, and will therefore be discarded offsite. The remaining useable excavated material will be used as in-place fill for the pond levees; balance of useable excavated material and in-place fill is anticipated. Excavated material will be compacted by 90 percent to create the levees.

City of Lodi Project No. 2016-00001 Page 5 of 33 November 23, 2016
2.2 Percolation Factors Percolation and infiltration are often used interchangeably to describe water entering the subsurface. However, infiltration refers to water moving through the ground surface while percolation more specifically refers to water that moves downwards through the soil column and ultimately reaches groundwater. This distinction is significant in locations where water that penetrates the soil surface is then removed by numerous processes, such as in arid regions, rather than moving downward through the soil profile. Percolation can therefore be much less than infiltration. The complex and dynamic process of water moving through the surface and subsurface are discussed below in relation to the proposed storage ponds. Initial Infiltration Water at the ground surface will generally either evaporate, run off, or percolate to groundwater. If water is located on a warm ground surface, a fraction of the water will rapidly evaporate until the surface cools (generally within minutes). If the water is stored in an arid environment, a fraction of the water will also evaporate into the environment over time. If water flows laterally over the ground surface and reaches the surrounding environment before infiltrating, it becomes runoff. If the ground surface is initially dry, water moving over or located on the surface can be retained within coarse-grained surface soils in a process of adhesion (Aubertin et al., 2003) or be pulled into soil pores by capillary forces. If the volume of water is sufficient, water will begin to fill larger soil pores and infiltrate the soil surface. If the rate at which water occurs (i.e., filling of a storage pond) exceeds the initial infiltration capacity of the soil, “surface ponding” may develop. The ponding increases pressure of the infiltrating water and thus the chance of the water finding its way to macropores (e.g. Nichol, 2002).
Water Retention and Initial Flow Once water infiltrates the ground surface migration to groundwater is complex. Capillary forces and adhesion effects create matric suction that retain water in the soil, with the strength increasing as a function of the initial dryness of the soil. The initial infiltration (i.e., filling of storage pond) is therefore tightly captured within the soil; percolation increases as the soil moisture increases. Matric suction is also dependent on soil characteristics such as grain size, where fine-grained soils retain more water than coarse-grained soils. In addition, the ability of soil to allow flow varies depending on water content. Soils with higher water content exhibit greater hydraulic conductivity and allow for greater flow. In a storage pond, as the water level increases, flow is increased vertically as well as induced horizontally into the pond sides. Lateral flow takes place in addition to the infiltration that occurs along the pond bottom (Massman, 2003). Percolation The behavior of water that passes deeper into the soil column is also complex. In general, percolation down to groundwater is positively related to applied water volume. Therefore, the greater the volume of water applied, the bigger percentage that reaches groundwater. Increases in shallow groundwater levels are associated with percolation; percolation can therefore be a significant source of groundwater recharge (Ochoa et al., 2007).

City of Lodi Project No. 2016-00001 Page 6 of 33 November 23, 2016
Long-Term Correction Factors Over time, siltation and biofouling occur on the sides of a storage pond. Correction factors should therefore be applied to account for loss of vertical and horizontal permeability/percolation resulting from the accumulation of fines and bio-buildup, as well as to account for uncertainties in testing and variations in depth to groundwater (Massman, 2003). Summary Water loss in the ponds due to evaporation is anticipated to be minor with occurrences limited to the summer months, and runoff is not anticipated to be a concern within the storage ponds. Based on these and the remaining above factors, it is anticipated that infiltration will be the chief form of water transport from the storage ponds. As part of this percolation to groundwater will occur, but will be lower than that of the general infiltration rate. Because groundwater is near the surface in the area of the ponds, the action of groundwater percolation will be similar to already existing flood irrigation practices which are currently used onsite. As the ponds are filled, the volume will be sufficient to fill larger soil pores and infiltrate the soil surface. The soil moisture will increase, resulting in an increase in percolation both vertically and horizontally, as well as an increase in hydraulic conductivity and greater flow in the subsurface. As percolation increases, the percent of water that reaches groundwater will likewise increase. Groundwater levels are thus anticipated to rise, particularly beneath the pond bottom. Based on existing shallow groundwater elevations in the pond region, groundwater will likely rise to the pond bottom. This has already been observed with the existing treatment ponds located just east of the proposed project. At the point when groundwater rises to the pond bottom, percolation will continue laterally through the pond sides. It is anticipated that the rate at which the ponds are filled will exceed the initial infiltration capacity of the immediate soil and result in standing water within the new pond(s). In addition, bio-buildup and siltation will decrease percolation rates over time. Thus, percolation will occur, but standing water in the ponds is expected. This report will estimate vertical and horizontal percolation in the storage ponds and resulting changes to local hydrologic conditions, considering the above percolation factors, site-specific testing, and geological environment. 3.0 ENVIRONMENTAL SETTING
The Project is located at the WPCF in unincorporated northern San Joaquin County, approximately 6.5 miles west of the City of Lodi. The WPCF is located in a primarily agricultural area, adjacent to Interstate 5 and 1.2 miles south of Highway 12. The WPCF address is 12751 North Thornton Road, Lodi, California, and consists of approximately 1,026.27 acres of land, including the WPCF and surrounding City-owned agricultural fields (APNs: 055-190-01, 055-150-29, 055-130-16). The City

City of Lodi Project No. 2016-00001 Page 7 of 33 November 23, 2016
of Lodi General Plan designates the WPCF as “Industrial” and the surrounding City-owned agricultural fields where the expansion ponds are proposed as “Public/Quasi-Public”.
3.1 Topography The general site elevation ranges from approximately 0 feet above mean sea level (MSL) near the northwestern boundary to approximately 10 feet above MSL near the southeastern boundary. The site has a general topography that slopes gently to the southwest. (Plate 3, Appendix A); 3.2 Climate The facility is located in a Mediterranean climate, classified as having relatively mild winters and dry, hot summers. According to data provided by a weather station near the facility (NCDC station #04-5032, Lodi), the average rainfall from 1893 to 2015 is 17.24 inches, and the average maximum and minimum temperature are 73.6° F and 46.0° F, respectively. Winds are predominantly from the west, with average wind speeds of 4 miles per hour (WYA, 2006). 3.3 Geological Setting The site is located within the Central Valley of California, a large, asymmetric northwest-trending structural trough, approximately 400 miles long, on average 50 miles wide, and 20,000 square miles in area. The site is located within the southern two-thirds of the Central Valley, an area known as the San Joaquin Valley. The San Joaquin Valley has been filled with as much as 6 miles of sediment, ranging in age from Jurassic to Holocene and include both marine and continental deposits. According to the “Geologic Map of the Sacramento Quadrangle” (California Geological Survey [CGS], 1987) (Plate 4, Appendix A), the WPCF is located on a westward dipping and thickening series of unconsolidated sediment and sedimentary rock underlying the eastern portion of the Central Valley. The sequence is underlain by Jurassic-Cretaceous metamorphic and igneous basement rock. The site area is underlain by sediments associated with the tectonic uplift of the Sierra Nevada and that were subsequently deposited into the subsiding structural trough of the Central Valley. The sedimentary sequence consists of marine and continental sedimentary rock deposits (Late Cretaceous to Eocene) overlain by unconsolidated fluvial and alluvial sediments (Late Tertiary to Quaternary) (Page, 1986). The Late Tertiary to Quaternary unconsolidated alluvial and fluvial sediments form the potable groundwater aquifer (West Yost, 2006). Surficial geology consists of the Upper Member of the Pleistocene Modesto Formation (CGS, 1987) (Plate 4, Appendix A). The Modesto Formation is further divided into the upper and lower members, with both present at the site (West Yost, 2006). Lithology includes arkosic alluvium forming the Mokelumne River fan and terraces, chiefly sand with some silt and gravel of Sierran origin, and arkosic sand forming low dunes on the Mokelumne River fan, likely poorly sorted eolian sand (Page, 1987). Underlying the Modesto Formation, Quaternary alluvium consists of approximately 100-200 feet of the Pleistocene age Turlock Lake Formation, consisting of a mixture of poorly consolidated and sorted sand, silt, clay and gravel of Sierran origin. At approximately 250 feet below ground surface (bgs) is a river channel deposit within the Turlock Lake Formation, which forms a significant aquifer in the area. Beneath the Turlock Lake Formation is approximately 400 feet of the Pliocene age Laguna Formation, consisting of poorly sorted clay, silt, sand and gravel, with more coarse-grained beds. The Pliocene Mehrten Formation, approximately 750 feet thick, underlies the Laguna Formation,

City of Lodi Project No. 2016-00001 Page 8 of 33 November 23, 2016
consisting of volcanic sand and conglomerate, andesitic gravel, sand and silt, and soft clay, silt, sand and minor gravel (Page, 1986). 3.4 Soils 3.4.1 General Soil Conditions Soil conditions vary across the site (Plate 5, Appendix A); the mapped soil types within the WPCF are the Guard and Devries soil series (USDA-NRCS 2003). The Guard soil series are in two soil phases (Guard clay loam and Guard clay loam, drained); both are taxonomically classified as fine-loamy, mixed superactive, calcareous, thermic Duric Endoaquolls, which consist of very deep poorly drained soils formed in alluvium from mixed sources (USDA Soil Series, Guard, 2016). One main discernible difference between the Guard clay loam and Guard clay loam, drained, is the Guard clay loam includes small areas that have a perched water table below a depth of 5 feet (San Joaquin County, 1992). The Devries soil series is taxonomically classified as a coarse-loamy, mixed, superactive thermic Typic Duraquolls, which consists of moderately deep hardpan, somewhat poorly drained soils formed in alluvium from mixed sources (USDA Soil Series, Devries, 2016). Both soils are on basin rims of the San Joaquin Delta and have slopes of 0 to 2 percent, with the approximate mean elevation ranging from -5 to 25 feet and 5 to 15 feet for Guard and Devries, respectively. As noted in a soil and groundwater investigation report for the facility by West Yost Associates (WYA, 2006), major physical property differences between the two soil series include 1) texture, 2) permeability, and 3) subsoil. The water permeability class for the Devries soil series is moderately rapid, with a sandy loam texture recorded at a depth of 0 to 28 inches, and a cemented, massive duripan recorded at 28 to 80 inches. The water permeability for the Guard soil series is slow, with a clay loam recorded from 0 to 72 inches bgs. Tables 1 and 2 provide some key characteristics of the Guard and Devries soil series.
Table 3-1. Soil Characterization of Guard Soil Series (Source USDA – NRCS Soil Survey)
Horizon Depth (in) Texture Structure Water
Permeability Class
Saturated Hydraulic Conductivity (in/hr)
Ap 0-5 clay loam sub-
angular blocky
Slow
0.2-0.6
A 5-15 clay loam sub-
angular blocky
0.2-0.6
Bkq1 15-27 clay loam massive 0.06-0.2
Bkq2 27-72 clay loam massive, weakly
cemented 0.06-0.2
Reference: USDA-NRCS (2003)
City of Lodi Project No. 2016-00001 Page 9 of 33 November 23, 2016
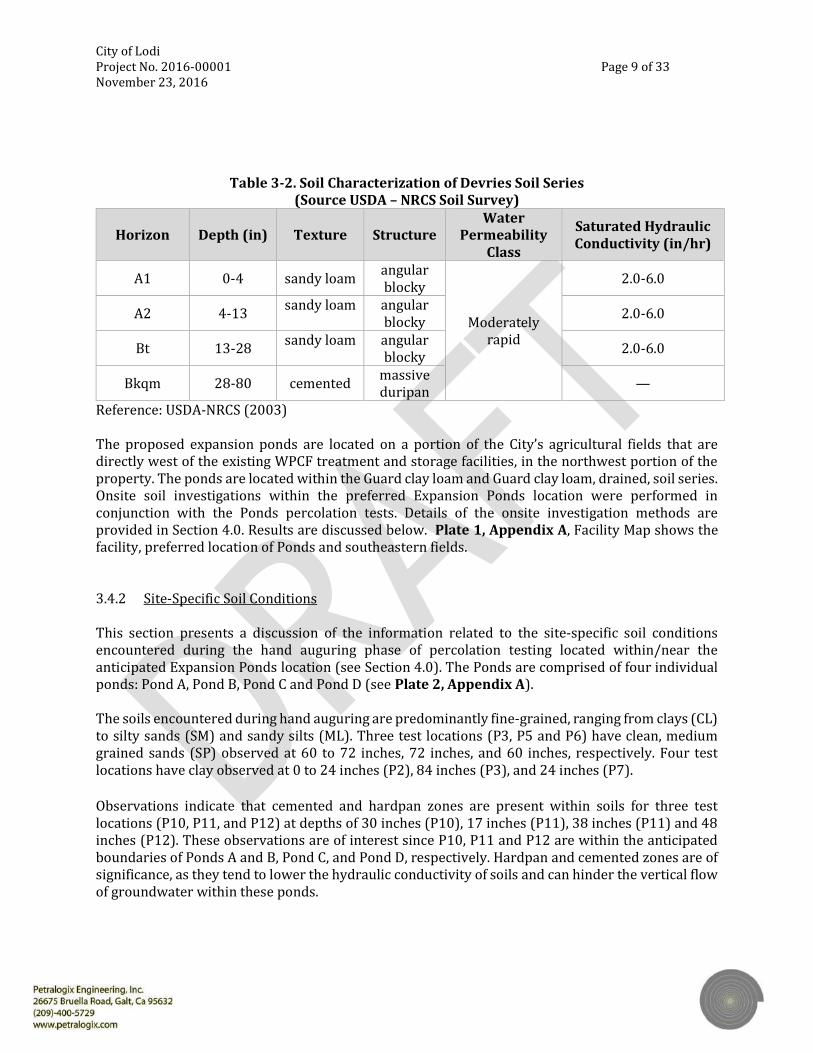
Table 3-2. Soil Characterization of Devries Soil Series (Source USDA – NRCS Soil Survey)
Horizon Depth (in) Texture Structure Water
Permeability Class
Saturated Hydraulic Conductivity (in/hr)
A1 0-4 sandy loam angular blocky
Moderately rapid
2.0-6.0
A2 4-13 sandy loam angular blocky 2.0-6.0
Bt 13-28 sandy loam angular blocky 2.0-6.0
Bkqm 28-80 cemented massive duripan —
Reference: USDA-NRCS (2003) The proposed expansion ponds are located on a portion of the City’s agricultural fields that are directly west of the existing WPCF treatment and storage facilities, in the northwest portion of the property. The ponds are located within the Guard clay loam and Guard clay loam, drained, soil series. Onsite soil investigations within the preferred Expansion Ponds location were performed in conjunction with the Ponds percolation tests. Details of the onsite investigation methods are provided in Section 4.0. Results are discussed below. Plate 1, Appendix A, Facility Map shows the facility, preferred location of Ponds and southeastern fields. 3.4.2 Site-Specific Soil Conditions This section presents a discussion of the information related to the site-specific soil conditions encountered during the hand auguring phase of percolation testing located within/near the anticipated Expansion Ponds location (see Section 4.0). The Ponds are comprised of four individual ponds: Pond A, Pond B, Pond C and Pond D (see Plate 2, Appendix A). The soils encountered during hand auguring are predominantly fine-grained, ranging from clays (CL) to silty sands (SM) and sandy silts (ML). Three test locations (P3, P5 and P6) have clean, medium grained sands (SP) observed at 60 to 72 inches, 72 inches, and 60 inches, respectively. Four test locations have clay observed at 0 to 24 inches (P2), 84 inches (P3), and 24 inches (P7). Observations indicate that cemented and hardpan zones are present within soils for three test locations (P10, P11, and P12) at depths of 30 inches (P10), 17 inches (P11), 38 inches (P11) and 48 inches (P12). These observations are of interest since P10, P11 and P12 are within the anticipated boundaries of Ponds A and B, Pond C, and Pond D, respectively. Hardpan and cemented zones are of significance, as they tend to lower the hydraulic conductivity of soils and can hinder the vertical flow of groundwater within these ponds.

City of Lodi Project No. 2016-00001 Page 10 of 33 November 23, 2016
The table below shows the soil type at the surface, 12, 24, 36, 48, 60, 72, 84, and greater than 84 inches depth for each test location, as observed over the entire site investigation area. The soil logs are included in Appendix B.
Table 3-3. Soil Classification, Site Investigation Area Unified Soil Classification System
Depth Borehole Locations (Inches)1 P1 P2 P3 P4 P5 P6 P7 P8 P9 P10 P11 P12
0 SM CL ML ML ML ML ML ML ML ML ML ML 12 SM CL ML ML ML ML ML ML ML ML ML ML 24 ML ML SM ML SM SM CL SM ML ML ML ML 36 ML ML SM ML SM SM ML ML — ML SM ML 48 ML ML SM ML SM SM ML ML — SM SM SM 60 SM ML SP/SM ML SM SP ML — — SM SM — 72 — — SP/SM — SP/SM — — — — — — — 84 — — CL — — — — — — — — —
>84 — — ML — — — — — — — — — 1Below ground surface (bgs) The site investigation encompasses the six current agricultural fields and one facility yard storage area west of the existing ponds, with the entire twelve location results reported in Table 3 above, however, the current design for the facilities expansion ponds are constrained to the most western portion of the site investigation (see Plate 1, Appendix A). Therefore, a table for each pond area with correlating soil results per pond is included below.
Table 3-4. Soil Classification Expansion Pond: Individual Ponds
Depth (Inches)1
POND A 64 Acre-Feet
POND B 67 Acre-Feet
POND C 109 Acre-Feet
POND D 67 Acre-Feet
P4 P10* P3 P10* P2 P8 P11** P7 P12*** P1 0 ML ML ML ML CL ML ML ML ML SM
12 ML ML ML ML CL ML ML ML ML SM 24 ML ML SM ML ML SM ML CL ML ML 36 ML ML SM ML ML ML SM ML ML ML 48 ML SM SM SM ML ML SM ML SM ML 60 ML SM SP/SM SM ML — SM ML — SM 72 — — SP/SM — — — — — — — 84 — — CL — — — — — — —
>84 — — ML — — — — — — — 1Below ground surface (bgs); * P10 has hardpan/gravel at 30 inches bgs: ** P11 has hardpan at 17 inches and cemented chunks at 38 inches; ***P12 has hardpan at 48 inches. The 4 separate Ponds occupy approximately 70 acres. Pond A will be approximately 64 acre feet, located in the northwest portion of the Expansion Pond. Based on the two soil logs (P4 and P10) for Pond A, the proposed pond is located on sandy silt from the surface to 62 inches bgs at the northwest perimeter and sandy silt/silty sand to 60 inches bgs along the central eastern perimeter. P10 has hardpan/rocks recorded at 30 inches bgs. Based on the two soil logs (P3 and P10), Pond B, approximately 67 acre feet, is located in the northeast portion of the main Expansion Pond. Pond B is located on sandy silt/silty sand to 60 inches bgs near the western perimeter. The northeastern
City of Lodi Project No. 2016-00001 Page 11 of 33 November 23, 2016
perimeter of Pond B is located on a sandy silt/silty sand to 48 inches bgs, underlain by a cleaner, medium grained sand to 79 inches bgs, underlain by clay to 89 inches bgs, and underlain by a silt with sand at 89 inches bgs. The anticipated eastern perimeter of Pond A (P10) and western perimeter of Pond B (P10) has hardpan/rocks recorded at 30 inches bgs. The third pond, Pond C, will be approximately 109 acre feet and located directly south of Ponds A and B. Pond C has a clay layer with very fine sand up to 20 inches bgs, underlain by silty sand/sandy silt to 60 inches bgs as recorded from P2, located in the anticipated northeast perimeter. The approximate center of Pond C has sandy silt/silty sand to 67 inches bgs, as recorded in P11; the soil of Pond C in the approximate center has a hardpan layer at 17 inches bgs, and cemented chunks were observed mixed with the silty sand at 38 inches bgs. The northwest perimeter of Pond C is represented by P8, where sandy silt was observed from the surface to the final depth of 57 inches bgs, with the exception of a silty sand observed at 24 to 31 inches bgs. The fourth pond, Pond D, will be approximately 67 acre feet, and will be the southernmost pond within the 70-acre Expansion Pond. The southwestern perimeter of Pond D is represented by P7, where there is a silt with sand from the surface to 14 inches bgs, underlain by a clay layer recorded from 14 to 24 inches bgs, underlain by a sandy silt to 63 inches bgs. The approximate center of Pond D is represented by P12 where the soil is logged as a sandy silt with clay to 20 inches bgs, underlain by a sandy silt to 44 inches bgs, which is underlain by a silty sand to 54 inches bgs; there is hardpan at P12 observed at 48 inches bgs. The test location P1 is outside the anticipated southeastern perimeter boundary for Pond D. With approximately 50 to 100 feet of separation to the southeast, it is considered in close enough proximity to be included in the soil descriptions for Pond D. P1 is a silty sand from the surface to 14 inches bgs, underlain by a sandy silt from 14 to 54 inches bgs, which is underlain by a silty sand from 54 to 60 inches bgs. The Expansion Pond area is comprised of alternating layers of sandy silt, silty sand, some thin layers of clay observed in Ponds B, D, and C, as well as a thin coarser grained, cleaner sand layer recorded at Pond B. The Expansion Pond area has hardpan observed within Ponds A and B at 30 inches, Pond C at 17 inches and Pond D at 48 inches, bgs. 3.5 Surface Water
Surface water features in the region of the WPCF include the Sacramento-San Joaquin River Delta (Delta), Lower Mokelumne River, Calaveras River, and a peripheral canal. The facility is located within the legal boundary of the Delta, as well as within the 1-in-100-year flood zone. The variation in surface water in the adjacent Delta is associated with the daily tidal fluctuations up to approximately 3 feet (WYA, 2006). 3.5.1 Site-Specific Surface Water Temperature The WPCF currently discharges effluent into the Delta during the non-irrigation season (October through mid-April). A study to characterize the seasonal temperature regimes of the facilities effluent discharge as compared to the receiving waters of the Delta was performed from July 28, 2009 to March 31, 2010 (Robertson-Bryan, 2010). The study was conducted in order to assess the effect of effluent discharge on receiving water temperatures, with particular concern focused on the suitability of water temperatures for the delta smelt, an endangered fish species native to the Delta, which migrates upstream to fresh water during spawning season. The study concluded, based on the data, that the Delta receiving waters are naturally “unsuitable thermally” for delta smelt spawning.
City of Lodi Project No. 2016-00001 Page 12 of 33 November 23, 2016
The temperature as recorded for the facilities effluent discharge is of interest in terms of infiltration assessment, due to the relationship of temperature and viscosity of water; the higher temperature water will have a lower viscosity and increase in infiltration rate (Horton, 2016). The average monthly temperature at the WPCF facility effluent discharge location, as measured at the filter pump station effluent box which is considered representative of the disinfected tertiary recycled water supplied to the Delta, was reported for the months January through April, 2010. The average temperatures recorded for this period (based on data acquired hourly) ranged from approximately 66° F in January 2009, to 71° F in April, 2009 and 67° F in January 2010 to 69° F in March, 2010. The temperature was only collected for the effluent during the periods when effluent was discharged to surface waters. 3.6 Groundwater This section provides information pertaining to the regional groundwater conditions relative to the facility, followed by site-specific groundwater conditions. The regional information is obtained from groundwater elevation contour maps prepared by San Joaquin County (2014), and site-specific groundwater condition information is obtained from multiple sources, including previous technical reports and onsite investigations. 3.6.1 Regional Groundwater Conditions According to the groundwater elevation maps obtained from the San Joaquin County Groundwater Report, the regional groundwater flow is to the east-southeast, with a cone of depression located approximately 6 miles to the east-southeast of the WPCF (San Joaquin County, 2014) (Plate 6 and Plate 7, Appendix A). A review of regional groundwater elevation data from the DWR Data Library and from the San Joaquin County Flood Control and Water Conservation District semi-annual reports by WYA indicates the regional flow direction in the WPCF vicinity has been east-southeasterly to southeasterly during spring and fall measurement periods, which span both wet and dry year conditions (including multi-year droughts) since at least 1971 (WYA, 2006). According to the Soil and Groundwater Investigation Existing Conditions Report (2006) by WYA, a review of the DWR Water Data Library hydrograph of wells close to the WPCF reveals groundwater fluctuates seasonally, with fluctuations greatest to the east of the WPCF. This is likely due to the fact that the western portion’s proximity to the Delta makes it less susceptible to pumping, allowing it to receive a greater uniform recharge throughout the year, unlike the eastern portion. Groundwater elevations in the immediate vicinity of the WPCF treatment facilities fluctuate little throughout the year, ranging from approximately -1 to -2 feet mean sea level (msl) in the spring and approximately -2 to -4 feet msl in the fall. In contrast, groundwater elevations seasonally fluctuate by about 10 feet at the eastern portion of the site (WYA, 2006). These site-specific fluctuations are considered at greater length below. 3.6.2 Site-Specific Groundwater Conditions This section considers site-specific groundwater conditions at the WPCF. Much of the information detailed below is based on information and analyses provided by previous reports prepared on the City of Lodi’s behalf (WYA, 2006, 2015 and 2016) in conjunction with fieldwork performed by Petralogix pertaining to the Expansion Pond site (see Section 4.0).

City of Lodi Project No. 2016-00001 Page 13 of 33 November 23, 2016
Groundwater Gradient The City has several groundwater monitoring wells historically used for monitoring gradient, elevations, and water quality of groundwater underlying the WPCF, the agricultural fields, and nearby parcels. The City’s monitoring well network currently includes 21 monitoring wells (WSM-1, WSM-2, WSM-4 through WSM-19 and RMW-1 through RMW-3) (Plate 8, Appendix A), located both within and beyond the facility boundary. Based on the monitoring depths to groundwater in the City’s monitoring well network, groundwater generally flows easterly across the WPCF site, with an area of apparent recharge along the western boundary. However, site-specific groundwater elevation contour mapping (Plates 9 and 10, Appendix A) by WYA of the site for September, 2003 and March, 2004 shows there are localized deflections in groundwater flow away from the regional drawdown cone, with deflection to the north, likely due to groundwater pumping; the northerly deflection is most apparent in the fall (WYA, 2006). Southwesterly groundwater flow underlies the southwestern corner of the agricultural reuse area as well, however, “volumetrically, and in terms of the potential for transport, the flow is probably minor” (WYA, 2006). Groundwater Elevation The median groundwater elevations range from just below 0 feet above msl near the western boundary of the site, to greater than 20 feet above msl near the eastern boundary of the City’s well network. The depth to groundwater, therefore, ranges from just a few feet below the ground surface in the City’s westernmost monitoring wells to greater than 30 feet below ground surface in the eastern-most monitoring wells (WYA, 2015). Most of the decrease in groundwater occurs east of Thornton Road, and is at least partially attributable to the agricultural areas east being irrigated by groundwater pumping. Groundwater elevations are the highest along a northwesterly-southeasterly trending axis located just west of the primary WPCF storage facility, which is considered an axis of recharge. Potential recharge sources include the WPCF land application areas, Delta waterways and irrigated land to the west of the WPCF, surface water irrigated lands to the north and east of the WPCF, and the WPCF storage ponds (WYA, 2006). The WPCF groundwater levels fluctuate yearly in response to varying levels of precipitation during non-irrigation season, as well as due to pumping during the irrigation season. The groundwater elevations at the WPCF for September 2003 and March 2004 are included as Plates 9 and 10, Appendix A. Groundwater elevations in the western portion of the site only fluctuate a few feet seasonally (indicating the western portion as an area of recharge) compared to the eastern portion of the site, which fluctuates up to approximately 10 feet annually. The lowest groundwater elevations generally occur near the end of the irrigation season; the highest elevations generally occur near the end of the non-irrigation season (WYA, 2015). A groundwater elevation contour map for the site, as measured from the WPCF’s monitoring well network on July 23, 2014 for the City of Lodi White Slough WPCF Best Practicable Treatment or Control (BPTC) Evaluation Report (WAY, 2015) is included as Plate 11, Appendix A. A summary of the depth to groundwater in the groundwater monitoring well WSM-02, a monitoring well located approximately 1000 feet east of the southeast corner of proposed Pond D, as measured between September 2001 and November 2005, is provided in the WYA Soil and Groundwater
City of Lodi Project No. 2016-00001 Page 14 of 33 November 23, 2016
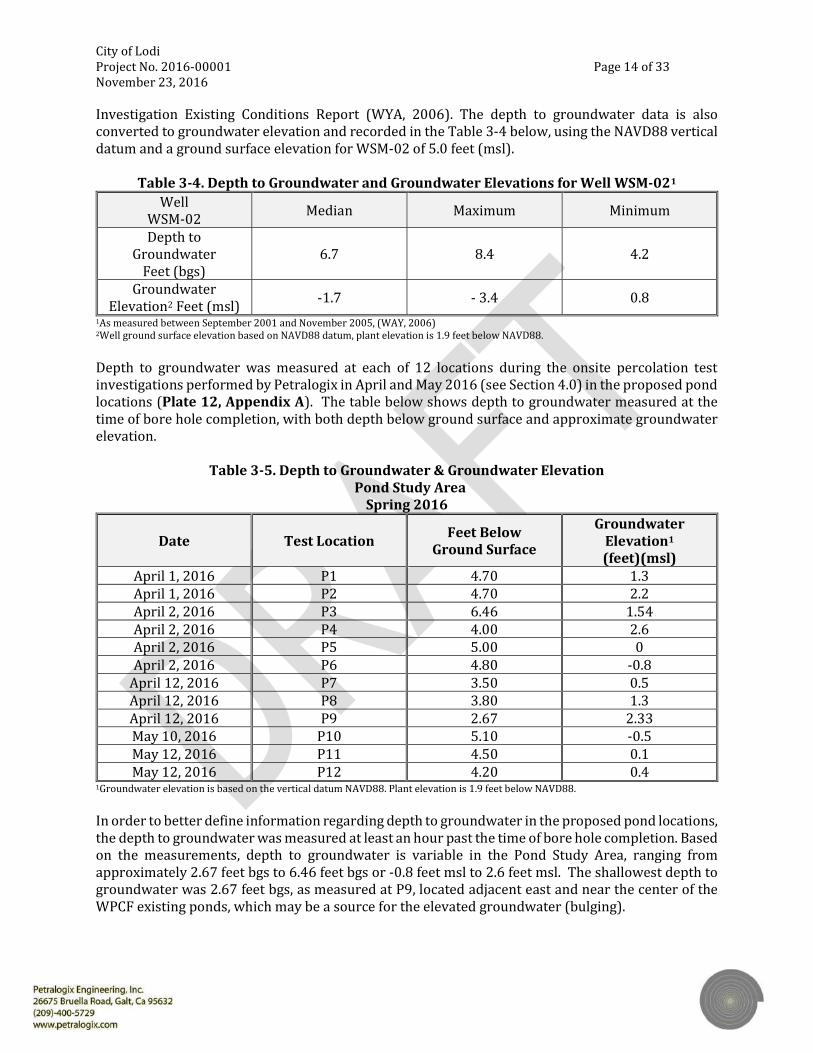
Investigation Existing Conditions Report (WYA, 2006). The depth to groundwater data is also converted to groundwater elevation and recorded in the Table 3-4 below, using the NAVD88 vertical datum and a ground surface elevation for WSM-02 of 5.0 feet (msl).
Table 3-4. Depth to Groundwater and Groundwater Elevations for Well WSM-021
Well WSM-02 Median Maximum Minimum Depth to
Groundwater Feet (bgs)
6.7 8.4 4.2
Groundwater Elevation2 Feet (msl) -1.7 - 3.4 0.8
1As measured between September 2001 and November 2005, (WAY, 2006) 2Well ground surface elevation based on NAVD88 datum, plant elevation is 1.9 feet below NAVD88. Depth to groundwater was measured at each of 12 locations during the onsite percolation test investigations performed by Petralogix in April and May 2016 (see Section 4.0) in the proposed pond locations (Plate 12, Appendix A). The table below shows depth to groundwater measured at the time of bore hole completion, with both depth below ground surface and approximate groundwater elevation.
Table 3-5. Depth to Groundwater & Groundwater Elevation Pond Study Area
Spring 2016
Date Test Location Feet Below Ground Surface
Groundwater Elevation1 (feet)(msl)
April 1, 2016 P1 4.70 1.3 April 1, 2016 P2 4.70 2.2 April 2, 2016 P3 6.46 1.54 April 2, 2016 P4 4.00 2.6 April 2, 2016 P5 5.00 0 April 2, 2016 P6 4.80 -0.8
April 12, 2016 P7 3.50 0.5 April 12, 2016 P8 3.80 1.3 April 12, 2016 P9 2.67 2.33 May 10, 2016 P10 5.10 -0.5 May 12, 2016 P11 4.50 0.1 May 12, 2016 P12 4.20 0.4
1Groundwater elevation is based on the vertical datum NAVD88. Plant elevation is 1.9 feet below NAVD88. In order to better define information regarding depth to groundwater in the proposed pond locations, the depth to groundwater was measured at least an hour past the time of bore hole completion. Based on the measurements, depth to groundwater is variable in the Pond Study Area, ranging from approximately 2.67 feet bgs to 6.46 feet bgs or -0.8 feet msl to 2.6 feet msl. The shallowest depth to groundwater was 2.67 feet bgs, as measured at P9, located adjacent east and near the center of the WPCF existing ponds, which may be a source for the elevated groundwater (bulging).
City of Lodi Project No. 2016-00001 Page 15 of 33 November 23, 2016
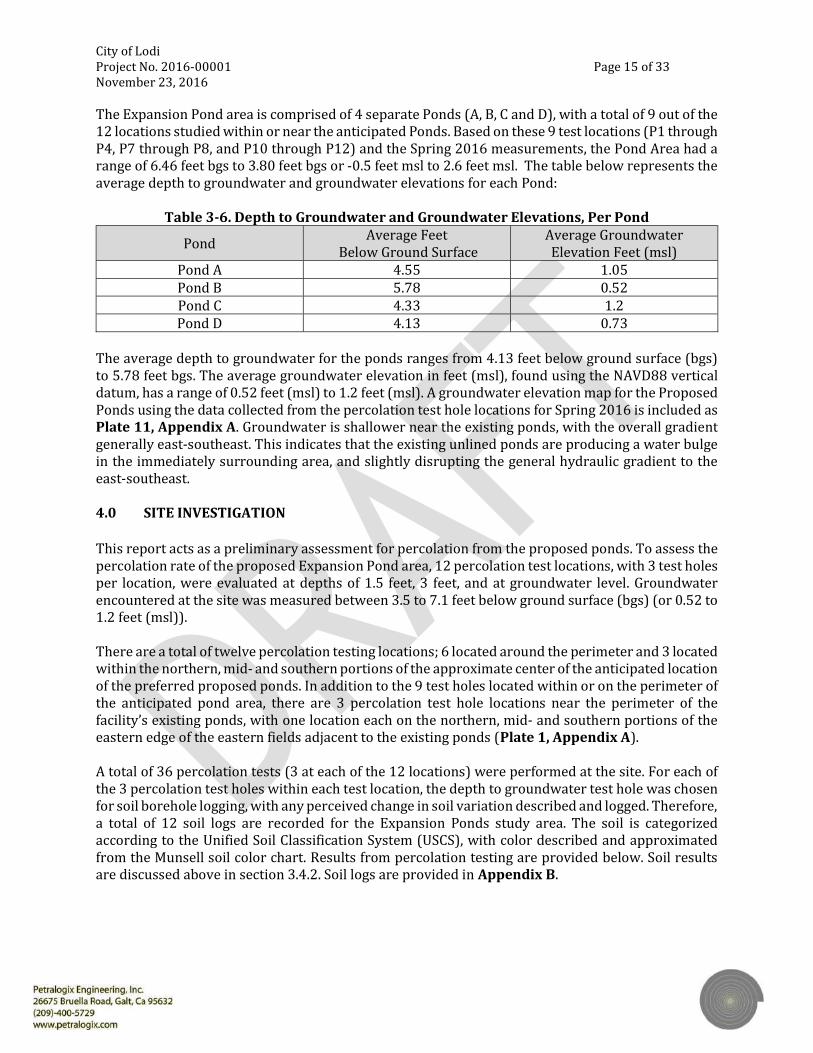
The Expansion Pond area is comprised of 4 separate Ponds (A, B, C and D), with a total of 9 out of the 12 locations studied within or near the anticipated Ponds. Based on these 9 test locations (P1 through P4, P7 through P8, and P10 through P12) and the Spring 2016 measurements, the Pond Area had a range of 6.46 feet bgs to 3.80 feet bgs or -0.5 feet msl to 2.6 feet msl. The table below represents the average depth to groundwater and groundwater elevations for each Pond:
Table 3-6. Depth to Groundwater and Groundwater Elevations, Per Pond Pond Average Feet
Below Ground Surface Average Groundwater Elevation Feet (msl)
Pond A 4.55 1.05 Pond B 5.78 0.52 Pond C 4.33 1.2 Pond D 4.13 0.73
The average depth to groundwater for the ponds ranges from 4.13 feet below ground surface (bgs) to 5.78 feet bgs. The average groundwater elevation in feet (msl), found using the NAVD88 vertical datum, has a range of 0.52 feet (msl) to 1.2 feet (msl). A groundwater elevation map for the Proposed Ponds using the data collected from the percolation test hole locations for Spring 2016 is included as Plate 11, Appendix A. Groundwater is shallower near the existing ponds, with the overall gradient generally east-southeast. This indicates that the existing unlined ponds are producing a water bulge in the immediately surrounding area, and slightly disrupting the general hydraulic gradient to the east-southeast. 4.0 SITE INVESTIGATION This report acts as a preliminary assessment for percolation from the proposed ponds. To assess the percolation rate of the proposed Expansion Pond area, 12 percolation test locations, with 3 test holes per location, were evaluated at depths of 1.5 feet, 3 feet, and at groundwater level. Groundwater encountered at the site was measured between 3.5 to 7.1 feet below ground surface (bgs) (or 0.52 to 1.2 feet (msl)). There are a total of twelve percolation testing locations; 6 located around the perimeter and 3 located within the northern, mid- and southern portions of the approximate center of the anticipated location of the preferred proposed ponds. In addition to the 9 test holes located within or on the perimeter of the anticipated pond area, there are 3 percolation test hole locations near the perimeter of the facility’s existing ponds, with one location each on the northern, mid- and southern portions of the eastern edge of the eastern fields adjacent to the existing ponds (Plate 1, Appendix A). A total of 36 percolation tests (3 at each of the 12 locations) were performed at the site. For each of the 3 percolation test holes within each test location, the depth to groundwater test hole was chosen for soil borehole logging, with any perceived change in soil variation described and logged. Therefore, a total of 12 soil logs are recorded for the Expansion Ponds study area. The soil is categorized according to the Unified Soil Classification System (USCS), with color described and approximated from the Munsell soil color chart. Results from percolation testing are provided below. Soil results are discussed above in section 3.4.2. Soil logs are provided in Appendix B.

City of Lodi Project No. 2016-00001 Page 16 of 33 November 23, 2016
4.1 Test Procedures
x For each test hole, a 4-inch diameter hand auger was used to drive a hole to the desired depth.
The side walls of each test hole were scraped with a breaker bar to reduce any smearing of sidewall created by the hand auger. Any loose material was removed from the test hole. A perforated 2’’ PVC pipe was placed within each of the holes and approximately ½ of an inch of pea gravel was placed at the bottom and around the annular space of the pipe. A total of twelve percolation test areas with three tests at different depths in each location (thirty-six test holes total) were set for subsequent testing. Pre-saturation was performed by adding 6 inches of water (head) to the test hole the day prior to testing to ensure that any clay fines were fully saturated and representative of wet condition testing.
x Approximately twenty-four hours after initial installation and pre-saturation, a representative from Petralogix performed the onsite percolation testing (April 2, April 5, May 13 and May 15, 2016). Tests were run using a water meter/sounder with 1/10 of an inch measurement increments. The tests continued for the time required, which is defined as the time needed for each test hole to reach a stable water level drop rate. The interval reading varied per hole, with most holes requiring a 10 or 20-minute interval.
4.2 Test Results The test results for each test hole (percolation test locations P1 through P12) are considered, as well as the percolation test location results constrained to each of the four ponds (Ponds A, B, C and D). Final percolation rates are considered in the analysis, as these are the stabilized and thus most representative rates. The field rates are converted to gallons per square foot per day (GPD/FT2) for each location and depth. The conversions to gallons per square foot per day consider the diameter, surface area, and head maintained in each test hole. Percolation field test data is available in Appendix C; data is summarized in the tables below.
Table 4-1. Percolation Rate Test Results: All Locations and Depths
Expansion Pond Study Area Depth 1.5 Feet Depth 3.0 Feet Variable Depth1
Test Date Location
Final Rate:
GPD/FT2
Location
Final Rate:
GPD/FT2
Location & Depth
(feet)
Final Rate:
GPD/FT2
4/2/2016 P1 1.1 P1 1.4 P1 @ 6.0’ 0.7 4/2/2016 P2 4.5 P2 4.1 P2 @ 5.0’ 4.1 4/5/2016 P3 2.9 P3 2.9 P3 @ 7.41’ 33.2 4/5/2016 P4 9.9 P4 5.0 P4 @ 5.0’ 4.1 4/5/2016 P5 5.0 P5 5.8 P5 @ 6.0’ 0.7 4/5/2016 P6 12.4 P6 3.3 P6 @ 5.3’ 25.7 4/5/2016 P7 3.3 P7 0.8 P7 @ 5.25’ 10.4 4/5/2016 P8 16.6 P8 4.1 P8 @ 4.75 0.7 4/5/2016 P9 1.2 P9 1.7 P9 @Q 3.28’ 20.7
5/11/2016 P10 22.3 P10 1.7 P10 @ 5.5’ 16.6 5/11/2016 P11 25.7 P11 3.3 P11 @ 5.8’ 27.3 5/11/2016 P12 33.2 P12 5.0 P12 @ 4.5’ 0.7
1Depth to groundwater

City of Lodi Project No. 2016-00001 Page 17 of 33 November 23, 2016
The percolation rates varied throughout the Site Investigation Area, with the range of stable percolation rates varying from 1.1 to 33.2 GPD/FT2 at a depth of 1.5 feet bgs, 0.8 to 5.8 GPD/FT2 at a depth of 3.0 feet bgs, and 0.7 to 33.2 GPD/FT2 at the variable depth to groundwater. The investigation area encompasses locations beyond the proposed ponds. Therefore, it is of interest to consider only the percolation test locations located near/within each pond area. The results of the percolation tests per each pond are listed in the following tables and discussed below.
Table 4-2. Percolation Rate Test Results, Pond A POND A
Depth 1.5 Feet Depth 3.0 Feet Variable Depth1
Location
Final Rate:
GPD/FT2
Average
Rate: GPD/FT2
Location
Final Rate:
GPD/FT2
Average
Rate: GPD/FT2
Location & Depth
(feet)
Final Rate:
GPD/FT2
Average
Rate: GPD/FT2
P4 9.9
16.1 P4 5.0
3.35 P4 @ 5.0’ 4.1
10.35 P10 22.3 P10 1.7 P10 @ 5.5’ 16.6 1Depth to groundwater Pond A, located in the northwest section of the Expansion Pond, will be approximately 64 acre feet of storage capacity. Pond A percolation test rate data is comprised of two locations relative to the anticipated design of Pond A: P4, located in the northwestern perimeter, and P10, located in the middle-eastern perimeter of Pond A. Although P10 is located near the anticipated perimeter of Pond A, the location is currently near the center of the existing agricultural field and is assumed to be representative of the percolation rate and soil conditions that will be within Pond A. Pond A percolation rates vary, with the final rate value range for each depth as follows: 9.9 to 22.3 GPD/FT2 at 1.5 feet, 5.0 to 1.7 GPD/FT2 at 3.0 feet and 4.1 to 16.6 GPD/FT2 at the variable depth to groundwater locations. For Pond A, the average final rates by depth are calculated, with an average final rate of 16.1 GPD/FT2 at 1.5 feet, 3.35 GPD/FT2 at 3.0 feet, and 10.35 GPD/FT2 at groundwater.

City of Lodi Project No. 2016-00001 Page 18 of 33 November 23, 2016
Table4-3. Percolation Rate Test Results, Pond B POND B
Depth 1.5 Feet Depth 3.0 Feet Variable Depth1
Location
Final Rate:
GPD/FT2
Average
Final Rate:
GPD/FT2
Location
Final Rate:
GPD/FT2
Average
Final Rate:
GPD/FT2
Location & Depth
(feet)
Final Rate:
GPD/FT2
Average
Final Rate:
GPD/FT2
P3 2.9
12.6 P3 2.9
2.3 P3 @7.41’ 33.2
24.9 P10 22.3 P10 1.7 P10 @ 5.5’ 16.6 1Depth to groundwater
Pond B, located in the northeast section of the Expansion Pond, will be approximately 67 acre feet of storage capacity. Pond B percolation test rate data is comprised of two locations relative to the anticipated design of Pond B: P3, located at the northeastern perimeter, and P10, located on the middle-western perimeter of Pond B. Although P10 is located near the anticipated perimeter of Pond B, the location is currently near the center of the existing agricultural field, and is assumed to be representative of the percolation rate and soil conditions that will be within Pond B. Pond B percolation rates vary, with the final rate value range for each depth as follows: 2.9 to 22.3 GPD/FT2 at 1.5 feet, 1.7 to 2.9 GPD/FT2 at 3.0 feet and 16.6 to 33.2 GPD/FT2 at the variable depth to groundwater locations. The percolation test final rate average is 12.6 GPD/FT2 at 1.5 feet, 2.3 GPD/FT2 at 3.0 feet and 24.9 GPD/FT2 at groundwater.
Table 4-4. Percolation Rate Test Results, Pond C POND C
Depth 1.5 Feet Depth 3.0 Feet Variable Depth1
Location
Final Rate:
GPD/FT2
Average
Final Rate:
GPD/FT2
Location
Final Rate:
GPD/FT2
Average
Final Rate:
GPD/FT2
Location & Depth
(feet)
Final Rate:
GPD/FT2
Average
Final Rate:
GPD/FT2
P2 4.5
15.6 P2 4.1
3.83 P2 @ 5.0’ 4.1
10.7 P8 16.6 P8 4.1 P8 @ 4.75 0.7 P11 25.7 P11 3.3 P11 @ 5.8’ 27.3
1Depth to groundwater Pond C is located in the center section of the Expansion Pond, south of Ponds A and B, north of Pond D, and will be the largest Pond, at approximately 109 acre feet of storage capacity. Pond C percolation test rate data is comprised of three locations and described relative to the anticipated design of Pond C: P2, located at the northeastern perimeter; P8, located near the northwestern perimeter; and P11, located near the anticipated center of Pond C. Pond C percolation rates vary, with the final rate value range for each depth as follows: 4.5 to 25.7 GPD/FT2 at 1.5 feet, 3.3 to 4.1 GPD/FT2 at 3.0 feet and 0.7 to 27.3 GPD/FT2 at the variable depth to groundwater locations. The percolation test rate final average for each depth is 15.6 GPD/FT2 at 1.5 feet, 3.83 GPD/FT2 at 3.0 feet, and 10.7 GPD/FT2 at groundwater.

City of Lodi Project No. 2016-00001 Page 19 of 33 November 23, 2016
Table 4-5. Percolation Rate Test Results, Pond D POND D
Depth 1.5 Feet Depth 3.0 Feet Variable Depth1
Location
Final Rate:
GPD/FT2
Average
Final Rate:
GPD/FT2
Location
Final Rate:
GPD/FT2
Average
Final Rate:
GPD/FT2
Location & Depth
(feet)
Final Rate:
GPD/FT2
Average
Final Rate:
GPD/FT2
P1 1.1
12.5 P1 1.4
2.4 P1 @ 6.0’ 0.7
3.93 P7 3.3 P7 0.8 P7 @ 5.25’ 10.4 P12 33.2 P12 5.0 P12 @ 4.5’ 0.7
1Depth to groundwater Pond D is located in the southern section of the Expansion Pond, south of Pond C, and will have approximately 67 acre feet of storage capacity. Pond D percolation test rate data is comprised of three locations and described relative to the anticipated design of Pond D: P7, located at the southwestern perimeter corner; P1, located near the southeastern perimeter (approximately 100 feet southeast of the anticipated pond perimeter); and P12, located near the anticipated center of Pond D. Pond D percolation rates vary, with the final rate value range for each depth as follows: 1.1 to 33.2 GPD/FT2 at 1.5 feet, 0.8 to 5.0 GPD/FT2 at 3.0 feet and 0.7 to 10.4 GPD/FT2 at the variable Depth to Groundwater locations. Average final percolation rates for Pond D is 12.5 GPD/FT2 at 1.5 feet, 2.4 GPD/FT2 at 3.0 feet, and 3.93 GPD/FT2 at groundwater. 5.0 ANALYSIS OF FINDINGS According to WYA’s Technical Draft (2016), depth of pond excavation will be a maximum of 2 feet, to the extent practical. Based on WYA’s Tertiary Storage Pond Earthwork Estimate (Figure 5, WYA’s Technical Memorandum), average excavation depths for the ponds range from 0.85 feet (Pond D) to 1.65 feet bgs (Pond C). In each pond, percolation rates were divided into three calculations as follows: 1) Lateral percolation from top of water to the ground surface elevation, 2) Lateral percolation from the ground surface elevation to pond bottom, and 3) Vertical percolation from the pond bottom to lowest anticipated groundwater elevation. An average percolation rate was calculated for each percolation direction and proposed storage pond. Percolation rates were based on 1) nearby percolation test holes (see Section 4.2) and 2) average percolation rates within the selected test locations at 1.5 feet bgs. Percolation rates at 1.5 feet bgs were chosen based on the anticipated excavation depths at a maximum of 2.0 feet. These calculations are discussed below, following diagram 5-1. The calculations are provided in Appendix D.
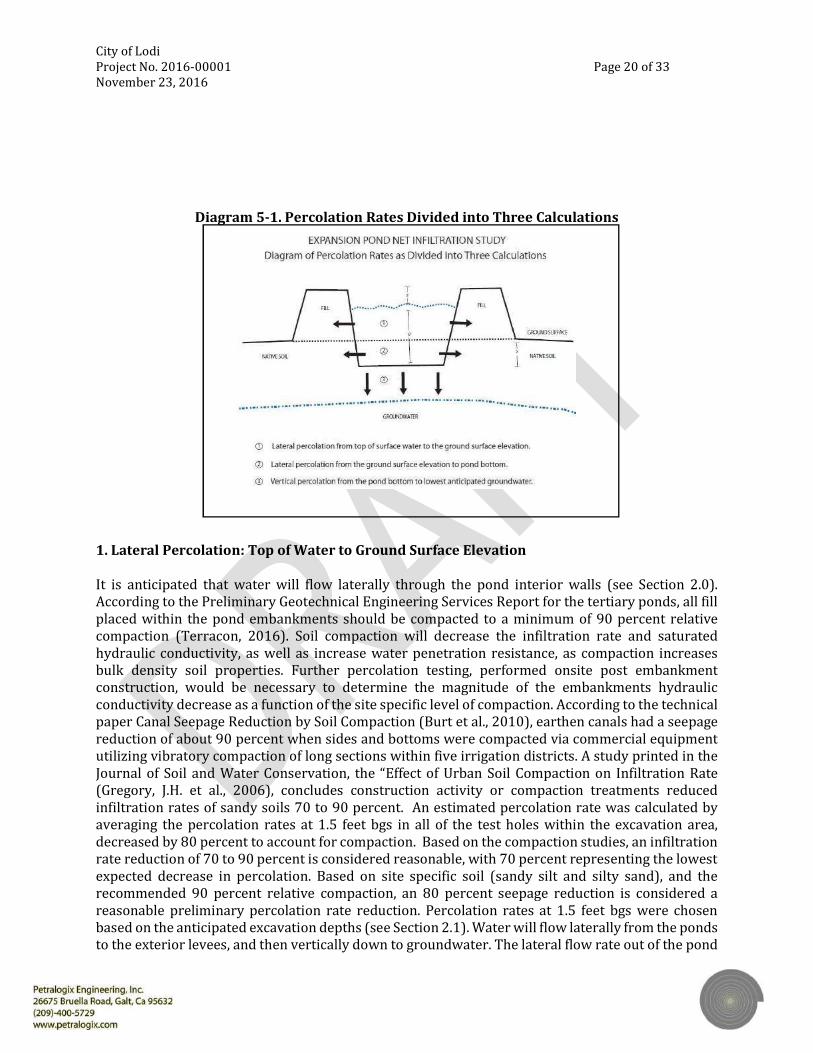
City of Lodi Project No. 2016-00001 Page 20 of 33 November 23, 2016
Diagram 5-1. Percolation Rates Divided into Three Calculations
1. Lateral Percolation: Top of Water to Ground Surface Elevation It is anticipated that water will flow laterally through the pond interior walls (see Section 2.0). According to the Preliminary Geotechnical Engineering Services Report for the tertiary ponds, all fill placed within the pond embankments should be compacted to a minimum of 90 percent relative compaction (Terracon, 2016). Soil compaction will decrease the infiltration rate and saturated hydraulic conductivity, as well as increase water penetration resistance, as compaction increases bulk density soil properties. Further percolation testing, performed onsite post embankment construction, would be necessary to determine the magnitude of the embankments hydraulic conductivity decrease as a function of the site specific level of compaction. According to the technical paper Canal Seepage Reduction by Soil Compaction (Burt et al., 2010), earthen canals had a seepage reduction of about 90 percent when sides and bottoms were compacted via commercial equipment utilizing vibratory compaction of long sections within five irrigation districts. A study printed in the Journal of Soil and Water Conservation, the “Effect of Urban Soil Compaction on Infiltration Rate (Gregory, J.H. et al., 2006), concludes construction activity or compaction treatments reduced infiltration rates of sandy soils 70 to 90 percent. An estimated percolation rate was calculated by averaging the percolation rates at 1.5 feet bgs in all of the test holes within the excavation area, decreased by 80 percent to account for compaction. Based on the compaction studies, an infiltration rate reduction of 70 to 90 percent is considered reasonable, with 70 percent representing the lowest expected decrease in percolation. Based on site specific soil (sandy silt and silty sand), and the recommended 90 percent relative compaction, an 80 percent seepage reduction is considered a reasonable preliminary percolation rate reduction. Percolation rates at 1.5 feet bgs were chosen based on the anticipated excavation depths (see Section 2.1). Water will flow laterally from the ponds to the exterior levees, and then vertically down to groundwater. The lateral flow rate out of the pond

City of Lodi Project No. 2016-00001 Page 21 of 33 November 23, 2016
is of interest as this rate is anticipated to be lower than the vertical flow rate once the water enters the levees. The surface area of the pond interior slopes were considered in calculating the area over which lateral percolation will occur. Calculations of lateral percolation from the top of pond water to the ground surface elevation are summarized for each pond in the table below.
Table 5-1. Lateral Percolation: Top of Water to Ground Surface Elevation
Parameter Surface Area (ft^2)1
Average Water Above Ground Surface (ft) 2
Average Percolation of Excavated Soil @ 1.5 ft bgs
w/ 80% Rate Decrease (gal/ft^2*day) 3
Daily Percolation
(gal/day)
Annual Percolation (gal/year)
Pond A 20,918 5.12 2.66 55,587 20,289,078 Pond B 15,957 4.41 2.66 42,404 15,477,379 Pond C 16,507 4.35 2.66 43,865 16,010,767 Pond D 27,966 5.15 2.66 74,318 27,125,899 TOTAL -- -- -- 216,174 78,903,123
1. Surface area of perimeter levee walls. Considers sloped interior walls from top of water to ground surface elevation and 2:1 slope. 2. Considers top of water to ground surface elevation. Dependent on average excavation depth and total water depth of 6 feet. 3. Considers the following Percolation Test Holes: P1, P2, P3, P4, P7, P8, P10, P11, P12. Based on these preliminary calculations, it is anticipated that 216,174 gallons/day and 78,903,123 gallons/year of water will percolate laterally through the levee walls, but below the ground surface elevation. It should be noted that these estimates do not consider correction factors to account for long-term siltation and bio-buidup on the pound walls. In addition, further percolation testing, performed onsite post embankment construction, would be necessary to determine the magnitude of the embankments hydraulic conductivity decrease as a function of the site-specific level of compaction. 2. Lateral Percolation: Ground Surface Elevation to Pond Bottom It is anticipated that water will flow laterally through the pond interior walls (see Section 2.0). An average percolation rate was calculated for each proposed storage pond. Percolation rates were based on 1) nearby percolation test holes and 2) average percolation rates within the selected test locations at 1.5 feet bgs. Percolation rates at 1.5 feet bgs were chosen based on the anticipated excavation depths (see Section 2.0). Water will flow laterally through the interior pond walls, where water will either flow downward, or to the east-southeast in accordance with the regional hydraulic gradient (Section 3.6). It is not anticipated that groundwater beneath the pond will impact the flow of water laterally out of the pond. The surface area of the pond interior slopes were considered in calculating the area over which lateral percolation will occur. Calculations of lateral percolation from the ground surface elevation to the pond bottom are summarized for each pond in the table below.
Table 5-2. Lateral Percolation: Ground Surface Elevation to Pond Bottom
Parameter Surface Area (ft^2) 1
Pond Bottom Average bgs
(ft) 2
Average Percolation Rate @ 1.5 ft bgs
(gal/ft^2*day) 3
Daily Percolation
(gal/day)
Annual Percolation (gal/year)
Pond A 3,604 0.88 16.1 58,031 21,181,472 Pond B 5,751 1.59 12.6 72,598 26,498,189 Pond C 6,273 1.65 15.6 97,797 35,695,738 Pond D 4,596 0.85 12.5 57,631 21,035,328 TOTAL -- -- -- 286,057 104,410,726
1. Surface area of outer/perimeter levee walls. Considers sloped interior walls from ground surface elevation to pond bottom and 2:1 slope. 2. Dependent on average excavation depth. 3. See Section 4.3 for nearby Percolation Test Holes.
City of Lodi Project No. 2016-00001 Page 22 of 33 November 23, 2016
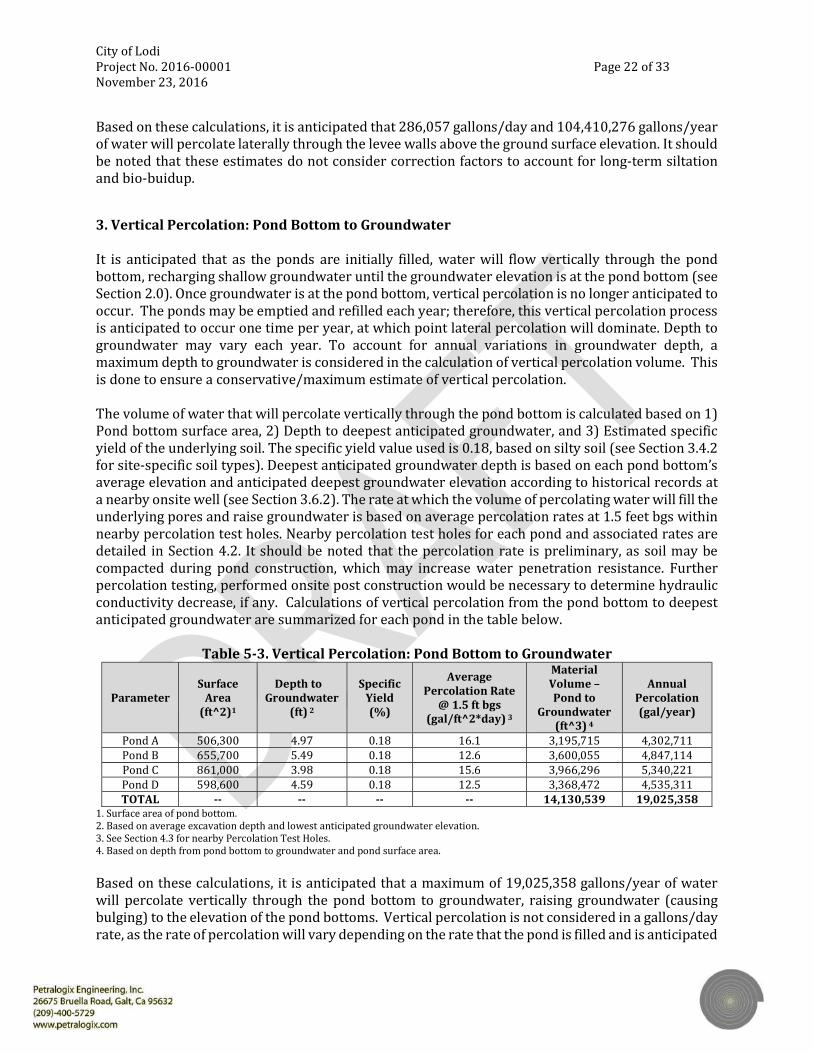
Based on these calculations, it is anticipated that 286,057 gallons/day and 104,410,276 gallons/year of water will percolate laterally through the levee walls above the ground surface elevation. It should be noted that these estimates do not consider correction factors to account for long-term siltation and bio-buidup. 3. Vertical Percolation: Pond Bottom to Groundwater It is anticipated that as the ponds are initially filled, water will flow vertically through the pond bottom, recharging shallow groundwater until the groundwater elevation is at the pond bottom (see Section 2.0). Once groundwater is at the pond bottom, vertical percolation is no longer anticipated to occur. The ponds may be emptied and refilled each year; therefore, this vertical percolation process is anticipated to occur one time per year, at which point lateral percolation will dominate. Depth to groundwater may vary each year. To account for annual variations in groundwater depth, a maximum depth to groundwater is considered in the calculation of vertical percolation volume. This is done to ensure a conservative/maximum estimate of vertical percolation. The volume of water that will percolate vertically through the pond bottom is calculated based on 1) Pond bottom surface area, 2) Depth to deepest anticipated groundwater, and 3) Estimated specific yield of the underlying soil. The specific yield value used is 0.18, based on silty soil (see Section 3.4.2 for site-specific soil types). Deepest anticipated groundwater depth is based on each pond bottom’s average elevation and anticipated deepest groundwater elevation according to historical records at a nearby onsite well (see Section 3.6.2). The rate at which the volume of percolating water will fill the underlying pores and raise groundwater is based on average percolation rates at 1.5 feet bgs within nearby percolation test holes. Nearby percolation test holes for each pond and associated rates are detailed in Section 4.2. It should be noted that the percolation rate is preliminary, as soil may be compacted during pond construction, which may increase water penetration resistance. Further percolation testing, performed onsite post construction would be necessary to determine hydraulic conductivity decrease, if any. Calculations of vertical percolation from the pond bottom to deepest anticipated groundwater are summarized for each pond in the table below.
Table 5-3. Vertical Percolation: Pond Bottom to Groundwater
Parameter Surface
Area (ft^2)1
Depth to Groundwater
(ft) 2
Specific
Yield (%)
Average Percolation Rate
@ 1.5 ft bgs (gal/ft^2*day) 3
Material Volume – Pond to
Groundwater (ft^3) 4
Annual Percolation (gal/year)
Pond A 506,300 4.97 0.18 16.1 3,195,715 4,302,711 Pond B 655,700 5.49 0.18 12.6 3,600,055 4,847,114 Pond C 861,000 3.98 0.18 15.6 3,966,296 5,340,221 Pond D 598,600 4.59 0.18 12.5 3,368,472 4,535,311 TOTAL -- -- -- -- 14,130,539 19,025,358
1. Surface area of pond bottom. 2. Based on average excavation depth and lowest anticipated groundwater elevation. 3. See Section 4.3 for nearby Percolation Test Holes. 4. Based on depth from pond bottom to groundwater and pond surface area. Based on these calculations, it is anticipated that a maximum of 19,025,358 gallons/year of water will percolate vertically through the pond bottom to groundwater, raising groundwater (causing bulging) to the elevation of the pond bottoms. Vertical percolation is not considered in a gallons/day rate, as the rate of percolation will vary depending on the rate that the pond is filled and is anticipated
City of Lodi Project No. 2016-00001 Page 23 of 33 November 23, 2016
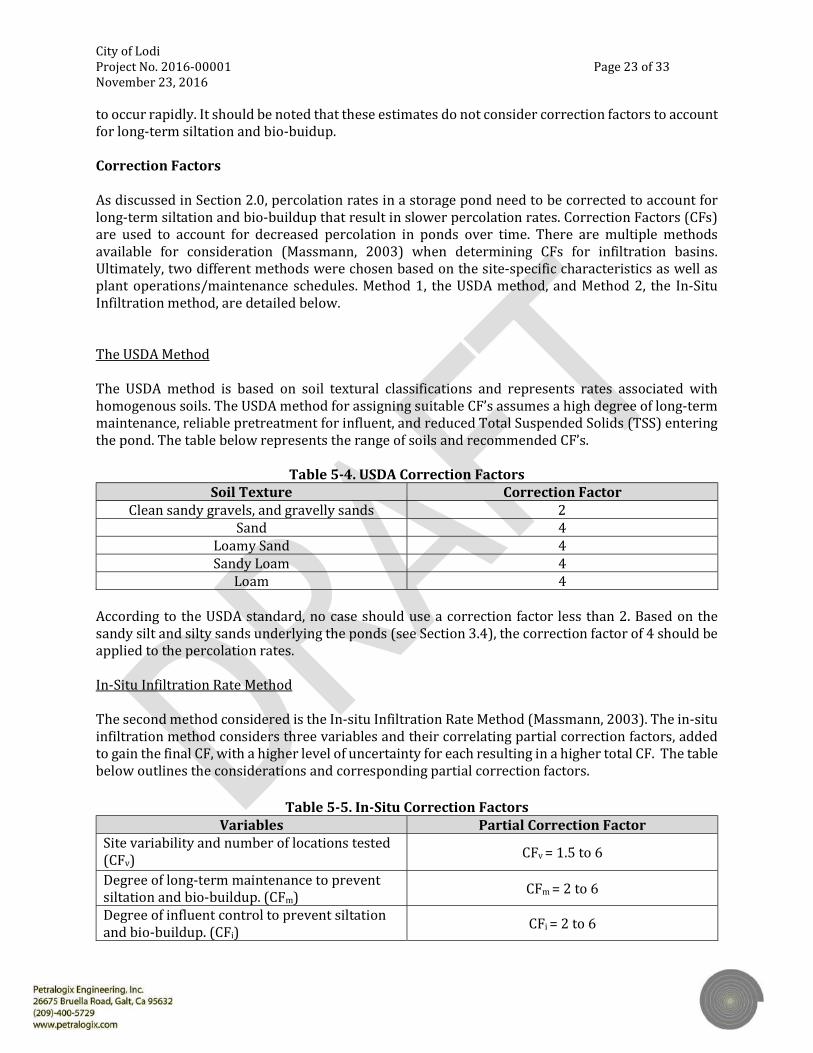
to occur rapidly. It should be noted that these estimates do not consider correction factors to account for long-term siltation and bio-buidup. Correction Factors As discussed in Section 2.0, percolation rates in a storage pond need to be corrected to account for long-term siltation and bio-buildup that result in slower percolation rates. Correction Factors (CFs) are used to account for decreased percolation in ponds over time. There are multiple methods available for consideration (Massmann, 2003) when determining CFs for infiltration basins. Ultimately, two different methods were chosen based on the site-specific characteristics as well as plant operations/maintenance schedules. Method 1, the USDA method, and Method 2, the In-Situ Infiltration method, are detailed below. The USDA Method The USDA method is based on soil textural classifications and represents rates associated with homogenous soils. The USDA method for assigning suitable CF’s assumes a high degree of long-term maintenance, reliable pretreatment for influent, and reduced Total Suspended Solids (TSS) entering the pond. The table below represents the range of soils and recommended CF’s.
Table 5-4. USDA Correction Factors Soil Texture Correction Factor
Clean sandy gravels, and gravelly sands 2 Sand 4
Loamy Sand 4 Sandy Loam 4
Loam 4 According to the USDA standard, no case should use a correction factor less than 2. Based on the sandy silt and silty sands underlying the ponds (see Section 3.4), the correction factor of 4 should be applied to the percolation rates. In-Situ Infiltration Rate Method The second method considered is the In-situ Infiltration Rate Method (Massmann, 2003). The in-situ infiltration method considers three variables and their correlating partial correction factors, added to gain the final CF, with a higher level of uncertainty for each resulting in a higher total CF. The table below outlines the considerations and corresponding partial correction factors.
Table 5-5. In-Situ Correction Factors Variables Partial Correction Factor Site variability and number of locations tested (CFv) CFv = 1.5 to 6 Degree of long-term maintenance to prevent siltation and bio-buildup. (CFm) CFm = 2 to 6 Degree of influent control to prevent siltation and bio-buildup. (CFi) CFi = 2 to 6

City of Lodi Project No. 2016-00001 Page 24 of 33 November 23, 2016
Variables Partial Correction Factor
TOTAL (CFt) CFt = CFv + CFm + CFi
Based on the variable percolation rates during the field investigation and general homogeneity of the soil, the site variability correction factor (CFv) for the pond is 3 (moderate). Since long-term maintenance from the City is anticipated to be reliable and on schedule, the maintenance correction factor (CFm) for the pond is 2 (lowest). Influent will consist of tertiary treated water with multiple treatments, including influent screens, grit removal, primary sedimentation tanks, activated sludge with biological nutrient removal, secondary clarification, tertiary treatment through cloth media filtration, and UV light disinfection. Therefore, the influent control correction factor (CFi) for the pond is 2 (lowest). Based on these assumptions, the final CF is calculated as follows: CFv = 3 CFm = 2 CFi = 2 CFt = 3 + 2 + 2 = 7 Therefore, the total CF is 7 based on the in-situ infiltration rate method. Both methods used to calculate a CF for a storage basin are reasonable. For final percolation rate calculations from the site storage ponds, both CFs will be used as a range (4-7) to consider both maximum and minimum anticipated percolation. Percolation Totals The three above calculations are summed to get both approximate percolation per day and percolation per year. As discussed above, these rates need to be corrected to account for siltation and bio-buildup. For the site, correction factors between 4 and 7 are appropriate (Massman, 2003). Therefore, a range of anticipated percolation rates are given below, considering both correction factors.
City of Lodi Project No. 2016-00001 Page 25 of 33 November 23, 2016
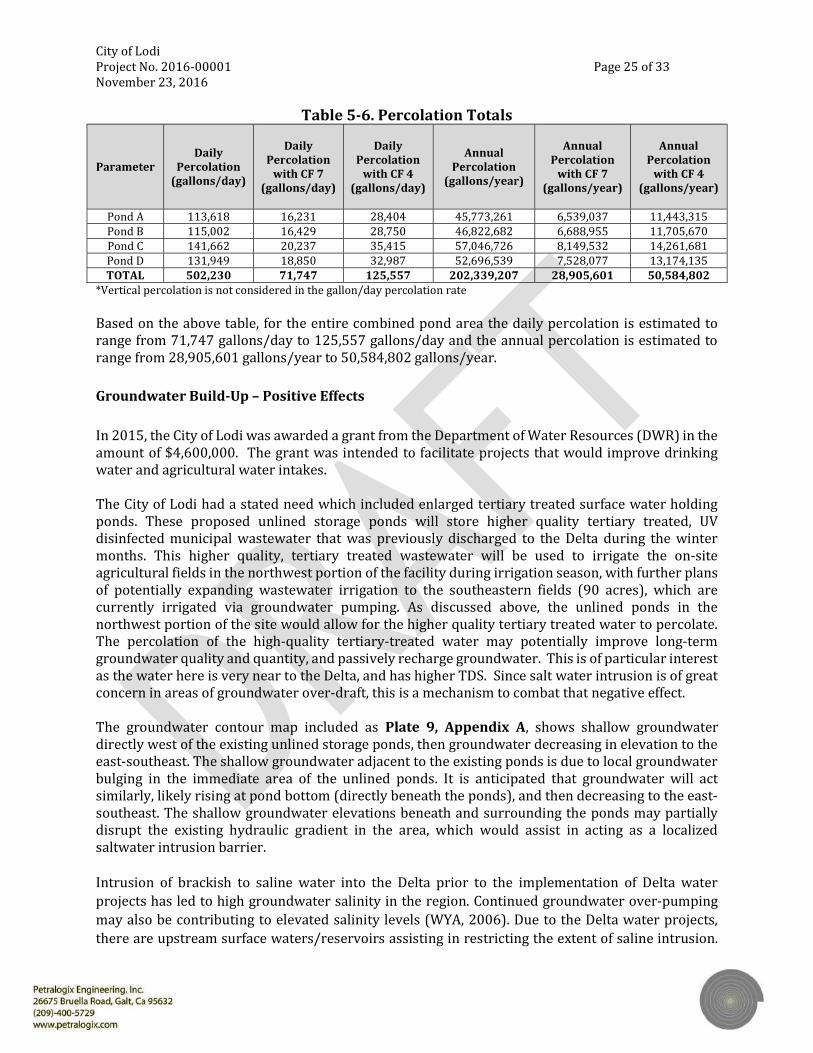
Table 5-6. Percolation Totals
Parameter Daily
Percolation (gallons/day)
Daily
Percolation with CF 7
(gallons/day)
Daily
Percolation with CF 4
(gallons/day)
Annual Percolation
(gallons/year)
Annual
Percolation with CF 7
(gallons/year)
Annual
Percolation with CF 4
(gallons/year)
Pond A 113,618 16,231 28,404 45,773,261 6,539,037 11,443,315 Pond B 115,002 16,429 28,750 46,822,682 6,688,955 11,705,670 Pond C 141,662 20,237 35,415 57,046,726 8,149,532 14,261,681 Pond D 131,949 18,850 32,987 52,696,539 7,528,077 13,174,135 TOTAL 502,230 71,747 125,557 202,339,207 28,905,601 50,584,802
*Vertical percolation is not considered in the gallon/day percolation rate Based on the above table, for the entire combined pond area the daily percolation is estimated to range from 71,747 gallons/day to 125,557 gallons/day and the annual percolation is estimated to range from 28,905,601 gallons/year to 50,584,802 gallons/year. Groundwater Build-Up – Positive Effects In 2015, the City of Lodi was awarded a grant from the Department of Water Resources (DWR) in the amount of $4,600,000. The grant was intended to facilitate projects that would improve drinking water and agricultural water intakes. The City of Lodi had a stated need which included enlarged tertiary treated surface water holding ponds. These proposed unlined storage ponds will store higher quality tertiary treated, UV disinfected municipal wastewater that was previously discharged to the Delta during the winter months. This higher quality, tertiary treated wastewater will be used to irrigate the on-site agricultural fields in the northwest portion of the facility during irrigation season, with further plans of potentially expanding wastewater irrigation to the southeastern fields (90 acres), which are currently irrigated via groundwater pumping. As discussed above, the unlined ponds in the northwest portion of the site would allow for the higher quality tertiary treated water to percolate. The percolation of the high-quality tertiary-treated water may potentially improve long-term groundwater quality and quantity, and passively recharge groundwater. This is of particular interest as the water here is very near to the Delta, and has higher TDS. Since salt water intrusion is of great concern in areas of groundwater over-draft, this is a mechanism to combat that negative effect. The groundwater contour map included as Plate 9, Appendix A, shows shallow groundwater directly west of the existing unlined storage ponds, then groundwater decreasing in elevation to the east-southeast. The shallow groundwater adjacent to the existing ponds is due to local groundwater bulging in the immediate area of the unlined ponds. It is anticipated that groundwater will act similarly, likely rising at pond bottom (directly beneath the ponds), and then decreasing to the east-southeast. The shallow groundwater elevations beneath and surrounding the ponds may partially disrupt the existing hydraulic gradient in the area, which would assist in acting as a localized saltwater intrusion barrier. Intrusion of brackish to saline water into the Delta prior to the implementation of Delta water projects has led to high groundwater salinity in the region. Continued groundwater over-pumping may also be contributing to elevated salinity levels (WYA, 2006). Due to the Delta water projects, there are upstream surface waters/reservoirs assisting in restricting the extent of saline intrusion.

City of Lodi Project No. 2016-00001 Page 26 of 33 November 23, 2016
Recharge of freshwater occurs on a year-round basis west and northwest of the WPCF, where these recharge zones have been reported to have lower salinity levels compared to the properties located further east (WYA, 2015). The area west of the WPCF facility relies on surface water, opposed to the area east, which generally relies on groundwater. As discussed in section 3.5.1, there is a cone of depression that persists throughout the year east-southeast of the site; this cone is a result of groundwater pumping and is responsible for the groundwater flow direction in the vicinity. The transition on-site between surface water and groundwater use is also expected to create a gradient of water quality across the site, particularly with regards to salinity (WYA, 2015). There are three agricultural fields that occupy 90 acres in the most southeast portion of the site which are currently irrigated with groundwater pumped from a well near the southeast corner of these fields. The WPCF’s irrigation distribution could be expanded in order to deliver the reclaimed tertiary wastewater and reduce (or eventually eliminate) the need for groundwater pumping/depletion in the southeast portion of the site (WYA, 2016). This could have the benefit of decreasing groundwater pumping while increasing groundwater recharge with higher quality tertiary treated water in the eastern portion of the site. 6.0 FUTURE IMPACTS AND GROUNDWATER RECHARGE IMPLICATIONS The purpose of the proposed storage ponds is to store Title 22 tertiary treated effluent that has historically been discharged to the Delta. The tertiary treated effluent would be stored during the non-irrigation season (October through mid-April), and then be used for irrigation from mid-April through September. This will reduce long-term pumping of groundwater for irrigation in the region. This is considered a passive form of groundwater recharge (in-lieu). However, more active/increased groundwater recharge methods and their impacts should be considered in the future. As previously discussed, the proposed pond location is on a portion (88 acres) of the City’s existing agricultural fields, located due west of the existing onsite storage ponds. The location is near the WPCF’s main irrigation distribution box, which is anticipated to reduce the cost needed to convey the tertiary treated water. The location is also situated at the end of the City’s irrigation distribution system currently in place, and serves as a further cost benefit since the construction of the ponds will have minor impacts on the City’s current irrigation water delivery systems (West Yost Technical Memo, Figure 4). The Project will divert Title 22 tertiary treated water to the new storage ponds. As outlined in WYA’s Technical Memorandum, the current diversion facilities transport both tertiary treated water and un-disinfected secondary treated water. Therefore, the Project will require new facilities that will accommodate the diversion of tertiary treated flow separately. The tertiary treated wastewater will be diverted from the WPCF’s current Filter Pump Station and transported to the new ponds via a new 18-inch diameter pipeline; the 18-inch pipeline will also serve to transport water from the new ponds to the WPCF’s irrigation system. The 18-inch diameter pipeline will terminate at the Tertiary Water Pump Station, which will be used to pump water directly into the ponds, as necessary. The Tertiary Water Pump Station will pump the stored water to the WPCF’s existing irrigation distribution system in order to deliver water to the City-owned agricultural fields.
City of Lodi Project No. 2016-00001 Page 27 of 33 November 23, 2016
The proposed ponds will remove approximately 88 acres of agricultural land located west of the facility. The irrigation water previously used to irrigate these 88 acres could be delivered to the three agricultural fields, consisting of 90 acres, in the very southeast portion of the WPCF that are currently irrigated with groundwater pumped from a well located near these fields (see Plate 1, Appendix A). Improvements needed to expand the irrigation system and deliver reclaimed wastewater to the southeastern fields would require a new pump station to withdraw water from an existing supply channel and deliver the water to the existing groundwater supply channel that trends parallel to Thornton Road (WYA, 2016). A water balance analysis performed by WYA (WYA, 2016) demonstrates that with the addition of the new ponds under current conditions, there may be a potential for excess water to remain in the storage ponds at the end of the irrigation season. If the water delivery system is expanded to transport the potential excess water to the southeastern fields that are currently drawing on groundwater pumping, the need for groundwater pumping in that area will be reduced, with some minimal groundwater pumping still required. The WPCF anticipates the average dry weather flow to reach 5.0 MGD in the future, of which the City could then irrigate the additional 90 acres in the southeastern fields without the need for supplemental irrigation, further decreasing local groundwater pumping (WYA, 2016). As discussed Section 3.4, there are two distinct soil types located at the WPCF: the Guard (located northwest in the anticipated pond location), a clay loam with a low permeability, and the Devries, (located southeast), a sandy loam with a moderately rapid permeability. Although additional monitoring wells are needed to further characterize the site-specific groundwater flows at the facility (WYA, 2006), the regional groundwater flow is to the southeast, toward a cone of depression. The tertiary treated water proposed to be stored in the expansion ponds, located northwest on the Guard soil series, will percolate at a relatively slow rate and migrate primarily to the southeast, into the Devries sandy loam. The infrastructure proposed to convey the tertiary treated water to the southeastern fields would drastically reduce groundwater pumping up to the point of the anticipated future increase of 5.0 MGD (WYA, 2016) future dry weather flow, at which time there would be no need for groundwater pumping from the dedicated well located near the southeastern agricultural fields. Furthermore, the treated water will percolate moderately fast through the Devries sandy loam located in the southeastern fields, which would be irrigated, potentially increasing groundwater storage/reducing aquifer level drawdown in an area with recorded elevated salinity levels. The proposed ponds, while primarily serving as unlined storage ponds with natural percolation, could be utilized in the future for other groundwater recharge projects. Groundwater recharge can be accomplished via in-lieu methods such as an injection well intended to introduce the treated waters and blend them with the existing aquifer, or via sand aquifer treatment (SAT), which would apply the treated waters to the southeastern agricultural fields that have moderately fast anticipated percolation rates and greater depth to groundwater. However, such possibilities need to be more thoroughly explored, and studied in greater detail.
City of Lodi Project No. 2016-00001 Page 28 of 33 November 23, 2016
If the tertiary treated pond water is used as a formal groundwater recharge source, extensive monitoring, testing, and research will need to be continually performed to ensure the recycled water remains safe for groundwater replenishment. Beneficial uses of the groundwater underlying the facility include agricultural water supply, industrial process water supply, and municipal and domestic water supply. The California Department of Public Health (CDPH) – Division of Drinking and Environmental Management sets the state standards for groundwater reuse projects, and has set forth engineering objectives for their review prior to the permitting process with the facilities Regional Water Quality Control Board. The requirements for a recycled groundwater recharge project are beyond the scope of this report; however, a brief discussion is given below. In order to be considered by the CDPH for permitting, an engineering report needs to be submitted. The report needs to include a general description of the hydrogeological and geologic setting of the groundwater basin potentially impacted and a detailed description of the stratigraphy beneath the site, which includes the composition; the extent and physical properties of the potentially affected aquifer, with at least four rounds of consecutive monitoring to capture seasonal impacts; and the existing and anticipated hydrogeology (CDPH, 2014). In conjunction with source water monitoring to ensure recycled water quality meets standards, at least two monitoring wells need to be located downgradient: at least one monitoring well should be located where recycled water has been retained in the saturated zone for at least two weeks, but no longer than six months, and at least one monitoring well should be located no less than thirty days up-gradient of the nearest drinking well(s) (CDPH, 2014). Retention times can vary, based on the model used to determine groundwater flow/residence time; models using Darcy’s Law require a maximum retention time of 24 months prior to reaching a domestic water supply well. Ultimately, a tracer test is required to ensure recycled water is retained underground for a minimum of 6 months prior to extraction for drinking water (CDPH, 2014). These studies can also apply to the application of Soil Aquifer Treatment to ensure soil is effectively removing contaminants. At least one year after the blended recharge water has reached a minimum of one groundwater monitoring well, the facility shall submit a report demonstrating buffer zone/travel time compliance, groundwater testing, and a mass balance to ensure that blending is occurring, with recharge water flow paths determined and compared to models. In accordance with Order R5-2007-0113, groundwater monitoring has historically been performed at the WPCF, with monitoring results submitted to the Water Board. The City has a groundwater monitoring well network at the WPCF, currently consisting of 21 groundwater monitoring wells. Depth to groundwater ranges from just a few feet bgs in the westernmost monitoring wells to greater than 30 feet bgs in the eastern monitoring wells. Based on historical monitoring results, the Central Valley Water Board concluded in amended Order R5-2013-0126 that the land application activities, consisting of the discharge of wastewater to agricultural fields, could be a threat to groundwater quality. To determine compliance with Groundwater Limitations contained in the Order and to evaluate whether the City is meeting Best Practicable Treatment or Control (BPTC) in accordance with the Antidegradation Policy, the City must continue to fully characterize background groundwater and complete a BPTC Evaluation.

City of Lodi Project No. 2016-00001 Page 29 of 33 November 23, 2016
In January 2015, WYA prepared a BPTC Evaluation report on behalf of the City of Lodi for the WPCF, in accordance with Special Provision VI.C.5.a of amended Order R5-2007-0113. The purpose of the report was to determine BPTCs for each of the waste constituents of concern (COCs). This is accomplished by an analysis of COCs for which degradation from the WPCF is possible. WYA determined that additional BPTCs may be necessary for COCs if the concentrations exceed the applicable Water Quality Objectives (WQOs) in any on-site well and if the existing WPCF practices are the cause of the background exceedance. However, BPTCs are considered adequate for COCs where either the onsite concentrations are at or below WQOs or there are no applicable WQOs. To identify COCs at the facility that may require additional BPTCs, WYA analyzed data from the City’s groundwater monitoring well network at the WPCF. The analyzed potential COCs, background concentrations, and applicable WQOs are included in Table 6-1 below.
Table 6-1. Groundwater Quality Data Source: West Yost Associates, BPTC (2015)
Constituent of Concern Units Background Tertiary-Level Treatment (2009-2011)
Water Quality Objective
Boron mg/l 0.073-0.15 NA 0.7 Chloride mg/l 12-97 645 106 Iron mg/l <0.017-0.33 0.1405 0.3 Lead mg/l 1.4 0.00035 15 Mercury ng/l NA 0.045 2 Manganese µg/l <0.17-275 294 50 Sodium mg/l 20-175 NA 69 Sulfate mg/l 11-160 285 250 Electrical Conductivity µhmos/cm 665-1,640 6735 700 Total Dissolved Solids mg/l 405-1,100 4165 450 Ammonia as N mg/l 0.11-0.31 2.72 1.5 Nitrate as N mg/l 1.4-31 NA 10 Nitrite as N mg/l <0.042 0.485 1 Nitrate + Nitrate as N mg/l 1.4-31 115 10 Total Coliform Organisms MPN/100 ml <2.2 12.53 2.21 Bromoform µg/l <0.085 NA 80 Chloroform µg/l <0.060 NA 80 Chlorodibromomethane µg/l <0.081 <0.312 0.41 Dichlorobromomethane µg/l <0.081 <0.252 0.56 Fixed Dissolved Solids mg/l 330-940 NA 450 Fluoride mg/l 0.13-0.285 NA 1 Alkalinity, Total mg/l 220-620 NA N/A pH Std Units 7.2-7.4 6.3-7.65 6.5-8.5

City of Lodi Project No. 2016-00001 Page 30 of 33 November 23, 2016
Constituent of Concern Units Background Tertiary-Level Treatment (2009-2011)
Water Quality Objective
Bromide mg/l <0.071-1.4 NA NA Calcium mg/l 63-100 NA NA Hardness mg/l 285-560 NA NA Phosphorous mg/l 0.084-0.76 NA NA Potassium mg/l 0.46-2.7 NA NA Magnesium mg/l 30-50 NA NA Total Kjeldahl Nitrogen mg/l 0.035-0.33 NA NA Molybdenum mg/l NA NA NA
(1) Average Weekly Effluent Limit (4) Highest Daily Concentration (2) Highest Average Monthly Concentration (5) Annual Average Concentration (3) Highest Average Weekly Concentration NA – Data Not Available Based on a background groundwater study and identified on-site well exceedances, additional BTPCs were considered for Chloride, Manganese, and Nitrate. A review of on-site and nearby chloride sources indicated that the WPCF is not the source of on-site chloride background exceedances. Rather, other regional processes such as regional groundwater pumping and historical intrusion of brackish to saline water are the suspected cause of the exceedances. For manganese, it was determined that naturally occurring anoxic conditions related to the presence of Guard soils are the cause of current on-site background exceedances. For nitrate, a nearby dairy farm and other previously impacted activities unrelated to the WPCF are likely the cause of on-site background exceedances. Based on these findings, West Yost concluded that the on-site application of secondary treated water at the WPCF is not the source of current background exceedances for COCs. Furthermore, the City of Lodi has already implemented and continues to implement numerous BPTCs to manage loading of COCs to groundwater. Therefore, the WPCF is in compliance with the Antidegradation Policy. The proposed pond will store tertiary treated, UV disinfected municipal wastewater that was previously discharged to the Delta during the winter months. The stored wastewater will be treated, stored, and land applied in accordance with amended Order R5-2013-0126. Secondary treated wastewater, treated to lower quality than the tertiary treated wastewater, is already stored in the four existing onsite unlined ponds during the winter months, and applied to the surrounding agricultural fields during irrigation season. As discussed above, WYA’s 2015 BPTC study concluded that the current onsite storage and application of secondary treated wastewater at the WPCF is not the source of background exceedance of COCs. Therefore, it is not expected that the tertiary treated wastewater stored in the proposed ponds, treated to higher quality than the already applied secondary treated wastewater, will violate any water quality standards or waste discharge requirements if applied to surrounding land. Furthermore, the treated wastewater may be a good candidate for groundwater recharge as a future positive benefit of the project at some point in the future.

City of Lodi Project No. 2016-00001 Page 31 of 33 November 23, 2016
7.0 REFERENCES
ASTM D2487: Standard Practice for Classification of Soils.
Aubertin, M., M. Mbonimpa, B. Bussière, and R.P. Chapuis, 2003. “A model to predict the water retention curve from basic geotechnical properties”. Canadian Geotechnical Journal, Vol. 40, pp. 1104-1122. Burt, C., Orvis, S., and Alexander, N. (2010). “Canal Seepage Reduction by Soil Compaction”. Journal of Irrigation and Drainage Engineering., 10.1061/(ASCE)IR. 1943-4774.0000205, 479-485. California Department of Public Health. Regulations Related to Recycled Water. June 18, 2014. Geologic Map of the Sacramento Quadrangle, Wagner, et al, California. Scale: 1:62,500. Gregory, J.H., Dikes, M.D., Jones, P.H., and Miller, G.L., (2006). “Effect of Urban Soil Compaction on Infiltration Rate”. Journal of soil and Water Conservation, Volume 61, Number 3.
Horton, Robert, E., An Approach Toward a Physical Interpretation of Infiltration-Capacity. American Soil Science, accessed online September 13, 2016. Available online at https://dl.sciencesocieties.org/publications/sssaj/abstracts/5/C/SS00500C0399
Massman, W. Joel, (2003). A Design Manual for Sizing Infiltration Ponds: Research Project Agreement Y8265
Nichol C., 2002. Transient Flow and Transport in Unsaturated Heterogeneous Media: Field Experiments in Mine Waste Rock. PhD. Thesis, University of British Columbia.
Ochoa, C.G, Fernarld, A. G. Fernald, Guldan, S. J., Shukla, M. K., 2007. Deep Percolation and its Effects on Shallow Groundwater Level Rise Following Flood Irrigation. American Society of Agricultural and Biological Engineers, Vol. 50(1, pp. 73−81)
Page, R.W., 1986, Geology of the Fresh Ground-Water Basin of the Central Valley: US Geological Survey Professional Paper 1401. San Joaquin County Groundwater Report (2015) Soil Survey of San Joaquin County (1992) Terracon Consultants, Inc., 2016. Preliminary Geotechnical Engineering Services Report: White Slough Wastewater Treatment Facility Tertiary Ponds, Lodi, California. US Geological Survey, 2015, 7.5’ Topographic Map, Lodi South Quadrangle. US Geological Survey, 2015, 7.5’ Topographic Map, Terminous Quadrangle. USDA-NRCS Web Soil Survey (2003), Accessed online July 26, 2016. Available online at http://websoilsurvey.nrcs.usda.gov/app/WebSoilSurvey.aspx

City of Lodi Project No. 2016-00001 Page 32 of 33 November 23, 2016
USDA Soil Series, Guard Series. Accessed online July 26, 2016. Available online at https://soilseries.sc.egov.usda.gov/OSD_Docs/G/GUARD.html USDA Soil Series, Devries Series. Accessed July 26, 2016. Available online at https://soilseries.sc.egov.usda.gov/OSD_Docs/D/DEVRIES.html West Yost Associates, 2006. City of Lodi White Slough WPCF Soil and Groundwater Investigation Existing Conditions Report (Existing Conditions Report). West Yost Associates, 2015. City of Lodi, White Slough, Water Pollution Control Facility, Best Practicable Treatment and Control Evaluation Work Plan (BPTC Work Plan) West Yost Associates, 2016. DRAFT- Technical Memorandum

City of Lodi Project No. 2016-00001 Page 33 of 33 November 23, 2016
8.0 DATE AND SIGNATURE PAGE
Tonya R. Scheftner, Project Geologist Daniel E. Kramer, President B.Sc. Geology, GIT No. 685 Professional Geologist No. 8657

APPENDIX A

Facility Map
Project Nam
e:____________Project N
o.:______________D
ate:___________________Plate N
o.:_______________
City of Lodi
Novem
ber 2016
Plate # 1N
Scale :_______________N
ot to Scale
Reference: Technical Mem
orandum, Prelim
inary Design of the W
hite Slough Water Pollution Control Facility Storage Expansion and Surface, Agricultural, and Groundw
ater SupplyImprovem
ent Project, West Yost 2016
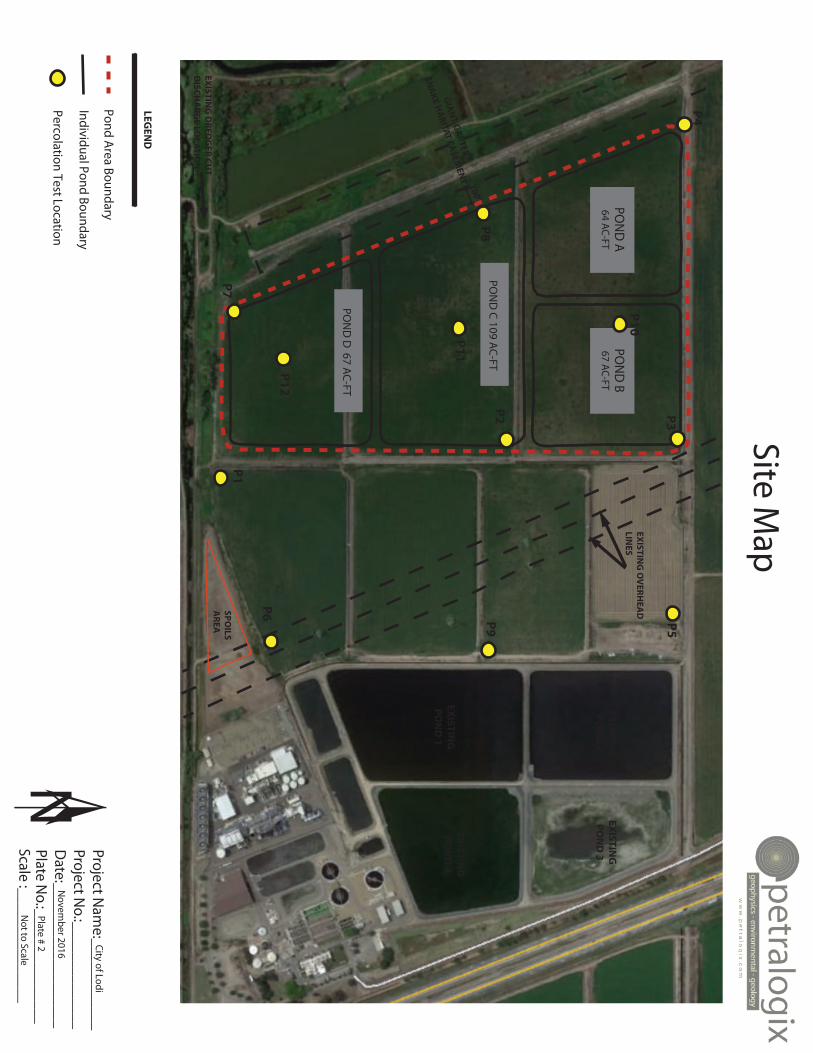
LEGEN
D
Pond Area Boundary
Site Map
Project Nam
e:____________Project N
o.:______________D
ate:___________________Plate N
o.:_______________
City of Lodi
Novem
ber 2016
Plate # 2N
Scale :_______________N
ot to Scale
P2
P5
P6
P7
P8P9
EXISTIN
GPO
ND
2EX
ISTING
PON
D 3
EXISTIN
GPO
ND
1
EXISTIN
GPO
ND
4G
IAN
T GA
RTER
SNA
KE HA
BITAT EASEM
ENT
EXISTIN
G O
VER
HEA
D
LINES
SPOILS
AR
EA
Individual Pond Boundary
Percolation Test Location
EXISTIN
G D
RED
GER
CU
TD
ISCH
AR
GE LO
CATIO
N
P1
P3
P4
100’ PON
D A
64 AC-FT
PON
D B
67 AC-FT
PON
D C
109 AC
-FT
PON
D D
67 AC
-FT
P10
P11
P12
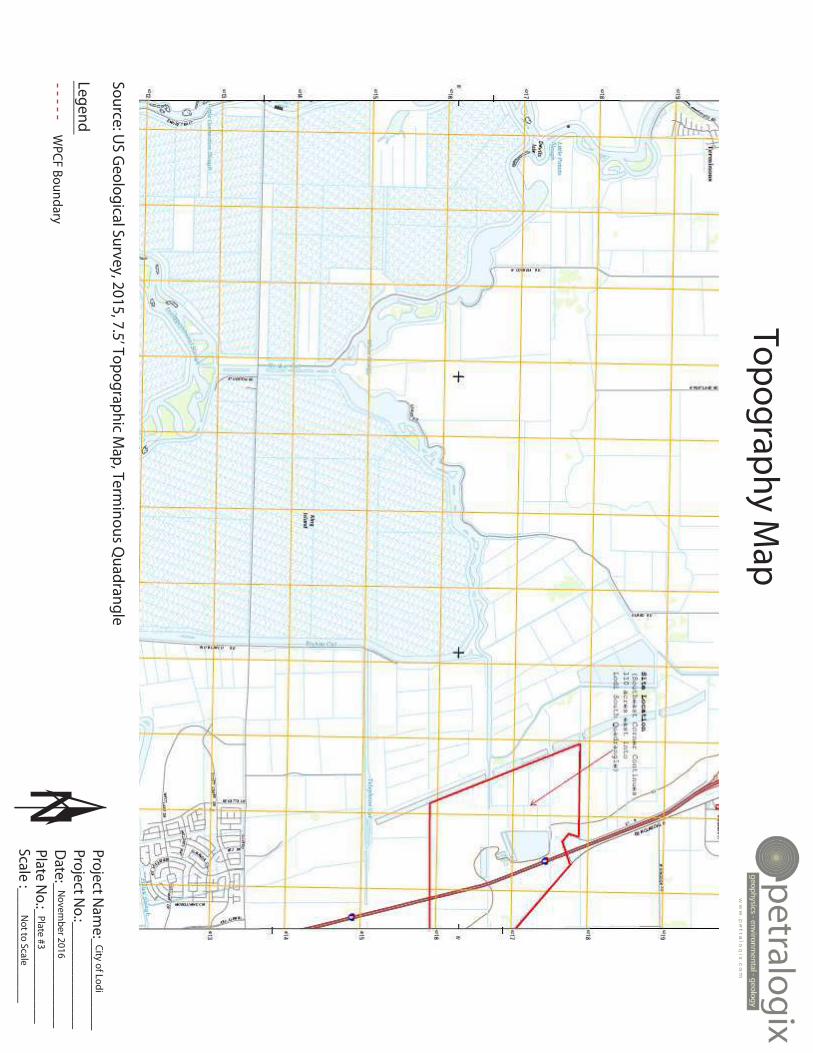
Topography Map
Project Nam
e:____________Project N
o.:______________D
ate:___________________Plate N
o.:_______________
City of Lodi
Novem
ber 2016
Plate #3N
Scale :_______________N
ot to Scale
Source: US Geological Survey, 2015, 7.5’ Topographic Map, Term
inous Quadrangle
Legend_______W
PCF Boundary

LEGEN
D
Geologic Map
Project Nam
e:____________Project N
o.:______________D
ate:___________________Plate N
o.:_______________
City of Lodi
Novem
ber 2016
Plate #4N
Scale :_______________N
ot to Scale
Approximate Site Boundary
Reference: California Geological Survey, 1981 Map of Sacram
ento Quadrangle
Compiled by D
.L. Wagner, C.W
Jennings, T.L. Bedrossian and E.J. Bortungno1:250,000, second printing 1987

Soil Map
Project Nam
e:____________Project N
o.:______________D
ate:___________________Plate N
o.:_______________
City of Lodi
Novem
ber 2016
Plate #5N
Scale :_______________N
ot to Scale
Reference: City of Lodi White Slough W
PCF Soil and Groundwater Investigation Existing Conditions Report. W
est Yost Associates, 2006

Spring 2013 Groundwater M
ap Lines of Equal Elevation
Project Nam
e:____________Project N
o.:______________D
ate:___________________Plate N
o.:_______________
City of Lodi
Novem
ber 2016
Plate #6N
Scale :_______________N
ot to Scale
White Slough W
PCF Boundary
Source: Groundwater Report, Spring 2014 - San Joaquin County Flood Control and W
ater Consrevation District,
Lines of Equal Elevation of Groundwater Spring 2013 Contour Interval 10 feet.
Approximate Groundw
ater Flow D
irection

Spring 2014 Groundwater M
ap Lines of Equal Elevation
Project Nam
e:____________Project N
o.:______________D
ate:___________________Plate N
o.:_______________
City of Lodi
Novem
ber 2016
Plate #7N
Scale :_______________N
ot to Scale
White Slough W
PCF Boundary
Source: Groundwater Report, Spring 2014 - San Joaquin County Flood Control and W
ater Consrevation District,
Lines of Equal Elevation of Groundwater Spring 2014 Contour Interval 10 feet.
Approximate Groundw
ater Flow D
irection

City of Lodi - White Slough W
PCF
Project Nam
e:____________Project N
o.:______________D
ate:___________________Plate N
o.:______________
City of Lodi
Novem
ber 2016
Plate #8N
Scale :_______________N
ot to Scale
Source: The City of Lodi - WPCF BPTC Report, W
est Yost, 2015.
Monitoring W
ell Locations
LEGEND
Note: The City’s m
onitoring wells previously included w
ell WSM
-3, which w
as destroyed in August 17, 2010.

Site-Specific Groundwater Elevations
September, 2003
Project Nam
e:____________Project N
o.:______________D
ate:___________________Plate N
o.:_______________
City of Lodi
Novem
ber 2016
Plate #9N
Scale :_______________N
ot to ScaleApproxim
ate Expansion Pond Boundary
Reference: City of Lodi White Slough W
PCF Soil and Groundwater Existing Conditions Report. W
est Yost Associates, 2006

Site-Specific Groundwater Elevations
March, 2004
Project Nam
e:____________Project N
o.:______________D
ate:___________________Plate N
o.:____________
City of Lodi
Novem
ber 2016
Plate #10N
Scale :_______________N
ot to Scale
Reference: City of Lodi White Slough W
PCF Soil and Groundwater Investigation Existing Conditions Report. W
est Yost, 2006.
Approximate Expansion Pond Boundary

Site-Specific Groundwater Elevations
July 23, 2014
Project Nam
e:____________Project N
o.:______________D
ate:___________________Plate N
o.:__________
City of Lodi
Novem
ber 2016
Plate #11N
Scale :_______________N
ot to Scale
Reference: City of Lodi WPCF Best Practicable Treatm
ent or Control Evaluation Report. West Yost, 2015.
Approximate Expansion Pond Boundary

LEGEN
D
Pond Area Boundary
Project Nam
e:____________Project N
o.:______________D
ate:___________________Plate N
o.:______________
City of Lodi
NScale :_______________
Individual Pond Boundary
Percolation Test Location
EXISTIN
GPO
ND
S
P7
Groundwater Elevation Contour.
Contour Interval = 0.5 feet
Groundwater Elevation in feet above m
ean sea level N
ADV88
1
P1W
ell 02
GROUN
DW
ATER ELEVATION
SSpring, 2016
PON
D C
109AC-FT
PON
D B
67 AC-FT
PON
D D
67 AC-FT
P3P5
P2P9
P6
P8
P4
P10P11
P12
Well 15
P7
PON
D A
64 AC-FT
-7 -6.5-6 -5.5-5 -4.5-4 -3.5-3 -2.5-2 -1.5-1 -0.50 0.51 1.52 2.53 3.54 4.55
Groundwater Flow
Direction
Groundwater Elevation Scale
Not to Scale
12
Novem
ber 2016

APPENDIX B

FIELD LOG
Project Name: City of Lodi White Slough Date: Auger: 4/1/2016, Percolation Test: 4/2/2016
Address: 12751 Thornton Rd, Lodi, CA 95242 Performed By: HS/TS
Groundwater: Groundwater @ 4.7 feet Location: 38.08739 N, 121.39339 W
PI-6’/ GW-I
Sample ID Depth (inches) Description
GW-1-I 0-14 Silty Sand, olive brown, very fine sand, dry (SM)
GW-1-II 14-20 Sandy Silt, brown, very fine sand, dry (ML)
GW-1-III 20-32 Sandy Silt, yellowish brown, fine sand, dry, subrounded (ML)
GW-1-IV 32-54 Sandy Silt with Clay, olive brown, fine sand, dry (ML)
GW-1-V 54-57 Silty Sand, yellowish brown, fine sand, wet (SM) Groundwater @ 4.7 feet / 56.4 inches
GW-1-VI 57-60 Silty Sand, olive brown, fine sand, wet (SM)
GW-1-VII 60- Silty Sand, yellowish brown, medium sand, wet (SM)

FIELD LOG
Project Name: City of Lodi White Slough Date: Auger: 4/1/2016, Percolation Test: 4/2/2016
Address: 12751 Thornton Rd, Lodi, CA 95242 Performed By: HS/TS
Groundwater: Groundwater @ 4.7 feet Location: 38.09147 N, 121.39349 W
P2-5’/ GW-2
Sample ID Depth (inches) Description
GW-2-I 0-6 Clay, black, with very fine sand, dry (CL)
GW-2-II 6-20 Clay, brown, with very fine sand, dry (CL)
GW-2-III 20-52 Silt with Sand, olive brown, very fine sand, dry (ML)
GW-2-IV 52-60 Sandy Silt, olive yellow, very fine, wet (ML) Groundwater @ 4.7 feet / 56.4 inches

FIELD LOG
Project Name: City of Lodi White Slough Date: Auger: 4/2/2016, Percolation Test: 4/5/2016
Address: 12751 Thornton Rd, Lodi, CA 95242 Performed By: HS/TS
Groundwater: Groundwater @ 6.46’ – 6.52’ Location: 38.09410 N, 121.39361 W
P3-7.4’/ GW-3
Sample ID Depth (inches) Description
GW-3-I 0-23 Sandy Silt, olive brown, fine sand, dry (ML)
GW-3-II 23-44 Silty Sand, brown, fine sand, dry (SM)
GW-3-III 44-67 Silty Sand, yellowish brown, fine sand, dry (SM)
GW-3-IV &
GW-3-V
67-79 Clean Sand with some silt, yellowish brown, medium sand, well sorted, moist-wet (SP)/(SM) Groundwater @ 6.46 feet / 77.5 inches
GW-3-VI 79-89 Clay, olive, dry (CL)
GW-3-VII 89- Silt with Sand, olive, wet (ML)

FIELD LOG
Project Name: City of Lodi White Slough Date: Auger: 4/2/2016, Percolation Test: 4/5/2016
Address: 12751 Thornton Rd, Lodi, CA 95242 Performed By: HS/TS
Groundwater: Groundwater @ 4-4.22’ Location: 38.094159 N, 121.400091 W
P4-5’/ GW-4
Sample ID Depth (inches) Description
GW-4-I 0-30 Sandy Silt, olive brown, very fine sand, dry (ML)
GW-4-II 30-53 Sandy Silt, brown, fine sand, drive (ML)
GW-4-III 53-60 Sandy Silt, yellowish brown, fine sand, wet (ML) Groundwater @ 4.22 feet / 50.6 inches
GW-4-IV 60-62 Sandy Silt olive, fine sand, wet (ML)

FIELD LOG
Project Name: City of Lodi White Slough Date: Auger: 4/2/2016, Percolation Test: 4/5/2016
Address: 12751 Thornton Rd, Lodi, CA 95242 Performed By: HS/TS
Groundwater: Groundwater @ 5-5.23’ Location: 38.09410 N, 121.39067 W
P5-6’/ GW-5
Sample ID Depth (inches) Description
GW-5-I 0-23 Sandy Silt, olive brown, very fine sand, dry (ML)
GW-5-II 23-60 Silty Sand, brown, fine sand, dry (SM)
GW-5-III 60-72 Clean Sand with some fines, yellowish brown, medium sand, well sorted, subrounded, wet (SP)/(SM) Groundwater @ 5 feet / 60 inches

FIELD LOG
Project Name: City of Lodi White Slough Date: Auger: 4/2/2016, Percolation Test: 4/5/2016
Address: 12751 Thornton Rd, Lodi, CA 95242 Performed By: HS/TS
Groundwater: Groundwater @ 4.8-5’ Location: 38.08802 N, 121.39025 W
P6-5.3’/ GW-6
Sample ID Depth (inches) Description
GW-6-I 0-20 Sandy Silt, olive brown, very fine sand, dry (ML)
GW-6-II 20-60 Silty Sand, yellowish brown, fine sand, dry (SM)
GW-6-III 60- Clean sand with minor fines, yellowish brown, medium sand, well sorted, subrounded, wet (SP) Groundwater @ 5 feet / 60 inches
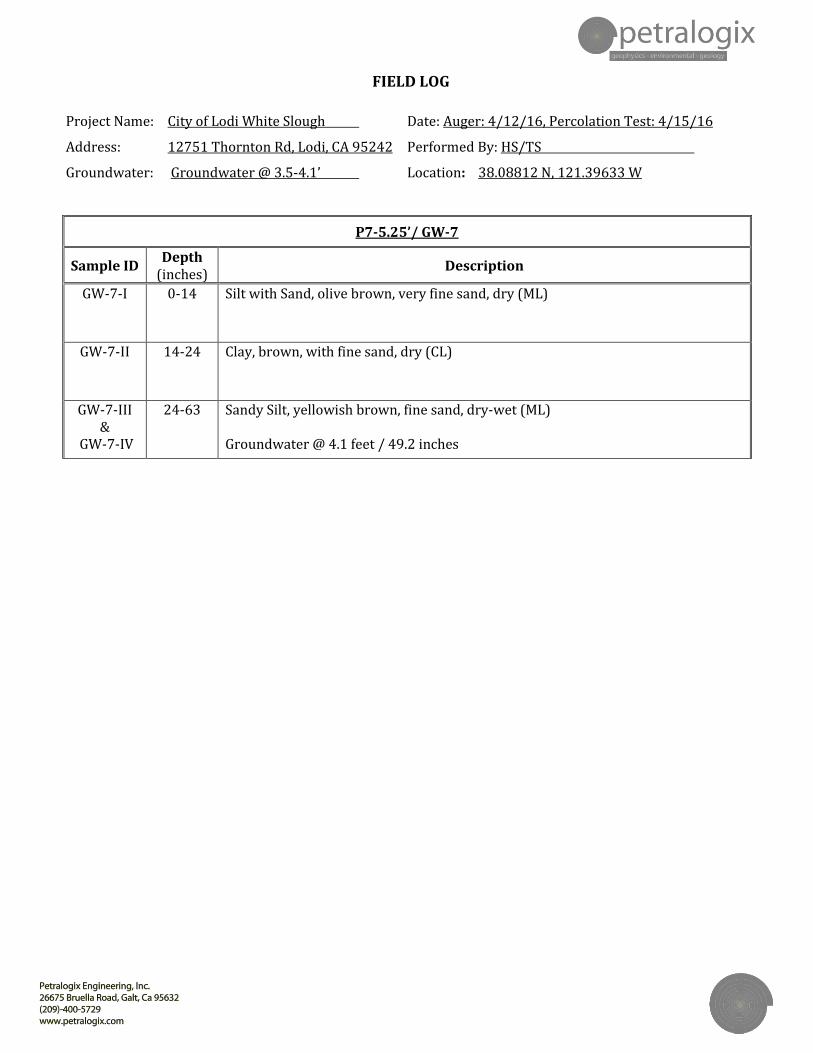
FIELD LOG
Project Name: City of Lodi White Slough Date: Auger: 4/12/16, Percolation Test: 4/15/16
Address: 12751 Thornton Rd, Lodi, CA 95242 Performed By: HS/TS
Groundwater: Groundwater @ 3.5-4.1’ Location: 38.08812 N, 121.39633 W
P7-5.25’/ GW-7
Sample ID Depth (inches) Description
GW-7-I 0-14 Silt with Sand, olive brown, very fine sand, dry (ML)
GW-7-II 14-24 Clay, brown, with fine sand, dry (CL)
GW-7-III &
GW-7-IV
24-63 Sandy Silt, yellowish brown, fine sand, dry-wet (ML) Groundwater @ 4.1 feet / 49.2 inches

FIELD LOG
Project Name: City of Lodi White Slough Date: Auger: 4/12/16, Percolation Test: 4/15/16
Address: 12751 Thornton Rd, Lodi, CA 95242 Performed By: HS/TS
Groundwater: Groundwater @ 3.8-4’ Location: 38.09108 N, 121.39878 W
P8-4.75’/ GW-8
Sample ID Depth (inches) Description
GW-8-I 0-14 Sandy Silt, olive brown, very fine sand, dry (ML)
GW-8-II 14-24 Sandy Silt, light brownish gray, fine sand, dry (ML)
GW-8-III 24-31 Silty Sand, yellowish brown, fine sand, dry (SM)
GW-8-IV 31-47 Silt with Sand, yellowish brown, fine sand, moist (ML)
GW-8-V 47-57 Sandy Silt, olive, fine sand, moist-wet (ML) Groundwater @ 4 ft / 48 inches
GW-8-VI 57- Sandy Silt, olive, fine sand, wet (ML)

FIELD LOG
Project Name: City of Lodi White Slough Date: Auger: 4/12/16, Percolation Test: 4/15/16
Address: 12751 Thornton Rd, Lodi, CA 95242 Performed By: HS/TS
Groundwater: Groundwater @ 2.67-3.1’ Location: 38.09139 N, 121.38995 W
P9-3.58’/ GW-9
Sample ID Depth (inches) Description
GW-9-I &
GW-9-II
0-43 Silt with Sand, olive brown, very fine sand, moist-wet (ML) Groundwater @ 3.1 feet / 37 inches

FIELD LOG
Project Name: City of Lodi White Slough Date: Auger: 5/10/16, Percolation Test: 5/11/16
Address: 12751 Thornton Rd, Lodi, CA 95242 Performed By: HS/TS
Groundwater: Groundwater @ 5.10-5.0’ Location: 38.093181 N, 121.396144 W
P10-5.5’/ GW-10
Sample ID Depth (inches) Description
GW-10-I 0-16 Sandy Silt, olive brown, very fine sand, dry (ML)
GW-10-II 16-20 Silty Sand, brown, fine, dry (SM)
GW-10-III 20-39 Sandy Silt, yellowish brown, fine, dry (ML)
GW-10-IV 39-45 Silty Sand, olive brown, fine, dry (SM)
GW-10-V 45-60 Silty Sand, brown, very fine, dry (SM)
GW-10-VI 60 Silty Sand, brown, fine, dry (SM)
Note: Hardpan/rocks at 30 inches

FIELD LOG
Project Name: City of Lodi White Slough Date: Auger: 5/12/16, Percolation Test: 5/13/16
Address: 12751 Thornton Rd, Lodi, CA 95242 Performed By: HS/TS
Groundwater: Groundwater @ 4.50-4.43’ Location: 38.09065 N, -121.39602 W
P11-5.8’/ GW-11
Sample ID Depth (inches) Description
GW-11-I 0-17 Sandy Silt, olive brown, very fine sand, dry (ML)
GW-11-II 17-23 Silt w/ Sand, olive brown, very fine sand, dry (ML)
GW-11-III 23-35 Sandy Silt, yellowish brown, fine, dry (ML)
GW-11-IV 35-67 Silty Sand, some clay, olive, fine (SM)
Note: Cemented at 17 inches
Cemented chunks at ~38 inches
More clay at 60 inches

FIELD LOG
Project Name: City of Lodi White Slough Date: Auger: 5/12/16, Percolation Test: 5/13/16
Address: 12751 Thornton Rd, Lodi, CA 95242 Performed By: HS/TS
Groundwater: Groundwater @ 4.2-4.05’ Location: 38.08849 N, -121.39567 W
P12-4.5’/ GW-12
Sample ID Depth (inches) Description
GW-12-I 0-20 Sandy silt w/clay, black, dry (ML)
GW-12-II 20-44 Sandy Silt, yellowish brown, very fine, dry (ML)
GW-12-III 44-54 Silty Sand, brown, medium, moist (SM)
Note: Cemented at 4 feet

APPENDIX C
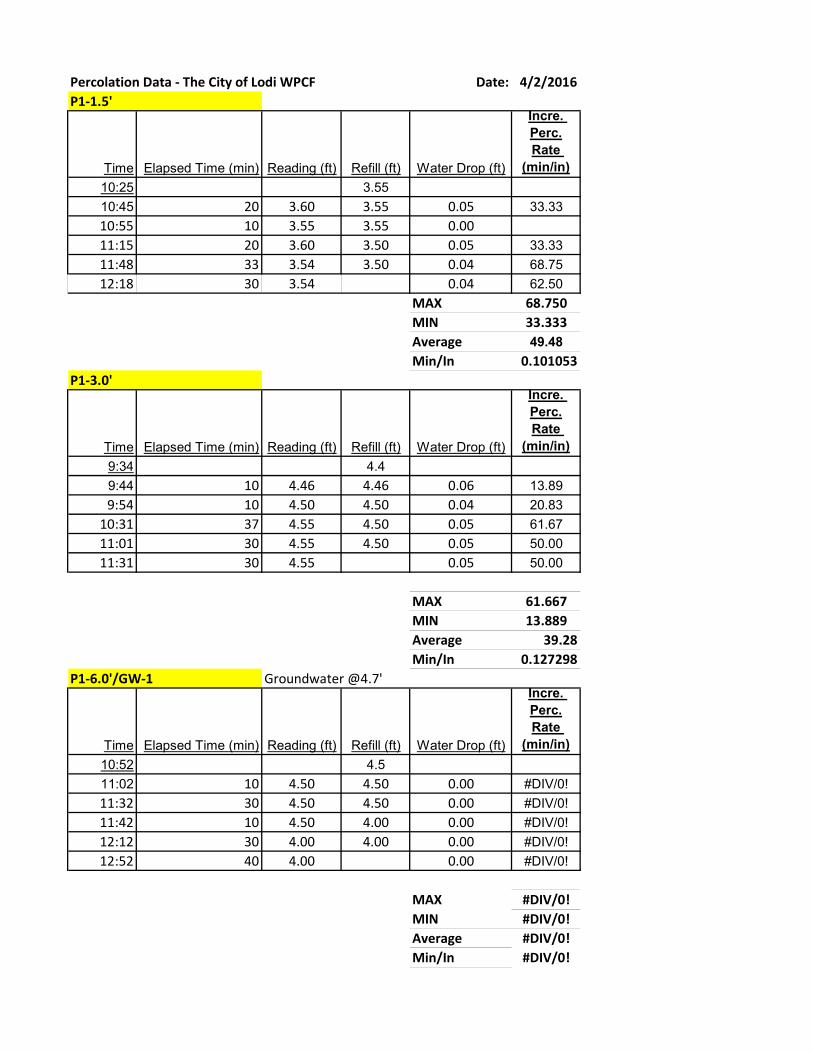
Percolation Data - The City of Lodi WPCF Date: 4/2/2016P1-1.5'
Time Elapsed Time (min) Reading (ft) Refill (ft) Water Drop (ft)
Incre. Perc.Rate
(min/in)10:25 3.5510:45 20 3.60 3.55 0.05 33.3310:55 10 3.55 3.55 0.0011:15 20 3.60 3.50 0.05 33.3311:48 33 3.54 3.50 0.04 68.7512:18 30 3.54 0.04 62.50
MAX 68.750MIN 33.333Average 49.48Min/In 0.101053
P1-3.0'
Time Elapsed Time (min) Reading (ft) Refill (ft) Water Drop (ft)
Incre. Perc.Rate
(min/in)9:34 4.49:44 10 4.46 4.46 0.06 13.899:54 10 4.50 4.50 0.04 20.83
10:31 37 4.55 4.50 0.05 61.6711:01 30 4.55 4.50 0.05 50.0011:31 30 4.55 0.05 50.00
MAX 61.667MIN 13.889Average 39.28Min/In 0.127298
P1-6.0'/GW-1 Groundwater @4.7'
Time Elapsed Time (min) Reading (ft) Refill (ft) Water Drop (ft)
Incre. Perc.Rate
(min/in)10:52 4.511:02 10 4.50 4.50 0.00 #DIV/0!11:32 30 4.50 4.50 0.00 #DIV/0!11:42 10 4.50 4.00 0.00 #DIV/0!12:12 30 4.00 4.00 0.00 #DIV/0!12:52 40 4.00 0.00 #DIV/0!
MAX #DIV/0!MIN #DIV/0!Average #DIV/0!Min/In #DIV/0!

Percolation Data - The City of Lodi WPCF Date: 4/2/2016P2-1.5'
Time Elapsed Time (min) Reading (ft) Refill (ft) Water Drop (ft)Incre. Perc.
Rate (min/in)13:10 3.813:30 20 3.95 3.81 0.15 11.1113:50 20 3.95 3.79 0.14 11.9014:10 20 3.90 0.11 15.15
MAX 15.152MIN 11.111AVE 12.72246272Min/In 0.4
P2-3.4'
Time Elapsed Time (min) Reading (ft) Refill (ft) Water Drop (ft)Incre. Perc.
Rate (min/in)13:00 4.5313:15 15 4.61 4.50 0.08 15.6313:35 20 4.61 4.55 0.11 15.1513:55 20 4.60 4.50 0.05 33.3314:15 20 4.60 0.10 16.67
MAX 33.333MIN 15.152AVE 20.19Min/In 0.247596717
P2-5.0'/GW-2 Groundwater @ 4.7'
Time Elapsed Time (min) Reading (ft) Refill (ft) Water Drop (ft)Incre. Perc.
Rate (min/in)12:45 6.06 5.5713:03 18 5.65 5.55 0.08 18.7513:23 20 5.65 5.65 0.10 16.6713:45 22 5.75 5.55 0.10 18.3314:05 20 5.65 0.10 16.67
MAX 18.750MIN 16.667AVE 17.60Min/In 0.284023669

Percolation Data - The City of Lodi WPCF Date: 4/5/2016P3-1.5'
Time Elapsed Time (min) Reading (ft) Refill (ft) Water Drop (ft)
Incre. Perc.Rate
(min/in)10:47 1.4510:57 10 1.51 1.45 0.06 13.8911:07 10 1.49 1.49 0.04 20.8311:17 10 1.50 1.50 0.01 83.3311:27 10 1.55 1.40 0.05 16.6711:37 10 1.40 1.40 0.0011:57 20 1.45 1.45 0.05 33.3312:17 20 1.52 1.40 0.07 23.8112:37 20 1.47 0.07 23.81
MAX 33.333MIN 23.810AVE 26.984Min/In 0.185
P3-3.0'
Time Elapsed Time (min) Reading (ft) Refill (ft) Water Drop (ft)
Incre. Perc.Rate
(min/in)10:43 2.9110:53 10 2.91 2.91 0.0011:03 10 2.97 2.97 0.06 13.8911:14 11 3.04 2.85 0.07 13.1011:24 10 2.85 2.75 0.0011:45 21 2.86 2.86 0.11 15.9112:05 20 2.93 2.93 0.07 23.8112:25 20 3.00 0.07 23.81
MAX 23.810MIN 15.909AVE 21.176Min/In 0.236

Percolation Data - The City of Lodi WPCF Date: 4/5/2016P3-7.41'/GW-3 Groundwater @6.46-6.52'
Time Elapsed Time (min) Reading (ft) Refill (ft) Water Drop (ft)
Incre. Perc.Rate
(min/in)10:40 7.56 6.9910:50 10 7.40 7.05 0.41 2.0311:00 10 7.43 7.03 0.38 2.1911:10 10 7.39 7.05 0.36 2.3111:20 10 7.45 7.02 0.40 2.0811:30 10 7.40 7.05 0.38 2.1911:40 10 7.38 7.00 0.33 2.5311:50 10 7.40 7.05 0.40 2.0812:00 10 7.45 7.10 0.40 2.0812:10 10 7.50 0.40 2.08
MAX 2.525MIN 2.083AVE 2.231Min/In 2.242

Percolation Data - The City of Lodi WPCF Date: 4/5/2016P4-1.75'
Time Elapsed Time (min) Reading (ft) Refill (ft) Water Drop (ft)
Incre. Perc.Rate
(min/in)10:37 1.310:47 10 1.49 1.30 0.19 4.3910:57 10 1.45 1.30 0.15 5.5611:07 10 1.44 1.31 0.14 5.9511:17 10 1.44 1.31 0.13 6.4111:27 10 1.44 1.32 0.13 6.4111:37 10 1.44 1.29 0.12 6.9411:47 10 1.41 1.32 0.12 6.9411:57 10 1.44 0.12 6.94
MAX 6.944MIN 6.944AVE 6.944Min/In 0.720
P4-3.0'
Time Elapsed Time (min) Reading (ft) Refill (ft) Water Drop (ft)
Incre. Perc.Rate
(min/in)10:35 3.2110:45 10 3.30 3.20 0.09 9.2610:55 10 3.27 3.20 0.07 11.9011:05 10 3.26 3.20 0.06 13.8911:15 10 3.27 3.22 0.07 11.9011:25 10 3.28 3.20 0.06 13.8911:35 10 3.26 3.21 0.06 13.8911:45 10 3.28 3.22 0.07 11.9011:55 10 3.28 0.06 13.89
MAX 13.889MIN 11.905AVE 13.228Min/In 0.378

Percolation Data - The City of Lodi WPCF Date: 4/5/2016P4-5.0'/GW-4 Groundwater @4-4.22'
Time Elapsed Time (min) Reading (ft) Refill (ft) Water Drop (ft)
Incre. Perc.Rate
(min/in)10:30 5.52 5.2510:40 10 5.31 5.26 0.06 13.8910:50 10 5.31 5.25 0.05 16.6711:00 10 5.30 5.24 0.05 16.6711:10 10 5.29 5.23 0.05 16.6711:20 10 5.29 5.20 0.06 13.8911:30 10 5.25 5.25 0.05 16.6711:40 10 5.30 5.26 0.05 16.6711:50 10 5.31 0.05 16.67
MAX 16.667MIN 16.667AVE 16.667Min/In 0.300

Percolation Data - The City of Lodi WPCF Date: 4/5/2016P5-1.5'
Time Elapsed Time (min) Reading (ft) Refill (ft) Water Drop (ft)
Incre. Perc.Rate
(min/in)12:36 1.112:46 10 1.15 1.04 0.05 16.6712:56 10 1.12 1.05 0.08 10.4213:06 10 1.11 1.02 0.06 13.8913:16 10 1.10 1.00 0.08 10.4213:26 10 1.07 1.00 0.07 11.9013:36 10 1.06 1.00 0.06 13.8913:46 10 1.06 1.00 0.06 13.8913:56 10 1.06 0.06 13.89
MAX 13.889MIN 13.889AVE 13.889Min/In 0.360
P5-3.0'
Time Elapsed Time (min) Reading (ft) Refill (ft) Water Drop (ft)
Incre. Perc.Rate
(min/in)12:34 2.312:44 10 2.43 2.40 0.13 6.4112:54 10 2.50 2.36 0.10 8.3313:04 10 2.45 2.33 0.09 9.2613:14 10 2.42 2.37 0.09 9.2613:24 10 2.45 2.41 0.08 10.4213:34 10 2.48 2.43 0.07 11.9013:44 10 2.50 2.39 0.07 11.9013:54 10 2.46 0.07 11.90
MAX 11.905MIN 11.905AVE 11.905Min/In 0.420
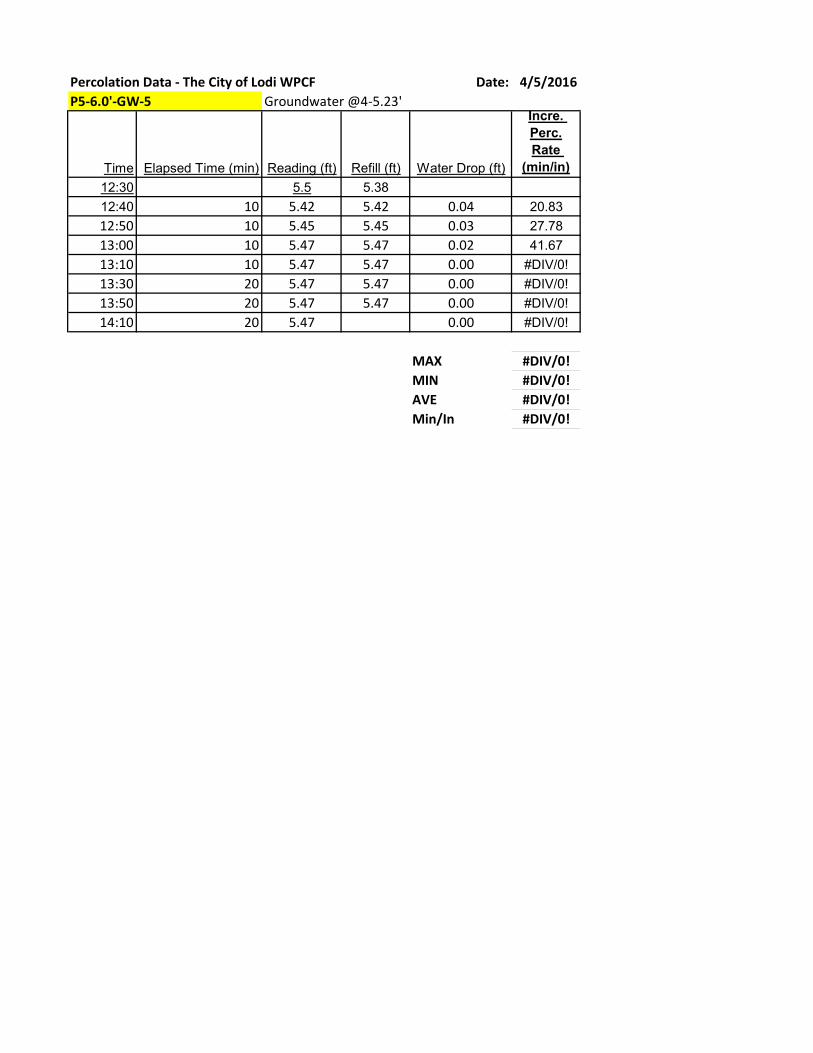
Percolation Data - The City of Lodi WPCF Date: 4/5/2016P5-6.0'-GW-5 Groundwater @4-5.23'
Time Elapsed Time (min) Reading (ft) Refill (ft) Water Drop (ft)
Incre. Perc.Rate
(min/in)12:30 5.5 5.3812:40 10 5.42 5.42 0.04 20.8312:50 10 5.45 5.45 0.03 27.7813:00 10 5.47 5.47 0.02 41.6713:10 10 5.47 5.47 0.00 #DIV/0!13:30 20 5.47 5.47 0.00 #DIV/0!13:50 20 5.47 5.47 0.00 #DIV/0!14:10 20 5.47 0.00 #DIV/0!
MAX #DIV/0!MIN #DIV/0!AVE #DIV/0!Min/In #DIV/0!

Percolation Data - The City of Lodi WPCF Date: 4/5/2016P6-1.5'
Time Elapsed Time (min) Reading (ft) Refill (ft) Water Drop (ft)
Incre. Perc.Rate
(min/in)7:59 3.498:09 10 3.80 3.65 0.31 2.698:19 10 3.82 3.65 0.17 4.908:29 10 3.80 3.60 0.15 5.568:39 10 3.75 3.60 0.15 5.568:49 10 3.75 3.60 0.15 5.568:59 10 3.75 0.15 5.56
MAX 5.556MIN 5.556AVE 5.556Min/In 0.900
P6-3.0'
Time Elapsed Time (min) Reading (ft) Refill (ft) Water Drop (ft)
Incre. Perc.Rate
(min/in)8:00 4.558:10 10 4.60 4.60 0.05 16.678:20 10 4.65 4.65 0.05 16.678:30 10 4.70 4.41 0.05 16.678:40 10 4.45 4.45 0.04 20.838:50 10 4.49 4.49 0.04 20.839:00 10 4.51 4.51 0.02 41.679:10 10 4.55 0.04 20.83
MAX 41.667MIN 20.833AVE 27.778Min/In 0.180

Percolation Data - The City of Lodi WPCF Date: 4/5/2016P6-5.3'/GW-6 Groundwater @4.8-5'
Time Elapsed Time (min) Reading (ft) Refill (ft) Water Drop (ft)
Incre. Perc.Rate
(min/in)7:54 5.848:04 10 6.27 5.77 0.43 1.948:14 10 6.25 5.67 0.48 1.748:24 10 6.05 5.65 0.38 2.198:34 10 6.11 5.75 0.46 1.818:44 10 6.15 5.80 0.40 2.088:54 10 6.17 5.81 0.37 2.259:04 10 6.17 5.80 0.36 2.319:14 10 6.20 5.80 0.40 2.089:24 10 6.11 0.31 2.69
MAX 2.315MIN 2.083AVE 2.217Min/In 2.256

Percolation Data - The City of Lodi WPCF Date: 4/15/2016P7-1.5'
Time Elapsed Time (min) Reading (ft) Refill (ft) Water Drop (ft)
Incre. Perc.Rate
(min/in)14:25 1.2614:45 20 1.45 1.26 0.19 8.7715:05 20 1.40 1.27 0.14 11.9015:25 20 1.35 1.23 0.08 20.8315:45 20 1.31 1.23 0.08 20.8316:05 20 1.31 0.08 20.83
MAX 20.833MIN 20.833AVE 20.833Min/In 0.240
P7-3.0'
Time Elapsed Time (min) Reading (ft) Refill (ft) Water Drop (ft)
Incre. Perc.Rate
(min/in)14:23 3.5614:43 20 3.61 3.61 0.05 33.3315:03 20 3.62 3.62 0.01 166.6715:23 20 3.64 3.64 0.02 83.3315:43 20 3.66 3.66 0.02 83.3316:03 20 3.68 0.02 83.33
MAX 83.333MIN 83.333AVE 83.333Min/In 0.060
P7-5.25'/GW-7 Groundwater @3.5-4.1'
Time Elapsed Time (min) Reading (ft) Refill (ft) Water Drop (ft)
Incre. Perc.Rate
(min/in)14:20 4.3 3.814:40 20 4.00 3.80 0.20 8.3315:00 20 4.05 3.80 0.25 6.6715:20 20 4.00 3.75 0.20 8.3315:40 20 4.00 3.77 0.25 6.6716:00 20 4.02 0.25 6.67
MAX 8.333MIN 6.667AVE 7.222Min/In 0.692

Percolation Data - The City of Lodi WPCF Date: 4/15/2016P8-1.5'
Time Elapsed Time (min) Reading (ft) Refill (ft) Water Drop (ft)
Incre. Perc.Rate
(min/in)12:00 1.2012:10 10 1.45 1.22 0.25 3.3312:20 10 1.42 1.25 0.20 4.1712:30 10 1.45 1.25 0.20 4.1712:40 10 1.45 0.20 4.17
MAX 4.167MIN 4.167AVE 4.167Min/In 1.200
P8-3.42'
Time Elapsed Time (min) Reading (ft) Refill (ft) Water Drop (ft)
Incre. Perc.Rate
(min/in)11:37 3.2511:57 20 3.40 3.25 0.15 11.1112:17 20 3.40 3.15 0.15 11.1112:37 20 3.25 3.20 0.10 16.6712:57 20 3.30 3.20 0.10 16.6713:17 20 3.30 0.10 16.67
MAX 16.667MIN 16.667AVE 16.667Min/In 0.300
P8-4.75'/GW-8 Groundwater @3.8-4'
Time Elapsed Time (min) Reading (ft) Refill (ft) Water Drop (ft)
Incre. Perc.Rate
(min/in)11:35 5.53 5.111:55 20 5.10 5.10 0.00 #DIV/0!12:15 20 5.10 5.10 0.00 #DIV/0!12:35 20 5.10 5.10 0.00 #DIV/0!12:55 20 5.10 0.00 #DIV/0!
MAX #DIV/0!MIN #DIV/0!AVE #DIV/0!Min/In #DIV/0!

Percolation Data - The City of Lodi WPCF Date: 4/15/2016P9-1.58'
Time Elapsed Time (min) Reading (ft) Refill (ft) Water Drop (ft)Incre. Perc.
Rate (min/in)16:50 1.0017:10 20 1.00 1.00 0.0017:30 20 1.03 1.03 0.03 55.5617:50 20 1.06 1.06 0.03 55.5618:10 20 1.09 0.03 55.56
MAX 55.556MIN 55.556AVE 55.556Min/In 0.090
P9-3'
Time Elapsed Time (min) Reading (ft) Refill (ft) Water Drop (ft)Incre. Perc.
Rate (min/in)16:49 2.7317:09 20 2.75 2.75 0.02 83.3317:29 20 2.77 2.66 0.02 83.3317:49 20 2.70 2.70 0.04 41.6718:09 20 2.74 2.74 0.04 41.6718:29 20 2.78 0.04 41.67
MAX 41.667MIN 41.667AVE 41.667Min/In 0.120
P9-3.28''/GW-9 Groundwater @2.67-3.1'
Time Elapsed Time (min) Reading (ft) Refill (ft) Water Drop (ft)Incre. Perc.
Rate (min/in)16:45 4.07 3.5517:05 20 4.05 3.55 0.50 3.3317:25 20 4.05 3.55 0.50 3.3317:45 20 4.05 0.50 3.33
MAX 3.333MIN 3.333AVE 3.333Min/In 1.500

APPENDIX D

Perimeter Length (ft)
Average water ags (ft)*
Slope Length (ft)
Slope Surface Area (ft^2)
Perimeter Length (ft)Average water
ags (ft)*Slope Length
(ft)Slope Surface Area
(ft^2)Perimeter Length (ft)
Average water ags (ft)*
Slope Length (ft)Slope Surface
Area (ft^2)Perimeter Length
(ft)
Average water ags
(ft)*Slope Length
(ft)Slope Surface
Area (ft^2)1830
5.1211.43
209181620
4.419.85
159571700
4.359.71
165072430
5.1511.51
27966
*Average ground surface elevation at perimeter wall after excavation subtracted by water depth of 6 feet. ags = above ground surfacePerimeter = Outer Perimeter of Pond
Perimeter Length (ft)
Pond Bottom Average bgs (ft)
Slope Length (ft)
Surface Area (ft^2)
Perimeter Length (ft)Pond Bottom
Average bgs (ft)Slope Length
(ft)Surface Area
(ft^2)Perimeter Length (ft)
Pond Bottom Average bgs (ft)
Slope Length (ft)Surface Area
(ft^2)Perimeter Length
(ft)Pond Bottom Average bgs
(ft)Slope Length
(ft)Surface Area
(ft^2)
18300.88
1.973604
16201.59
3.555751
17001.65
3.696273
24300.85
1.894596
Length (ft)W
idth (ft)Surface Area (ft^2)
GSE (ft msl)Length (ft)
Width (ft)
Surface Area (ft^2)
GSE (ft msl)Length (ft)
Width (ft)
Surface Area (ft^2)
GSE (ft msl)Length (ft)
Width (ft)
Surface Area (ft^2)
GSE (ft msl)830
610 506,300
5.6830
790 655,700
6.3820
1050 861,000
5.5820
730 598,600
4.9
Length (ft)W
idth (ft)Surface Area (ft^2)
Length (ft)W
idth (ft)Surface Area (ft^2)
Length (ft)W
idth (ft)Surface Area (ft^2)
830330
136950820
330 135,300
820330
135,300
Average bgs (ft)
Average Base Elevation (ft)
Lowest Anticipated GW
Elevation (ft)
Depth to GW (ft)
Average bgs (ft)Average Base Elevation (ft)
Lowest Anticipated GW
Elevation (ft)
Depth to GW (ft)
Average bgs (ft)
Average Base Elevation (ft)
Lowest Anticipated GW
Elevation (ft)
Depth to GW (ft)
Average bgs (ft)Average Base Elevation (ft)
Lowest Anticipated GW
Elevation (ft)
Depth to GW
(ft)0.88
4.72-0.25
4.971.59
4.71-0.78
5.491.65
3.88-0.1
3.980.85
4.02-0.57
4.59
Specific yield for silt
Material Volume (ft^3)
Volume Water
Drained (ft^3)Volume W
ater Drained (gal)
Specific yield for siltMaterial Volume (ft^3)
Volume Water
Drained (ft^3)Volume W
ater Drained (gal)
Specific yield for silt
Material Volume (ft^3)
Volume Water
Drained (ft^3)Volume W
ater Drained (gal)
Specific yield for silt
Material Volume (ft^3)
Volume Water
Drained (ft^3)Volume W
ater Drained (gal)
0.183,195,715
575,229
4,302,711
0.18
3,600,055
648,010
4,847,114
0.183,966,296
713,933
5,340,221
0.18
3,368,472
606,325
4,535,311
Groundwater depth recorded in April 2016
FS Range4
7TOTAL
CF 4CF 7
TOTALCF 4
CF 7Pond A
113,618
28,404
16,231
45,773,261
11,443,315
6,539,037
Pond B115,002
28,750
16,429
46,822,682
11,705,670
6,688,955
71,747.10
125,557.43
Pond C
141,662
35,415
20,237
57,046,726
14,261,681
8,149,532
Pond D131,949
32,987
18,850
52,696,539
13,174,135
7,528,077
28,905,601 50,584,802
TOTALS
502,229.72 125,557
71,747.10 202,339,207
50,584,802 28,905,601
PERCOLATIO
N CALCULATIONS
PERIMETER D
IMEN
SION
S
PERCOLATIO
N
PON
D B
PERIMETER D
IMEN
SION
S
PERCOLATIO
N
GAL/DAY
GAL/YEAR
GALLON
S PER YEAR 42,404
15,477,379
Average Percolation of Excavated Soil (gpd/ft^2)
Average Percolation of Exacated Soil after 80%
Reduction 13.3
2.66GPD
GALLON
S PER YEAR 55,587
$ 20,289,078.21
Average Percolation of Excavated Soil (gpd/ft^2)
13.3
Average Percolation of Exacated Soil after 80%
Reduction 2.66
GPD
GROU
ND
SURFACE TO PO
ND
BOTTO
M
GALLON
S PER YEAR 74,318
27,125,899
TOP O
F PON
D W
ATER TO GRO
UN
D SU
RFACE
Average Percolation of Excavated Soil (gpd/ft^2)
Average Percolation of Exacated Soil after 80%
Reduction 13.3
2.66
PON
D D
PERIMETER D
IMEN
SION
S
PERCOLATIO
N
GPDGALLO
NS PER YEAR
43,865 16,010,767
Average Percolation of Excavated Soil (gpd/ft^2)
Average Percolation of Exacated Soil after 80%
Reduction (gpd/ft^2)13.3
2.66
PON
D C
PERIMETER D
IMEN
SION
S
PERCOLATIO
N
GPD
PON
D A
Percolation Test Hole
P4P10
Average
Percolation Rate at 1.5 ft (gpd/ft^2)
9.922.3
16.1
PON
D B
PERIMETER D
IMEN
SION
S
PERCOLATIO
N
PON
D A
PON
D C
PERIMETER D
IMEN
SION
S
PERCOLATIO
N
Percolation Test Hole
Percolation Rate at 1.5 ft (gpd/ft^2)
P24.5
P8P10
22.3
PERIMETER D
IMEN
SION
S
PERCOLATIO
N
Percolation Test Hole
Percolation Rate at 1.5 ft (gpd/ft^2)
P32.9
16.6P11
25.7
GPDGALLO
NS PER YEAR
3.3P12
33.2
GPDGALLO
NS PER YEAR
Average15.6
PON
D D
PERIMETER D
IMEN
SION
S
PERCOLATIO
N
Percolation Test Hole
Percolation Rate at 1.5 ft (gpd/ft^2)
P11.1
P7
21,035,328
Average12.5
57,631 GPD
GALLON
S PER YEAR 58,031
21,181,472 97,797
35,695,738 72,598
26,498,189
Average12.6
GPDGALLO
NS PER YEAR
PON
D BASE TO
GROU
ND
WATER
PON
D D
IMEN
ION
S (2)
PERCOLATIO
N
DEPTH
TO GRO
UND
WATER 16.1
P32.9
P10P1
1.1P7
3.3
GALLON
S PER YEAR 4,302,711
TIME (days)
0.42
PON
D D
IMEN
ION
S (2)
PERCOLATIO
NPercolation Test H
olePercolation Rate at 1.5 ft
SPECIFIC YIELD
Percolation Test Hole
Percolation Rate at 1.5 ft P4
9.9P10
22.3
Average
SPECIFIC YIELD
GALLON
S PER YEARTIM
E (days) 4,847,114
0.59
N/A
22.3
Average12.6
DEPTH
TO GRO
UND
WATER
GALLON
S PER YEARTIM
E (days)
P24.5
P816.6
P1125.7
PON
D D
IMEN
ION
S (2)
PERCOLATIO
NPercolation Test H
olePercolation Rate at 1.5 ft
Average15.6
DEPTH
TO GRO
UND
WATER
SPECIFIC YIELD
TOTAL GPD
TOTAL GAL/YEAR
TOTAL GAL/YEAR W
/ FS RAN
GE
TOTAL GPD
W/ FS RAN
GE502,230
202,339,207
TOTALS
PON
D D
IMEN
ION
S (2)
PERCOLATIO
NPercolation Test H
olePercolation Rate at 1.5 ft
DEPTH
TO GRO
UND
WATER
4,535,311 0.49
SPECIFIC YIELD
GALLON
S PER YEARTIM
E (days)
P1233.2
Average12.5
5,340,221 0.34

Pond ALength (ft)
Width (ft)
Area (ft^2)Area (acres)
West W
all (feet)North W
all (feet)O
utside Perimter (feet)
Excavation Average bgs (ft)830
610506300
11.62890
9401830
0.88830
330136950
3.14643,250.00
14.77
Pond BLength (ft)
Width (ft)
Area (ft^2)Area (acres)
East Wall (feet)
North Wall (feet)
Outside Perim
ter (feet)Excavation Average bgs (ft)
830790
65570015.05
830790
16201.59
655,700.00
15.05
Pond CLength (ft)
Width (ft)
Area (ft^2)Area (acres)
West W
all (feet)East W
all (feet)O
utside Perimter (feet)
Excavation Average bgs (ft)820
1050861000
19.77880
8201700
1.65820
330135300
3.11996,300.00
22.87
Pond DLength (ft)
Width (ft)
Area (ft^2)Area (acres)
West W
all (feet)East W
all (feet)South W
all (feet)O
utside Perimter (feet)
Excavation Average bgs (ft)820
730598600
13.74880
820730
24300.85
820330
1353003.11
733,900.00
16.85
Area (acres)Pond A
14.77Pond B
15.05Pond C
22.87Pond D
16.85TO
TAL69.54
Total Area
Total Area
Total Area
Total Area
POND DIMENSIONS

Estimated Lowest GW Elevation (msl) Plant DatumNADV88
Estimated Lowest GW Elevation (msl) Plant DatumNADV88
Estimated Lowest GW Elevation (msl) Plant DatumNADV88
Estimated Lowest GW Elevation (msl) Plant DatumNADV88
LOWEST GROUNDWATER ELEVATIONS
-0.57
Pond A
-2.15-0.25
Pond B
-2.68-0.78
Pond C
-2-0.1
Pond D
-2.47

GSE Feet (msl) NADV88
P1 4.7 6 4.1 -0.6 1.3P2 4.7 6.9 5 0.3 2.2P3 6.46 8 6.1 -0.36 1.54P4 4 6.6 4.7 0.7 2.6P5 5 5 3.1 -1.9 0P6 4.8 4 2.1 -2.7 -0.8P7 3.5 4 2.1 -1.4 0.5P8 3.8 5.1 3.2 -0.6 1.3P9 2.67 5 3.1 0.43 2.33
P10 5.1 4.6 2.7 -2.4 -0.5P11 4.5 4.6 2.7 -1.8 0.1P12 4.2 4.6 2.7 -1.5 0.4
NW Well WSM 15 5.27 4.6 2.7 -2.57 -0.67SE Well WSM 02 7.1 5 3.1 -4 -2.1
*Ground Surface Elevation Estimated based on WYA Draft Pond Plans, using the Plant Datum**Draft Pond Plans have existing spot elevations based on Plant Datum***Plant datum is NADV88 - 1.9 feet****Well data has been altered from NADV88 to Plant Datum
GROUNDWATER ELEVATIONS BASED ON PERCOLATION LOCATIONS
Percolation Locations Depth to GW (ft)GSE Feet (msl)* Plant
Datum
GW Elevation Feet (msl) Plant
Datum
GW Elevation Feet (msl) NADV88
Datum


