Appendix F: Vulnerability to Catastrophic Interruption of ...
49
Appendix F: Vulnerability to Catastrophic Interruption of Water Supply and Disaster Preparedness
Transcript of Appendix F: Vulnerability to Catastrophic Interruption of ...

Appendix F: Vulnerability to Catastrophic Interruption of Water Supply and Disaster Preparedness

This page intentionally left blank.

U P P E R S A N T A A N A I N T E G R A T E D R E S O U R C E S W A T E R M A N A G E M E N T P L A N A P P E N D I X F – V U L N E R A B I L I T Y T O C A T A S T R O P H I C I N T E R R U P T I O N O F W A T E R S U P P L Y
A N D D I S A S T E R P R E P A R E D N E S S
( P A R T I A L R E V I S I O N 1 / 5 / 2 0 1 5 )
Table of Contents
1 Background 1
2 Evaluation of a Catastrophic Interruption to Regional Facilities 3
2.1 Facility Evaluation 3 2.2 Findings and Recommendations 9
2.2.1 Alternative Local Supplies 9 2.2.2 Increased Groundwater Production Capacity and Reliability 11 2.2.3 Alternative Conveyance of Surface Water 11 2.2.4 Additional Surface Storage 11
3 Vulnerability of Region’s Water Supply System to SWP Supply Interruption 13
3.1 Valley District SWP Deliveries 13 3.2 Overview of Known Earthquake Vulnerabilities of State Water Project 13
3.2.1 California Division of Mines and Geology Planning Scenarios 13 3.2.2 Seismic Risk Analysis for California State Water Project –
Reach C 14 3.3 Finding and Recommendations 15
3.3.1 Pipeline Redundancy 15 3.3.2 Recharge with SWP Water when it is Available 15 3.3.3 Surface Storage in the Region 16 3.3.4 Exchange and Banking Program Utilizing Santa Ana River
Water 16
4 Vulnerabilities of Local Purveyors Water Supply System to an Earthquake in the Region 17
4.1 Overview of Known Earthquake Vulnerabilities of Purveyor’s Systems 17 4.1.1 San Bernardino Municipal Water Department 17 4.1.2 East Valley Water District 17 4.1.3 West Valley Water District 18 4.1.4 Yucaipa Valley Water District 18 4.1.5 City of Redlands 19 4.1.6 Fontana Water Company 19 4.1.7 City of Rialto 19
4.2 Findings and Recommendations 20
F-i
U P P E R S A N T A A N A I N T E G R A T E D R E S O U R C E S W A T E R M A N A G E M E N T P L A N A P P E N D I X F – V U L N E R A B I L I T Y T O C A T A S T R O P H I C I N T E R R U P T I O N O F W A T E R S U P P L Y
A N D D I S A S T E R P R E P A R E D N E S S
( P A R T I A L R E V I S I O N 1 / 5 / 2 0 1 5 )
5 Summary of Findings and Recommendations 21
5.1 Findings 21 5.2 Recommendations for Disaster Preparedness 24
5.2.1 General Recommendations 24 5.2.2 Proposed Projects to Provide Conveyance System Redundancies
for the Regional Facilities 25 5.3 Alternative Local Supplies 25
5.3.1 Interties between Purveyors 25 5.3.2 Big Bear Lake 26 5.3.3 Increased Groundwater Production Capacity and Reliability 26
5.4 Alternative Conveyance of Surface Water 27 5.4.1 Alternatives to Foothill Pipeline System 27 5.4.2 Alternatives to the Lytle Pipeline 27 5.4.3 Alternatives to Baseline Feeder System 27
5.5 Back-Up Power Supplies 28 5.5.1 Power Supplies for Groundwater Wells 28 5.5.2 Back-Up Power Supplies for Other Water Supply Facilities: 28
6 Water Shortage Contingency Plan 29
6.1 Stage I Conservation – Additional 20% Reduction 29 6.2 Stage II Conservation – Additional 35% Reduction 30 6.3 Stage III Conservation – Additional 50% Reduction 31
References 32
Attachment 1 – Earthquake Literature Search
J:\San Bernardino Valley MWD\Project\054510 Valley District Upper Santa Ana IRWMP\Admin Report\Appendices\Appendix F\Vulnerability of the Region to Catastrophic Interruption of Water Supply System.doc
F-ii
U P P E R S A N T A A N A I N T E G R A T E D R E S O U R C E S W A T E R M A N A G E M E N T P L A N A P P E N D I X F – V U L N E R A B I L I T Y T O C A T A S T R O P H I C I N T E R R U P T I O N O F W A T E R S U P P L Y A N D
D I S A S T E R P R E P A R E D N E S S
( P A R T I A L R E V I S I O N 1 / 5 / 2 0 1 5 )
1 Background
This appendix addresses vulnerability of the region’s water supply system to catastrophic events that may interrupt the water supply system in the Upper Santa Ana IRWM Plan Region (region). California Water Code Section 10632 (c) requires that Urban Water Management Plans address catastrophic supply interruptions. While not the only cause for catastrophic water supply interruption, the postulated Magnitude 8+ Earthquake certainly will be the predominant example in the region. Since a large magnitude earthquake is generally considered the most significant event for the region, we will concentrate on earthquake effects as our primary water supply interruption, knowing that other events would be treated similarly. Literature to be reviewed includes post-earthquake surveys of water system damage, earthquake planning reports, purveyor’s Urban Water Management Plans and available reports prepared by the Department of Water Resources. We have concentrated the following discussions with a magnitude 8+ earthquake. Other catastrophic interruptions caused by regional power failure, terrorist attack, or other man-made or natural catastrophic event could cause similar conditions and issues to water supply systems in the region. For purposes of this report, a major earthquake is defined as an earthquake on the San Andreas Fault (SAF) on the order of 8.0.1
The work conducted for this appendix is intended to be the first step and is at the conceptual level. Additional detailed work should be conducted in the future to further evaluate options to effectively address water supply system vulnerabilities. This appendix includes the discussion of the following:
• An earthquake literature search of major earthquake events and what has been learned from such events.
• Evaluation of Catastrophic interruption of the regional facilities
• Vulnerabilities of region’s water supply system to SWP supply interruption.
• Vulnerably of local purveyors’ system to an earthquake .
• Summary of Finding and Recommendations including Water Shortage Contingency Plan
1 The California Division of Mines and Geology has prepared two “Planning Scenarios” for major earthquakes in southern California. The first was a Magnitude 8.3 Earthquake on the San Andreas Fault (California, 1982). The second was a magnitude 7 earthquake on the San Bernardino Valley segment of the San Jacinto Fault (California, 1993).
F-1

U P P E R S A N T A A N A I N T E G R A T E D R E S O U R C E S W A T E R M A N A G E M E N T P L A N A P P E N D I X F – V U L N E R A B I L I T Y T O C A T A S T R O P H I C I N T E R R U P T I O N O F W A T E R S U P P L Y A N D
D I S A S T E R P R E P A R E D N E S S
( P A R T I A L R E V I S I O N 1 / 5 / 2 0 1 5 )
• Options to reduce the impacts in case of catastrophic water supply system failure.
• Water Shortage contingency planning.
The region is located in a seismically active area of Southern California. Four major fault zones are found in the region, including the San Jacinto Fault, the Chino-Corona segment of the Elsinore Fault, the Cucamonga Fault, and the San Andreas Fault (SAF). Numerous other minor faults associated with these larger fault structures may also present substantial hazards.
The SAF is a right-lateral strike-slip fault that runs approximately 800 miles through western and southern California. The fault marks a transform boundary between the Pacific Tectonic Plate and the North American Tectonic Plate.
In Southern California, the SAF runs along the southern base of the San Bernardino Mountains, crosses through Cajon Pass, and continues northwest along the northern base of the San Gabriel Mountains. Historical records indicate that massive earthquakes have occurred in the central section of the SAF in 1857 and in the northern section in 1906 (the San Francisco Earthquake). In 1857, an estimated magnitude 8+ earthquake occurred on the San Andreas Fault rupturing the ground for 200 to 275 miles, from near Cholame to Cajon Pass and possibly as far south as San Gorgonio Pass. The recurrence interval for a magnitude 8 earthquake along the total length of the fault is estimated to be between 50 and 200 years. It has been 147 years since the 1857 rupture. A study completed by Yuri Fialko (2005) suggests that the SAF in Southern California has been stressed to a level sufficient for an earthquake of magnitude 7.0 or greater.
A detailed earthquake-related literature search was conducted to prepare this report. The literature search included review of the following events and reports:
• Loma Prieta Earthquake of October 17, 1989
• Northridge Earthquake of January 17, 1994
• Santa Clara Valley Water District Water Infrastructure Reliability Project
• San Simeon Earthquake of December 22, 2003
• Denali Earthquake of November 3, 2002
• City of San Diego Water Supply Study
• City of Vancouver Regional Water Distribution System Study
• San Fernando Earthquake of 1971
• Kobe (Japan) Earthquake of January 17, 1995
• California Division of Mines and Geology Planning Scenarios
Attachment A summarized this literature search.
F-2

U P P E R S A N T A A N A I N T E G R A T E D R E S O U R C E S W A T E R M A N A G E M E N T P L A N A P P E N D I X F – V U L N E R A B I L I T Y T O C A T A S T R O P H I C I N T E R R U P T I O N O F W A T E R S U P P L Y A N D
D I S A S T E R P R E P A R E D N E S S
( P A R T I A L R E V I S I O N 1 / 5 / 2 0 1 5 )
2 Evaluation of a Catastrophic Interruption to Regional Facilities
The California Aqueduct has been designed to “break” at the Devil Canyon Powerplant in a large earthquake.
Some of Valley District’s pipelines cross the San Andreas Fault. This section evaluates the impact of a catastrophic interruption on Valley District’s regional facilities used to convey SWP water supplies and specific actions that may be taken to minimize the impact on water deliveries.
2.1 Facility Evaluation The individual facilities that were examined in this analysis are as follows:
Foothill Pipeline
Santa Ana River Connector (SARC) Pipeline
Greenspot Pump Station
Morton Canyon Connector
Greenspot Pipeline
Tate Pump Station
Crafton Hills Pump Station
Crafton Hills Reservoir
Crafton Hills Pipeline, portion of EBX
Yucaipa Pipeline
Bryant Street Pipeline
Lytle Pipeline
Baseline Feeder System
Given a loss of each of the above facilities, the examination will include:
How the water supply needs of the affected service area could be met.
To what degree local groundwater and/or surface water can replace the loss of the SWP
What projects would be required to mitigate the loss of the facility.
F-3

U P P E R S A N T A A N A I N T E G R A T E D R E S O U R C E S W A T E R M A N A G E M E N T P L A N A P P E N D I X F – V U L N E R A B I L I T Y T O C A T A S T R O P H I C I N T E R R U P T I O N O F W A T E R S U P P L Y A N D
D I S A S T E R P R E P A R E D N E S S
( P A R T I A L R E V I S I O N 1 / 5 / 2 0 1 5 )
What projects could be implemented to mitigate the impact of catastrophic failures of these facilities.
Figure AF-1 shows the location of Valley District’s major facilities relative to fault lines.
In general, Valley District direct deliveries are to surface water treatment plants that were built to treat local surface water and SWP water. Local surface water, collected and conveyed by the purveyor’s own system is the least costly and highest quality. Valley District’s SWP deliveries supplement these supplies.
Valley District also makes direct deliveries for irrigation. These deliveries are assumed to be able to be suspended during severe events and will not be investigated further.
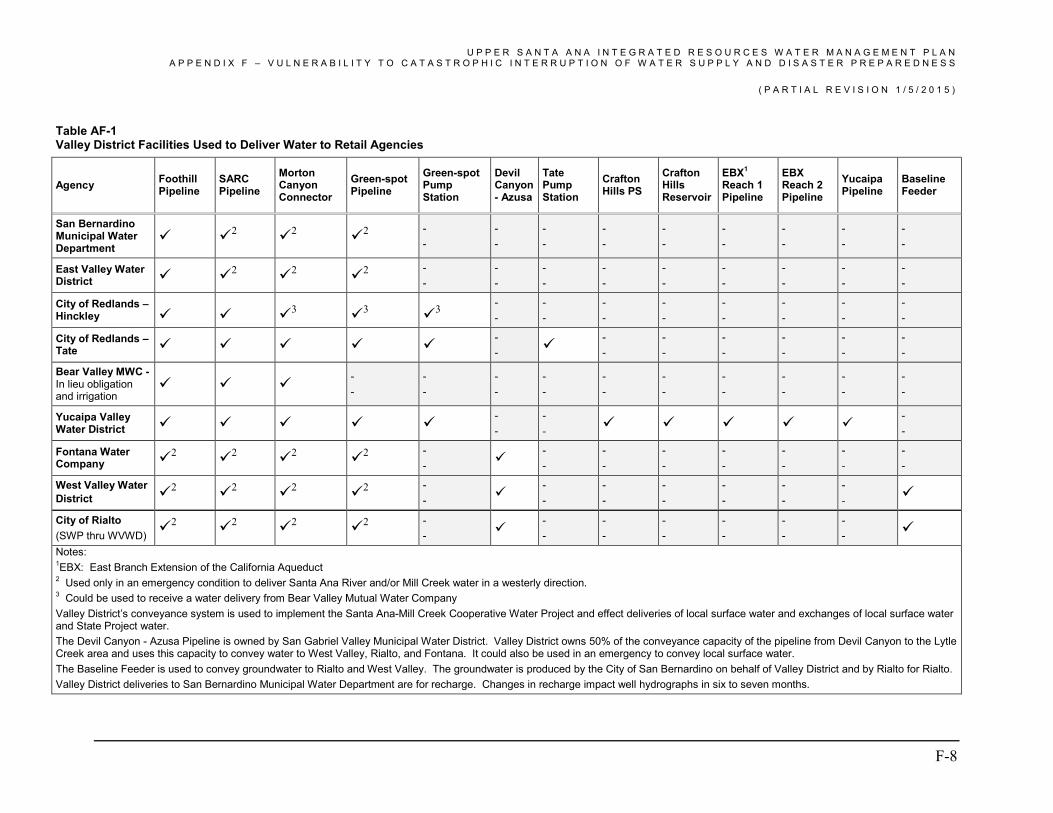
Table AF-1 shows the Valley District conveyance facilities and the surface water treatment plants that receive deliveries of imported and surface water from those facilities. This table shows how interruption in each of the Valley District facilities may impact water deliveries for the local purveyors. Valley District’s conveyance system is used to implement the Santa Ana-Mill Creek Cooperative Water Project and effect deliveries of local surface water and exchanges of local surface water and SWP water. Furthermore, these facilities could be used to convey local surface water from the Santa Ana River and/or Mill Creek in the east to delivery points in the west along the Lytle Creek Pipeline. In the past, Valley District has demonstrated this capability by delivering local surface water from the Santa Ana River to Devil Canyon where it was transferred to Metropolitan Water District of Southern California and conveyed to the Weymouth Water Filtration Plant.
It should also be mentioned that the California Division of Mine and Geology planning scenario for a major earthquake on the San Jacinto Fault concludes that the Santa Ana Valley (a SWP facility) Pipeline will also be damaged extensively as the fault and pipeline cross several times. Since Valley District does not have any current delivery points along this pipeline, it is not considered in this analysis.
F-4

U P P E R S A N T A A N A I N T E G R A T E D R E S O U R C E S W A T E R M A N A G E M E N T P L A N A P P E N D I X F – V U L N E R A B I L I T Y T O C A T A S T R O P H I C I N T E R R U P T I O N O F W A T E R S U P P L Y A N D D I S A S T E R P R E P A R E D N E S S
( P A R T I A L R E V I S I O N 1 / 5 / 2 0 1 5 )
Figure F-1 Water Supply Infrastructure and Faults
F-5

U P P E R S A N T A A N A I N T E G R A T E D R E S O U R C E S W A T E R M A N A G E M E N T P L A N A P P E N D I X F – V U L N E R A B I L I T Y T O C A T A S T R O P H I C I N T E R R U P T I O N O F W A T E R S U P P L Y A N D D I S A S T E R P R E P A R E D N E S S
( P A R T I A L R E V I S I O N 1 / 5 / 2 0 1 5 )
F-6

U P P E R S A N T A A N A I N T E G R A T E D R E S O U R C E S W A T E R M A N A G E M E N T P L A N A P P E N D I X F – V U L N E R A B I L I T Y T O C A T A S T R O P H I C I N T E R R U P T I O N O F W A T E R S U P P L Y A N D D I S A S T E R P R E P A R E D N E S S
( P A R T I A L R E V I S I O N 1 / 5 / 2 0 1 5 )
NOTE: Arrows indicate the primary flow direction. In some cases, water can also flow in the opposite direction, in an emergency, for short durations.
Yucaipa Pipeline
Bear Valley Highline @ Boulion Box
SWP EBX
Santa Ana Valley
Pipeline MWDSC
Inland Feeder
Delivery to SBVMWD
Crafton Hills PS
Crafton Hills
Reservoir
Morton Canyon Connector I
Cone Camp Road Intertie
Fontana WTP
West Valley WTP
East Valley WTP
Northfork Irrigation
Bear Valley
Highline
Hinkley WTP via Redlands Aqueduct
Greenspot Grove
Yucaipa Regional Park
Tate WTP
Yucaipa Irrigation
Yucaipa WTP
Devil Canyon Afterbay
Tate PS
Lytle Pipeline
California Aqueduct
Foothill Pipeline
Greenspot PS
Greenspot Pipeline
Figure 2 VALLEY DISTRICT Delivery Point
Mentone Reservoir
via Redlands Aqueduct
Crafton Reservoir
Delivery to San Gorgonio
Baseline Feeder
West Valley
Storage
Rialto Storage and Distribution
System
Sweetwater SG Badger SG Waterman SG East Twin Creek SG Patton SG City Creek SG
SAR SG
Mill Creek SG
Mill Creek SG
Mill Creek SG
F-7
U P P E R S A N T A A N A I N T E G R A T E D R E S O U R C E S W A T E R M A N A G E M E N T P L A N A P P E N D I X F – V U L N E R A B I L I T Y T O C A T A S T R O P H I C I N T E R R U P T I O N O F W A T E R S U P P L Y A N D D I S A S T E R P R E P A R E D N E S S
( P A R T I A L R E V I S I O N 1 / 5 / 2 0 1 5 )
Table AF-1 Valley District Facilities Used to Deliver Water to Retail Agencies
Agency Foothill Pipeline
SARC Pipeline
Morton Canyon Connector
Green-spot Pipeline
Green-spot Pump Station
Devil Canyon - Azusa
Tate Pump Station
Crafton Hills PS
Crafton Hills Reservoir
EBX1 Reach 1 Pipeline
EBX Reach 2 Pipeline
Yucaipa Pipeline
Baseline Feeder
San Bernardino Municipal Water Department
2 2 2 - -
- -
- -
- -
- -
- -
- -
- -
- -
East Valley Water District 2 2 2 -
- - -
- -
- -
- -
- -
- -
- -
- -
City of Redlands – Hinckley 3 3 3
- -
- -
- -
- -
- -
- -
- -
- -
City of Redlands – Tate -
- - -
- -
- -
- -
- -
- -
Bear Valley MWC - In lieu obligation and irrigation
- -
- -
- -
- -
- -
- -
- -
- -
- -
- -
Yucaipa Valley Water District -
- - -
- -
Fontana Water Company 2 2 2 2 -
- - -
- -
- -
- -
- -
- -
- -
West Valley Water District 2 2 2 2 -
- - -
- -
- -
- -
- -
- -
City of Rialto (SWP thru WVWD)
2 2
2 2
- -
- -
- -
- -
- -
- -
- -
Notes: 1EBX: East Branch Extension of the California Aqueduct 2 Used only in an emergency condition to deliver Santa Ana River and/or Mill Creek water in a westerly direction. 3 Could be used to receive a water delivery from Bear Valley Mutual Water Company Valley District’s conveyance system is used to implement the Santa Ana-Mill Creek Cooperative Water Project and effect deliveries of local surface water and exchanges of local surface water and State Project water. The Devil Canyon - Azusa Pipeline is owned by San Gabriel Valley Municipal Water District. Valley District owns 50% of the conveyance capacity of the pipeline from Devil Canyon to the Lytle Creek area and uses this capacity to convey water to West Valley, Rialto, and Fontana. It could also be used in an emergency to convey local surface water. The Baseline Feeder is used to convey groundwater to Rialto and West Valley. The groundwater is produced by the City of San Bernardino on behalf of Valley District and by Rialto for Rialto. Valley District deliveries to San Bernardino Municipal Water Department are for recharge. Changes in recharge impact well hydrographs in six to seven months.
F-8

U P P E R S A N T A A N A I N T E G R A T E D R E S O U R C E S W A T E R M A N A G E M E N T P L A N A P P E N D I X F – V U L N E R A B I L I T Y T O C A T A S T R O P H I C I N T E R R U P T I O N O F W A T E R S U P P L Y
A N D D I S A S T E R P R E P A R E D N E S S
( P A R T I A L R E V I S I O N 1 / 5 / 2 0 1 5 )
2.2 Findings and Recommendations Table AF-1 summarizes the Valley District facilities which purveyors utilize. This table also includes Valley District facilities that could be used to make other deliveries in an emergency situation. Table AF-1 shows that all purveyors listed could be impacted by interruption in the Foothill Pipeline, SARC Pipeline and Morton Canyon Connector. Therefore, these four pipelines are the most vulnerable Valley District facilities in the case of a major earthquake along the San Andreas Fault. Specific recommendations to manage the catastrophic interruption are discussed below.
2.2.1 Alternative Local Supplies 2.2.1.1 Interties between Purveyors
Table AF-2 lists interconnections between purveyors. These interties could be used to balance supplies between purveyors. An interconnection between the City of San Bernardino and East Valley is currently being used to facilitate blending. This use is anticipated to end in the near future.
F-9

U P P E R S A N T A A N A I N T E G R A T E D R E S O U R C E S W A T E R M A N A G E M E N T P L A N A P P E N D I X F – V U L N E R A B I L I T Y T O C A T A S T R O P H I C I N T E R R U P T I O N O F W A T E R S U P P L Y
A N D D I S A S T E R P R E P A R E D N E S S
( P A R T I A L R E V I S I O N 1 / 5 / 2 0 1 5 )
Table AF-2 – System Interties between Purveyors Transfer Direction Capacity
(MGD) Remarks/data source
City of San Bernardino/East Valley
Either 4 Three interties. One currently used to facilitate blending.
City of San Bernardino/Riverside
To San Bernardino
2 (San Bernardino UWMP, Pg 2-10)
City of San Bernardino/West Valley
Either 3 (San Bernardino UWMP, Pg 2-10)
City of San Bernardino/Loma Linda
Either 5 (San Bernardino UWMP, Pg 2-10)
City of San Bernardino/Colton To Colton 3 (San Bernardino UWMP, Pg 2-10) City of San Bernardino/Rialto Either 3.6 (San Bernardino UWMP, Pg 2-10) City of San Bernardino/ Riverside Highland
To Riverside/ Highland
3 (San Bernardino UWMP, Pg 2-10)
Fontana/Cucamonga Valley Either 3.6 Fontana UWMP (2500 gpm) West Valley/Fontana Either West Valley UWMP. West Valley/Rialto Either West Valley UWMP. West Valley/Colton West Valley UWMP. Redlands/Loma Linda To Loma Linda Greg Gage Rialto1/Marygold To Marygold Rialto has historically conveyed 1,500 afy of
groundwater to Marigold. The agreement under which this was accomplished is expiring.
Sources: San Bernardino Municipal Water Department 2005 UWMP; Jack Nelson, Yucaipa Valley; Ron Buchenwald, East Valley; Greg Gage, Valley District, West Valley 2005 UWMP. 1 Rialto has several connections with other systems, including four connections with West Valley Water District, and connections with City of San Bernardino, Fontana Water Company, and Riverside Highland Water Company. Based on the limited sources of data, this list may be incomplete.
2.2.1.2 Use of Big Bear Lake
Big Bear Lake has a capacity of over 70,000 acre-feet. The goal of Big Bear Lake Municipal Water District is stabilization of the level of Big Bear Lake by managing the amount of water released to the downstream water rights holder. That is, water is kept stored in the lake at all times for recreational use. Bear Valley Mutual Water Company (Mutual) has rights to a large portion of the lake. Through an agreement with Big Bear Municipal Water District (Big Bear), Valley District provides SWP water to Mutual instead of water being released from the lake. However, in an emergency situation, it may be possible for water to be released from the lake for a short duration. A legal framework could be established to make this water available in case of a catastrophe that prevented Valley District from making its deliveries under the agreement with Big Bear.
F-10

U P P E R S A N T A A N A I N T E G R A T E D R E S O U R C E S W A T E R M A N A G E M E N T P L A N A P P E N D I X F – V U L N E R A B I L I T Y T O C A T A S T R O P H I C I N T E R R U P T I O N O F W A T E R S U P P L Y
A N D D I S A S T E R P R E P A R E D N E S S
( P A R T I A L R E V I S I O N 1 / 5 / 2 0 1 5 )
2.2.2 Increased Groundwater Production Capacity and Reliability
In general, the groundwater basin is presently able to meet peak demands using wells without Valley District facilities. If the catastrophe is an earthquake, the most likely impact on groundwater production capacity will be damage to the electrical system of the well or to the electricity supplier’s system, and backup power supplies at key production wells will be necessary
Thus, depending on the system of each purveyor, increasing the purveyor’s groundwater production capacity and the reliability of that capacity may improve the area’s ability to operate after a catastrophic failure.
2.2.3 Alternative Conveyance of Surface Water 2.2.3.1 Alternatives to Foothill Pipeline System
As stated earlier, Foothill Pipeline together with Santa Ana River Connector Pipeline are the most vulnerable facilities if a major earthquake were to occur along the San Andreas Fault and the most critical during a catastrophic interruption. The following systems could provide some alternative conveyance of surface water should portions of the Foothill Pipeline System fail:
• Metropolitan’s Inland Feeder can provide redundancy of the Foothill Pipeline to the intertie at Opal Avenue. The Inland Feeder could also be used to pump water from Diamond Valley Lake north to the intertie with the Valley District Foothill Pipeline. The conveyance capacity of the Inland Feeder operating from Diamond Valley Lake to the north is reported to be 250 cfs.
• The proposed conjunctive use project would include facilities that could convey stored groundwater from the San Bernardino Basin Area to purveyors as a substitute for imported water.
2.2.4 Additional Surface Storage
If the ability to import SWP water is lost or the region is faced with major interruption of regional and local facilities due to a catastrophic event, it is important to have ample local surface storage to meet immediate water demands. While there may be significant water stored below ground, the ability to extract and deliver this water may also be disrupted by a catastrophic event. The following suggestions could further prepare the Region for such an emergency:
• Inventory surface water storage facilities throughout the region and determine the amount of existing storage capacity compared to need to satisfy emergency water
F-11
U P P E R S A N T A A N A I N T E G R A T E D R E S O U R C E S W A T E R M A N A G E M E N T P L A N A P P E N D I X F – V U L N E R A B I L I T Y T O C A T A S T R O P H I C I N T E R R U P T I O N O F W A T E R S U P P L Y
A N D D I S A S T E R P R E P A R E D N E S S
( P A R T I A L R E V I S I O N 1 / 5 / 2 0 1 5 )
demands. The Valley District should conduct an evaluation of feasible storage needs for the Region.
• Select appropriate delivery methods for the waters (i.e., trucking or alternative or backup pipelines).
• Rank agencies by their current amount of surface water storage and their operating storage amounts to determine which areas of the Region are in need of additional surface storage. (How far would people have to walk or drive to get to water? Which cities or communities are most at risk for water shortages?)
• Investigate adding additional local surface water storage facilities that could supply water to the entire Region in the event of an emergency. (North and South Lake projects and conservation pool behind Seven Oaks Dam.)
F-12

U P P E R S A N T A A N A I N T E G R A T E D R E S O U R C E S W A T E R M A N A G E M E N T P L A N A P P E N D I X F – V U L N E R A B I L I T Y T O C A T A S T R O P H I C I N T E R R U P T I O N O F W A T E R S U P P L Y
A N D D I S A S T E R P R E P A R E D N E S S
( P A R T I A L R E V I S I O N 1 / 5 / 2 0 1 5 )
3 Vulnerability of Region’s Water Supply System to SWP Supply Interruption
The scenario considered by this document is a large earthquake along the San Andreas Fault severing the State Water Project (SWP) California Aqueduct just above Devil Canyon power plant. In addition to the threat of earthquake, a disruption on the SWP could be caused by levee failure in the Sacramento-San Joaquin Delta or by other disruptions in transmissions facilities. These two disasters would have an impact on the delivery of SWP water into the region. This chapter will investigate the effects of an interruption of the SWP system on Valley District’s customers.
3.1 Valley District SWP Deliveries Deliveries of SWP water to Valley District have averaged approximately 15,000 acre-feet per year (1999-2003 Western-San Bernardino watermaster records). San Gorgonian Pass Water Agency is also receiving SWP water that would be affected by interruption of SWP deliveries. These direct deliveries are projected to increase to 34,000 acre-feet per year by 2030 based on the UWMP projections within the Region. Historically, direct deliveries have peaked during summer months with the greatest deliveries in July, August, and September. In the event that State Water Project deliveries are severely reduced, more demand will be placed on local groundwater supplies. For example, in a one-month shutdown, additional demands on groundwater within the Valley District service area would be 3,000 to 6,000 acre-feet (current to future demands, shut down in the summer); in a six-month shutdown, additional groundwater demands would be 10,000 to 30,000 acre-feet (current to future demands, shut down in May to September); and in a 12-month shutdown, additional demands on groundwater would be 15,000 to 34,000 acre-feet (current to future demands).
3.2 Overview of Known Earthquake Vulnerabilities of State Water Project
Publications available from the Department of Water Resources address the institutional requirements of responding to an emergency.
3.2.1 California Division of Mines and Geology Planning Scenarios
The California Division of Mine and Geology planning scenario for a major earthquake on the San Jacinto Fault concludes that the Santa Ana Valley Pipeline of the SWP will be damaged extensively as the fault and pipeline cross several times.
F-13

U P P E R S A N T A A N A I N T E G R A T E D R E S O U R C E S W A T E R M A N A G E M E N T P L A N A P P E N D I X F – V U L N E R A B I L I T Y T O C A T A S T R O P H I C I N T E R R U P T I O N O F W A T E R S U P P L Y
A N D D I S A S T E R P R E P A R E D N E S S
( P A R T I A L R E V I S I O N 1 / 5 / 2 0 1 5 )
The planning scenario for a magnitude 8.3 earthquake north of the San Bernardino area and on the San Andreas Fault concludes that though all of the SWP facilities of the California Aqueduct are designed to resist the effects of a great earthquake comparable to the scenario event, widespread damage to the aqueduct will inevitably occur. For planning purposes, a minimum of three months will be required to accomplish those repairs necessary to restore water deliveries to southern California. Severe damage to the East Branch where it crosses the San Andres Fault at Barrel Springs is expected. No major damage to aqueduct facilities between Lake Silverwood and the Devil Canyon Power Plant is expected (this scenario assumes that surface fault rupture would terminate some 25 km northwest of Devil Canyon). The Santa Ana Valley Pipeline would be subjected to intense shaking and possible ground failure.
3.2.2 Seismic Risk Analysis for California State Water Project – Reach C
The objective of this study (Shah, 1976) was to develop a seismic hazard map for the east branch of the SWP. The study concluded that with respect to the pumping and power plants, the hazard or probability of exceeding the design load level employed for the substructures and superstructures during the next 50 years was very small (on the order of 5 percent). For the switchyards, however, the probability of exceeding their design load level during the next 50 years is large (on the order of 30 to 60 percent).
The following recommendations were made as a result of the above study.
• “The risk of damage or destruction to the pumping and power plant substructures and superstructures is minimal during the next 50 to 100 years, and therefore no action is required. However, for the mechanical and electrical equipment within these plants it is recommended that a thorough survey be made to evaluate their ability to resist seismic loads.”
• “All switchgear equipment should be modified so as to resist a minimum peak ground acceleration of 0.3 g. This load level corresponds to a return period of approximately 200 years or more along [the East Branch].”
• “Since the ground shaking along the Santa Ana Valley pipeline is relatively high, in excess of 0.5 g for a 1000 year return period), an investigation should be made to determine the advisability of providing a cut-off facility for this portion of the [East Branch].”
• “Because of the large risk potential, a central operations and maintenance center with facilities and capabilities for dealing with earthquake induced damage should be set up for the region south of the Devil Canyon Power Plant.”
F-14
U P P E R S A N T A A N A I N T E G R A T E D R E S O U R C E S W A T E R M A N A G E M E N T P L A N A P P E N D I X F – V U L N E R A B I L I T Y T O C A T A S T R O P H I C I N T E R R U P T I O N O F W A T E R S U P P L Y
A N D D I S A S T E R P R E P A R E D N E S S
( P A R T I A L R E V I S I O N 1 / 5 / 2 0 1 5 )
3.3 Finding and Recommendations Valley District currently requires the agencies it serves to have a back-up water supply in case the State Water Project (SWP) supply is not available. Assuming the back-up supply is groundwater produced from the San Bernardino Basin Area (SBBA), 15,000 additional acre-feet per year of groundwater production would be needed if the earthquake happened in the near future, and potentially 34,000 acre-feet of additional groundwater production if the earthquake happened around 2030.
The average instantaneous pumping rate for the 199 wells (with data available) of the major water purveyors in the SBBA is approximately 1,438 gpm. Based on well production rates at 70 percent of their instantaneous pumping rate, annual production would be about 323,100 acre-feet. For the remaining wells without instantaneous pumping rate data, the total maximum annual production between 2001 and 2005 was about 60,800 acre-feet. This yields a total maximum annual groundwater production capability of 383,900 acre-feet. The projected actual groundwater pumping for the Baseline Run 1 ranged from between 193,200 acre-feet in 2010 to 289,100 acre-feet in 2034, with an annual average of 248,900 acre-feet per year for the period 2006-2044. Thus, the additional groundwater production that could be used if the state aqueduct was severed is approximately 95,000 acre-feet (383,935 – 289,105) which is greater than the estimated 2030 need of 34,000 acre-feet. The 95,000 acre-feet represents approximately 9 percent of the 1,000,000 acre-feet of usable storage in the SBBA.
In the event of a SWP shutdown, there is sufficient groundwater storage, production facilities and transmission facilities to likely provide short-term water deliveries to customers in the Valley District service area. To prepare for such an outage, SWP and local supplies should be stored in the local groundwater basins, whenever available.
3.3.1 Pipeline Redundancy
Pipeline redundancy in the region is important if interruption occurs in the region along the Foothill Pipeline. On a regional-scale, projects like the Baseline Feeder, the proposed conjunctive use project and the MWDSC Inland Feeder provide additional options of conveyance in an emergency situation.
Although a loss of SWP water for a short period of time can be overcome, the SWP is critical to long-term management of the groundwater basin. The following suggestions are intended to help further prepare the Region for a shutdown of the State Water Project.
3.3.2 Recharge with SWP Water when it is Available
The SBBA is essentially an underground storage reservoir that contributes to the water reliability of the Region during periods of drought. By recharging water from the SWP when it is available, the Region can prepare in advance for drought or disruptions in the SWP
F-15
U P P E R S A N T A A N A I N T E G R A T E D R E S O U R C E S W A T E R M A N A G E M E N T P L A N A P P E N D I X F – V U L N E R A B I L I T Y T O C A T A S T R O P H I C I N T E R R U P T I O N O F W A T E R S U P P L Y
A N D D I S A S T E R P R E P A R E D N E S S
( P A R T I A L R E V I S I O N 1 / 5 / 2 0 1 5 )
system. This is a primary management strategy of the San Bernardino Valley Regional Urban Water Management Plan and the Upper Santa Ana River Watershed Integrated Regional Water Management Plan.
3.3.3 Surface Storage in the Region
Additional surface storage in the region can help provide water supplies during a catastrophic failure of the California Aqueduct.
3.3.4 Exchange and Banking Program Utilizing Santa Ana River Water
In years when water available from the Santa Ana River exceeds the capacity of local treatment plants and spreading grounds, the excess amount could physically be delivered to the Inland Feeder and into Metropolitan’s water system in exchange for SWP water from Metropolitan. This banked water could be recovered and delivered to the region if a catastrophe occurs along the California Aqueduct.
F-16

U P P E R S A N T A A N A I N T E G R A T E D R E S O U R C E S W A T E R M A N A G E M E N T P L A N A P P E N D I X F – V U L N E R A B I L I T Y T O C A T A S T R O P H I C I N T E R R U P T I O N O F W A T E R S U P P L Y
A N D D I S A S T E R P R E P A R E D N E S S
( P A R T I A L R E V I S I O N 1 / 5 / 2 0 1 5 )
4 Vulnerabilities of Local Purveyors Water Supply System to an Earthquake in the Region
A catastrophic 8.0 earthquake near San Bernardino could lead to pipeline rupture, loss of electricity, and well failure, substantially reducing water supplies available in the Region. The quality of both surface and groundwater supplies could also be affected by the failure of existing wastewater treatment facilities. Figure AF-1 shows the San Andreas Fault trace through the Valley District service area with a five mile fault buffer zone. In the case of a 7.8 earthquake, anything within five miles of the fault is likely to be damaged or destroyed (Caltech meeting, July 31, 2007). In addition, regional infrastructure within this zone includes the SWP CA Aqueduct coming from Lake Silverwood to Devil Canyon, regional water facilities owned by Valley District (Foothill Pipeline, Greenspot Pipeline, Lytle Canyon Pipeline, and the East Branch Extension), and Metropolitan’s Inland Feeder will be impacted. Prudent preparation for a catastrophic earthquake would suggest planning for no water deliveries from the SWP.
4.1 Overview of Known Earthquake Vulnerabilities of Purveyor’s Systems
This section has been prepared based on review of Urban Water Management Plans of agencies receiving direct deliveries from Valley District. California Water Code Section 10632 (c) requires that Urban Water Management Plans address catastrophic supply interruptions.
4.1.1 San Bernardino Municipal Water Department
San Bernardino Municipal Water Department’s Supplemental Emergency Plan is designed for implementation during emergency water shortages that could occur as a result of earthquake, flood, fire, or other catastrophes. SBMWD maintains portable backup power supply and diesel- and/or natural gas-driven wells at critical locations within the distribution system to provide domestic water for emergency purposes during sustained power outages. Additionally, they have entered into a Mutual Aid Agreement with surrounding water agencies.
4.1.2 East Valley Water District
East Valley has in place back-up power supplies at critical locations within the distribution system. The District maintains portable pumps that can be used to transfer water between zones, but cannot be used for production. East Valley’s storage capacity of 25.5 million gallons would provide a potable supply for customers’ non-irrigation uses (assumes
F-17

U P P E R S A N T A A N A I N T E G R A T E D R E S O U R C E S W A T E R M A N A G E M E N T P L A N A P P E N D I X F – V U L N E R A B I L I T Y T O C A T A S T R O P H I C I N T E R R U P T I O N O F W A T E R S U P P L Y
A N D D I S A S T E R P R E P A R E D N E S S
( P A R T I A L R E V I S I O N 1 / 5 / 2 0 1 5 )
implementation of Water Shortage Contingency Plan) for an estimated two to three days. A Mutual Aid Agreement with surrounding water agencies is also in place for the provision of water supply and/or manpower.
East Valley has an agreement with Arrowhead Drinking Water Company to deliver potable water tanks to selected sites within the District’s service area. The trucks will be manned by District personnel to distribute water to customers for drinking purposes.
Were surface water deliveries to East Valley disrupted, East Valley has adequate groundwater production capacity to meet peak day. This presumes that East Valley’s facilities remained intact.
4.1.3 West Valley Water District
Extended multi-week supply shortages due to natural disasters or accidents that damage all West Valley water sources are unlikely. The District’s 23 storage reservoirs hold 65.6 million gallons, which is sufficient water to meet the health and safety requirements of 50 gallons per day per capita for the 60,121 customers for 21 days. This assumes zero non-residential use. Under emergency power outages or catastrophic earthquake conditions, the existing storage is expected to provide a minimum supply of 3.5 days of average day demand or 1.7 days under maximum summer demand.
The District is planning to construct an additional 12.5 million gallons of storage within the next few years for a total of 78.11 million gallons, which would give the District 4.2 days of average day demand. The District also has interconnections with three other agencies for emergency supplies.
The District has portable back-up generators that can be used in the event of an area-wide power outage. These generators can be located on both wells and booster stations to continue water production. These generators will be located in the northern part of the distribution system. Water can then be boosted to higher zones or gravity fed to the lower zones. In addition to the portable generators, the District is constructing back-up generators at the Zone 5 and 6 booster stations.
West Valley’s groundwater production capacity is approximately 80 percent of peak day demand. It obtains water from two Valley District facilities, the Lytle Pipeline and the Baseline Feeder. These facilities are required to meet peak day demand.
4.1.4 Yucaipa Valley Water District
Yucaipa Valley’s Major Disaster Plan and Alerting Procedures deal with non-drought-related water shortages, including those that might result from earthquakes. It outlines the responsibilities of the District’s designated emergency response personnel, alerting
F-18
U P P E R S A N T A A N A I N T E G R A T E D R E S O U R C E S W A T E R M A N A G E M E N T P L A N A P P E N D I X F – V U L N E R A B I L I T Y T O C A T A S T R O P H I C I N T E R R U P T I O N O F W A T E R S U P P L Y
A N D D I S A S T E R P R E P A R E D N E S S
( P A R T I A L R E V I S I O N 1 / 5 / 2 0 1 5 )
procedures, alternate headquarters, communications, transportation, and relationships with regional and state emergency response officials.
To the extent well capacity exists, the Yucaipa basin can be temporarily exercised beyond its long-term safe yield in response to shortages.
It is East Valley’s intent to maintain groundwater production facilities adequate to meet peak day demand without use of surface water.
4.1.5 City of Redlands
The Redlands UWMP notes that the Redlands Municipal Utilities Department has an emergency plan that supplements the Citywide Emergency Plan. It notes that in case of an earthquake, required actions are to “coordinate the resources necessary for repair of water infrastructure,” and to “utilize vendor lists to identify available water haulers, temporary water lines, piping, heavy equipment, etc.”
Redlands does not have adequate capacity to meet peak day demand without use of surface water. Redlands obtains surface water from Mill Creek and SWP wheeled by SBVWMD. During a typical summer, Mill Creek is the main source during early summer, but this supply is substantially reduced by late summer. SWP water is the dominate source in late summer. Depending on the supply of Mill Creek water, Redlands may not be able to meet peak day demands without SWP water.
4.1.6 Fontana Water Company
Fontana is dependent on imported surface water to meet demands. Presently, the water is all delivered via the Lytle Pipeline. It is possible that in the future, some of the imported water will be conveyed by Metropolitan’s Foothill Feeder (also known as the Rialto Pipeline). These two lines are parallel, however, and it is reasonable to presume that the same event that damages one will damage the other.
4.1.7 City of Rialto
Rialto’s UWMP notes that the city’s storage reservoirs can meet the health and safety requirements of 50 gallons per day per capita for 11 days. This assumes no non-residential use. The City is retrofitting key well sites to enable the City to bring in portable generators for use during a power outage.
Rialto obtains water from two Valley District facilities, the Lytle Pipeline and the Baseline Feeder. It is believed that both these facilities are required to meet peak day demand.
F-19
U P P E R S A N T A A N A I N T E G R A T E D R E S O U R C E S W A T E R M A N A G E M E N T P L A N A P P E N D I X F – V U L N E R A B I L I T Y T O C A T A S T R O P H I C I N T E R R U P T I O N O F W A T E R S U P P L Y
A N D D I S A S T E R P R E P A R E D N E S S
( P A R T I A L R E V I S I O N 1 / 5 / 2 0 1 5 )
4.2 Findings and Recommendations • The purveyors in the region will primarily rely on groundwater during catastrophic
events. Therefore, they must ensure they have reliable and adequate backup power supplies at critical locations within the distribution system as well as key production wells. The backup power supplies should be tested periodically to ensure proper operations during emergencies.
• Local purveyors should examine their current storage and interties capacities and plan for additional storage and interties to ensure adequate water supply is available for health and safety during catastrophic events.
F-20
U P P E R S A N T A A N A I N T E G R A T E D R E S O U R C E S W A T E R M A N A G E M E N T P L A N A P P E N D I X F – V U L N E R A B I L I T Y T O C A T A S T R O P H I C I N T E R R U P T I O N O F W A T E R S U P P L Y
A N D D I S A S T E R P R E P A R E D N E S S
( P A R T I A L R E V I S I O N 1 / 5 / 2 0 1 5 )
5 Summary of Findings and Recommendations
5.1 Findings These findings have been developed from a search of literature reporting the impacts of major earthquakes and limited work by water purveyors. More detailed, site-specific analyses are needed to better quantify and identify impacts from major earthquakes or other catastrophic outages.
Reliability of Groundwater Wells. Review of post-earthquake lifeline performance reports reveals little discussion of groundwater well failure. However, loss of commercial power, damage to electrical equipment and aboveground appurtenances, or damage to the distribution system may effectively put the well out of service. Liquefaction, especially in areas where there is high groundwater levels between depths of 5 to 50 feet, may cause ground settlement and interfere with continued well operation.
No discussion of the performance of well head treatment systems during earthquakes was found. This may be due to the limited amount of well head treatment in place during prior earthquakes. As well head treatment typically includes purchased equipment installed in a field location, there is significant opportunity for lapses in the seismic design.
The groundwater basin and the groundwater production wells are a reliable part of the water supply system for the San Bernardino area.
Reliability of Pipelines. Pipelines are generally the most fragile part of a water system. Generally, damage is a function of displacement rather than shaking. Empirical algorithms have been developed to predict seismic reliability of pipelines.
Reliability of Pump Stations. Past earthquakes indicate that the structural and mechanical elements of a pump station are highly resistant to earthquake damage. The most likely failures are to the electrical equipment and loss of commercial power.
Reliability of Surface Water Treatment Facilities. The major elements of a surface water treatment system are typically concrete structures that are very resistant to damage. However, these facilities include a large variety of mechanical equipment, much of it long and light weight that is subject to damage not only from the direct force of an earthquake, but also to the wave action created by the earthquake. Similar to a pump station, power supply and electrical equipment are fragile.
F-21

U P P E R S A N T A A N A I N T E G R A T E D R E S O U R C E S W A T E R M A N A G E M E N T P L A N A P P E N D I X F – V U L N E R A B I L I T Y T O C A T A S T R O P H I C I N T E R R U P T I O N O F W A T E R S U P P L Y
A N D D I S A S T E R P R E P A R E D N E S S
( P A R T I A L R E V I S I O N 1 / 5 / 2 0 1 5 )
Reliability of the State Water Project. While little specific information was found on anticipated damage to the SWP, the high susceptibility of the Santa Ana Valley Pipeline is recognized. A major vulnerability of the SWP is the Sacramento-San Joaquin Delta. The SWP does have a Business Resumption Plan and an Emergency Operations Plan.
Length of Outages. The Loma Prieta earthquake affected a large number of separate systems. The San Jose Water Company serves most of San Jose and all of Los Gatos. Los Gatos was hard hit and half of the water customers lost water service. In San Francisco, the worst hit area was the Marina District. Fires and liquefaction both affected the district. East Bay Municipal Water District serves 1.1 million customers and suffered $3.7 million in damage. Damage included a break in a 60-inch raw water line.
After the Northridge earthquake, the Los Angeles Aqueducts No. 1 and 2 were in and out of service for temporary and permanent repairs over several months, these facilities were not critical at that time. Alternate supplies were available and drought conditions limited supply to these aqueducts.
Table AF-3 shows the length of outages for water operation during the Loma Prieta and Northridge earthquakes.
Valley District’s Emergency Operations Plan includes estimates for repair of Valley District facilities. Electrical and pipe repairs are estimated to take 35 to 77 days. Pump repairs are estimated to take 168 to 273 days.
Tables AF-4 and AF-5 summarize the degree to which purveyors depend on Valley District facilities for deliveries over a period of days to one year. These tables presume normal operations by the purveyor with the exception that non-potable deliveries (West Valley and Yucaipa) are suspended.
Table AF-3 – Length of Outages for Water Operation during Loma Prieta and Northridge Earthquakes
Earthquake Purveyors Time to Restore Water Operation
Loma Prieta San Jose WC 36 hrs/98%
San Francisco 6 days/most areas
East Bay MWD 3 days/normal operation
Northridge City of L.A. 12-65 days
F-22

U P P E R S A N T A A N A I N T E G R A T E D R E S O U R C E S W A T E R M A N A G E M E N T P L A N A P P E N D I X F – V U L N E R A B I L I T Y T O C A T A S T R O P H I C I N T E R R U P T I O N O F W A T E R S U P P L Y A N D D I S A S T E R P R E P A R E D N E S S
( P A R T I A L R E V I S I O N 1 / 5 / 2 0 1 5 )
Table AF-4 – Percent of Present (P) and Future (F) Peak Day, Potable Demand conveyed by SBVWMD facilities when no local surface water is available. Assumes imported water used prior to local groundwater
Purveyor Foothill Pipeline
SARC Pipeline
Greenspot Pump
Station
Morton Canyon
Connector Greenspot
Pipeline Tate
Pump Station
Crafton Hills PS
Crafton Hills
Reservoir
Crafton Hills
Pipeline
Bryant Street
Pipeline Yucaipa Pipeline
Lytle Pipeline
Baseline Feeder
San Bernardino Municipal Water Dept
0 0 0 0
East Valley Water District
12 (P) 24 (F)
12 (P) 24 (F)
12 (P) 24 (F)
0
Redlands 36 (P) 41 (F)
36 (P) 41 (F)
24 (P) 25 (F)
51 (P) 35 (F)
24 (P) 25 (F)
24 (P) 25 (F)
Yucaipa Valley Water District
24(P) 49 (F)
24(P) 49 (F)
24(P) 49 (F)
24(P) 49 (F)
24(P) 49 (F)
24(P) 49 (F)
24(P) 49 (F)
24(P) 49 (F)
24(P) 49 (F)
0
Fontana Water Company
0 0 0 0 unknown
West Valley Water District
0 0 0 0 23 (P) 36 (F)
12(P) 27 (F)
City of Rialto 0 0 0 0 7 (P) 6 (F) unknown
Notes: San Bernardino Municipal Water Department figure does not include deliveries of surface water for wells under the influence of surface water as it takes six to seven
months for the hydrographs of these wells to respond. If these deliveries were included, they would be 14% of peak day demand. Does not include deliveries for irrigation or indirect deliveries. Gray shading indicates a conveyance facility that cannot under any circumstances be used to convey water to the agency.
F-23

U P P E R S A N T A A N A I N T E G R A T E D R E S O U R C E S W A T E R M A N A G E M E N T P L A N A P P E N D I X F – V U L N E R A B I L I T Y T O C A T A S T R O P H I C I N T E R R U P T I O N O F W A T E R S U P P L Y
A N D D I S A S T E R P R E P A R E D N E S S
( P A R T I A L R E V I S I O N 1 / 5 / 2 0 1 5 )
Table AF-5 – Groundwater and Local Surface Water Production Capacity as percent of peak day demand
Purveyor Percentage Remarks
San Bernardino Municipal Water Department
113%
East Valley Water District 104%
Redlands ≈ 75 to 85% Assumes late summer when local surface water supplies are low. When local surface water supplies are high, Redlands can produce approximately 85 to 95% of demand.
Yucaipa Valley Water District 95%
Yucaipa’s intent is to maintain groundwater production facilities adequate to meet peak demand. As of August 2007, they do not meet this goal.
Fontana Water Company
Significantly less than
100%
West Valley Water District 78%
Projected to decrease to 59% in the future.
Rialto unknown
Notes: Does not include non-potable use by West Valley and Yucaipa.
5.2 Recommendations for Disaster Preparedness This section includes the consultants recommendations based on the literature review and discussions with District staff and purveyors. The following recommendations have not been included in the administrative draft of the IRWM Plan. After these recommendations, the projects already included in the IRWM Plan that would enhance disaster preparedness will be reviewed.
5.2.1 General Recommendations
Consider a Seismic Improvement Program/Water Infrastructure Reliability Project to review the adequacy of Valley District facilities to withstand an earthquake. East Bay Municipal Utilities District and Santa Clara Valley Water District (Santa Clara Valley Water District, 2005) are two agencies that have performed such studies. High priority facilities include Foothill Pipeline, Santa Ana River Connector, Morton Canyon Connector, and Greenspot Pipeline.
Consider the opportunities that Big Bear Lake presents as an emergency source of water after an earthquake that interrupts SWP deliveries for many weeks.
Consider using the existing MWD agreements to allow the use of Metropolitan Water District facilities to bypass failed Valley District facilities (and the reverse).
F-24
U P P E R S A N T A A N A I N T E G R A T E D R E S O U R C E S W A T E R M A N A G E M E N T P L A N A P P E N D I X F – V U L N E R A B I L I T Y T O C A T A S T R O P H I C I N T E R R U P T I O N O F W A T E R S U P P L Y
A N D D I S A S T E R P R E P A R E D N E S S
( P A R T I A L R E V I S I O N 1 / 5 / 2 0 1 5 )
Review ability to provide drinking water immediately following an earthquake. Arrangements to provide bottled water may be appropriate.
The USGS Multi-hazards Demonstration Project (MHDP) is leading an effort to create a scenario document for a future M7.8 southern San Andreas Fault earthquake. The document will describe in detail the effects of the earthquake. It will form the basis for a November 2008 statewide earthquake response exercise. The USGS contact for this project is Dale Cox, [email protected], 916/997-4209. It is probable that useful information for disaster preparedness planning will come out of this effort.
5.2.2 Proposed Projects to Provide Conveyance System Redundancies for the Regional Facilities
The proposed conjunctive use project could provide the backup well production needed for the retail water agencies in an emergency when SWP supplies have been severed.
5.3 Alternative Local Supplies This section is intended to initiate a discussion of options that would improve the water supply reliability in case of a catastrophic failure of portions of the Valley District water system.
5.3.1 Interties between Purveyors
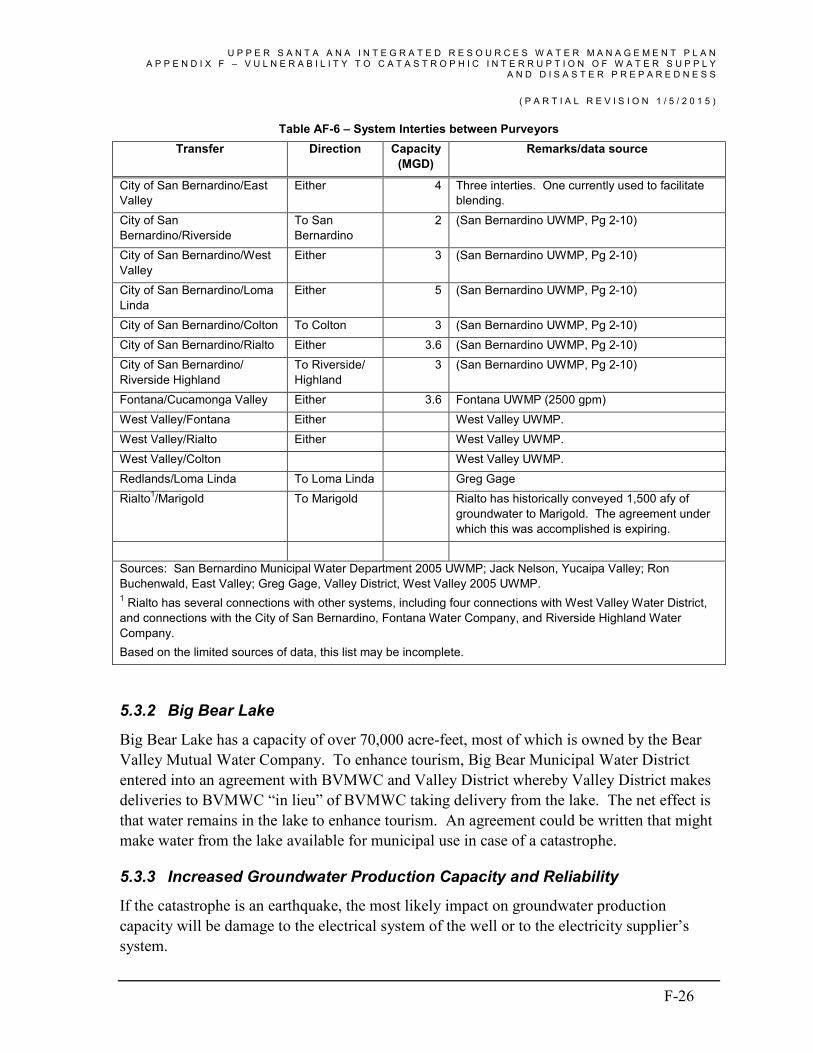
Table AF-6 lists interconnections between purveyors. These interties could be used to balance supplies between purveyors. An interconnection between the City of San Bernardino and East Valley is currently being used to facilitate blending. This use is anticipated to end in the near future. Fontana Water Company has historically depended on supplies delivered through its interconnection with Cucamonga Valley to meet peak day demand.
F-25
U P P E R S A N T A A N A I N T E G R A T E D R E S O U R C E S W A T E R M A N A G E M E N T P L A N A P P E N D I X F – V U L N E R A B I L I T Y T O C A T A S T R O P H I C I N T E R R U P T I O N O F W A T E R S U P P L Y
A N D D I S A S T E R P R E P A R E D N E S S
( P A R T I A L R E V I S I O N 1 / 5 / 2 0 1 5 )
Table AF-6 – System Interties between Purveyors Transfer Direction Capacity
(MGD) Remarks/data source
City of San Bernardino/East Valley
Either 4 Three interties. One currently used to facilitate blending.
City of San Bernardino/Riverside
To San Bernardino
2 (San Bernardino UWMP, Pg 2-10)
City of San Bernardino/West Valley
Either 3 (San Bernardino UWMP, Pg 2-10)
City of San Bernardino/Loma Linda
Either 5 (San Bernardino UWMP, Pg 2-10)
City of San Bernardino/Colton To Colton 3 (San Bernardino UWMP, Pg 2-10) City of San Bernardino/Rialto Either 3.6 (San Bernardino UWMP, Pg 2-10) City of San Bernardino/ Riverside Highland
To Riverside/ Highland
3 (San Bernardino UWMP, Pg 2-10)
Fontana/Cucamonga Valley Either 3.6 Fontana UWMP (2500 gpm) West Valley/Fontana Either West Valley UWMP. West Valley/Rialto Either West Valley UWMP. West Valley/Colton West Valley UWMP. Redlands/Loma Linda To Loma Linda Greg Gage Rialto1/Marigold To Marigold Rialto has historically conveyed 1,500 afy of
groundwater to Marigold. The agreement under which this was accomplished is expiring.
Sources: San Bernardino Municipal Water Department 2005 UWMP; Jack Nelson, Yucaipa Valley; Ron Buchenwald, East Valley; Greg Gage, Valley District, West Valley 2005 UWMP. 1 Rialto has several connections with other systems, including four connections with West Valley Water District, and connections with the City of San Bernardino, Fontana Water Company, and Riverside Highland Water Company. Based on the limited sources of data, this list may be incomplete.
5.3.2 Big Bear Lake
Big Bear Lake has a capacity of over 70,000 acre-feet, most of which is owned by the Bear Valley Mutual Water Company. To enhance tourism, Big Bear Municipal Water District entered into an agreement with BVMWC and Valley District whereby Valley District makes deliveries to BVMWC “in lieu” of BVMWC taking delivery from the lake. The net effect is that water remains in the lake to enhance tourism. An agreement could be written that might make water from the lake available for municipal use in case of a catastrophe.
5.3.3 Increased Groundwater Production Capacity and Reliability
If the catastrophe is an earthquake, the most likely impact on groundwater production capacity will be damage to the electrical system of the well or to the electricity supplier’s system.
F-26

U P P E R S A N T A A N A I N T E G R A T E D R E S O U R C E S W A T E R M A N A G E M E N T P L A N A P P E N D I X F – V U L N E R A B I L I T Y T O C A T A S T R O P H I C I N T E R R U P T I O N O F W A T E R S U P P L Y
A N D D I S A S T E R P R E P A R E D N E S S
( P A R T I A L R E V I S I O N 1 / 5 / 2 0 1 5 )
Thus, providing emergency generators for “key” wells would help improve the area’s ability to operate after a catastrophic failure.
5.4 Alternative Conveyance of Surface Water 5.4.1 Alternatives to Foothill Pipeline System
The following systems could provide some alternative conveyance of surface water should portions of the Foothill Pipeline System fail:
• Metropolitan’s Inland Feeder parallels the Foothill Pipeline from Devil Canyon to Opal Avenue. The Inland Feeder could also be used to convey water stored in Diamond Valley north to the Valley District service area. The conveyance capacity of the Inland Feeder operating from Diamond Valley Lake to the north is reported to be 250 cfs.
• The proposed conjunctive use project would increase the ability to convey groundwater between agencies following a catastrophe.
• The proposed East Branch Extension Phase II will convey SWP water from the eastern portion of the Foothill Pipeline to Crafton Hills Pump Station. This will provide redundancy for the SARC Pipeline, Greenspot Pump Station, Morton Canyon Connector I, and Greenspot Pipeline.
5.4.2 Alternatives to the Lytle Pipeline
• Metropolitan’s Foothill Feeder, also called the Rialto Pipeline, parallels the Lytle Creek Pipeline from Devil Canyon east for approximately nine miles. With turnouts it could provide alternative conveyance to West Valley’s and Fontana’s surface water treatment plants.
• The Baseline Feeder conveys groundwater to West Valley and Rialto. This groundwater is an alternative to SWP water conveyed by the Lytle Pipeline. It should be noted that Rialto’s connection to Lytle Pipeline is not yet completed.
5.4.3 Alternatives to Baseline Feeder System
• The Lytle Creek Pipeline conveys SWP water to West Valley and can convey SWP water to Rialto when the connection is completed. This surface water is an enhancement to groundwater conveyed by the Baseline Feeder.
F-27
U P P E R S A N T A A N A I N T E G R A T E D R E S O U R C E S W A T E R M A N A G E M E N T P L A N A P P E N D I X F – V U L N E R A B I L I T Y T O C A T A S T R O P H I C I N T E R R U P T I O N O F W A T E R S U P P L Y
A N D D I S A S T E R P R E P A R E D N E S S
( P A R T I A L R E V I S I O N 1 / 5 / 2 0 1 5 )
5.5 Back-Up Power Supplies 5.5.1 Power Supplies for Groundwater Wells
A catastrophic earthquake may cause loss of electricity for an indeterminate amount of time. In order to ensure water supplies in the immediate aftermath and weeks following a major earthquake, it is critical to have back-up generators or internal combustion engines for important production wells throughout the Region.
• Inventory wells in the Region with back-up generators. • Determine the number of wells that could be equipped with internal combustion
engines. • Rank groundwater wells by their ability to supply water to purveyors. Wells with
higher production capacities, more conveyance connections, or delivery pipeline options are preferential.
• Select a distribution of wells across the basin to be provided with back-up generators or internal combustion engines, decreasing the likelihood of a localized event impacting a majority of the most important wells.
5.5.2 Back-Up Power Supplies for Other Water Supply Facilities:
Similar evaluations should be conducted for other facilities such as water treatment plants and the key pumping plants, and back-up power generation should be put in place for use during emergencies.
F-28

U P P E R S A N T A A N A I N T E G R A T E D R E S O U R C E S W A T E R M A N A G E M E N T P L A N A P P E N D I X F – V U L N E R A B I L I T Y T O C A T A S T R O P H I C I N T E R R U P T I O N O F W A T E R S U P P L Y
A N D D I S A S T E R P R E P A R E D N E S S
( P A R T I A L R E V I S I O N 1 / 5 / 2 0 1 5 )
6 Water Shortage Contingency Plan
Each water agency in the region is required by law to have a water shortage plan and emergency catastrophe plan. If there is a shutdown in the SWP system or a long-term drought that affects imported or local supplies, each agency in the region should participate in conservation activities that maximize use of the shared water supplies, both local surface water and ground water. These conservation efforts should be coordinated at a regional level.
The following provides examples of rules, regulations, and procedures that could be implemented to restrict or reduce water use. These could be implemented upon determination that there exists, or there is a threat of, a water shortage that affects the region’s ability to provide adequate potable water supplies for the purveyors to deliver to their customers. Each agency should have a water shortage plan that is tailored to their customers in order to reach water conservation targets.
6.1 Stage I Conservation – Additional 20% Reduction Upon determination that additional water conservation is needed, the following prohibitions can be considered and adopted with the goal of achieving an additional 20 percent reduction in water consumption—the water conservation measures referenced in Stage I, and the following:
(a) All outdoor irrigation should occur only after 8 p.m. and before 7 a.m.
(b) Prohibit the use of potable water to wash sidewalks, walkways, driveways, parking lots, open ground, and other hard-surface areas by direct application.
(c) Prohibit the use of non-drinking-water fountains, except for those using recycled water.
(d) Prohibit the use of water that results in any flooding or run-off in gutters or streets. Limit water deliveries to residential and non-residential users to 90 percent of their water consumption for the same billing cycle during a pre-determined Base Year.
(b) Levy a surcharge of 200 percent on all water use in excess of the maximum water use allotment referenced in subparagraph (a) above, assessed to the account of the customer.
F-29

U P P E R S A N T A A N A I N T E G R A T E D R E S O U R C E S W A T E R M A N A G E M E N T P L A N A P P E N D I X F – V U L N E R A B I L I T Y T O C A T A S T R O P H I C I N T E R R U P T I O N O F W A T E R S U P P L Y
A N D D I S A S T E R P R E P A R E D N E S S
( P A R T I A L R E V I S I O N 1 / 5 / 2 0 1 5 )
(c) Limit the use of water from fire hydrants to fire suppression and/or other activities immediately necessary to maintain health, safety, and welfare of residents.
(d) Prohibit the use of potable water for dust control and compaction for construction projects.
(e) Prohibit the washing of automobiles, trucks, trailers, boats, and other types of mobile equipment not occurring upon the immediate premises of a commercial car wash and/or commercial service station that uses recycled water.
(f) Encourage restaurants to refrain from serving water to their customers, except upon specific request.
(g) Limit the use of potable water to irrigate grass, lawns, ground cover, shrubbery, crops, vegetation, ornamental trees, etc., to Saturdays, Mondays, and Wednesdays for even-numbered addresses and Sundays, Tuesdays, and Thursdays for odd-numbered addresses, or as otherwise established by resolution from the Board of Directors of the respective agencies.
(h) Limit water main flushing to emergency situations only.
(i) Wait list applications for Intent to Serve Letters and suspend their further processing.
Pursue a vigorous public information campaign regarding current water supply conditions and the need to reduce water consumption by such means deemed appropriate.
Meet with other water purveyors, public school districts, park agencies, and golf courses that use water sources other than purveyor-supplied water, to seek voluntary reduction in irrigation of decorative landscape and reduce irrigation of turf and play areas.
In addition to those measures stated above, adoption of water conservation measures on an urgency basis may be warranted.
6.2 Stage II Conservation – Additional 35% Reduction Upon determination that additional water conservation is needed, the following prohibitions can be considered and adopted with the goal of achieving up to an additional 35 percent reduction in water consumption. The water conservation measures referenced in Stage I and Stage II, and the following:
F-30

U P P E R S A N T A A N A I N T E G R A T E D R E S O U R C E S W A T E R M A N A G E M E N T P L A N A P P E N D I X F – V U L N E R A B I L I T Y T O C A T A S T R O P H I C I N T E R R U P T I O N O F W A T E R S U P P L Y
A N D D I S A S T E R P R E P A R E D N E S S
( P A R T I A L R E V I S I O N 1 / 5 / 2 0 1 5 )
(a) Limit water deliveries for residential uses to 65 percent of their water consumption for the same billing cycle during a pre-determined Base Year.
(b) Levy a surcharge of 400 percent on all water use in excess of the maximum water use allotment reflected in subparagraph (a) above, and that can be assessed to the account of the customer.
(c) Require all swimming pools to be covered when not in use.
(d) Prohibit the use of potable water to irrigate grass, lawns, ground cover, shrubbery, crops, vegetation, ornamental trees, etc., and lock all irrigation meters.
(e) Suspend Intent-To-Serve Letters. However, the expiration period can be extended commensurate with the time of suspension.
In addition to those measures stated above, adoption of water conservation measures on an urgency basis may be necessary.
6.3 Stage III Conservation – Additional 50% Reduction Upon determination that additional water conservation is needed, the following prohibitions can be considered and adopted with the goal of achieving up to an additional 50 percent reduction in water consumption. The water conservation measures referenced in Stage I, II, and III above, and the following:
(a) Limit water deliveries for residential uses to 50 percent of their water consumption for the same billing cycle during a pre-determined Base Year.
(b) Levy a surcharge of 500 percent on all water use in excess of the maximum water use allotment reflected in subparagraph (a) above, and that can be assessed to the account of the customer.
(c) Prohibit the setting of new water meters and suspend all Will-Serve Letters.
In addition to those measures stated above, adoption of additional water conservation measures on an urgency basis may be necessary.
F-31

U P P E R S A N T A A N A I N T E G R A T E D R E S O U R C E S W A T E R M A N A G E M E N T P L A N A P P E N D I X F – V U L N E R A B I L I T Y T O C A T A S T R O P H I C I N T E R R U P T I O N O F W A T E R S U P P L Y
A N D D I S A S T E R P R E P A R E D N E S S
( P A R T I A L R E V I S I O N 1 / 5 / 2 0 1 5 )
References
Ballantyne, Donald. Water System Performance in the Great Hanshin (Kobe) Earthquake.
Ballantyne, Donald. 1995. Relative Earthquake Vulnerability of Water Pipe. Dames & Moore, Inc. July 26, 1995.
Ballantyne, Donald B and Crouse, C.B. 1997. Reliability & Restoration of Water Supply Systems for Fire Suppression & Drinking Following Earthquakes. GCR 97-730. National Institute of Standards and Technology. November 1997.
Ballantyne, Donald B. Comparison of Water Utility Earthquake Mitigation Practices.
California Department of Conservation, Division of Mines and Geology. 1982. Earthquake Planning Scenario for a Magnitude 8.3 Earthquake on the San Andreas Fault in Southern California, Special Publication 60. 1982.
California Department of Conservation, Division of Mines and Geology. 1993. Planning Scenario for a major Earthquake on the San Jacinto Fault Zone in the San Bernardino Area, Special Publication 102. 1993.
California Department of Water Resources. 2006. Emergency Response Plan.
California Department of Water Resources. Business Resumption Plan. September 2006.
Chung, Riley M, Jason, Nora H. Jason, Mohraz, Bijan, Mowrer, Frederick W., and Walton. William D (editors). 1995. Post-Earthquake Fire & Lifelines Workshop: Long Beach. CA. NIST Special Publication 889. National Institute of Standards and Technology. August 1995.
Collins, Frank, Conner Michael Eidinger, John M. and Tomasulo, Jim. Pipeline Performance in San Diego due to Earthquakes. March 28, 2001.
Degner, Joel, Pappas Alex, IRGMP Study Area Vulnerability to an 8.0 Earthquake on the San Andreas Fault, September 14, 2007
Eidinger, John, Yashinsky, Mark and Schiff, Anshel. 2000. Napa M5.2 Earthquake of September 3, 2000. September 13, 2000.
F-32

U P P E R S A N T A A N A I N T E G R A T E D R E S O U R C E S W A T E R M A N A G E M E N T P L A N A P P E N D I X F – V U L N E R A B I L I T Y T O C A T A S T R O P H I C I N T E R R U P T I O N O F W A T E R S U P P L Y
A N D D I S A S T E R P R E P A R E D N E S S
( P A R T I A L R E V I S I O N 1 / 5 / 2 0 1 5 )
Fialko Y., Rivera L. , and, Kanamori H. (2005) Estimate of differential stress in the upper crust from variations in topography and strike along the San Andreas fault . Geophysical Journal International 160 (2), 527–532
Gilbert, Jerome B, Dawson, Artis L., and Linville, Thomas J. Bay Area Water Utilities Response to Earthquake. Prepared for East Bay Municipal Utility District.
Housing and Urban Development, Department of. 2000. Preparing for the “Big One”: Saving Lives through Earthquake Mitigation in Los Angeles, California. http://www.huduser.org/publications/destech/bigone/
JELC Working Committee. 2000. Final Report, Provision of Water. May 2000.
Los Angeles Fire Department. Northridge Earthquake January 17, 1994. http://lafd.org/eq.htm.
Lund, Le Val. Lifeline Performance, San Simeon Earthquake, December 22, 2003. http://www.asce.org/pdf/sansimeon.pdf
Pickett, Mark A, Laverty, Gordon L., Abu-Yasein, Omar A., and Chen Wun Lay. Loma Prieta Earthquake: Lessons Learned for Water Utilities.
Riordan, Raymond A. Sending Mutual Aid to Northridge: More than Main Repairs. Prepared for East Bay Municipal Utility District.
RMC Water and Environment. 2005. Executive Summary, Water Infrastructure Reliability Project Report prepared for Santa Clara Valley Water District, May 2005.
Schiff, Anshel J. (ed). 1998. The Loma Prieta, California. Earthquake of October 17, 1989 – Lifelines. U.S. Geological Survey Professional Paper 1552-A.
Schiff, Anshel J. 1997. Northridge Earthquake: Lifeline Performance and Post-Earthquake Response. Mational Institute of Standard and Technology.
Vancouver, City of. 2007. Alternate Water Supplies. http://www.city.vancouver.bc.ca/engsvcs/waterserwers/altenatve.htm/
Water Supply Panel. Assessing the Impacts of a M7.8 Southern San Andreas Earthquake on Water Supply. 7/31/2007 meeting at the California Institute of Technology
Water Supply Contingency Work Group. July 2007 sketch.
Yashinsky, Mark and Eidinger, John. Performance of Lifelines during the November 3, 2002 Denali, Alaska Earthquake. http://www.asce.org/pdf/denaliearthquake.pdf
F-33

U P P E R S A N T A A N A I N T E G R A T E D R E S O U R C E S W A T E R M A N A G E M E N T P L A N A P P E N D I X F – V U L N E R A B I L I T Y T O C A T A S T R O P H I C I N T E R R U P T I O N O F W A T E R S U P P L Y
A N D D I S A S T E R P R E P A R E D N E S S
( P A R T I A L R E V I S I O N 1 / 5 / 2 0 1 5 )
Conversations with: Sam Fuller, San Bernardino Valley MWD, July 2007 Ron Buchwald, East Valley, August 2007 Tom Crowley, West Valley, August 2007. Email on August 28. Chris Diggs, Redlands, August 2007 Jack Nelson, Yucaipa Valley, August 2007 Matt Litchfield, August 2007
2005 Urban Water Management Plans: East Valley Water District Fontana Water Company City of Redlands West Valley Water District Yucaipa Valley Water District
F-34

U P P E R S A N T A A N A I N T E G R A T E D R E S O U R C E S W A T E R M A N A G E M E N T P L A N A P P E N D I X F – V U L N E R A B I L I T Y T O C A T A S T R O P H I C I N T E R R U P T I O N O F W A T E R S U P P L Y
A N D D I S A S T E R P R E P A R E D N E S S
( P A R T I A L R E V I S I O N 1 / 5 / 2 0 1 5 )
Attachment 1
Earthquake Literature Search

U P P E R S A N T A A N A I N T E G R A T E D R E S O U R C E S W A T E R M A N A G E M E N T P L A N A P P E N D I X F – V U L N E R A B I L I T Y T O C A T A S T R O P H I C I N T E R R U P T I O N O F W A T E R S U P P L Y
A N D D I S A S T E R P R E P A R E D N E S S
( P A R T I A L R E V I S I O N 1 / 5 / 2 0 1 5 )
This section has been prepared based on the insights included in reports prepared by water agencies outside this IRWM Plan area that summarize their experience and include their after-action reports prepared following earthquakes.
Loma Prieta, California, Earthquake of October 17, 1989. The U.S. Geological Survey’s Professional Paper on the performance of the built environment in the Loma Prieta Earthquake was compiled of a number of separate papers. Information from two of those papers that focused on water systems is discussed here (Schiff, 1998).
A section of the Professional Paper (Le Val Lund, primary author) had the following conclusions:
“On the basis of this preliminary reconnaissance survey, the 1989 Loma Prieta earthquake has reinforced the lessons learned in previous earthquakes that water and wastewater systems should do the following.
Provide emergency power for critical operating, treatment, and support facilities
Maintain portable light plants, generators, chlorinators, and pumps
Develop a separate radio-communication system, independent of the telephone system
Maintain an inventory of repair materials, parts, and fuel
Improve the State-wide and mutual-aid programs
Establish guidelines for State-wide emergency water-quality sampling and public notification
Conduct an earthquake-response assessment of system facilities
Develop an emergency-response plan
Incorporate into local or regional emergency-response plans a more active participation by water and wastewater agencies
Provide a method, possibly computer based, for logging problems and system operations to establish priority for repair activities
Conduct a cross-training program to include all personnel in emergency response
Train personnel in appropriate communication procedures
Conduct regular periodic emergency-response exercises
Provide flexible pipe joints
Provide flexible pipe connections to wells, tanks, pumps, and other rigid structures
FA-1
U P P E R S A N T A A N A I N T E G R A T E D R E S O U R C E S W A T E R M A N A G E M E N T P L A N A P P E N D I X F – V U L N E R A B I L I T Y T O C A T A S T R O P H I C I N T E R R U P T I O N O F W A T E R S U P P L Y
A N D D I S A S T E R P R E P A R E D N E S S
( P A R T I A L R E V I S I O N 1 / 5 / 2 0 1 5 )
Provide adequate anchorage for air valves and other heavy appurtenances that are installed in an inverted-pendulum position
Design mechanical appurtenances in treatment-plant basin facilities for wave action
Provide for a breakaway or fusible connections and (or) safety cables or chains to prevent malfunctioning mechanical equipment from interfering with other equipment in treatment-based basins
Provide for redundancy in water and wastewater systems
Install isolation valves and establish a regular valve-maintenance program
Anchor water-quality-testing equipment and supply cabinets”
A separate section of the Professional Paper (Mark Pickett, primary author) focused in part on the lessons learned from the Loma Prieta Earthquake for utility operations, including preparedness and response. A brief review of the points made on utility operations is below:
Organization. Important improvements in organization that were frequently identified were (1) better definition of leadership roles, (2) clearer statement of unit duties, (3) improved emergency planning to reflect the detailed events that must be dealt with in real disasters, and (4) better preparation through “what if” thinking and plan exercising.
Energy Sources. Points that could provide better preparedness for loss of electrical power included:
o Maintain close relationships with the local electrical-power company to ensure priorities of the utility and the water agency are understood.
o Portable electrical-power generators should be provided with the proper fittings and connections for each intended use. Generators should be periodically tested.
o Permanent engine-driven generator sets should be provided at critical support facilities.
o Regularly scheduled periodic tests should be conducted under load.
Portable Equipment. All utility personnel noted that more portable equipment was needed than was on hand in their organization. Portable equipment needs scheduled maintenance and safe and accessible storage. Personnel need to know how to operate the equipment and the equipment limitations.
Communications and Public Information. Pre-disaster preparation includes development of “fill-in-the-blank” media-release forms, development of procedures to disseminate information to the media, securing of communications equipment and access to communications networks, and preparation for post-disaster investigations.
FA-2

U P P E R S A N T A A N A I N T E G R A T E D R E S O U R C E S W A T E R M A N A G E M E N T P L A N A P P E N D I X F – V U L N E R A B I L I T Y T O C A T A S T R O P H I C I N T E R R U P T I O N O F W A T E R S U P P L Y
A N D D I S A S T E R P R E P A R E D N E S S
( P A R T I A L R E V I S I O N 1 / 5 / 2 0 1 5 )
Inventory. Adequate supplies and access to those supplies needs to be maintained.
Emergency-Response Planning. In general, utility emergency-response plans were not well documented or pre-exercised before the earthquake.
Mutual-Aid Planning. Adequate mutual-aid planning includes coordination with other water agencies, participation in regional meetings and test exercises, preparation to provide aid to adjacent Federal and State organizations, and authorization from fire department officials for utilization of fire engines as booster equipment.
Training. Extensive training of employees is required.
Long-Term Recovery Planning. Recovery planning needs to take into account reconstruction, rate-structure changes, integration of new knowledge into operations, collection of revenues, and record keeping for State or Federal reimbursement.
Northridge Earthquake, California, Magnitude 6.8 Earthquake of January 17, 1994 The National Institute of Standards and Technology report on the lifeline performance in the Northridge Earthquake had the following observations and recommendations concerning the performance of water facilities (Schiff, 1997).
“Seismic performance of dams, large buried reservoirs, and wells in the 1994 Northridge earthquake showed significant improvement from the 1971 San Fernando earthquake. Facilities constructed since the San Fernando earthquake that incorporated lessons learned from that earthquake performed well. These include concrete tanks and pumping stations that were subjected to very strong ground motions. The prestress-concrete water tanks were constructed using criteria more conservative than those contained in AWWA Standards for Wire-Wound Circular Prestressed Water Tanks (AWWA D110).”
“There is a need for performance criteria for water systems so that piping systems and other water system facilities and equipment can be evaluated and seismic specification established in a consistent manner. With performance criteria, water systems performance and the consequences of disruption can be evaluated. With this information a case can be made for getting public support to enhance system performance in a timely and cost-effective manner.”
“The largest impact on water system performance was the failure of water lines, both large supply lines and smaller lines in the distribution system. Most pipeline damage has the result of ground deformations. This earthquake had no surface faulting, but there were many areas with ground deformations in locations that had not previously been predicted. Thus, a general level of improved materials and methods may be needed to improve system performance rather than concentrating on special problems of fault crossings. The uncertainty in predicting the location of damage increases the importance of system
FA-3
U P P E R S A N T A A N A I N T E G R A T E D R E S O U R C E S W A T E R M A N A G E M E N T P L A N A P P E N D I X F – V U L N E R A B I L I T Y T O C A T A S T R O P H I C I N T E R R U P T I O N O F W A T E R S U P P L Y
A N D D I S A S T E R P R E P A R E D N E S S
( P A R T I A L R E V I S I O N 1 / 5 / 2 0 1 5 )
redundancy and alternate supplies from other sources, such as groundwater basins and alternate aqueduct systems for water supplies.”
“Many of the pipe failures appear to be related to cracks in bells that are probably associated with their method of fabrication. There is a need to study the seismic strength of welded steel bell and spigot joints and methods to improve the seismic performance of the joint. The joint performance should be compared with the current (AWWA) Standard for Welded Steel Pipe.”
“The performance of surface-supported tanks was poor and damage was similar to that observed in previous earthquakes. Many of the damaged tanks were old and predate current seismic design standards. The loss of tank contents was frequently associated with failure of input and output pipe connections. These failures are due to the use of cast iron fittings and inadequate flexibility to accommodate the movement of the tank, which was typically lifting rather than sliding. The roofs and upper parts of side walls on several tanks were damaged due to sloshing. Several examples of elephant foot buckling were observed.”
“There is a need for follow up surveys to determine the performance of tanks constructed using current seismic standards and to determine the relative performance of anchored and unanchored tanks. Methods to address the damage due to sloshing should be identified for existing and new tanks. Based on the effect of tank performance on water system performance, the need for reducing the risk of tank damage by improving anchorage, stiffening to prevent buckling, and reducing effects of sloshing can be determined.”
“Sloshing in large basins in water filtration and water reclamation plants caused damage in both 1989 Loma Prieta and the Northridge events. Although not critical, the damaged equipment can cause malfunction of other equipment. For example, sloshing caused the jamming of the chain drive sludge scrapers in seven out of 44 final clarifiers of a water reclamation plant. There is a continuing need to consider sloshing and shaking in the design of mechanical equipment and baffles in large basins of water and wastewater treatment plants.”
“Air and vacuum valves on pipelines are configured in an inverted pendulum above the ground surface. In the Northridge event many valves toppled, had cracked bodies or damaged floats (balls). Also the damage may have been caused by transient pressures in the pipeline. A study is required to improve the performance of these valves in an earthquake.”
“The disruption of commercial power emphasizes the need for reliable emergency power supplies. While emergency power for pumping stations and treatment plants performed well, there were indications that testing units under full load may enhance performance.
FA-4
U P P E R S A N T A A N A I N T E G R A T E D R E S O U R C E S W A T E R M A N A G E M E N T P L A N A P P E N D I X F – V U L N E R A B I L I T Y T O C A T A S T R O P H I C I N T E R R U P T I O N O F W A T E R S U P P L Y
A N D D I S A S T E R P R E P A R E D N E S S
( P A R T I A L R E V I S I O N 1 / 5 / 2 0 1 5 )
“The 1971 San Fernando and 1987 Whittier Narrows earthquakes experience had encouraged water agencies to prepare emergency response plans and establish emergency operations centers. These plans have been tested and implemented by lifeline agencies. Water system emergency response plans generally worked well in the Northridge earthquake. This was attributed to their periodic testing. It is important that plans address expected problems in communicating with personnel and with transportation problems. Because of transportation problems and the disruption of several lifelines, it is important that water system disaster plans make provisions for supporting most needs of their workers, including food and temporary housing. In the recovery after the earthquake, outside contractors may be retained to speed the recovery. It is important that all personnel be aware of OSHA requirements for entering confined spaces, such as large diameter pipes, conduits and tunnels. To improve the performance of utility work crews, utilities should consider providing support for worker families that have been directly affected by the earthquake. For example, this could include providing assistance with getting shelter or help in evaluating damage to homes.”
“Boil water orders were issued as a precaution. Because of the time needed to confirm that water is safe once an order is issued, the public may be needlessly inconvenienced. Consideration should be given to developing a mobile water quality laboratory to expedite, in the field after repairs have been made, the determination if the water is safe for drinking. More rapid methods for evaluating the safety of water should be explored.”
“There is a need for adequate documentation of emergency response and recovery costs. For public utilities, as is the case for most water systems, a record is needed for reimbursement from FEMA. Documentation is also needed to substantiate insurance claims.”
“The disruption of the water supply demonstrated that many critical facilities were not prepared with emergency water supplies or even a means for connecting an external source into their system.”
“This is a need for better public education about the consequences of water system disruption and use of appropriate mitigation measures.”
“While the performance of customer water is outside of the jurisdiction of water utilities, damage to these systems was costly and disruptive in the Northridge earthquake. The Oliveview Hospital, which was reconstructed after experiencing severe damage in the San Fernando earthquake had to be evacuated due to the failure of water systems within the hospital. The vulnerability of water systems in buildings should be evaluated and standards improved to reduce the losses and disruption from these systems.”
This report also addresses damage and repair of supply pipelines. Since supply pipelines are the main facilities of SBVWMD, these estimates may be of particular interest. They are summarized in Table 1.
FA-5
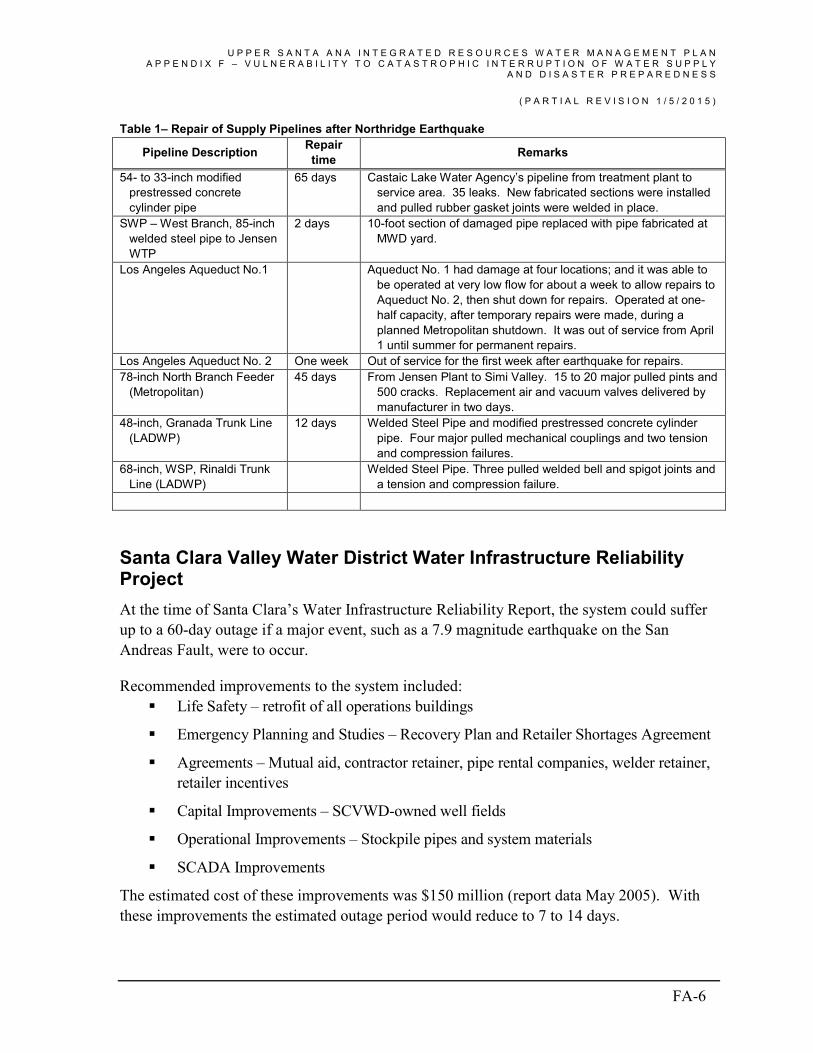
U P P E R S A N T A A N A I N T E G R A T E D R E S O U R C E S W A T E R M A N A G E M E N T P L A N A P P E N D I X F – V U L N E R A B I L I T Y T O C A T A S T R O P H I C I N T E R R U P T I O N O F W A T E R S U P P L Y
A N D D I S A S T E R P R E P A R E D N E S S
( P A R T I A L R E V I S I O N 1 / 5 / 2 0 1 5 )
Table 1– Repair of Supply Pipelines after Northridge Earthquake
Pipeline Description Repair time Remarks
54- to 33-inch modified prestressed concrete cylinder pipe
65 days Castaic Lake Water Agency’s pipeline from treatment plant to service area. 35 leaks. New fabricated sections were installed and pulled rubber gasket joints were welded in place.
SWP – West Branch, 85-inch welded steel pipe to Jensen WTP
2 days 10-foot section of damaged pipe replaced with pipe fabricated at MWD yard.
Los Angeles Aqueduct No.1 Aqueduct No. 1 had damage at four locations; and it was able to be operated at very low flow for about a week to allow repairs to Aqueduct No. 2, then shut down for repairs. Operated at one-half capacity, after temporary repairs were made, during a planned Metropolitan shutdown. It was out of service from April 1 until summer for permanent repairs.
Los Angeles Aqueduct No. 2 One week Out of service for the first week after earthquake for repairs. 78-inch North Branch Feeder
(Metropolitan) 45 days From Jensen Plant to Simi Valley. 15 to 20 major pulled pints and
500 cracks. Replacement air and vacuum valves delivered by manufacturer in two days.
48-inch, Granada Trunk Line (LADWP)
12 days Welded Steel Pipe and modified prestressed concrete cylinder pipe. Four major pulled mechanical couplings and two tension and compression failures.
68-inch, WSP, Rinaldi Trunk Line (LADWP)
Welded Steel Pipe. Three pulled welded bell and spigot joints and a tension and compression failure.
Santa Clara Valley Water District Water Infrastructure Reliability Project At the time of Santa Clara’s Water Infrastructure Reliability Report, the system could suffer up to a 60-day outage if a major event, such as a 7.9 magnitude earthquake on the San Andreas Fault, were to occur.
Recommended improvements to the system included: Life Safety – retrofit of all operations buildings
Emergency Planning and Studies – Recovery Plan and Retailer Shortages Agreement
Agreements – Mutual aid, contractor retainer, pipe rental companies, welder retainer, retailer incentives
Capital Improvements – SCVWD-owned well fields
Operational Improvements – Stockpile pipes and system materials
SCADA Improvements
The estimated cost of these improvements was $150 million (report data May 2005). With these improvements the estimated outage period would reduce to 7 to 14 days.
FA-6
U P P E R S A N T A A N A I N T E G R A T E D R E S O U R C E S W A T E R M A N A G E M E N T P L A N A P P E N D I X F – V U L N E R A B I L I T Y T O C A T A S T R O P H I C I N T E R R U P T I O N O F W A T E R S U P P L Y
A N D D I S A S T E R P R E P A R E D N E S S
( P A R T I A L R E V I S I O N 1 / 5 / 2 0 1 5 )
San Simeon, California, Magnitude 6.5 Earthquake of December 22, 2003 The San Simeon earthquake damaged two of 19 dams in the area.
There was no reported damage to groundwater wells other than the loss of power from a few hours to several days.
Steel water tanks damaged included two in the City of Paso Robles water system, one in a private system serving a mobile home park, three (of four) at the City of Templeton, and an elevated tank in the City of Guadalupe.
Pipeline breaks were reported in most purveyor systems (Lund, 2003).
Denali, Alaska, Magnitude 7.9 Earthquake of November 3, 2002 Population near the epicenter is limited to about 10,000 people in rural locations. Nearly all residents rely on private wells for water supply. Two events of well casings ejecting out of the ground were reported. These events may be attributed to accumulated frost heave forces on casing pipe that lost its soil resistance temporarily due to shaking and/or liquefaction.
City of San Diego In 2001, the City of San Diego completed a study of the expected operational performance of the City of San Diego Water Supply pipelines when exposed to possible future scenario earthquakes. The analysis used a specialized GIS software package.
For the most serious earthquake, the study determined that it would take 1.7 days to stabilize the system, 20 days to restore backbone pipes, 35 days to restore distribution pipes, and 74 days to complete all pipe repairs.
The study also examined the costs and benefits of different seismic improvement programs and developed benefit/cost ratios for each program (Collins, 2001).
While the City of San Diego has a large number of reservoirs in the distribution system, this study did not examine those systems.
City of Vancouver, Canada In 2000, the City of Vancouver completed a study of the expected operational performance of the Regional Water Distribution System. In the event of a Design Basis Earthquake, a 475-year event, the report concluded the following (JELC Working Committee, 2000):
FA-7
U P P E R S A N T A A N A I N T E G R A T E D R E S O U R C E S W A T E R M A N A G E M E N T P L A N A P P E N D I X F – V U L N E R A B I L I T Y T O C A T A S T R O P H I C I N T E R R U P T I O N O F W A T E R S U P P L Y
A N D D I S A S T E R P R E P A R E D N E S S
( P A R T I A L R E V I S I O N 1 / 5 / 2 0 1 5 )
1. The present system will be severely impacted. Chlorine facilities evaluated have life safety concerns. Fiberglass tanks containing sodium hypochlorite and ammonia may overturn due to lack of anchorage.
2. An estimated 30 pipeline failures will occur, making much of the system inoperable.
3. All pump stations that were evaluated will likely be inoperable as a result of nonstructural and, in some cases, structural damage. All but two pump stations are dependent on commercial power. If power is out, pump stations without self-contained power will be inoperable.
4. All reservoir roofs/column supports are vulnerable. Some may collapse. In general, tanks should remain operable.
A later discussion of the development of an alternate water supply for Vancouver proposed development of procedures to allow use of two existing irrigation wells for potable supply should the city’s supplies from reservoirs fail in an earthquake. In addition, a dedicated fire protection system, possibly supplied with sea water, was proposed (City of Vancouver).
San Fernando, California, Magnitude 6.7 Earthquake of 1971 Immediately following the earthquake, approximately 100,000 customers were without water, and a citywide “boil water” advisory was issued. Within 5 days, water service was restored to all but a few thousand customers; after 10 days, less than 100 scattered customers were without water. All “boil water” orders were lifted after 12 days (Housing and Urban Development, 2001).
Two dams, Van Norman and Pacoima were seriously damaged by this earthquake. Van Norman was replaced and Pacoima was repaired.
Kobe, Japan, Magnitude 6.8 Earthquake of January 17, 1995 An estimated 2,000 water pipeline failures occurred, draining reservoirs and limiting water available for fire suppression. Transmission and distribution pipeline and water purification plant damage resulted in 300,000 people still without water one month following the earthquake.
An aggressive earthquake mitigation program had replaced most of the city’s cast iron pipe prior to the earthquake. Without that, program failures and restoration time could have been far greater. About 6 percent of Kobe’s ductile iron pipe had a special seismic joint that appears to have had little or no damage. An earthquake monitoring and control system isolated 18 reservoirs saving the water for drinking in the days following the event.
FA-8

U P P E R S A N T A A N A I N T E G R A T E D R E S O U R C E S W A T E R M A N A G E M E N T P L A N A P P E N D I X F – V U L N E R A B I L I T Y T O C A T A S T R O P H I C I N T E R R U P T I O N O F W A T E R S U P P L Y
A N D D I S A S T E R P R E P A R E D N E S S
( P A R T I A L R E V I S I O N 1 / 5 / 2 0 1 5 )
The earthquake monitoring and control system consists of an earthquake ground motion monitoring center, telemetry, and reservoirs with earthquake isolation valves at 21 locations. There are dual reservoirs at each of the 21 sites; one has an isolation valve to be controlled following an earthquake, and one does not. This concept allows shutdown of one reservoir while maintaining service should the second reservoir inadvertently shut down. If the system can keep up with system leakage, the isolated reservoir can be put back on line from the control center. If the system cannot keep up with demand, the reservoir remains isolated (Ballantyne, 1995).
There were two major issues identified that had delayed system restoration:
No water pressure was available to check the repairs while the tunnels remained out of service.
Access – limited by collapsed buildings and traffic congestion.
California Division of Mines and Geology Planning Scenarios The California Division of Mines and Geology has prepared two special publications intended to provide an understanding of the impacts of major earthquakes in southern California. The first was a Magnitude 8.3 Earthquake on the San Andreas Fault (California, 1982). The second was a magnitude 7 earthquake on the San Bernardino Valley segment of the San Jacinto Fault (California, 1993). Both studies anticipate significant damage to the State Water Project. That information is discussed in a later section of this report that focuses on the State Water Project. Impacts to other water facilities in the SBVWMD service area are discussed here.
The San Andreas publication hypothesized an earthquake in which the southern limit of surface fault rupture is outside of the San Bernardino service area (approximately 10 miles northwest of Devil Canyon Power Plant). Thus, it does not directly address facilities within the San Bernardino service area. Within the area that is affected (generally west and north of San Bernardino), it does not anticipate widespread damage to primary transmission lines, although some pipe failures will occur. In distribution lines, there will be hundreds of breaks and thousands of leaks. Pumping plants are generally more compact structures and, with the exception of related electrical equipment and transformers, will probably not suffer as great of damage as distribution pipelines.
The San Jacinto publication hypothesized an earthquake within Valley District’s service area and thus, substantially more impact on SBVWMD. The publication’s planning scenario states that within 25 miles of the fault, damage to treatment facilities, pumping stations, and transmission and distribution pipelines will reduce service by 20 percent for up to five days. Restoration will take up to two weeks. People will be asked to use emergency supplies, boil their water, or take other safety measures against contamination. Delays will be necessary because waste water lines must be repaired before fresh water lines. The most serious
FA-9
U P P E R S A N T A A N A I N T E G R A T E D R E S O U R C E S W A T E R M A N A G E M E N T P L A N A P P E N D I X F – V U L N E R A B I L I T Y T O C A T A S T R O P H I C I N T E R R U P T I O N O F W A T E R S U P P L Y
A N D D I S A S T E R P R E P A R E D N E S S
( P A R T I A L R E V I S I O N 1 / 5 / 2 0 1 5 )
problems will be concentrated in the low lying areas of San Bernardino and the Santa Ana River Basin. The extent of damage and contamination of wells and groundwater will depend on groundwater levels at the time of the earthquake.
Specific failures hypothesized by the San Jacinto publication to facilities that convey SBVWMD water include (State Water Project facilities are discussed in a later section):
San Gabriel Valley MWD’s pipeline closed for 5 to 10 days. Fault displacement.
Valley District’s Foothill Pipeline closed for 4 to 6 days. Moderate liquefaction potential.
Valley District’s Baseline Feeder closed for 4 to 6 days.
The main source for this hypothesis was the then General Manager of SBVWMD, Louis Fletcher.
Regional Electrical System Vulnerability During this evaluation, no recent information was available from Southern California Edison on the anticipated likelihood of a widespread failure of the electrical system serving the San Bernardino Area. Nor was information found on the times required to restore power after the Loma Prieta Earthquake. In the absence of that data, we reviewed the impacts of the Northridge earthquake.
The total generating capacity supplying the greater Los Angeles area at the time of the Magnitude 6.8 Northridge Earthquake of January 17, 1994, was approximately 10,000 MW. When the earthquake occurred at 4:30 AM the southern California area was exporting approximately 1800 MW to the Northwest over AC and DC interties that link Southern California to Oregon and Washington State. As a result of the earthquake, the AC and DC interties were opened and the power grid in the United States west of Denver was spilt into three separate islands. Due to the loss of power, there were short-term outages, up to three hours, in British Columbia, Montana, Wyoming, Idaho, Oregon, and Washington.
Within the City of Los Angeles, restoration times of power at major substations varied from 6:18 AM to 11:03 PM on the day of the earthquake. Due to distribution system failures, power remained out for a longer period for some customers. But, within 24 hours power was restored to over 90 percent of its customers. Had the earthquake occurred during the summer when loads are heavier, restoration would have taken longer.
FA-10