APPENDIX F HYDRAULICS OF BAFFLES - Caltrans F - Hydraulics of... · HYDRAULICS OF BAFLES F.1...
17
Caltrans Fish Passage Design for Road Crossings Appendix F – Hydraulics of Baffles August 2009 APPENDIX F HYDRAULICS OF BAFFLES
Transcript of APPENDIX F HYDRAULICS OF BAFFLES - Caltrans F - Hydraulics of... · HYDRAULICS OF BAFLES F.1...

Caltrans Fish Passage Design for Road Crossings
Appendix F – Hydraulics of Baffles August 2009
APPENDIX F
HYDRAULICS OF BAFFLES

Caltrans Fish Passage Design for Road Crossings
Appendix F – Hydraulics of Baffles Page F-1 August 2009
F. HYDRAULICS OF BAFLES F.1 Baffled Culvert Research Overview During the period from Summer 2004 through Fall 2008, Humboldt State University (HSU) conducted baffled culvert research, requested and funded by Caltrans, with goals of quantifying impacts on hydraulic capacity and identifying appropriate design and analysis methods. This research was led by Professor Margaret Lang and concentrated on the changes in culvert hydraulic performance under higher flow conditions due to the addition of baffles. Prior to the HSU research effort, analyzing and modeling culverts retrofitted with baffles under high/flood flows have been somewhat crude. This shortfall justified the need for research in hopes of increasing accuracy in analysis and possibly reducing the amount of conservatism that has typically been applied to the design of baffles in culvert rehabilitation.
Previously, research performed by others such as Rajaratnam and Katopodis, focused on baffled culvert performance during lower flows when fish would be migrating through a culvert. Under these lower flow conditions, the individual baffles operate as weirs where water plunges over a baffle into the pool between two successive baffles. When flows are higher and baffles are fully overtopped, water streams over them and they become a roughness element inside a culvert and no longer act as weirs (See Figure F.1). As flow depth increases above a baffle, their roughness influence on the culvert hydraulics decreases. In addition, culvert hydraulics are affected by spacing, height and configuration of baffles. This higher flow condition was examined at baffled culvert sites in the field, recreated and analyzed in the laboratory, and modeled using computer software by the HSU research team.
Figure F.1 Plunging Flow vs. Streaming Flow
Caltrans Fish Passage Design for Road Crossings
Appendix F – Hydraulics of Baffles Page F-2 August 2009
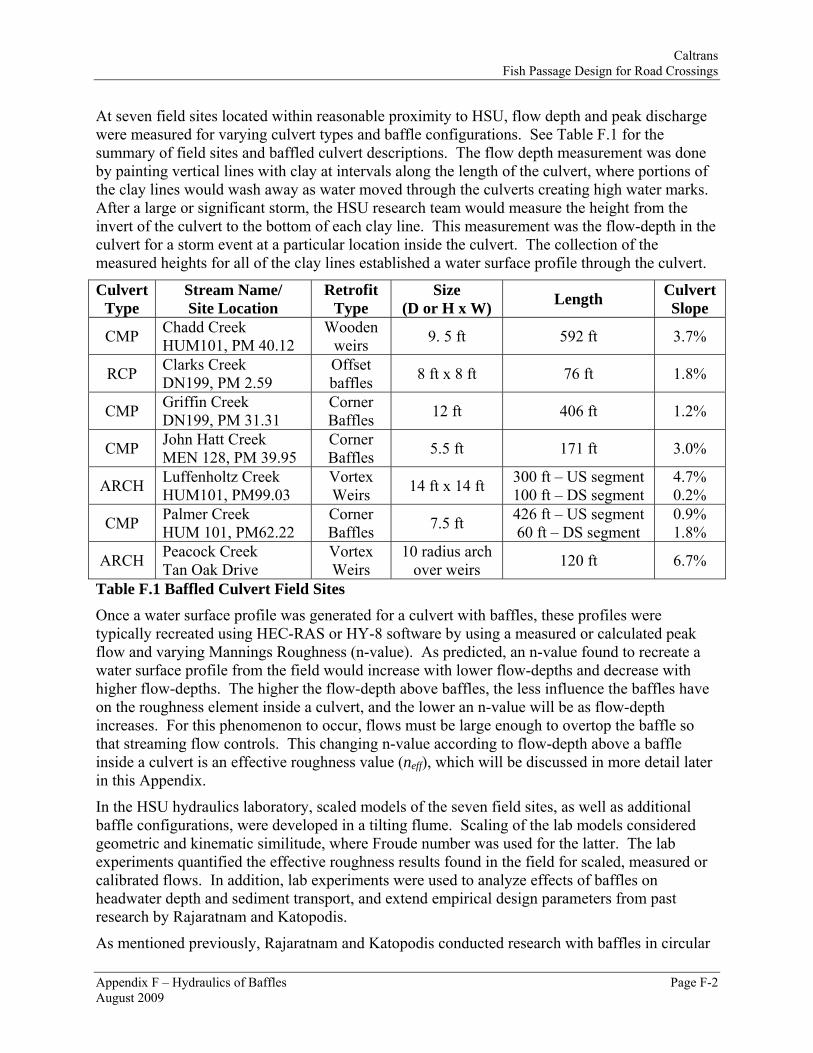
At seven field sites located within reasonable proximity to HSU, flow depth and peak discharge were measured for varying culvert types and baffle configurations. See Table F.1 for the summary of field sites and baffled culvert descriptions. The flow depth measurement was done by painting vertical lines with clay at intervals along the length of the culvert, where portions of the clay lines would wash away as water moved through the culverts creating high water marks. After a large or significant storm, the HSU research team would measure the height from the invert of the culvert to the bottom of each clay line. This measurement was the flow-depth in the culvert for a storm event at a particular location inside the culvert. The collection of the measured heights for all of the clay lines established a water surface profile through the culvert.
Culvert Type
Stream Name/ Site Location
Retrofit Type
Size (D or H x W) Length Culvert
Slope
CMP Chadd Creek HUM101, PM 40.12
Wooden weirs 9. 5 ft 592 ft 3.7%
RCP Clarks Creek DN199, PM 2.59
Offset baffles 8 ft x 8 ft 76 ft 1.8%
CMP Griffin Creek DN199, PM 31.31
Corner Baffles 12 ft 406 ft 1.2%
CMP John Hatt Creek MEN 128, PM 39.95
Corner Baffles 5.5 ft 171 ft 3.0%
ARCH Luffenholtz Creek HUM101, PM99.03
Vortex Weirs 14 ft x 14 ft 300 ft – US segment
100 ft – DS segment 4.7% 0.2%
CMP Palmer Creek HUM 101, PM62.22
Corner Baffles 7.5 ft 426 ft – US segment
60 ft – DS segment 0.9% 1.8%
ARCH Peacock Creek Tan Oak Drive
Vortex Weirs
10 radius arch over weirs 120 ft 6.7%
Table F.1 Baffled Culvert Field Sites Once a water surface profile was generated for a culvert with baffles, these profiles were typically recreated using HEC-RAS or HY-8 software by using a measured or calculated peak flow and varying Mannings Roughness (n-value). As predicted, an n-value found to recreate a water surface profile from the field would increase with lower flow-depths and decrease with higher flow-depths. The higher the flow-depth above baffles, the less influence the baffles have on the roughness element inside a culvert, and the lower an n-value will be as flow-depth increases. For this phenomenon to occur, flows must be large enough to overtop the baffle so that streaming flow controls. This changing n-value according to flow-depth above a baffle inside a culvert is an effective roughness value (neff), which will be discussed in more detail later in this Appendix.
In the HSU hydraulics laboratory, scaled models of the seven field sites, as well as additional baffle configurations, were developed in a tilting flume. Scaling of the lab models considered geometric and kinematic similitude, where Froude number was used for the latter. The lab experiments quantified the effective roughness results found in the field for scaled, measured or calibrated flows. In addition, lab experiments were used to analyze effects of baffles on headwater depth and sediment transport, and extend empirical design parameters from past research by Rajaratnam and Katopodis.
As mentioned previously, Rajaratnam and Katopodis conducted research with baffles in circular

Caltrans Fish Passage Design for Road Crossings
Appendix F – Hydraulics of Baffles Page F-3 August 2009
culverts mainly for lower flows, but they also executed experiments for baffled culverts operating up to 80% flow capacity. Through this research, a relationship between dimensionless discharge (Q*) and dimensionless depth (yo/D) were derived.
Circular Culverts: ⎟⎟⎠
⎞⎜⎜⎝
⎛==
D
yC
DgS
QQ o
a
o5*
Through the HSU study, it was found that the dimensionless discharge equation could be modified for box culverts. This modified equation is expressed below:
Box Culverts: ⎟⎟⎠
⎞⎜⎜⎝
⎛==
zy
CWgS
QQ oa
o max5*
Where:
C & a = Experimental design parameters
D = Circular culvert diameter
W = Box culvert width
zmax = Maximum baffle height
yo = Flow depth
So = Culvert slope
Q = Actual discharge
G = Gravity
The HSU team built upon the Rajaratnam and Katopodis past research and determined C and a values for several baffle configurations through their flume experiments. The benefit of the equations above is that the C and a values determined from the scaled experiments apply directly to geometrically similar full-scale baffled culverts without having to use factors or other equations to relate scaled lab results to full-scale field design.
In the analysis/design of baffled culverts, the dimensionless discharge equation will be most used in the form below to solve for flow depth (yo):
Circular Culverts: a
oo
DgSC
QDy
1
5 ⎥⎥
⎦
⎤
⎢⎢
⎣
⎡=
Or
Box Culverts: a
oo
WgSC
Qzy
1
5max ⎥⎥
⎦
⎤
⎢⎢
⎣
⎡=
At the HSU lab, C and a values were determined for box culverts with many combinations of high, medium, or low height baffles and close, intermediate, and far-spaced baffles. The box

Caltrans Fish Passage Design for Road Crossings
Appendix F – Hydraulics of Baffles Page F-4 August 2009
culvert was the main shape of focus for developing experimental parameters in the determination of effective roughness, partly because it is commonly found in the field. It was also the main focus due to its typical wide cross section and smooth surface that can be poor in creating fish friendly environments that ideally have high depth and low velocity. As for circular culverts, the most common culvert shape, the C and a values were developed in the lab for corner baffles. This type of baffle retrofit type is most widely recommended for circular culverts by the resource agencies (i.e. CA Fish & Game, etc).
The configuration and corresponding C and a values are summarized in Table F.2, which are suggested baffle configurations for Caltrans projects. Also, see Figures F.2, F.3, F.4, and F.5 for plan view and box/circular cross-sectional views.
Culvert Shape Retrofit Type
Baffle Height
(ft)
Baffle Spacing
(ft)
Wall Angle in Plan View (Degrees)
C a
Box High Height,
Close-Spaced, Full Span, Top Angled
Baffle
zmin = 0.13W zmax = 0.20W 0.5W 60 0.122 1.85
Box Medium Height,
Close-Spaced, Full Span, Top Angled
Baffle
zmin = 0.09W zmax = 0.16W 0.5W 60 0.123 1.70
Box Low Height, Close-Spaced, Full Span, Top Angled Baffle
zmin = 0.05W zmax = 0.11W 0.5W 60 0.113 1.64
Box High Height, Intermediate-
Spaced, Full Span, Top Angled Baffle
zmin = 0.13W zmax = 0.20W 0.75W 60 0.139 1.82
Box Medium Height,
Intermediate-Spaced, Full Span, Top Angled Baffle
zmin = 0.09W zmax = 0.16W 0.75W 60 0.125 1.82
Box Low Height, Intermediate-
Spaced, Full Span, Top Angled Baffle
zmin = 0.05W zmax = 0.11W 0.75W 60 0.119 1.68
Box High Height, Far-Spaced, Full Span, Top Angled Baffle
zmin = 0.13W zmax = 0.20W W 60 0.169 1.79
Box Medium Height, Far-Spaced, Full
Span, Top Angled Baffle
zmin = 0.09W zmax = 0.16W W 60 0.166 1.73
Box Low Height, Far-
Spaced, Full Span, Top Angled Baffle
zmin = 0.05W zmax = 0.11W W 60 0.180 1.64
Circular Corner Baffle z = 0.10D zmax = 0.13D 0.5W 90 7.81 2.63
W = Box Culvert Width D = Circular Culvert Diameter
Table F.2 Experimental “C” and “a” Parameters

Caltrans Fish Passage Design for Road Crossings
Appendix F – Hydraulics of Baffles Page F-5 August 2009
In Table F.2, baffle recommendations for arch culverts are not addressed. Contact HQ Hydraulics for arch culvert potential baffle configuration and analysis methods.
Figure F.2 Top-Angled Baffle Cross Section For Box Culverts
Figure F.3 Corner Baffle Cross Section For Circular Culverts

Caltrans Fish Passage Design for Road Crossings
Appendix F – Hydraulics of Baffles Page F-6 August 2009
Figure F.4 Top-Angled Baffle (Full-Spanning) Plan View
Figure F.5 Corner Baffle (Partial Spanning) Plan View

Caltrans Fish Passage Design for Road Crossings
Appendix F – Hydraulics of Baffles Page F-7 August 2009
From collecting data at existing field sites, performing scaled model testing, and developing computer models using software, effects of baffles on culvert performance during larger flows were determined. Based on this research, recommendations for minimizing headwater changes and sediment accumulation in culverts have been made. In addition, a method for analyzing baffled culvert hydraulics under larger flows was developed through the calculation of effective roughness. In sections following this research overview, application of the research results will be presented.
F.2 Baffle Configuration, Height, and Spacing As seen in Figure F.4, the suggested baffles for box culverts are to be constructed at a 60-degree angle with the culvert wall in plan view. From flume experiments at HSU, large wall angles (90-degrees) provide a more blunt projection to the flow projecting to the flow promoting increased flow resistance and higher headwater, as well as increased average culvert flow depths. Smaller wall angles, as low as 30-degrees, create lower average flow depths inside a culvert and lower headwater. The smaller wall angles also produce higher velocities.
From solely a fish passage perspective, higher flow depths and subsequent lower velocities are attractive. When viewing the culvert strictly as a water conveyance structure, higher depths in the culvert, higher headwater, and low velocity mean reduced capacity and function. The compromise from the two perspectives (fish conveyance vs. water conveyance) is to have a reasonable increase in headwater and flow depth with decreased velocity so that fish can pass through a culvert without inundating capacity. This compromise is the suggested 60-degree culvert wall and baffle in plan view.
In the corner baffle configuration for circular culverts seen in Figure F.5, a 90-degree wall angle is the recommendation, if not an informal standard. This configuration is widely accepted by agencies, such as CA Fish & Game and NMFS. The corner baffle partially spans a culvert and provides wall roughness with a minimal potential for debris catchment. Even though the 90-degree wall angle is blunt, its effect on increasing headwater and flow depth is less given its partial span and steep top angle. With this stated, the corner baffle will still promote reasonable passage of adult and juvenile fish with the benefit of minimal changes to culvert capacity.
As for the slope on the top of both box and circular culvert baffles, this slope will provide smoother changes in water surface and less turbulence in the pools between baffles compared to a baffle with constant height. Similar to the reasoning behind placing baffles in an angled orientation in plan view, the sloped baffles in cross section will provide increased flow depth and decreased velocity without harshly affecting culvert flow depth and headwater.
In addition to baffle configuration, spacing and height (zmax) of baffles play a significant role in their ability to improve culvert fish passage without adversely affecting a culvert’s ability to convey water. The design baffle height and corresponding spacing combination can vary to achieve acceptable depth and velocity, which means that multiple solutions or combinations can exist for a given site. The combination with the lowest height and maximum spacing that will achieve appropriate depth and velocity should be first consideration since it will have the least effect on culvert headwater, capacity, and sediment transport.
The majority of existing culverts that require baffle retrofits have steep slopes and operate under inlet control, which means that the placement or location of the most upstream baffle can greatly affect the headwater elevation. From the scaled model testing at HSU, the headwater depths in

Caltrans Fish Passage Design for Road Crossings
Appendix F – Hydraulics of Baffles Page F-8 August 2009
inlet control culverts were higher when the most upstream baffles were close to the culvert inlet. In general, the optimum distance having the least affect on headwater between the most upstream baffle and the culvert inlet is 0.5W to 1.4W for box culverts or 0.5D to 1.4D for circular culverts. For Caltrans projects, it is recommended to place the most upstream baffle at 1.0W or 1.0D downstream of the culvert inlet with the lowest possible baffle height (zmax) so that headwater impact is minimized.
Through the HSU scaled model testing with introduced sediment, it was found that the lowest possible height (zmax) used in conjunction with the largest spacing yielded the least amount of sediment trapping in a baffled culvert. As seen in the field and in the flume, sediment typically builds up the most between the upstream baffle and the inlet, and sediment slowly fills in the downstream pools between baffles. The problem with sediment trapping in the downstream pools is that the baffles will no longer function, and the culvert barrel roughness will subsequently decrease creating shallow depths and high velocities. When baffles are far-spaced having low height, the accumulation of sediment in the downstream pools was fairly insignificant. Therefore, it is recommended that the lowest height (zmax) of baffle be used in conjunction with the greatest spacing to avoid significant sediment accumulation while maintaining proper depth and velocity for fish passage.
In order to determine a preliminary (first trial) baffle height and spacing combination, see Figure F.6 and associated equations. In Figure F.6, a pool between two baffles is shown inside an existing culvert. A line representing level water surface has been drawn from the top of the upstream side of the downstream baffle to the downstream side of the upstream baffle. By using the equations below, a trial baffle height (h1 = zmax) can be assumed and a corresponding baffle spacing can be calculated based on the CDFG and NMFS minimum pool depth (h3), or baffle spacing can be assumed and a corresponding baffle height (h1 = zmax) can be calculated. Again, this combination of baffle height and spacing is preliminary. After using the method below, it must be verified that proper fish passage depths and velocities have been met through the low and high fish passage modeling procedure outlined in Section F.4 and F.6 or F.7. Also, energy dissipation factor (EDF) criteria and procedure must be met and followed in Section F.5.
Figure F.6 Baffle Height and Spacing Diagram
Caltrans Fish Passage Design for Road Crossings
Appendix F – Hydraulics of Baffles Page F-9 August 2009
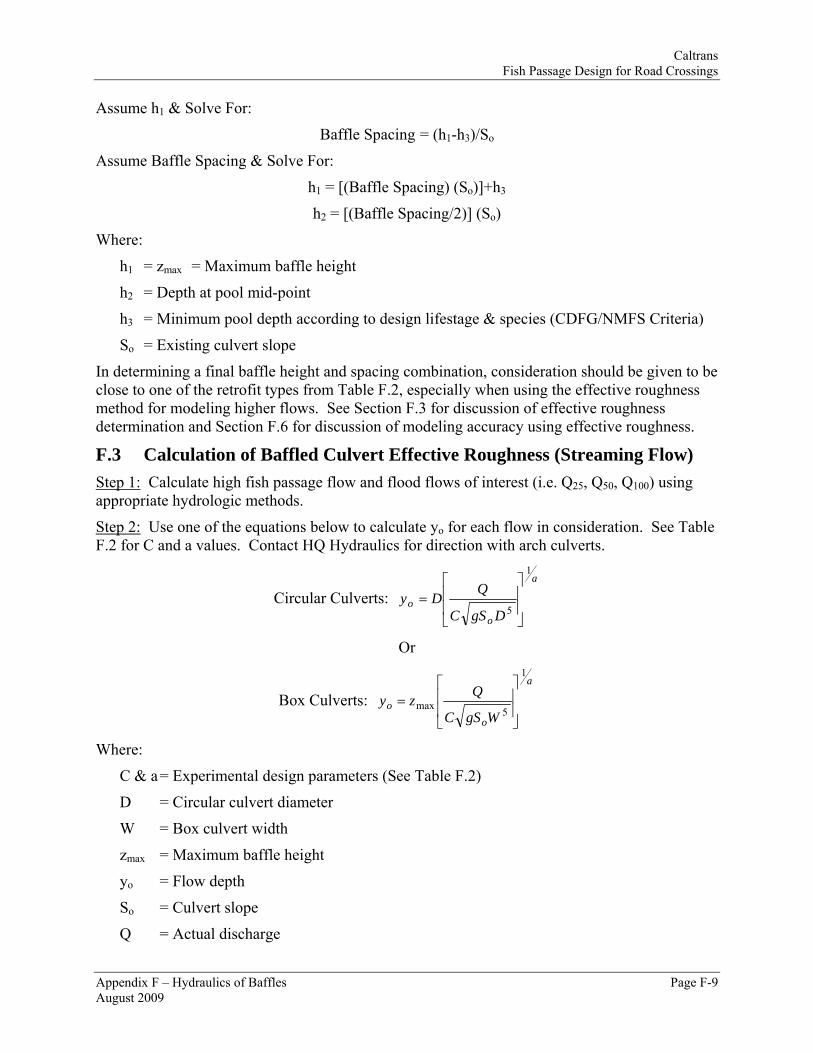
Assume h1 & Solve For:
Baffle Spacing = (h1-h3)/So
Assume Baffle Spacing & Solve For:
h1 = [(Baffle Spacing) (So)]+h3
h2 = [(Baffle Spacing/2)] (So)
Where:
h1 = zmax = Maximum baffle height
h2 = Depth at pool mid-point
h3 = Minimum pool depth according to design lifestage & species (CDFG/NMFS Criteria)
So = Existing culvert slope
In determining a final baffle height and spacing combination, consideration should be given to be close to one of the retrofit types from Table F.2, especially when using the effective roughness method for modeling higher flows. See Section F.3 for discussion of effective roughness determination and Section F.6 for discussion of modeling accuracy using effective roughness.
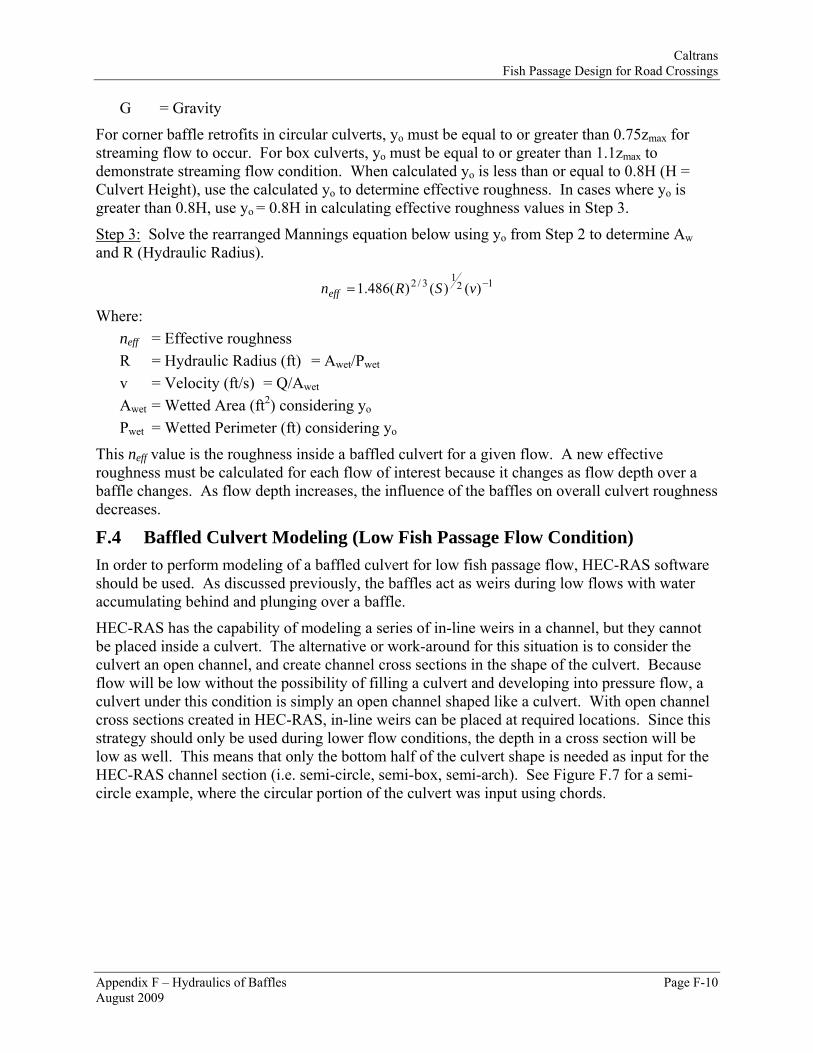
F.3 Calculation of Baffled Culvert Effective Roughness (Streaming Flow) Step 1: Calculate high fish passage flow and flood flows of interest (i.e. Q25, Q50, Q100) using appropriate hydrologic methods.
Step 2: Use one of the equations below to calculate yo for each flow in consideration. See Table F.2 for C and a values. Contact HQ Hydraulics for direction with arch culverts.
Circular Culverts: a
oo
DgSC
QDy
1
5 ⎥⎥
⎦
⎤
⎢⎢
⎣
⎡=
Or
Box Culverts: a
oo
WgSC
Qzy
1
5max ⎥⎥
⎦
⎤
⎢⎢
⎣
⎡=
Where:
C & a = Experimental design parameters (See Table F.2)
D = Circular culvert diameter
W = Box culvert width
zmax = Maximum baffle height
yo = Flow depth
So = Culvert slope
Q = Actual discharge
Caltrans Fish Passage Design for Road Crossings
Appendix F – Hydraulics of Baffles Page F-10 August 2009
G = Gravity
For corner baffle retrofits in circular culverts, yo must be equal to or greater than 0.75zmax for streaming flow to occur. For box culverts, yo must be equal to or greater than 1.1zmax to demonstrate streaming flow condition. When calculated yo is less than or equal to 0.8H (H = Culvert Height), use the calculated yo to determine effective roughness. In cases where yo is greater than 0.8H, use yo = 0.8H in calculating effective roughness values in Step 3.
Step 3: Solve the rearranged Mannings equation below using yo from Step 2 to determine Aw and R (Hydraulic Radius).
1213/2 )()()(486.1 −= vSRneff
Where: neff = Effective roughness R = Hydraulic Radius (ft) = Awet/Pwet v = Velocity (ft/s) = Q/Awet
Awet = Wetted Area (ft2) considering yo
Pwet = Wetted Perimeter (ft) considering yo
This neff value is the roughness inside a baffled culvert for a given flow. A new effective roughness must be calculated for each flow of interest because it changes as flow depth over a baffle changes. As flow depth increases, the influence of the baffles on overall culvert roughness decreases.
F.4 Baffled Culvert Modeling (Low Fish Passage Flow Condition) In order to perform modeling of a baffled culvert for low fish passage flow, HEC-RAS software should be used. As discussed previously, the baffles act as weirs during low flows with water accumulating behind and plunging over a baffle.
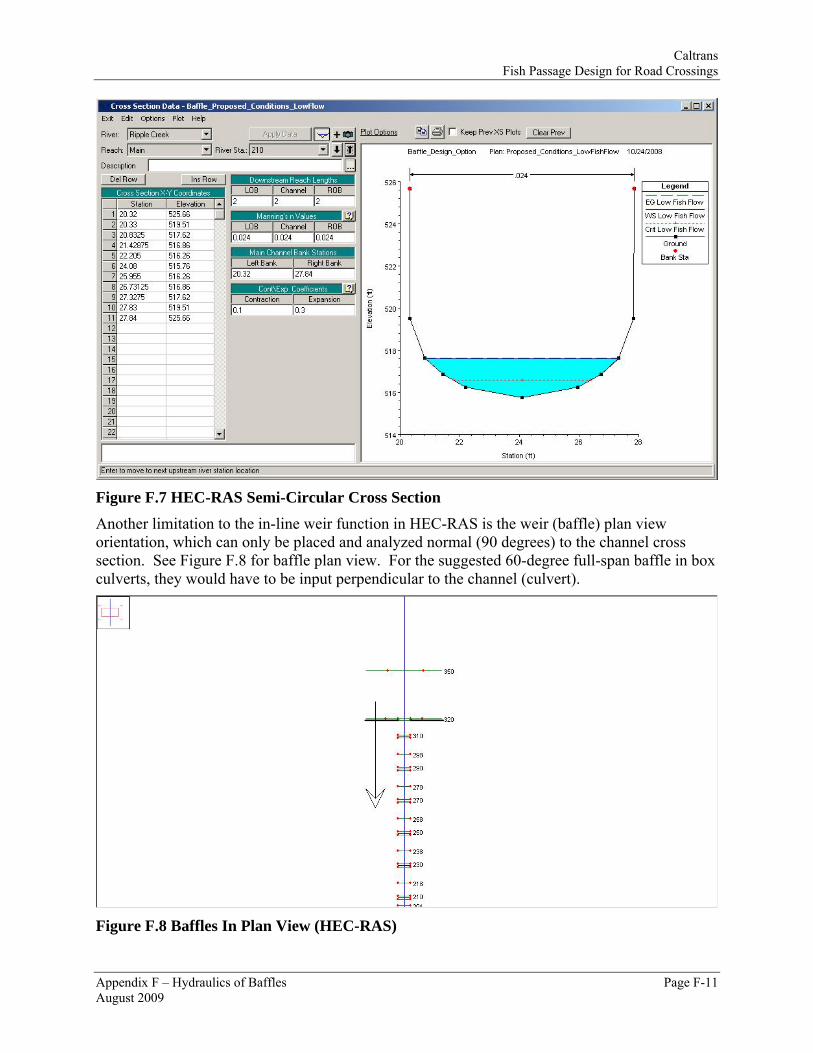
HEC-RAS has the capability of modeling a series of in-line weirs in a channel, but they cannot be placed inside a culvert. The alternative or work-around for this situation is to consider the culvert an open channel, and create channel cross sections in the shape of the culvert. Because flow will be low without the possibility of filling a culvert and developing into pressure flow, a culvert under this condition is simply an open channel shaped like a culvert. With open channel cross sections created in HEC-RAS, in-line weirs can be placed at required locations. Since this strategy should only be used during lower flow conditions, the depth in a cross section will be low as well. This means that only the bottom half of the culvert shape is needed as input for the HEC-RAS channel section (i.e. semi-circle, semi-box, semi-arch). See Figure F.7 for a semi-circle example, where the circular portion of the culvert was input using chords.
Caltrans Fish Passage Design for Road Crossings
Appendix F – Hydraulics of Baffles Page F-11 August 2009
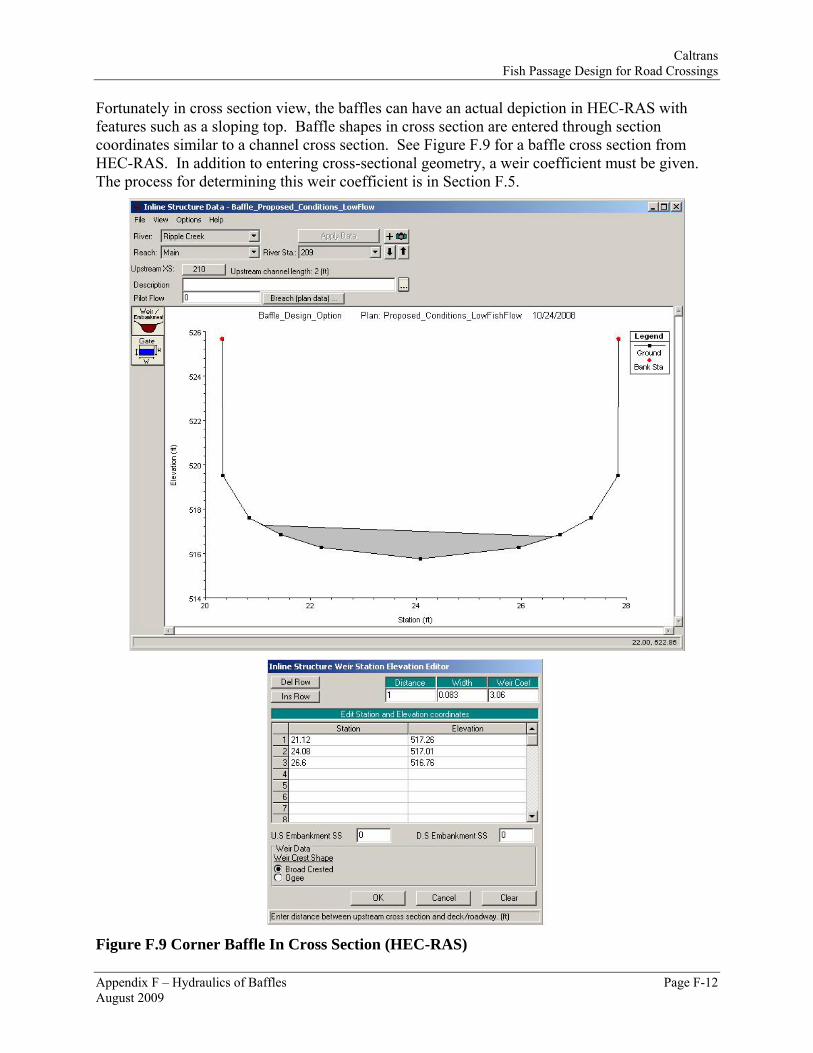
Figure F.7 HEC-RAS Semi-Circular Cross Section Another limitation to the in-line weir function in HEC-RAS is the weir (baffle) plan view orientation, which can only be placed and analyzed normal (90 degrees) to the channel cross section. See Figure F.8 for baffle plan view. For the suggested 60-degree full-span baffle in box culverts, they would have to be input perpendicular to the channel (culvert).
Figure F.8 Baffles In Plan View (HEC-RAS)
Caltrans Fish Passage Design for Road Crossings
Appendix F – Hydraulics of Baffles Page F-12 August 2009
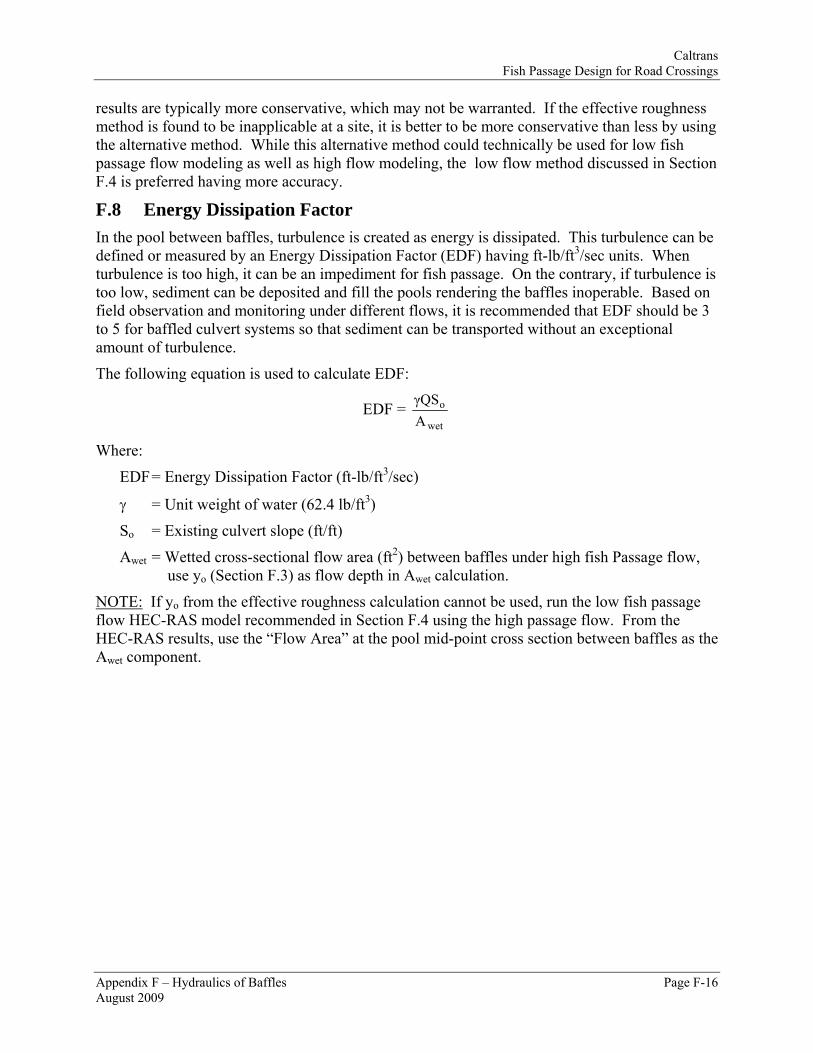
Fortunately in cross section view, the baffles can have an actual depiction in HEC-RAS with features such as a sloping top. Baffle shapes in cross section are entered through section coordinates similar to a channel cross section. See Figure F.9 for a baffle cross section from HEC-RAS. In addition to entering cross-sectional geometry, a weir coefficient must be given. The process for determining this weir coefficient is in Section F.5.
Figure F.9 Corner Baffle In Cross Section (HEC-RAS)

Caltrans Fish Passage Design for Road Crossings
Appendix F – Hydraulics of Baffles Page F-13 August 2009
Once the cross sections representing the culvert and the “regular” stream cross sections have been entered, as well as the in-line weirs representing baffles, HEC-RAS can be executed for the low fish passage flow. Flow-depth can be checked at appropriate cross sections and compared to CA Fish & Game and NMFS criteria. In order to develop an accurate water surface profile, it is recommended that at least three cross sections be created between weirs (baffles): one cross section immediately downstream of a weir (baffle), one cross section at the mid-point of the pool between weirs (baffles), and one cross section just upstream of a weir (baffle). The most critical cross section, which will have the lowest depth, is the one immediately downstream of a weir (baffle) within the plunge pool. Depth at this cross section especially, as well as the other cross sections, should meet minimum design criteria.
F.5 Determination of Weir Coefficient By following the iterative procedure below that uses Table F-3 from HEC-22, a weir coefficient can be determined for use in modeling a baffled culvert during the low fish passage condition. When metal baffles are used, such as typical corner baffles, its thickness (breadth of crest of weir) is less than 1 inch. In Table F.3, the smallest thickness is 0.5 feet. For cases like this where baffle thickness (breadth of crest of weir) is thin, it is recommended to use weir coefficients associated with 0.5 feet according to the Head found in HEC-RAS. Thin metal baffles are technically operating as sharp-crested weirs, but HEC-RAS will only recognize broad-crested weirs and use these equations. The amount of error in using broad crested weir equations for sharp-crested weirs is not great, and will yield a conservative solution. For other baffle materials, such as concrete, their thickness is typically 0.5 feet or greater and will qualify as broad-crested weirs.
Step A: Estimate the highest weir coefficient using the highest head for the previously calculated crest width (breadth of crest of weir) from Table F.3 Broad Crested Weir Coefficient.
Step B: Run the proposed HEC-RAS model and find the average head (weir average depth) over a baffle for the Low Fish Passage Flow from HEC-RAS results.
Step C: Given the average head (weir average depth) from the HEC-RAS results and the crest width (breadth of crest of weir), find a second weir coefficient from Table F.3 Broad Crested Weir Coefficient.
Step D: Run the proposed HEC-RAS model with the second weir coefficient from Step C and find the average head (weir average depth) over a baffle for the Low Fish Passage Flow from HEC-RAS results.
Step E: Given the average head (weir average depth) from the HEC-RAS results and the crest width (breadth of crest of weir), find a third weir coefficient from Table F.3 Broad Crested Weir Coefficient.
Step F: Compare weir coefficient from Step C and Step E. If weir coefficients are close in value, then use Step E weir coefficient for remaining HEC-RAS modeling. If weir coefficients are not close in value, repeat Steps C-F until an appropriate weir coefficient is found.

Caltrans Fish Passage Design for Road Crossings
Appendix F – Hydraulics of Baffles Page F-14 August 2009
Breadth of Crest of Weir (ft) Head
(ft) 0.50 0.75 1.00 1.50 2.00 2.50 3.00 4.00 5.00 10.00 15.00 0.2 2.80 2.75 2.69 2.62 2.54 2.48 2.44 2.38 2.34 2.49 2.68 0.4 2.92 2.80 2.72 2.64 2.61 2.60 2.58 2.54 2.50 2.56 2.70 0.6 3.08 2.89 2.75 2.64 2.61 2.60 2.68 2.69 2.70 2.70 2.70 0.8 3.30 3.04 2.85 2.68 5.60 2.60 2.678 2.68 2.68 2.69 2.64 1.0 3.32 3.14 2.98 2.75 2.66 2.64 2.65 2.67 2.68 2.68 2.63 1.2 3.32 3.20 3.08 2.86 2.70 2.65 2.64 2.67 2.66 2.69 2.64 1.4 3.32 3.26 3.20 2.92 2.77 2.68 2.64 2.65 2.65 2.67 2.64 1.6 3.32 3.29 3.28 3.07 2.89 2.75 0.68 2.66 2.65 2.64 2.63 1.8 3.32 3.32 3.31 3.07 2.88 2.74 2.68 2.66 2.65 2.64 2.63 2.0 3.32 3.31 3.30 3.03 2.85 2.76 2.72 2.68 2.65 2.64 2.63 2.5 3.32 3.32 3.31 3.28 3.07 2.89 2.81 2.72 2.67 2.64 2.63 3.0 3.32 3.32 3.32 3.32 3.20 3.05 2.92 2.73 2.66 2.64 2.63 3.5 3.32 3.32 3.32 3.32 3.32 3.19 2.97 2.76 2.68 2.64 2.63 4.0 3.32 3.32 3.32 3.32 3.32 3.32 3.07 2.79 2.70 2.64 2.63 4.5 3.32 3.32 3.32 3.32 3.32 3.32 3.32 2.88 2.74 2.64 2.63 5.0 3.32 3.32 3.32 3.32 3.32 3.32 3.32 3.07 2.79 2.64 2.63 5.5 3.32 3.32 3.32 3.32 3.32 3.32 3.32 3.32 2.88 2.64 2.63
Table F.3 Broad Crested Weir Coefficient
F.6 Baffled Culvert Modeling Using Effective Roughness (Higher Flows) The simplest procedure for modeling a baffled culvert under higher flows is through the use of effective roughness (neff). Unlike the low fish passage flow condition, water can fill the culvert and possibly operate under pressure flow. Because of this possibility, it is essential to use the culvert routine in HEC-RAS. As mentioned in Section F.4, baffles cannot be analyzed in a culvert within HEC-RAS, as well as other culvert software. Through calculation of effective roughness under different flows and corresponding depths, the roughness influence of the baffles, as water streams over them, can be properly depicted. This means that other Caltrans recommended software (HY-8 and Haestad CulvertMaster) can also be used to model baffled culverts by changing the culvert roughness for each scenario.
When using the procedures to calculate effective roughness in Section F.3, culvert shape and retrofit type (baffle height, spacing, and configuration) must be considered in selecting the experimental values developed from the HSU study. The goal in choosing the design baffle retrofit type is to be as close to a type identified in Table F.2 as possible. Because the equations developed from the research are empirical, the greater difference in design retrofit type or culvert shape from the ones in Table F.2, the less accurate modeling results may be. In other words, the closer the design and suggested height/spacing combination are to each other, the more accurate the modeling results. Given the limitations of the alternative method for modeling high fish passage and flood flows in Section F.7 commonly used in the fish passage design community, the effective roughness method may be the better choice even when the design baffle height/spacing combination is not that close to the combination developed from the research study.

Caltrans Fish Passage Design for Road Crossings
Appendix F – Hydraulics of Baffles Page F-15 August 2009
After running HEC-RAS using the effective roughness method, an average culvert velocity can be found for a high fish passage flow and compared to the CDFG and NMFS criteria for compliance. Also, culvert capacity can be reviewed by checking culvert flow depth and headwater under appropriate flood flows.
If the effective roughness method for analyzing culvert hydraulics under higher flows is not used, see Section F.7 for an alternative method.
F.7 Alternative Baffled Culvert Modeling (Higher Flows) When the effective roughness method for determining baffled culvert roughness under higher flows cannot be used, the following alternative method is suggested. This method is based on an HSU study from 2004 funded by NMFS where roughness coefficients (n-values) were measured at three baffled culvert sites from seven observations.
For a range of (y/zmax) ratio, where y = flow depth and zmax =baffle height, a range of corresponding culvert n-values were determined by HSU in their 2004 study. Based on field data, measured n-values ranged from 0.107 to 0.039 and y/zmax ratios ranged from 0.6 to 1.95. The 0.107 n-value was considered an outlier for y/zmax = 1.3 by HSU and was discarded. The next highest measured n-value was 0.076.
For baffled culvert modeling purposes of any type, shape, or material, a baffled culvert n-value of 0.076 can be used for y/zmax = 0.6 or lower. When y/zmax is 1.95 or higher, use n-value equal to 0.039. In order to determine n-values for a y/zmax ratio between 0.6 and 1.95, perform linear interpolation to find an n-value between 0.076 and 0.039. As previously discussed, the higher the flow depth above a baffle, the less influence on culvert roughness it has, yielding a lower n-value.
Before an n-value can be selected, the baffle height (zmax) must have been previously determined and flow depth (y) must be calculated. It is recommended to use the low fish passage flow HEC-RAS model, where in-line weirs have been entered as baffles in channel cross sections having the culvert shape, to determine the average flow depth (y) in the pools between baffles using the higher flow of interest. Depending on the magnitude of the higher flow, it may be necessary to vertically extend the walls of the channel sections mimicking a culvert or enter the majority of the culvert shape (excluding the culvert top) within the HEC-RAS model geometry. After determining the baffled culvert n-value, the culvert can be modeled in HEC-RAS, HY-8, or Haestad CulvertMaster.
In the NMFS funded study, HSU did not distinguish the independent effects or influence on n-values from baffle type and configuration, nor culvert shape and material. This is a limitation to the method, but its use will provide conservative modeling results. Limitations in predicting baffled culvert n-values are common and accepted in fish passage professional practice where conservatism is applied. The HSU alternative method is considered reasonable, as well as conservative in professional practice, and is similar to the Washington Department of Fish & Wildlife general n-value recommendations observed from baffled culvert sites in Washington State.
Because the latest HSU study (2008) considers influences of culvert shape, as well as baffle configuration and spacing, the effective roughness method is the choice for modeling higher flows in baffled culverts. With the consideration of these influences, the analysis results more accurately depict actual water surface profiles and capacity. Using the alternative method,
Caltrans Fish Passage Design for Road Crossings
Appendix F – Hydraulics of Baffles Page F-16
results are typically more conservative, which may not be warranted. If the effective roughness method is found to be inapplicable at a site, it is better to be more conservative than less by using the alternative method. While this alternative method could technically be used for low fish passage flow modeling as well as high flow modeling, the low flow method discussed in Section F.4 is preferred having more accuracy.
F.8 Energy Dissipation Factor In the pool between baffles, turbulence is created as energy is dissipated. This turbulence can be defined or measured by an Energy Dissipation Factor (EDF) having ft-lb/ft3/sec units. When turbulence is too high, it can be an impediment for fish passage. On the contrary, if turbulence is too low, sediment can be deposited and fill the pools rendering the baffles inoperable. Based on field observation and monitoring under different flows, it is recommended that EDF should be 3 to 5 for baffled culvert systems so that sediment can be transported without an exceptional amount of turbulence.
The following equation is used to calculate EDF:
EDF = wet
o
AγQS
Where:
EDF = Energy Dissipation Factor (ft-lb/ft3/sec)
γ = Unit weight of water (62.4 lb/ft3)
So = Existing culvert slope (ft/ft)
Awet = Wetted cross-sectional flow area (ft2) between baffles under high fish Passage flow, use yo (Section F.3) as flow depth in Awet calculation.
NOTE: If yo from the effective roughness calculation cannot be used, run the low fish passage flow HEC-RAS model recommended in Section F.4 using the high passage flow. From the HEC-RAS results, use the “Flow Area” at the pool mid-point cross section between baffles as the Awet component.
August 2009