Land capability study of (sandy) soils, north west of the ...
Appendix E2: Soils

Red Earth cc Page 1
SPECIALIST STUDY REPORT SOILS, LAND CAPABILITY, and LAND USE
INCLUDING
BASELINE DESCRIPTION OF THE ENVIRONMENT;
ENVIRONMENTAL IMPACT ASSESSMENT; and
ENVIRONMENTAL MANAGEMENT PLAN
ALSO INCLUDING INFORMATION ON:
WETLAND CLASSIFICATION/DELINEATION AND RIPARIAN AREAS,
And SENSITIVE LANDSCAPES
OF
LEPHALALE COAL AND POWER PROJECT
ON THE ORIGINAL FARMS
HONINGSHADE 427 LQ, BOTMANSDRIFT 423 LQ, GROOTGENOEG 426 LQ,
WELTEVREDEN 482 LQ, PRETORIA 483 LQ, GARIBALDI 480 LQ;
FRANSCHHOEK 207 LQ, SEBRIGHT 205 LQ, STUTGARD 420 LQ, FORFARSHIRE
419 LQ, BILLIARDS 428 LQ, and WELLINGTON 432 LQ
LEPHALALE LOCAL MUNICIPALITY, WATERBERG DISTRICT MUNICIPALITY
LIMPOPO PROVINCE
SOUTH AFRICA
Prepared for
KONGIWE ENVIRONMENTAL (PTY) LTD
and
LEPHALALE COAL MINES (PTY) LTD
By
B.B. McLeroth
…………………………………………………………………………………………………….
July 2017 Survey Reference: REMS60-LCPP Project-Soils-Specialist Study Report
Members:BRUCE McLEROTH B.Sc.Agric.(Natal),MSAIF, MSSSSA
ccearth red

Red Earth cc Page 2
CONFIDENTIALITY AND COPYRIGHT RECORDAL
This report may be distributed by the ‘client’ to the relevant authorities and interested and
affected parties; and may be inserted, replicated, printed or referred to by the ‘client’ and
interested and affected parties in all manners of documentation or research whatsoever,
where so required.
Nevertheless, it is recorded that the author of this report claims ownership of his intellectual
property and will take all necessary action to protect his interests should his intellectual
property rights be infringed (except in the cases as mentioned above).
The author must be acknowledged in all cases where the current report document, either in
its entirety, or portions of the content thereof are referred to, either by the ‘client’ or
interested and affected parties (including other consultants).

Red Earth cc Page 3
CONTENTS
EXECUTIVE SUMMARY ........................................................................................ 7
1. INTRODUCTION .............................................................................................21
2. DETAILS OF SPECIALIST ............................................................................22
3. DECLARATION OF INDEPENDANCE .......................................................23
4. RELEVANT LEGISLATION AND GUIDELINES .........................................24
4.1 ACTS AND REGULATIONS ............................................................................................. 25 4.2 GUIDELINES ....................................................................................................................... 26
5. SCOPE, PURPOSE, APPROACH AND METHODOLOGY .........................27
5.1 SCOPE AND PURPOSE OF THE REPORT.................................................................... 27 5.2 APPROACH, METHODOLOGY AND ACTIONS PERFORMED ................................ 27
5.2.1 DESKTOP STUDY / REVIEW EXISTING INFORMATION ........................ 27 5.2.2 FIELDWORK AND RESEARCH ...................................................................... 29 5.2.3 BASELINE DESCRIPTION ............................................................................... 30
5.2.4 IMPACT AND RISK ASSESSMENT ................................................................ 32
6. ASSUMPTIONS, UNCERTAINTIES AND KNOWLEDGE GAPS ..............33
6.1 ASSUMPTIONS ................................................................................................................ 33
6.2 UNCERTAINTIES ............................................................................................................ 35 6.3 KNOWLEDGE GAPS ....................................................................................................... 35
7. PROJECT ASPECTS RELEVANT TO SOILS, LAND CAPABILITY
AND LAND USE ..............................................................................................36
7.1 INFRASTRUCTURE AND LAYOUT ............................................................................. 36 7.2 SITE SENSITIVITY.......................................................................................................... 39 7.3 FATAL FLAW ASSESSMENT ........................................................................................ 39
7.4 FEATURES AND BUFFERS FOR AVOIDANCE .......................................................... 45
BASELINE SECTIONS ...........................................................................................47
8. BASELINE DESCRIPTION OF THE ENVIRONMENT ............................47
8.1 REGIONAL SETTING ..................................................................................................... 47 8.1.1 LOCATION ........................................................................................................... 47
8.1.2 TOPOGRAPHY .................................................................................................... 49 8.1.3 SURFACE DRAINAGE ....................................................................................... 49
8.1.4 METEOROLOGY ................................................................................................ 50 8.1.5 GEOLOGY AND PARENT MATERIAL .......................................................... 51 8.1.6 REGIONAL SOILS .............................................................................................. 52
8.1.7 REGIONAL LAND CAPABILITY .................................................................... 62 8.1.8 REGIONAL LAND USE ..................................................................................... 62
8.2 SOILS BASELINE ............................................................................................................ 64 8.2.1 SURVEY METHODS AND DATA COLLECTION ........................................ 64
8.2.2 THE SOIL MAP ................................................................................................... 65
8.2.3 SOIL TYPES AND SUITABILITY FOR AGRICULTURE AND ‘TOPSOIL’
............................................................................................................................................ 67 8.2.4 SOIL WATER-TABLE ........................................................................................ 72 8.2.5 SOIL ANALYTICAL DATA ............................................................................... 73 8.2.6 SOIL ANALYTICAL CHARACTERISTICS AND SOIL FERTILITY ........ 76 8.2.7 EROSION HAZARD AND SLOPE .................................................................... 81
Red Earth cc Page 4
8.2.8 DRYLAND / IRRIGATED PRODUCTION POTENTIAL ............................. 90
8.2.9 IRRIGATION POTENTIAL ............................................................................... 92
8.2.10 OVERBURDEN/UNDERBURDEN ‘WASTES’ AND ‘NON-WASTES’ ..... 93
8.2.11 SOIL UTILIZATION (STRIPPING) GUIDE ................................................. 93 8.2.12 REHABILITATION TOPSOIL BUDGET ...................................................... 96
8.3 LAND CAPABILITY BASELINE ................................................................................... 99 8.3.1 LAND CAPABILITY REQUIREMENTS ......................................................... 99
8.3.2 WETLAND CLASSIFICATION / DELINEATION AND RIPARIAN AREAS
.......................................................................................................................................... 102 8.4 LAND USE BASELINE ................................................................................................. 107
8.4.1 MAN-MADE FEATURES ................................................................................. 107 8.4.2 BROAD VEGETATION COMMUNITIES ..................................................... 109 8.4.3 HUMAN SETTLEMENT .................................................................................. 111
8.4.4 HISTORICAL AGRICULTURAL PRODUCTION ....................................... 112 8.4.5 EXISTING STRUCTURES ............................................................................... 113 8.4.6 EVIDENCE OF MISUSE .................................................................................. 113
8.5 SENSITIVE LANDSCAPES .......................................................................................... 115 8.6 SITES OF CULTURAL AND ARCHAEOLOGICAL INTEREST ............................... 117
EIA AND EMP SECTIONS ..................................................................................118
9. IMPACT AND RISK ASSESSMENT ..........................................................118
9.1 IDENTIFICATION AND DESCRIPTION OF TOPOGRPAHICAL IMPACTS.......... 118 9.1.1 RELEVANT PROJECT ACTIVITIES ............................................................ 118 9.1.2 IDENTIFICATION OF ASPECTS PER LIFE CYCLE PHASE .................. 119
9.1.3 IMPACT DESCRIPTION/DEFINITION PER LIFE CYCLE PHASE ....... 119 9.2 EVALUATION OF IMPACTS ...................................................................................... 122
9.2.1 IMPACT RATING METHODOLOGY ........................................................... 122
9.2.2 IMPACT SIGNIFICANCE RATING AND MANAGEMENT MEASURES
125
10. QUANTIFICATION OF IMPACTS ............................................................189
11. TECHNICAL DETAILS OF MANAGEMENT MEASURES ..................190
11.1 STRIPPING RECOVERY RECOMMENDATIONS .................................................. 191 11.2 COMPACTION ............................................................................................................ 192
11.3 STORAGE LIFE AND STOCKPILING ...................................................................... 193 11.4 ‘TOPSOILING’ DEPTH .............................................................................................. 194
11.5 ORGANIC CARBON ................................................................................................... 196 11.6 FERTILITY .................................................................................................................. 197 11.7 SLOPE GRADE AND ERODIBILITY ........................................................................ 199
11.8 SUITABLE ‘TOPSOILING’ MATERIALS ................................................................ 202 11.9 SEQUENCE OF REHABILITATED HORIZONS ...................................................... 203
11.10 POLLUTION ............................................................................................................ 204 11.11 PERCHED WATER-TABLE ................................................................................... 210 11.12 RE-VEGETATION AND PHYTOREMEDIATION ............................................... 211
11.13 CLIMATE/IRRIGATION ........................................................................................ 214
12. RELINQUISHMENT CRITERIA ...............................................................215
13. MONITORING PLAN ..................................................................................218
13.1 MONITORING STANDARDS .................................................................................... 218 13.2 MONITORING LOCALITIES ..................................................................................... 218 13.3 MONITORING PROCEDURES .................................................................................. 219
13.3.1 FREQUENCY ................................................................................................. 219 13.3.2 VARIABLES TO BE RECORDED .............................................................. 220

Red Earth cc Page 5
13.3.3 MONITORING / SAMPLING TECHNIQUE ............................................. 221
13.3.4 SAMPLE PRESENTATION TO LABORATORY ..................................... 221
13.4 DATA CAPTURE ........................................................................................................ 222
13.5 REPORTING ................................................................................................................ 222 13.6 EMERGENCY ACTION PLAN .................................................................................. 222
14. REASONED OPINION AND RECOMMENDATIONS ...........................223
14.1 IMPACT STATEMENT ............................................................................................... 223 14.2 RECOMMENDATION FOR APPROVAL ................................................................. 223 14.3 RECOMMENDATIONS FOR MEASURES AND/OR CONDITIONS ..................... 223
15. FINANCIAL PROVISIONING ....................................................................224
16. SUMMARY OF CONSULTATION PROCESS .........................................224
17. INFORMATION REQUESTED BY COMPETENT AUTHORITY .......225
18. REFERENCES ...............................................................................................227
APPENDIX I: MAPS .............................................................................................230
Map 1. Soil Sampling Points.....………………………………………………………231
Map 2a. Soil Mapping Units.......………………………………………………………232
Map 2b. Soil Mapping Units - Image Overlay....………………………………………233
Map 3a. Pre-Mining Land Capability......………………………………………………234
Map 3b. Wetlands....……………………………………………………………………235
Map 4. Present Land Use.......…………………………………………………………236
Map 5. Soil Utilization (Stripping) Guide.……………………………………………237
APPENDIX II: SOIL AUGER PHOTOGRAPHS ..............................................238
APPENDIX III: ACRONYMS AND GLOSSARY ...................................... 248248
ACRONYMS: ..................................................................................................................... 248248 GLOSSARY: ...................................................................................................................... 249249
APPENDIX IV: CURRICULUM VITAE ..................................................... 288288

Red Earth cc Page 6
TABLES Table 4.1. Acts and Regulations..……………………………………………………………..25
Table 4.2. Guidelines.…………………………………………………………………………26
Table 5.2.1. Farm Names and Areas...…………………………………………………………28
Table 8.2.2. Summary of Soil Form.……………………………………………………………66
Table 8.2.5. Soil Analytical Data……………………………………………………………74-75
Table 8.2.7. Data Used and Results Obtained from the Soil Erodibility Nomograph...………83
Table 8.2.11. Summary of Soil Utilization (Stripping) Guide...…………………………………95
Table 8.3.1(a). Land Capability Requirements.......………………………………………………99
Table 8.3.1(b). Summary of Pre-Mining Land Capability...……………………………………101
Table 8.3.2(a). Wetland Indicators and Corresponding Wetland Types.………………………104
Table 8.3.2(b). Summary of Wetlands...…………………………………………………………106
Table 8.4. Summary of Present Land Use..…………………………………………………108
Table 8.4.1. Summary of Man-Made Structures...……………………………………………109
Table 9.2.1(a). Key Elements in the Evaluation of Impact Significance.………………………126
Table 9.2.1(b). Characteristics to be Used in Impact Descriptions..……………………………127
Table 9.2.1(c). Method for Rating the Significance of Impacts...………………………………128
Table 9.2.2(a). Impact Significance and Management Measures (Construction Phase)…130-142
Table 9.2.2(b). Impact Significance and Management Measures (Operational Phase).…143-153
Table 9.2.2(c).Impact Significance and Management Measures (Decommissioning/Closure
Phase) .………………………………………………………………………159-188
Table 9.2.2(d). Impacts and Management Measures (Post-Closure Phase)………………189-192
Table 12. Relinquishment Criteria at the Time of Closure...…………………………218-220
Table 17. Specialist Study Report Guideline (Appendix 6 GNR 982 of 4 December 2014)
Checkbox.……………………………………………………………………228-229
Table 8.2.5 (two pages) must be printed on A3 paper, as set up in the document.
FIGURES
Figure 7.1(a). Proposed Infrastructure Layout (General).....……………………………………37
Figure 7.1(b). Proposed Infrastructure Layout (Operational Area Detail) .……………………38
Figure 7.4. Features and Buffers for Avoidance...……………………………………………46
Figure 8.1.1. Location and Topography of Study Area…………………………………………48
Figure 8.1.4. Annual Rainfall (mm)………………………….………………………………….50
Figure 8.1.6(a). Terrain Units…….………………………………………………………………53
Figure 8.1.6(b). Regional Soil Setting……………………………………………………………61
Figure 8.2.7. The Soil Erodibility Nomograph of Wischmeier, Johnson and Cross (1971)..…82
Red Earth cc Page 7
EXECUTIVE SUMMARY
INTRODUCTION
Kongiwe Environmental (Pty) Ltd (hereafter referred to as Kongiwe) was appointed by
Lephalale Coal Mines (Pty) Limited to undertake the Environmental Impact Assessment (EIA)
process in support of the Mining Right Application (MRA) and other Environmental
Authorisations required for the proposed mine and IPP. Applications at this stage will be
conducted for the mining section only, while applications for the IPP will be done in the future
once the design of the IPP has progressed.
Red Earth cc was in turn commissioned by Kongiwe firstly to produce a Scoping Report, and
thereafter a Specialist Study Report (current report). The Specialist Study Report incorporates
the previous Scoping Report information, together with the Baseline Report, Environmental
Impact Assessment (EIA) and Environmental Management Plan (EMP) sections for the Soils,
Land Capability and Land Use components.
Additional Baseline information presented in this Specialist Study Report includes the
following: Wetland Identification/Delineation and Riparian Areas, Parent Material, Sensitive
Landscapes, and location of Sites of Cultural and Archaeological Interest.
Numerous written Sections precede the Soils Baseline Sections of the current document, these
being outlined in the Table of Contents.
SOILS BASELINE
Survey Methods and Data Collection
An intensive systematic grid soil survey was undertaken, with auger sampling points 300m
(one auger per 9.00ha) apart throughout the proposed Operational Area only (2743.59ha), a
total of three-hundred-and-twenty-two augers being conducted at pre-determined positions in
the survey area as a whole. Seven modal (typical representative) soil auger points were
augered, photographed and sampled (for agricultural analysis).
The Soil Map
Soil-mapping units are indicated on Map 2a (Soil Mapping Units), and are summarized in
terms of soil form in Table 8.2.2 (Summary of Soil Form).
The different soil types identified were grouped together into soil-mapping units on the basis of
soil form, effective rooting depth (ERD) for rehabilitation (stripping depth) and cropping,
surface features, and parent material. Each soil-mapping unit has a unique code, which
describes these factors.
Soil Types
The soils encountered in the Operational Area were divided into seven broad groups as follows:
- Red apedal soils (Hutton and Lichtenburg forms) [509.64 ha; 18.58 %];

Red Earth cc Page 8
- Yellow-brown apedal soils (Clovelly and Glencoe forms) [882.51 ha; 32.17 %];
- Neocutanic soils (Tukulu form) [11.07 ha; 0.40 %];
- Carbonate soils (Plooysburg, Kimberley and Molopo forms [42.25 ha; 1.54 %]; and
Augrabies, Addo, Prieska, Montagu, Brandvlei and Coega forms [119.67 ha; 4.36 %]; Total
[161.92 ha; 5.90 %];
- Pedocutanic soils (Swartland, Sepane and Bonheim forms) [492.48ha; 17.95 %];
- Shallow soils (i.e. lithosols) (Glenrosa, Mispah and Dresden forms) [617.15 ha; 22.49 %];
- Hydromorphic soils (Westleigh and Katspruit forms, the latter form generally occurring in
and adjacent to pans [59.43 ha; 2.17 %]; and
- Pans (generally Katspruit form) [4.97 ha; 0.18 %]; Total [64.40 ha; 2.35 %]).
- Total (Soils) [2739.18ha; 99.84 %].
The district road (3.95 ha; 0.14 %) and three man-made ponds (0.47 ha; 0.02 %) in terrestrial
(non-wetland) areas comprise the balance of the Operational Area total survey area (2743.59
ha; 100.00 %); the aforementioned being indicated in Table 8.2.2 (Summary of Soil Form).
Soil Water Table
Map 2a (Soil Mapping Units) normally indicates the distribution of perched soil water-tables
(or moisture) in augered depth; making use of the terms ‘moist depth’, ‘moist’, ‘wet’, or ‘very
wet’; including the depth at which the moisture associated with a perched water-table
commences. Moist soil profiles were not encountered in the current survey area due to both the
low effective rainfall in the area, as well as the time of year that the survey was conducted.
Furthermore, given the grid espacement utilised, augers were generally not conducted in the
currently dry pan areas (that may still be moist).
Soil Analytical Data
Table 8.2.5 (Soil Analytical Data) shows the agricultural analysis analytical data for the seven
topsoil (A-horizon) and four subsoil (B-horizon) samples collected from seven modal (typical)
soil augers.
The following physical and chemical variables were analysed (or calculated from the data
provided): texture seven fractions (also includes clay %), exchangeable cations (cmol (+) kgˉ¹
soil and ppm), S-value (cmol (+) kgˉ¹ clay), cation exchange capacity (cmol (+) kgˉ¹ soil, and
clay), base saturation (%), exchangeable sodium percentage (%), electrical conductivity (µS/cm
÷ 10 = mS/m), pH (H2O), saturation extract soluble cations (cmol (+) kgˉ¹ soil), organic carbon
(Walkley Black %), phosphorus (Bray 1 ppm), and saturation % (ml of water used to saturate
100g of soil).
Soil Analytical Characteristics and Soil Fertility
The following represent the overall texture range in the Operational Area:
- Yellow-brown apedal, Neocutanic, Shallow, and Carbonate soils (broad soil groups): loamy-
sand to sandy-loam textures (clay content approximately 5 - 16%),
- Red apedal soils: sandy-loam to sandy-clay-loam (clay content approximately 10 - 26%),
- Pedocutanic soils: clay to sandy-clay -loam textures (clay content approximately 55 - 30%),
and
- Hydromorphic soils: sandy-loam to clay textures (clay content approximately 15 - 55%).

Red Earth cc Page 9
The following points are relevant to soil fertility:
pH:
An optimum pH is assumed to be between about 6 to 7 (the range in which most nutrients
are most available, and the average range preferred by most crops).
The pH of the analysed topsoil and subsoil (collectively) samples vary as follows:
- Yellow-brown apedal (Glencoe form) and Shallow (Glenrosa form): 5.53 - 5.89 (medium
acid): i.e. slightly too acid;
- Shallow (Dresden form), Hydromorphic (Westleigh form), Pedocutanic (Swartland form),
and Red apedal (Hutton form): 6.02 - 6.37 (slightly acid): i.e. ideal; and
- Carbonate (Brandvlei form): 8.26 (moderately alkaline): i.e. too alkaline.
Electrical Conductivity (EC):
The EC of the analysed samples varies from approximately 100-200 for the majority of
samples, to up to approximately 500 for the pedocutanic (Swartland form) sample, and up
to approximately 900 for the carbonate (Brandvlei form) sample. Thus the majority of the
samples are non-saline as per The Chamber of Mines definition, bar the pedocutanic
(Swartland form, probably also many of the Sepane forms) and carbonate (Brandvlei form,
and probably also many examples of the non-analysed Augrabies, Addo, Prieska, Montagu,
and Coega forms) soils which are saline.
Exchangeable Sodium Percentage (ESP):
The ESP of the analysed samples varies from 0.26 to 1.12 % for the majority of samples,
and 2.50 to 6.06 % for the hydromorphic (Westleigh form) topsoil and subsoil samples.
Thus all of the soils are non-sodic as per The Chamber of Mines definition.
Total Nitrogen (N):
Total N of the analysed samples is likely to be low to medium for the majority of analysed
samples, and very high for the carbonate (Brandvlei form) sample.
Potassium (K), Magnesium (Mg), and Phosphorus (P):
In terms of fertility for maize, the optimal levels of nutrients (exchangeable cations) are: K
(120 ppm optimal - 100 ppm acceptable), Mg (60 ppm) and P (34 ppm).
Levels of K for the eleven samples range from 79 (moderately deficient) to 310 (far more
than adequate) ppm. Deficiencies (79 - 96 ppm: moderately - very slightly deficient) are
present for the following samples: red apedal subsoil, yellow-brown apedal topsoil and
subsoil, and shallow (Glenrosa form) topsoil.
Levels of Mg for the eleven samples range from 55 (very slightly deficient) to 273 (far
more than adequate) ppm. Very slight deficiencies (55 - 58 ppm) are present for the
following samples: red apedal topsoil, and shallow (Glenrosa form) topsoil.
Levels of P are seriously deficient (1.04 - 14.29 ppm) for all of the topsoil and subsoil
samples.
Erosion Hazard and Slope
Erosion slopes were calculated from the Soil Erodibility Nomograph of Wischmeier, Johnson
and Cross (1971) [Figure 8.2.7]. The results are presented in Table 8.2.7 (Data Used and
Results Obtained from the Soil Erodibility Nomograph).
In-Situ (undisturbed) soils:

Red Earth cc Page 10
Slope in the Operational Area varies as follows for natural areas:
- Midslopes (and concave ‘valley-bottom’ areas): almost level (0.5 - 1 degree): vast majority;
- Midslopes (and concave ‘valley-bottom’ areas): very gently sloping (1 - 2 degrees):
occasionally; and
- Midslopes (and concave ‘valley-bottom’ areas): gently sloping (2 - 4 degrees): rarely.
The following critical erosion slopes have been selected from our data in Table 8.2.7 to
represent the topsoils (A-horizons) of the various broad soil groups that occur in the area:
- Red apedal and Yellow-brown apedal soils (also applicable to Neocutanic soils, and
Carbonate [Py, Ky and Mp soil forms only] soils):
Average 7.0 degrees (12.3 % percentage grade).
- Pedocutanic soils (also applicable to Hydromorphic soils):
Average 6.2 degrees (10.8 % percentage grade).
- Shallow soils:
Average 4.8 degrees (8.4 % percentage grade).
Despite the fact that the determined critical erosion slopes are steeper than the prevailing slopes
in the area, soil erosion is severe to moderate in the majority of the Operational Area as a result
of the degradation/removal of the majority of the grass cover due to overstocking/overgrazing
in the past. Unacceptable levels of soil erosion will almost always begin to occur in bare areas
(without grass cover).
Critical erosion slopes are next presented for a number of different Rehabilitation Scenarios:
(i) Rehabilitated ‘topsoiled’ areas overlying building rubble, removed features, and opencast
areas [not intentionally compacted].
[i.e. rehabilitated ‘topsoiled’ areas overlying the footprints of all demolished/removed man-
made features not included in Point ii)].
This scenario applies to the rehabilitation of the footprints of all of the sites of the
demolished/removed/levelled man-made facilities/features upon closure: e.g. infrastructure /
buildings, roads, ‘non-waste’ prepared surfaces/piles/banks, excavations; re-graded opencast
areas; non-carbonaceous rock dumps that remain in perpetuity; and the sites of removed
rock dumps (or piles of material) / removed overburden or underburden ‘waste’ layers /
removed ‘topsoil’ stockpiles.
Rehabilitated areas must be re-graded (re-sloped), to ensure that the following
recommended calculated slopes are not exceeded:
- Red apedal and Yellow-brown apedal soils: 5.2 degrees (9.2 % percentage grade). Also
applicable to the Neocutanic soils, and Carbonate (Py, Ky and Mp soil forms only) soils.
- Pedocutanic soils: 6.2 degrees (10.8 % percentage grade).
- The final selected slope is 5.2 degrees (9.2 % percentage grade) for all ‘topsoil’ types, the
soils in the former bullet being preferred.
All of the aforementioned slopes refer to non-vegetated areas, but may be slightly steeper
(undetermined) after re-vegetation.
Suitable broad soil groups for rehabilitation ‘topsoiling’ purposes (surface placement) are as
follows:

Red Earth cc Page 11
Red apedal (very high suitability), Yellow-brown apedal (high suitability), Neocutanic (high
suitability), Carbonate [Py, Ky and Mp soil forms only] (high suitability), and Pedocutanic
(moderate-low suitability).
(ii) Rehabilitated ‘topsoiled’ areas overlying a compacted-‘remoulded’ ‘seal’ layer and/or
overlying a potentially-polluting rehabilitated feature.
[i.e. the ‘seal’ layer should ideally overlie rehabilitated pollution control/return
water/process water dams, evaporation ponds, slurry/tailings dams, and potentially
polluting dumps (e.g. carbonaceous discard dumps and ash dumps) at the time that these
features become redundant and are rehabilitated. The seal layer should also underlie
these features at the time of their construction, and also including the dirty water
gullies/drains/canals].
During rehabilitation these feature must be re-graded (re-sloped) before placement of either
the compacted -‘remoulded’ soil layer, or the overlying ‘topsoil’ layer to ensure that the
following recommended slope is ideally not exceeded:
Pedocutanic (B-horizon) or Hydromorphic (G- or B-horizons) soils: maximum 5.2 degrees
(9.2 % percentage grade) [non-vegetated, but slightly steeper (undetermined) after re-
vegetation].
Thus, in terms of the overlying non-compacted ‘topsoil’ layer (Red apedal, Yellow-brown
apedal, Neocutanic, or Carbonate [Py, Ky and Mp soil forms only], the determined slope
would be the same.
The aforementioned slope is impractical since the slope of a ‘topsoiled’ ‘rehabilitated’
potentially polluting carbonaceous discard dump or ash dump cannot easily be reduced to
this extent, while that of a ‘rehabilitated’ pollution control/return water/process water dam
can be reduced (unless this feature remains functioning in perpetuity).
Thus, given the erodibility of the soils on steeper slopes, the ‘topsoiling’ of some features
may not be feasible. In such cases, the feature must be re-vegetated using phytoremediation
and ecological restoration principles.
(iii) Opencast Mining Areas.
Two pits are planned to be excavated for the current proposed project. Opencast areas must
be re-graded, ‘topsoiled’, and re-vegetated as per Point (i).
Dryland / Irrigated Production Potential
Ranching:
The land in the region is suited to extensive game ranching and eco-tourism, and to a lesser
extent extensive cattle ranching. Previous cattle ranching and over-stocking (of grazers) have
resulted in the currently degraded eroded land. The farmers should completely discontinue
burning for a good number of years, while grazer stocking densities must be kept as absolutely
low as possible, to give the land a chance to ‘recover’ somewhat.
Cultivation:
Dryland
Given the low mean annual precipitation (435 mm), the hot climate (average maximum
temperatures ranging from 30°C to 36°C), as well as the unpredictable rainfall in the area;

Red Earth cc Page 12
dryland production is not recommended due to the very low yields obtained as well as the high
associated risk.
According to the South African Atlas of Agrohydrology and -Climatology (R.E. Schulze et-al,
1997), the generalised dryland yield (dry mass) in the region for maize on arable soils is 2 - 3
tonnes/ha, with an inter-seasonal coefficient of variation of approximately 40 - 50 %. The
dryland breakeven for maize is considered to be approximately 3 tonnes/ha. Schultze et-al
indicates that the area is climatically unsuitable for all other dryland crops.
Irrigated
The irrigation potential in the soil survey area is based on the characteristics (already
described) of the soils that occur, and generally varies as follows:
- High : red apedal soils;
- Moderate : yellow-brown apedal, neocutanic, and carbonate (Py, Ky and Mp soil
forms only) soils;
- Low : pedocutanic soils (‘red’ colours); and
- Unsuitable : shallow, hydromorphic, pedocutanic (‘bleached’ grey colours), and
carbonate (Ag, Ad, Pr, Mu, Br and Cg soil forms) soils.
Despite the arable soils that occur in many areas, such areas will not be able to be
commercially cultivated without the provision of irrigation, due to the semi-arid prevailing
climate in the area. Furthermore, there is a scarcity of borehole water for irrigation purposes, as
well as the potentially saline water quality in some areas. High profit drip irrigated crops such
as citrus or vegetables are likely to be feasible, provided that irrigation water is available.
Overburden / Underburden ‘Wastes’ and ‘Non-Wastes’
‘Wastes’ (mining related) do not occur in the current green fields survey area.
The term ‘wastes’ has been selected (by the author for discussion purposes) to refer to
mining/processing/industrial/smelting related raw materials and by-products, that may have an
inherently high pollution potential under certain circumstances. These may include materials
such as discard, ash, potentially polluting carbonaceous spoil rock (particularly that which has
been crushed to a fine grade), ore fines, slag, pellets, slurry/tailings, coke/anthracite/coal, and
scrap.
The term ‘non-wastes’ has been selected (by the author for discussion purposes) to refer to
other (non-mining or -processing, or -industrial, or -smelting related) materials, that have an
inherently low pollution potential. These may include materials such as potentially non-
polluting deposited rock, rubble, concrete, stone chips, and soil (when mixed with the
aforementioned).
Soil Utilization (Stripping) Guide
As the opencast, infrastructure, storage, waste and containment facilities expand, the available
‘topsoil’ reserves must be stripped as per the depths indicated on Map 5 (Soil Utilization
[Stripping] Guide), and either utilised to ‘topsoil’ a feature undergoing rehabilitation or
stockpiled for later use (rehabilitation purposes).
Table 8.2.11 (Summary of Soil Utilization [Stripping] Guide) is extracted from Map 5, and
summarizes the information for the survey area (Operational Area).
Red Earth cc Page 13
Table 8.2.11 shows that 16 389 904m³ of usable (high to low-unsuitable suitability) ‘topsoil’
(suitable A- and B-horizons) is present in-situ in the Operational Area.
Suitable broad soil groups for rehabilitation ‘topsoiling’ purposes (surface placement) are as
follows (descending order of suitability) [types i - iii preferred]:
i) Red apedal, very high suitability,
ii) Yellow-brown apedal (and Neocutanic), high suitability,
iii) Carbonate (Py, Ky, and Mp soil forms only), high suitability, and
iv) Pedocutanic (‘red’ colours only), moderate-low suitability.
The following broad soil groups are not recommended for surface placement, but may be
utilised further down in the rehabilitated profile:
v) Carbonate (Ag, Ad, Pr, Mu, Br, Cg soil forms only), very low to unsuitable (saline), and
vi) Shallow, Hydromorphic, and Pedocutanic (‘grey’ colours), very low to unsuitable (Shallow-gravelly/rocky;
Hydromorphic and Structured-bleached).
The following broad soil groups are recommended for sealing purposes (compacted-‘re-
moulded’ seal) overlying/underlying a potentially-polluting rehabilitation feature.
vii) Hydromorphic (G- and B-horizons) and Pedocutanic (B-horizon), highly suited to this purpose.
Rehabilitation ‘Topsoil’ Budget
The Chamber of Mines specifies that at least the same percentage of arable and grazing land
should exist, as were present before disturbance. Furthermore, Government Notice R537 (of 21
March 1980) requires that all topsoil (as defined) removed must be replaced on the disturbed
surface during rehabilitation.
Based on the volume (16 389 904m³) of available ‘topsoil’ reflected on Map 5 (Soil Utilization
[Stripping] Guide) and in Table 8.2.11 (Summary of Soil Utilization [Stripping] Guide), then
the following area would be able to be rehabilitated to the post-mining/disturbance arable
capability classes (albeit to a lower production potential): Arable (‘topsoiling’ depth: 0.60m) =
2731ha.
However, not all areas will need to be rehabilitated to the arable depth class standard (0.6m), as
determined by the pre-mining/disturbance capability class. Thus, many areas will be ‘topsoiled’
to the grazing (0.25m) or non-grazing (‘wilderness’ 0.15m) depth class standards.
Furthermore, the extent of the impacted (and thus rehabilitated) footprint will obviously occupy
a far lesser extent than the entire Operational Area (2743.59ha). Thus, available ‘topsoil’ is in
more than abundant supply. The Red apedal, Yellow-brown apedal, Neocutanic, and Carbonate
(Py, Ky and Mp soil forms only) broad soil groups are preferred for rehabilitation ‘topsoiling’
purposes, as a surface cover.
The following volumes of suitable ‘topsoil’ material are available for the construction of
compacted-‘re-moulded’ seals in the Operational Area: Pedocutanic (B-horizons): 3 492
439m³, and Hydromorphic (G- and B-horizons): 117 049m³. Thus, material for sealing
purposes is in more than abundant supply.

Red Earth cc Page 14
LAND CAPABILITY BASELINE
Land Capability
Land capability classes were determined using the guidelines outlined in the following
document produced by The Chamber of Mines of South Africa / CoalTech: Guidelines for the
Rehabilitation of Mined Land (November 2007).
Table 8.3.1b (Summary of Pre-Mining Land Capability) is extracted from Map 3a (Pre-Mining
Land Capability), and summarizes the information for the Operational Area.
The pre-mining/disturbance land capability has been divided into eleven classes. In summary,
the broad land capability groupings for the Operational Area are as follows:
- Arable : 825.10 ha, 30.07 % of survey area;
- Grazing : 1282.81 ha, 46.76 %;
- Non-Grazing : 550.71ha, 20.07 %; and
- Wetland : 80.55 ha, 9.33 %.
- Man-Made Features : 4.42 ha, 0.16 %.
- Total Survey Area : 2743.59 ha, 100 %.
Wetland Classification/Delineation and Riparian Areas
The wetland delineation procedure is based on the following document: ‘A Practical Field
Procedure for Identification and Delineation of Wetlands and Riparian Areas’, published by the
Department of Water Affairs and Forestry (DWAF) [Edition 1, September 2005].
The wetlands (thus also riparian areas) encountered within the Operational Area are indicated
on Map 3b (Wetlands) [and Map 3a - Pre-Mining Land Capability] and are summarised in
Table 8.3.2b (Summary of Wetlands).
The indicated wetlands include the following:
- Wetland Permanent : 13.52ha, 0.49% Soils; 4.98ha, 0.18 % Pans (25);
- Wetland Seasonal : 55.78ha, 2.03%; and
- Wetland Temporary : 6.27ha, 0.23%.
- Total Wetlands : 80.56ha or 2.94%.
Three man-made ponds occur in terrestrial (non-wetland) areas: 0.47ha, 0.02 %.
Wetlands are also defined as riparian areas.
LAND USE BASELINE
The present land use in the Operational Area is presented on Map 4 (Present Land Use), and
summarised in Table 8.4 (Summary of Present Land Use).
The land use both within and immediately adjacent to LCPP is dominated by game
ranching/farming and eco-tourism, and to a lesser extent cattle ranching. Occasional lands are

Red Earth cc Page 15
also spread out throughout the area, the aforementioned probably producing dryland hay and
other types of livestock feed on a small scale.
Table 8.4 indicates the present land use as follows:
Terrestrial Natural:
- Bush (Bush/Savannah/Grassland/Bare) : 2575.59 ha, 93.88 %;
Terrestrial Farming/Ranching Related Area:
- Cp (Cultivated Previously) : 79.67ha; 2.90 %;
- Orchard (Citrus) : 0.05ha, 0.00 %;
- Kraal (Cattle Kraal) : 0.23ha, 0.01 %;
- Farmyard : 3.09ha, 0.11 %;
Terrestrial-Other Man-Made:
- Pond (Pond and Wall) : 0.47ha, 0.02 %;
- District Road : 3.95ha, 0.14 %.
Wetland Natural:
- Wp (Riparian/Wetland Vegetation-Permanent Wetland) : 13.52ha, 0.49 %;
- Pan (undisturbed) and Pan.W (pan with a man-made wall):
Both Permanent Wetlands : 4.98ha, 0.18 %;
- Ws (Riparian/Wetland Vegetation-Seasonal Wetland) : 55.69ha, 2.03 %;
- Wt (Riparian/Wetland Vegetation-Temporary Wetland) : 6.27ha, 0.23 %;
Wetland in Farming Related Area:
- Seasonal Wetland passing through a Farmyard : 0.09ha, 0.00 %.
Man-Made Features
The man-made features within the Operational Area are presented on Map 4 (Present Land
Use), and summarised on the corresponding summary Tables 8.4 (Summary of Present Land
Use).
Table 8.4 indicates the following features:
- District Road (one) : 3.95ha, 0.14 %; and
- Ponds (man-made) (three) : 0.47ha, 0.02 %.
Map 4 also indicates numerous tracks on the various farms, the aforementioned not being
divided into polygons and thus having no area.
Man-Made (Existing) Structures
The man-made (i.e. existing) structures within the Operational Area are indicated on Map 4
(Present Land Use), and are summarised on the corresponding summary Table 8.4.1 (Summary
of Man-Made Structures).
Table 8.4.1 indicates the following human/ranching/farming related structures, as well as the
‘count’ (number of occurrences) in brackets:
Borehole/pump (1), borehole (2), chalet (2), construction (1), dip (2), garage (1), house (11),
house & braai (2), IR [i.e. informal house ruins] (3), lounge/kitchen (1), pool (1), reservoir (7),
reservoir? (2), residence [i.e. main homestead] (5), rondawel (4), shed (5), silo (2), tank (1),
tank[JoJo] (4), tank [JoJo] & solar (1), tower (1), trough (5), trough.F (i.e. trough for feed] (8),

Red Earth cc Page 16
trough.F (x7) [i.e. trough for feed - 7 troughs spread out in one location] (1), trough.W [i.e.
trough for water] (3), U [i.e. undifferentiated/unknown] (16), windmill (3), and workshop (1).
The aforementioned are not divided into polygons and thus have no area.
Broad Vegetation Communities
The vegetated areas are presented on Map 4 (Present Land Use), and summarised in Table
8.4.1 (Summary of Present Land Use).
Although degraded or transformed in sections, the vegetated areas include the following:
- Bush (or Savannah) in Terrestrial (non-wetland) areas: 2575.59ha (93.88 % of Operational
Area); and
- Wetland/Riparian Vegetation in Wetland areas: 80.47ha (2.93 %); and
- Total Vegetated area: 2656.06ha (96.81 %).
Human Settlement
Human settlement is indicated on Map 4 (Present Land Use), and is summarized in Tables 8.4
(Summary of Present Land Use) and 8.4.1 (Summary of Man-Made Structures).
Current human settlement within the Operational area is essentially comprised of the following:
- Residences (i.e. main farmhouse) on each of the farms in the Operational Area (except
Garibaldi). Associated structures such as sheds, workshops, garages, rondawels, chalets,
windmills, boreholes, reservoirs, and water tanks are present in the immediate vicinity of each
of these sites; and
- Houses for guests or labour are frequently present in either the immediate vicinity of the
residences, or further away from these main settlement sites.
- Each of the residence or house sites is surrounded by an open area described on Map 4 as a
‘farmyard’.
Previous (but contemporary) settlement sites are described as Informal Ruins (‘IR’) on Map 4.
These sites include brick and concrete rubble scattered around the relevant areas.
Historical Agricultural Production
Ranching (game and cattle) and farming related activities within the Operational Area are
indicated on Map 4 (Present Land Use), and are summarized in Tables 8.4 (Summary of
Present Land Use) and 8.4.1 (Summary of Man-Made Structures).
Agriculture:
Previous cultivation was identified at six locations, the aforementioned being comprised of
twelve distinct fields in terrestrial areas amounting to 79.67ha (2.90 % of Operational Area).
These dryland fields were probably predominantly utilised to produce supplementary feed for
livestock in the past. Ranching/farming related features and structures are discussed in Sections
8.4.1 (MAN-MADE FEATURES) and 8.4.5 (EXISTING STRUCTURES). Crop production is
discussed in Section 8.2.8 (DRYLAND / IRRIGATED PRODUCTION POTENTIAL).
Grazing and Browsing:
Red Earth cc Page 17
The farms are utilised for game ranching/farming and eco-tourism, and to a lesser extent cattle
ranching.
Evidence of Misuse
Overgrazing and soil erosion are evident in the vast majority of the surveyed area, the levels of
sheet erosion being indicated on Map 2a (Soil Mapping Units). At most sites, soil losses of
between approximately 5 - 15cm have occurred throughout approximately 40 - 80 % of the
surface area, the only relatively non-eroded areas being those underlying low vegetation such
as small bushes and trees.
The levels of overgrazing/soil erosion on the various farms generally appear to be as follows
(from most to least eroded): Grootgenoeg Ptn.1 (very highly eroded in many sections),
Honingshade (highly eroded), Grootgenoeg Ptn. 0 (moderately-highly), Weltevreden Ptn. 0
(moderately-highly), Botmansdrift (moderately), Weltevreden Ptn. 1 (slightly-moderately), and
Garibaldi (slightly). The current levels of grass basal cover are closely correlated with the
existing levels of soil erosion.
Given the widespread erosion in the area, the farmers should completely discontinue burning
for a good number of years, while grazer stocking densities must be kept as absolutely low as
possible to give the land a chance to ‘recover’ somewhat. Furthermore, erosion control
measures such as the laying out of brush packs along the contour must be implemented.
SENSITIVE LANDSCAPES
Sensitive landscapes are discussed from the following perspectives in Section 8.5 (SENSITIVE
LANDSCAPES):
i) Natural Wetland Soils
Ephemeral wetlands soils amount to 80.56ha or 2.94% of the Operational Area (2743.59ha).
ii) Natural Wetland Drainage Features
A limited number of short disconnected slightly concave ephemeral drainage features exist
in the Operational area, these features being occupied by the aforementioned natural wetland
soils. Drainage gullies, streams and rivers do not exist in the immediate area.
iii) Wetland/Riparian Vegetation
The main categories of wetland/riparian vegetation in the Operational Area are described in
Section 8.4.2 (BROAD VEGETATION COMMUNITIES).
The wetland soils / wetland drainage features / wetland-riparian vegetation occurring
within the Operational Area are not deemed to represent fatal flaws by the author for
the following reasons: ephemeral in nature; dissipate a short distance after they
commence; are generally underlain by solid rock or hard plinthite (ferricrete) at
approximately 40-70cm below the surface; are not connected to streams and thus do
not constitute catchment areas; and are commonly occurring features in the
surrounding areas in general. Thus, the loss of these wetland areas due to mining
related activities is deemed acceptable by the author.
iv) Erodible Soils
Despite the determined erosion slopes in Section 8.2.7 (EROSION HAZARD AND SLOPE;
In-Situ [Undisturbed] Soils), soil erosion is a major issue in the natural vegetated areas, the

Red Earth cc Page 18
aforementioned due to the generally extremely low grass basal cover as a result of many
years of overgrazing, burning, and rain drop splash erosion on a largely bare surface.
The soils in the study area that are likely to be more sensitive to erosion than others include
the following:
- pedocutanic soils, due to a slow-moderate subsoil permeability; and
- shallow soils, due to a relatively impermeable (to water) depth limiting horizon within 10 -
30cm below the soil surface, the aforementioned being either hard plinthite (Dresden form)
or hard rock (Mispah form).
v) Vegetative Cover
Severe overgrazing and fire over many years are the likely causes of the low grass basal
cover and thus severe to moderate levels of sheet erosion that occur throughout the majority
of the survey area.
vi) Anthropogenic Moisture
Anthropogenic moisture does not occur in the current green fields site. Measures must be
taken to prevent/limit the infiltration of ‘dirty’ water into the soils, and thereafter into the
perched soil water-table, perched ‘ground’ water-table and ‘deeper’ groundwater-tables,
during the operational and closure phases of the proposed project.
vii) Paleochannels and Naturally Buried Soils
No such soils were encountered.
Provided that the potential future mining /processing/containment procedures are conducted
appropriately, then the impact to the soils/land capability/land use will be limited.
SITES OF CULTURAL AND ARCHAEOLOGICAL INTEREST
Sites of archaeological interest were not encountered in the current area. Sites of cultural
interest are indicated on Map 4 (Present Land Use), and are summarized in Table 8.4.1
(Summary of Man-made Structures) in Section 8.4.1 (MAN-MADE FEATURES) of the
current report. All of these contemporary structures are related to game and cattle ranching,
eco-tourism, and farming.
ENVIRONMENTAL IMPACT ASSESSMENT
Chapters 9 (IMPACT AND RISK ASSESSMENT) and 10 (QUANTIFICATION OF
IMPACTS) of the current document are relevant and are compliant with the NEMA
Regulations (GN R982 of 4 December 2014).
Impact Significance Rating / Management Measures Tables were compiled for all three life
cycle phases (Construction, Operational, and Decommissioning and Closure) of the LCPP
Project. This was done for the Activities deemed to have a potential impact with reference to
the Aspects identified.
The aforementioned Tables include the following information: Activity Area, Activity, Aspect,
Impact Category, Type of Impact, Impact Description, Impact Significance Rating before
Management (Measures), Mitigation Measures, Time Period for Implementation, and Impact
Significance Rating after Management (Measures).

Red Earth cc Page 19
Impact Significance Rating / Management Measures Tables relevant to the Construction Phase
are relayed in Table 9.2.2(a), to the Operational Phase in Table 9.2.2 (b) and finally to the
Decommissioning and Closure Phase in Table 9.2.2 (c).
Impacts and Management Measures relevant to the Post-Closure Phase are relayed in Table
9.2.2(d). The aforementioned Table includes the following information: Impact Category,
Mitigation Measures, and Time Period for Implementation only. The Mitigation Measures
described are equally applicable to all of the previously identified Activity Areas, Activities,
and Aspects.
ENVIRONMENTAL MANAGEMENT PLAN
As previously mentioned, Tables 9.2.2(a) [Construction phase], 9.2.2(b) [Operational phase],
and 9.2.2(c) [Decommissioning and Closure phase] in Chapter 9 (IMPACT AND RISK
ASSESSMENT) of the current document also include the following information: Mitigation
Measures, Time Period for Implementation, and Impact Significance Rating after Management
(Measures). Table 9.2.2(d) [Post-Closure phase] includes the following information: Mitigation
Measures, and Time Period for Implementation only.
In addition, Chapters 11 (TECHNICAL DETAILS OF MANAGEMENT MEASURES) and 12
(RELINQUISHMENT CRITERIA) of the current report are also relevant.
Furthermore, Section 8.4.6 (EVIDENCE OF MISUSE; Point a: Agriculture; and Point b:
Mining, Processing and Industry) is also relevant and must be referred to.
ENVIRONMENTAL MONITORING PLAN
Chapter 13 (ENVIRONMENTAL MONITORING PLAN) of the current document is relevant.
Monitoring Standards, Monitoring Localities, Monitoring Procedures (frequency, variables to
be recorded, monitoring/sampling technique, and sample presentation to the laboratory), Data
Capture, and Reporting are discussed.
REASONED OPINION AND RECOMMENDATIONS
Chapter 14 (REASONED OPINION AND RECOMMENDATIONS) of the current document
is relevant.
Impact Statement
The Soils / Land Capability / Land Use Impact Assessment conducted for the LCPP project
was informed by a comprehensive, site specific, quantitative and qualitative 300m-grid soil
survey, conducted with the aid of an aerial photograph. The aforementioned enabled a
reasonably accurate (would have been more detailed had a 150m-grid soil survey been
conducted instead) description in support of a fundamental understanding of the attributes
of the occurring soils, land capability and land use environments that will be influenced by
both the existing and proposed new activities/developments/expansions.
The project applicant furthermore provided sufficiently detailed information pertaining to
the existing and proposed activities, to enable an accurate definition and description of the
existing and potential aspects which could cause soils, land capability and land use impacts.

Red Earth cc Page 20
Based on the above, the following Impact Statement is made:
In the context of the situation, the associated impacts are conditionally deemed to be acceptable
impacts; provided that the rehabilitation complies with the relinquishment criteria listed in
Section 12 (RELINQUISHMENT CRITERIA) and specifically Table 12 (Relinquishment
Criteria).
Recommendations for Approval
Based on the aforementioned Impact Statement, it is recommended that the New Project
Activities/Aspects may proceed subject to the recommendations and conditions stated below.
Recommendations for Measures and/or Conditions
The New Project (LCPP Project) may proceed provided that the following recommendations
and conditions are met:
The applicant must take full cognizance of the soils / land capability / land use
relinquishment criteria, as detailed in Section 12 (RELINQUISHMENT CRITERIA) and
specifically Table 12 (Relinquishment Criteria). These include the Soil Component (Final
Slope, Soil Erosion, Soil Depth, Soil Fertility, and Soil Contamination), the Land
Capability Component, and the Land Use Component. Given the semi-arid climate, it is
imperative that all of the relinquishment criteria are adhered to, and particularly the
calculated final slopes, rehabilitation ‘topsoiling’ depth; and re-vegetation that is
successful, functional and appropriate.
The applicant must take full cognizance of the soils / land capability / land use sensitivities
of the proposed New Project (LCPP Project) as detailed in Section 8.5 (SENSITIVE
LANDSCAPES) into consideration throughout the life of the mine.
The applicant must further comply with the recommendations for mitigation, management
and monitoring as contained in the EMP Chapters 9 to 17 of this report and as stated in the
conditional acceptance of the impacts as stated above.
The approval is subject to the development of the proposed ‘New Project Sites’ being sited in
accordance with the approximate proposed location of such sites (as provided), and that should
these proposed locations be shifted slightly for any reason, that these shifted sites do not
intrude outside of the current proposed Operational Area. Any future proposed activities
outside of the current proposed Operational Area will require another Baseline/EIA/EMP
process to be conducted, together with the associated licences and approvals.
Respectfully submitted,
.....................................
Bruce McLeroth
Cellular: 082 202 4188

Red Earth cc Page 21
1. INTRODUCTION
Lephalale Coal Mines (Pty) Ltd (LCM), which is a subsidiary within the Masimong Group
Holdings (MGH), proposes to develop a new coal mine and energy project in the Waterberg
Coalfield, approximately 22km north-east of the town of Lephalale, Limpopo Province,
Republic of South Africa. The project is known as the Lephalale Coal and Power Project
(hereafter referred to as LCPP or the Project). The proposed Project is to consist of an open
pit coal mine and, at a later stage, an Independent Power Producer (IPP) plant.LCM holds
the prospecting rights for 12 farms associated with the Project. A Pre-Feasibility Study (PFS)
for the project has been conducted by Royal HaskoningDHV and indications from the PFS are
that this is an economically viable project.
Kongiwe Environmental (Pty) Ltd (Kongiwe) has been appointed by LCM to undertake the
Environmental Impact Assessment (EIA) process in support of the Mining Right Application
(MRA) and other Environmental Authorisations required for the proposed mine and IPP.
Applications at this stage will be conducted for the mining section only, while applications for
the IPP will be done in the future once the design of the IPP has progressed.
The applications require a Scoping and Environmental Impact Assessment as per Regulation 21
and Regulation 24 of the Environmental Impact Assessment Regulations, 2014 (the EIA 2014
Regulations, published in GN R982 of 4 December 2014) of the National Environmental
Management Act (NEMA).
Red Earth cc was in turn commissioned by Kongiwe to firstly produce a Scoping Report, and
thereafter a Specialist Study Report (current report). The Specialist Study Report incorporates
the previous Scoping Report information; together with the Baseline Report, Environmental
Impact Assessment (EIA) and Environmental Management Plan (EMP) sections for the Soils,
Land Capability and Land Use components.
Additional Baseline information presented in this Specialist Study Report includes the
following: Wetland Identification/Delineation and Riparian Areas, Parent Material, Sensitive
Landscapes, and location of Sites of Cultural and Archaeological Interest.
It is herewith confirmed that this Soils / Land Capability / Land Use Specialist Study Report
(including a Baseline Description, EIA, and EMP) has been compiled in accordance with, and
contains the information as specified in Appendix 6 of the EIA 2014 Regulations.
The following components have therefore been assessed and are included in this report:
Title page including name of author and contact details;
Executive Summary detailing the major findings (in Specialist Study Report document
only);
Table of Contents;
Introduction and project background;
Specialist details and declaration of independence;
Relevant legislation; and a statement that the study has addresses the relevant requirements;
Scope/purpose of work undertaken; and approach and methodology;
Assumptions, uncertainties, and knowledge gaps; as well as sources of data;
Project description;
Site sensitivity related to the activity;

Red Earth cc Page 22
Areas to be avoided including buffers (i.e. fatal flaw assessment);
Description of the Baseline Environment;
Impact/Risk assessment (direct, indirect and cumulative) utilising the prescribed assessment
methodology/format;
Management plan including mitigation measures to deal with both negative and positive
risks/impacts;
Monitoring plan;
Reasoned opinion and recommendations;
Notes on the consultation process;
Checklist of the information requested by the competent authorities; and
Conclusions and References.
2. DETAILS OF SPECIALIST
This current Soils / Land Capability / Land Use Specialist Study Report has been compiled by
an experienced specialist. The following specialist was involved with the investigation and in
the compilation of the aforementioned reports:
Specialist:
- Bruce McLeroth
Qualifications and Experience:
- B.Sc. Agriculture (Natal);
- Member of the Soil Science Society of Southern Africa; and
- Years of Experience in the current field: 31 years as follows:
28 years of these in my own business (Red Earth cc from 1989 till present); and
3 years prior to that (Institute for Commercial Forestry Research from 1986-1988).
- A synoptic C.V. of the abovementioned specialist is attached as Appendix IV of the Specialist
Study Report. A detailed C.V. can be made available upon request.
Given time constraints due to the immanent commencement of the hunting season, the
following persons assisted the author with the soil fieldwork exercise: Diana Rietz (Phd Soil
Science), Bonginkosi Vilakazi (M.Sc Soil Science) and Anele Mkila (B.Sc Soil Science).

Red Earth cc Page 23
3. DECLARATION OF INDEPENDANCE
I Bruce Bertram McLeroth as the appointed specialist hereby declare/affirm the correctness
of the information provided as part of the application, and that:
I act as the independent specialist in this application;
I will perform the work relating to the application in an objective manner, even if this results
in views and findings that are not favourable to the applicant;
I declare that there are no circumstances that may compromise my objectivity in performing
such work;
I have expertise in conducting the specialist report relevant to this application, including
knowledge of the Act, Regulations and any guidelines that have relevance to the proposed
activity;
I will comply with the Act, Regulations and all other applicable legislation;
I have no, and will not engage in, conflicting interests in the undertaking of the activity;
I undertake to disclose to the applicant and the competent authority all material information
in my possession that reasonably has or may have the potential of influencing any decision
to be taken with respect to the application by the competent authority; and - the objectivity
of any report, plan or document to be prepared by myself for submission to the competent
authority;
all the particulars furnished by me in this form are true and correct; and
I am aware that it is an offence in terms of Regulation 48 to provide incorrect or misleading
information and that a person convicted of such an offence is liable to the penalties as
contemplated in section 49B(2) of the National Environmental Management Act, 1998
(Act No. 107 of 1998).
B.B.McLeroth
Signature of the Specialist
Red Earth cc _
Name of Company
30 June 2017
_
Date

Red Earth cc Page 24
4. RELEVANT LEGISLATION AND GUIDELINES
All relevant Acts, Regulations and Guidelines are routinely considered during the compilation
of a Specialist Study Report. The Specialist Report is always compiled in support of an
Environmental Authorization Process under the management of an Environmental Assessment
Practitioner (EAP).
In support of the abovementioned environmental authorisation applications cognisance was
taken of the following Acts, Regulations and Guidelines (among others – refer to Sections 4.1
and 4.2 of the current document) during the compilation of the Soils / Land Capability / Land
Use Specialist Study Report.
The following applications will be made to the Department of Mineral Resources (DMR) as the
competent authority for the proposed mining project:
Mining Right Application (MRA) in terms of the Minerals and Petroleum Resource
Development Act, 2002 (Act No. 28 of 2002) (MPRDA);
Application for Environmental Authorisation (EA) for listed activities triggered in Listing
Notices GNR 983, 984 and 985 and in accordance with the Environmental Impact
Assessment (EIA) Regulations, 2014, promulgated in terms of National Environmental
Management Act, 1998 (Act No. 107 of 1998) (NEMA); and
Application for listed waste activities in terms of GNR 921 of the National Environmental
Management: Waste Act, 2008 (Act No. 59 of 2008), as amended (NEMWA).
In addition, the following applications will be made to the relevant competent authorities:
Atmospheric Emission Licence (AEL) Application, in terms of the National Environmental
Management: Air Quality Act, 2004 (Act No. 39 of 2004) (NEMAQA). The Lephalale
Local Municipality (LLM) is the competent authority;
Integrated Water Use Licence (IWUL) Application, in terms of the National Water Act,
1998 (Act No. 36 of 1998), as amended (NWA). The Department of Water and Sanitation
(DWS) is the competent authority; and
Relevant permit applications will also be made in terms of sections 34, 35 and 36 of the
National Heritage Resources Act, 1999 (Act No. 25 of 1999) (NHRA). The South African
Heritage Resources Agency (SAHRA) and/or the Limpopo Heritage Resources Authority
(LHRA) will be the competent authorities.

Red Earth cc Page 25
4.1 ACTS AND REGULATIONS
Table 4.1: Acts and Regulations
Act: Constitution of the Republic of South Africa No. 108 of 1996 (Constitution)
Act: Mineral and Petroleum Resources Development Act 28 of 2002 (MPRDA)
Regulation:
GNR 527 of 23 April 2004 - Mineral and Petroleum Resources Development Regulations
Act: National Water Act 36 of 1998 (NWA)
Regulations:
GNR 704 of 4 June 1999 – Regulations on Use of Water for Mining and Related Activities aimed at the Protection of Water Resources
Act: National Environmental Management Act 107 of 1998 (NEMA)
Regulations:
GNR 807 of 10 October 2012 - Publication of Public Participation Guideline
GNR 982 of 08 December 2014 - Environmental Impact Assessment Regulations
GNR 983 of 08 December 2014 - Environmental Impact Assessment Regulations - Listing Notice 1 of 2014
GNR 984 of 08 December 2014 - Environmental Impact Assessment Regulations - Listing Notice 2 of 2014
GNR 985 of 08 December 2014 - Environmental Impact Assessment Regulations - Listing Notice 3 of 2014
Act: National Environmental Management : Waste Act 59 of 2008 (NEMWA)
Regulations:
GNR 344 of 4 May 2012 – National Waste Management Strategy
GNR 921 of 29 November 2013 – List of Waste Management Activities that have, or are likely to have, a Detrimental Effect on the Environment
GNR 634 of 23 August 2013 – Waste Classification and Management Regulations
GNR 635 of 23 August 2013 – National Norms and Standards for the Assessment of Waste for Landfill Disposal
GNR 636 of 23 August 2013 – National Norms and Standards for Disposal of Waste to Landfill
GN 926 of 29 November 2013 – National Norms and Standards for the Storage of Waste
GN 331 of 2 May 2014 – National Norms and Standards for the Remediation of Contaminated Land and Soil Quality
GN 332 of 2 May 2014 – Amendment to the List of Waste Management Activities that have, or are likely to have a Detrimental Effect on the Environment
Act: National Heritage Resources Act (Act No. 25 of 1999) (NHRA)
Act: National Environmental Management: Air Quality Act (Act No. 39 of 2004) (NEMAQA)

Red Earth cc Page 26
4.2 GUIDELINES
Table 4.2: Guidelines
Guidelines:
Department of Mineral Resources (DMR) Guideline for Consultation with Communities and Interested and Affected Parties
DMR Guideline for the Compilation of an Environmental Impact Assessment and an Environmental Management Programme
Best Practice Guideline G4 – Impact Prediction; 2008
Best Practice Guideline H2 – Pollution Prevention and Minimization of Impacts; 2008
Integrated Environmental Management, Information Series 0, Overview of Integrated Environmental Management
Integrated Environmental Management, Information Series 2, Scoping
Integrated Environmental Management, Information Series 4, Specialist Studies
Integrated Environmental Management, Information Series 5, Impact Significance
Integrated Environmental Management, Information Series 6, Ecological Risk Assessment
Integrated Environmental Management, Information Series 9, Project Alternatives in EIA
Integrated Environmental Management, Information Series 10, Environmental Impact Reporting
Integrated Environmental Management, Information Series 11, Review in EIA
Integrated Environmental Management, Information Series 12, Environmental Management Plans
Integrated Environmental Management, Information Series 13, Environmental Auditing
Integrated Environmental Management, Information Series 14, Life Cycle Assessment
Integrated Environmental Management, Information Series 15, Strategic Environmental Assessment
Integrated Environmental Management, Information Series 16, Cumulative Effects Assessment
Integrated Environmental Management, Information Series 17, Environmental Reporting
Integrated Environmental Management, Information Series 20, Linking EIA and EMS
Integrated Environmental Management, Information Series 23, Risk Management
Guideline 3: General Guide to the Environmental Impact Assessment Regulations
Guideline 4: Public Participation
Guideline 5: Assessment of Alternatives and Impacts
Guideline 6: Environmental Management Frameworks
Guideline 7: Detailed Guide to Implementation of the EIA Regulations
Guideline 9: Need and Desirability in terms of the Environmental Impact Assessment Regulations
Framework for the Management of Contaminated Land. DEA 2010
DEA Guideline on Understanding the Definition of Waste.

Red Earth cc Page 27
5. SCOPE, PURPOSE, APPROACH AND METHODOLOGY
5.1 SCOPE AND PURPOSE OF THE REPORT
Kongiwe Environmental (Pty) Ltd (Kongiwe) has been appointed by LCM to undertake the
Environmental Impact Assessment (EIA) process in support of the Mining Right Application
(MRA) and other Environmental Authorisations required for the proposed mine and IPP.
Applications at this stage will be conducted for the mining section only, while applications for
the IPP will be done in the future once the design of the IPP has progressed.
The applications require a Scoping and Environmental Impact Assessment as per Regulation 21
and Regulation 24 of the EIA 2014 Regulations, of the National Environmental Management
Act (NEMA).
Red Earth cc was in turn commissioned by Kongiwe firstly to produce a Scoping Report, and
thereafter a Specialist Study Report (current report). The Specialist Study Report incorporates
the previous Scoping Report information; together with the Baseline Report, Environmental
Impact Assessment (EIA) and Environmental Management Plan (EMP) sections for the Soils,
Land Capability and Land Use components.
5.2 APPROACH, METHODOLOGY AND ACTIONS PERFORMED
The Soils / Land Capability / Land Use investigations conducted entailed both qualitative
(mostly) and quantitative (soil analytical data only) site specific investigations using data
obtained in the field as well as information documented during previous studies, in accordance
with the various guidelines and documents obtained from the regulating authorities. The
approach and methodology which was followed during the various investigations is discussed
below.
5.2.1 DESKTOP STUDY / REVIEW EXISTING INFORMATION
Obtain and review the existing soils, land capability, land use and mining related
information pertaining to the survey area. This includes published regional information, as
well as available reports relevant to LCPP.
Compile figures (maps) of the regional location/topography, and soils of the Study Area
and surrounds. These figures are used as a reference to aid in the description of the regional
setting of the Project Area. The figures were compiled as clipped sections or line work
extracted from the following published or unpublished maps: o 1:50 000 Topographical Map Series of South Africa. Published Sheets 2327 BC, 2327
DA, 2327 BD, 2327 DB, and 2328 AC;
o 1:250 000 Land Type Map Series of South Africa. Unpublished 1: 250 000 Sheet 2326
Ellisras; and
Red Earth cc Page 28
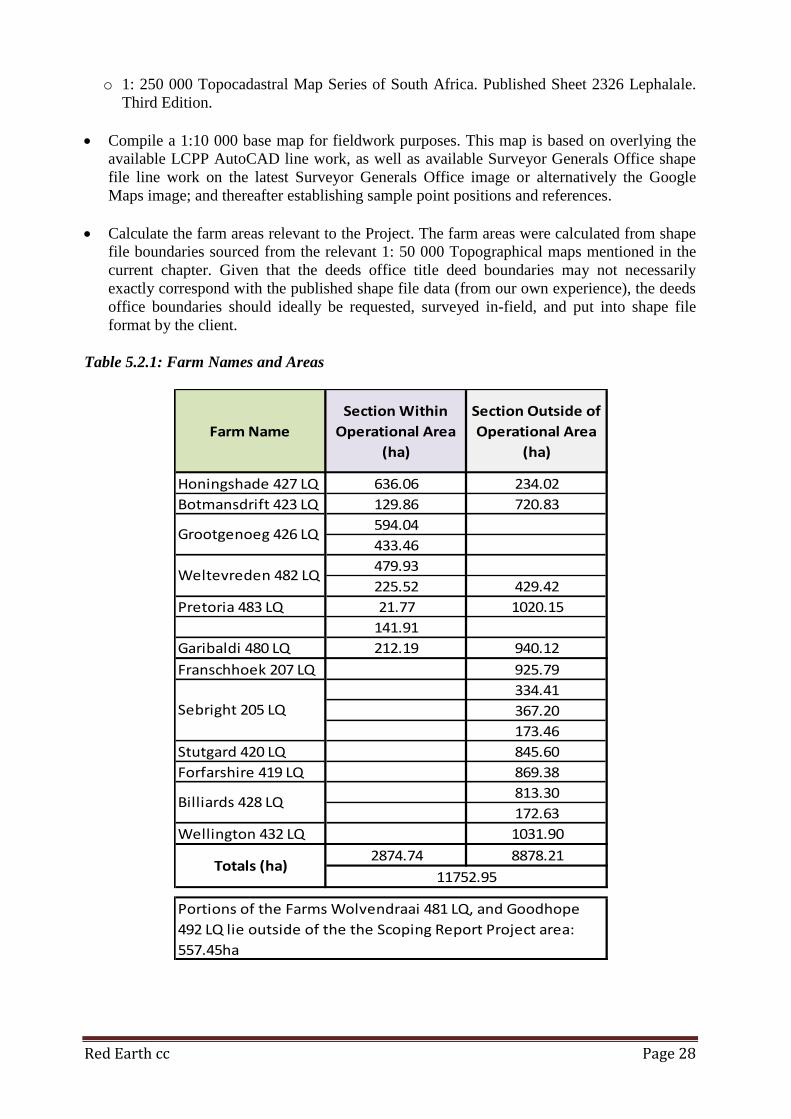
o 1: 250 000 Topocadastral Map Series of South Africa. Published Sheet 2326 Lephalale.
Third Edition.
Compile a 1:10 000 base map for fieldwork purposes. This map is based on overlying the
available LCPP AutoCAD line work, as well as available Surveyor Generals Office shape
file line work on the latest Surveyor Generals Office image or alternatively the Google
Maps image; and thereafter establishing sample point positions and references.
Calculate the farm areas relevant to the Project. The farm areas were calculated from shape
file boundaries sourced from the relevant 1: 50 000 Topographical maps mentioned in the
current chapter. Given that the deeds office title deed boundaries may not necessarily
exactly correspond with the published shape file data (from our own experience), the deeds
office boundaries should ideally be requested, surveyed in-field, and put into shape file
format by the client.
Table 5.2.1: Farm Names and Areas
Farm Name
Section Within
Operational Area
(ha)
Section Outside of
Operational Area
(ha)
Honingshade 427 LQ 636.06 234.02
Botmansdrift 423 LQ 129.86 720.83
594.04
433.46
479.93
225.52 429.42
Pretoria 483 LQ 21.77 1020.15
141.91
Garibaldi 480 LQ 212.19 940.12
Franschhoek 207 LQ 925.79
334.41
367.20
173.46
Stutgard 420 LQ 845.60
Forfarshire 419 LQ 869.38
813.30
172.63
Wellington 432 LQ 1031.90
2874.74 8878.21
11752.95Totals (ha)
Grootgenoeg 426 LQ
Weltevreden 482 LQ
Sebright 205 LQ
Billiards 428 LQ
Portions of the Farms Wolvendraai 481 LQ, and Goodhope
492 LQ lie outside of the the Scoping Report Project area:
557.45ha

Red Earth cc Page 29
Despite the Operational Area extent indicated in Table 5.2.1 (2874.74ha), the final mapping
Shapefiles for the map set indicate the extent to be 2743.59ha, since the mapping boundaries
were digitized according to the farm fence boundaries that are visible on the aerial photograph.
Both sets of areas include that portion of the district dirt road that dissects the farms.
5.2.2 FIELDWORK AND RESEARCH
A detailed qualitative site-specific fieldwork investigation was undertaken at LCPP between 23
April and 10 May 2017 as part of the Soils / Land Capability / Land Use study, the
aforementioned by means of a 300m grid auger soil survey.
Due to the non-polluted (by mining or industry) green fields nature of the Soils / Land
Capability / Land Use environments at LCPP, it is not expected that the season / time of the
year during which the fieldwork was undertaken will have a significant influence on the
outcome of the assessment. Note that in polluted areas (other sites outside of current Project
Area), where soil / ‘waste’ / ‘non-waste’ samples are collected during the rainy season, a
proportion of the potential pollutants in the 0-2cm sample depth range will have been leached
to a lower depth (generally top 30cm or 60cm) in the soil profile to a certain extent. The
opposite applies during the dry season, where potential pollutants will have moved closer to the
soil surface as a result of capillary action.
The procedure was:
Write up the Scoping Report before commencement of the soil augering fieldwork exercise.
Conduct the soil survey fieldwork and describe and classify the soils at each of the pre-
determined auger points, as per the procedure outlined in Section 8.2.1 (SURVEY
METHODS AND DATA COLLECTION).
Concurrently with the soil survey fieldwork exercise, also record the land capability and
land use at each pre-determined soil auger point. At the same time also record the types of
‘waste’ or ‘non-waste’ (none occur), and the location of sites of cultural and archaeological
(none encountered) interest.
Upon completion of the soil survey fieldwork exercise, auger seven modal (typical
representative) soil auger points. Immediately after augering; photograph, sample (for
agricultural analysis) and describe each of the modal soil augers, one at a time. A maximum
of two samples were collected from each soil augers, these being one each from the topsoil
and subsoil. A total of only eleven samples were collected, since three of the profiles did
not display a subsoil horizon.
Submit the agricultural soil samples to the Institute for Soil, Climate and Water for
analysis. Analyse the samples for the range of physical and chemical variables as indicated
in Table 8.2.5 (Soil Analytical Data). Interpret the resultant data.
Conduct the mapping of the following maps with reference to the data collected in-field,
aerial photographic interpretation, and the contours. Map 1: Soil Sampling Points; Map 2a:
Soil Mapping Units; Map 2b: Soil Mapping Units - Image Overlay; Map 3a: Pre-Mining
Land Capability; Map 3b: Wetlands; Map 4: Present Land Use; and Map 5: Soil Utilization
(Stripping) Guide.

Red Earth cc Page 30
Map 2c: Parent Material; Map 4a: Present Land Use - Man-Made Features Theme; Map 4b:
Present Land Use - Broad Vegetation Communities Theme; and Map 5: Sites of
Archaeological and Cultural Interest; were not produced since a 300m-grid soil survey was
utilised for the fieldwork (instead of the recommended 150m grid soil survey). The
collected data were thus insufficient to produce the aforementioned maps.
Should the proposed Project continue in the future, then all of the mapping products must
be updated based on intensifying the soil survey grid intensity to 150m, as specified by the
Chamber of Mines.
Finalise the aforementioned maps into Shape file format.
Write-up the Specialist Study Report document, which includes the Baseline, EIA, and
EMP components.
5.2.3 BASELINE DESCRIPTION
Comprehensive Soils, Land Capability, and Land Use Baselines were compiled.
Additional baseline information routinely presented includes the following: location and
mapping of ‘Wastes’ / ‘Non-Wastes’ (none present in current green fields Study Area),
Wetland Identification/Delineation and Riparian Areas, and Broad Vegetation Communities
(Distribution - not species composition – not compiled due to 300m grid utilised). These
chapters are routinely included with the Soils, Land Capability and Land Use Baselines
respectively.
Further additional information routinely presented includes the following: Sensitive
Landscapes, and Sites of Cultural and Archaeological Interest (not compiled due to 300m grid
utilised).
The Soils Baseline routinely describes the following aspects:
soil distribution [homogenous areas of soil] (i.e. soil mapping units map – includes soil
form, depth, surface features, parent material, perched soil water-table – not encountered,
overburden waste or non-waste depth and type – none encountered; and rarely precipitated
sub-surface/surface salts);
soil frequency (i.e. soil mapping units map – map legend summary, and table in document);
soil types and suitability for agriculture (i.e. cultivation) and ‘topsoil’ (i.e. rehabilitation
‘topsoiling’ purposes);
soil water-table (i.e. anthropogenic, semi-permanent, seasonal, and temporary perched
water-tables);
soil analytical data (i.e. chemical and physical data);
soil analytical characteristics and soil fertility (i.e. how the soil chemical and physical
analytical data relates to soil fertility);
erosion hazard and slope (i.e. how the soil physical analytical data relates to soil erosion,
both naturally in-situ, and in two different rehabilitation scenarios [not intentionally
compacted underlying material, and compacted -‘remoulded’ ‘seal’] in the post-
mining/industrial state);
dryland and irrigated production potential (i.e. crop range and yields);
Red Earth cc Page 31
soil utilization (stripping) guide (i.e. distribution) [map], frequency [map legend summary],
and volume [map legend summary] of broad soil groups, that must be stripped / stockpiled /
and utilised for rehabilitation ‘topsoiling’ purposes [frequently separately from ‘each
other’, for the different broad soil groups];
rehabilitation ‘topsoil’ budget (i.e. comparison of the volume of stockpiled ‘topsoil’, versus
that required to rehabilitate [‘topsoil’] the various post-mining / post-industrial landscapes
to the arable or grazing or non-grazing capability classes during the operational and closure
phases, for two different rehabilitation scenarios [not intentionally compacted underlying
material, and compacted -‘remoulded’ ‘seal’ layer]; and
‘waste’ or ‘non-waste’ overburden/underburden – includes
distribution/depth/frequency/types of ‘wastes’ or ‘non-wastes’ (i.e. indicated on soil
mapping units map, and explanation table in document). This is to inform a potential
‘Wastes’ Baseline of the entire survey area, this being necessary to quantify the state of the
property, so that the mine/smelter can make informed decisions regarding the best / safest /
most cost effective measures for dealing with the materials. Such material did not occur in
the current green fields Study Area.
The Land Capability Baseline describes the following aspects:
land capability requirements (i.e. the allocation of soils to different land capabilities, based
on the various requirements allocated to each land capability class);
land capability distribution (i.e. land capability and wetland delineation - map); and
land capability frequency (i.e. land capability and wetland delineation maps - map legend
summaries, and tables in document).
The Land Use Baseline describes the following aspects:
present land use distribution (i.e. present land use map, including vegetated areas);
present land use frequency (i.e. present land use map - map legend summary, and table in
document);
on the aforementioned map/table, the various structures, features and landscapes will be
mapped, classified, quantified, and summarized in detail; and
the present/past land use will be discussed from the following perspectives: human
settlement, historical agricultural production, existing structures, and evidence of misuse
from the agricultural perspective in the current area.
Furthermore, additional related information provided includes the following aspects:
wetland classification/delineation and riparian areas;
sensitive landscapes; and
sites of cultural and archaeological (none encountered) interest.
Wetland Classification/Delineation and Riparian Areas describes the following aspects:
wetland distribution (i.e. included on the land capability and wetland delineation map);
wetland frequency (i.e. included on the land capability and wetland delineation map - map
legend summaries, and tables in document); and
wetland identification and classification/delineation procedure (i.e. initial identification of
wetlands based on the recognition of ‘signs of wetness’ within the top 0.5m of soil depth;
and thereafter the wetlands are classified into the semi-permanent/permanent, seasonal and
temporary classes).
Sensitive Landscapes describes the following aspects:
natural wetland soils, natural (wetland) drainage features, wetland/riparian vegetation,
erodible soils and vegetative cover, anthropogenic moisture (not encountered), and

Red Earth cc Page 32
paleochannels/naturally buried soils (not encountered). The sensitive landscapes will be
identifiable on the following maps (and map legend summaries): pre-mining land
capability; and soil mapping units.
Sites of Archaeological and Cultural Interest describes the following aspects:
location of sites of cultural interest (i.e. present land use map, and table in document). Sites
of archaeological interest were not encountered in the current area.
To this end, a 300m-grid auger soil survey was conducted to map, classify, quantify and
summarize all of the aforementioned.
5.2.4 IMPACT AND RISK ASSESSMENT
These aspects of the Project are discussed in Sections 9 – 17 of the current document.

Red Earth cc Page 33
6. ASSUMPTIONS, UNCERTAINTIES AND KNOWLEDGE
GAPS
6.1 ASSUMPTIONS
Soils study
Due to the qualitative (mostly) / quantitative (soil analytical data only) investigative nature of
the assessment very few significant assumptions were made. The vast majority of the
information included in the report was either verified during (observed soil variables) or after
(estimated soil variables were largely verified by the soil analytical data of the seven modal soil
augers) the field investigations.
The volume of available in-situ ‘topsoil’ (suitable topsoils and subsoils), calculated for the soil
utilization (stripping) guide is precise up till the weathering/hard rock/hardpan carbonate
horizon/soft carbonate horizon/soft plinthic horizon/G-horizon, since this figure was calculated
using both soil depth and extent (area). Table 8.2.11 (Summary of Soil Utilization [Stripping]
Guide) indicates the aforementioned.
‘Topsoil’ stockpiles and ‘waste’ were not encountered in the current green fields survey area.
Further assumptions made relate to the Adequacy of the Predictive Methods utilised.
The predictive methods used throughout the soils, land capability and land use investigations
generally adhere to the relevant regulating requirements and are both applicable to and
adequate (bar the soil survey grid intensity utilised) for the investigations conducted. These
methods include the soil survey intensity (i.e. grid espacement – 150m grid is recommended
and appropriate; not 300m-grid), and the recording of observed / estimated data during the
fieldwork exercise, as well as the analytical determinations conducted on the modal soil
samples collected for agricultural analyses.
Soil survey grid intensity:
The 150m-grid auger observation interval is recommended to be utilised throughout areas
where detailed soil information is required (where large amounts of surface disturbance will, or
have already occurred). The 150m-grid intensity represents the generally accepted minimum
industry standard (also recommended by the Chamber of Mines) that will achieve a high
mapping purity, ensuring that the area does not have to be revisited in the future to refine
detail.
Given time constraints due to the immanent commencement of the hunting season, the 300m-
grid auger intensity (instead of the 150m-grid auger intensity) was utilised in the proposed
‘Operational Area’ (i.e. ‘Footprint’ indicated on Figure 7.1a) for mapping and reporting
purposes. Should the proposed Project continue in the future, then the area must be revisited
and the sampling intensified. In this event, the first version of the mapping / Specialist Study
Report document must then be updated.
Recording of observed and estimated soil variables:
Red Earth cc Page 34
Observed soil variables are recorded accurately in the field (at each auger point / sample
position), and include most of those mentioned in Section 8.2.1 (SURVEY METHODS AND
DATA COLLECTION). The ‘Recorded soil variables’ are either: ‘Recorded per horizon’ or
‘Recorded per profile’. Exceptions in this list, which are estimated in the field, are recorded
below.
Estimated soil variables are recorded approximately in the field (at each auger point / sample
position), and include surface features (% of surface cover), topsoil organic carbon (%), clay
content (%), sand grade (dominantly fine, medium, or coarse), and cultivation factors (coarse
fragments %). The latter four estimates will be adjusted slightly (where necessary), after
comparing them with the soil analytical data of the modal soil profiles (topsoils and subsoils)
that were collected and analysed.
Soil analytical determinations:
The agricultural soil analyses were conducted at the laboratories of The Institute for Soil,
Climate, and Water (ISCW) (Agricultural Research Council) on eleven samples that were
collected from eight modal soil augers. The data is likely to be precise given that the laboratory
has a long history and professional staff.
Land Capability (including Wetland Classification / Delineation and Riparian Areas)
study
Due to the qualitative (soil form, effective rooting depth, signs of wetness in the soil profile,
and slope) and quantitative (soil analytical data) investigative nature of the assessment, no
significant assumptions were made in areas augered or traversed. Furthermore the guidelines
governing the classification of land capabilities and wetlands are clearly defined.
Despite the aforementioned, the 300m-grid soil survey was found to be insufficient to map the
wetland boundaries and the soil forms occurring therein accurately. Thus, the delineation
(boundaries) and classification (permanent, seasonal or temporary) of wetlands that were not
augered or traversed were subjective and in many instances based on aerial photograph
interpretation.
Land Use study
Information recorded in-field was of a qualitative nature. However, due to the quantitative
nature of the mapping (utilizing an aerial photograph, from which all of the mapping was
conducted, for all of the maps in the set); no significant assumptions will be made during the
mapping exercise.
Despite the aforementioned, given the low resolution of the aerial photograph utilised, man-
made structures were frequently not clearly visible on the image or alternatively not visible at
all. Thus, the positions of many of the man-made structures are approximate only.
The dryland/irrigated agricultural production potential yields are far more subjective, given that
yields assume a high level of expertise and management, and furthermore the unpredictable
rainfall patterns also play a role. Quoted yields will be as per R.E. Schulze et-al (1997).
Red Earth cc Page 35
6.2 UNCERTAINTIES
The vast majority of the information used/recorded during the various studies was
qualitatively/quantitatively obtained, before, during, and after the field work exercise.
Information that was collected during the various studies was either verified or quantified
during the field investigations conducted on site, or afterwards by soil analysis of modal soil
profiles (augers) or comparison with published data for the area.
Mapping uncertainty exists in certain aspects of the mapping (already discussed) given both the
utilisation of the 300m-grid intensity auger soil survey conducted (lower mapping purity) as
opposed to the recommended 150m-grid survey; as well as due to the resolution of the geo-
referenced aerial photograph utilised. The resultant lower mapping purity in certain instances
cannot thus be attributed to the specialist, but rather to both the time constraints (and thus broad
mapping grid) specified by the client, as well as the non-provision of a high resolution geo-
referenced aerial photograph by the client.
6.3 KNOWLEDGE GAPS
Minor knowledge gaps exist in certain aspects of the mapping (already discusses) given both
the utilisation of the 300m-grid intensity auger soil survey conducted (lower mapping purity) as
opposed to the recommended 150m-grid survey; as well as due to the resolution of the geo-
referenced aerial photograph utilised.
Neither the Parent Material map nor the Present Land Use (Broad Vegetation Communities
Theme) map were compiled as a result.

Red Earth cc Page 36
7. PROJECT ASPECTS RELEVANT TO SOILS, LAND
CAPABILITY AND LAND USE
The current section is comprised of Infrastructure and Layout, Site Sensitivity, a Fatal Flaw
Assessment, and Features and Buffers for Avoidance.
7.1 INFRASTRUCTURE AND LAYOUT (Refer to Figures 7.1a and 7.1b; Map 4; and Tables 8.4 and 8.4.1)
Proposed Infrastructure Layout:
The proposed infrastructure and layout within the proposed ‘Operational Area’ (i.e. ‘Footprint’
indicated on Figure 7.1b) is indicated on Figure 7.1b, these features occupying the majority of
this area. The proposed infrastructure will be comprised of the following:
Opencast pits (two), crushing circuit, wash plant, conveyors;
Discard dump, Run of Mine stockpiles, ash dump, topsoil stockpiles;
Water supply network, storm water network, pollution control dams, raw water dam,
effluent water, water treatment works;
Offices, workshops, change house, storehouses, warehouses;
Internal roads, haul roads, fuel storage facilities; and
Independent Power Producer station (design and location to be covered by a later Specialist
Studies Report document).
A more detailed proposed Infrastructure list is provided in Tables 9.2.2a-c.
Map 4 (Present Land Use) indicates the currently occurring man-made features in the proposed
Operational Area (only). The corresponding summary Tables 8.4 (Summary of Present Land
Use) and 8.4.1 (Summary of Man-Made Structures) summarises these features.
Adjacent Areas:
The man-made features in the greater Project / Study Area surrounding the proposed
Operational Area will not be mapped. Thus, the proposed Operational Area may in the current
document be referred to as the survey area.

Red Earth cc Page 37
Figure 7.1(a): Proposed Infrastructure Layout (General)

Red Earth cc Page 38
Figure 7.1(b): Proposed Infrastructure Layout (Operational Area Detail)

Red Earth cc Page 39
7.2 SITE SENSITIVITY
Section 8.5 (SENSITIVE LANDSCAPES) of the current document describes the potentially
sensitive landscapes in the survey area.
The sensitive landscapes were grouped according to the following:
i) Natural Wetland Soils.
ii) Natural (Wetland) Drainage Features.
iii) Wetland/Riparian Vegetation.
Such vegetation is found in the areas associated with Points i) and ii).
iv) Erodible Soils
v) Vegetative Cover.
vi) Anthropogenic Moisture.
vii) Paleochannels and Naturally Buried Soils.
Future infrastructure and containment facilities must be carefully planned so as not to impact or
intrude into sensitive wetland soils / riparian areas.
7.3 FATAL FLAW ASSESSMENT
(Refer to Figure 7.4)
Section 7.4 (FEATURES AND BUFFERS FOR AVOIDANCE) indicates that no fatal
flaws were encountered within the LCPP Operational Area. The procedure that was
utilised to identify potential fatal flaws is described in the current Section.
The fatal flaw assessment is performed subject to the guidelines contained within the DWAF
Waste Management Series’ “Mining Requirements for Waste Disposal by Landfill” document.
It is a Minimum Requirement that no landfill site be developed in an area with an inherent
Fatal Flaw. The assessment is performed by highlighting any potential fatal flaw from the list
provided, which are known to occur within the LCPP Operational and immediate surrounding
areas, ending up with a map that indicates areas void of any fatal flaws.
The fatal flaw assessment at LCPP is addressed with reference to the features depicted on
Figure 7.4 (Features and Buffers for Avoidance), which incorporates each of the identified
requirements for the fatal flaw assessment. This map (Figure 7.4) was compiled based on
existing published information (extracted from the published 1:50 000 Topographical maps of
the area) as well as information generated during the various field investigations conducted at
LCPP.
In a green fields situation (such as the current LCPP Study Area) the map would be used to site
activities within these fatal flaw free zones. In a brown fields situation the map would be used
to identify activities for which the design criteria should be adapted to engineer for possible
fatal flaw related complications.

Red Earth cc Page 40
A number of aspects representing potential fatal flaws (situations which may preclude the
development of an environmentally or publicly acceptable waste disposal facility except at
excessive cost) were considered during the fatal flaw assessment. The proposed ash dump may
be considered as a waste disposal facility.
A number of the potentially fatal flaws may possibly occur more than once in the discussions
of the various aspects. The various aspects include the following:
3000m from the end of any airport runway or landing strip in the direct line of the flight
path and within 500m of an airport or airfield boundary. This is because certain waste disposal landfills (typically domestic) may attract birds,
creating a danger to aircraft.
The closest farm landing strip on the farm Franschhoek 207 LQ (within the Project Area) is
located approximately 4.5km to the north-east of the northern property corner (farm
Botmansdrift 423 LQ) of the Operational Area. The Operational Area is therefore not
located in the direct line of approaching or departing aircraft.
Areas below the 1 in 50 year flood line.
These areas are included to protect naturally sensitive areas such as streams, wetlands
(wetland soils, vleis and pans), flood plains and riparian vegetation, where development
would result in the destruction of the soils/land capability/land use in these areas, while
water pollution could [potentially] also result. Furthermore, this is also to prevent the
flooding and resultant instability of man-made features.
The water courses and ephemeral pans indicated on Figure 7.4 as a solid blue line were
extracted from the South African National Biodiversity Institute (SANBI) database
(‘wetlands’ layer).
These solid blue water course lines were also overlaid on top of the dashed blue drainage
lines/pans indicated on the combined 1:50 000 Topographical Map Series of South Africa
(Sheets 2327 BC, 2327 DA, 2327 BD, 2327 DB, and 2328 AC), to create Figures 7.1a
(Proposed Infrastructure Layout [General]) and 8.1.1 (Location and Topography of Study
Area).
The SANBI ‘wetlands’ layer indicates three unnamed non-perennial water courses (short
sections only) and sixteen ephemeral pans within the Project Area, outside of the
Operational Area. Further wetlands will occur in this area (not indicated by SANBI). The
extent of wetlands in the aforementioned area may be inferred from that occurring in the
Operational Area (2.94% of area). Although the SANBI ‘wetlands’ layer did not indicate
any wetlands within the Operational Area, this is not correct.
The wetlands identified within the Operational Area during the course of the soil survey
(refer to the following bullet: Areas characterized by flat gradients, shallow or emergent
groundwater) were added to Figure 7.4.
The 1: 50 year and 1: 100 year flood lines will be calculated as part of the Surface Water
Specialist Study Report. In the absence of delineated flood lines, we delineated only the
water courses, pans, and wetlands (without the buffer).
Figure 7.4 indicates the relevant features as follows:

Red Earth cc Page 41
Inside Operational Area: ‘Wetlands’ (incorporating Wp-Wetland permanent, Ws-Wetland
seasonal, and Wt-Wetland seasonal), ‘Pans’, and ‘Pan.W’ (pans displaying a man-made
wall to increase the water storage capacity - also permanent wetlands).
Outside Operational Area (i.e. Project Area): ‘Water Courses’, and ‘Pans’.
Areas in close proximity to significant surface water bodies.
No major water courses, major water bodies or major dams occur within the Project Area.
Surface water for livestock and human drinking purposes is pumped from boreholes and
stored in a limited number of man-made ponds, reservoirs, tanks and troughs. Three man-
made ponds have been constructed in terrestrial (non-wetland) areas within the Operational
Area, the aforementioned amounting to 0.47ha or 0.02% of the Operational Area. The area
of man-made ponds within the Project Area (outside of the Operational Area) is unknown to
the author. The ephemeral pans display surface water for short periods after rainfall events.
The Mokolo (AKA Magol) and Lephalale Rivers (tributaries of the Limpopo River), are the
closest significant surface water body, flowing in a northerly and north-westerly direction
approximately 18.5 km to the west and 18.0 km to the north-east of the LCPP Operational
Area respectively.
Catchment areas for important water resources.
Although all sites ultimately fall within a catchment area, the size and sensitivity of the
catchment is important, especially if it feeds a water resource.
The Project Area does not produce surface runoff (an endoreic area) due to the semi-arid
climatic conditions and shallow topographical gradients. The limited ephemeral wetlands
within the Operational Area dissipate a short distance after they commence and are
not connected to streams, and thus do not constitute catchment areas.
Thus, the size and locality of the LCPP Project Area is not deemed to represent a fatal flaw.
Areas characterized by flat gradients, shallow or emergent groundwater Such areas are regarded as wetlands (wetland soils, springs and pans).
Wetlands and their associated riparian vegetation areas are normally regarded as especially
sensitive landscapes under statutory protection, and as such must not be disturbed, polluted,
cultivated or overgrazed without a licence. Such areas have a high significance from a
preservation point of view, since they perform important hydrological functions, and are
major contributors to the bio-diversity of an area. In wetland areas there would not be a
sufficient unsaturated zone separating a waste body and the groundwater.
The DWA interpretation of the NWA is that no mining activities or infrastructural
placement may take place within a 500m radius of the boundary of any wetland; unless an
authorisation is issued in terms of Sections 21 (c) [Impeding or diverting the flow of a
watercourse] and (I) [Altering the bed, banks, course or characteristics of a watercourse] of
the NWA.
The SANBI (South African National Biodiversity Institute) ‘wetlands’ layer indicates three
unnamed non-perennial water courses (short sections only) and sixteen ephemeral pans
within the Project Area, outside of the Operational Area. Further wetlands will occur in this

Red Earth cc Page 42
area (not indicated by SANBI). The extent of wetlands in the aforementioned area may be
inferred from that occurring in the Operational Area (2.94% of area). Although the SANBI
‘wetlands’ layer did not indicate any wetlands within the Operational Area, this is not
correct.
Within the Operational Area, the soil survey indicated the following: 23 pans (3.96ha,
0.14% of Operational Area); 2 pans further dammed up by a man-made wall (1.02ha,
0.04%); and further wetland areas (permanent 13.52ha, 0.49%; seasonal 55.78ha, 2.03%;
and temporary 6.27ha, 0.23%). Thus total wetlands amount to 80.56ha or 2.94% of the
Operational Area (2743.59ha).
Any proposed infrastructure in such areas will require a license. It is the opinion of the
author that such a license should be granted, given our comments in the following two
paragraphs.
The ephemeral wetlands and pans occurring within the Operational Area are not
deemed to represent fatal flaws by the author for the following reasons:
ephemeral in nature; dissipate a short distance after they commence; are generally
underlain by solid rock or hard plinthite (ferricrete) at approximately 40-70cm below
the surface; are not connected to streams and thus do not constitute catchment areas;
and are commonly occurring features in the surrounding areas in general.
Thus, the loss of these wetland areas due to mining related activities is deemed
acceptable by the author.
An ephemeral stream is defined in Appendix III of our report as follows: “A stream or portion
of a stream that flows only in direct response to precipitation, and receives little or no water
from springs or no long continued supply from snow or other sources, and its channel is at all
times above the water table”.
Figure 7.4 indicates the relevant features as follows:
Inside Operational Area: ‘Wetlands’, ‘Pans’, and ‘Pan.W’.
Outside Operational Area (i.e. Project Area): ‘Water Courses’, and ‘Pans’.
Sensitive ecological and/or historical areas.
These include areas of ecological significance (increased bio-diversity and nature reserves),
and sites of cultural or archaeological interest.
Wetlands and their associated riparian vegetation areas are regarded as especially sensitive
landscapes under statutory protection, and are major contributors to the bio-diversity of an
area. Thus, such areas must ideally be preserved.
Areas of broader vegetative (and other) diversity are also relevant, such as those that occur
on rocky ridges where there is a reduced incidence of fire.
The Study Area is not a formally protected area; the closest major ecologically sensitive
area being the D’Nyala Nature Reserve which is located approximately 17.0 km to the
south-south-west of the proposed Operational Area. The Hans Strydom Nature Reserve
surrounds the Mokolo Dam, approximately 45km to the south of the proposed Operational
Area.

Red Earth cc Page 43
Sites of archaeological and cultural significance were searched for during the course of the
soil survey fieldwork exercise. However, no archaeological sites were encountered. The
existing contemporary man-made structures are presented in Section 8.4.1 (MAN MADE
FEATURES) and Table 8.4.1 (Summary of Man-Made Structures) and may have some
cultural interest.
Figure 7.4 indicates the relevant features as follows:
Inside Operational Area: ‘Wetlands’, ‘Pans’, and ‘Pan.W’.
Outside Operational Area (i.e. Project Area): ‘Water Courses’, ‘Pans’, and ‘Rocky Soils’.
Areas of groundwater recharge on account of topography and/or highly permeable soils.
Groundwater recharge may be increased in areas of rapid soil permeability, as well as
associated with dykes and certain (dykes) rocky soils. Dykes in particular may represent a
fatal flaw in terms of groundwater recharge.
Rehabilitated opencast pits / other features (none present in current green fields Study Area)
may also represent areas of increased groundwater recharge.
Figure 7.4 indicates only one possible relevant feature as follows:
Outside Operational Area (i.e. Project Area): ‘Rocky Soils’.
Areas overlying or adjacent to important or potentially important aquifers.
This aspect is not applicable to our scope of work.
Areas characterized by steep gradients, where stability of slopes could be problematic.
Steep areas do not occur within the proposed Operational Area. Thus, Figure 7.4 does not
presently indicate any relevant features.
Areas characterized by shallow bedrock with little soil cover.
The shallow broad soil group (lithosols - typically 5 - 30cm of soil overlying shattered or
weathering rock) is relevant when associated with dykes (or faults). Bio-diversity is usually
high in the less rocky sections of such areas, while groundwater recharge may also be raised
relative to the surrounds.
The soil survey fieldwork exercise determined that no such soils associated with dykes
occur in the proposed Operational Area. The shallow soils associated with mudstone,
siltstone, sandstone and ferricrete in the Operational Area are not relevant.
Figure 7.4 indicates only one possible relevant feature (two locations) as follows:
Outside Operational Area (i.e. Project Area): ‘Rocky Soils’.
Areas in close proximity to land-uses which are incompatible with land-filling.
Community resistance to incompatible land-uses is likely to arise from proposed
developments in the vicinity of residential areas, nature reserves and cemeteries.
No major residential areas exist in proximity to the proposed Operational Area.

Red Earth cc Page 44
Thus, Figure 7.4 does not presently indicate any relevant features.
Areas where adequate buffer zones are not possible. The DWAF Minimum Requirements for Waste Disposal by Landfill (2nd Edition) indicate
that buffer zones are separations between the registered (or proposed) landfill site boundary
and any adjacent residential or sensitive development. They are established to ensure that a
landfill operation does not have an adverse impact on quality of life and/or public health.
The buffer zone around LCPP is deemed adequate given that the proposed Operational Area
is surrounded by areas of livestock/game farming, as well as limited areas of cultivated land.
Areas which, because of title deeds and other constraints, can never be rezoned to permit
a waste disposal facility.
This aspect is not applicable to our scope of work.
Areas immediately upwind of a residential area in the prevailing wind direction(s).
This aspect is not applicable to our scope of work, and is dealt with in the Air Quality
Specialist Study Report.
Areas over which servitudes are held that would prevent the establishment of a waste
disposal facility.
This aspect is not applicable to our scope of work. The details of all the servitudes (e.g.
Eskom Power Lines and District Roads) will be confirmed during the relevant Specialist
Study Report.
Nevertheless, Figure 7.4 indicates one relevant feature as follows:
Inside Operational Area: ‘Secondary Roads’ (i.e. the District Road).
Any area characterized by any factor that would prohibit the development of a landfill
except at prohibitive cost.
This refers to areas with specific engineering challenges.
This aspect is not applicable to our scope of work.
Areas in conflict with the Local Development Objectives (LDO) process and the Regional
Waste Strategy.
This aspect is not applicable to our scope of work

Red Earth cc Page 45
7.4 FEATURES AND BUFFERS FOR AVOIDANCE
(Refer to Figure 7.4)
The features and buffers addressed in Section 7.3 (FATAL FLAW ASSESSMENT) have been
used to identify the areas which are normally considered as fatal flaws, and which should
therefore be avoided.
Those areas which contain features and buffers which are to be avoided are indicated on Figure
7.4 (Features and Buffers for Avoidance). However, given our comments in Section 7.3, and
specifically Bullet: Areas characterised by flat gradients, shallow or emergent groundwater; the
wetlands/pans occurring in the Operational Area are not considered by the author to be
particularly ecologically sensitive areas, and are thus not considered to be fatal flaws.

Red Earth cc Page 46
Figure 7.4: Features and Buffers for Avoidance
Red Earth cc Page 47
BASELINE SECTIONS
8. BASELINE DESCRIPTION OF THE ENVIRONMENT
The Soils, Land Capability, and Land Use Scoping Report baseline descriptions (and other
related studies) were compiled with reference to the available information pertaining to the site
(moderate amount of the information). The majority of the information was generated during
the field investigations and a small minority after completion of the investigations. The
soils/land capability/land use baseline descriptions are further documented in such a manner as
to support the information required for the respective applications in terms of the MPRDA, the
NEMA, the NEMWA as well as the NWA.
8.1 REGIONAL SETTING
The regional setting is discussed with reference to available published regional information for
the survey area. The discussion will deal with the regional location, topography, surface
drainage, meteorology, geology/parent material, soils, land capability, and land use; all of
which have an influence on the soil/land capability/land use setting of the site.
8.1.1 LOCATION (Refer to Figure 8.1.1)
Figure 8.1.1 (Location and Topography of Survey Area) indicates the location of the site, the
figure having being clipped from the published 1: 50 000 Topographical Map Series of South
Africa, compilation of Sheets 2327 BC, 2327 DA, 2327 BD, 2327 DB, and 2328 AC.
The LCPP Project is located in the Waterberg Coalfield, the proposed Operational Area lying
approximately 22km north-east of the town of Lephalale (Limpopo Province), and
approximately 40km south of the Botswana border.
The centre of the proposed Operational Area lies approximately 12km north of the R518
provincial tar road that links the town of Lephalale with the village of Marken, and
approximately 27km east of the R510 provincial tar road that trends to the north-north-west
from the town of Lephalale. The Project Area is bisected by a number of district dirt roads.

Red Earth cc Page 48
Figure 8.1.1: Location and Topography of Study Area

Red Earth cc Page 49
8.1.2 TOPOGRAPHY (Refer to Figure 8.1.1)
The topography is evident in Figure 8.1.1 (Location and Topography of Study Area).
Topographically the Study Area lies within the Ellisras-Limpopo Plain, which is a flat to gently
undulating region. The area is part of the broad Limpopo Basin.
The topography in the area is described as being generally that of an almost level (0.5 - 1
degree slope) plain with very gentle undulations and no prominent topographical features.
Slope is very-gentle (1 - 2 degrees) in other limited areas of the plain.
At least two rocky outcrops exist outside of the proposed Operational Area. Slopes in these
areas may exceed 5 degrees (moderate slope is defined as 5 - 10 degrees) in certain sections.
One of these outcrops exists in the central section of the farm Wellington 432 LQ, while the
other is a small isolated outcrop in the western extent of the farm Garibaldi 480 LQ. There are
no natural areas characterized by steep gradients in the proposed Operational Area. A number
of concave ‘valley-bottom’ areas associated with wetlands also exist, these areas being almost
non-discernible in-field due to the almost level to very gently sloping prevailing slopes.
Altitude within the Project Area varies as follows: 840mamsl (western boundary of Wellington
432 LQ); 865mamsl (north-eastern corner of Franschhoek 207 LQ); 890mamsl (north-western
corner of Forfarshire 419 LQ); and 940mamsl (south-eastern corner of Pretoria 483 LQ).
Aspects are generally north-westerly, except on the farm Forfarshire 419 LQ where they are
south-easterly.
In summary, after completion of the soil survey exercise, slope in the Operational Area was
determined to vary as follows for natural areas: - Midslopes (and concave ‘valley-bottom’ areas): almost level (0.5 - 1 degree): vast majority;
- Midslopes (and concave ‘valley-bottom’ areas): very gently sloping (1 - 2 degrees):
occasionally; and
- Midslopes (and concave ‘valley-bottom’ areas): gently sloping (2 - 4 degrees): rarely.
8.1.3 SURFACE DRAINAGE (Refer to Figure 8.1.1)
The Ellisras-Limpopo Plain area is part of the broad Limpopo Basin and is drained by several
rivers, of varying size, which flow northwards to the Limpopo River. These rivers are, from
west to east, the Matlabas, Mokolo, Lephalale, Mogalakwena and Sand Rivers. The current
Study Area is bounded by the Mokolo River to the west and the Lephalale River to the east.
The surface drainage in the Study Area is evident in Figure 8.1.1 (Location and Topography of
Study Area).
The Mokolo (AKA Magol) and Lephalale Rivers (tributaries of the Limpopo River), are the
closest significant surface water body, flowing in a northerly and north-westerly direction

Red Earth cc Page 50
approximately 18.5 km to the west and 18.0 km to the north-east of the LCPP Operational Area
respectively.
The majority of slopes in the Project Area are towards the Mokolo River to the west, with a
limited number sloping towards the Lephalale River to the north-east. The majority of the
Project Area falls within the A42J quaternary catchment of the Limpopo Water Management
Area, the aforementioned draining to the Mokolo River, A42 sub-catchment. A limited section
to the north-east of the Project Area drains instead into another catchment to the north-east,
also within the Limpopo Water Management Area.
Despite the aforementioned, the Project Area does not produce surface runoff (an endoreic
area) on account of the semi-arid climatic conditions and shallow topographic gradients that
occur.
The SANBI (South African National Biodiversity Institute) ‘wetlands’ layer indicates three
unnamed non-perennial water courses (short sections only) and sixteen ephemeral pans within
the Project Area, outside of the Operational Area. Further wetlands will occur in this area (not
indicated by SANBI). The extent of wetlands in the aforementioned area may be inferred from
that occurring in the Operational Area (2.94% of area). Although the SANBI ‘wetlands’ layer
did not indicate any wetlands within the Operational Area, this is not correct.
Within the Operational Area, the soil survey indicated the following: 23 pans (3.96ha, 0.14% of
Operational Area); 2 pans further dammed up by a man-made wall (1.02ha, 0.04%); and further
wetland areas (permanent 13.52ha, 0.49%; seasonal 55.78ha, 2.03%; and temporary 6.27ha,
0.23%). Thus total wetlands amount to 80.56ha or 2.94% of the Operational Area (2743.59ha).
8.1.4 METEOROLOGY
The climatic information that follows (in quotations) was sourced from Section 1.10
(CLIMATE) of the RSV ENCO Consulting report entitled ‘Lephalale Coal Project, Dedicoal
06860001, Scoping Study Report’, dated May 2014 (Document Number: 06860001A-00-REP-
0001).
“The climate is best described as semi-arid with rainfall of between 250mm - 500mm per
annum and temperatures reaching up to 40°C. The mean annual rainfall is 435mm, mostly
falling during the summer months of October to April with very dry winters extending from
May to September, as can be seen in Table 8.1.4”.
Figure 8.1.4: Annual Rainfall (mm)
Jan Feb Mar Apr May Jun Jul Aug Sep Oct Nov Dec Total
Average 78.7 74.0 53.2 27.4 6.7 2.5 2.2 2.6 7.7 27.4 54.3 75.1 412
Maximum 291.5 293.7 216.0 179.1 98.7 43.4 46.6 45.0 61.5 108.5 201.5 280.5 1866
Minimum 0 0 0 0 0 0 0 0 0 0 0 0 0

Red Earth cc Page 51
“Monthly temperatures vary with average maximum temperatures ranging from 30°C to 36°C
and minimum temperatures of between 3°C and 7°C. Record highs were measured at 40.7°C in
January and lowest of 0.2°C in June”.
“The average humidity recorded is 69% and the minimum and maximum average humidity
ranges between 28% and 99% respectively”.
“The average wind speed recorded is 1.4 m/s, with the minimum and maximum wind speed
ranging from 0 m/s to 5.2 m/s. Wind direction is predominantly west-south-west”.
8.1.5 GEOLOGY AND PARENT MATERIAL
Geology:
The geological information for the area is described in the following report: RSV Enco
Consulting report entitled ‘Fatal Flaw and Screening Assessment - Lephalale Coal Project’,
dated February 2014 (Report Reference: RSV2436). The report indicates that Karoo sandstone,
siltstone, mudstone, grit, conglomerates, shale and coal exist in the area.
Parent Material:
Parent material is the material from which soil has weathered, which in turn has weathered
from the parent rock. Thus, the parent material is usually the rock type that directly underlies
the soil profile. Different parent material types, largely by nature of their inherent relative
concentrations of cations, lead to the development of differing soil types.
In the case of the current Study Area, the underlying ‘geology’ in the Operational Area
frequently consists of the rock types mentioned in the Geology sub-section of the report, while
the deep Aeolian sand mantle of the Quaternary System exists to the north-west outside of the
Operational Area (within the Project Area) on the farms Forfarshire 419 LQ and Stutgard 420
LQ.
Parent materials encountered (observed) in the proposed Operational Area during the course of
the soil survey (in descending order of frequency) include the following:
sandstone/grit; ferricrete (secondary - usually overlying sandstone at depth); chert
(predominantly chert stone layer mixed with fragments of numerous other parent material types
- possibly weathered from conglomerates); calcrete (secondary - probably overlying a base rich
parent material at depth), siltstone/mudstone; and colluvium (rarely - associated with pans).
The carbonate ‘parent material’ (secondary) is comprised of an underlying hardpan or soft
carbonate horizon, the aforementioned most likely being underlain by basic igneous rock (such
as diabase), although this rock type was not encountered anywhere on the surface or in the soil
profiles.
The ferricrete ‘parent material’ (secondary) is relic and reflects an ancient
topographical/climatic regime (previously fluctuating water-table and iron rich environment).
Such material generally overlies relatively impermeable sandstone rock at depth.

Red Earth cc Page 52
The parent material types encountered are indicated on Map 2a (Soil Mapping Units).
However, the parent material was not indicated in cases where it was not able to be determined
by the author, the aforementioned areas probably being chert or sandstone derived.
8.1.6 REGIONAL SOILS (Refer to Figures 8.1.6(a) and 8.1.6(b)
The regional soil boundaries are indicated in Figure 8.1.6(b) (Regional Soil Setting). The
aforementioned figure was clipped from the unpublished 1: 250 000 Land Type Map Series of
the Republic of South Africa - Sheet 2326 Ellisras (1995). Information regarding the soils
occurring in the Land Type units was extracted from the published Memoir 19 (Agricultural
Research Council, February 2005) that accompanies the aforementioned Land Type map.
Both the Broad Soil Patterns indicated on Figure 8.1.6(b), as well as the average soil form
distribution (and quoted percentages) for the Land Types are approximate for the 1: 250 000
sheet as a whole, the aforementioned due to the fact that Land Type maps are based on broad
reconnaissance soil surveys only. Thus, the information provided in the current section should
be regarded as generalised reconnaissance level information only.
Detailed soil distribution patterns, profile descriptions, and soil physical/chemical information
were derived from our soil survey of the Operational Area; and are presented on Map 2a (Soil
Mapping Units) and are discussed in the various sub-sections (8.2.1 - 8.2.12) of Section 8.2
(SOILS BASELINE) of the current document.
According to Memoir 19, the Study Area lies within the Ellisras-Limpopo Plain, which is a flat
to gently undulating region.
Memoir 19 further reports the information that follows, this information frequently having been
adapted from the original form, into a form that best suits the purposes of the current report.
The Memoir reports the underlying ‘geology’ within the Plain to consist of an Aeolian sand
mantle of the Quaternary System, along with shale and sandstone of the Karoo Sequence, as
well as granite and gabbro of the Bushveld Complex.
Deep, red, apedal loamy-sands to sandy-loams are dominant on the sands of the Quaternary
System. These soils belong mainly to the Hutton form and are less weathered than those that lie
further to the east, where the rainfall is higher. The shale and sandstone areas result in the
formation of moderately deep to deep, yellow apedal eutrophic loamy-sands with the dominant
soil form being Clovelly. Some areas of rock outcrops and shallow lithosols of the Mispah
form also occur.
The northern fringe of the Waterberg mountain range (sandstone of the Kransberg Subgroup)
occurs to the south of the Study Area, and this may influence the soils in small isolated sections
the Study Area to a certain limited extent, the aforementioned where this parent material type is
present as a result of colluvial action. In raised (relative to the surrounds) topographical
positions, this parent material type will give rise to shallow, stony soils of the Mispah and
Glenrosa forms.
The symbols utilised to describe slope shape, terrain type and terrain unit in the Land Type
inventory descriptions i) to iii) are discussed hereafter.

Red Earth cc Page 53
Slope Shape:
Slope Shape is described as follows: X (concave); Y (convex); and Z (straight).
Terrain Type:
Percentage level land is estimated (with the aid of a slope wedge) in terms of four classes:
A - >80% of the area has slopes less than 8%;
B - 50 - 80% of the area has slopes less than 8%;
C - 20 - 50% of the area has slopes less than 8%;
D - <20% of the area has slopes less than 8%.
Local relief is an estimate of the difference (m) over the Land Type between the highest (unit
1) and lowest (unit 5) points in the landscape. It is expressed in terms of six classes as follows:
Class 1 0-30m; Class 2 30-90m; Class 3 90-150m; Class 4 150-300m; Class 5 300-900m; and
Class 6 >900m.
Using the criteria given above, a symbol (e.g. A2) indicating the nature of the terrain type is
given in the inventory of each Land Type.
Terrain Unit:
The Terrain Units are described as follows:
1 represents a crest; 2 a scarp; 3 a midslope; 4 a footslope; and 5 a valley-bottom; while 3⁽¹⁾
indicates a second phase midslope and 3⁽²⁾ a third phase midslope.
Whether a terrain unit is a footslope or a midslope depends on its position (a midslope lies
immediately below a crest or scarp) and, to an extent, upon the steepness of the slope. In
contrast with a midslope, a scarp is steeper than 100% (45degrees) and usually steeper than
about 70 degrees.
The various Terrain Units are indicated in the schematic diagrams below.
Figure 8.1.6(a): Terrain Units

Red Earth cc Page 54
The Land Types occurring in the LCPP Study Area are discussed hereafter.
i) Red-Yellow Apedal, Freely Draining Soils
Map Unit: Ae (red, high base status, >300mm deep, no dunes)
Map Unit Ae refers to yellow and red soils without water tables and belonging to one or
more of the following soil forms (in the current area): Hutton, Griffin and Clovelly. The
Map Unit refers to land that does not qualify as a plinthic catena and in which one or more
of the red and yellow apedal soil forms occupy ≥ 40% of the area.
According to the Map Unit definition for Ae, yellow soils occupy <10 % of the area, while
high base status eutrophic soils occupy a larger area than mesotrophic soils.
Land Type: Ae253a
Parent material: Shale, sandstone and coal from the Karoo Sequence. Gabbro and
anorthosite of the Villa Nora Gabbro. Biotite granite of the Lebowa
Granite Suite. Note: not all of these parent material types may be relevant
to the Study Area.
Terrain: Type: A2.
For Terrain Unit: 4 (95% of the area):
Slope: Grade: 0 - 2 %; Length: 1000 - 5000m; Shape: Z.
For Terrain Unit: 5 (5% of the area):
Slope: Grade: 1 - 3 %; Length: 50 - 100m; Shape: Z-X.
Soils:
- Hutton or Shortlands forms: Relative Abundance of these soil forms in the Land
Type Unit: 77.1%; Depth: 50-90cm; Clay: A 20-30%, B 20-50%; Texture B:
medium sandy-clay-loam to clay;
- Hutton form: 9.5%; Depth: 50-120cm; Clay: A 4-8%, B 8-14%; Texture B:
medium-coarse sand to sandy-loam;
- Avalon form: 5.4%; Depth: 60-90cm; Clay: A 15-30%, B 30-45%; Texture B:
medium sandy-clay-loam to clay;
- Mispah form: 4.8%; Depth: 5-20cm; Clay: A 10-20%; Texture A: medium sandy-
loam;
- Glencoe and Westleigh forms: 2.9%; Depth: 50-70cm; Clay: A 15-25%, B 30-40%;
Texture B: medium sandy-clay-loam to sandy-clay; and
- Pans: Arcadia form: 0.5%; Depth: 50-120cm; Clay: A 45-60%; Texture A: clay.
Land Type: Ae337a
Parent material: Gabbro and Anorthosite of the Villa Nora Gabbro.

Red Earth cc Page 55
Terrain: Type: A1.
For Terrain Unit: 4 (90% of the area):
Slope: Grade: 0 - 2 %; Length: 500 - 4000m; Shape: Z.
For Terrain Unit: 5 (10% of the area):
Slope: Grade: 1 - 3 %; Length: 25 - 50m; Shape: Z-X.
Soils:
- Hutton form: Relative Abundance of these soil forms in the Land Type Unit: 31.5%;
Depth: 60-120cm; Clay: A 15-20%, B 20-30%; Texture B: medium sandy-clay-
loam;
- Hutton form: 18.2%; Depth: 50-100cm; Clay: A 20-30%, B 35-55%; Texture B:
sandy-clay to clay;
- Shortlands form: 18.0%; Depth: 35-60cm; Clay: A 40-50%, B 55-65%; Texture B:
clay;
- Arcadia form: 15.8%; Depth: 30-80cm; Clay: A 45-60%; Texture A: clay;
- Swartland and Glenrosa forms: 9.0%; Depth: 40-80cm; Clay: A 15-35%, B 40-50%;
Texture B: sandy-clay to clay;
- Oakleaf form: 3.0%; Depth: 100-120cm; Clay: A 20-30%; B 20-30%; Texture B:
medium sandy-clay-loam;
- Valsrivier form: 2.7%; Depth: >120cm; Clay: A 25-35%; B 25-35%; Texture B:
fine/medium sandy-clay-loam; and
- Avalon form: 1.8%; Depth: 50-80cm; Clay: A 25-35%, B 35-45%; Texture B:
sandy-clay-loam to sandy-clay.
ii) Red-Yellow Apedal, Freely Draining Soils
Map Unit: Ah (red and yellow, high base status [usually <15% clay])
Map Unit Ah refers to red and yellow soils without water tables and belonging to one or
more of the following soil forms (in the current area): Hutton, Griffin and Clovelly. The
Map Unit refers to land that does not qualify as a plinthic catena and in which one or more
of the red and yellow apedal soil forms occupy ≥ 40% of the area.
According to the Map Unit definition for Ah, red and yellow soils each occupy >10 % of
the area, while high base status eutrophic soils occupy a larger area than mesotrophic soils.
Land Type: Ah85a
Parent material: Karoo Sequence sandstone and siltstone of the Clarens Formation as well
as undifferentiated shale, mudstone and coal.
Terrain: Type: A2.

Red Earth cc Page 56
For Terrain Unit: 1 (5% of the area):
Slope: Grade: 1 - 2 %; Length: 200 - 600m; Shape: Y.
For Terrain Unit: 3 (30% of the area):
Slope: Grade: 1 - 3 %; Length: 500 - 3000m; Shape: Z.
For Terrain Unit: 4 (60% of the area):
Slope: Grade: 0 - 1 %; Length: 3000 - 8000m; Shape: Z.
For Terrain Unit: 5 (5% of the area):
Slope: Grade: 1 - 2 %; Length: 50 - 250m; Shape: X.
Soils:
- Hutton form: Relative Abundance of these soil forms in the Land Type Unit: 43.5%;
Depth: >120cm; Clay: A 2-5%, B 4-12%; Texture: fine/medium sand to loamy-
sand;
- Clovelly form: 28.9%; Depth: >120cm; Clay: A 2-7%, B 4-12%; Texture B:
fine/medium sand to loamy-sand;
- Hutton form: 9.8%; Depth: >120cm; Clay: A 2-4%, B 4-8%; Texture B: coarse sand
to loamy-sand;
- Fernwood form: 3.9%; Depth: >120cm; Clay: A 1-3%, B 2-6%; Texture B:
fine/medium sand;
- Avalon form: 3.7%; Depth: 30-100cm; Clay: A 4-8%, B 8-12%; Texture B: medium
loamy-sand to sandy-loam;
- Clovelly form: 3.4%; Depth: >120cm; Clay: A 6-10%; B 6-15%; Texture B: coarse
sand to loamy-sand;
- Oakleaf form: 2.3%; Depth: 80-120cm; Clay: A 10-15%; B 12-30%; Texture B:
medium sandy-loam to sandy-clay-loam;
- Valsrivier, Katspruit and Longlands forms: 1.6%; Depth: 20-80cm; Clay: A 8-12; B
15-40%; Texture B: fine/medium sandy-loam to sandy-clay;
- Hutton form: 1.2%; Depth: >120cm; Clay: A 10-15%; B 18-25%; Texture B:
medium sandy-loam to sandy-clay-loam;
- Mispah form: 1.1%; Depth: 50-150cm; Clay: A 5-15%; Texture A: fine/medium
sand to sandy-loam; and
- Stream Beds: 0.8%.

Red Earth cc Page 57
iii) Plinthic Catena: Upland Duplex and Margalitic Soils Rare
Map Unit: Bc (eutrophic, red soils widespread)
Map Unit Bc refers to land where plinthic soils must cover more than 10% of the area.
Upland duplex and margalitic soils are absent or occupy <10% of the area. The valley
bottom is occupied by one or other gley soil.
According to the Map Unit definition for Bc: high base status eutrophic soils predominate
over mesotrophic soils; while red soils (mainly Hutton and Bainsvlei forms) occupy > one
third of the area.
Land Type: Bc45a
Parent material: Sandstone and conglomerate of the Kransberg Sub-Group, Waterberg
Group as well as undifferentiated shale, sandstone, mudstone and coal of the Karoo
Sequence.
Terrain: Type: A4.
For Terrain Unit: 1 (1% of the area):
Slope: Grade: 0 - 15 %; Length: 50 - 150m; Shape: Y.
For Terrain Unit: 3 (2% of the area):
Slope: Grade: 6 - 35 %; Length: 200 - 500m; Shape: X-Z.
For Terrain Unit: 4 (92% of the area):
Slope: Grade: 1 - 3 %; Length: 800 - 3500m; Shape: Z.
For Terrain Unit: 5 (5% of the area):
Slope: Grade: 1 - 3 %; Length: 25 - 200m; Shape: X.
Soils:
- Rock: Abundance in the Land Type Unit: 1.3%;
- Mispah and Glenrosa forms: Relative Abundance of these soil forms in the Land
Type Unit: 1.7%; Depth: 5-15cm; Clay: A 4-12%; Texture A: coarse sand to loamy-
sand;
- Hutton form: 48.3%; Depth: 80-120cm; Clay: A 10-18%, B 20-30%; Texture B:
medium sandy-clay-loam;
- Hutton form: 17.5%; Depth: 50-120cm; Clay: A 2-6%, B 8-14%; Texture B:
medium/coarse sand to sandy-loam;
- Avalon form: 12.0%; Depth: 70-120cm; Clay: A 6-15%, B 15-25%; Texture B:
medium sandy-loam to sandy-clay-loam;
- Mispah form: 7.4%; Depth: 10-35cm; Clay: A 6-12%; Texture A: coarse sand to
sandy-loam;

Red Earth cc Page 58
- Bainsvlei form: 7.4%; Depth: 90-120cm; Clay: A 25-30%; B 35-45%; Texture B:
sandy-clay;
- Oakleaf form: 3.3%; Depth: 70-120cm; Clay: A 3-8; B 6-10%; Texture B: coarse
sand to loamy-sand;
- Valsrivier form: 1.0%; Depth: >120cm; Clay: A 20-30%; B 30-40%; Texture B:
sandy-clay-loam to sandy-clay; and
- Sterkspruit and Westleigh forms: 0.2%; Depth: 25-40cm; Clay: A 15-40%, B 35-
45%; Texture A: sandy-clay.
Land Type: Bc44c
Parent material: Sandstone and conglomerate of the Kransberg Sub-Group, Waterberg
Group as well as undifferentiated shale, sandstone, mudstone and coal of the Karoo
Sequence.
This small Land Type polygon falls just outside (south) of the Project Area, so is not
outlined in detail.
iv) Glenrosa and/or Mispah Forms (other soils may occur)
Map Unit: Fa (‘lime rare or absent in the entire landscape-including upland and
valley-bottom soils’)
Map Unit Fa is intended to accommodate pedologically young landscapes that are not
predominantly rock and not predominantly alluvial or aeolian and in which the dominant
soil-forming processes have been rock weathering, the formation of orthic topsoil horizons
and, commonly, clay illuviation, giving rise typically to lithocutanic horizons. The soil
forms that epitomise these processes are Glenrosa and Mispah. However, exposed rock and
soils belonging in almost any of the other 39 soil forms may be found in these land types,
provided these other soils do not qualify the land for inclusion in another map unit.
According to the Map Unit definition: Fa refers to land in which lime in the soil is not
encountered regularly in any part of the landscape.
Land Type: Fa295a
Parent material: Biotite granite of the Lebowa Granite Suite, Bushveld Complex.
Terrain: Type: A3.
For Terrain Unit: 1 (10% of the area):
Slope: Grade: 1 - 2 %; Length: 200 - 800m; Shape: Y.
For Terrain Unit: 4 (86% of the area):
Slope: Grade: 1 - 2 %; Length: 500 - 3000m; Shape: Z.
For Terrain Unit: 5 (4% of the area):
Slope: Grade: 1 - 3 %; Length: 50 - 200m; Shape: Z-X.
Soils:

Red Earth cc Page 59
- Rock: Abundance in the Land Type Unit: 4.8%;
- Mispah form: Relative Abundance of these soil forms in the Land Type Unit:
34.1%; Depth: 5-15cm; Clay: A 8-20%; Texture A: loamy-coarse-sand to sandy-
loam;
- Hutton and Clovelly forms: 19.2%; Depth: 20-80cm; Clay: A 10-16%, B 18-25%;
Texture B: coarse sandy-loam to sandy-clay-loam;
- Glenrosa form: 18.7%; Depth: 30-45cm; Clay: A 8-20%; Texture A: loamy-coarse-
sand to sandy-loam;
- Clovelly and Glencoe forms: 15.9%; Depth: 20-70cm; Clay: A 2-6%, B 4-12%;
Texture B: coarse sand to loamy-sand;
- Avalon form: 5.7%; Depth: 70-100cm; Clay: A 10-20%, B 15-25%; Texture B:
coarse sandy-loam to sandy-clay-loam; and
- Oakleaf form: 1.6%; Depth: >120cm; Clay: A 15-25%; B 20-30%; Texture B:
coarse sandy-clay-loam.
v) Glenrosa and/or Mispah Forms (other soils may occur)
Map Unit: Fc (‘lime generally present in the entire landscape-including upland and
valley-bottom soils’)
Map Unit Fc is also intended to accommodate pedologically young landscapes that are not
predominantly rock and not predominantly alluvial or aeolian and in which the dominant
soil-forming processes have been rock weathering, the formation of orthic topsoil horizons
and, commonly, clay illuviation, giving rise typically to lithocutanic horizons. The soil
forms that epitomise these processes are Glenrosa and Mispah. However, exposed rock and
soils belonging in almost any of the other 39 soil forms may be found in these land types,
provided these other soils do not qualify the land for inclusion in another map unit.
According to the Map Unit definition: Fc refers to land where lime occurs regularly (there
need not be much of it and it need not occur in every soil present) in upland and valley-
bottom soils. Occasionally landscapes are encountered without lime but with accumulations
of soluble salts in the soil; these have been included in Fb or Fc as the case may be.
Land Type: Fc478a
Parent material: Undifferentiated shale, sandstone, mudstone and coal of the Karoo
Sequence.
Terrain: Type: A3.
For Terrain Unit: 1 (15% of the area):
Slope: Grade: 1 - 5 %; Length: 450 - 1400m; Shape: Y-Z.
For Terrain Unit: 3 (15% of the area):
Slope: Grade: 6 - 30 %; Length: 100 - 300m; Shape: Z.

Red Earth cc Page 60
For Terrain Unit: 4 (65% of the area):
Slope: Grade: 1 - 2 %; Length: 500 - 5000m; Shape: Z.
For Terrain Unit: 5 (5% of the area):
Slope: Grade: 1 - 3 %; Length: 20 - 100m; Shape: X.
Soils:
- Rock: Abundance in the Land Type Unit: 15.0%;
- Mispah form: Relative Abundance of these soil forms in the Land Type Unit:
42.0%; Depth: 10-30cm; Clay: A 2-8%; Texture A: medium/coarse sand to loamy-
sand;
- Glenrosa form: 18.0%; Depth: 10-40cm; Clay: A 6-15%, B 18-25%; Texture A:
medium/coarse sand to loamy-sand:
- Hutton form: 2.6%; Depth: 15-40cm; Clay: A 4-10%, B: 6-12%; Texture B: coarse
sand to loamy-sand;
- Hutton form: 9.8%; Depth: >120cm; Clay: A 10-20%, B 25-45%; Texture B:
medium sandy-clay-loam to sandy-clay;
- Avalon form: 8.3%; Depth: 90-120cm; Clay: A 10-20%, B 25-45%; Texture B:
medium sandy-clay-loam to sandy-clay; and
- Oakleaf form: 4.5%; Depth: 80-120cm; Clay: A 8-12%; B 10-20%; Texture B:
loamy medium/coarse sandy to sandy-loam.
Figure 8.1.6(b) indicates that only the Ae253a and Fa295a Land Type units occur within the
proposed LCPP Operational Area.

Red Earth cc Page 61
Figure 8.1.6(b): Regional Soil Setting

Red Earth cc Page 62
8.1.7 REGIONAL LAND CAPABILITY (Refer to Figure 8.1.1)
The land capability of the Study Area as a whole may be roughly inferred by an interpretation
of the land use indicated on Figure 8.1.1 (Location and Topography of Study Area) as follows:
- cultivated areas (majority arable, lesser amount grazing, and very rarely wetland capability
class);
- grassland areas (majority grazing, lesser amount arable, occasionally non-grazing wilderness,
and rarely wetland capability class);
- ephemeral pans and water courses (wetland capability class); and
- hilly bush / grassland areas (majority non-grazing - i.e. wilderness capability class,
occasionally grazing capability class);
as per the Chamber of Mines capability class classification.
Within the Operational Area the soil survey indicated the following percentages of the various
Chamber of Mines capability classes: arable 30.07%, grazing 46.76%, wilderness 20.07%, and
wetland 2.94%; while man-made features occupy 0.16% of the area.
Despite the arable soils that occur in many areas, such areas will not be able to be cultivated
without the provision of irrigation, the aforementioned due to the arid to semi-arid prevailing
climate in the area.
8.1.8 REGIONAL LAND USE (Refer to Figure 8.1.1)
The regional land use is evident in Figure 8.1.1 (Location and Topography of Study Area).
The land use both within and immediately adjacent to LCPP is dominated by game
ranching/farming and eco-tourism, and to a lesser extent cattle ranching. Thus occasional-rare
farm related structures also exist including homesteads, residences, hunting accommodation,
labour accommodation, farm sheds, workshops, boreholes, windmills, reservoirs, water tanks,
and water/feeding troughs. Occasional lands are also spread out throughout the area, the
aforementioned probably producing dryland hay and other types of livestock feed on a small
scale.
The LCPP Project Area is located within the Central Bushveld Bioregion. Mucina and
Rutherford (2006), indicate the natural vegetation within the LCPP Project Area as savannas of
the Roodeberg Bushveld vegetation type (approximately eastern two-thirds of Project Area),
with the section to the west being Limpopo Sweet Bushveld (approximately western third of
Project Area). The former vegetation type is comprised of plains and slightly undulating hills
with short, dense, open woodland; while the latter vegetation type is comprised of short, open
woodland. Disturbed areas are dominated by thickets of Blue Thorn (Acacia erubescens),
Black Thorn (Acacia mellifera) and Sickle Bush (Dichrostachys cinerea). These vegetation
types are listed as Least Threatened, which implies that they are not threatened due to major
habitat loss. The northern fringe of the Waterberg Mountain Bushveld occurs south (outside) of
the site.

Red Earth cc Page 63
The arid to semi-arid climate as well as the lack of irrigation water minimises the potential for
intensive crop production. Thus, the planting of moderate to low profit commercial agricultural
crops are likely to be extremely limited. However, high profit drip irrigated crops such as citrus
are likely to be feasible / present, provided that irrigation water is available. One small citrus
orchard exists adjacent to the farmhouse on the farm Weltevreden 482 JQ (portion 1).
The historical and current ranching / agricultural activities within the Project Area are
discussed in Section 8.4.4 (HISTORICAL AGRICULTURAL PRODUCTION) of this report.
Exxaro’s Grootegeluk Coal Mine lies to the west of the town of Lephalale, and is currently the
only operating coal mine in the Waterberg Coalfield. Numerous other mining companies
currently own prospecting rights in the Waterberg Coalfield, with these potential projects being
in various stages of planning.

Red Earth cc Page 64
8.2 SOILS BASELINE
8.2.1 SURVEY METHODS AND DATA COLLECTION (Refer to Map 1)
The fieldwork component (300m-grid auger survey) was carried out between 23 April and 10
May 2017 by B.B. McLeroth of Red Earth cc. Given time constraints due to the immanent
commencement of the hunting season, the following persons assisted the author with the soil
survey fieldwork exercise: Diana Rietz (Phd Soil Science), Bonginkosi Vilakazi (M.Sc Soil
Science) and Anele Mkila (B.Sc Soil Science).
An intensive systematic grid soil survey was undertaken, with auger sampling points 300m
(one auger per 9.00ha) apart throughout the proposed Operational Area only (2743.59ha), a
total of three-hundred-and-twenty-two augers being conducted at pre-determined positions in
the survey area as a whole. Auger points were occasionally shifted off the pre-determined grid,
to be conducted in more meaningful positions or to avoid man-made obstacles. Upon
completion of the soil survey fieldwork exercise, seven modal (typical representative) soil
auger points were augered; photographed and sampled (for agricultural analysis).
Distribution of the auger sample points examined with a 100mm bucket soil auger is indicated
on Map 1 (Soil Sampling Points).
During the course of the soil survey fieldwork exercise, the land capability, present land use,
wetlands, sensitive landscapes, and location of sites of archaeological and cultural interest were
recorded. Furthermore, man-made features and structures were also classified and recorded.
Many such features may not have been identified given the broad 300m soil survey grid
intensity utilised.
Auger sampling was conducted to a maximum depth of 1.8m, or less (vast majority) if a depth
limiting material (for the soil auger) was encountered at lesser depth. Such limiting horizons
include hard rock, weathering rock, hard plinthic B-horizon, hardpan carbonate horizon, soft
carbonate horizon, soft plinthic B-horizon, G-horizon, unconsolidated material with signs of
wetness, and unspecified material with signs of wetness.
‘Recorded soil variables’ include the following:
‘Recorded per profile’: soil form/series, effective rooting depth, surface features,
compaction, topsoil organic carbon, depth limiting material,
parent material, ground roughness and remarks.
‘Recorded per horizon’: name/depth of horizons, clay content, sand grade, Munsell colour
(standardized soil colour charts from Munsell Colour Company,
Inc., Baltimore 18, Md., USA), structure, wetness hazard and
cultivation factors.
This information is either summarized in the soil code (for each distinct polygon) on Map 2a
(Soil Mapping Units), or alternatively discussed in Section 8.2.3 (SOIL TYPES AND
SUITABILITY FOR AGRICULTURE AND ‘TOPSOIL’).
Red Earth cc Page 65
Soils were classified as per the Soil Classification Working Group, 1991 (Taxonomic System
for South Africa). The aforementioned soil types may be correlated to international systems if
so required.
8.2.2 THE SOIL MAP (Refer to Map 2a and Table 8.2.2)
Soil-mapping units are indicated on Map 2a (Soil Mapping Units), and are summarized in
terms of soil form in Table 8.2.2 (Summary of Soil Form).
The different soil types identified were grouped together into soil-mapping units on the basis of
soil form, effective rooting depth (ERD) for rehabilitation (stripping depth) and cropping,
surface features, and parent material.
Effective rooting depth (ERD) and ameliorated effective rooting depth (AERD) are actually
measures of effective rooting volume (ERV). This is the total soil depth (TSD) less the volume
(converted into depth) of the profile occupied by coarse (>2mm) fragments. The difference
between ERD and AERD is that these indices reflect the ERV up until the first and final depth
limiting horizons respectively. Thus the AERD is the most important determining index for the
ultimate potential of a soil. Only ERD was recorded in the current Study Area.
Perched soil water-table depth, location of precipitated surface (day-lighting surface
efflorescence) or sub-surface ‘salts’ associated with pollution plumes, and
overburden/underburden ‘waste’ (large variety of materials) or ‘non-waste’ type/depth/location
(where present) are normally also recorded. However, none of the aforementioned was
encountered since the current Study Area is a green fields site.
Each soil-mapping unit has a unique code, which describes these factors.

Red Earth cc Page 66
Table 8.2.2: Summary of Soil Form
ha % ha %
Hu Hutton orthic A/red apedal B/unspecified 14 369.74 13.48
Li Lichtenburg (future form) orthic A/red apedal B/hard plinthic B 8 139.90 5.10
Cv Clovelly orthic A/yellow-brown apedal B/unspecified 27 445.39 16.23
Gc Glencoe orthic A/yellow-brown apedal B/hard plinthic B 26 437.11 15.93
Neocutanic Tu Tukuluorthic A/neocutanic B/unspecified material with
signs of wetness2 11.07 0.40 11.07 0.40
Sw Swartlandorthic A/pedocutanic B/saprolite (occasionally
hard rock in this area)24 474.83 17.31
Se Sepaneorthic A/pedocutanic B/unconsolidated material
with signs of wetness4 13.23 0.48
Bo Bonheim melanic A/pedocutanic B/unspecified 1 4.42 0.16
Py Plooysburg orthic A/red apedal B/hardpan carbonate horizon 2 34.76 1.27
Ky Kimberley orthic A/red apedal B/soft carbonate horizon 1 4.03 0.15
Mp Molopoorthic A/yellow-brown apedal B/soft carbonate
horizon1 3.46 0.13
Ag Augrabies orthic A/neocarbonate B/unspecified 3 15.62 0.57
Ad Addo orthic A/neocarbonate B/soft carbonate horizon 3 5.22 0.19
Pr Prieskaorthic A/neocarbonate B/hardpan carbonate
horizon2 24.53 0.89
Mu Montaguorthic A/neocarbonate B/unspecified material
with signs of wetness1 15.40 0.56
Br Brandvlei orthic A/soft carbonate horizon 2 14.52 0.53
Cg Coega orthic A/hardpan carbonate horizon 8 44.38 1.62
Gs Glenrosa orthic A/lithocutanic B 21 538.56 19.63
Ms Mispah orthic A/hard rock 11 42.16 1.54
Dr Dresden orthic A/hard plinthic B 6 36.43 1.33
We Westleigh orthic A/soft plinthic B 16 45.91 1.67
Ka Katspruit orthic A/G-horizon 7 13.52 0.49
Pan 23 3.96 0.14
Pan.W 2 1.02 0.04
215 2739.18 99.84 2739.18 99.84
ha % ha %
Pond 3 0.47 0.02 0.47 0.02
District Road 1 3.95 0.14 3.95 0.14
4 4.42 0.16 4.42 0.16
219 2743.59 100.00 2743.59 100.00
Soils Summary
AreaBroad Soil Group Map Notation
Soil Form (South African Taxonomic
System)Soil Horizons Count
Red apedal
Yellow-brown
apedal
Hydromorphic
'Pan' (natural)
'Pan' (natural); with a man-made earth Wall (in order to increase the water storage
capacity)
Pedocutanic
(Structured)
Shallow
Hydromorphic
4.97 0.18
Carbonate
Man-Made Summary
Group Map Notation CountArea
Further Explanation
SUB-TOTAL (SOILS)
22.49617.15
2.1759.43
'Man-Made'
SUB-TOTAL (MAN-MADE)
TOTAL (SOILS AND MAN-MADE)
Pond (and man-made earth Wall) constructed in a non-wetland area
District Road (Dirt)
882.51
119.67
42.25
509.64 18.58
32.17
1.54
4.36
17.95492.48

Red Earth cc Page 67
8.2.3 SOIL TYPES AND SUITABILITY FOR AGRICULTURE AND
‘TOPSOIL’ (Refer to Map 2a; and Table 8.2.2)
The leaching status of soils is based on S-value (cmol (+) kgˉ¹ clay = leaching status). These
classes vary as follows:
- dystrophic (S-value <5 = low base status = highly leached, i.e. soil suffered marked leaching);
- mesotrophic (S-value 5-15 = medium base status = moderately leached); and
- eutrophic (S-value >15 = high base status = poorly leached, i.e. little or no leaching).
- Note for calcareous soils (S-value is undefined, but very high = extremely high base status =
extremely poorly leached, i.e. no leaching). A calcareous soil has sufficient calcium carbonate
or calcium-magnesium carbonate to effervesce visibly when treated with cold dilute (10 %)
hydrochloric acid.
S-value for the eleven analysed samples in the Operational area varies as follows:
- B-horizons: 16.0 - 23.3 (eutrophic);
- A-horizons: most soils 20.1 - 36.5 (eutrophic); shallow soils (Glenrosa form) 12.0
(mesotrophic); and
- A-horizon: carbonate soils (Brandvlei form) 349.9 (highly calcareous = eutrophic).
The majority of soils in the area are poorly leached (eutrophic); given the interaction of the low
to moderate base reserve of the dominant parent material types (sandstone, grit, chert,
ferricrete, siltstone and mudstone), as well as low effective rainfall (interaction of the low mean
annual precipitation, the high mean annual evaporation, and the hot mean annual temperature)
in the area, whereby the leaching potential is insufficient to remove the majority of the base
cations (calcium-carbonate and calcium-magnesium carbonate) from the soil profile.
The carbonate broad soil group soils of the Augrabies, Addo, Prieska and Montagu forms
display a calcareous neocarbonate B-horizon (and frequently the A-horizon also), while the A-
horizon of the Brandvlei and Coega forms is generally (not always) calcareous. These soils are
extremely poorly leached (or not leached at all) due to the base rich parent material from which
they are derived (calcrete, which is probably underlain by basic igneous rock such as diabase).
Limited other areas of calcareous soils occur as follows:
- A number of the hydromorphic broad soil group G- (and/or A-) horizons of the Katspruit
form, the aforementioned as a result of the accumulation of bases in low-lying areas;
- A number of the pedocutanic broad soil group lower subsoils; and
- A number of the shallow broad soil group topsoils, and particularly those displaying bleached
colours.
The majority of the sandstone and grit derived soils display 10 - 30% quartz gravel in the
profile, while those derived from an underlying chert stone/gravel layer are also gravelly.
The soils encountered in the Operational Area were divided into seven broad groups.
(i) Red apedal soils (Hutton and Lichtenburg forms) [509.64 ha; 18.58 %]
Location / Slope Position: occur in five distinct locations in midslope positions;
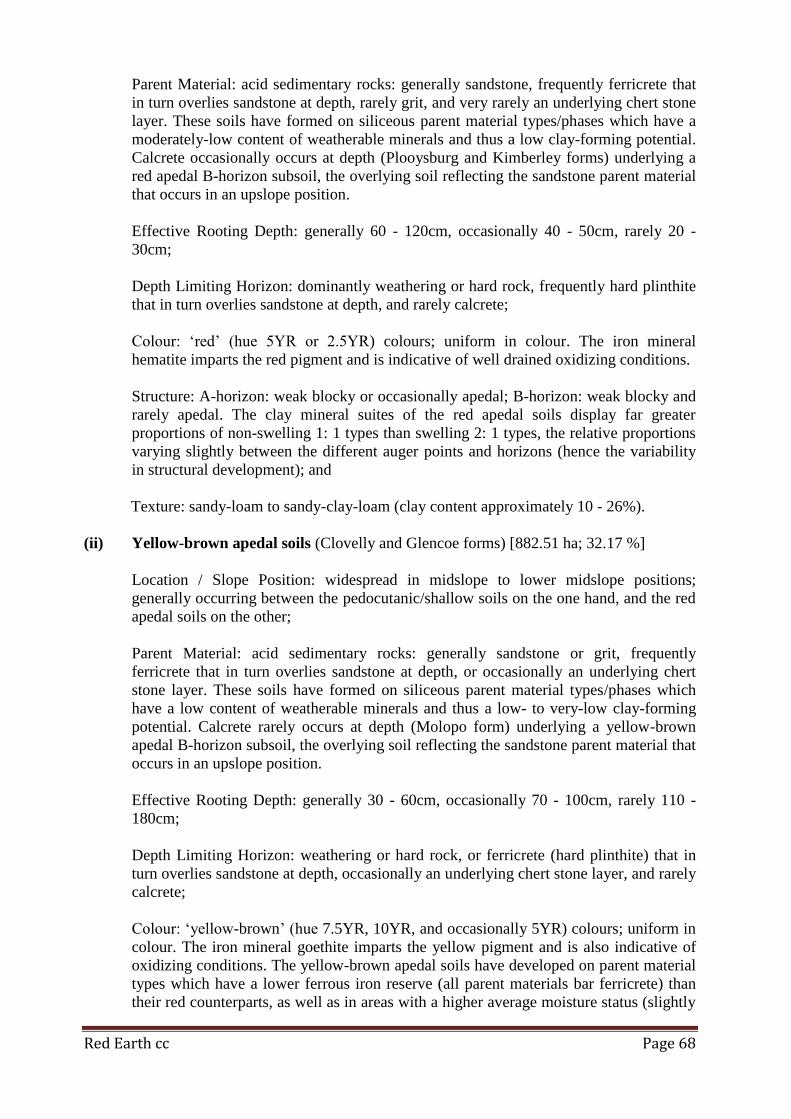
Red Earth cc Page 68
Parent Material: acid sedimentary rocks: generally sandstone, frequently ferricrete that
in turn overlies sandstone at depth, rarely grit, and very rarely an underlying chert stone
layer. These soils have formed on siliceous parent material types/phases which have a
moderately-low content of weatherable minerals and thus a low clay-forming potential.
Calcrete occasionally occurs at depth (Plooysburg and Kimberley forms) underlying a
red apedal B-horizon subsoil, the overlying soil reflecting the sandstone parent material
that occurs in an upslope position.
Effective Rooting Depth: generally 60 - 120cm, occasionally 40 - 50cm, rarely 20 -
30cm;
Depth Limiting Horizon: dominantly weathering or hard rock, frequently hard plinthite
that in turn overlies sandstone at depth, and rarely calcrete;
Colour: ‘red’ (hue 5YR or 2.5YR) colours; uniform in colour. The iron mineral
hematite imparts the red pigment and is indicative of well drained oxidizing conditions.
Structure: A-horizon: weak blocky or occasionally apedal; B-horizon: weak blocky and
rarely apedal. The clay mineral suites of the red apedal soils display far greater
proportions of non-swelling 1: 1 types than swelling 2: 1 types, the relative proportions
varying slightly between the different auger points and horizons (hence the variability
in structural development); and
Texture: sandy-loam to sandy-clay-loam (clay content approximately 10 - 26%).
(ii) Yellow-brown apedal soils (Clovelly and Glencoe forms) [882.51 ha; 32.17 %]
Location / Slope Position: widespread in midslope to lower midslope positions;
generally occurring between the pedocutanic/shallow soils on the one hand, and the red
apedal soils on the other;
Parent Material: acid sedimentary rocks: generally sandstone or grit, frequently
ferricrete that in turn overlies sandstone at depth, or occasionally an underlying chert
stone layer. These soils have formed on siliceous parent material types/phases which
have a low content of weatherable minerals and thus a low- to very-low clay-forming
potential. Calcrete rarely occurs at depth (Molopo form) underlying a yellow-brown
apedal B-horizon subsoil, the overlying soil reflecting the sandstone parent material that
occurs in an upslope position.
Effective Rooting Depth: generally 30 - 60cm, occasionally 70 - 100cm, rarely 110 -
180cm;
Depth Limiting Horizon: weathering or hard rock, or ferricrete (hard plinthite) that in
turn overlies sandstone at depth, occasionally an underlying chert stone layer, and rarely
calcrete;
Colour: ‘yellow-brown’ (hue 7.5YR, 10YR, and occasionally 5YR) colours; uniform in
colour. The iron mineral goethite imparts the yellow pigment and is also indicative of
oxidizing conditions. The yellow-brown apedal soils have developed on parent material
types which have a lower ferrous iron reserve (all parent materials bar ferricrete) than
their red counterparts, as well as in areas with a higher average moisture status (slightly

Red Earth cc Page 69
concave). A large number of areas (strong-brown or occasionally reddish-yellow
colour) have both goethite (dominant) and hematite present in the profile.
Structure: A- and B-horizons: weak blocky or apedal. The clay mineral suites display a
far greater proportion of non-swelling 1: 1 types;
Texture: loamy-sand to sandy-loam textures (clay content approximately 5 - 16%).
(iii) Neocutanic soils (Tukulu form) [11.07 ha; 0.40 %]
General: these soils are essentially yellow-brown apedal soils, the only differences (in
the current area) being that they are non-uniform in colour due to the presence of cutans
and channel infillings (occasionally slightly mottled), and their colour is bleached (hue
10YR) in the dry state. These recent soils of colluvial accumulation are not yet
advanced in terms of their pedogenesis. Two small polygons of these soils occur, one in
a slightly concave drainage area and one in a footslope area adjacent to the
hydromorphic soils. These soils are slightly poorly drained in the current area, the
effective rooting depth ranging from 50 - 100cm.
(iv) Pedocutanic (i.e. structured ) soils (Swartland, Sepane and Bonheim forms) [492.48
ha; 17.95 %]
Location / Slope Position: majority occur in one large central area in midslope (upper to
lower) positions (Swartland form), and three small isolated pockets occur in concave
drainage areas or footslope positions (Sepane form);
Parent Material: unknown intermediate rocks or underlying chert stone layer,
occasionally ferricrete, rarely siltstone/mudstone, and rarely colluvium. These soils
have generally formed on a parent material type/phase that has a moderate content of
weatherable minerals;
Effective Rooting Depth: 40 - 100cm;
Depth Limiting Horizon: dominantly weathering or hard rock, or occasionally hard
plinthite (Swartland and rarely Bonheim forms); or rarely unconsolidated material with
signs of wetness (Sepane form);
Colour: ‘red’ (hue 5YR or 2.5YR), ‘brown’ (hue 7.5YR, 5YR, or 10YR), or ‘bleached’
(hue 10YR) colours; non-uniform in colour due to the presence of cutans (clay skins) on
most ped surfaces, and particularly so for the soils displaying ‘bleached’, and less so for
the soils displaying ‘brown’ colours;
Structure: A-horizon: weak or moderate blocky, B-horizon: moderate blocky; and
Texture: clay to sandy-clay-loam textures (clay content approximately 55 - 30%); both
the presence of 2:1 clays and the high clay contents have given rise to the pedality
(structure) of these soils.
(v) Carbonate soils (Plooysburg, Kimberley and Molopo forms [42.25 ha; 1.54 %]; and
Augrabies, Addo, Prieska, Montagu, Brandvlei and Coega forms
[119.67 ha; 4.36 %]; Total [161.92 ha; 5.90 %]

Red Earth cc Page 70
Location / Slope Position: a number of patches occur in crest/scarp or midslope
positions, both such areas probably being underlain by basic igneous rock at depth.
Alternatively a number of patches occur in footslope positions due to the accumulation
of bases in low-lying areas;
Parent Material:
- Calcareous profiles (Augrabies, Addo, Prieska, Montagu, Brandvlei and Coega
forms): calcrete, in turn probably underlain by basic igneous rock (such as diabase)
at depth.
- Non-calcareous profiles (Plooysburg, Kimberley and Molopo forms): calcrete at
depth. The non-calcareous overlying red apedal or yellow-brown apedal material will
in these cases have migrated downslope from sandstone/grit/chert parent material
areas;
Effective Rooting Depth: generally 50 - 120cm, rarely 10 - 30cm;
Depth Limiting Horizon: calcrete (i.e. hardpan carbonate horizon, or soft carbonate
horizon);
Colour:
Calcareous profiles: generally ‘bleached’ or ‘brown’ (hue 10YR or 7.5YR) colours.
Non-calcareous profiles: ‘red’ (hue 5YR) or ‘yellow’ (hue 7.5YR or 10YR) colours;
Structure: A- and B-horizons: weak blocky or apedal; and
Texture: loamy-sand to sandy-loam textures (clay content approximately 5 - 16%).
(vi) Shallow soils (i.e. lithosols) (Glenrosa, Mispah and Dresden forms) [617.15 ha; 22.49
%]
Location / Slope Position: widespread numerous patches in upper midslope, ‘crest’
(barely discernible), and footslope positions; or frequently in areas where the slope
increases above 2 degrees (to 4 degrees);
Parent Material: acid sedimentary rocks: generally sandstone or grit, frequently an
underlying chert stone layer, frequently ferricrete that in turn overlies sandstone at
depth; and one patch of siltstone/mudstone. The majority of these soils have formed on
siliceous parent material types/phases which have a low content of weatherable
minerals and thus a low- to very-low clay-forming potential, the exception being
mudstone/siltstone that has a moderate clay forming potential;
Effective Rooting Depth: generally 10 - 30cm, although plant roots may grow deeper in
the spaces between the stone/gravel layer. The surface is frequently stony or rocky;
Depth Limiting Horizon: the majority overlie a lithocutanic B-horizon (actually a dense
stone/gravel layer, or weathering rock); or occasionally hard rock or ferricrete (hard
plinthite that in turn overlies sandstone at depth);
Colour: generally ‘brown’ (hue 10YR or 7.5YR) or more ‘bleached’ (hue 10YR)
colours, occasionally ‘red’ (hue 5YR) or ‘yellow’ (hue 7.5YR or 10YR) colours. The

Red Earth cc Page 71
‘brown’ and more ‘bleached’ colours are associated with lateral drainage of moisture
after rainfall events, the aforementioned due to the relatively impermeable underlying
rock or ferricrete;
Structure: A-horizon: generally weak blocky or occasionally apedal; and
Texture: loamy-sand to sandy-loam textures (clay content approximately 5 - 16%).
(vii) Neocutanic soils (Tukulu form) [11.07 ha; 0.40 %]
General: these soils are essentially yellow-brown apedal soils, the only differences (in
the current area) being that they are non-uniform in colour due to the presence of cutans
and channel infillings (occasionally slightly mottled), and their colour is bleached (hue
10YR) in the dry state. These recent soils of colluvial accumulation are not yet
advanced in terms of their pedogenesis. Two small polygons of these soils occur, one in
a slightly concave drainage area and one in a footslope area adjacent to the
hydromorphic soils. These soils are slightly poorly drained in the current area, the
effective rooting depth ranging from 50 - 100cm.
(viii) Hydromorphic soils (Westleigh and Katspruit forms [59.43 ha; 2.17 %] and
Pans [4.97 ha; 0.18 %]; Total [64.40 ha; 2.35 %])
Location / Slope Position:
Westleigh form: concave bottomland ‘vlei’ or drainage areas (ephemeral).
Katspruit form: pan and pan surrounds (ephemeral);
Such soils have formed due to either a fluctuating water table (Westleigh form: soft
plinthic B - alternating cycles of oxidation and reduction accompanied by an
accumulation of iron and manganese oxides - seasonal ephemeral wetland), or a semi-
permanent water table (Katspruit: G-horizon - continuous reduction and marked clay
illuviation - permanent ephemeral wetland).
Parent Material:
Westleigh form: sandstone, ferricrete, chert stoneline, or siltstone/mudstone in one area.
Katspruit form: colluvium overlying ferricrete or sandstone (or overlying
siltstone/mudstone in one area);
Effective Rooting Depth: 10 - 30cm;
Depth Limiting Horizon: soft plinthic B-horizon or G-horizon;
Colour:
Westleigh form: ‘brown’ or more ‘bleached’ (hue 10YR and 7.5YR) colours. These
colours reflect reducing conditions due to waterlogging.
Katspruit form: ‘bleached’ (hue 10YR) colours;
Structure:
Westleigh form: apedal or weak blocky A- and B-horizons.
Katspruit form: moderate blocky or crumb A-horizon, and massive G-horizon;

Red Earth cc Page 72
Texture: sandy-loam to clay textures (clay content approximately 15 - 55%). The
Westleigh form generally displays sandy-loam to sandy-clay-loam textures, while the
Katspruit form displays sandy-clay to clay textures. Both the presence of a proportion of
2:1 clays and the generally moderate to high clay contents of the Katspruit form, have
given rise to the pedality (structure) of these soils
The district road (3.95 ha; 0.14 %) and three man-made ponds (0.47 ha; 0.02 %) in terrestrial
(non-wetland) areas comprise the balance of the total survey area (2743.59 ha; 100.00 %); the
aforementioned being indicated in Table 8.2.2 (Summary of Soil Form) and Table 8.4
(Summary of Present Land Use) respectively.
8.2.4 SOIL WATER-TABLE (Refer to Map 2a)
Map 2a (Soil Mapping Units) normally indicates the distribution of perched soil water-tables
(or moisture) in augered depth; making use of the terms ‘moist depth’, ‘moist’, ‘wet’, or ‘very
wet’; including the depth at which the moisture associated with a perched water-table
commences. Moist soil profiles were not encountered in the current survey area due to both the
low effective rainfall in the area, as well as the time of year that the survey was conducted.
Natural perched soil water-tables will generally occur in summer after rainfall events, where
there is a relatively impermeable horizon (G-horizon, soft plinthic B, unconsolidated wet
material, hard plinthic B, hardpan carbonate horizon, or hard rock) below the A, B or E-
horizon. However, vertic A-horizons and pedocutanic B-horizons will also result in
waterlogging at or near the surface, after heavy or prolonged rainfall events. This is because
these subsoil types generally display a slow (when dry) to very slow (when moist) [for vertic
topsoils], to slow-moderate [frequently for pedocutanic subsoils] permeability.
As a general rule in undisturbed areas (where there is no seepage/runoff/discharge of water as a
result of the activities of man), natural perched soil water-tables (when they occur after heavy
rains) disappear altogether in the dry season (winter), except in the most low-lying positions.
Anthropogenic moisture or wetland conditions may occur in the soils downslope of man-made
features in developed, mining or smelting related areas during the operational and closure
phases of a project. In such cases, the anthropogenic moisture is derived from runoff /seepage
from infrastructure; or seepage/overflow from poorly sealed (or non-sealed) water containment
facilities and waste sites. No such sites occur in the current green fields survey area.

Red Earth cc Page 73
8.2.5 SOIL ANALYTICAL DATA (Refer to Table 8.2.5)
Table 8.2.5 (Soil Analytical Data) shows the agricultural analysis analytical data for the seven
topsoil (A-horizon) and four subsoil (B-horizon) samples collected from seven modal (typical)
soil augers.
The analytical determinations were conducted in the laboratories of the Institute for Soil,
Climate and Water (ISCW) [part of the Agricultural Research Council] in Pretoria.
The ISCW data was obtained from the following ISCW reports entitled GROND 201718 5543:
- Majority of the data (also including exchangeable cations in ppm): two reports dated
30/6/2017; and
- CEC and saturation extract soluble cations: one report dated 14/7/2017.
The ISCW data was transferred to our Table 8.2.5.
The following physical and chemical variables were analysed (or calculated from the data
provided): texture seven fractions (also includes clay %), exchangeable cations (cmol (+) kgˉ¹
soil and ppm), S-value (cmol (+) kgˉ¹ clay), cation exchange capacity (cmol (+) kgˉ¹ soil, and
clay), base saturation (%), exchangeable sodium percentage (%), electrical conductivity, pH
(H2O), saturation extract soluble cations (cmol (+) kgˉ¹ soil), organic carbon (Walkley Black
%), phosphorus (Bray 1 ppm), and saturation % (ml of water used to saturate 100g of soil).
The interpretation of this data is discussed in the following sections of the current report:
8.2.3 (SOIL TYPES AND SUITABILITY FOR AGRICULTURE AND ‘TOPSOIL’);
8.2.6 (SOIL ANALYTICAL CHARACTERISTIC AND SOIL FERTILITY); and
8.2.7 (EROSION HAZARD AND SLOPE).

Red Earth cc Page 74
Table 8.2.5: Soil Analytical Data
PARTICLE SIZE
Sand Coarse 2.0-0.50mm 20.3 15.2 40.4 27.9 12.9 12.0
Medium 0.50-0.25mm 22.9 17.7 11.9 17.2 13.5 8.0
Fine 0.25-0.106mm 21.4 18.4 19.0 22.0 13.4 8.3
Very Fine 0.106-0.05mm 10.5 9.6 12.0 12.9 7.6 4.7
Silt Coarse 0.05-0.02mm 4.2 5.1 6.5 5.9 4.1 2.7
Fine 0.02-0.002mm 5.1 5.7 2.8 2.4 12.7 8.2
Clay Clay <0.002mm 12.5 12.5 24.8 24.8 5.3 5.3 8.2 8.2 32.7 32.7 52.7 52.7
Texture Co SaLm 96.9 Co SaClLm 96.5 Co LmSa 97.9Co SaLm-
LmSa96.5
Co SaClLm-
SaCl96.9 Co Cl 96.6
EXCHANGEABLE CAT
Ca cmol(+)kg⁻¹ soil ppm = mg/kg 1.8527 371 2.9383 589 1.1061 222 0.6865 138 4.6671 935 6.5259 1308
Mg cmol(+)kg⁻¹ soil ppm = mg/kg 0.4497 55 0.8762 106 0.5663 69 0.6516 79 1.1777 143 1.4757 179
K cmol(+)kg⁻¹ soil ppm = mg/kg 0.4625 181 0.2109 82 0.2451 96 0.2248 88 0.7002 274 0.3559 139
Na cmol(+)kg⁻¹ soil ppm = mg/kg 0.0627 14 0.0704 16 0.0194 4 0.0576 13 0.0355 8 0.0806 19
S-VALUE cmol(+)kg⁻¹ soil 2.828 4.096 1.937 1.621 6.580 8.438
cmol(+)kg⁻¹ clay 22.6 16.5 36.5 19.8 20.1 16.0
CEC at pH7 cmol(+)kg⁻¹ soil 11.763 10.705 7.424 5.152 10.116 12.127
cmol(+)kg⁻¹ clay 94.1 43.2 140.1 62.8 30.9 23.0
BASE SATURATION 24.0 38.3 26.1 31.5 65.0 69.6
ESP 0.53 0.66 0.26 1.12 0.35 0.66
EC 2 2 1 1 2 5
Eh Redox Potential mV
pH (H2O) 6.32 6.37 5.89 5.53 6.02 6.26
ORGANIC CARBON 0.46 0.39 0.43 0.27 0.86 0.69
TOTAL N (Digest)
P (Bray 1 method) 5.25 1.57 3.22 1.21 5.95 1.57
SATURATION % 40 40 40 40 40 40
Ca cmol(+)kg⁻¹ soil ppm = mg/kg 0.012 2.4 0.022 4.4 0.003 0.6 0.002 0.4 0.017 3.4 0.090 18.0
Mg cmol(+)kg⁻¹ soil ppm = mg/kg 0.016 1.9 0.024 2.9 0.007 0.9 0.010 1.2 0.027 3.3 0.037 4.5
K cmol(+)kg⁻¹ soil ppm = mg/kg 0.034 13.3 0.024 9.4 0.014 5.5 0.015 5.9 0.048 18.8 0.024 9.4
Na cmol(+)kg⁻¹ soil ppm = mg/kg 0.008 1.8 0.011 2.5 0.004 0.9 0.005 1.1 0.006 1.4 0.016 3.7
SOIL FORM
SOIL CODE & FAMILY
DEGREE OF LEACHING
PARENT MATERIAL
PRESENT LAND USE
BROAD SOIL GROUP
33.0
9.3 10.8 9.3 8.3 16.8 10.9
75.1 60.9 83.3 80.0 47.4
PEDOCUTANIC (i.e. STRUCTURED)
SATURATION EXTRACT SOLUBLE CATIONS
M375
Orthic A (0-10cm)
M376
Pedocutanic B (45cm)
M377
Bush (Combretum spp. dominant) and frequent-rare Grasses.
Usually moderately eroded
Stoneline (Chert predominantly, & numerous other fragments).
Possibly weathered from Conglomerates.
Hutton
Hu 3200 Ventersdorp (luvic)
Eutrophic (marginally)
Auger AY82
Swartland
Sw 1221 Mtini (luvic)
Eutrophic (marginally)
Orthic A (0-10cm)
M372
Red apedal B (50cm)
M373
Orthic A (0-10cm)
M374
Auger CE96 Auger BS102
Glencoe
Gc 3100 Draaihoek (non-luvic)
Eutrophic
Yellow-brown (45cm)
RED APEDAL YELLOW-BROWN APEDAL
Bush and Bare Surface (Grasses mostly gone). Larger growth
forms of trees than on other soil types. Usually severely-highly
eroded (with surface capping)
ppm = mg/kg
Ferricrete overlying Sandstone
SAMPLE REFERENCE
HORIZON (DEPTH)
LAB REFERENCE (ISCW). Report GROND 201718 5543
Ammonium Acetate method
Pipette method %
Bush and frequent Grasses. Usually slightly eroded (least
eroded of all broad soil groups)
ml water to saturate 100g soil
Sandstone
%
%
%
% Walkley Black method

Red Earth cc Page 75
Table 8.2.5: Soil Analytical Data (continued)
PARTICLE SIZE
Sand Coarse 2.0-0.50mm 29.8 27.6 14.8 23.3 26.4
Medium 0.50-0.25mm 12.6 15.7 16.8 14.3 13.6
Fine 0.25-0.106mm 17.5 20.5 30.1 19.9 15.1
Very Fine 0.106-0.05mm 10.6 13.2 14.0 11.8 8.4
Silt Coarse 0.05-0.02mm 4.9 6.6 5.4 3.2 3.5
Fine 0.02-0.002mm 5.6 3.2 10.3 8.9 4.3
Clay Clay <0.002mm 15.5 15.5 10.2 10.2 5.6 5.6 14.6 14.6 25.4 25.4
Texture Co SaLm 96.5Co SaLm-
LmSa97.0
Me-Fi LmSa-
SaLm97.0 Co SaLm 96.0 Co SaClLm 96.7
EXCHANGEABLE CAT
Ca cmol(+)kg⁻¹ soil ppm = mg/kg 1.1841 237 2.3702 475 17.0011 3407 2.1238 426 2.5892 519
Mg cmol(+)kg⁻¹ soil ppm = mg/kg 0.4778 58 0.5333 65 1.6927 206 1.1905 145 2.2484 273
K cmol(+)kg⁻¹ soil ppm = mg/kg 0.2027 79 0.5446 213 0.7939 310 0.6287 246 0.5309 208
Na cmol(+)kg⁻¹ soil ppm = mg/kg 0.0399 9 0.0453 10 0.1077 25 0.1742 40 0.5563 128
S-VALUE cmol(+)kg⁻¹ soil 1.904 3.493 19.595 4.117 5.925
cmol(+)kg⁻¹ clay 12.3 34.2 349.9 28.2 23.3
CEC at pH7 cmol(+)kg⁻¹ soil 5.506 6.082 11.898 6.939 9.174
cmol(+)kg⁻¹ clay 35.5 59.6 212.5 47.5 36.1
BASE SATURATION 34.6 57.4 164.7 59.3 64.6
ESP 0.72 0.75 0.91 2.51 6.06
EC 1 2 9 2 3
pH (H20) 5.70 6.14 8.26 6.17 6.32
ORGANIC CARBON 0.43 0.60 2.57 0.48 0.40
TOTAL N (Digest)
P (Bray 1 method) 11.75 14.29 6.97 1.53 1.04
SATURATION % 40 40 40 40 40
Ca cmol(+)kg⁻¹ soil ppm = mg/kg 0.003 0.6 0.021 4.2 0.455 91.2 0.014 2.8 0.025 5.0
Mg cmol(+)kg⁻¹ soil ppm = mg/kg 0.005 0.6 0.034 4.1 0.044 5.3 0.036 4.4 0.080 9.7
K cmol(+)kg⁻¹ soil ppm = mg/kg 0.009 3.5 0.065 25.4 0.062 24.2 0.064 25.0 0.071 27.8
Na cmol(+)kg⁻¹ soil ppm = mg/kg 0.006 1.4 0.006 1.4 0.009 2.1 0.030 6.9 0.094 21.6
SOIL FORM
SOIL CODE & FAMILY
DEGREE OF LEACHING
PARENT MATERIAL
PRESENT LAND USE
BROAD SOIL GROUP
Stoneline (Chert predominantly, & numerous other fragments).
Possibly weathered from Conglomerates.
SHALLOW SHALLOW CARBONATE HYDROMORPHIC
Shrubby vegetation and Bare Surface (Grasses mostly gone).
Usually severely erodedShrubby vegetation and rare Grasses. Usually highly eroded
Bush and frequent-rare Grasses. Usually frequent Acacia
(Sheperds bush some areas), stony/rocky surface, saline.
Usually moderately-slightly eroded
Bottomland (‘vlei’) wetland: Savannah / open ‘Grasslands’
(frequent Grasses, frequently with Sedges). Slightly eroded
Ferricrete overlying Sandstone Calcrete (probably overlying Base Rich Igneous material) Sandstone and Ferricrete
Mesotrophic Eutrophic Eutrophic (highly calcareous) Eutrophic
Brandvlei Westleigh
Gs 2111 Overberg Dr 2000 Hilldrop Br 1000 Grootvloer We 2000 Mareetsane (luvic)
ppm = mg/kg
Glenrosa Dresden
ml water to saturate 100g soil
Ammonium Acetate method
%
%
% Walkley Black method
%
SATURATION EXTRACT SOLUBLE CATIONS
69.3 63.5
10.5 9.8 15.7 12.1 7.8
Pipette method %
70.5 77.0
Orthic A (0-10cm) Orthic A (0-10cm) Soft Plinthic B (40cm)
LAB REFERENCE (ISCW). Report GROND 201718 5543 M380 M381 M382 M378 M379
HORIZON (DEPTH) Orthic A (0-10cm) Orthic A (0-10cm)
75.7
SAMPLE REFERENCE Auger BG88 Auger BS96SE (south-east of grid point) Auger BY92 Auger BU98SE (south-east of grid point)

Red Earth cc Page 76
8.2.6 SOIL ANALYTICAL CHARACTERISTICS AND SOIL
FERTILITY (Refer to Table 8.2.5)
i) Soil texture
Soil texture is considered to be a permanent property of soils and as such it is
particularly important in determining soil behaviour. Many soil properties are
dependent on the proportions of sand, silt and clay, including inter-alia nutrient and
water holding ability, permeability, porosity, erodibility, and susceptibility to
compaction.
Survey Area
Based on the soil analytical data presented in Table 8.2.5 (Soil Analytical Data) alone,
the following trends are evident:
The neocutanic, yellow-brown apedal, shallow, carbonate, red apedal, and
hydromorphic (Westleigh form only) broad soil groups generally have low to moderate
clay contents (5 - 25%), low to moderate silt contents (8 - 16%), and high sand contents
(61 - 83%). The aforementioned soils are generally listed from lowest (neocutanic) to
higher (hydromorphic) clay content.
The exceptions are the hydromorphic (Katspruit and extremely rarely Rensburg forms)
and pedocutanic broad soil groups that have moderate to high clay contents (38 - 53%),
low to moderate silt contents (11 - 17%), and moderate to high sand contents (33 -
47%).
Sand grade is coarse for all samples, except the carbonate broad soil group (Brandvlei
form) which is medium to fine.
However, the soil survey obviously showed a slightly larger variation in the measured
variables (both within and between soil forms) than those mentioned above for the
determined modal samples in Table 8.2.5. Thus, the following represent the overall
texture range as determined in-field in the Operational Area:
- Yellow-brown apedal, Neocutanic, Shallow, and Carbonate soils (broad soil groups):
loamy-sand to sandy-loam textures (clay content approximately 5 - 16%),
- Red apedal soils: sandy-loam to sandy-clay-loam (clay content approximately 10 -
26%),
- Pedocutanic soils: clay to sandy-clay -loam textures (clay content approximately 55 -
30%), and
- Hydromorphic soils: sandy-loam to clay textures (clay content approximately 15 -
55%).
ii) Soil pH (reaction)
Soil pH is the degree of acidity of a soil. Descriptive terms commonly associated with
certain ranges in soil pH (van der Watt, 1995) measured in distilled water are:

Red Earth cc Page 77
Extremely acid (< 4.5), very strongly acid (4.5-5.0), strongly acid (5.1-5.5),
medium acid (5.6-6.0), slightly acid (6.1-6.5), neutral (6.6-7.3),
mildly alkaline (7.4-7.8), moderately alkaline (7.9-8.4), strongly alkaline (8.5-9.0) and
very strongly alkaline (> 9.0).
An optimum pH is assumed to be between about 6 to 7 (the range in which most
nutrients are most available, and the average range preferred by most crops).
The soil pH has a direct influence on plant growth in a number of ways:
Through the direct effect of the hydrogen ion concentration on nutrient uptake;
Indirectly through the effect on trace nutrient availability; and by the
Mobilizing of toxic ions such as aluminium and manganese, which restrict plant growth.
Survey Area
The pH of the analysed topsoil and subsoil (collectively) samples vary as follows:
- Yellow-brown apedal (Glencoe form) and Shallow (Glenrosa form): 5.53 - 5.89
(medium acid): i.e. slightly too acid;
- Shallow (Dresden form), Hydromorphic (Westleigh form), Pedocutanic (Swartland
form), and Red apedal (Hutton form): 6.02 - 6.37 (slightly acid): i.e. ideal; and
- Carbonate (Brandvlei form): 8.26 (moderately alkaline): i.e. too alkaline.
The former two bullets cater for soils that are derived from less base rich (more acid)
parent material types in the survey area (i.e. sandstone, ferricrete, and chert; and
possibly also siltstone and mudstone).
The latter bullet caters for soils that are derived from the most base rich parent material
types in the survey area (i.e. calcrete, which is probably underlain by a base rich
igneous parent material type such as diabase).
The Chamber of Mines arable definition requires a soil pH value of between 4.0 and
8.4. Thus according to this definition, all of the soils are arable in terms of their pH, the
carbonate soils being only marginally so.
iii) Saturated extract
Saturated extracts are used to determine the amounts of easily water-soluble elements,
especially the amounts of Ca (calcium), Mg (magnesium) and Na (sodium) to determine
the salinity and sodicity of the soil.
Background
Electrical conductivity (EC: measured in millisiemens/metre: mS/m) is a measure of the
ability of a soil saturation extract to conduct electricity and is a measure of the
concentration of salts in solution. For example low salinity irrigation waters have values
less than 25mS/m and high salinity irrigation waters have values greater than 75mS/m.
Highly saline (high soluble salt content of which sodium forms a modest proportion
[usually exchangeable sodium percentage or ESP <15]) soils will result in the reduction
of plant growth, caused by the diversion of plant energy from normal physiological
processes to that involved in the acquisition of water under highly stressed conditions.

Red Earth cc Page 78
The sodium adsorption ratio (SAR) measures soil sodicity and is a measure of the
quality of a solution (e.g. saturation extract of irrigation water with regards to sodium
content). At high levels of exchangeable sodium, certain clay minerals, when saturated
with sodium, swell markedly. With the swelling and dispersion of a sodic soil, pore
spaces become blocked and infiltration rates and permeability are greatly reduced. The
critical SAR for poorly drained grey soils is 6, for slowly draining black swelling clays
is 10 and for well drained soils and recent sands 15. The exchangeable sodium
percentage (ESP) [percentage of the cation exchange capacity (CEC) that is occupied
by sodium] is also an indicator of soil sodicity. The cation exchange capacity of a soil is
the sum total of exchangeable cations that a soil can adsorb. A sodic (low soluble salt
content and a high exchangeable sodium percentage [usually ESP >15] soil has
sufficient adsorbed sodium to have caused significant de-flocculation.
The Chamber of Mines specifies that for a soil to be defined as arable (or to be utilized
as ‘topsoil’), that it must have an EC of less than 400mS/m at 25°C and an ESP of less
than 15 throughout the upper 0.75m of soil.
Survey Area
The EC of the analysed samples varies from approximately 100-200 for the majority of
samples, to up to approximately 500 for the pedocutanic (Swartland form) sample, and
up to approximately 900 for the carbonate (Brandvlei form) sample. Thus the majority
of the samples are non-saline as per The Chamber of Mines definition, bar the
pedocutanic (Swartland form, and probably also many of the Sepane forms) and
carbonate (Brandvlei form, and probably also many examples of the non-analysed
Augrabies, Addo, Prieska, Montagu, and Coega forms) soils which are saline.
The ESP of the analysed samples varies from 0.26 to 1.12 % for the majority of
analysed samples, and 2.50 to 6.06 % for the hydromorphic (Westleigh form) samples.
Thus all of the soils are non-sodic as per The Chamber of Mines definition.
iv) Organic carbon, nitrogen and phosphorus
Organic matter (indicated by the amount of organic carbon) is of vital importance in
soil. It improves the structural condition of both coarse- and fine-textured soils and
improves the water holding capacity, especially of sandy soils. It therefore greatly
reduces the erodibility of soil. Organic matter supplies greater than 99 % of total soil
nitrogen (N) and 33 - 67 % of total soil phosphorus (P). Humus, the active fraction of
soil organic matter has a very high CEC (between 150 and 300 cmol(+) kg-1) and can
adsorb up to about 6 times its own weight in water. The C: N (carbon: nitrogen) ratio of
humus is often about 10: 1 to 12: 1.
Survey Area
Topsoil organic carbon percentages may be categorised into classes as follows: l = low
(<0.3 % organic carbon), lm = low to medium (0.3 - 0.6 %), m = medium (0.6 - 1.0 %),
mh = medium to high (1.0 - 1.4 %), h = high (1.4 - <1.8 %), vh = very high (>1.8 %),
and ultra high (>10.0%).

Red Earth cc Page 79
The organic carbon percentage of the analysed samples varies from 0.27 % (low) to
0.86 % (medium) for the majority of analysed samples, and is 2.57 % (very high) for
the carbonate (Brandvlei form) sample.
Total N is generally likely to follow the same trend as organic carbon, with the highest
amount being found in the topsoil with the highest organic carbon percentage. The
topsoil C: N ratios generally exhibit a larger range than in the subsoil, reflecting the
more stable condition of the organic matter at depth.
v) Exchangeable cations
It is normal practice to determine what are known as the ‘exchangeable bases’ i.e., Ca
(calcium), Mg (magnesium), K (potassium) and Na (sodium) because they include three
of the major plant nutrients, and Na because it indicates the possible sodicity of the soil,
especially in circumstances where saturated paste data are not available. Lack of organic
matter and clay minerals (which provide exchange sites that serve as nutrient stores)
result in the soil having a low ability to retain and supply nutrients for plant growth. The
maximum potential of a soil to retain nutrients in an exchangeable form is assessed by
measuring the cation exchange capacity (CEC).
The base saturation (%) is then calculated as: (sum of the four bases / CEC) x 100.
In general the amounts of exchangeable cations normally follow the same trend as
outlined for pH, texture and saturated paste data. For most soils cations follow the
typical trend Ca > Mg > K > Na.
Survey Area
The aforementioned trend was the case for only three (B-horizons of the Hutton,
Swartland and Westleigh forms) of the eleven samples. For the remaining eight
samples: K > Mg.
vi) Soil fertility
The comments that follow are based on the laboratory data discussed above and thus
reflect the fertility of the soils as currently exists in the field, with the soils in-situ. It
does not take into account any changes that may occur as a result of stripping,
stockpiling and compaction, or the rehabilitation methods or purposes for which the soil
may be used. It would be imperative that if any of the soils are to be used for
rehabilitation purposes; their fertility status is re-analyzed at that time prior to their use,
that recommendations concerning possible ameliorative actions can be given,
depending on the species to be planted. In addition different crops have different soil
fertility requirements and so the discussion here can be of a general nature only, rather
than specific to a particular crop.
The following points are relevant to soil fertility:
- pH
The pH of the analysed topsoil and subsoil (collectively) samples vary as follows:
- Yellow-brown apedal (Glencoe form) and Shallow (Glenrosa form): 5.53 - 5.89
(medium acid): i.e. slightly too acid;

Red Earth cc Page 80
- Shallow (Dresden form), Hydromorphic (Westleigh form), Pedocutanic (Swartland
form), and Red apedal (Hutton form): 6.02 - 6.37 (slightly acid): i.e. ideal; and
- Carbonate (Brandvlei form): 8.26 (moderately alkaline): i.e. much too alkaline.
- EC
The EC of the analysed samples varies from approximately 100-200 for the majority of
samples, to up to approximately 500 for the pedocutanic (Swartland form) sample, and
up to approximately 900 for the carbonate (Brandvlei form) sample. Thus the majority
of the samples are non-saline as per The Chamber of Mines definition, bar the
pedocutanic (Swartland form, and probably also many of the Sepane forms) and
carbonate (Brandvlei form, and probably also many examples of the non-analysed
Augrabies, Addo, Prieska, Montagu, and Coega forms) soils which are saline.
- ESP
The ESP of the analysed samples varies from 0.26 to 1.12 % for the majority of
samples, and 2.50 to 6.06 % for the hydromorphic (Westleigh form) topsoil and subsoil
samples. Thus all of the soils are non-sodic as per The Chamber of Mines definition.
- Total N
Total N of the analysed samples is likely to be low to medium for the majority of
analysed samples, and very high for the carbonate (Brandvlei form) sample.
- K, Mg and P
In terms of fertility for maize, the optimal levels of nutrients (exchangeable cations) are:
K (120 ppm optimal - 100 ppm acceptable), Mg (60 ppm) and P (34 ppm).
Levels of K for the eleven samples range from 79 (moderately deficient) to 310 (far
more than adequate) ppm. Deficiencies (79 - 96 ppm: moderately - very slightly
deficient) are present for the following samples: red apedal subsoil, yellow-brown
apedal topsoil and subsoil, and shallow (Glenrosa form) topsoil.
Levels of Mg for the eleven samples range from 55 (very slightly deficient) to 273 (far
more than adequate) ppm. Very slight deficiencies (55 - 58 ppm) are present for the
following samples: red apedal topsoil, and shallow (Glenrosa form) topsoil.
Levels of P are seriously deficient (1.04 - 14.29 ppm) for all of the topsoil and subsoil
samples.
Levels of Ca should be in the range of at least 300 to 400 ppm. Levels of Ca for the
eleven samples range from 138 (highly deficient) to 589 (more than adequate) ppm for
most samples; from 935 to 1308 ppm (both more than adequate) for the pedocutanic
topsoil and subsoil respectively; and 3407 ppm (excessive) for the carbonate (Brandvlei
form) topsoil sample. Deficiencies (138 - 237 ppm: highly - moderately deficient) are
present for the following samples: yellow-brown apedal topsoil and subsoil, and
shallow (Glenrosa form) topsoil.

Red Earth cc Page 81
In the case of the subsoils, nutrient deficiencies are of no consequence unless the
material is to be utilized for rehabilitation purposes, at which stage the deficiencies
should be ameliorated.
In terms of fertility for improved or natural pasture there are no accepted data for the
elemental concentrations required in the soil to ensure optimum yields. Most of the
available data is based on leaf analysis from various field experiments. The Guidelines
for the Rehabilitation of Land Disturbed by Surface Coal Mining in South Africa (1981)
suggest that optimal concentrations for P, K and Mg are 36, 120 and 50 ppm,
respectively.
8.2.7 EROSION HAZARD AND SLOPE (Refer to Tables 8.2.5 and 8.2.7; and Figure 8.2.7)
It is necessary to determine the maximum critical slope (at which unacceptable soil erosion will
begin to occur) for a site to be regarded as arable. To this end, minimum erosion slopes were
calculated (for eleven samples, collected from seven modal soil augers) from the soil
erodibility nomograph of Wischmeier, Johnson and Cross (1971) [Figure 8.2.7], based on the
soil analytical data (Table 8.2.5) gathered during the soil survey. The results are presented in
Table 8.2.7 (Data Used and Results Obtained from the Soil Erodibility Nomograph).
The nomograph uses the following five soil parameters, which have been shown by research to
have a major effect in determining erodibility:
i) Mass percentage of the fraction between limiting diameters of 0.1 and 0.002mm (very
fine sand plus silt) of the topsoil.
ii) Mass percentage of the fraction between 0.1 and 2.0mm diameter (residue of sand
fraction – fine, medium and coarse) of the topsoil.
iii) Organic matter content of the topsoil, obtained by multiplying the organic carbon
content (in grams per 100g soil, Walkley Black method) by a factor of 1.724.
iv) Numerical index of soil structure.
v) Numerical index of soil permeability of the soil profile as a whole.
Topsoil and subsoil permeability’s for the shallow, yellow-brown apedal, neocutanic, and
carbonate soils in the survey area are generally rapid (>3600mm/hour); those for the red apedal
topsoils and subsoils are rapid (>3600mm/hour) to moderate-rapid (360 - 3600mm/hour); while
those for the hydromorphic and pedocutanic topsoils and subsoils are generally slow-moderate
(3.6 - 36mm/hour), or occasionally moderate (36 - 360mm/hour) for the topsoils.
Despite the prevailing topsoil permeability’s in the area, the permeability classes refer to the
permeability of the profile as a whole, which is determined by the controlling soil layer
(horizon). Thus profiles overlying horizons of slow permeability (e.g. hard rock, hard plinthite,
hardpan carbonate, a pedocutanic horizon, or a gleyed horizon), or luvic soils (with relatively
permeable sandy topsoils overlying less permeable higher clay subsoils) are likely to reach
field capacity relatively quickly, and particularly so when the soil depth is limited and the
storm is heavy or of long duration. A luvic soil displays markedly higher clay content in the B-

Red Earth cc Page 82
horizon relative to the overlying A- or E-horizon. Other controlling soil horizons include
slowly (0.36 - 3.6mm/hour) [once moist] permeable vertic A-horizons (extremely rare in
survey area), and prismacutanic B-horizons (not present in survey area).
Therefore, the permeability classes utilised for the nomograph exercise for in-situ soils cater for
the worst scenario (heavy storm of long duration on a shallow example of the soil type).
Both soil structure and soil permeability have a large influence on the soil erodibility factor (K)
and thus the maximum slope for a site to be regarded as arable. The soil permeability index is
the most subjective of the five parameters and is difficult to decide upon.
Figure 8.2.7 (The Soil Erodibility Nomograph of Wischmeier, Johnson and Cross [1971])
shows the nomograph, that has been redrawn (by the author) to include finer sub-divisional
graph lines for greater ease of calculating K. Table 8.2.7 (Data Used and Results Obtained from
the Soil Erodibility Nomograph) is a summary of the data used (extracted from our soil
analytical data and field notes of the site) and the results obtained.
Figure 8.2.7: The Soil Erodibility Nomograph of Wischmeier, Johnson and Cross (1971)
The x-axis in the diagram refers to increasing organic carbon percentages and increasing
percentages of sand (in the left hand ‘graph’); and increasing grades of soil structure and
increasing permeability (in the right hand ‘graph’).

Red Earth cc Page 83
Table 8.2.7: Data Used and Results Obtained from the Soil Erodibility Nomograph
ORGANIC
MATTER %
Percentage
GradeDegrees
AUGER CE96 In-Situ: Moderate - Rapid 2 0.158 12.7 7.2
Hutton Rehabilitation: Slow-Moderate (rubble/soil - compacted by machinery) 4 0.210 9.5 5.4
Orthic A
AUGER BS102 In-Situ: Rapid 1 0.164 12.2 6.9
Glencoe Rehabilitation: Slow-Moderate (rubble/soil - compacted by machinery) 4 0.240 8.3 4.7
Orthic A
AUGER AY82 In-Situ: Slow - Moderate (controlling pedocutanic subsoil) 4 0.194 10.3 5.9
Swartland Rehabilitation: Slow (rubble/soil - compacted by machinery) 5 0.218 9.2 5.2
Orthic A
Rehabilitation: Slow (rubble/soil - compacted by machinery) 5 0.160 12.5 7.1
Compacted Seal: Slow
AUGER BG88
Glenrosa
Orthic A
AUGER BS96SE
Dresden
Orthic A
AUGER BY92
Brandvlei
Orthic A
AUGER BU98SE
Westleigh
Orthic A
Soft Plinthic B 16.2 55.1 0.7 Coarse granular 3 Compacted Seal: Slow 5 0.164 12.2 6.9
DATA USED RESULTS OBTAINED
SOIL SAMPLE
MASS % OF:SOIL STRUCTURE (type and
size)SOIL PERMEABILITY BASED ON CONTROLLING SOIL HORIZON (profile as a whole)
SOIL
ERODIBILITY
FACTOR K
(From
nomograph)
MAXIMUM CRITICAL
SLOPE FOR ARABLE (IN-
SITU ), REHABILITATION,
AND COMPACTED SEALvf sand
& silt
sand
residue
(organic
carbon x
1.724)
Type and size class Description class
Pedocutanic B 15.6 28.3 1.2 Blocky 4
19.8 64.6 0.8 Blocky 4
24.4 39.8 1.5 Blocky 4
21.3 71.3 0.7 Blocky 4
67.1 0.5 Blocky 4
Red apedal B 20.4 51.3 0.7 Coarse granular 3
Yellow-brown 21.2
21.1 59.9 0.7 Blocky 4
23.0 63.8 1.0 Blocky 4
29.7 61.7 4.4 Fine granular 2
23.9 57.5 0.8 Coarse granular 3
In-Situ: Moderate (controlling lithocutanic B 'subsoil') 9.20.218 5.23
In-Situ: Moderate (controlling soft plinthic subsoil) 3 0.177 11.3 6.5
0.096 20.8 11.71
In-Situ: Slow (controlling hard plinthic B 'subsoil')
In-Situ: Rapid (underlying soft carbonate is stony, permeability also rapid)
5 0.260 7.7 4.4
Rehabilitation: Slow-Moderate (rubble/soil - compacted by machinery) 4 0.195 10.3 5.9
Rehabilitation: Slow-Moderate (rubble/soil - compacted by machinery) 4 0.237 8.4 4.8

Red Earth cc Page 84
Table 8.2.7 shows the soil erodibility factor (K) to increase, and the maximum slope for a site
to be classed as arable to decrease with the following:
i) Increasing very fine sand plus silt,
ii) Decreasing organic matter percentage,
iii) Increasing structure index, and
iv) Decreasing permeability.
We regard the minimum slope for an unacceptable erosion hazard to exist, as the maximum
slope for the site to be regarded as arable in terms of The Chamber of Mines land use capability
(refer to Section 8.3 - LAND CAPABILITY BASELINE). The specification that the product of
percent slope and the K factor must not exceed 2.0 for land to be classed as arable, was the
basis of calculating the maximum slope for arable in Table 8.2.7. Once the value of 2.0 is
exceeded, an unacceptable erosion hazard exists and conservation measures are required.
Note that percentage slope refers to the percentage grade, where 45 degrees (one metre vertical
rise in one metre horizontal distance) is equal to a percentage grade of 100 %, where
percentage grade is equal to vertical distance divided by horizontal distance multiplied by one
hundred.
In-Situ (undisturbed) soils
The following critical erosion slopes have been selected from our data in Table 8.2.7 to
represent the topsoils (A-horizons) of the various broad soil groups that occur in the area:
Red apedal and Yellow-brown apedal soils (also applicable to Neocutanic soils, and
Carbonate [Py, Ky and Mp soil forms only] soils):
Two samples: 7.2 degrees and 6.9 degrees: Average 7.0 degrees (12.3 % percentage
grade). Less-steep than for Scottney’s ‘Ferrallitic soils’ (8.5 degrees).
Pedocutanic soils (also applicable to Hydromorphic soils):
Two samples: 5.9 degrees and 6.5 degrees: Average 6.2 degrees (10.8 % percentage
grade).
More-steep than for Scottney’s ‘Non-Ferrallitic soils with a clay increase B-horizon’ (5.7
degrees).
Shallow soils:
Two samples: 5.2 degrees and 4.4 degrees: Average 4.8 degrees (8.4 % percentage
grade). Slightly more-steep than for Scottney’s ‘Duplex soils’ (4.5 degrees), for the lack of a more
relevant comparison.
The subsoil values are not normally considered (not exposed) for the determination of the
arable capability class.

Red Earth cc Page 85
Scotney et al. (1987) makes use of the following critical arable slopes:
Ferrallitic (highly weathered) soils : < 15.0 % (8.5 degrees),
Non-Ferrallitic soils without a ‘clay increase B-horizon’ : < 12.0 % (6.8 degrees),
Non-Ferrallitic soils with a ‘clay increase B-horizon’ : < 10.0 % (5.7 degrees),
Duplex soils : < 8.0 % (4.5 degrees).
The critical erosion slopes determined in Table 8.2.7 are either less-steep (red apedal and
yellow-brown apedal), more-steep (pedocutanic and hydromorphic), and slightly more-steep
(shallow soils) than those of Scotney et al. (1987) for equivalent soils.
Unacceptable levels of soil erosion will begin to occur in bare (without grass cover) areas,
where the slope exceeds that specified for the respective broad soil groups.
To provide for a buffer against soil erosion in cultivated areas, the aforementioned selected
slopes were also chosen as the maximum permissible slope for an area to be accepted into the
arable capability class.
After completion of the soil survey exercise, slope in the Operational Area was determined to
vary as follows for natural areas: - Midslopes (and concave ‘valley-bottom’ areas): almost level (0.5 - 1 degree): vast majority;
- Midslopes (and concave ‘valley-bottom’ areas): very gently sloping (1 - 2 degrees):
occasionally; and
- Midslopes (and concave ‘valley-bottom’ areas): gently sloping (2 - 4 degrees): rarely.
Despite the fact that the determined critical erosion slopes are steeper than the prevailing slopes
in the area, soil erosion is severe to moderate in the majority of the Operational Area as a result
of the degradation/removal of the majority of the grass cover due to overstocking/overgrazing
in the past.
Slope was not a limiting factor in the survey area with regard to the determination of the arable
capability class since the soils which were deep enough to qualify as arable (≥75cm) occurred
in areas where the slope was less than 7.0 degrees [critical erosion slope selected to represent
the potentially arable red apedal and yellow-brown apedal soils]. Steeper sections (none in
survey area) would generally display soils of lesser depth, and thus would already classify as
grazing or non-grazing areas.
It should be noted that the Department of Agriculture stipulates that conservation measures
should be implemented on slopes of over 2.0 % (1.1 degrees) on disturbed (where the original
grass cover has been removed) sites. These measures involve practices such as building contour
banks, re-grassing and cultivating on the contour, etc. The maximum allowable slope for
annual cropping is 12 % (6.8 degrees).

Red Earth cc Page 86
Critical erosion slopes are next presented for a number of different Rehabilitation
Scenarios.
(i) Rehabilitated ‘topsoiled’ areas overlying building rubble, removed features, and
opencast areas [not intentionally compacted]
[i.e. rehabilitated ‘topsoiled’ areas overlying the footprints of all demolished/removed
man-made features not included in Point ii)]
This scenario applies to the rehabilitation of the footprints of all of the sites of the
demolished/removed/levelled man-made facilities/features upon closure: e.g. infrastructure
/ buildings, roads, ‘non-waste’ prepared surfaces/piles/banks, excavations; re-graded
opencast areas; non-carbonaceous rock dumps that remain in perpetuity; and the sites of
removed rock dumps (or piles of material) / removed overburden or underburden ‘waste’
layers / removed ‘topsoil’ stockpiles.
Topsoil (A-horizon) material should ideally be placed at the top of the rehabilitated
‘topsoil’ sequence. This horizon has the greatest organic matter percentage and is thus
more fertile and less erodible (usually, depending on very fine sand and silt contents) than
the subsoil (B-horizon). However, in practice topsoil (A-horizon) and subsoil (B-horizon)
mixing is likely, despite the fact that it would be desirable to strip and ‘topsoil’ these
reserves separately (A-horizons replaced at the surface).
Given that the permeability of the levelled rubble/removed features is defined as slow (3.6
- 36mm/hour) due to unintentional compaction; then the removed feature becomes the
controlling horizon in the nomograph exercise.
The following critical erosion slopes have been selected from our data (Table 8.2.7) to
represent the various broad soil groups that are recommended for rehabilitation
‘topsoiling’ purposes.
Rehabilitated areas must be re-graded (re-sloped) to ensure that these recommended
calculated slopes are not exceeded:
Red apedal and Yellow-brown apedal soils:
Also applicable to the Neocutanic soils, and Carbonate (Py, Ky and Mp soil forms
only) soils.
Topsoils: two samples: 5.4 and 4.7 degrees;
Subsoils: two samples: 5.9 and 4.8 degrees;
Average of A- and B-horizons: 5.2 degrees (9.2 % percentage grade)
[non-vegetated, but slightly steeper (undetermined) after re-vegetation].
Pedocutanic soils:
Topsoils: one sample: 5.2 degrees;
Subsoils: one sample: 7.1 degrees;
Average of A- and B-horizon: 6.2 degrees (10.8 % percentage grade)
[non-vegetated, but slightly steeper (undetermined) after re-vegetation].
The final selected slope is 5.2 degrees (9.2 % percentage grade) for all ‘topsoil’ types,
the soils in the first bullet being preferred.

Red Earth cc Page 87
Suitable broad soil groups for rehabilitation ‘topsoiling’ purposes (surface placement) are
as follows (descending order of suitability) [types i - iii preferred]:
i) Red apedal, very high suitability,
ii) Yellow-brown apedal (and Neocutanic), high suitability,
iii) Carbonate (Py, Ky, and Mp soil forms only), high suitability, and
iv) Pedocutanic (‘red’ colours only), moderate-low suitability.
The following broad soil groups are not recommended for surface placement, but may be
utilised further down in the rehabilitated profile:
i) Carbonate (Ag, Ad, Pr, Mu, Br, Cg soil forms only), very low to unsuitable (saline), and
ii) Shallow, Hydromorphic, and Pedocutanic (‘grey’ colours), very low to unsuitable (Shallow-
gravelly/rocky; Hydromorphic and
Pedocutanic-bleached).
The A-horizons should ideally be replaced at the surface, the B-horizon material only
contributing to the required ‘topsoiling’ depth (as determined by the pre-mining land
capability class).
In rehabilitated infrastructure and opencast areas, the pre-disturbance/pre-mining grade
(slope), slope shape, contours and drainage density (not necessarily pattern) should be
implemented where possible, at all times bearing in mind the calculated critical erosion
slopes for the various broad soil groups which occur. This will be done by surface re-
grading. Concave (rather than convex) slopes should be maximized wherever possible,
while the creation of undulating ‘basin and ridge’ topography with frequent blind hollows
should be avoided. In rehabilitated infrastructure/opencast areas, the negative impact of
drainage systems approximating their original course is that the re-established drainage
systems may incise their beds into the ‘wastes’/rubble/overburden rock/spoil over time
(unless these drainage systems are constructed of concrete in such areas). The
consequences of this possible deepening of drainage systems is firstly that the ‘clean’
water flowing over rehabilitated areas may become contaminated, and secondly that some
(unknown volume) of this water will infiltrate into the polluted zone (rubble from
infrastructure, or pit) itself.
Erosion control measures such as intercept drains, contour bank canals, grassed waterways
and toe berms should be implemented where necessary.

Red Earth cc Page 88
(ii) Rehabilitated ‘topsoiled’ areas; overlying a compacted-‘remoulded’ ‘seal’ layer;
overlying a potentially-polluting rehabilitated feature
[i.e. the ‘seal’ layer should ideally overlie rehabilitated pollution control/return
water/process water dams, evaporation ponds, slurry/tailings dams, and potentially
polluting dumps (e.g. carbonaceous discard dumps and ash dump) at the time that
these features become redundant and are rehabilitated. The seal layer should also
underlie these features at the time of their construction, and also including the dirty
water gullies/drains/canals]
In the case of the aforementioned features, where the objective is to limit the infiltration of
rainwater to avoid contamination of the groundwater, a layer of compacted -‘remoulded’
soil (or an impermeable membrane) is placed immediately overlying the feature during
rehabilitation (also underlying these features during construction). In such cases, the
permeability of the controlling ‘soil’ horizon (compacted -‘remoulded’ soil) will be
defined as slow [0.36 - 3.6mm/hour] to very slow (<0.36mm/hour) according to the
nomograph, then irrespective of the soil type used as ‘topsoil’ cover material (overlying
the compacted layer), the critical erosion slopes will be low for all suitable (for use as
‘topsoil’) soil types.
Given the findings in Table 8.2.7, during rehabilitation these features must be re-
graded (re-sloped) before placement of either the compacted -‘remoulded’ soil layer,
or the overlying ‘topsoil’ layer; to ensure that the following recommended slope is
ideally not exceeded:
Pedocutanic (B-horizon) or Hydromorphic (G- or B-horizons) soils: maximum 5.2
degrees (9.2 % percentage grade)
[non-vegetated, but slightly steeper (undetermined) after re-vegetation].
In terms of the overlying non-compacted ‘topsoil’ layer (Red apedal, Yellow-brown
apedal, Neocutanic, Carbonate [Py, Ky and Mp soil forms], or Pedocutanic), the
determined slope would be the same.
Thus the final selected slope is 5.2 degrees (9.2 % percentage grade) for all ‘topsoil’
types.
The aforementioned slope is impractical since the slope of a ‘topsoiled’ ‘rehabilitated’
potentially polluting carbonaceous discard dump, ash dump or TSF cannot easily be
reduced to this extent, while that of a ‘rehabilitated’ pollution control/return
water/process water dam can be reduced (unless this feature remains functioning in
perpetuity).
Given the erodibility of the soils on steeper slopes, the ‘topsoiling’ of some features
may not be feasible. Even if a compacted -‘remoulded’ layer was not established
overlying the feature, the determined slope would be the same: 5.2 degrees (9.2 %
percentage grade) [non-vegetated, but slightly steeper (undetermined) after re-
vegetation]. In such cases, the feature must be re-vegetated using phytoremediation
and ecological restoration principles.
Although Vertisols (vertic broad soil group) are extremely rare in the area, these soils are
the most suitable of all soils for use as compacted ‘seals’, since the vertic A-horizon

Red Earth cc Page 89
naturally displays a slow permeability when moist, and a very slow permeability once
compacted. Thus, if possible such soils should be sought. One patch is known to occur in
the very small pan that lies to the south of auger point AQ70. Further patches may occur in
other of the pans that occur in the Operational Area. However, given the broad auger grid
intensity of 300m that was utilised for the soil survey, augering was not conducted in many
of the pan areas. The pedocutanic and hydromorphic broad soils groups are also suitable
(less so) for use as compacted ‘seals’ in the area.
The natural angle of repose of dumped spoil/rock/tailings/other material is generally
approximately 75.4 % or 37.0 degrees. The recommended maximum gradient
(Chamber of Mines) for material dumped on level to gently sloping terrain (therefore
also rehabilitated ‘topsoiled’ pollution control/return water/process water dams,
evaporation ponds, slimes/tailings dams, and potentially polluting dumps) is at least
1v: 3h (33.0 % or 18.4 degrees), the least erosion occurring if the slope angle reduces
in the direction of the toe of the pediment (i.e. concave). One of the key findings of
extensive surveys and experimental work carried out by the University of the
Witwatersrand between 1996 and 2009 was that grass persistence and erosion control
were increased, and irrigation decreased, by TSF slope reduction to <16 degrees.
Given the critical erosion slopes calculated in this exercise, slopes of 18.4 degrees (before
re-vegetation) appear to be much too steep and would lead to unacceptable levels of soil
erosion occurring after rehabilitation. Other considerations suggest the strong desirability
of lesser gradients to reduce erosion and permit mechanization of re-vegetation and
maintenance operations (agricultural tractors can be operated with most implements up to
20.0 % or 11.3 degrees) [i.e. 1v: 5h].
(iii) Opencast Mining Areas
Two pits are planned to be excavated for the current proposed project.
Opencast areas must be re-graded, ‘topsoiled’, and re-vegetated as per Point (i).
(iv) Underground Mining Areas
Underground mining is not planned for the current proposed project.
Subsided areas must be re-graded, ‘topsoiled’ (where necessary), and re-vegetated as per
Point (i).

Red Earth cc Page 90
8.2.8 DRYLAND / IRRIGATED PRODUCTION POTENTIAL (Refer to Maps 2a, 3a and 4)
DRYLAND
Ranching
The land use both within and immediately adjacent to LCPP is dominated by ranching / game
faming and eco-tourism, and to a lesser extent cattle ranching.
The land in the region is suited to environmental tourism or extensive game ranching. Due to
the scarcity of naturally occurring surface water for the majority of the year, the natural
vegetation is evolved to a low density of grazers and a probable relatively higher density of
browsers. Previous cattle ranching and over-stocking (of grazers) have resulted in the currently
degraded eroded land. Thus the farmers should completely discontinue burning for a good
number of years, while grazer stocking densities must be kept as absolutely low as possible; to
give the land a chance to ‘recover’ somewhat.
Cultivation
Climatic information for the area is presented in Section 8.1.4 (METEOROLOGY). Given the
low mean annual precipitation (435 mm), the hot climate (average maximum temperatures
ranging from 30°C to 36°C), as well as the unpredictable rainfall in the area; dryland
production is not recommended due to the very low yields obtained as well as the high
associated risk.
The semi-arid climate minimises the potential for intensive dryland crop production. Thus the
arable soils as indicated on Map 3a (Pre-Mining Land Capability) are generally not extensively
cultivated due to the very low dryland yields obtained. Thus, the planting of moderate to low
profit commercial agricultural crops are likely to be extremely limited.
Occasional cultivated lands are spread out in six locations as indicated on Map 4 (Present Land
Use), the aforementioned probably producing dryland hay and other types of livestock feed on
a small scale.
Cultivated fields should ideally be located on soils of the arable capability class. The yields
obtained on grazing capability class soils would be considerably lower than those obtained on
the deeper arable soils. However, shallow patches inevitably occur within a land. Scotney et al.
(Soil Capability Classification, March 1987) defines many such areas as arable, albeit with
decreased production possibilities, an increased hazard of use, and an increased intensity of
conservation techniques required.
Generalised dryland yields in the region are presented for the arable soils (usually red apedal
broad soil group). These yields are according to those presented in the South African Atlas of
Agrohydrology and -Climatology (R.E. Schulze et-al, 1997).
All of the yields mentioned by Schultze et-al refer to dry mass.

Red Earth cc Page 91
Maize
2 - 3 tonnes/ha, with an inter-seasonal coefficient of variation of approximately 40 - 50 %.
The dryland breakeven is considered to be approximately 3 tonnes/ha.
Schultze et-al indicates that the area is climatically unsuitable for all other dryland crops, the
following yields being indicated:
Dry Beans
Unsuitable. Patches of <0.5tonnes/ha, and 0.5 - 0.75 tonnes/ha in the region.
National average is 1.2 tonnes/ha.
Given well drained arable soils, a MAP of <775mm, a rooting depth of 100cm, and clay
content (clay 15 - 35 %); the indicated yields must be multiplied by a factor of 1.0 (i.e.
unchanged).
Soybeans
Unsuitable. Patches of 1.00 - 1.50 tonnes/ha in the region.
Given well drained arable soils, a MAP of <775mm, a rooting depth of 100cm, and clay
content (clay 15 - 35 %); the indicated yields must be multiplied by a factor of 1.0 (i.e.
unchanged).
Groundnuts
Unsuitable. Patches 1.5 - 2.0 tonnes/ha (shelled) in the region.
For soil depths of 0.5m, 0.6m, 0.7m, 0.8m, and 0.9m; the indicated yields must be
multiplied by factors of 0.6, 0.7, 0.8, 0.9, and 1.0 respectively in the different areas. Given
arable soil depth of 0.9m, yield is thus unchanged.
Sorghum
Unsuitable <3tonnes/ha (patches 3 - 4 tonnes/ha in the region).
Given well drained arable soils, a MAP of <775mm, a rooting depth of 100cm, and clay
content (clay 15 - 35 %); the indicated yield must be multiplied by a factor of 1.1 (i.e.
increase).
Sunflowers
Unsuitable (patches <1.0 tonne/ha in the region).
Given well drained arable soils, a MAP of <775mm, a rooting depth of 100cm, and clay
content (clay 15 - 35 %); the indicated yields must be multiplied by a factor of 1.0 (i.e.
unchanged).
Cotton:
Unsuitable <1.0 tonne/ha (patches 1.0 - 1.5 tonnes/ha in the region).
For arable soil depths of 0.7m, 0.8m, 0.9m, and 1.0m; the indicated yields must be
multiplied by factors of 0.8, 0.9, 1.0.and 1.1 respectively in the different areas.
Given arable soil depth of 0.9m, yield is thus unchanged.
Kikuyu (Pennisetum clandistinum), Coast Cross II (more drought resistant than Kikuyu),
Eragrostis curvula, and Smuts Finger Grass (Digitaria eriantha)
Unsuitable <4 tonnes/ha (patches 4 - 6 tonnes/ha in the region).
Given that the soils are eutrophic in the area, the indicated yields must be multiplied by a
factor of 0.8 (i.e. reduced).

Red Earth cc Page 92
The aforementioned yields assume that the pH and nutrient status of the soils are optimum
(ameliorated) for a particular crop. The yield variations are primarily rainfall dependant.
IRRIGATED
Despite the arable soils that occur in many areas, such areas will not be able to be
commercially cultivated without the provision of irrigation, the aforementioned due to the
semi-arid prevailing climate in the area. Furthermore, there is a scarcity of borehole water for
irrigation purposes, as well as the potentially saline water quality in some areas.
High profit drip irrigated crops such as citrus or vegetables are likely to be feasible, provided
that irrigation water is available. One small citrus orchard exists adjacent to the farmhouse on
the farm Weltevreden 482 JQ (portion 1).
High irrigated yields will only achieved with high levels of expertise and management.
Schulze et-al (1997) indicates the following for the region:
- gross irrigation requirement: median annual based on the ACRU Model: 1800 -
2000mm/annum, with patches of 1100 - 1800mm/annum; and
- hail incidence: less than once per annum.
8.2.9 IRRIGATION POTENTIAL
The irrigation potential in the soil survey area is based on the characteristics (already
described) of the soils that occur, and generally varies as follows:
- High : red apedal soils;
- Moderate : yellow-brown apedal, neocutanic, and carbonate (Py, Ky and Mp soil
forms only) soils;
- Low : pedocutanic soils (‘red’ colours);
- Unsuitable : shallow, hydromorphic, pedocutanic (‘bleached’ grey colours), and
carbonate (Ag, Ad, Pr, Mu, Br and Cg soil forms) soils.
The trend of high, moderate, low, and unsuitable potential is generally related to:
- Depth of occurrence of the depth limiting horizon (thus effective rooting depth);
- Texture (clay content) of the soil, as this relates to moisture holding capacity (readily and
plant available water);
- Permeability of the soil; and
- Salinity and sodicity of the soil.
The allocation of broad soil groups/soil forms to the various potentials is a guideline only, since
within a particular broad soil group/soil form, the soils tend to exhibit a large variation in
effective rooting depth. Thus the irrigation potential of each polygon of potential cropping soils
needs to be evaluated on its own merits.
The lower irrigation potential soils require more complex irrigation scheduling and drainage
control, while the lower yields make them unfeasible for irrigation purposes.

Red Earth cc Page 93
Borehole water quality must be carefully evaluated before considering irrigation. The EC of the
irrigation water should ideally be lower than 25mS/m (low salinity irrigation water), and
definitely not higher than 75mS/m (high salinity irrigation water).
8.2.10 OVERBURDEN/UNDERBURDEN ‘WASTES’ AND ‘NON-
WASTES’
‘Wastes’ (mining related) do not occur in the current green fields survey area.
The term ‘wastes’ has been selected (by the author for discussion purposes) to refer to
mining/processing/industrial/smelting related raw materials and by-products, that may have an
inherently high pollution potential under certain circumstances. These may include materials
such as discard, ash, potentially polluting carbonaceous spoil rock (particularly that which has
been crushed to a fine grade), ore fines, slag, pellets, slurry/tailings, coke/anthracite/coal, and
scrap.
The term ‘non-wastes’ has been selected (by the author for discussion purposes) to refer to
other (non-mining or -processing, or -industrial, or -smelting related) materials, that have an
inherently low pollution potential. These may include materials such as potentially non-
polluting deposited rock, rubble, concrete, stone chips, and soil (when mixed with the
aforementioned).
8.2.11 SOIL UTILIZATION (STRIPPING) GUIDE (Refer to Map 5; and Table 8.2.11)
As the opencast, infrastructure, storage, waste and containment facilities expand, the available
‘topsoil’ reserves must be stripped as per the depths indicated on Map 5 (Soil Utilization
[Stripping] Guide), and either utilised to ‘topsoil’ a feature undergoing rehabilitation or
stockpiled for later use (rehabilitation purposes). Map 5 summarizes Map 2a (Soil Mapping
Units) into broad soil groups, average usable depth, and available volume of existing ‘topsoil’
(suitable A- and B-horizons) material.
Table 8.2.11 (Summary of Soil Utilization [Stripping] Guide) is extracted from Map 5, and
summarizes the information for the survey area (Operational Area).
Table 8.2.11 shows that 16 389 904m³ of usable (high to low-unsuitable suitability) ‘topsoil’
(suitable A- and B-horizons) is present in-situ in the Operational Area.
Suitable broad soil groups for rehabilitation ‘topsoiling’ purposes (surface placement) are as
follows (descending order of suitability) [types i - iii preferred]:
i) Red apedal, very high suitability,
ii) Yellow-brown apedal (and Neocutanic), high suitability,
iii) Carbonate (Py, Ky, and Mp soil forms only), high suitability, and
iv) Pedocutanic (‘red’ colours only), moderate-low suitability.
The following broad soil groups are not recommended for surface placement, but may be
utilised further down in the rehabilitated profile:

Red Earth cc Page 94
v) Carbonate (Ag, Ad, Pr, Mu, Br, Cg soil forms only), very low to unsuitable (saline), and
vi) Shallow, Hydromorphic, and Pedocutanic (‘grey’ colours), very low to unsuitable (Shallow-gravelly/rocky;
Hydromorphic and Structured-bleached).
The following broad soil groups are recommended for sealing purposes overlying/underlying a
potentially-polluting rehabilitation feature. The ‘seal’ layer should ideally overlie rehabilitated
pollution control/return water/process water dams, evaporation ponds, slurry/tailings dams, and
potentially polluting dumps (e.g. carbonaceous discard dumps and ash dump) at the time that
these features become redundant and are rehabilitated. The seal layer should also underlie these
features at the time of their construction, and also underlie the base of the dirty water
gullies/drains/canals.
vii) Hydromorphic (G- and B-horizons) and Pedocutanic (B-horizon), highly suited to this purpose.
All of these ‘topsoils’ must be stripped, stockpiled and utilised for rehabilitation purposes (in
the specified manner). However, ‘topsoil’ types i) - iv) are the most suitable, and must be
stripped, stockpiled and utilised separately to ‘topsoil’ types v) - vii); the aforementioned being
due to their relative surface versus sub-surface placements. The former ‘topsoil’ types must be
replaced at the surface, and where available volume allows, on top of the latter ‘topsoil’ types.
Furthermore, the A-horizon material should ideally be replaced above the B-horizon material
wherever possible.
The ‘topsoil’ types (vii) utilised for sealing purposes (compacted- ‘remoulded’ layer), must
thus also be stripped, stockpiled and utilised separately to the other ‘topsoil’ types.
Recommendations regarding the stripping, stockpiling, suitability and utilization of ‘topsoil’
material are further described in sub-sections of this Specialist Study Report.
These ENVIRONMENTAL MANAGEMENT PLAN sub-sections include the following:
Section 11 (TECHNICAL DETAILS OF MANAGEMENT MEASURES); and specifically
Sub-Section 11.8 (SUITABLE ‘TOPSOILING’ MATERIALS), and Sub-Section 11.9
(SEQUENCE OF REHABILITATED HORIZONS).
The ‘soft’s’ materials (weathering rock = saprolite, soft carbonate horizon, and hardpan
carbonate horizon) must be stockpiled separately from the ‘topsoil’ on the one hand and hard
overburden rock on the other. This is because the ‘soft’s’ material will probably be accessible
to plant roots, when it is replaced as a layer between the underlying rock/spoil/discard/‘wastes’
and the surface ‘usable’ ‘topsoil’. Furthermore, these ‘soft’s’ materials (particularly the
hardpan carbonate and soft carbonate horizons, as well as neocarbonate B-horizons) can
perform a useful function in that they can be placed as a breaker layer (to intercept the upward
capillary movement of acid water from the pit) between the weathered discard materials and
the ‘usable’ ‘topsoil’.

Red Earth cc Page 95
Table 8.2.11: Summary of Soil Utilization (Stripping) Guide
Map
Notation
Broad Soil
Group
Soil Form (South
African
Taxonomic
System)
18+
>180
12+
>120
12
120cm
11
110cm
10
100cm
9
90cm
8
80cm
7
70cm
6
60cm
5
50cm
4
40cm
3
30cm
2
20cm
1
10cmha
% of
total
area
m3
% of
total
volume
M
Mineral Soils
(Red apedal,
Yellow-brown
apedal, and
Neocutanic)
Hu, Li; Cv, Gc; Tu 17.26 18.52 11.05 31.68 113.10 296.00 183.74 124.47 140.44 383.76 78.81 4.03 0.37 77 1403.22 51.15 10239695 62.48
TPedocutanic (i.e.
Structured)Sw, Se, Bo 8.41 4.42 264.75 177.13 36.71 1.07 29 492.48 17.95 3492439 21.31
B CarbonatePy, Ky, Mp; Ag,
Ad, Pr, Mu, Br, Cg4.03 34.51 9.77 20.03 10.81 7.86 1.25 14.75 4.24 43.89 10.77 23 161.92 5.90 1039978 6.35
SShallow (i.e
Lithosols)Ms, Gs, Dr 254.15 313.72 28.76 38 617.15 22.49 1500742 9.16
H
Hydromorphic
(also including
Pan areas)
Ka, We (and
usually Ka in Pan
areas)
1.66 49.32 13.43 48 64.41 2.35 117049 0.71
Pond 3 0.47 0.02
District
Road1 3.95 0.14
219 2743.59 100.00 16389904 100.00
District Road (Dirt)
TOTAL (SOIL UTILIZATION [STRIPPING] GUIDE)
Summary of Soil Utilization (Stripping) Guide
Broad Soil Group Soil Depth and Area
Count
Area Volume
Pond (and man-made earth Wall) constructed in a non-wetland area

Red Earth cc Page 96
8.2.12 REHABILITATION TOPSOIL BUDGET (Refer to Map 5; and Table 8.2.11)
All soil (suitable and unsuitable) stripped must be replaced on the relevant feature during
rehabilitation. This is due to Government Regulations (R537 of 21 March 1980), which
require that all ‘topsoil’ (as defined – generally suitable A-, B- and C-horizons) removed
be replaced on the disturbed surface during rehabilitation.
The unsuitable (for rehabilitation purposes) soil must be replaced below the suitable ‘topsoil’.
In the survey area, the unsuitable soil materials include the following: hard rock, weathering
rock, hard plinthic B-horizon, neocarbonate B-horizon, hardpan carbonate horizon, soft
carbonate horizon, soft plinthic B-horizon, G-horizon, unconsolidated material with signs of
wetness, and unspecified material with signs of wetness. These materials can perform a
useful function in that they can be placed as a breaker layer (to intercept the upward capillary
movement of polluted or acid water) between the rehabilitated feature and the ‘usable’
‘topsoil’.
(i) Rehabilitation Scenario (building rubble, removed features, and
opencast areas) [not intentionally compacted] [i.e. rehabilitated ‘topsoiled’ areas overlying the footprints of all demolished/removed
man-made features not included in scenario (ii)]
This scenario applies to the rehabilitation of the footprints of all of the sites of the
demolished/removed/levelled man-made facilities/features upon closure: e.g.
infrastructure / buildings, roads, ‘non-waste’ prepared surfaces/piles/banks,
excavations; re-graded opencast areas; and the sites of removed rock dumps (or piles of
material) / removed overburden or underburden ‘waste’ layers / removed ‘topsoil’
stockpiles.
Ideally, in the rehabilitated scenario, at least the same percentage of arable and grazing land
should exist as were present before disturbance. All of the suitable ‘topsoiling’ materials must
be utilised for rehabilitation purposes in the top 0.6m (arable), 0.25m (grazing) and 0.15m
(wilderness and wetland/riparian). The mixing of suitable (‘usable’ ‘topsoil’) / unsuitable
(‘non-usable’ soil and other) materials in this zone must be avoided.
Although the land capability (Map 3a) and soils (Map 2a) will have been destroyed (wholly
or partially) in disturbed areas post-mining, their pre-disturbance status will be clear, given
the trends on the periphery. These clearly interpretable pre-disturbance land capabilities and
soils will form the basis for the rehabilitation (i.e. ‘topsoiling’ depth) that must take place in
these areas. If however the man-made feature is removed, exposing the original in-situ soils,
then ‘topsoiling’ will not be required. Opencast areas should preferably be rehabilitated to the
pre-mining land capability depth standard. In areas where the aforementioned is not possible,
then these areas must be rehabilitated as per the grazing capability class depth standard,
which is 0.25m of suitable ‘topsoil’ material.
Based on the volume (16 389 904m³) of available ‘topsoil’ reflected on Map 5 (Soil
Utilization [Stripping] Guide) and in Table 8.2.11 (Summary of Soil Utilization [Stripping]

Red Earth cc Page 97
Guide), then the following area would be able to be rehabilitated to the post-
mining/disturbance arable capability classes (albeit to a lower production potential):
- Arable (‘topsoiling’ depth: 0.60m) = 2731ha.
However, not all areas will need to be rehabilitated to the arable depth class standard, as
determined by the pre-mining/disturbance capability class. Thus, many areas will be
‘topsoiled’ to a lesser depth of 0.25m or 0.15m (Grazing versus Non-Grazing capability class
depth standard).
Furthermore, the extent of the impacted (and thus rehabilitated) footprint will obviously
occupy a far lesser extent than the entire Operational Area (2743.59ha).
Thus, available ‘topsoil’ is in more than abundant supply. The Red apedal, Yellow-
brown apedal, Neocutanic, and Carbonate (Py, Ky and Mp soil forms only) broad soil
groups are preferred for rehabilitation ‘topsoiling’ purposes.
(ii) Rehabilitation Scenario [compacted -‘remoulded’ ‘seal’ layer]
[i.e. rehabilitated ‘topsoiled’ (non-compacted ‘topsoil’) areas; overlying a compacted -
‘remoulded’ soil ‘seal’ layer; overlying a potentially-polluting rehabilitated feature]
This scenario applies to the rehabilitation of all of the sites of potentially polluting
features upon closure. The ‘seal’ layer should ideally overlie rehabilitated pollution
control/return water/process water dams, evaporation ponds, slurry/tailings dams, and
potentially polluting dumps (e.g. carbonaceous discard dumps and ash dump) at the
time that these features become redundant and are rehabilitated. The seal layer should
also underlie these features at the time of their construction, and should also underlie
the base of the dirty water gullies/drains/canals. Features with a high pollution potential
must be overlaid by an impermeable membrane.
Redundant features, the material from which is not required in the process in the future, must
be removed from where it is no longer required, and transported to a designated facility or
dumping area (including the pit), which must in turn be ‘rehabilitated’. Redundant
features/materials will contribute to soil/water pollution since rainwater will percolate
through these materials (leading to acid rock drainage, and dissolving pollutants), and
thereafter into the underlying/surrounding soils and water-tables.
To limit the infiltration of rain/waste water into/through potential pollution sources, such
features must be sealed with a layer of compacted -‘remoulded’ vertic (ideally) soil
(immediately overlying the feature).
The compaction of the seal layer to a high level will lead to a layer with a low to very low
coefficient of permeability that is effective at limiting infiltration. From the nomograph point
of view, the permeability of this controlling horizon should be slow (0.36 - 3.6mm/hour) to
very slow (<0.36mm/hour). It should be possible to achieve a slow permeability by using
soils of the hydromorphic (G- and B-horizons) and pedocutanic (B-horizon) broad soil
groups.
These soils generally have the following textures:

Red Earth cc Page 98
- Pedocutanic soils: clay to sandy-clay-loam textures (clay content approximately 55 - 30%),
and
- Hydromorphic soils: sandy-loam to clay textures (clay content approximately 15 - 55%).
The clay to sandy-clay subsoils (clay content approximately 55 - 30%) of the aforementioned
soils are suitable materials for utilization as the compacted ‘seal’.
The compacted layer must in turn be ‘topsoiled’ with at least 0.25m (grazing capability class
depth standard) [but preferably more - arable depth standard] of soil material (relatively
undisturbed and non-compacted). This ‘topsoil’ layer must be ameliorated to optimize soil
fertility, and thereafter re-vegetated.
Those of the pollution control/return water dams, slurry dams, evaporation ponds, discard
dumps and ash dumps that remain in perpetuity, must be rehabilitated by re-grading (i.e. re-
shaping/re-sloping) the side slopes to an acceptable maximum slope (from the soil erosion
perspective), ‘topsoiling’, and re-vegetating.
Table 8.2.11 (Summary of Soil Utilization [Stripping] Guide) indicates that the following
volumes of suitable ‘topsoil’ material are available for the construction of compacted-‘re-
moulded’ seals in the Operational Area:
- Pedocutanic: 3 492 439m³, and
- Hydromorphic: 117 049m³.
Thus, material for sealing purposes is in more than abundant supply. The Pedocutanic
B-horizons and Hydromorphic G- and B-horizons must be utilised.

Red Earth cc Page 99
8.3 LAND CAPABILITY BASELINE
8.3.1 LAND CAPABILITY REQUIREMENTS (Refer to Map 3; and Tables 8.3.1a and 8.3.1b)
Land capability classes were determined using the guidelines outlined in the following
document produced by The Chamber of Mines of South Africa / CoalTech: Guidelines for
the Rehabilitation of Mined Land (November 2007). The aforementioned guidelines were
extracted (unchanged) from the following document produced by The Chamber of Mines of
South Africa: Handbook of Guidelines for Environmental Protection - The Rehabilitation of
Land Disturbed by Surface Coal Mining in South Africa (volume 3, 1981). A summary of the
land capability classes is presented in Table 8.3.1a (Land Capability Requirements).
Table 8.3.1(a): Land Capability Requirements
Criteria for Wetland Land with organic soils or
A horizon that is gleyed throughout more than 50 % of its volume and is significantly thick, occurring within
750mm of the surface.
{Note: The DWAF definition (DWAF. Edition 1, September 2005) has now superseded this definition, and
instead considers a wetland to occur if the soil wetness indicator occurs within 500mm of the surface.
Exceptions are the Champagne, Rensburg, Katspruit and Willowbrook forms, which may be of any depth. The
topsoils of the former two forms are frequently deeper than 500mm}
Criteria for Arable Land Land, which does not qualify as a wetland
The soil is readily permeable to the roots of common cultivated plants to a depth of 750mm
The soil has a pH value of between 4.0 and 8.4
The soil has a low salinity and SAR
The soil has a permeability of at least 1.5mm per hour in the upper 500 mm of soil
The soil has less than 10 % (by volume) rocks or pedocrete fragments larger than 100mm in diameter in the
upper 750mm
Has a slope (in %) and erodibility factor (K) such that their product is <2.0
Occurs under a climatic regime, which facilitates crop yields that are at least equal to the current national
average for these crops, or is currently being irrigated successfully
Criteria for Grazing Land Land, which does not qualify as wetland or arable land
Has soil, or soil-like material, permeable to roots of native plants, that is more than 250mm thick and contains
less than 50 % by volume of rocks or pedocrete fragments larger than 100mm
Supports, or is capable of supporting, a stand of native or introduced grass species, or other forage plants,
utilizable by domesticated livestock or game animals on a commercial basis
Criteria for Non-Grazing (Wilderness)* Land Land, which does not qualify as wetland, arable land or grazing land.
*Note that the term “Wilderness”, which was in common usage in South Africa due to its erroneous definition in
the 1981 Chamber of Mines guidelines, should in the authors opinion no longer be used. The definition of
“wilderness” is globally accepted to be land which has not been impacted upon by human development or settled
agricultural or industrial activities. The aforementioned is not the case in areas overlaid by ‘wastes’, or
underlain by a pollution plume (as indicated by degraded vegetation).

Red Earth cc Page 100
A soil must meet all of the requirements specified in Table 8.3.1a to qualify for the respective
Land Capability class.
A further document was utilised to subdivide the wetlands into three classes
(permanent/semi-permanent, seasonal and temporary), as well as to identify riparian areas.
The aforementioned document is entitled ‘A Practical Field Procedure for Identification and
Delineation of Wetlands and Riparian Areas’, and is published by the Department of Water
Affairs and Forestry (Edition 1, September 2005). For further information refer to Section
8.3.2 (WETLAND CLASSIFICATION / DELINEATION AND RIPARIAN AREAS) of our
current report document.
Table 8.3.1b (Summary of Pre-Mining Land Capability) is extracted from Map 3a (Pre-
Mining Land Capability), and summarizes the information for the Operational Area.

Red Earth cc Page 101
Table 8.3.1(b): Summary of Pre-Mining Land Capability
ha % ha %
Arable A Arable [Effective Rooting Depth ERD > 75cm, non-saline, non-sodic, non-rocky] 37 825.10 30.07 825.10 30.07
G-A Grazing transitional Arable [ERD 60-70cm, non-saline, non-sodic, non-rocky] 7 93.93 3.42
G Grazing [ERD < 75cm, non-saline, non-sodic, non-rocky] 53 941.75 34.33
Gb Grazing [ERD usually > 75cm, probably saline] 9 60.77 2.21
Gc Grazing [ERD usually > 75cm, surface capping evident] 13 186.37 6.79
'Non-Grazing' L 'Non-Grazing' ('Wilderness') [ERD < 25cm, occasionally rocky surface] 42 550.71 20.07 550.71 20.07
Wp 7 13.52 0.49
Pan 23 3.96 0.14
Pan.W 2 1.02 0.04
WsWetland (Seasonal) [ERD 20-30cm; generally Westleigh form, occasionally Sepane and Glenrosa
forms]18 55.78 2.03
Wt Wetland (Temporary) [ERD 25-50cm; Sepane and Tukulu forms] 4 6.27 0.23
Pond Pond (and man-made earth Wall) constructed in a non-wetland area 3 0.47 0.02 0.47 0.02
District Road District Road (Dirt) 1 3.95 0.14 3.95 0.14
219 2743.60 100.00 2743.59 100.00TOTAL (LAND CAPABILITY)
'Other' (Man-
made)
Land Capability Summary
Land Capability
Wetland
Map Notation Description CountArea
80.55 2.94
Grazing 1282.81 46.76
Wetland (permanent) [ERD < 10cm, generally Katspruit form]

Red Earth cc Page 102
8.3.2 WETLAND CLASSIFICATION / DELINEATION AND
RIPARIAN AREAS (Refer to Map 3b; and Tables 8.3.2a and 8.3.2b)
Wetlands and their associated Riparian areas are generally regarded as especially sensitive
landscapes under statutory protection, and as such must not be disturbed, polluted, cultivated
or overgrazed without a licence. Such areas have a high significance from a preservation
point of view, since they perform important hydrological functions, and are major
contributors to the bio-diversity of an area.
Wetlands:
A wetland is defined by the South African National Water Act 36 of 1998 as follows:
Land that is transitional between terrestrial and aquatic systems where the water-table is
usually at or near to the surface or the land is periodically covered with shallow water, and
which under normal circumstances supports or would support vegetation typically adapted to
life in saturated soil.
Given the aforementioned definition, non-wetland areas have in the current report document
been referred to as ‘terrestrial’ areas.
The wetland classification process is presented for information purposes.
The wetland delineation procedure is based on the following document: ‘A Practical Field
Procedure for Identification and Delineation of Wetlands and Riparian Areas’, published by
the Department of Water Affairs and Forestry (DWAF) [Edition 1, September 2005]. This
document was in turn largely based on the following document: ‘Wetland and Riparian
Habitats: A Practical Procedure for their Identification and Delineation’ (2000), by The
Wetland and Riparian Habitat Working Group (Forest Owners Assoc. S.A.). Both of these
documents were utilised in the current delineation procedure. Table 8.3.2a (Wetland
Indicators and Corresponding Wetland Types) summarizes the major points from the latter
document.
The aforementioned documents have superseded the wetland capability class definition of
The Chamber of Mines. This is because The Chamber of Mines definition is both too broad
(no subdivision for permanent/semi-permanent, seasonal and temporary wetlands), and
considers signs of wetness at depths of up to 0.75m, (as opposed to 0.5m, which is the current
practice) below the soil surface.
The wetland delineation procedure makes use of four wetland indicators.
i) Soil form indicator
For a site to be classified as a wetland in the first place, it must display a soil form
indicator. These include any one of a list of soil forms, which are associated with
prolonged and frequent saturation, such soils being termed hydromorphic soils.
ii) Soil wetness indicator
These morphological ‘signatures’ include grey colours in the soil matrix, and/or mottling
within the top 0.5m of the soil surface, these morphological ‘signatures’ having
developed in the soil profile as a result of prolonged and frequent saturation. This depth

Red Earth cc Page 103
has been chosen since experience internationally has shown that frequent saturation of
the soil within 0.5m of the surface is necessary to support hydrophytes (plants typically
found in wet habitats). Exceptions to this rule are the Champagne, Rensburg,
Willowbrook and Katspruit soil forms, where it is not necessary for the profile or horizon
to qualify as hydromorphic, since the topsoil horizon may be thicker than 0.5m. The
topsoils of the aforementioned forms are usually dark in the permanent wetness zone,
due to the accumulation of organic matter. In the case of the Champagne form, the
organic carbon content is over 10 %.
The wetland indicators of soil form and soil wetness factor are of over-riding importance
since soil characteristics (soil form and soil wetness indicators) have often developed
over hundreds of years. The next two wetland indicators should be used as guidelines
only (for reasons which will be explained).
iii) Terrain unit indicator
This practical index identifies valley-bottom units, as well as depressions in crest,
midslope and footslope positions, as the most likely sites for wetlands to occur.
However, groundwater discharge may also take place through seeps in non-depression
areas on mild to steep slopes, these seeps also being classified as wetlands.
iv) Vegetation indicator
Hydrophytes are plant species, which have developed mechanisms to grow, compete,
reproduce and persist in anaerobic soil conditions. Obligate hydrophytes are only found
in wetlands, while facultative hydrophytes can occur in both wetland and non-wetland
areas.
Thus vegetation in an untransformed (virgin) state is a helpful field guide in finding the
boundary of a wetland. However, it should be borne in mind that the original vegetation
might have been transformed or destroyed as a result of previous agricultural, land use,
drainage or mining practices.
Once the site has been classified as a wetland, the four Wetland Indicators are used to
further subdivide the wetland into one of three types, viz.: permanent/semi-permanent,
seasonal or temporary.

Red Earth cc Page 104
Table 8.3.2(a): Wetland Indictors and Corresponding Wetland Types
WETLAND
INDICATOR
WETLAND TYPE
Permanent Seasonal Temporary
‘Old Chamber of
Mines wetland
definition cut-off
depth’. Now Grazing
capability class.
Soil Form
Katspruit, Rensburg,
Champagne, Willowbrook
(ANY VEGETATION)
Any form, which incorporates wetness at the Form or Family level.
Soil Wetness
Factor
Wetness all year round
Wetness long
periods
(3-10 months p.a.) at
< 50 cm
Wetness short
periods
(< 3 months p.a.)
at < 50 cm
Wetness short
periods
(< 3 months p.a.)
at 50-75 cm
Vegetation
Obligate Wetland species
accounting for
> 50 % of aerial cover
Obligate/Facultative
Wetland species
accounting for
> 50 % of aerial
cover
Facultative and
Facultative Dryland
species. (Facultative
Wetland species
accounting for < 50
% of aerial cover)
Facultative Dryland
and/or Facultative
species mandatory.
Slope Position Valley-bottom mandatory Typically lower
footslope
Typically upper
footslope
Typically lower
midslope
VEGETATION DEFINITIONS:
Obligate Wetland species – almost always grow in wetland (> 99 % of occurrences)
Facultative Wetland species – usually grow in wetlands (67 - 99 % of occurrences) but are
occasionally encountered in non-wetland areas.
Facultative species – are equally likely to grow in wetlands (34 – 66 % of occurrences)
and
non-wetland areas.
Facultative Dryland species – usually grow in non-wetland areas but sometimes grow in wetlands
(1 - 34 % of occurrences)
NOTE: The Wetland Indicators of soil form and soil wetness factor are of over-riding importance. This is
because the original vegetation may have either been removed or transformed by previous land use, drainage or
mining practices.
Riparian Areas:
Riparian habitat (as defined by the South African National Water Act 36 of 1998) includes
the physical structure and associated vegetation of the areas associated with a watercourse
which are commonly characterized by alluvial soils, and which are inundated or flooded to an
extent and with a frequency sufficient to support vegetation of species with a composition
and physical structure distinct from those of adjacent land areas.
DWAF (Edition 1, September 2005) states that riparian areas: are associated with a
watercourse; contain distinctly different plant species than adjacent areas, and contain species
similar to adjacent areas but exhibiting more vigorous or robust growth forms; and may have
alluvial soils.

Red Earth cc Page 105
Survey Area:
The wetlands (thus also riparian areas) encountered within the survey area indicated on Map
3b (Wetlands) [and Map 3a - Pre-Mining Land Capability] and are summarised in Table
8.3.2b (Summary of Wetlands).
Within the Operational Area, the soil survey indicated the following:
23 pans (3.96ha, 0.14% of Operational Area);
2 pans further dammed up by a man-made wall (1.02ha, 0.04%); and
further wetland areas (permanent 13.52ha, 0.49%; seasonal 55.78ha, 2.03%; and temporary
6.27ha, 0.23%).
Thus total wetlands amount to 80.56ha or 2.94% of the Operational Area (2743.59ha).
These wetlands are ephemeral in nature; dissipate a short distance after they
commence; are generally underlain by solid rock or hard plinthite (ferricrete) at
approximately 40-70cm below the surface; are not connected to streams and thus do not
constitute catchment areas; and are commonly occurring features in the surrounding
areas in general.
Thus, the loss of these wetland areas due to mining related activities is deemed acceptable
by the author.
An ephemeral stream is defined in Appendix III of our report as follows: “A stream or portion
of a stream that flows only in direct response to precipitation, and receives little or no water
from springs or no long continued supply from snow or other sources, and its channel is at all
times above the water table”.
Anthropogenic (i.e. due to the activities of man - seepage/runoff/discharge from man-made
features) wetlands were not encountered. However, three man-made ponds occur in terrestrial
(non-wetland) areas.
The wetlands in the Operational Area are further described in the following Sections of the
current report:
Section 8.4.2 (BROAD VEGETATION COMMUNITIES); Sub-Point g) Hydromorphic
(Wetland) Soils; and
Section 8.5 (SENSITIVE LANDSCAPES); Sub-Points: i) Natural Wetland Soils, ii) Natural
Wetland Drainage Features, and iii) Wetland/Riparian Vegetation.

Red Earth cc Page 106
Table 8.3.2(b): Summary of Wetlands
ha % ha %
Wp 7 13.52 0.49
Pan 23 3.96 0.14
Pan.W 2 1.02 0.04
WsWetland (Seasonal) [ERD 20-30cm; generally Westleigh form, occasionally Sepane and Glenrosa
forms]18 55.78 2.03
Wt Wetland (Temporary) [ERD 40-50cm; Sepane and Tukulu forms] 4 6.27 0.23
54 80.56 2.94 80.55 2.94
'Other' (Man-
made)Pond Pond (and man-made earth Wall) constructed in a terrestrial (non-wetland) area 3 0.47 0.02 0.47 0.02
TOTAL (WETLANDS)
Wetland
Wetland (Permanent) [ERD < 10cm, generally Katspruit form].
Note: Wp (Wetland Permanent); and Pan.W (Pan displaying a man-made wall in order to increase
the water storage capacity)
80.55 2.94
Wetland Summary
Land Capability Map Notation Description CountArea

Red Earth cc Page 107
8.4 LAND USE BASELINE
(Refer to Map 4; Table 8.4; and Figure 8.1.1)
The present land use in the Operational Area is presented on Map 4 (Present Land Use), and
summarised in Table 8.4 (Summary of Present Land Use).
The regional land use is discussed in Section 8.1.8 (REGIONAL LAND USE), and is evident
in Figure 8.1.1 (Location and Topography of Study Area).
The land use both within and immediately adjacent to LCPP is dominated by game
ranching/farming and eco-tourism, and to a lesser extent cattle ranching. Thus occasional-rare
farm related structures also exist including homesteads, residences, hunting accommodation,
labour accommodation, farm sheds, workshops, boreholes, windmills, reservoirs, water tanks,
and water/feeding troughs. Occasional lands are also spread out throughout the area, the
aforementioned probably producing dryland hay and other types of livestock feed on a small
scale.
8.4.1 MAN-MADE FEATURES (Refer to Map 4; and Tables 8.4 and 8.4.1)
The man-made features and structures within the Operational Area are presented on Map 4
(Present Land Use), and summarised on the corresponding summary Tables 8.4 (Summary of
Present Land Use) and 8.4.1 (Summary of Man-Made Structures). The former Table indicates
the district dirt road, three ponds, eight farmyards, four cattle kraals, and one citrus orchard;
while the latter Table indicates a variety of human/ranching related structures. Both Tables
also indicate the number (‘count’) of relevant features/structures.
Map 4 also indicates numerous tracks on the various farms, as well as previously cultivated
areas that are concentrated at six locations.

Red Earth cc Page 108
Table 8.4: Summary of Present Land Use
ha % ha %
Terrestrial Natural Bush Bush, Savannah, occasional Grassland; and frequent Bare Patches 2 2575.59 93.88 2575.59 93.88
Wp Riparian vegetation 7 13.52 0.49
Pan Bare surface, Standing water during rainy season 23 3.96 0.14
Pan.W Bare surface, Standing water during rainy season 2 1.02 0.04
Ws Riparian vegetation 18 55.69 2.03
Wt Riparian vegetation 4 6.27 0.23
Wetland in Farming
related areaWs.Farmyard Seasonal Wetland passing through a Farmyard 1 0.09 0.00 0.09 0.00
Cp Cultivated Previously (occasionally long ago) 12 79.67 2.90
Orchard Citrus 1 0.05 0.00
Kraal Cattle Kraal 4 0.23 0.01
Farmyard Farmyard (bare, trees, or open; high traffic areas) 8 3.09 0.11
Pond Pond (and man-made earth Wall) constructed in a non-wetland area 3 0.47 0.02 0.47 0.02
District Road District Road (Dirt) 1 3.95 0.14 3.95 0.14
86 2743.60 100.00 2743.60 100.00
Wetland Natural 80.47 2.93
Land Use Summary
Group Map Notation Description CountArea
'Other' (Man-made).
Terrestrial
TOTAL (LAND CAPABILITY)
Terrestrial Farming /
Ranching Related Area
Note: Refer to the accompanying legend for man-made Structures
3.0383.03

Red Earth cc Page 109
Table 8.4.1: Summary of Man-Made Structures
8.4.2 BROAD VEGETATION COMMUNITIES (Refer to Map 4; and Table 8.4)
The vegetated areas are presented on Map 4 (Present Land Use), and summarised in Table
8.4.1 (Summary of Present Land Use).
Although degraded or transformed in sections, the vegetated areas include the following:
- Bush (or Savannah) in Terrestrial (non-wetland) areas: 2575.59ha (93.88 % of Operational
Area); and
- Wetland/Riparian Vegetation in Wetland areas: 80.47ha (2.93 %); and
- Total Vegetated area: 2656.06ha (96.81 %).
Soil texture in the Operational Area varies as follows:
Man-Made Structures Count
Borehole/Pump 1
Borehole 2
Chalet 2
Construction 1
Dip 2
Garage 1
House 11
House & Braai 2
IR (i.e. Informal House Ruins) 3
Lounge/Kitchen 1
Pool 1
Reservoir 7
Reservoir? 2
Residence 5
Rondawel 4
Shed 5
Silo 2
Tank 1
Tank (JoJo) 4
Tank (JoJo) & Solar 1
Tower 1
Trough 5
Trough.F (i.e. Trough for Feed) 8
Trough.F (x7) (i.e. Trough for Feed - 7 troughs) 1
Trough.W (i.e. Trough for Water) 3
U (i.e. Undifferentiated / Unknown) 16
Windmill (or WM) 3
Workshop 1
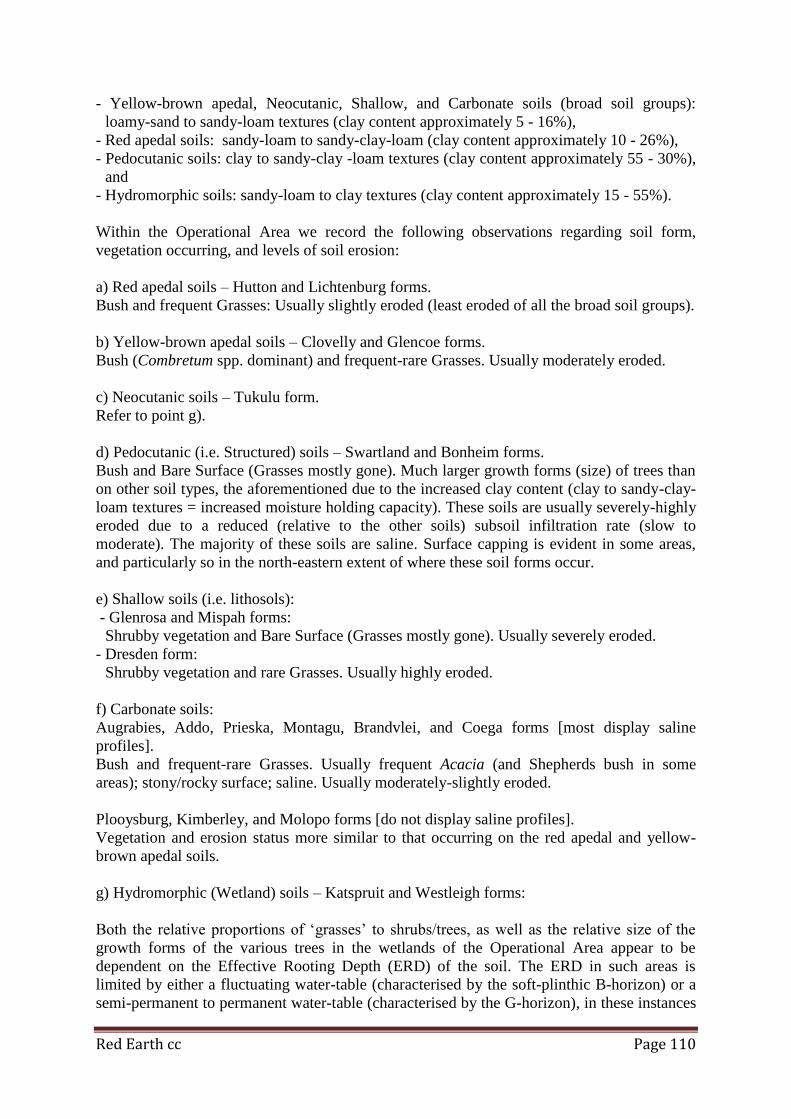
Red Earth cc Page 110
- Yellow-brown apedal, Neocutanic, Shallow, and Carbonate soils (broad soil groups):
loamy-sand to sandy-loam textures (clay content approximately 5 - 16%),
- Red apedal soils: sandy-loam to sandy-clay-loam (clay content approximately 10 - 26%),
- Pedocutanic soils: clay to sandy-clay -loam textures (clay content approximately 55 - 30%),
and
- Hydromorphic soils: sandy-loam to clay textures (clay content approximately 15 - 55%).
Within the Operational Area we record the following observations regarding soil form,
vegetation occurring, and levels of soil erosion:
a) Red apedal soils – Hutton and Lichtenburg forms.
Bush and frequent Grasses: Usually slightly eroded (least eroded of all the broad soil groups).
b) Yellow-brown apedal soils – Clovelly and Glencoe forms.
Bush (Combretum spp. dominant) and frequent-rare Grasses. Usually moderately eroded.
c) Neocutanic soils – Tukulu form.
Refer to point g).
d) Pedocutanic (i.e. Structured) soils – Swartland and Bonheim forms.
Bush and Bare Surface (Grasses mostly gone). Much larger growth forms (size) of trees than
on other soil types, the aforementioned due to the increased clay content (clay to sandy-clay-
loam textures = increased moisture holding capacity). These soils are usually severely-highly
eroded due to a reduced (relative to the other soils) subsoil infiltration rate (slow to
moderate). The majority of these soils are saline. Surface capping is evident in some areas,
and particularly so in the north-eastern extent of where these soil forms occur.
e) Shallow soils (i.e. lithosols):
- Glenrosa and Mispah forms:
Shrubby vegetation and Bare Surface (Grasses mostly gone). Usually severely eroded.
- Dresden form:
Shrubby vegetation and rare Grasses. Usually highly eroded.
f) Carbonate soils:
Augrabies, Addo, Prieska, Montagu, Brandvlei, and Coega forms [most display saline
profiles].
Bush and frequent-rare Grasses. Usually frequent Acacia (and Shepherds bush in some
areas); stony/rocky surface; saline. Usually moderately-slightly eroded.
Plooysburg, Kimberley, and Molopo forms [do not display saline profiles].
Vegetation and erosion status more similar to that occurring on the red apedal and yellow-
brown apedal soils.
g) Hydromorphic (Wetland) soils – Katspruit and Westleigh forms:
Both the relative proportions of ‘grasses’ to shrubs/trees, as well as the relative size of the
growth forms of the various trees in the wetlands of the Operational Area appear to be
dependent on the Effective Rooting Depth (ERD) of the soil. The ERD in such areas is
limited by either a fluctuating water-table (characterised by the soft-plinthic B-horizon) or a
semi-permanent to permanent water-table (characterised by the G-horizon), in these instances

Red Earth cc Page 111
the depth limiting horizon occurring directly below the topsoil (A-horizon). The Katspruit
and Westleigh forms are relevant, the ERD varying from 0-10cm for the former, and 20-
40cm for the latter form.
The ERD may alternatively be limited by either a fluctuating or a semi-permanent to
permanent water-table that occurs directly below the B-horizon as the third soil horizon
(characterised by the unconsolidated material with signs of wetness, or the unspecified
material with signs of wetness horizons). Although the Sepane (Pedocutanic broad soil
group) and Tukulu forms (Neocutanic broad soil group) are not grouped with the
Hydromorphic soils, these soil forms constitute wetlands where the signs of wetness
(mottling and bleached colours) occur at <= 50cm below the soil surface.
Vegetation in lower wetland vlei or drainage line areas (i.e. wetland riparian vegetation):
- Katspruit form (ERD 0 - 10cm): bare surface in pan areas, or open ‘grasslands’ (frequently
with sedges) in the vleis surrounding a number of these areas;
- Westleigh form (ERD 20 - 30cm): savannah displaying small growth forms of trees in vlei
edge areas;
- Westleigh form (ERD 30 - 40cm): savannah or bush displaying medium growth forms of
trees in lower drainage line areas;
- Sepane and Tukulu forms (ERD 40 - 50cm): bush displaying large growth forms of trees in
lower to middle drainage line areas.
All of the aforementioned areas are usually slightly eroded.
Vegetation in upper non-wetland drainage areas, generally very slightly concave (i.e. also
riparian vegetation):
- Sepane and Tukulu forms, also other forms (ERD 60 - >150cm): dense bush displaying
large to very large growth forms of trees. The large to very large growth forms in these
areas occur where the signs of wetness occur too deeply below the soil surface (>50cm) to
be either classifiable as wetlands, or to be encountered with the soil auger (in many cases).
However, trees roots are able to access the moisture in such areas, either directly or by
capillary action, thereby resulting in the large to very large growth forms of the trees.
8.4.3 HUMAN SETTLEMENT (Refer to Map 4; and Tables 8.4 and 8.4.1)
Human settlement is indicated on Map 4 (Present Land Use), and is summarized in Tables
8.4 (Summary of Present Land Use) and 8.4.1 (Summary of Man-Made Structures).
Current human settlement within the Operational area is essentially comprised of the
following:
- Residences (i.e. main farmhouse) on each of the farms in the Operational Area (except
Garibaldi). Associated structures such as sheds, workshops, garages, rondawels, chalets,
windmills, boreholes, reservoirs, and water tanks are present in the immediate vicinity of
each of these sites; and
- Houses for guests or labour are frequently present in either the immediate vicinity of the
residences, or further away from these main settlement sites.
- Each of the residence or house sites is surrounded by an open area described on Map 4 as a
‘farmyard’.

Red Earth cc Page 112
Previous (but contemporary) settlement sites are described as Informal Ruins (‘IR’) on Map
4. These sites include brick and concrete rubble scattered around the relevant areas.
No signs of historical human settlement (e.g. kraal ruins, mud house floors, pottery, or Stone
Age chards) were encountered during the course of the soil survey.
8.4.4 HISTORICAL AGRICULTURAL PRODUCTION (Refer to Map 4; and Tables 8.4 and 8.4.1)
Ranching (game and cattle) and farming related activities within the Operational Area are
indicated on Map 4 (Present Land Use), and are summarized in Tables 8.4 (Summary of
Present Land Use) and 8.4.1 (Summary of Man-Made Structures).
a. Agriculture
Previous cultivation was identified at six locations, the aforementioned being comprised
of twelve distinct fields in terrestrial areas amounting to 79.67ha (2.90 % of Operational
Area). The majority of the cultivated areas are located within arable capability class areas
of the Hutton form, while others are located in grazing areas of the Clovelly form, and a
lesser number in non-grazing (wilderness) areas of the Glenrosa form.
These dryland fields were probably predominantly utilised to produce supplementary
feed for livestock in the past.
Ranching/farming related features and structures are discussed in Sections 8.4.1 (MAN-
MADE FEATURES) and 8.4.5 (EXISTING STRUCTURES).
Crop production is discussed in Section 8.2.8 (DRYLAND / IRRIGATED
PRODUCTION POTENTIAL).
b. Grazing and Browsing
The indigenous bush, savannah, ‘grasslands’ and wetlands were before the settlement of
man utilised by wildlife for both grazing (e.g. impala and zebra) and browsing (e.g.
kudu, giraffe, elephant and black rhino).
With the arrival of settlers and cattle, the massive reduction in wildlife populations,
regular burning to expand the grasslands, overstocking/overgrazing by cattle, reduced
grass basal cover and severe to moderate sheet erosion; the natural balance has been
completely changed. The degradation of the area has mostly occurred in the last 100
years.
The farms are now utilised for game ranching/farming and eco-tourism, and to a lesser
extent cattle ranching.
The farmers should completely discontinue burning for a good number of years, while
grazer stocking densities must be kept as absolutely low as possible; to give the land a
chance to ‘recover’ somewhat.
Red Earth cc Page 113
8.4.5 EXISTING STRUCTURES (Refer to Map 4; and Tables 8.4 and 8.4.1)
The existing man-made structures within the Operational Area are presented on Map 4
(Present Land Use), and summarised on the corresponding summary Tables 8.4 (Summary of
Present Land Use) and 8.4.1 (Summary of Man-Made Structures).
The former Table indicates the district dirt road, three ponds, eight farmyards, four cattle
kraals, and one citrus orchard; while the latter Table indicates a variety of human/ranching
related structures. Both Tables also indicate the number (‘count’) of relevant
features/structures.
8.4.6 EVIDENCE OF MISUSE (Refer to Maps 2a and 4)
a. Agriculture
Overgrazing and soil erosion are evident in the vast majority of the surveyed area, the
levels of sheet erosion being indicated on Map 2a (Soil Mapping Units).
The levels of overgrazing/soil erosion on the various farms generally appear to be as
follows (from most to least eroded): Grootgenoeg Ptn.1 (very highly eroded in many
sections), Honingshade (highly eroded), Grootgenoeg Ptn. 0 (moderately-highly),
Weltevreden Ptn. 0 (moderately-highly), Botmansdrift (moderately), Weltevreden Ptn. 1
(slightly-moderately), and Garibaldi (slightly). The current levels of grass basal cover are
closely correlated with the existing levels of soil erosion.
The levels of grass cover/erosion on the various broad soil groups appear to be as follows
(from most eroded to least eroded - related to topsoil permeability, depth to relatively
impermeable horizon, organic carbon content, and slope): shallow, pedocutanic, yellow-
brown apedal, neocutanic, hydromorphic, carbonate, and red apedal.
Severe soil sheet erosion occurs throughout almost the entirety of the area. At most sites,
soil losses of between approximately 5 - 15cm have occurred throughout approximately
40 - 80 % of the surface area, the only relatively non-eroded areas being those underlying
low vegetation such as small bushes and trees. The vast majority of the erosion appears
to have occurred in the relatively recent past, the result of the introduction of cattle
(mostly now gone), over-grazing, cycles of consecutive years of drought, consequent
relatively bare surfaces at the commencement of the rainy season, and then rain drop and
sheet erosion during heavy thunderstorms. Consequently grass cover generally occurs in
patches in the more protected sites, with larger relatively bare patches in-between.
Soil fertility and nutrient cycling will have been severely affected by the loss on average
of over half of the A-horizon, where organic matter (now mostly lost) is mostly
concentrated. Organic matter supplies greater than 99 % of total soil nitrogen and 33 -
67 % of total soil phosphorus, while humus, the active fraction of soil organic matter has

Red Earth cc Page 114
a very high CEC (between 150 and 300 cmol(+) kg-1) and can adsorb up to about 6 times
its own weight in water.
Burning must be discontinued in all areas by the ranchers/farmers, since the resultant loss
of mulch and organic matter will result in an increase in soil erosion, further disrupt the
nutrient cycle and reduce the moisture holding capacity of these already degraded
(eroded) topsoils.
Sequences of brush lines of woody material in combination with other obstacles must be
laid out along the contour in severely eroded areas to slow and trap runoff. Mowed
seeded grass should be laid out underlying the brush lines, in the hope of germination
and creating grass cover and habitat.
b. Mining, Processing and Industry
Evidence of misuse from the mining/processing perspective is not currently applicable in
the current green fields Study Area.
However, commonly occurring issues associated with existing mining/processing sites in
other areas are highlighted in the Sections mentioned in the next paragraph, so that the
same mistakes are avoided in the current potential project area.
Mitigation measures for the identified points are addressed in the following sections of
the report:
Section 9.2.2 (IMPACT SIGNIFICANCE RATING AND MANAGEMENT
MEASURES), and specifically Tables 9.2.2a-d; and
Section 11 (TECHNICAL DETAILS OF MANAGEMENT MEASURES), and
specifically Sub-Section 11.10 (POLLUTION).

Red Earth cc Page 115
8.5 SENSITIVE LANDSCAPES (Refer to Maps 2a, 3a, 3b and 4; and Tables 8.2.2, 8.3.1b, 8.3.2b and 8.4)
The soils within the survey area are indicated on Map 2a (Soil Mapping Units) and are
summarized in Table 8.2.2 (Summary of Soil Form). The wetlands within the survey area are
described in Section 8.3.2 (WETLAND CLASSIFICATION / DELINEATION AND
RIPARIAN AREAS), indicated on Maps 3a (Pre-Mining Land Capability) and 3b
(Wetlands), and are summarized in Tables 8.3.1b (Summary of Pre-Mining Land Capability)
and 8.3.2b (Summary of Wetlands). The vegetated areas within the survey area are indicated
on Map 4 (Present Land Use) and are summarized in Table 8.4 (Summary of Present Land
Use). Refer to the aforementioned for further information.
i) Natural Wetland Soils
Wetlands and their associated riparian areas are generally regarded as especially
sensitive landscapes under statutory protection, and as such must not be disturbed,
polluted, cultivated or overgrazed without a licence. Such areas have a high
significance from a preservation point of view, since they perform important
hydrological functions, and are major contributors to the bio-diversity of an area.
Within the Operational Area, the soil survey indicated the following: 23 pans (3.96ha,
0.14% of Operational Area); 2 pans further dammed up by a man-made wall (1.02ha,
0.04%); and further wetland areas (permanent 13.52ha, 0.49%; seasonal 55.78ha,
2.03%; and temporary 6.27ha, 0.23%). Thus total wetlands amount to 80.56ha or
2.94% of the Operational Area (2743.59ha). The Westleigh (dominant), Katspruit
(sub-dominant), and Rensburg (extremely rare) soil forms of the hydromorphic broad
soil group occur in these areas.
ii) Natural Wetland Drainage Features
A limited number of short disconnected slightly concave ephemeral drainage features
exist in the Operational area, these features being occupied by the aforementioned
natural wetland soils. Drainage gullies, streams and rivers do not exist in the
immediate area.
The free (uninterrupted) flow of water (surface and sub-surface) must be promoted in
all areas.
iii) Wetland/Riparian Vegetation
The main categories of wetland/riparian vegetation in the Operational Area are
described in Section 8.4.2 (BROAD VEGETATION COMMUNITIES). Riparian
vegetation must ideally be preserved for the following reasons: represents a major
contributor to the bio-diversity in any area; stabilizes drainage areas; limits and slows
runoff; traps sediments; and promotes evapotranspiration.
The wetland soils / wetland drainage features / wetland-riparian vegetation
occurring within the Operational Area are not deemed to represent fatal flaws
by the author for the following reasons:

Red Earth cc Page 116
ephemeral in nature; dissipate a short distance after they commence; are
generally underlain by solid rock or hard plinthite (ferricrete) at approximately
40-70cm below the surface; are not connected to streams and thus do not
constitute catchment areas; and are commonly occurring features in the
surrounding areas in general.
Thus, the loss of these wetland areas due to mining related activities is deemed
acceptable by the author.
iv) Erodible Soils
Despite the determined erosion slopes in Section 8.2.7 (EROSION HAZARD AND
SLOPE; In-Situ [Undisturbed] Soils), soil erosion is a major issue in the natural
vegetated areas.
Severe soil sheet erosion occurs throughout almost the entirety of the area. At most
sites, soil losses of between approximately 5 - 15 cm have occurred throughout
approximately 40 - 80 % of the surface area, the only relatively non-eroded areas
being those underlying low vegetation such as small bushes and trees. The vast
majority of the erosion appears to have occurred in the relatively recent past, the result
of the introduction of cattle (mostly now gone), over-grazing, burning, cycles of
consecutive years of drought, consequent relatively bare surfaces at the
commencement of the rainy season, and then rain drop and sheet erosion during heavy
thunderstorms. Soil fertility and nutrient cycling will have been severely affected by
the loss on average of over half of the A-horizon, where organic matter (now mostly
lost) is mostly concentrated.
The removal of grass cover leads to raindrop splash erosion by raindrops, whereby the
grass cover is not available to break raindrop energy. Thereafter, in the absence of
significant grass cover to slow and trap runoff, soil sheet erosion occurs. Furthermore,
the loss of mulch and organic matter due to fire or erosion (water and wind) reduces
the soils structural condition and moisture holding capacity, thereby making degraded
soils far more susceptible to erosion as they are in the current area.
The soils in the study area that are likely to be more sensitive to erosion than others
include the following:
- Pedocutanic soils, due to a slow-moderate subsoil permeability; and
- Shallow soils, due to a relatively impermeable (to water) depth limiting horizon
within 10 - 30cm below the soil surface, the aforementioned being either hard
plinthite (Dresden form) or hard rock (Mispah form).
Thus, both of these broad soil groups are prone to temporary waterlogging in the
topsoil after heavy or prolonged rainfall events, and thereafter ensuing surface runoff
and erosion.
v) Vegetative Cover
All soils are more susceptible to erosion when the vegetative cover (grass/trees) is
removed, or the litter layer is burnt.

Red Earth cc Page 117
Severe overgrazing and fire are the likely causes of the low grass basal cover and thus
severe to moderate levels of sheet erosion that occur throughout the majority of the
survey area. In eroded areas, grass cover generally occurs in patches in the more
protected sites, with larger relatively bare patches in-between.
The farmers should completely discontinue burning for a good number of years, while
grazer stocking densities must be kept as absolutely low as possible; to give the land a
chance to ‘recover’ somewhat. Rehabilitated areas must be correctly re-graded and re-
vegetated from the outset.
vi) Anthropogenic Moisture
Although anthropogenic moisture does not occur in the current green fields site, the
potential for the phenomenon is described in Section 11.10 (POLLUTION); Point A:
Polluted Water – Limitation/Prevention of Seepage in Waste-Water and Other
Disposal Facilities, Sub-Points: i) and ii).
The infiltration / seepage / runoff of ‘dirty’ water may take place in certain sections of
mining / raw material / processing / plant / dumping / containment areas during the
operational and closure phases of a project.
Measures must be taken to prevent/limit the infiltration of ‘dirty’ water into the soils,
and thereafter into the perched soil water-table, perched ‘ground’ water-table and
‘deeper’ groundwater-tables, and ultimately the streams in certain areas.
vii) Paleochannels and Naturally Buried Soils
No such soils were encountered.
Provided that potential future mining /processing/containment procedures are conducted
appropriately, then the impact to the soils/land capability/land use will be limited.
8.6 SITES OF CULTURAL AND ARCHAEOLOGICAL INTEREST (Refer to Map 4 and Table 8.4.1)
Sites of archaeological interest were not encountered in the current area.
Sites of cultural interest are indicated on Map 4 (Present Land Use), and are summarized in
Table 8.4.1 (Summary of Man-made Structures) in Section 8.4.1 (MAN-MADE
FEATURES) of the current report.
All of these contemporary structures are related to game and cattle ranching, eco-tourism, and
farming.
The identified sites will be forwarded to a heritage specialist for further investigation and
comment.
Red Earth cc Page 118
EIA AND EMP SECTIONS
9. IMPACT AND RISK ASSESSMENT (Refer to Tables 9.2.1(a-c), 9.2.2(a-d), 12, and 17)
9.1 IDENTIFICATION AND DESCRIPTION OF
TOPOGRPAHICAL IMPACTS
An Environmental Impact Assessment was performed for each of the project life-cycle
phases (i.e. construction phase, operational phase, decommissioning and post-closure phase),
for all the project related activities, to determine what the impact will be on the environment.
The Environmental Impact Assessment is compliant with the NEMA regulations.
Generally, the Impact Assessment method comprises of four parts:
Activity Identification;
Aspect Identification;
Impact Definition; and
Impact Evaluation.
These four parts are systematically addressed in the sections below. Firstly, the Activities
deemed to have a potential impact were identified and categorised to identify the Aspect
related to each Activity per life cycle phase. Afterwards, the Environmental Impact (Impact
Category and Impact Description) associated with the Aspect was defined and finally,
evaluated with reference to the Impact Assessment Methodology.
9.1.1 RELEVANT PROJECT ACTIVITIES
Activities as defined by the National Environmental Management Act 107 of 1998, means
policies, programmes, processes, plans and projects.
Activities associated with the project deemed to have a potential impact are listed in the top
rows of each of the numerous Sub-Tables associated with the following main Tables:
Table 9.2.2(a): Impact Significance and Management Measures (Construction -Phase);
Table 9.2.2(b): Impact Significance and Management Measures (Operational Phase);
Table 9.2.2(c): Impact Significance and Management Measures (Decommissioning and
Closure Phase); and
Table 9.2.2(d): Impacts and Management Measures (Post-Closure Phase).
[i.e. This section is comprised of listing the Activities and Aspects identified which could
potentially have an impact on the environmental components relevant to our study. The
Impact Category (e.g. Soil Distribution, Soil Quality, and Soil Contamination) and Impact

Red Earth cc Page 119
Description (e.g. Soil Contamination due to spillages and blown dust) relevant to the various
Activities and Aspects will also be considered].
Separate Activity lists have not been produced within current Section 9.1.1 to limit the
duplication of information.
9.1.2 IDENTIFICATION OF ASPECTS PER LIFE CYCLE PHASE
An Environmental Aspect is the mechanisms by which the project activities impact on
receptors (e.g. people, economy, infrastructure, institutions and natural environment).
Aspects associated with the above mentioned Activities were identified for each life-cycle
phase and are relayed into the top rows of each of the numerous Sub-Tables associated with
previously mentioned Tables 9.2.2 (a) – 9.2.2 (d).
[i.e. the Activities and Aspects identified in Section 9.1.1 are entered into the Tables 9.2.2(a)-
(d)].
A separate Activity/Aspect/Impact Identification Table has not been produced within current
Section 9.1.2 to limit the duplication of information.
9.1.3 IMPACT DESCRIPTION/DEFINITION PER LIFE CYCLE
PHASE
Impact Category, Impact Type and Impact Descriptions associated with the above mentioned
Aspects were identified for each life-cycle phase; and are relayed in the top rows of each of
the numerous Sub-Tables associated with previously mentioned Tables 9.2.2 (a) - 9.2.2 (d).
[i.e. The Impact Category (e.g. Soil Distribution, Soil Quality, and Soil Contamination) and
Impact Description (e.g. Soil Contamination due to spillages and blown dust) relevant to the
various Activities and Aspects identified in Section 9.1.1 will be entered into Tables 9.2.2(a)-
(d) respectively. The Type of Impact (e.g. Direct, Indirect, Cumulative, or Fatal Flaw) may
also be entered into Tables 9.2.2(a)-(d)].
A separate Impact Category, Impact Type, and Impact Description Identification Table is not
included within current Section 9.1.3 to limit the duplication of information.
Impact Category and Impact Description
Impacts for Soils are considered in four categories namely:
Impact Category: Soil Distribution
Impact Description: Loss of Soil Horizons/Depth due to ‘topsoil’ (suitable A- and B-
horizons) stripping (and stockpiling) from the sites of proposed infrastructure during the
construction phase of a project; or by soil erosion; or by the covering over of the in-situ
soils by ‘waste’ and /or ‘non-waste’ material during the operational phase of a project.
Red Earth cc Page 120
Impact Category: Soil Erosion
Impact Description: Soil Erosion due to excessive final ‘rehabilitated’ slopes.
Impact Category: Soil Quality
Impact Description: Loss of Soil Fertility or Soil Compaction.
The aforementioned mainly refers to the following:
- The utilization (mechanized stripping, stockpiling and ‘topsoiling’ activities) or
trafficking of machinery when the soils are too moist (or wet), resulting in soil
compaction;
- ‘Topsoil’ stockpiles that are too high (higher than 1.5m) or areas covered over by
‘wastes’ and/or ‘non-wastes’ resulting in soil compaction, the loss of soil fertility, and
the loss of the reproductive seed-bank; and
- ‘Topsoil’ stockpiles or man-made ‘soil’ slopes that are too steep and/or non-vegetated,
resulting in soil erosion.
Impact Category: Soil Contamination
Impact Description: Contamination (Pollution) of soil due to spillages or dumping of
discard, ash, raw materials, ore, product or ‘wastes’ during transport or during the
operational phase; or due to the settling of blown dust or plant/industry/smelter fallout;
or due to spillage/leakage/seepage of contaminated ‘dirty’ water from pipes, canals,
sumps and dams; or due to the seepage and infiltration of contaminated ‘dirty’ water
from waste disposal facilities (discard dumps, slurry dams, and ash dumps), plant areas,
dams, spread ‘waste’ layers, raw materials, ore or product.
This impact largely relates to the Downward/Lateral infiltration of
pollutants/salts/hydrocarbons from contaminated surface materials, ‘waste’ layers (man-
made layers) or ‘dirty’ water reticulation, into (infiltration), or onto (wind-blown) the
underlying or surrounding in-situ soil horizons or water-tables; or
Upward capillary movement into uncontaminated in-situ soil horizons or rehabilitation
‘topsoil’ material.
Impacts are also relevant to Land Capability and Land Use as follows:
Impact Category: Land Capability
Impact Description: Change in Land Capability due to reduced soil depth
(‘rehabilitation’ ‘topsoiling’ depth) and/or an increased slope; as compared with the pre-
disturbance state.
Impact Category: Land Use
Impact Description: Change in Land Use (post-disturbance state); as compared with the
pre-disturbance state.

Red Earth cc Page 121
However, given that the Soils, Land Capability and Land Use are inter-related and inter-
dependant on each other, not all Impact Categories (particularly Land Capability and Land
Use) were mentioned in all cases to avoid duplication. The Land Capability and Land Use
obviously changes in the majority of instances where the soil has been impacted, these
changes being due to the various previously mentioned Soils Impact Categories.
For example, the Impact Category Soil Distribution (soil stripping) will change both the Land
Capability and Land Use, while Soil Erosion will affect land use (reduced grass basal cover).
Thus the Impact Categories were often considered collectively.
Impact Type
Impact Types include the following:
Direct Impacts
Occur directly on the site of the relevant Aspect.
Indirect Impacts
Occur either in the immediate surrounds or further away from the relevant Aspect.
Cumulative Impacts
A cumulative impact is defined in GNR 543 (EIA Regulations of 18 June 2010) as:
“[a] ‘cumulative impact’ in relation to an activity, means the impact of an activity that in
itself may not be significant, but may become significant when added to the existing and
potential impacts eventuating from similar or diverse activities or undertakings in the
area.”
Fatal Flaw
This is a very significant adverse impact which cannot be avoided or mitigated.
Direct impacts ideally require quantitative assessment as opposed to Indirect and Cumulative
Impacts that are described qualitatively. In addition, an indication of any fatal flaws are also
considered and provided in Tables 9.2.2 (a) – 9.2.2 (c) [where applicable]. A description of the method utilised to quantify Impacts (particularly Direct Impacts) is provided in Chapter 10 (QUANTIFICATION OF IMPACTS) of this report.

Red Earth cc Page 122
9.2 EVALUATION OF IMPACTS
9.2.1 IMPACT RATING METHODOLOGY
This section is comprised of the impact rating methodology by means of the following Tables:
Table 9.2.1(a). Key Elements in the Evaluation of Impact Significance,
Table 9.2.1(b). Characteristics to be Used in Impact Descriptions, and
Table 9.2.1(c). Method for Rating the Significance of Impacts.
Table 9.2.1(a): Key Elements in the Evaluation of Impact Significance
Element Description Questions applied to the test of Significance
Consequence An impact or effect can be described as the change in an environmental parameter, which results from a particular project activity or intervention. Here the term consequence refers to: The sensitivity of the receiving environment,
including its capacity to accommodate the kinds of
changes the project may bring about
The type of change and the key characteristics of the
change (these are magnitude, extent and duration)
The importance of the change (the level of public
concern/ value attached to environment by the
stakeholders and the change effected by the project)
The following should be considered in the determination of impact consequence: Standards and Guidelines (e.g. pollution and
emissions thresholds)
Scientific evidence and professional judgment
Points of reference from comparable cases
Levels of stakeholder concern
Will there be a change in the biophysical environment? Is the change of consequence (of any importance)?
Probability Likelihood/ Chances of an impact occurring
Is the change likely to occur?
Effectiveness of the Management Measures
Significance of the impact needs to be determined both without management measures and with management measures. The significance of the unmanaged impact needs to be determined so there is an appreciation of what could occur in the absence of management measures and of the effectiveness of the proposed management measures.
Will the management measures reduce impact to an acceptable level?
Uncertainty/ Confidence
Uncertainty in impact prediction and the effectiveness of the proposed management measures. Sources of uncertainty in impact prediction include: Scientific uncertainty – limited understanding of an
ecosystem or affected stakeholder and the processes
that govern change
Data uncertainty – restrictions introduced by
incomplete, contradictory or incomparable
information, or by insufficient measurement
techniques
Policy uncertainty – unclear or disputed objectives,
standards or guidelines
What is the degree of confidence in the significance ascribed to the impact?

Red Earth cc Page 123
Table 9.2.1(b): Characteristics to be used in Impact Description
Characteristics used to describe Consequence
Sub-Components Terms used to describe the Characteristics
Type Biophysical, social or economic
Nature Direct or Indirect or Cumulative
Status Positive (a Benefit), Negative (a Cost) or Neutral
Phase of Project During the Pre-Construction (if applicable), Construction, Operational, Decommissioning/ Post Closure
Timing Immediate, Delayed
Magnitude
Sensitivity of the Receiving environment/ receptors
High, Medium or Low Sensitivity Low capacity to accommodate the change (impact)/ tolerant of the proposed change
Severity/ Intensity (degree of change measured against thresholds and/ or professional judgment)
Gravity/ seriousness of the impact Intensity / Influence/ Power/ Strength
Level of Stakeholder concern High, Medium or Low levels of concern All or some stakeholders are concerned about the change
Spatial Extent The area affected by the impact.
Area/ Volume covered , Distribution, Population Site/ Local, Regional, National or International
Duration (and Reversibility) Length of time over which an impact occurs and potential for recovery of the endpoint from the impact
Short term. Long term Intermittent, Continuous Reversible, Irreversibility Temporary, Permanent
Confidence High, Medium, Low
The Impact Significance Rating system is presented in Table 9.2.1(c) and involves four parts:
Part A: Define impact consequence using the three primary impact characteristics of
magnitude, spatial scale/ population and duration;
Part B: Use the matrix to determine a rating for impact consequence based on the
definition identified in Part A;
Part C: Use the matrix to determine the impact significance rating, which is a function of
the impact consequence rating (from Part B) and the probability of occurrence; and
Part D: Define the Confidence level.

Red Earth cc Page 124
Table 9.2.1(c): Method for Rating the Significance of Impacts PART A: DEFINING CONSEQUENCES OF MAGNITUDE, DURATION AND SPATIAL SCALE
(Use these definitions to define the consequence in Part B) + denotes a positive impact
Impact Characteristics
Definition Criteria
MAGNITUDE
Major Substantial deterioration or harm to receptors; receiving environment has an inherent value to stakeholders; receptors of impact are of conservation importance; or identified threshold often exceeded
Moderate Moderate/ measurable deterioration of harm to receptors; receiving environment moderately sensitive; or identified threshold occasionally exceeded
Minor Minor deterioration (nuisance or minor deterioration) or harm to receptors; change to receiving environment not measurable; or identified threshold never exceeded
Minor + Minor improvement; change not measurable; or threshold never exceeded
Moderate + Moderate improvement; within or better than the threshold; or no observed reaction
Major + Substantial improvement; within or better than the threshold; or favourable publicity
SPATIAL SCALE
Site or Local Site specific or confined to the immediate project area
Regional May be defined in various ways e.g. cadastral, catchment, topographic
National/ International
Nationally or beyond
DURATION
Short term Quickly reversible. Less than two years
Medium term Reversible over time. Life of the project
Long term Permanent. Beyond closure
PART B: DETERMINING CONSEQUENCE RATING (Rate consequence based on definition of magnitude, spatial extent and duration)
SPATIAL SCALE
Site or Local Regional National/
International
MAGNITUDE
Minor DURATION
Long term Medium Medium High
Medium term Low Low Medium
Short term Low Low Medium
Moderate DURATION
Long term Medium High High
Medium term Medium Medium High
Short term Low Medium Medium
Major DURATION
Long term High High High
Medium term Medium Medium High
Short term Medium Medium High
PART C: DETERMINING SIGNIFICANCE RATING (Rate significance based on consequence and probability)
CONSEQUENCE
Low Medium High
PROBABILITY (of exposure to impacts)
Definite Medium Medium High
Possible Low Medium High
Unlikely Low Low Medium
PART D: CONFIDENCE LEVEL
High Medium Low

Red Earth cc Page 125
9.2.2 IMPACT SIGNIFICANCE RATING AND MANAGEMENT
MEASURES
This section is comprised of the following comprehensive Tables:
Table 9.2.2(a). Impact Significance and Management Measures (Construction Phase),
Table 9.2.2(b). Impact Significance and Management Measures (Operational Phase),
Table 9.2.2(c). Impact Significance and Management Measures (Decommissioning / Closure
Phase), and
Table 9.2.2(d). Impacts and Management Measures (Post-Closure Phase).
Impact Significance Rating / Management Measures Tables were compiled for all three life
cycle phases (Construction, Operational, and Decommissioning and Closure) of the Project.
This was done for the activities deemed to have a potential impact with reference to the
aspects identified. The aforementioned Tables include the following information: Activity
Area, Activity, Aspect, Impact Category, Type of Impact, Impact Description, Impact
Significance Rating Before Management (Measures), Mitigation Measures, Time Period for
Implementation, and Impact Significance Rating After Management (Measures).
Impact Significance Rating / Management Measures Tables relevant to the Construction
Phase are relayed in Table 9.2.2(a), to the Operational Phase in Table 9.2.2 (b) and finally to
the Decommissioning and Closure Phase in Table 9.2.2 (c).
Impacts and Management Measures relevant to the Post-Closure Phase are relayed in Table
9.2.2(d). The aforementioned Table includes the following information: Impact Category,
Mitigation Measures, and Time Period for Implementation only. The Mitigation Measures
described are equally applicable to all of the previously identified Activity Areas, Activities,
and Aspects.
A discussion with regards to the quantification of the impacts is provided in Chapter 10
(QUANTIFICATION OF IMPACTS) of this report. In addition, Chapter 11 (TECHNICAL
DETAILS OF MANAGEMENT MEASURES) of this report is also relevant.
Furthermore, Section 8.4.6 (EVIDENCE OF MISUSE) is also relevant and must be referred
to.

Red Earth cc Page 126
Table 9.2.2(a): Impact Significance and Management Measures (Construction Phase)
ACTIVITY AREAS: Mining, Coal Handling and Processing Plant Area (CHPP), Mine Infrastructure Area (MIA), Heavy Duty Vehicle Area (HDV) ACTIVITIES (AND ASPECTS): Buildings and Structures: ‘Clean’: Fencing (ASPECTS - All Potential Processes and Procedures). Electrical Distribution: ‘Clean’: 11/ 33 kV Switching station, Internal power lines (ASPECTS - All Potential Processes and Procedures)
IMPACT CATEGORY: Soil Distribution - TYPE OF IMPACT: Direct - IMPACT DESCRIPTION: 1. Soil Distribution: Loss of soil distribution (depth and horizons) at foundation sites.
Magnitude Duration Scale Consequence Probability SIGNIFICANCE +/- Confidence
Impact BEFORE Management
Minor Medium Term
Site Low Possible Low - High
Management Measures Time Period for Implementation Compliance with Standards
Measures 1: Soil Distribution: Minimal excavation of foundation holes for fence poles, pylon supports and pylon platforms; Place excavated soil in a small pile in the vicinity for rehabilitation ‘topsoiling’ in the Decommissioning/Closure phase; Avoid unnecessary disturbance of the underlying/surrounding in-situ soils at the site. Do not scalp off or poison the grass cover along fence and power line routes as this will lead to soil erosion; Utilise steel (not wooden) poles for fences and power lines; No grazing or burning allowed
During development process; Biannually (soil erosion and vegetative monitoring: spring before- and autumn after- the rains)
Chamber of Mines Guidelines and Author’s interpretation
Impact AFTER Management
Minor Medium Term
Site Low Unlikely Low - High

Red Earth cc Page 127
ACTIVITY AREAS: Mining, Coal Handling and Processing Plant Area (CHPP), Mine Infrastructure Area (MIA), Heavy Duty Vehicle Area (HDV)
ACTIVITIES (AND ASPECTS): ‘Clean’ Infrastructure / Features: Buildings and Structures: ‘Clean’: Gate house complex, Workers under cover waiting areas, Workers turnstile access control and Induction office, Office complex, Helicopter landing pad, Change houses, Clinic, Canteen, Fire control facility, Gas store, Flammable store, Instrumentation workshop, Combined stores, Under crane warehouse (ASPECTS - All Potential Processes and Procedures). Plant Facilities: ‘Clean’: Plant motor control centre (MCC) control room, Transformer bays, Plant coal laboratory, Plant geology grade control, Plant office building (ASPECTS - All Potential Processes and Procedures). ‘Dirty’ Infrastructure / Features: Buildings and Structures: ‘Dirty’: Entrance/ exit and 2 x weighbridges, Solid waste sorting facility, General workshop, Chemical store, Hazardous material store, Electrical workshop, Welding shop, Light duty vehicle (LDV)/ heavy duty vehicle (HDV) workshop, LDV/ HDV wash bay, LDV/ HDV fuel storage and refuelling, Oil discard tanks, HDV tyre storage, HDV tyre change assembly station, HDV tyre change hard stand (ASPECTS - All Potential Processes and Procedures). Plant Facilities: ‘Dirty’: Run of Mine pad, Single stage wash beneficiation, Primary crusher, Conveyors, Plant workshop (ASPECTS - All Potential Processes and Procedures). Residue Stockpiles and Deposits: ‘Dirty’: ROM/ raw material stockpile, Waste tip (ASPECTS - All Potential Processes and Procedures). Electrical Distribution: ‘Dirty’: Substation and miniature substations (11 kV), Uninterrupted power supply (UPS) generators (ASPECTS - All Potential Processes and Procedures). Residue Stockpiles and Deposits: ‘Dirty’: Discard dump, Overburden stockpile (ASPECTS - All Potential Processes and Procedures). Road Network: ‘Dirty’ and ‘Clean’: Access roads (R518), Internal roads (road width = 7.4 m, road reserve = 15 m).
IMPACT CATEGORY: Soil Distribution, Soil Erosion, Soil Quality, Land Use, Land Capability - TYPE OF IMPACT: Direct and Indirect - IMPACT DESCRIPTION: 1. Soil Contamination of the Surrounding in-situ soil areas as a result of ‘dirty’ rainwater run-off and blown dust from the excavation/construction in the Infrastructure
areas. 2.Soil Distribution: Loss of soil distribution (depth/horizons) during excavation. 3. Soil Erosion due to bare surface (stripped vegetation). 4. Soil Quality reduction (increased compaction, reduced organic carbon % and decreased nutrient levels) during 'topsoil' stripping exercise; due to machinery handling
of 'topsoil' material or burying of in-situ soils. 5. Land Use: Existing land use destroyed. 6. Land Capability: Existing land capability destroyed.
Magnitude Duration Scale Consequence Probability SIGNIFICANCE +/- Confidence
Impact BEFORE Management
‘CLEAN’ Moderate Medium Term
Local Medium Definite Medium - High
‘DIRTY’ Major Long Term Cadastral High Definite High - High
Management Measures Time Period for Implementation Compliance with Standards

Red Earth cc Page 128
Measures 1: Soil Contamination: Institute all possible measures (e.g. construct numerous concrete slabs, secondary drains, and berms) to encourage the run-off of 'dirty' water and rain water into drains, rather than allowing trapped water to infiltrate/leach through the ‘waste’/’non-waste’ layers that may be present in the future, and thereafter into the buried in-situ soils (underlying a number of these areas) and water-tables. The base of relatively potentially highly polluting features (e.g. discard dump and other – determined by the mine) must be well sealed with an impermeable membrane that overlies a compacted-‘re-moulded’ soil ’seal’ layer. Provide under drainage. The soil ‘seal’ layer must ideally be comprised of pedocutanic (B-horizons) or hydromorphic (G- or B-horizons), the aforementioned soils probably displaying a slow permeability once compacted. Although vertic soil material is far more suited for this purpose, very little occurs in the Operational Area. Construct and maintain optimum functioning (attend to leaks, clear blockages, remove vegetation and remove siltation) of 'clean' (re-directs 'clean' water around potential pollution sources) and 'dirty' (intercepts 'dirty' water from polluted areas) storm water intercept canals/drains/berms, upslope/downslope (respectively) of the various infrastructure areas (potentially polluting features). The associated soil berm must lie adjacent (entire length on the downslope side) to the canals/drains. Compact the soil base and downslope (not upslope) side-walls of the drains to achieve a relatively impermeable compacted-‘re-moulded’ soil seal’ layer.
During construction/development process Chamber of Mines Guidelines and Author’s interpretation
Measures 2: Soil Distribution: ‘Dirty’ Infrastructure/Features: Strip the soils ahead of construction operations as per the depths indicated on Map 5 (Soil Utilization [Stripping] Guide]. ‘Clean’ Infrastructure/Features: Minimal ‘topsoil’ stripping for foundations/slabs only. Thus during rehabilitation, the pre-disturbance soil distribution / land capability will easily be regained after removing the foundations / slabs (exposing the in-situ soils), with minimal ‘topsoiling’ required.
Do not remove vegetation or strip soil material earlier than is required. Either deposit the stripped ‘topsoil’ in ‘topsoil’ berms in the vicinity of where the soil was stripped (to be utilised for rehabilitation ‘topsoiling’ purposes during the decommissioning / closure phase), or alternatively transport the ‘topsoil’ to the ‘topsoil’ stockpile for later use. The ‘topsoil’ berms and stockpile must be sited at locations where the ‘topsoil’ is unlikely to become contaminated by either dust erosion (related to the prevailing wind direction) or ‘dirty’ run-off (thus
During construction/development process Chamber of Mines Guidelines and Author’s interpretation

Red Earth cc Page 129
preferably in an upslope position). In the case of the ‘clean’ access and internal roads, and canals/drains; the stripped ‘topsoil’ must lie adjacent to the feature (entire length in an upslope position) in the form of a re-vegetated ‘topsoil’ berm. In the case of ‘dirty’ haul roads, the stripped ‘topsoil must be stored in the ‘topsoil stockpile.
Measures 3: Soil Erosion: Soil Erosion may be reduced by reducing ‘topsoil’ berm side-slopes to < 5.2 degrees/ 9.2 % percentage grade. Re-vegetate (locally indigenous grasses) the ‘topsoil’ berms. Functional surface cover (basal) to be achieved by both natural means as well as by intervention. Thus, Mature Seeded ‘Grass’ must first be mown from elsewhere on the property and then spread out on the berms during the rainy season. Thereafter manually/mechanically re-vegetate (with self-sustaining locally indigenous ‘grasses’) in problematic areas, as well as in those areas where the spread seeded ‘grass’ did not germinate/create cover. No grazing or burning allowed.
During construction/development process Chamber of Mines Guidelines and Author’s interpretation
Measures 4: Soil Quality (compaction and fertility) Machinery - utilize tracked vehicles for ‘topsoil’ handling during the dry season (ideally, but often impractical) to minimise soil compaction of stripped ‘topsoil’. Utilise live topsoil (and compost if available) to replenish soil micro-flora before re-vegetation of the ‘topsoil’ berms (and other areas). Sample and analyse the ‘topsoil’. Fertilize (slow release ameliorants) the 'topsoil' immediately after re-vegetation, and once every 3 - 4 years thereafter.
During construction/development process Chamber of Mines Guidelines and Author’s interpretation
Measures 5. Land Use: Do not remove vegetation or strip soil material earlier than is required; Re-vegetate the ‘topsoil’ berms and as many other areas as possible. Refer to Decommissioning/Closure phase Impacts/Measures for further details.
- Chamber of Mines Guidelines
Measures 6: Land Capability: Do not remove vegetation or strip soil material earlier than is required; Re-vegetate the ‘topsoil’ berms and as many other areas as possible. Refer to Decommissioning/Closure phase Impacts/Measures for further details.
- Chamber of Mines Guidelines
Impact AFTER Management
‘CLEAN’ Moderate Medium Term
Site Medium Definite-Probable Medium - High
‘DIRTY’ Major Long Term Cadastral High Definite High - High

Red Earth cc Page 130
ACTIVITY AREAS: Mining, Coal Handling and Processing Plant Area (CHPP), Mine Infrastructure Area (MIA), Heavy Duty Vehicle Area (HDV)
ACTIVITIES (AND ASPECTS): Water Supply Network: ‘Dirty’: Water treatment works (reverse osmosis package plant), Waste water treatment works (closed system package plant), Sludge and solids collection and disposal, Pollution control dams/ storm-water retention ponds (combined), Raw water dam (ASPECTS - All Potential Processes and Procedures)
IMPACT CATEGORY: Soil Distribution, Soil Erosion, Soil Quality, Land Use, Land Capability - TYPE OF IMPACT: Direct - IMPACT DESCRIPTION: 1. Soil Contamination not likely during the Construction phase. 2.Soil Distribution: Loss of soil distribution (depth/horizons) during excavation. 3. Soil Erosion due to excessive soil dam and berm side slopes, and bare surface (stripped vegetation). 4. Soil Quality reduction (increased compaction, reduced organic carbon % and decreased nutrient levels) during 'topsoil' stripping exercise; due to machinery handling
of 'topsoil' material; and intentional compaction of dam side-slopes and drain base/downslope wall. 5. Land Use: Existing land use destroyed. 6. Land Capability: Existing land capability destroyed.
Magnitude Duration Scale Consequence Probability SIGNIFICANCE +/- Confidence
Impact BEFORE Management
Major Long Term Local High Definite High - High
Management Measures Time Period for Implementation Compliance with Standards
Measures 1: Soil Contamination: The base and walls of the ‘Dam Features’ must be well sealed with an impermeable membrane that overlies a compacted-‘re-moulded’ soil ’seal’ layer. Provide under drainage. The soil ‘seal’ layer must ideally be comprised of pedocutanic (B-horizons) or hydromorphic (G- or B-horizons), the aforementioned soils probably displaying a slow permeability once compacted. Although vertic soil material is far more suited for this purpose, very little occurs in the Operational Area. A non-compacted ‘topsoil’ layer comprised of Red apedal (Hu and Li soil forms), Yellow-brown apedal (Cv and Gc forms) or Carbonate [Py, Ky and Mp forms) soils must be present on the surface for ‘topsoiling’ and re-vegetation purposes. Construct and maintain optimum functioning (attend to leaks, clear blockages, remove vegetation and remove siltation) of 'clean' (re-directs 'clean' water around potential pollution sources) and 'dirty' (intercepts 'dirty' water from polluted areas) storm water intercept canals/drains/berms, upslope/downslope (respectively) of each dam (potentially polluting features). The associated soil berm must lie adjacent (entire length on the downslope side) to the drains. Compact the soil base and downslope (not upslope) side-walls of the drains to achieve a relatively impermeable compacted-‘re-moulded’ soil seal’ layer.
During construction/development process Chamber of Mines Guidelines and Author’s interpretation
Measures 2: Soil Distribution:
During construction/development process Chamber of Mines Guidelines

Red Earth cc Page 131
Excavate in-situ ‘topsoil’ to the required depth during development; Transport excess stripped soil to the ‘topsoil’ stockpile.
Measures 3: Soil Erosion: Soil Erosion may be reduced by reducing soil dam side-slopes to < 5.2 degrees/ 9.2 % percentage grade where necessary. Re-vegetate (locally indigenous grasses) the dam side-slopes and ‘topsoil’ berms. Functional surface cover (basal) to be achieved by both natural means as well as by intervention. Thus, Mature Seeded ‘Grass’ must first be mown from elsewhere on the property and then spread out on the soil dam side-slopes and berms during the rainy season. Thereafter manually/mechanically re-vegetate (with self-sustaining locally indigenous ‘grasses’) in problematic areas, as well as in those areas where the spread seeded ‘grass’ did not germinate/create cover. No grazing or burning allowed.
During construction/development process Chamber of Mines Guidelines and Author’s interpretation
Measures 4: Soil Quality (compaction and fertility) Machinery - utilize tracked vehicles for ‘topsoil’ handling during the dry season (ideally, but often impractical) to minimise soil compaction of stripped ‘topsoil’. Import pedocutanic or hydromorphic soil utilised for dam construction and compact in the moist state to maximise compaction and create a compacted-‘re-moulded’ seal layer; Utilise live topsoil (and compost if available) to replenish soil micro-flora before re-vegetation of the dam side-slopes and adjacent (to the drains) ‘topsoil’ berms. Sample and analyse the ‘topsoil’. Fertilize (slow release ameliorants) the 'topsoil' immediately after re-vegetation, and once every 3 - 4 years thereafter.
During construction/development process Chamber of Mines Guidelines and Author’s interpretation
Measures 5. Land Use: Do not remove vegetation or strip soil material earlier than is required; Re-vegetate dam wall side-slopes (where applicable) and ‘topsoil’ berms Refer to Decommissioning/Closure phase Impacts/Measures for further details.
- Chamber of Mines Guidelines
Measures 6: Land Capability: Do not remove vegetation or strip soil material earlier than is required; Re-vegetate dam wall side-slopes (where applicable) and ‘topsoil’ berms Refer to Decommissioning/Closure phase Impacts/Measures for further details.
- Chamber of Mines Guidelines
Impact AFTER Management
Moderate Long Term Local Medium Possible Medium - High

Red Earth cc Page 132
ACTIVITY AREAS: Mining, Coal Handling and Processing Plant Area (CHPP), Mine Infrastructure Area (MIA), Heavy Duty Vehicle Area (HDV)
ACTIVITIES (AND ASPECTS): Water Supply Network: ‘Dirty’ and ‘Clean’: ‘dirty’ water intercept berms/drains/canals, ‘clean’ water diversion berms/drains/canals, Pipelines, Pump stations, Storage tanks (ASPECTS - All Potential Processes and Procedures)
IMPACT CATEGORY: Soil Distribution, Soil Erosion, Soil Quality, Land Use, Land Capability - TYPE OF IMPACT: Direct - IMPACT DESCRIPTION: 1. Soil Contamination not likely during the Construction phase. 2.Soil Distribution: Loss of soil distribution (depth/horizons) during excavation. 3. Soil Erosion due to excessive soil berm side slopes, and bare surface (stripped vegetation). 4. Soil Quality reduction (increased compaction, reduced organic carbon % and decreased nutrient levels) during 'topsoil' stripping exercise; due to machinery handling
of 'topsoil' material. 5. Land Use: Existing land use destroyed. 6. Land Capability: Existing land capability destroyed.
Magnitude Duration Scale Consequence Probability SIGNIFICANCE +/- Confidence
Impact BEFORE Management
Major Long Term Local High Definite High - High
Management Measures Time Period for Implementation Compliance with Standards
Measures 1: Soil Contamination: Future ‘Dirty’ polluted areas: Construct canals/drains from concrete to prevent seepage of ‘dirty’ water. Future ‘Clean’ non-polluted areas: Construct an earth canal/drain; Compact the soil base and side-walls of the canal/drain to achieve a relatively impermeable compacted-‘re-moulded’ soil seal’ layer.
During development process Chamber of Mines Guidelines
Measures 2: Soil Distribution: Excavate in-situ ‘topsoil’ to the required depth during development of canals/drains; Establish a ‘topsoil’ berm from excavated soil material adjacent to the canals/drains (entire length on the downslope side)
During development process Chamber of Mines Guidelines
Measures 3: Soil Erosion: Soil Erosion may be reduced by reducing soil berm side-slopes to < 5.2 degrees/ 9.2 % percentage grade where necessary. Re-vegetate (locally indigenous grasses) the ‘topsoil’ berms. Functional surface cover (basal) to be achieved by both natural means as well as by intervention. Thus, Mature Seeded ‘Grass’ must first be mown from elsewhere on the property and then spread out on the soil berms during the rainy season. Thereafter manually/mechanically re-vegetate (with self-sustaining locally indigenous
During development process Chamber of Mines Guidelines and Author’s interpretation

Red Earth cc Page 133
‘grasses’) in problematic areas, as well as in those areas where the spread seeded ‘grass’ did not germinate/create cover. No grazing or burning allowed.
Measures 4: Soil Quality (compaction and fertility) Machinery - utilize tracked vehicles for ‘topsoil’ handling during the dry season (ideally, but often impractical) (ideally – not practical) to minimise compaction; Utilise live topsoil (and compost if available) to replenish soil micro-flora before re-vegetation of the adjacent (to the canals/drains) ‘topsoil’ berms. Sample and analyse the ‘topsoil’. Fertilize (slow release ameliorants) the 'topsoil' immediately after re-vegetation, and once every 3 - 4 years thereafter.
During development process Chamber of Mines Guidelines and Author’s interpretation
Measures 5. Land Use: Do not remove vegetation or strip soil material earlier than is required; Re-vegetate ‘topsoil’ berms Refer to Decommissioning/Closure phase Impacts/Measures for further details.
- Chamber of Mines Guidelines
Measures 6: Land Capability: Do not remove vegetation or strip soil material earlier than is required; Re-vegetate ‘topsoil’ berms Refer to Decommissioning/Closure phase Impacts/Measures for further details.
- Chamber of Mines Guidelines
Impact AFTER Management
Moderate Long Term Site Medium Possible Medium - High

Red Earth cc Page 134
ACTIVITY AREA: Mining ACTIVITIES (AND ASPECTS): Mining: Box cut, Open pit (ASPECTS - All Potential Processes and Procedures)
IMPACT CATEGORY: Soil Contamination, Soil Distribution, Soil Erosion, Soil Quality, Land Use, Land Capability - TYPE OF IMPACT: Direct and Indirect - IMPACT DESCRIPTION: 1. Soil Contamination of the Surrounding in-situ soil areas as a result of ‘dirty’ rainwater run-off and blown dust from the excavation of the Opencast area. 2. Soil Distribution: Loss of soil distribution (depth and horizons) in stripped areas. 3. Soil Erosion due to excessive slopes, uneven terrain, and bare surface (stripped vegetation). 4. Soil Quality reduction (increased compaction, reduced organic carbon % and decreased nutrient levels) during 'topsoil' stripping exercise; due to machinery handling
of 'topsoil' material. 5. Land Use: Existing land use destroyed. 6. Land Capability: Existing land capability destroyed.
Magnitude Duration Scale Consequence Probability SIGNIFICANCE +/- Confidence
Impact BEFORE Management
Major Long Term Local High Definite High - High
Management Measures Time Period for Implementation Compliance with Standards
Refer to all Mitigation Measures in the Decommissioning/Closure phase for more detailed information. Measures 1a: Soil Contamination: Construct a vegetated berm from ‘softs’ or soil material around the outer boundary of the opencast (rock dumps/open void) footprint area, Construct 'clean' (re-direct 'clean' water around potential pollution sources) and 'dirty' (intercept 'dirty' water from polluted areas) storm water intercept canals/drains/berms upslope and downslope of the Opencast Areas respectively. The spraying of water for dust suppression will be beneficial during mechanical operations. Wash residual ‘wastes’ from elsewhere off the machinery before utilising the machinery for transportation of ‘topsoil’ or rehabilitation ‘topsoiling’ purposes. Haul trucks and vehicle traffic must obey speed limits to reduce the amount of blown dust.
During construction/development process (construct ‘softs’ berm, and ‘dirty’/’clean’ water canals/drains/berms), Daily where necessary (spraying of water when operating machinery and haul trucks), Continuously (speed limits)
Chamber of Mines Guidelines
Measures 2: Soil Distribution:
During construction/development process Chamber of Mines Guidelines

Red Earth cc Page 135
Strip the soils ahead of opencast operations as per the depths indicated on Map 5 (Soil Utilization [Stripping] Guide]. Do not remove vegetation or strip soil material earlier than is required. Either deposit the stripped ‘topsoil’ on a backfilled area that is undergoing rehabilitation, or alternatively transport the ‘topsoil’ to the ‘topsoil’ stockpile for later use.
Measures 3. Soil Erosion: Do not remove vegetation or strip soil material earlier than is required. Refer to Decommissioning/Closure phase Impacts/Measures for further details. Measures 4. Soil Quality: Machinery - utilize tracked vehicles for ‘topsoil’ handling during the dry season (ideally, but often impractical since mining operations are ongoing throughout the year) to minimise compaction. Refer to Decommissioning/Closure phase Impacts/Measures for further details. Measures 5. Land Use: Do not remove vegetation or strip soil material earlier than is required. Re-vegetate rehabilitated areas. Refer to Decommissioning/Closure phase Impacts/Measures for further details. Measures 6: Land Capability: Do not remove vegetation or strip soil material earlier than is required. Re-vegetate rehabilitated areas. Refer to Decommissioning/Closure phase Impacts/Measures for further details.
- Chamber of Mines Guidelines
Impact AFTER Management
Major Long Term Site High Definite High - High

Red Earth cc Page 136
ACTIVITY AREAS: Mining (mainly). Also Coal Handling and Processing Plant Area (CHPP), Mine Infrastructure Area (MIA), Heavy Duty Vehicle Area (HDV) ACTIVITIES (AND ASPECTS): Residue Stockpiles and Deposits: ‘Clean’: Topsoil stockpile (in Mining Area); and Soil berm ‘stockpiles’ (in other areas) (ASPECTS - All Potential Processes and Procedures)
IMPACT CATEGORY: Soil Distribution, Soil Erosion, Soil Quality, Land Use , and Land Capability - TYPE OF IMPACT: Direct - IMPACT DESCRIPTION: 1. Soil Contamination: Not likely during the Construction phase. 2. Soil Distribution: Burying of existing in-situ soils by the stockpile. 3. Soil Erosion of the stockpile due to excessive side-slopes (>5.2 degrees, 9.2 % percentage grade), lack of vegetative (grass) basal cover, and possible absence of a
downslope soil berm to intercept run-off. 4. Soil Quality reduction (below and within stockpile): (increased compaction, reduced organic carbon % and decreased nutrient levels, and reduction of reproductive
seed-bank in the pile) due to excessive stockpile heights (>2.5m) and expected long periods of storage. 5. Land Use: Existing land use covered over by the stockpile. 6. Land Capability: Existing land capability covered over by the stockpile.
Magnitude Duration Scale Consequence Probability SIGNIFICANCE +/- Confidence
Impact BEFORE Management
Major Medium Term
Site Medium Definite Medium - High
Management Measures Time Period for Implementation Compliance with Standards
Measures 1: Soil Contamination: The ‘topsoil’ stockpile must not be allowed to become contaminated; by means of the implementation of the following measures: Do not deposit ‘waste’ (coal fines, discard or other) materials on the ‘clean’ ‘topsoil’ stockpiles. Spray water for dust suppression where necessary when working with machinery. The spraying of water for dust suppression in other developed areas (as recommended) will limit dust pollution (coal dust) of the ‘topsoil’ stockpiles. The spraying of water for dust suppression will not be required on the pile since the stockpiled topsoils that will be re-vegetated are only slightly prone to wind erosion. Haul trucks and vehicle traffic must obey speed limits to reduce the amount of blown dust. Construct and maintain optimum functioning (attend to leaks, clear blockages, remove vegetation and remove siltation) of the 'clean' (re-direct 'clean' water around potential pollution sources) and 'dirty' (intercept 'dirty' water from polluted areas) storm water intercept canals/drains/berms, upslope/downslope (respectively) of potentially polluting features. The aforementioned will limit ‘clean’ and ‘dirty’ water run-off and seepage derived from elsewhere from entering the stockpile
Daily when necessary (wash machinery utilised for transportation and spreading of ‘topsoil’ material), Daily where necessary (spraying of water when operating machinery and haul trucks), Continuously (speed limits), Quarterly (drainage features-‘dirty’/’clean’ drains/canals/berms-monitor and maintain-repair leaks, clear blockages, remove vegetation, remove siltation, dredging), Annually (contamination monitoring).
Chamber of Mines Guidelines

Red Earth cc Page 137
areas. Wash residual ‘wastes’ from elsewhere off the machinery before utilising the machinery for transportation of ‘topsoil’. The ‘topsoil’ berms and stockpile must be sited at locations where the ‘topsoil’ is unlikely to become contaminated by either dust erosion (related to the prevailing wind direction) or ‘dirty’ run-off (thus preferably in an upslope position).
Measures 2. Soil Distribution: Limit the surface area of the footprint, to preserve the existing in-situ soils underlying the site. Avoid unnecessary disturbance of any underlying/surrounding in-situ soils that may already be present at the ‘topsoil’ stockpile sites.
During construction/development process Chamber of Mines Guidelines
Measures 3: Soil Erosion: Side-slopes ideally < 5.2 degrees, 9.2 % percentage grade [non-vegetated maximum slope, but slightly steeper (undetermined) after re-vegetation]. Functional surface cover (basal, canopy) to be achieved by both natural means as well as by intervention. Thus, Mature Seeded ‘Grass’ must first be mown from elsewhere on the property and then spread out on the bare ‘topsoil’ stockpiles during the rainy season. Thereafter manually/mechanically re-vegetate (with self-sustaining locally indigenous ‘grasses’) in problematic areas, as well as in those areas where the spread seeded ‘grass’ did not germinate/create cover. No grazing or burning allowed. Construct a soil berm surrounding the stockpile. That on the upslope sides will divert dirty water run-off, while that downslope will prevent siltation of the surrounds.
During construction/development process (establish correct slope), Immediately after establishment of ‘topsoil’ stockpile (soil sampling, ameliorate/fertilise soils, mow/spread mature ‘seeded’ grass), Biannually (erosion and vegetative monitoring: spring before- and autumn after- the rains).
Chamber of Mines Guidelines and Author’s interpretation
Measures 4: Soil Quality (compaction and fertility): Topsoil’ stockpiles should ideally not exceed a maximum depth of 1.5 – 2.5m, as greater depths than this can lead to the following: anaerobic conditions developing in the pile; a reduction in soil fertility; the accelerated loss of the reproductive seed-bank; and compaction. Sample and analyse the ‘topsoil’. Fertilize (slow release ameliorants) the 'topsoil' stockpile immediately after establishment, and once every 3 - 4 years thereafter in spring to maintain soil fertility and vegetative (‘grass’) basal cover, thereby limiting soil erosion and continually refreshing the reproductive seed-bank. Do not fertilise the soils in areas displaying healthy existing locally indigenous ‘grass’ cover. Machinery - to limit compaction, machinery for stripping/stockpiling/rehabilitation purposes should ideally be tracked (not wheeled), and should operate during the dry winter months only.
Immediately after establishment of ‘topsoil’ stockpile, and once every 3-4 years thereafter (fertility monitoring: sample and fertilise)
Chamber of Mines Guidelines

Red Earth cc Page 138
Measures 5: Land Use: Re-vegetate the stockpile.
Immediately after establishment Chamber of Mines Guidelines
Measures 6: Land Capability: Re-vegetate the stockpile.
Immediately after establishment Chamber of Mines Guidelines
General Information: Available ‘topsoil’ reserves must be stripped as per the depths indicated on Map 5 (Soil Utilization [Stripping] Guide) during the construction and operational phases (varies for different features). The organisation must plan not to stockpile the soils wherever it can, but rather utilize the stripped ‘topsoil’ material immediately in an area that is being rehabilitated (e.g. ‘moving’ opencast area). Provision should also be made for limited stockpiling of excess ‘topsoil’ material for use in repair work during the post-closure phase.
Construction and Operational phases Chamber of Mines Guidelines
Impact AFTER Management
Moderate Medium Term
Site Medium Definite Medium - High

Red Earth cc Page 139
Table 9.2.2(b): Impact Significance and Management Measures (Operational Phase)
ACTIVITY AREAS: Mining, Coal Handling and Processing Plant Area (CHPP), Mine Infrastructure Area (MIA), Heavy Duty Vehicle Area (HDV) ACTIVITIES (AND ASPECTS) Buildings and Structures: ‘Clean’: Fencing (ASPECTS - All Potential Processes and Procedures); Electrical Distribution: ‘Clean’: 11/ 33 kV Switching station, Internal power lines (ASPECTS - All Potential Processes and Procedures)
IMPACT CATEGORY: Soil Erosion - TYPE OF IMPACT: Direct - IMPACT DESCRIPTION: 1. Soil Erosion due to possible poor vegetative (grass) basal cover
Magnitude Duration Scale Consequence Probability SIGNIFICANCE +/- Confidence
Impact BEFORE Management
Minor Medium Term
Site Low Possible Low - High
Management Measures Time Period for Implementation Compliance with Standards
Measures 1: Soil Erosion: Monitor and maintain vegetative (grass) basal cover and soil erosion in the vicinity of the foundation holes; Mature seeded grass may be mown from elsewhere and then spread out in eroded areas displaying poor grass cover; Do not scalp off or poison the grass cover along fence and power line routes; Utilise steel (not wooden) poles for fences and power lines; Do not fertilise the soils in these areas; No grazing or burning allowed.
Biannually (soil erosion and vegetative monitoring: spring before- and autumn after- the rains)
Chamber of Mines Guidelines and Author’s interpretation
Impact AFTER Management
Minor Medium Term
Site Low Unlikely Low - High

Red Earth cc Page 140
ACTIVITY AREAS: Mining, Coal Handling and Processing Plant Area (CHPP), Mine Infrastructure Area (MIA), Heavy Duty Vehicle Area (HDV) ACTIVITIES (AND ASPECTS): Road Network: ‘Dirty’ and ‘Clean’: Access roads (R518), Internal roads (road width = 7.4 m, road reserve = 15 m) (ASPECTS - All Potential Processes and Procedures)
IMPACT CATEGORY: Soil Erosion, Soil Contamination - TYPE OF IMPACT: Direct and Indirect - IMPACT DESCRIPTION: 1. Soil Erosion due to possible poor vegetative (grass) basal cover of surrounding soils and soil berms, or ‘waste’ or ‘non-waste’ bare surfaces or berms. 2. Soil Contamination of Underlying/Surrounding in-situ soils due to accidental spillages (coal dust, discard, carbonaceous rock, raw materials, chemicals, vehicle oil/fuel leaks), exhaust fumes and blown dust; and subsequent infiltration into the soils and run-off into the drainage areas.
Magnitude Duration Scale Consequence Probability SIGNIFICANCE +/- Confidence
Impact BEFORE Management
Moderate Medium Term
Local Medium Definite Medium - High
Management Measures Time Period for Implementation Compliance with Standards
Measures 1: Soil Erosion: Monitor and maintain vegetative (grass) basal cover in the surrounds; Sample/fertilize the 'topsoil' berms once every 3 -4 years in spring to maintain vegetative basal cover, thereby limiting soil erosion; No grazing or burning allowed. Maintain local drainage features (direct/contain 'dirty' water runoff and keep ‘clean’ water away); Maintain optimum functioning (remove siltation and vegetation) of the 'dirty' water run-off intercept drains/berms to the PCD's, as well as the ‘clean’ water diversion drains/berms. The aforementioned will limit ‘dirty’ and ‘clean’ run-off water derived from elsewhere from impacting these areas.
Biannually (soil erosion and vegetative monitoring: spring before- and autumn after- the rains), Quarterly (drainage features-‘dirty’/’clean’ drains/canals/berms-monitor and maintain-repair leaks, clear blockages, remove vegetation, remove siltation, dredging)
Chamber of Mines Guidelines
Measures 2: Soil Contamination: Report, monitor and clean up accidental spillages immediately; Sweep roads/verges periodically. Spray water for dust suppression; Speed limits; Monitor dust.
Immediately (spills), Daily (spray water), Quarterly (sweep roads/verges), Continuously (speed limits)
Chamber of Mines Guidelines
Impact AFTER Management
Moderate Medium Term
Site Medium Possible Medium - Medium

Red Earth cc Page 141
ACTIVITY AREAS: Coal Handling and Processing Plant Area (CHPP), Mine Infrastructure Area (MIA), Heavy Duty Vehicle Area (HDV) ACTIVITIES (AND ASPECTS): Buildings and Structures: ‘Clean’: Gate house complex, Workers under cover waiting areas, Workers turnstile access control and Induction office, Office complex, Helicopter landing pad, Change houses, Clinic, Canteen, Fire control facility, Gas store, Flammable store, Instrumentation workshop, Combined stores, Under crane warehouse (ASPECTS - All Potential Processes and Procedures). Plant Facilities: ‘Clean’: Plant motor control centre (MCC) control room, Transformer bays, Plant coal laboratory, Plant geology grade control, Plant office building (ASPECTS - All Potential Processes and Procedures)
IMPACT CATEGORY: Soil Erosion, Soil Contamination - TYPE OF IMPACT: Direct - IMPACT DESCRIPTION: 1. Soil Erosion due to possible poor vegetative (lawn) basal cover of surrounds. 2. Soil Contamination of Underlying/Surrounding in-situ soils due to accidental spillages (oils or chemicals) on the soil surface and subsequent infiltration into the soils
and run-off into the drainage systems (both unlikely)
Magnitude Duration Scale Consequence Probability SIGNIFICANCE +/- Confidence
Impact BEFORE Management
Moderate Long Term Local Medium Possible Medium - High
Management Measures Time Period for Implementation Compliance with Standards
Measures 1: Soil Erosion: Monitor and maintain vegetative (lawn) basal cover in the vicinity and surrounds; Fertilise lawn soils annually upon commencement of the rainy season
Biannually (soil erosion and vegetative monitoring: spring before- and autumn after- the rains), Annually upon commencement of the rainy season (soil quality-fertilise lawn)
Chamber of Mines Guidelines
Measures 2: Soil Contamination: Monitor accidental oil/chemical spillages, and blown coal dust; Clean up spills and sweep up coal dust immediately; Discuss further during Induction Training. Maintain optimum functioning (remove siltation and vegetation) of the 'dirty' water run-off intercept drains/berms to the PCD's, as well as the ‘clean’ water diversion drains/berms. The aforementioned will limit ‘dirty’ and ‘clean’ run-off water derived from elsewhere from entering these areas.
Immediately/daily (spills-various facility staff), Quarterly (drainage features-‘dirty’/’clean’ drains/canals/berms-monitor and maintain-repair leaks, clear blockages, remove vegetation, remove siltation, dredging)
Chamber of Mines Guidelines
Impact AFTER Management
Minor Medium Term
Site Low Possible Low - High

Red Earth cc Page 142
ACTIVITY AREAS: Coal Handling and Processing Plant Area (CHPP), Mine Infrastructure Area (MIA), Heavy Duty Vehicle Area (HDV) ACTIVITIES (AND ASPECTS): Plant Facilities: ‘Dirty’: Run of Mine pad, Single stage wash beneficiation, Primary crusher, Conveyors, Plant workshop (ASPECTS - All Potential Processes and Procedures) Buildings and Structures: ‘Dirty’: Entrance/ exit and 2 x weighbridges, Solid waste sorting facility, General workshop, Chemical store, Hazardous material store, Electrical workshop, Welding shop, Light duty vehicle (LDV)/ heavy duty vehicle (HDV) workshop, LDV/ HDV wash bay, LDV/ HDV fuel storage and refuelling, Oil discard tanks, HDV tyre storage, HDV tyre change assembly station, HDV tyre change hard stand (ASPECTS - All Potential Processes and Procedures) Residue Stockpiles and Deposits: ‘Dirty’: ROM/ raw material stockpile, Waste tip (ASPECTS - All Potential Processes and Procedures) Electrical Distribution: ‘Dirty’: Substation and miniature substations (11 kV), Uninterrupted power supply (UPS) generators (ASPECTS - All Potential Processes and Procedures)
IMPACT CATEGORY: Soil Contamination, ‘Waste’/’Non-Waste’ Erosion, Soil Quality, Land Use, Land Capability - TYPE OF IMPACT: Direct and Indirect - IMPACT DESCRIPTION: 1. Soil Contamination of Buried Underlying/Surrounding in-situ soils due to the infiltration/leaching of ‘dirty’ water and rain water through the accumulated ‘waste’/’non-waste’ materials layer, raw materials stockpiles, product stockpiles, conveyor spillages, or other spilled materials (e.g. oils/fuels/chemicals) into the soils and run-off into the drainage systems, as well as the contamination of downwind soils due to the settling of blown dust. 2. ‘Waste’/’Non-Waste’ Erosion of the Local/Surrounding bare (devoid of vegetation)surfaces due to the run-off of waste-water and rainfall.
Magnitude Duration Scale Consequence Probability SIGNIFICANCE +/- Confidence
Impact BEFORE Management
Major Long Term Cadastral High Definite High - High
Management Measures Time Period for Implementation Compliance with Standards
Measures 1a: Soil Contamination: Continually scrape up and remove daily generated/spilled ‘wastes’/’non-wastes’ or fines/dust layers that accumulates overlying the concrete pads or in-situ soils, and dispose of on the discard dump, in the opencast void, or a designated ‘waste’ storage facility; or re-process as applicable.; Re-use or sell off unwanted materials (e.g. scrap from a salvage yard) as soon as possible. Spray water for dust suppression; Tarpaulin cover over haul truck bin where necessary to limit dust; Obey speed limits.
Continuously (monitoring and maintenance), Continuously (scrape up, consolidate, remove, and dump generated daily ‘waste’/’non-waste’ material), Immediately (clean up spillages), Weekly, or immediately after a spill (clean up, clean concrete pads), Ongoing (maintenance of roofed areas and pads), Continuously (speed limits and tarpaulin haul truck bin cover where necessary), Daily where necessary (spraying of water when operating machinery and haul trucks),
Chamber of Mines Guidelines and Author’s interpretation

Red Earth cc Page 143
Measures 1b: Soil Contamination: Monitor and maintain optimum functioning (remove siltation and vegetation) of the earth ‘clean’ water diversion drain surrounding the upslope sections of the relevant ‘Infrastructure’ areas, together with the drains adjacent soil berm (entire length on the downslope side); as well as the earth ‘dirty’ water intercept drain/berm surrounding the downslope sections of the relevant ‘Infrastructure’ areas. The aforementioned will limit ‘clean’ water run-off from entering the ‘Infrastructure’ areas, as well as intercept ‘dirty’ water seepage and run-off derived from the ‘Infrastructure’ areas respectively. Institute all possible measures (e.g. additional concrete slabs, secondary drains, and berms) to encourage the run-off of 'dirty' water and rain water into drains, rather than allowing trapped water to infiltrate/leach through the ‘waste’/’non-waste’ layers, and thereafter into the buried in-situ soils (underlying a number of these areas) and water-tables.
Quarterly (drainage features-‘dirty’/’clean’ drains/canals/berms-monitor and maintain-repair leaks, clear blockages, remove vegetation, remove siltation, dredging).
Chamber of Mines Guidelines and Author’s interpretation
Measures 1c: Soil Contamination: Further Measures: i) Raw Materials – Product Stockpiles: Sweep up accumulated raw material layers off the concrete pad (if present) periodically when necessary; Construct concrete pads if they do not already exist. Do not spray excessive volumes of water (that drains through the pile) onto the coal stockpiles as this may lead to ‘acid rock drainage’ to the underlying layers; Cover the coal (and other potentially polluting) stockpiles with a portable impermeable sheet during the rainy season (where necessary) for the same reason.
When necessary-monthly (sweep), Daily (spray water)
Chamber of Mines Guidelines and Author’s interpretation
ii) Conveyors: Sweep up spilled material periodically. Spray water onto the raw materials that are to be transported by conveyor before these materials are deposited on the conveyor, the aforementioned for dust suppression. Monitor soil erosion and Maintain local drainage features (direct/contain 'dirty' water runoff and keep ‘clean’ water away). Maintain vegetative (grass) basal cover in the surrounding areas
Monthly (sweep up spilled materials), Continuously (spray water for dust suppression), Quarterly (drainage features-monitor and maintain), Biannually (monitor soil erosion and vegetative cover - spring before- and autumn after- the rains)
Chamber of Mines Guidelines and Author’s interpretation
iii) Fuel-Oil-Chemical Sites, and Salvage Yard: Maintain the sloped concrete pads and sumps at the fuel-oil tank/vehicle filling and maintenance/ hazardous chemical sites, and salvage yard; Clean concrete pads and sumps inside/underlying these structures/features periodically; Monitor, clean up and report accidental spillages immediately; Maintain the roofed area and concrete pads to prevent the ingress of rainfall or run-off; Spray water for dust suppression when necessary.
Immediately (clean up spillages), Weekly, or immediately after a spill (clean concrete pads and sumps), Monthly (scrape up accumulated ‘waste’ or ‘non-waste’ fines materials), When necessary (spray water), Ongoing (maintenance of roofed area and pads, and re-use or selling of unwanted materials)
Chamber of Mines Guidelines and Author’s interpretation

Red Earth cc Page 144
iv) Fumes and Fallout Monitor emissions and dust, both in the plant and downwind areas; Ongoing implementation of appropriate pollution reducing measures that are currently in place; Ongoing maintenance of equipment and processes that are designed to reduce emissions and dust; Clean up and dispose of accumulated ‘waste’ material layers (particularly fines); Spray water to limit blown dust in ‘safe’ ‘non-heat’/’non-electrical’ areas only!!
Continuously (monitor emissions and dust, implement appropriate measures, equipment/process maintenance), Periodically at intervals on a daily basis (spray water in ‘safe’ ‘non-heat’/’non-electrical’ areas only!!)
Author’s interpretation
Measures 2: ‘Waste’/’Non-Waste’ Erosion, Soil Quality, Land Use, and Land Capability: Given that the existing in-situ soils were either stripped/removed/buried during the Construction phase, the land use / land capability will remain Industrial (buildings, facilities and features: mostly non-vegetated) during the Operational phase. Thus during the Operational phase, soil distribution, soil erosion, and soil quality cannot be ameliorated directly in the majority of the aforementioned sites, except where soils/vegetation is present on the surface. However, the erosion of surface ‘waste’/’non-waste’ can be controlled to a certain extent by the implementation of Measures 1b. Furthermore, refer to Measures 1a, 1b, and 1c above.
As per Measures 1a – 1c Chamber of Mines Guidelines and Author’s interpretation
Impact AFTER Management
Major Long Term Local High Definite-Probable High - High

Red Earth cc Page 145
ACTIVITY AREAS: Mining, Coal Handling and Processing Plant Area (CHPP) ACTIVITIES (AND ASPECTS): Residue Stockpiles and Deposits: ‘Dirty’: Discard dump, Overburden stockpile (ASPECTS - All Potential Processes and Procedures)
IMPACT CATEGORY: Soil Contamination - TYPE OF IMPACT: Direct and Indirect - IMPACT DESCRIPTION: 1. Soil Contamination of Buried Underlying/Surrounding in-situ soils due to the infiltration/leaching of ‘dirty’ water and rain water through the ’dirty’ (carbonaceous) Residue Stockpiles and Deposits, and assorted ‘dirty’ Infrastructure; leading to sulphates, Acid Rock Drainage (ARD), hydrocarbons and other contaminants draining into the soils and running-off into the drainage areas; as well as contamination of the downwind (majority to the south-west) soils due to the settling of blown carbonaceous dust.
Magnitude Duration Scale Consequence Probability SIGNIFICANCE +/- Confidence
Impact BEFORE Management
Major Long Term Local High Definite High - High
Management Measures Time Period for Implementation Compliance with Standards
Measures 1a: Soil Contamination: Scrape up, consolidate in the relevant dump, or process any layers that may have spilled, accumulated or been spread out both within or surrounding these sites; Transport and dump carbonaceous discard (from discard dump), overburden rock (from overburden rock dump), and scraped up ‘waste’ fines (spilled and dust) into the opencast void on an ongoing basis. Carbonaceous materials must be dumped at the bottom of the opencast void, and overlaid by non-carbonaceous materials, before the sulphide minerals (e.g. pyrite) are given the opportunity to oxidise through exposure to air and water, thereby minimising the potential for ARD; Institute all possible measures to encourage the run-off of 'dirty' water and rain water into drains, rather than allowing trapped water to infiltrate into the buried in-situ soils (underlying these areas) and water-tables; Monitor soil contamination on an ongoing basis via the downslope boreholes. Spray water for dust suppression; Obey speed limits.
Continuously (monitoring and maintenance), Continuously (scrape up, consolidate, remove, and dump accumulated and surrounding ‘waste’ layer if present), Continuously (transport discard and overburden rock to the opencast void), Continuously (speed limits), Daily where necessary (spraying of water when operating machinery and haul trucks)
Chamber of Mines Guidelines and Author’s interpretation
Measures 1b: Soil Contamination: Monitor and maintain optimum functioning (remove siltation and vegetation) of the earth ‘clean’ water diversion drain surrounding the upslope sections of each of the dumps, together with its adjacent soil berm (entire length on the downslope side); as well as the earth ‘dirty’ water
Quarterly (drainage features-‘dirty’/’clean’ drains/canals/berms-monitor and maintain-repair leaks, clear blockages, remove vegetation, remove siltation, dredging).
Chamber of Mines Guidelines

Red Earth cc Page 146
intercept drain/berm (to the PCD’s) surrounding the downslope sections of each of the ‘dirty’ dumps. The aforementioned will limit ‘clean’ water run-off from entering these areas, as well as intercept ‘dirty’ water run-off derived from these areas respectively. Maintain the soil fertility and vegetative cover on the adjacent (to the drains) or surrounding berms.
Immediately after construction and once every 3-4 years thereafter (fertility monitoring and amelioration: sample and fertilise)
Impact AFTER Management
Moderate Medium Term
Local Medium Definite Medium - High

Red Earth cc Page 147
ACTIVITY AREAS: Coal Handling and Processing Plant Area (CHPP), Mine Infrastructure Area (MIA), Heavy Duty Vehicle Area (HDV) ACTIVITIES (AND ASPECTS): Water Supply Network: ‘Dirty’: Water treatment works (reverse osmosis package plant), Waste water treatment works (closed system package plant), Sludge and solids collection and disposal, Pollution control dams/ storm-water retention ponds (combined), Raw water dam (ASPECTS - All Potential Processes and Procedures)
IMPACT CATEGORY: Soil Contamination, Soil Erosion, Soil Quality - TYPE OF IMPACT: Direct, Indirect and Cumulative - IMPACT DESCRIPTION: 1a. Soil Contamination of the Underlying/Surrounding in-situ soils due to seepage of ‘dirty’ water below the base of- or through the walls of- the dams; as a result of being either poorly sealed (impermeable membrane liner) or poorly compacted (compacted-‘remoulded’ soils) bases/walls. 1b. Soil Contamination of the ‘topsoiled’ (some instances) dam walls due to the dumping of ‘dirty’ sludge materials derived from the dredging of the base of the dams. 1c. Soil Contamination of the Underlying/Surrounding in-situ soils due to seepage of leaked/spilled ‘dirty’ water or sludge from piping; or a shortage of, or poor maintenance of piping bund walls. 1d. Soil Contamination due to spillages of transported sediments from trucks. 2. Soil Erosion of the ‘topsoiled’ (some instances) dam walls or piping bund walls due to possible excessive side-slopes (>5.2 degrees, 9.2 % percentage grade), or alternatively possible poor vegetative (grass) basal cover. 3. Soil Quality reduction of the ‘topsoiled’ (some instances) dam walls or piping bund walls due to possible non-fertilisation.
Magnitude Duration Scale Consequence Probability SIGNIFICANCE +/- Confidence
Impact BEFORE Management
Major Long Term Local High Possible High - Medium
Management Measures Time Period for Implementation Compliance with Standards
Measures 1: Soil Contamination: 1a). Correct construction procedures are likely to have prevented leakage. Monitor seepage from the dams/water treatment works and maintain these features. Monitor and maintain optimum functioning (remove siltation and vegetation) of the earth ‘dirty’ water intercept drain downslope of each dam, together with its adjacent soil berm (entire length on the downslope side). Monitor soil contamination on an ongoing basis via the downslope boreholes.
Quarterly (dams-monitor and maintain), Quarterly (drainage features-‘dirty’/’clean’ drains/canals/berms-monitor and maintain-repair leaks, clear blockages, remove vegetation, remove siltation, dredging)
Chamber of Mines Guidelines and Author’s interpretation
1b). Dredged material from the PCD dams and drains must either be disposed of in the residual portion of the discard dump (for materials with a high pollution potential) or the opencast void [as applicable], but not dumped on the dam/drain/bund walls or in surrounding areas. Dried up sewage sludge material must be scraped up periodically and utilised as a ‘topsoil’ fertiliser in Opencast areas that are being rehabilitated on an ongoing basis during the Operational and Closure phases.
Annually (dredging PCD,s where necessary), Annually in spring (scrape up sewage sludge and utilise as a ‘topsoil’ fertiliser)
Chamber of Mines Guidelines and Author’s interpretation
1c). Clean up ‘dirty’ water and sludge from pipeline leaks and spills immediately. Immediately (clean up leaked or spilled Chamber of Mines Guidelines

Red Earth cc Page 148
Monitor, maintain, and repair pipelines and bund walls where necessary.
sludge), Daily (monitor for piping leaks –may also be indicated by a drop in sludge pressure), Immediately (repair piping leaks)
1d). Clean up sludge/solids spilled from haul trucks immediately. Immediately (clean up spilled sludge/solids from trucks)
Chamber of Mines Guidelines
Measures 2: Soil Erosion: Monitor soil erosion, and monitor and maintain the vegetative cover of the ‘topsoil’ dam walls and piping bund walls. Soil Erosion may be reduced by reducing side-slopes to < 5.2 degrees (9.2 % percentage grade) where necessary. Mature seeded grass may be mown from elsewhere and then spread out on areas that display a poor grass basal cover; No grazing or burning allowed.
Biannually (soil erosion and vegetative monitoring: spring before- and autumn after- the rains)
Chamber of Mines Guidelines and Author’s interpretation
Measures 3: Soil Quality: Sample/Fertilize the 'topsoil' dam walls and piping bund walls once every 3 -4 years in spring to maintain soil fertility and vegetative (grass) basal cover, thereby limiting soil erosion and continually refreshing the reproductive seed-bank.
Once every 3-4 years (fertility monitoring: sample and fertilise)
Chamber of Mines Guidelines
Impact AFTER Management
Moderate Long Term Local Medium Possible Medium - High

Red Earth cc Page 149
ACTIVITY AREAS: Mining, Coal Handling and Processing Plant Area (CHPP), Mine Infrastructure Area (MIA), Heavy Duty Vehicle Area (HDV)
ACTIVITIES (AND ASPECTS): Water Supply Network: ‘Dirty’ and ‘Clean’: ‘dirty’ water intercept berms/drains/canals, ‘clean’ water diversion berms/drains/canals, Pipelines, Pump stations, Storage tanks (ASPECTS - All Potential Processes and Procedures)
IMPACT CATEGORY: Soil Contamination, Soil Erosion, Soil Quality - TYPE OF IMPACT: Direct and Indirect - IMPACT DESCRIPTION: 1a. Soil Contamination due to seepage of ‘dirty’ (in some instances) water below possibly poorly compacted/sealed existing canals/drains, or due to possible siltation/vegetative growth in canals/drains. 1b. Soil Contamination of the Underlying/Surrounding in-situ soils due to seepage of dirty water from pipelines/pump stations/storage tanks, or seepage of leaked/spilled oil/fuel from the pump motors (if mechanical). 2a. Soil Erosion of the adjacent (to canals/drains) ‘topsoil’ berms due to either possible excessive side-slopes (>5.2 degrees, 9.2 % percentage grade), or alternatively possible poor vegetative (grass) basal cover. 2b. Soil Erosion of Underlying/Surrounding in-situ soils due to possible leakage of water from pipelines/pump stations/storage tanks. 3. Soil Quality reduction due to possible non-fertilisation or vegetation maintenance of the ‘topsoil’ berms.
Magnitude Duration Scale Consequence Probability SIGNIFICANCE +/- Confidence
Impact BEFORE Management
Major Long Term Local High Possible High - Medium
Management Measures Time Period for Implementation Compliance with Standards
Measures 1a: Soil Contamination (canals, drains, berms): Monitor and maintain optimum functioning (remove siltation and vegetation) of the 'dirty' water run-off intercept drains/berms to the PCD's, as well as the ‘clean’ water diversion drains/berms. The aforementioned will limit ‘dirty’ and ‘clean’ run-off water. Promote water flow in the canals/drains to limit seepage below those that may be poorly sealed. Dredged material from the canals/drains must be disposed of in the discard dump (high pollution potential), but not dumped on the canal/drain walls or in surrounding areas. Measures 1b: Soil Contamination (pipelines, pump stations, storage tanks): Clean up oil/fuel spillages below pumps in pump station immediately; Clean concrete pad below pumps in pump station periodically, to collect up minor oil/fuel leakage; Ongoing maintenance of equipment.
Canals, Drains, Berms: Quarterly (drainage features-‘dirty’/’clean’ drains/canals/berms-monitor and maintain-repair leaks, clear blockages, remove vegetation, remove siltation, dredging), Annually (dredging where necessary) Pipelines, Pump Stations, Storage Tanks: Immediately (clean up oil/fuel spillages), Monthly (clean concrete pad in pump station), Ongoing (equipment maintenance)
Chamber of Mines Guidelines and Author’s interpretation
Measures 2: Soil Erosion: Canal and Drain Berms:
Canal and Drain Berms: Biannually (soil erosion and vegetative monitoring: spring before- and autumn
Chamber of Mines Guidelines and Author’s interpretation