APPENDIX E: SCHOOL SYSTEM INFRASTRUCTURE NEEDS BY …
38
221 WWW.TN.GOV/TACIR Appendix E: School System Infrastructure Needs by County Building Tennessee’s Tomorrow: Anticipating the State’s Infrastructure Needs July 2016 through June 2021 APPENDIX E: SCHOOL SYSTEM INFRASTRUCTURE NEEDS BY COUNTY Table E-1 Tennessee Public School Systems as of July 2016 ..................................................... 223 Table E-2 Infrastructure Needs at Public Elementary and Secondary Schools .................. 225 Table E-3 Infrastructure Needs at Existing Public Schools......................................................... 229 Table E-4 Infrastructure Needs at Public Elementary and Secondary Schools .................. 233 Table E-5 Overall Condition of Schools by School System as of July 2016 .......................... 238 Table E-6 Overall School Ratings and Costs to Upgrade Components to Excellent or Good Condition ................................................................................ 240 Table E-7 Existing School Classroom Counts by School System ............................................. 245 Table E-8 Technology Needs at Existing Public Schools............................................................. 250 Table E-9 Mandate Compliance Needs ............................................................................................. 254 DRAFT
Transcript of APPENDIX E: SCHOOL SYSTEM INFRASTRUCTURE NEEDS BY …

221WWW.TN.GOV/TACIR
Appendix E: School System Infrastructure Needs by County
Building Tennessee’s Tomorrow:Anticipating the State’s Infrastructure Needs
July 2016 through June 2021
APPENDIX E: SCHOOL SYSTEM INFRASTRUCTURE NEEDS BY COUNTY
Table E-1 Tennessee Public School Systems as of July 2016 .....................................................223
Table E-2 Infrastructure Needs at Public Elementary and Secondary Schools ..................225
Table E-3 Infrastructure Needs at Existing Public Schools .........................................................229
Table E-4 Infrastructure Needs at Public Elementary and Secondary Schools ..................233
Table E-5 Overall Condition of Schools by School System as of July 2016 ..........................238
Table E-6 Overall School Ratings and Costs to Upgrade Componentsto Excellent or Good Condition ................................................................................240
Table E-7 Existing School Classroom Counts by School System .............................................245
Table E-8 Technology Needs at Existing Public Schools .............................................................250
Table E-9 Mandate Compliance Needs .............................................................................................254
DRAFT

DRAFT

223WWW.TN.GOV/TACIR
Appendix E: School System Infrastructure Needs by County
Scho
ol
Cou
ntSt
uden
t C
ount
Scho
ol
Cou
ntSt
uden
t C
ount
186,
370
62,
864
388
016
8,17
98
4,42
08
3,83
314
8,43
84
2,61
08
2,13
48
3,22
65
1,73
16
2,09
34
1,89
011
5,41
120
10,7
482
500
75,
047
93,
937
179,
917
31,
046
95,
406
31,
938
155,
475
31,
289
71,
938
83,
861
22
83,
538
264
016
6,67
24
1,18
47
2,76
93
1,30
67
2,07
81
338
1810
,091
389
372
43,1
0215
5,24
13
985
52,
448
93,
575
136,
249
73,
456
62,
814
186,
899
134,
271
163
94
1,03
95
2,90
912
4,46
89
3,87
01
713
288
110
4,35
16
2,95
73
1,31
73
1,69
07
3,41
08
3,33
91
583
51,
308
137
37
2,88
65
1,94
24
1,46
812
7,17
913
7,15
414
782
,050
72,
004
41,
585
8757
,929
Tab
le E
-1.
Ten
ness
ee P
ublic
Sch
ool S
yste
ms a
s of J
uly
2016
Alp
habe
tical
by
Cou
nty
And
erso
nC
linto
nA
nder
son
Oak
Rid
geB
edfo
rdB
edfo
rd C
ount
y
Cou
nty
Scho
ol S
yste
m
And
erso
nA
nder
son
Cou
nty
DeK
alb
DeK
alb
Cou
nty
Dic
kson
Dic
kson
Cou
nty
Dye
rD
yer C
ount
yD
yer
Dye
rsbu
rg
Can
non
Can
non
Cou
nty
Blo
unt
Blo
unt C
ount
yB
loun
tM
aryv
ille
Bra
dley
Bra
dley
Cou
nty
Ben
ton
Ben
ton
Cou
nty
Ble
dsoe
Ble
dsoe
Cou
nty
Blo
unt
Alc
oa
Cro
cket
tC
rock
ett C
ount
yC
umbe
rland
Cum
berla
nd C
ount
y
Cof
fee
Man
ches
ter
Cof
fee
Tulla
hom
aC
rock
ett
Ala
mo
Coc
keN
ewpo
rtC
offe
eC
offe
e C
ount
y
Che
ster
Che
ster
Cou
nty
Cla
ibor
neC
laib
orne
Cou
nty
Cro
cket
tB
ells
Cla
yC
lay
Cou
nty
Car
ter
Car
ter C
ount
yC
arte
rEl
izab
etht
onC
heat
ham
Che
atha
m C
ount
y
Coc
keC
ocke
Cou
nty
Car
roll
McK
enzi
e SS
DC
arro
llSo
uth
Car
roll
SSD
Car
roll
Wes
t Car
roll
SSD
Gre
ene
Gre
enev
ille
Car
roll
Car
roll
Cou
nty
Car
roll
Hol
low
Roc
k-B
ruce
ton
SSD
Car
roll
Hun
tingd
on S
SD
Bra
dley
Cle
vela
ndC
ampb
ell
Cam
pbel
l Cou
nty
Faye
tteFa
yette
Cou
nty
Fent
ress
Fent
ress
Cou
nty
Fran
klin
Fran
klin
Cou
nty
Gra
inge
rG
rain
ger C
ount
yG
reen
eG
reen
e C
ount
y
Gib
son
Mila
n SS
DG
ibso
nTr
ento
n SS
DG
iles
Gile
s Cou
nty
Gib
son
Bra
dfor
d SS
DG
ibso
nG
ibso
n C
ount
y SS
DG
ibso
nH
umbo
ldt
Han
cock
Han
cock
Cou
nty
Har
dem
anH
arde
man
Cou
nty
Har
din
Har
din
Cou
nty
Gru
ndy
Gru
ndy
Cou
nty
Ham
blen
Ham
blen
Cou
nty
Ham
ilton
Ham
ilton
Cou
nty
Hen
ders
onH
ende
rson
Cou
nty
Hen
ders
onLe
ton
Hen
ryH
enry
Cou
nty
Haw
kins
Haw
kins
Cou
nty
Haw
kins
Rog
ersv
ille
Hay
woo
dH
ayw
ood
Cou
nty
Hum
phre
ysH
umph
reys
Cou
nty
Jack
son
Jack
son
Cou
nty
Jeff
erso
nJe
ffer
son
Cou
nty
Hen
ryPa
ris S
SDH
ickm
anH
ickm
an C
ount
yH
oust
onH
oust
on C
ount
y
John
son
John
son
Cou
nty
Kno
xK
nox
Cou
nty
Dav
idso
nD
avid
son
Cou
nty
Dec
atur
Dec
atur
Cou
nty
Cou
nty
Scho
ol S
yste
m
DRAFT

WWW.TN.GOV/TACIR224
Building Tennessee’s Tomorrow: Anticipating the State’s Infrastructure NeedsT
able
E-1
. T
enne
ssee
Pub
lic S
choo
l Sys
tem
s as o
f Jul
y 20
16A
lpha
betic
al b
y C
ount
y
Scho
ol
Cou
ntSt
uden
t C
ount
Scho
ol
Cou
ntSt
uden
t C
ount
378
947
42,6
507
4,13
33
1,21
913
6,60
97
2,84
04
1,72
83
2,25
73
1,43
430
14,2
658
3,83
54
4,98
53
2,26
411
8,50
09
4,67
48
8,02
15
1,57
05
5,72
71
353
190
19
5,51
84
2,53
99
4,19
918
711
5,57
98
3,67
99
3,02
523
12,4
926
2,00
310
4,03
08
3,96
61
275
127,
151
105,
311
229,
899
2011
,900
4828
,764
41,
712
1410
,940
125,
353
31,
236
41,
532
72,
319
3931
,882
103,
484
285
22
724
83,
032
116,
363
73,
411
117,
772
31,
565
158,
596
93,
099
82,
215
41,
041
114,
204
272
29
3,85
96
2,36
18
3,43
820
10,7
2342
36,3
031
821
63,
552
74,
248
2017
,206
176,
583
1,73
396
0,95
920
10,9
7712
7,98
1N
ote:
SSD
is th
e ab
brev
iatio
n fo
r Spe
cial
Sch
ool D
istri
ct.
Spec
ial S
choo
l Dis
trict
s do
not n
eces
saril
y co
inci
de w
ith c
ity o
r cou
nty
boun
darie
s and
hav
e se
para
te p
rope
rty ta
x ra
tes s
et b
y th
e Te
nnes
see
Gen
eral
Ass
embl
y. T
hey
do n
ot h
ave
sale
s tax
ing
auth
ority
.
Laud
erda
leLa
uder
dale
Cou
nty
Law
renc
eLa
wre
nce
Cou
nty
Lew
isLe
wis
Cou
nty
Lake
Lake
Cou
nty
Rut
herf
ord
Rut
herf
ord
Cou
nty
Scot
tO
neid
a SS
DSc
ott
Scot
t Cou
nty
Sequ
atch
ieSe
quat
chie
Cou
nty
Loud
onLo
udon
Cou
nty
McM
inn
Ath
ens
McM
inn
Etow
ah
Linc
oln
Faye
ttevi
lleLi
ncol
nLi
ncol
n C
ount
yLo
udon
Leno
ir C
ity
Rhe
aR
hea
Cou
nty
Roa
neR
oane
Cou
nty
Pick
ett
Pick
ett C
ount
yPo
lkPo
lk C
ount
yPu
tnam
Putn
am C
ount
y
Rob
erts
onR
ober
tson
Cou
nty
Rut
herf
ord
Mur
free
sbor
o
Obi
onO
bion
Cou
nty
Mon
roe
Mon
roe
Cou
nty
Mon
roe
Swee
twat
erM
ontg
omer
yM
ontg
omer
y C
ount
y
Obi
onU
nion
City
Ove
rton
Ove
rton
Cou
nty
Perr
yPe
rry
Cou
nty
Moo
reM
oore
Cou
nty
Mor
gan
Mor
gan
Cou
nty
Rhe
aD
ayto
n
Mar
shal
lM
arsh
all C
ount
yM
aury
Mau
ry C
ount
yM
eigs
Mei
gs C
ount
y
Shel
byC
ollie
rvill
eSh
elby
Ger
man
tow
n
Sulli
van
Bris
tol
Mad
ison
Mad
ison
Cou
nty
Mar
ion
Mar
ion
Cou
nty
Mar
ion
Ric
hard
City
SSD
McM
inn
McM
inn
Cou
nty
McN
airy
McN
airy
Cou
nty
Mac
onM
acon
Cou
nty
Sulli
van
Kin
gspo
rtSu
lliva
nSu
lliva
n C
ount
ySu
mne
rSu
mne
r Cou
nty
Sevi
erSe
vier
Cou
nty
Shel
byA
rling
ton
Shel
byB
artle
tt
Smith
Smith
Cou
nty
Stew
art
Stew
art C
ount
y
Shel
byLa
kela
ndSh
elby
Mill
ingt
onSh
elby
Shel
by C
ount
y
Way
neW
ayne
Cou
nty
Uni
onU
nion
Cou
nty
Van
Bur
enV
an B
uren
Cou
nty
War
ren
War
ren
Cou
nty
Tipt
onTi
pton
Cou
nty
Trou
sdal
eH
arts
ville
-Tro
usda
le
Uni
coi
Uni
coi C
ount
y
Stat
ewid
e C
ount
s
Cou
nty
Scho
ol S
yste
mC
ount
ySc
hool
Sys
tem
Will
iam
son
Will
iam
son
Cou
nty
Wils
onLe
bano
n SS
DW
ilson
Wils
on C
ount
y
Wea
kley
Wea
kley
Cou
nty
Whi
teW
hite
Cou
nty
Will
iam
son
Fran
klin
SSD
Was
hing
ton
John
son
City
Was
hing
ton
Was
hing
ton
Cou
nty
DRAFT

225WWW.TN.GOV/TACIR
Appendix E: School System Infrastructure Needs by County
County School System Student Count
Cost Per Student
Anderson Anderson County $ 6,370 $703Anderson Clinton 880 $835Anderson Oak Ridge 4,420 $4,453Bedford Bedford County 8,438 $5,027Benton Benton County 2,134 $3,880Bledsoe Bledsoe County 1,731 $656Blount Blount County 10,748 $763Blount Alcoa 1,890 $74Blount Maryville 5,047 $2,232Bradley Bradley County 9,917 $4,487Bradley Cleveland 5,406 $2,926Campbell Campbell County 5,475 $461Cannon Cannon County 1,938 $57Carroll Carroll County 2 $123,474Carroll Hollow Rock-Bruceton SSD 640 $0Carroll Huntingdon SSD 1,184 $0Carroll McKenzie SSD 1,306 $278Carroll South Carroll SSD 338 $148Carroll West Carroll SSD 893 $0Carter Carter County 5,241 $3,278Carter Elizabethton 2,448 $4,333Cheatham Cheatham County 6,249 $4,908Chester Chester County 2,814 $721Claiborne Claiborne County 4,271 $1,512Clay Clay County 1,039 $1,781Cocke Cocke County 4,468 $4,574Cocke Newport 713 $512Coffee Coffee County 4,351 $2,018Coffee Manchester 1,317 $0Coffee Tullahoma 3,410 $880Crockett Crockett County 1,942 $4,831Crockett Alamo 583 $15,282Crockett Bells 373 $215Cumberland Cumberland County 7,179 $4,684Davidson Davidson County 82,050 $14,855Decatur Decatur County 1,585 $694DeKalb DeKalb County 2,864 $16,165Dickson Dickson County 8,179 $5,399Dyer Dyer County 3,833 $1,185Dyer Dyersburg 2,610 $2,115
4,476,065735,000
19,683,13342,417,192
8,281,2001,135,0008,198,870
140,00011,265,00044,493,00015,816,000
2,525,000
4,540,7775,520,000
46,292,00044,157,618
1,218,818,2671,100,000
80,00033,625,000
9,380,0008,910,000
03,000,000
365,0008,778,000
1,850,00020,438,607
2,028,6006,459,000
Table E-2. Infrastructure Needs at Public Elementary and Secondary SchoolsTotal Estimated Cost and Cost Per Student by School System
Five-year Period July 2016 through June 2021
Total Est. Cost
10,606,38430,670,000
017,177,614
363,00050,000
00
110,031270,000
DRAFT

WWW.TN.GOV/TACIR226
Building Tennessee’s Tomorrow: Anticipating the State’s Infrastructure Needs
County School System Student Count
Cost Per Student
Table E-2. Infrastructure Needs at Public Elementary and Secondary SchoolsTotal Estimated Cost and Cost Per Student by School System
Five-year Period July 2016 through June 2021
Total Est. Cost
Fayette Fayette County 3,226 $1,228Fentress Fentress County 2,093 $1,871Franklin Franklin County 5,411 $629Gibson Humboldt 1,046 $3,484Gibson Milan SSD 1,938 $1,290Gibson Trenton SSD 1,289 $0Gibson Bradford SSD 500 $0Gibson Gibson County SSD 3,937 $4,318Giles Giles County 3,861 $456Grainger Grainger County 3,538 $241Greene Greene County 6,672 $429Greene Greeneville 2,769 $3,122Grundy Grundy County 2,078 $3,737Hamblen Hamblen County 10,091 $2,769Hamilton Hamilton County 43,102 $3,294Hancock Hancock County 985 $1,680Hardeman Hardeman County 3,575 $1,083Hardin Hardin County 3,456 $382Hawkins Hawkins County 6,899 $1,411Hawkins Rogersville 639 $0Haywood Haywood County 2,909 $2,968Henderson Henderson County 3,870 $1,004Henderson Lexington 881 $679Henry Henry County 2,957 $1,864Henry Paris SSD 1,690 $4,734Hickman Hickman County 3,339 $487Houston Houston County 1,308 $61Humphreys Humphreys County 2,886 $4,109Jackson Jackson County 1,468 $869Jefferson Jefferson County 7,154 $4,517Johnson Johnson County 2,004 $77Knox Knox County 57,929 $1,711Lake Lake County 789 $13,705Lauderdale Lauderdale County 4,133 $8,923Lawrence Lawrence County 6,609 $1,077Lewis Lewis County 1,728 $0Lincoln Lincoln County 3,835 $604Lincoln Fayetteville 1,434 $1,465Loudon Loudon County 4,674 $2,152Loudon Lenoir City 2,264 $1,979
10,056,6004,480,000
2,315,0002,100,000
7,116,8490
10,810,00036,877,500
155,15099,111,576
1,275,00032,318,000
80,00011,860,000
8,000,0001,625,000
598,0005,511,654
8,635,2433,884,495
9,735,4110
3,870,0001,320,454
141,992,0001,653,671
7,763,00027,944,800
2,864,1308,644,543
1,762,000853,237
017,000,000
2,500,0000
3,405,0003,645,000
3,960,0003,915,000
DRAFT

227WWW.TN.GOV/TACIR
Appendix E: School System Infrastructure Needs by County
County School System Student Count
Cost Per Student
Table E-2. Infrastructure Needs at Public Elementary and Secondary SchoolsTotal Estimated Cost and Cost Per Student by School System
Five-year Period July 2016 through June 2021
Total Est. Cost
McMinn McMinn County 5,518 $1,927McMinn Athens 1,570 $10,516McMinn Etowah 353 $3,639McNairy McNairy County 4,199 $1,850Macon Macon County 3,679 $8,316Madison Madison County 12,492 $2,619Marion Marion County 4,030 $10,830Marion Richard City SSD 275 $0Marshall Marshall County 5,311 $216Maury Maury County 11,900 $4,682Meigs Meigs County 1,712 $1,004Monroe Monroe County 5,353 $4,609Monroe Sweetwater 1,532 $2,679Montgomery Montgomery County 31,882 $6,842Moore Moore County 852 $25,831Morgan Morgan County 3,032 $670Obion Obion County 3,411 $171Obion Union City 1,565 $4,907Overton Overton County 3,099 $2,675Perry Perry County 1,041 $136Pickett Pickett County 722 $596Polk Polk County 2,361 $47Putnam Putnam County 10,723 $1,298Rhea Rhea County 4,248 $24Rhea Dayton 821 $0Roane Roane County 6,583 $8,770Robertson Robertson County 10,977 $16,120Rutherford Rutherford County 42,650 $4,652Rutherford Murfreesboro 7,981 $3,696Scott Scott County 2,840 $2,098Scott Oneida SSD 1,219 $0Sequatchie Sequatchie County 2,257 $880Sevier Sevier County 14,265 $7,300Shelby Shelby County 115,579 $4,201Shelby Arlington 4,985 $334Shelby Bartlett 8,500 $9,867Shelby Collierville 8,021 $13,621Shelby Germantown 5,727 $5,634Shelby Lakeland 901 $19,708Shelby Millington 2,539 $20,288
17,762,00051,504,000
109,256,75032,265,000
1,664,00083,868,200
104,136,885485,501,044
01,985,000
29,500,0005,960,000
176,945,000198,401,376
057,734,993
13,915,000100,000
430,000110,000
8,289,000142,000
585,0007,677,508
22,000,0002,030,500
4,105,000218,131,362
1,719,00024,674,853
1,147,20355,716,500
43,640,6850
30,590,50032,714,200
1,285,0007,768,900
10,631,68816,507,000
DRAFT

WWW.TN.GOV/TACIR228
Building Tennessee’s Tomorrow: Anticipating the State’s Infrastructure Needs
County School System Student Count
Cost Per Student
Table E-2. Infrastructure Needs at Public Elementary and Secondary SchoolsTotal Estimated Cost and Cost Per Student by School System
Five-year Period July 2016 through June 2021
Total Est. Cost
Smith Smith County 3,025 $2,710Stewart Stewart County 2,003 $1,330Sullivan Sullivan County 9,899 $15,598Sullivan Bristol 3,966 $28,465Sullivan Kingsport 7,151 $4,627Sumner Sumner County 28,764 $4,159Tipton Tipton County 10,940 $366Trousdale Hartsville-Trousdale 1,236 $1,068Unicoi Unicoi County 2,319 $65Union Union County 3,484 $749Van Buren Van Buren County 724 $1,092Warren Warren County 6,363 $848Washington Washington County 8,596 $10,405Washington Johnson City 7,772 $4,851Wayne Wayne County 2,215 $1,005Weakley Weakley County 4,204 $4,406White White County 3,859 $2,950Williamson Williamson County 36,303 $15,218Williamson Franklin SSD 3,438 $4,769Wilson Wilson County 17,206 $18,516Wilson Lebanon SSD 3,552 $7,088Grand Total $ 960,959 $5,7245,500,849,177
318,595,94025,175,000
552,475,00016,395,000
18,519,97611,385,000
37,704,0002,225,000
5,399,10089,447,500
2,609,365790,000
1,320,000150,000
119,619,7294,009,000
112,885,54933,085,000
2,665,000154,406,000
8,199,200
DRAFT

229WWW.TN.GOV/TACIR
Appendix E: School System Infrastructure Needs by County
County School System Student Count
Cost Per Student
Anderson Anderson County $ 6,370 $703Anderson Clinton 880 $835Anderson Oak Ridge 4,420 $2,078Bedford Bedford County 8,438 $642Benton Benton County 2,134 $1,795Bledsoe Bledsoe County 1,731 $656Blount Blount County 10,748 $763Blount Alcoa 1,890 $74Blount Maryville 5,047 $429Bradley Bradley County 9,917 $1,032Bradley Cleveland 5,406 $336Campbell Campbell County 5,475 $452Cannon Cannon County 1,938 $57Carroll Carroll County 2 $123,474Carroll Hollow Rock-Bruceton SSD 640 $0Carroll Huntingdon SSD 1,184 $0Carroll McKenzie SSD 1,306 $278Carroll South Carroll SSD 338 $148Carroll West Carroll SSD 893 $0Carter Carter County 5,241 $2,961Carter Elizabethton 2,448 $1,596Cheatham Cheatham County 6,249 $107Chester Chester County 2,814 $721Claiborne Claiborne County 4,271 $857Clay Clay County 1,039 $1,348Cocke Cocke County 4,468 $2,053Cocke Newport 713 $512Coffee Coffee County 4,351 $2,018Coffee Manchester 1,317 $0Coffee Tullahoma 3,410 $293Crockett Crockett County 1,942 $144Crockett Alamo 583 $1,132Crockett Bells 373 $80Cumberland Cumberland County 7,179 $2,469Davidson Davidson County 82,050 $10,826Decatur Decatur County 1,585 $694DeKalb DeKalb County 2,864 $151Dickson Dickson County 8,179 $1,884Dyer Dyer County 3,833 $730Dyer Dyersburg 2,610 $2,085
4,476,065735,000
Total Est. Cost
1,816,0002,475,000
2,165,00010,233,500
8,198,870140,000
3,831,2001,135,000
9,183,1335,420,000
3,906,384670,000
015,516,614
363,00050,000
00
110,031270,000
280,000660,000
01,000,000
365,0008,778,000
1,400,0009,172,607
2,028,6003,659,000
2,797,5995,440,000
432,00015,406,948
888,287,2671,100,000
30,00017,725,000
Table E-3. Infrastructure Needs at Existing Public SchoolsTotal Estimated Cost and Cost Per Student by School System
Five-year Period July 2016 through June 2021
DRAFT

WWW.TN.GOV/TACIR230
Building Tennessee’s Tomorrow: Anticipating the State’s Infrastructure Needs
County School System Student Count
Cost Per Student
Total Est. Cost
Table E-3. Infrastructure Needs at Existing Public SchoolsTotal Estimated Cost and Cost Per Student by School System
Five-year Period July 2016 through June 2021
Fayette Fayette County 3,226 $1,228Fentress Fentress County 2,093 $1,871Franklin Franklin County 5,411 $629Gibson Humboldt 1,046 $3,484Gibson Milan SSD 1,938 $1,290Gibson Trenton SSD 1,289 $0Gibson Bradford SSD 500 $0Gibson Gibson County SSD 3,937 $0Giles Giles County 3,861 $456Grainger Grainger County 3,538 $241Greene Greene County 6,672 $339Greene Greeneville 2,769 $3,122Grundy Grundy County 2,078 $3,737Hamblen Hamblen County 10,091 $1,778Hamilton Hamilton County 43,102 $580Hancock Hancock County 985 $969Hardeman Hardeman County 3,575 $1,083Hardin Hardin County 3,456 $382Hawkins Hawkins County 6,899 $1,049Hawkins Rogersville 639 $0Haywood Haywood County 2,909 $2,216Henderson Henderson County 3,870 $991Henderson Lexington 881 $679Henry Henry County 2,957 $207Henry Paris SSD 1,690 $4,734Hickman Hickman County 3,339 $487Houston Houston County 1,308 $61Humphreys Humphreys County 2,886 $3,416Jackson Jackson County 1,468 $596Jefferson Jefferson County 7,154 $3,469Johnson Johnson County 2,004 $77Knox Knox County 57,929 $520Lake Lake County 789 $13,705Lauderdale Lauderdale County 4,133 $8,923Lawrence Lawrence County 6,609 $320Lewis Lewis County 1,728 $0Lincoln Lincoln County 3,835 $604Lincoln Fayetteville 1,434 $1,465Loudon Loudon County 4,674 $205Loudon Lenoir City 2,264 $1,714
3,960,0003,915,000
2,264,1308,644,543
1,762,000853,237
00
2,500,0000
3,405,0003,645,000
6,445,2433,834,495
7,235,4110
3,870,0001,320,454
24,993,000953,671
7,763,00017,944,800
155,15030,126,576
875,00024,818,000
80,0009,860,000
8,000,0001,625,000
598,000611,654
956,6003,880,000
2,315,0002,100,000
2,116,8490
10,810,00036,877,500
DRAFT

231WWW.TN.GOV/TACIR
Appendix E: School System Infrastructure Needs by County
County School System Student Count
Cost Per Student
Total Est. Cost
Table E-3. Infrastructure Needs at Existing Public SchoolsTotal Estimated Cost and Cost Per Student by School System
Five-year Period July 2016 through June 2021
McMinn McMinn County 5,518 $1,927McMinn Athens 1,570 $4,922McMinn Etowah 353 $3,639McNairy McNairy County 4,199 $930Macon Macon County 3,679 $337Madison Madison County 12,492 $2,442Marion Marion County 4,030 $3,031Marion Richard City SSD 275 $0Marshall Marshall County 5,311 $216Maury Maury County 11,900 $659Meigs Meigs County 1,712 $266Monroe Monroe County 5,353 $4,045Monroe Sweetwater 1,532 $2,679Montgomery Montgomery County 31,882 $2,305Moore Moore County 852 $18,786Morgan Morgan County 3,032 $670Obion Obion County 3,411 $142Obion Union City 1,565 $1,589Overton Overton County 3,099 $2,640Perry Perry County 1,041 $136Pickett Pickett County 722 $457Polk Polk County 2,361 $47Putnam Putnam County 10,723 $388Rhea Rhea County 4,248 $24Rhea Dayton 821 $0Roane Roane County 6,583 $1,166Robertson Robertson County 10,977 $8,422Rutherford Rutherford County 42,650 $753Rutherford Murfreesboro 7,981 $658Scott Scott County 2,840 $408Scott Oneida SSD 1,219 $0Sequatchie Sequatchie County 2,257 $392Sevier Sevier County 14,265 $1,328Shelby Shelby County 115,579 $4,142Shelby Arlington 4,985 $334Shelby Bartlett 8,500 $9,632Shelby Collierville 8,021 $1,777Shelby Germantown 5,727 $5,592Shelby Lakeland 901 $93Shelby Millington 2,539 $2,696
10,631,6887,727,000
456,00021,654,853
1,147,2037,843,000
12,213,2250
1,240,50030,504,200
1,285,0003,903,900
330,000110,000
8,179,000142,000
485,0002,486,508
16,000,0002,030,500
4,105,00073,489,000
0885,000
5,250,0001,160,000
92,445,00032,129,376
07,674,993
4,165,000100,000
84,0006,845,000
14,256,75032,025,000
1,664,00081,868,200
18,948,885478,712,160
DRAFT

WWW.TN.GOV/TACIR232
Building Tennessee’s Tomorrow: Anticipating the State’s Infrastructure Needs
County School System Student Count
Cost Per Student
Total Est. Cost
Table E-3. Infrastructure Needs at Existing Public SchoolsTotal Estimated Cost and Cost Per Student by School System
Five-year Period July 2016 through June 2021
Smith Smith County 3,025 $913Stewart Stewart County 2,003 $1,306Sullivan Sullivan County 9,899 $6,910Sullivan Bristol 3,966 $14,849Sullivan Kingsport 7,151 $1,595Sumner Sumner County 28,764 $2,247Tipton Tipton County 10,940 $211Trousdale Hartsville-Trousdale 1,236 $1,068Unicoi Unicoi County 2,319 $65Union Union County 3,484 $699Van Buren Van Buren County 724 $1,092Warren Warren County 6,363 $848Washington Washington County 8,596 $1,742Washington Johnson City 7,772 $519Wayne Wayne County 2,215 $824Weakley Weakley County 4,204 $3,549White White County 3,859 $2,950Williamson Williamson County 36,303 $2,223Williamson Franklin SSD 3,438 $4,769Wilson Wilson County 17,206 $3,754Wilson Lebanon SSD 3,552 $200Grand Total $ 960,959 $2,794
68,406,000
2,763,200
2,685,192,931
64,595,940710,000
80,715,00016,395,000
14,919,97611,385,000
4,030,0001,825,000
5,399,10014,972,000
2,434,365790,000
1,320,000150,000
64,619,7292,309,000
58,885,54911,405,000
2,615,000
DRAFT

233WWW.TN.GOV/TACIR
Appendix E: School System Infrastructure Needs by County
Cou
nty
Scho
ol S
yste
mSt
uden
t C
ount
And
erso
nA
nder
son
Cou
nty
6,37
0$
0$
0$
2,12
5,81
7$
2,35
0,24
8$
0$
4,47
6,06
5A
nder
son
Clin
ton
880
00
710,
000
25,0
000
735,
000
And
erso
nO
ak R
idge
4,42
010
,500
,000
03,
213,
133
5,97
0,00
00
19,6
83,1
33B
edfo
rdB
edfo
rd C
ount
y8,
438
31,8
50,0
005,
147,
192
5,42
0,00
00
042
,417
,192
Ben
ton
Ben
ton
Cou
nty
2,13
420
0,00
04,
250,
000
2,66
2,00
01,
169,
200
08,
281,
200
Ble
dsoe
Ble
dsoe
Cou
nty
1,73
10
094
0,00
019
5,00
00
1,13
5,00
0B
loun
tB
loun
t Cou
nty
10,7
480
06,
054,
000
2,14
4,87
00
8,19
8,87
0B
loun
tA
lcoa
1,89
00
00
140,
000
014
0,00
0B
loun
tM
aryv
ille
5,04
70
9,10
0,00
02,
165,
000
00
11,2
65,0
00B
radl
eyB
radl
ey C
ount
y9,
917
16,0
00,0
002,
259,
500
10,1
05,0
0012
8,50
016
,000
,000
44,4
93,0
00B
radl
eyC
leve
land
5,40
614
,000
,000
085
6,00
096
0,00
00
15,8
16,0
00C
ampb
ell
Cam
pbel
l Cou
nty
5,47
50
50,0
0022
0,00
02,
255,
000
02,
525,
000
Can
non
Can
non
Cou
nty
1,93
80
00
110,
031
011
0,03
1C
arro
llC
arro
ll C
ount
y2
00
210,
000
60,0
000
270,
000
Car
roll
Hol
low
Roc
k-B
ruce
ton
SSD
640
00
00
00
Car
roll
Hun
tingd
on S
SD1,
184
00
00
00
Car
roll
McK
enzi
e SS
D1,
306
00
318,
000
45,0
000
363,
000
Car
roll
Sout
h C
arro
ll SS
D33
80
050
,000
00
50,0
00C
arro
llW
est C
arro
ll SS
D89
30
00
00
0C
arte
rC
arte
r Cou
nty
5,24
10
1,66
1,00
014
,957
,400
559,
214
017
,177
,614
Car
ter
Eliz
abet
hton
2,44
80
6,70
0,00
03,
791,
131
115,
253
010
,606
,384
Che
atha
mC
heat
ham
Cou
nty
6,24
930
,000
,000
067
0,00
00
030
,670
,000
Che
ster
Che
ster
Cou
nty
2,81
40
01,
795,
000
233,
600
02,
028,
600
Cla
ibor
neC
laib
orne
Cou
nty
4,27
11,
800,
000
1,00
0,00
02,
809,
000
850,
000
06,
459,
000
Cla
yC
lay
Cou
nty
1,03
90
450,
000
1,35
0,00
050
,000
01,
850,
000
Coc
keC
ocke
Cou
nty
4,46
80
11,2
66,0
008,
036,
000
1,13
6,60
70
20,4
38,6
07C
ocke
New
port
713
00
300,
000
65,0
000
365,
000
Cof
fee
Cof
fee
Cou
nty
4,35
10
08,
778,
000
00
8,77
8,00
0
Tab
le E
-4.
Infr
astr
uctu
re N
eeds
at P
ublic
Ele
men
tary
and
Sec
onda
ry S
choo
lsT
otal
Est
imat
ed C
ost b
y Sc
hool
Sys
tem
Fiv
e-ye
ar P
erio
d Ju
ly 2
016
thro
ugh
June
202
1
Add
ition
sR
enov
atio
nsO
ther
Nee
dsSy
stem
-wid
eT
otal
Est
imat
ed
Cos
tN
ew S
choo
ls
DRAFT

WWW.TN.GOV/TACIR234
Building Tennessee’s Tomorrow: Anticipating the State’s Infrastructure Needs
Cou
nty
Scho
ol S
yste
mSt
uden
t C
ount
Tab
le E
-4.
Infr
astr
uctu
re N
eeds
at P
ublic
Ele
men
tary
and
Sec
onda
ry S
choo
lsT
otal
Est
imat
ed C
ost b
y Sc
hool
Sys
tem
Fiv
e-ye
ar P
erio
d Ju
ly 2
016
thro
ugh
June
202
1
Add
ition
sR
enov
atio
nsO
ther
Nee
dsSy
stem
-wid
eT
otal
Est
imat
ed
Cos
tN
ew S
choo
ls
Cof
fee
Man
ches
ter
1,31
70
00
00
0C
offe
eTu
llaho
ma
3,41
00
2,00
0,00
01,
000,
000
00
3,00
0,00
0C
rock
ett
Cro
cket
t Cou
nty
1,94
20
9,10
0,00
028
0,00
00
09,
380,
000
Cro
cket
tA
lam
o58
30
8,25
0,00
060
0,00
060
,000
08,
910,
000
Cro
cket
tB
ells
373
050
,000
030
,000
080
,000
Cum
berla
ndC
umbe
rland
Cou
nty
7,17
912
,000
,000
3,90
0,00
016
,345
,000
1,38
0,00
00
33,6
25,0
00D
avid
son
Dav
idso
n C
ount
y82
,050
258,
000,
000
72,5
31,0
0088
4,08
3,06
74,
204,
200
01,
218,
818,
267
Dec
atur
Dec
atur
Cou
nty
1,58
50
01,
100,
000
00
1,10
0,00
0D
eKal
bD
eKal
b C
ount
y2,
864
42,0
00,0
003,
660,
000
428,
000
4,00
020
0,00
046
,292
,000
Dic
kson
Dic
kson
Cou
nty
8,17
921
,000
,000
7,75
0,67
014
,756
,948
650,
000
044
,157
,618
Dye
rD
yer C
ount
y3,
833
01,
743,
178
2,79
7,59
90
04,
540,
777
Dye
rD
yers
burg
2,61
00
80,0
004,
350,
000
1,09
0,00
00
5,52
0,00
0Fa
yette
Faye
tte C
ount
y3,
226
00
3,75
0,00
021
0,00
00
3,96
0,00
0Fe
ntre
ssFe
ntre
ss C
ount
y2,
093
00
3,16
5,00
075
0,00
00
3,91
5,00
0Fr
ankl
inFr
ankl
in C
ount
y5,
411
00
2,50
5,00
090
0,00
00
3,40
5,00
0G
ibso
nH
umbo
ldt
1,04
60
03,
485,
000
160,
000
03,
645,
000
Gib
son
Mila
n SS
D1,
938
00
2,50
0,00
00
02,
500,
000
Gib
son
Tren
ton
SSD
1,28
90
00
00
0G
ibso
nB
radf
ord
SSD
500
00
00
00
Gib
son
Gib
son
Cou
nty
SSD
3,93
717
,000
,000
00
00
17,0
00,0
00G
iles
Gile
s Cou
nty
3,86
10
01,
702,
000
60,0
000
1,76
2,00
0G
rain
ger
Gra
inge
r Cou
nty
3,53
80
037
0,00
048
3,23
70
853,
237
Gre
ene
Gre
ene
Cou
nty
6,67
20
600,
000
1,10
0,00
01,
164,
130
02,
864,
130
Gre
ene
Gre
enev
ille
2,76
90
07,
654,
545
989,
998
08,
644,
543
Gru
ndy
Gru
ndy
Cou
nty
2,07
80
07,
118,
000
645,
000
07,
763,
000
Ham
blen
Ham
blen
Cou
nty
10,0
9110
,000
,000
017
,024
,000
920,
800
027
,944
,800
Ham
ilton
Ham
ilton
Cou
nty
43,1
0250
,000
,000
66,9
99,0
0024
,993
,000
00
141,
992,
000
Han
cock
Han
cock
Cou
nty
985
070
0,00
094
5,27
18,
400
01,
653,
671
Har
dem
anH
arde
man
Cou
nty
3,57
50
03,
870,
000
00
3,87
0,00
0H
ardi
nH
ardi
n C
ount
y3,
456
00
558,
508
761,
946
01,
320,
454
Haw
kins
Haw
kins
Cou
nty
6,89
90
2,50
0,00
05,
706,
000
1,52
9,41
10
9,73
5,41
1H
awki
nsR
oger
svill
e63
90
00
00
0
DRAFT

235WWW.TN.GOV/TACIR
Appendix E: School System Infrastructure Needs by County
Cou
nty
Scho
ol S
yste
mSt
uden
t C
ount
Tab
le E
-4.
Infr
astr
uctu
re N
eeds
at P
ublic
Ele
men
tary
and
Sec
onda
ry S
choo
lsT
otal
Est
imat
ed C
ost b
y Sc
hool
Sys
tem
Fiv
e-ye
ar P
erio
d Ju
ly 2
016
thro
ugh
June
202
1
Add
ition
sR
enov
atio
nsO
ther
Nee
dsSy
stem
-wid
eT
otal
Est
imat
ed
Cos
tN
ew S
choo
ls
Hay
woo
dH
ayw
ood
Cou
nty
2,90
90
2,19
0,00
05,
827,
000
618,
243
08,
635,
243
Hen
ders
onH
ende
rson
Cou
nty
3,87
00
50,0
003,
745,
000
89,4
950
3,88
4,49
5H
ende
rson
Lexi
ngto
n88
10
050
0,00
098
,000
059
8,00
0H
enry
Hen
ry C
ount
y2,
957
02,
500,
000
315,
000
296,
654
2,40
0,00
05,
511,
654
Hen
ryPa
ris S
SD1,
690
00
8,00
0,00
00
08,
000,
000
Hic
kman
Hic
kman
Cou
nty
3,33
90
012
5,00
01,
500,
000
01,
625,
000
Hou
ston
Hou
ston
Cou
nty
1,30
80
080
,000
00
80,0
00H
umph
reys
Hum
phre
ys C
ount
y2,
886
02,
000,
000
9,45
0,00
041
0,00
00
11,8
60,0
00Ja
ckso
nJa
ckso
n C
ount
y1,
468
040
0,00
080
0,00
075
,000
01,
275,
000
Jeff
erso
nJe
ffer
son
Cou
nty
7,15
40
7,50
0,00
024
,320
,000
498,
000
032
,318
,000
John
son
John
son
Cou
nty
2,00
40
013
5,00
020
,150
015
5,15
0K
nox
Kno
x C
ount
y57
,929
58,2
95,0
0010
,690
,000
25,0
04,7
095,
121,
867
099
,111
,576
Lake
Lake
Cou
nty
789
00
10,6
60,0
0015
0,00
00
10,8
10,0
00La
uder
dale
Laud
erda
le C
ount
y4,
133
00
35,4
30,0
001,
447,
500
036
,877
,500
Law
renc
eLa
wre
nce
Cou
nty
6,60
90
5,00
0,00
01,
966,
849
150,
000
07,
116,
849
Lew
isLe
wis
Cou
nty
1,72
80
00
00
0Li
ncol
nLi
ncol
n C
ount
y3,
835
00
2,30
0,00
015
,000
02,
315,
000
Linc
oln
Faye
ttevi
lle1,
434
00
2,10
0,00
00
02,
100,
000
Loud
onLo
udon
Cou
nty
4,67
40
9,10
0,00
00
956,
600
010
,056
,600
Loud
onLe
noir
City
2,26
40
600,
000
3,88
0,00
00
04,
480,
000
McM
inn
McM
inn
Cou
nty
5,51
80
010
,547
,688
84,0
000
10,6
31,6
88M
cMin
nA
then
s1,
570
08,
780,
000
6,26
0,00
01,
467,
000
016
,507
,000
McM
inn
Etow
ah35
30
01,
000,
000
285,
000
01,
285,
000
McN
airy
McN
airy
Cou
nty
4,19
90
3,86
5,00
057
7,50
03,
326,
400
07,
768,
900
Mac
onM
acon
Cou
nty
3,67
924
,000
,000
4,85
0,00
01,
180,
500
60,0
0050
0,00
030
,590
,500
Mad
ison
Mad
ison
Cou
nty
12,4
920
2,21
0,00
014
,420
,000
16,0
84,2
000
32,7
14,2
00M
ario
nM
ario
n C
ount
y4,
030
30,0
00,0
001,
427,
460
11,8
13,2
2540
0,00
00
43,6
40,6
85M
ario
nR
icha
rd C
ity S
SD27
50
00
00
0M
arsh
all
Mar
shal
l Cou
nty
5,31
10
01,
147,
203
00
1,14
7,20
3M
aury
Mau
ry C
ount
y11
,900
45,0
00,0
002,
873,
500
7,64
8,00
019
5,00
00
55,7
16,5
00M
eigs
Mei
gs C
ount
y1,
712
01,
113,
000
456,
000
015
0,00
01,
719,
000
Mon
roe
Mon
roe
Cou
nty
5,35
30
3,02
0,00
021
,490
,853
164,
000
024
,674
,853
DRAFT

WWW.TN.GOV/TACIR236
Building Tennessee’s Tomorrow: Anticipating the State’s Infrastructure Needs
Cou
nty
Scho
ol S
yste
mSt
uden
t C
ount
Tab
le E
-4.
Infr
astr
uctu
re N
eeds
at P
ublic
Ele
men
tary
and
Sec
onda
ry S
choo
lsT
otal
Est
imat
ed C
ost b
y Sc
hool
Sys
tem
Fiv
e-ye
ar P
erio
d Ju
ly 2
016
thro
ugh
June
202
1
Add
ition
sR
enov
atio
nsO
ther
Nee
dsSy
stem
-wid
eT
otal
Est
imat
ed
Cos
tN
ew S
choo
ls
Mon
roe
Swee
twat
er1,
532
00
3,90
0,00
020
5,00
00
4,10
5,00
0M
ontg
omer
yM
ontg
omer
y C
ount
y31
,882
117,
672,
362
26,9
70,0
0068
,218
,000
5,27
1,00
00
218,
131,
362
Moo
reM
oore
Cou
nty
852
06,
000,
000
15,8
00,0
0020
0,00
00
22,0
00,0
00M
orga
nM
orga
n C
ount
y3,
032
00
1,22
8,00
080
2,50
00
2,03
0,50
0O
bion
Obi
on C
ount
y3,
411
010
0,00
048
5,00
00
058
5,00
0O
bion
Uni
on C
ity1,
565
04,
999,
000
2,40
6,20
880
,300
192,
000
7,67
7,50
8O
verto
nO
verto
n C
ount
y3,
099
00
7,23
8,00
094
1,00
011
0,00
08,
289,
000
Perr
yPe
rry
Cou
nty
1,04
10
014
2,00
00
014
2,00
0Pi
cket
tPi
cket
t Cou
nty
722
00
200,
000
130,
000
100,
000
430,
000
Polk
Polk
Cou
nty
2,36
10
011
0,00
00
011
0,00
0Pu
tnam
Putn
am C
ount
y10
,723
09,
500,
000
3,70
0,00
046
5,00
025
0,00
013
,915
,000
Rhe
aR
hea
Cou
nty
4,24
80
010
0,00
00
010
0,00
0R
hea
Day
ton
821
00
00
00
Roa
neR
oane
Cou
nty
6,58
350
,000
,000
60,0
006,
200,
000
1,47
4,99
30
57,7
34,9
93R
ober
tson
Rob
erts
on C
ount
y10
,977
70,0
00,0
0013
,000
,000
83,2
68,0
009,
177,
000
1,50
0,00
017
6,94
5,00
0R
uthe
rfor
dR
uthe
rfor
d C
ount
y42
,650
154,
110,
000
12,1
62,0
0031
,569
,000
560,
376
019
8,40
1,37
6R
uthe
rfor
dM
urfr
eesb
oro
7,98
121
,750
,000
05,
250,
000
02,
500,
000
29,5
00,0
00Sc
ott
Scot
t Cou
nty
2,84
00
4,80
0,00
01,
125,
000
35,0
000
5,96
0,00
0Sc
ott
One
ida
SSD
1,21
90
00
00
0Se
quat
chie
Sequ
atch
ie C
ount
y2,
257
00
450,
000
435,
000
1,10
0,00
01,
985,
000
Sevi
erSe
vier
Cou
nty
14,2
6545
,250
,000
39,9
38,0
0018
,798
,885
150,
000
010
4,13
6,88
5Sh
elby
Shel
by C
ount
y11
5,57
90
6,78
8,88
438
0,79
3,24
097
,918
,920
048
5,50
1,04
4Sh
elby
Arli
ngto
n4,
985
00
914,
000
750,
000
01,
664,
000
Shel
byB
artle
tt8,
500
02,
000,
000
80,0
38,2
001,
830,
000
083
,868
,200
Shel
byC
ollie
rvill
e8,
021
95,0
00,0
000
13,0
45,0
001,
211,
750
010
9,25
6,75
0Sh
elby
Ger
man
tow
n5,
727
024
0,00
028
,375
,000
3,65
0,00
00
32,2
65,0
00Sh
elby
Lake
land
901
17,6
78,0
000
084
,000
017
,762
,000
Shel
byM
illin
gton
2,53
96,
659,
000
38,0
00,0
005,
670,
000
1,17
5,00
00
51,5
04,0
00Sm
ithSm
ith C
ount
y3,
025
05,
436,
000
1,58
8,20
01,
175,
000
08,
199,
200
Stew
art
Stew
art C
ount
y2,
003
050
,000
2,61
5,00
00
02,
665,
000
Sulli
van
Sulli
van
Cou
nty
9,89
985
,000
,000
1,00
0,00
061
,285
,000
7,12
1,00
00
154,
406,
000
Sulli
van
Bris
tol
3,96
652
,000
,000
2,00
0,00
056
,233
,049
2,65
2,50
00
112,
885,
549
DRAFT

237WWW.TN.GOV/TACIR
Appendix E: School System Infrastructure Needs by County
Cou
nty
Scho
ol S
yste
mSt
uden
t C
ount
Tab
le E
-4.
Infr
astr
uctu
re N
eeds
at P
ublic
Ele
men
tary
and
Sec
onda
ry S
choo
lsT
otal
Est
imat
ed C
ost b
y Sc
hool
Sys
tem
Fiv
e-ye
ar P
erio
d Ju
ly 2
016
thro
ugh
June
202
1
Add
ition
sR
enov
atio
nsO
ther
Nee
dsSy
stem
-wid
eT
otal
Est
imat
ed
Cos
tN
ew S
choo
ls
Sulli
van
Kin
gspo
rt7,
151
021
,680
,000
8,88
7,00
02,
518,
000
033
,085
,000
Sum
ner
Sum
ner C
ount
y28
,764
55,0
00,0
000
64,4
00,7
2921
9,00
00
119,
619,
729
Tipt
onTi
pton
Cou
nty
10,9
400
1,70
0,00
01,
423,
000
886,
000
04,
009,
000
Trou
sdal
eH
arts
ville
-Tro
usda
le
1,23
60
01,
250,
000
70,0
000
1,32
0,00
0U
nico
iU
nico
i Cou
nty
2,31
90
015
0,00
00
015
0,00
0U
nion
Uni
on C
ount
y3,
484
017
5,00
01,
628,
300
806,
065
02,
609,
365
Van
Bur
enV
an B
uren
Cou
nty
724
00
790,
000
00
790,
000
War
ren
War
ren
Cou
nty
6,36
30
04,
299,
100
1,10
0,00
00
5,39
9,10
0W
ashi
ngto
nW
ashi
ngto
n C
ount
y8,
596
70,0
00,0
0017
5,50
014
,972
,000
04,
300,
000
89,4
47,5
00W
ashi
ngto
nJo
hnso
n C
ity7,
772
14,0
00,0
0012
,500
,000
4,03
0,00
00
7,17
4,00
037
,704
,000
Way
neW
ayne
Cou
nty
2,21
50
400,
000
1,82
5,00
00
02,
225,
000
Wea
kley
Wea
kley
Cou
nty
4,20
40
3,60
0,00
014
,149
,976
770,
000
018
,519
,976
Whi
teW
hite
Cou
nty
3,85
90
011
,285
,000
100,
000
011
,385
,000
Will
iam
son
Will
iam
son
Cou
nty
36,3
0346
1,24
0,00
010
,520
,000
77,2
92,0
003,
423,
000
055
2,47
5,00
0W
illia
mso
nFr
ankl
in S
SD3,
438
00
16,3
95,0
000
016
,395
,000
Wils
onW
ilson
Cou
nty
17,2
0623
4,00
0,00
00
16,3
95,0
005,
298,
750
20,0
00,0
0031
8,59
5,94
0W
ilson
Leba
non
SSD
3,55
221
,200
,000
056
0,00
015
0,00
03,
265,
000
25,1
75,0
00G
rand
Tot
al96
0,95
9$
2,24
2,20
4,36
2$
513,
710,
884
$2,
464,
281,
023
$22
0,91
1,90
8$
59,7
41,0
00$
5,50
0,84
9,17
7
DRAFT
WWW.TN.GOV/TACIR238
Building Tennessee’s Tomorrow: Anticipating the State’s Infrastructure Needs
Cou
nty
Exc
elle
ntG
ood
Fair
Poor
Cou
nty
Exc
elle
ntG
ood
Fair
Poor
And
erso
n12
6Fa
yette
15
2A
nder
son
21
Fent
ress
42
And
erso
n2
51
Fran
klin
38
Bed
ford
94
1G
ibso
n1
2B
ento
n3
41
Gib
son
11
1B
leds
oe2
3G
ibso
n1
2B
loun
t12
8G
ibso
n2
Blo
unt
22
Gib
son
36
Blo
unt
34
Gile
s2
6B
radl
ey4
103
Gra
inge
r1
7B
radl
ey3
6G
reen
e2
14C
ampb
ell
87
Gre
ene
15
1C
anno
n5
2G
rund
y1
32
1C
arro
ll1
1H
ambl
en11
7C
arro
ll2
Ham
ilton
2738
61
Car
roll
13
Han
cock
3C
arro
ll3
Har
dem
an9
Car
roll
1H
ardi
n4
3C
arro
ll1
2H
awki
ns6
12C
arte
r2
121
Haw
kins
1C
arte
r5
Hay
woo
d5
Che
atha
m7
6H
ende
rson
27
Che
ster
24
Hen
ders
on1
1C
laib
orne
67
Hen
ry6
Cla
y1
3H
enry
12
Coc
ke3
9H
ickm
an4
4C
ocke
1H
oust
on1
4C
offe
e6
31
Hum
phre
ys3
4C
offe
e2
1Ja
ckso
n2
2C
offe
e3
4Je
ffer
son
310
Cro
cket
t5
John
son
34
Cro
cket
t1
Kno
x10
761
Cro
cket
t1
Lake
12
Cum
berla
nd3
9La
uder
dale
43
Dav
idso
n45
7923
Law
renc
e4
9D
ecat
ur2
2Le
wis
4D
eKal
b1
41
Linc
oln
44
Dic
kson
411
1Li
ncol
n3
Dye
r4
4Lo
udon
27
Dye
r3
1Lo
udon
3
Scho
ol S
yste
m
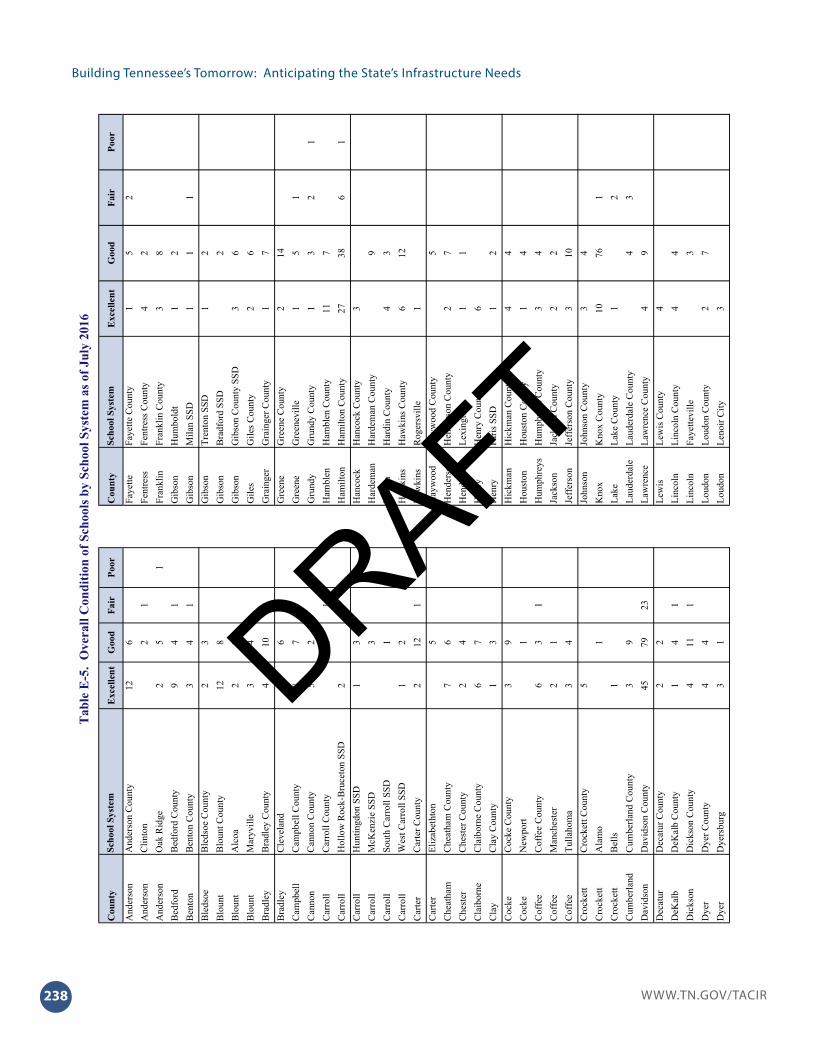
Tab
le E
-5.
Ove
rall
Con
ditio
n of
Sch
ools
by
Scho
ol S
yste
m a
s of J
uly
2016
Loud
on C
ount
yLe
noir
City
Laud
erda
le C
ount
yLa
wre
nce
Cou
nty
Lew
is C
ount
yLi
ncol
n C
ount
yFa
yette
ville
Jack
son
Cou
nty
Jeff
erso
n C
ount
yJo
hnso
n C
ount
yK
nox
Cou
nty
Lake
Cou
nty
Hen
ry C
ount
yPa
ris S
SDH
ickm
an C
ount
yH
oust
on C
ount
yH
umph
reys
Cou
nty
Haw
kins
Cou
nty
Rog
ersv
ille
Hay
woo
d C
ount
yH
ende
rson
Cou
nty
Lexi
ngto
n
Ham
blen
Cou
nty
Ham
ilton
Cou
nty
Han
cock
Cou
nty
Har
dem
an C
ount
yH
ardi
n C
ount
y
Gile
s Cou
nty
Gra
inge
r Cou
nty
Gre
ene
Cou
nty
Gre
enev
ille
Gru
ndy
Cou
nty
Hum
bold
tM
ilan
SSD
Tren
ton
SSD
Bra
dfor
d SS
DG
ibso
n C
ount
y SS
D
Dye
r Cou
nty
Dye
rsbu
rg
Faye
tte C
ount
yFe
ntre
ss C
ount
yFr
ankl
in C
ount
y
Cum
berla
nd C
ount
yD
avid
son
Cou
nty
Dec
atur
Cou
nty
DeK
alb
Cou
nty
Dic
kson
Cou
nty
Man
ches
ter
Tulla
hom
aC
rock
ett C
ount
yA
lam
oB
ells
Cla
ibor
ne C
ount
yC
lay
Cou
nty
Coc
ke C
ount
yN
ewpo
rtC
offe
e C
ount
y
Wes
t Car
roll
SSD
Car
ter C
ount
yEl
izab
etht
onC
heat
ham
Cou
nty
Che
ster
Cou
nty
Car
roll
Cou
nty
Hol
low
Roc
k-B
ruce
ton
SSD
Hun
tingd
on S
SDM
cKen
zie
SSD
Sout
h C
arro
ll SS
D
Scho
ol S
yste
m
And
erso
n C
ount
yC
linto
nO
ak R
idge
Mar
yvill
eB
radl
ey C
ount
yC
leve
land
Cam
pbel
l Cou
nty
Can
non
Cou
nty
Bed
ford
Cou
nty
Ben
ton
Cou
nty
Ble
dsoe
Cou
nty
Blo
unt C
ount
yA
lcoa
DRAFT

239WWW.TN.GOV/TACIR
Appendix E: School System Infrastructure Needs by CountyT
able
E-5
. O
vera
ll C
ondi
tion
of S
choo
ls b
y Sc
hool
Sys
tem
as o
f Jul
y 20
16
Cou
nty
Exc
elle
ntG
ood
Fair
Poor
Cou
nty
Exc
elle
ntG
ood
Fair
Poor
McM
inn
17
1Sh
elby
53
3M
cMin
n5
Shel
by1
61
McM
inn
1Sh
elby
14
McN
airy
27
Shel
by1
Mac
on2
6Sh
elby
12
1M
adis
on11
12Sm
ith8
1M
ario
n5
23
Stew
art
51
Mar
ion
1Su
lliva
n5
143
Mar
shal
l5
41
Sulli
van
15
2M
aury
710
3Su
lliva
n10
2M
eigs
31
Sum
ner
2226
Mon
roe
81
21
Tipt
on3
11M
onro
e1
3Tr
ousd
ale
12
Mon
tgom
ery
2217
Uni
coi
25
Moo
re1
1U
nion
37
Mor
gan
33
2V
an B
uren
2O
bion
34
War
ren
47
Obi
on3
Was
hing
ton
510
Ove
rton
54
Was
hing
ton
101
Perr
y1
3W
ayne
26
Pick
ett
11
Wea
kley
47
Polk
24
Whi
te6
3Pu
tnam
1010
Will
iam
son
2913
Rhe
a3
4W
illia
mso
n6
2R
hea
1W
ilson
911
Roa
ne12
41
Wils
on4
2R
ober
tson
811
166
293
113
55
Rut
herf
ord
2621
Rut
herf
ord
75
Scot
t3
4Sc
ott
3Se
quat
chie
21
Sevi
er13
17Sh
elby
4390
54Sh
elby
4
Scho
ol S
yste
mSc
hool
Sys
tem
Will
iam
son
Cou
nty
Fran
klin
SSD
Wils
on C
ount
yLe
bano
n SS
D
Sulli
van
Cou
nty
Bris
tol
Kin
gspo
rtSu
mne
r Cou
nty
Tipt
on C
ount
y
Lake
land
Mill
ingt
onSm
ith C
ount
ySt
ewar
t Cou
nty
Uni
on C
ity
Mar
shal
l Cou
nty
Mau
ry C
ount
yM
eigs
Cou
nty
Mon
roe
Cou
nty
Swee
twat
er
Tota
l
Was
hing
ton
Cou
nty
John
son
City
Way
ne C
ount
yW
eakl
ey C
ount
yW
hite
Cou
nty
Har
tsvi
lle-T
rous
dale
U
nico
i Cou
nty
Uni
on C
ount
yV
an B
uren
Cou
nty
War
ren
Cou
nty
Shel
by C
ount
yA
rling
ton
Bar
tlett
Col
lierv
ille
Ger
man
tow
n
Mur
free
sbor
oSc
ott C
ount
yO
neid
a SS
DSe
quat
chie
Cou
nty
Sevi
er C
ount
y
Rhe
a C
ount
yD
ayto
nR
oane
Cou
nty
Rob
erts
on C
ount
yR
uthe
rfor
d C
ount
y
Ove
rton
Cou
nty
Perr
y C
ount
yPi
cket
t Cou
nty
Polk
Cou
nty
Putn
am C
ount
y
Mon
tgom
ery
Cou
nty
Moo
re C
ount
yM
orga
n C
ount
yO
bion
Cou
nty
McN
airy
Cou
nty
Mac
on C
ount
yM
adis
on C
ount
yM
ario
n C
ount
yR
icha
rd C
ity S
SD
McM
inn
Cou
nty
Ath
ens
Etow
ah
DRAFT

WWW.TN.GOV/TACIR240
Building Tennessee’s Tomorrow: Anticipating the State’s Infrastructure Needs
Scho
ol S
yste
mSc
hool
C
ount
Est
imat
ed
Upg
rade
Cos
tSc
hool
C
ount
Est
imat
ed
Upg
rade
Cos
tSc
hool
C
ount
Est
imat
ed
Upg
rade
Cos
t*A
nder
son
Cou
nty
00
$0
186
33.3
%$
2,12
5,81
718
$2,
125,
817
Clin
ton
11
360,
000
22
66.7
%35
0,00
03
710,
000
Oak
Rid
ge1
135
0,00
07
787
.5%
2,86
3,13
38
3,21
3,13
3B
edfo
rd C
ount
y1
15,
000,
000
135
35.7
%42
0,00
014
5,42
0,00
0B
ento
n C
ount
y1
00
75
62.5
%2,
662,
000
82,
662,
000
Ble
dsoe
Cou
nty
00
05
360
.0%
940,
000
594
0,00
0B
loun
t Cou
nty
00
020
1155
.0%
6,05
4,00
020
6,05
4,00
0A
lcoa
00
04
00.
0%0
40
Mar
yvill
e0
00
72
28.6
%2,
165,
000
72,
165,
000
Bra
dley
Cou
nty
33
2,65
0,00
014
741
.2%
7,45
5,00
017
10,1
05,0
00C
leve
land
00
09
333
.3%
856,
000
985
6,00
0C
ampb
ell C
ount
y0
00
152
13.3
%22
0,00
015
220,
000
Can
non
Cou
nty
00
07
00.
0%0
70
Car
roll
Cou
nty
11
210,
000
10
0.0%
02
210,
000
Hol
low
Roc
k-B
ruce
ton
SSD
00
02
00.
0%0
20
Hun
tingd
on S
SD0
00
40
0.0%
04
0M
cKen
zie
SSD
00
03
310
0.0%
318,
000
331
8,00
0So
uth
Car
roll
SSD
00
01
110
0.0%
50,0
001
50,0
00W
est C
arro
ll SS
D0
00
30
0.0%
03
0C
arte
r Cou
nty
11
13,5
78,0
0014
746
.7%
1,37
9,40
015
14,9
57,4
00El
izab
etht
on0
00
55
100.
0%3,
791,
131
53,
791,
131
Che
atha
m C
ount
y0
00
135
38.5
%67
0,00
013
670,
000
Che
ster
Cou
nty
00
06
583
.3%
1,79
5,00
06
1,79
5,00
0C
laib
orne
Cou
nty
00
013
1292
.3%
2,80
9,00
013
2,80
9,00
0C
lay
Cou
nty
00
04
250
.0%
1,35
0,00
04
1,35
0,00
0C
ocke
Cou
nty
00
012
1083
.3%
8,03
6,00
012
8,03
6,00
0N
ewpo
rt0
00
11
100.
0%30
0,00
01
300,
000
Cof
fee
Cou
nty
11
8,70
0,00
09
110
.0%
78,0
0010
8,77
8,00
0C
offe
e10
.0%
$2,0
18
Coc
ke0.
0%$1
,798
Coc
ke0.
0%$4
21
Cla
ibor
ne0.
0%$6
58C
lay
0.0%
$1,3
00
Che
atha
m0.
0%$1
07C
hest
er0.
0%$6
38
Car
ter
6.7%
$2,8
54C
arte
r0.
0%$1
,549
Car
roll
0.0%
$148
Car
roll
0.0%
$0
Car
roll
0.0%
$0C
arro
ll0.
0%$2
44
Car
roll
50.0
%$9
6,03
5C
arro
ll0.
0%$0
Cam
pbel
l0.
0%$4
0C
anno
n0.
0%$0
Bra
dley
17.6
%$1
,019
Bra
dley
0.0%
$158
Blo
unt
0.0%
$0B
loun
t0.
0%$4
29
Ble
dsoe
0.0%
$543
Blo
unt
0.0%
$563
Bed
ford
7.1%
$642
Ben
ton
12.5
%$1
,247
And
erso
n12
.5%
$727
Cou
nty
Scho
ols w
ith
Upg
rade
Nee
dsSc
hool
s with
U
pgra
de N
eeds
Per
Stud
ent
And
erso
n0.
0%$3
34
Tab
le E
-6.
Ove
rall
Scho
ol R
atin
gs a
nd C
osts
to U
pgra
de C
ompo
nent
s to
Exc
elle
nt o
r G
ood
Con
ditio
nB
y Sc
hool
Sys
tem
and
Ove
rall
Scho
ol R
atin
g w
ith C
ost p
er S
tude
nt b
y Sc
hool
Sys
tem
Fiv
e-ye
ar P
erio
d Ju
ly 2
016
thro
ugh
June
202
1
Ove
rall
Fair
or
Poor
Con
ditio
nO
vera
ll E
xcel
lent
or
Goo
d C
ondi
tion
All
Scho
ols
And
erso
n33
.3%
$806
DRAFT

241WWW.TN.GOV/TACIR
Appendix E: School System Infrastructure Needs by County
Scho
ol S
yste
mSc
hool
C
ount
Est
imat
ed
Upg
rade
Cos
tSc
hool
C
ount
Est
imat
ed
Upg
rade
Cos
tSc
hool
C
ount
Est
imat
ed
Upg
rade
Cos
t*C
ount
ySc
hool
s with
U
pgra
de N
eeds
Scho
ols w
ith
Upg
rade
Nee
dsPe
r St
uden
t
Tab
le E
-6.
Ove
rall
Scho
ol R
atin
gs a
nd C
osts
to U
pgra
de C
ompo
nent
s to
Exc
elle
nt o
r G
ood
Con
ditio
nB
y Sc
hool
Sys
tem
and
Ove
rall
Scho
ol R
atin
g w
ith C
ost p
er S
tude
nt b
y Sc
hool
Sys
tem
Fiv
e-ye
ar P
erio
d Ju
ly 2
016
thro
ugh
June
202
1
Ove
rall
Fair
or
Poor
Con
ditio
nO
vera
ll E
xcel
lent
or
Goo
d C
ondi
tion
All
Scho
ols
Man
ches
ter
00
03
00.
0%0
30
Tulla
hom
a0
00
71
14.3
%1,
000,
000
71,
000,
000
Cro
cket
t Cou
nty
00
05
120
.0%
280,
000
528
0,00
0A
lam
o0
00
11
100.
0%60
0,00
01
600,
000
Bel
ls0
00
10
0.0%
01
0C
umbe
rland
Cou
nty
00
012
1210
0.0%
16,3
45,0
0012
16,3
45,0
00D
avid
son
Cou
nty
2321
199,
629,
000
124
8960
.5%
684,
454,
067
147
884,
083,
067
Dec
atur
Cou
nty
00
04
375
.0%
1,10
0,00
04
1,10
0,00
0D
eKal
b C
ount
y1
117
5,00
05
350
.0%
253,
000
642
8,00
0D
icks
on C
ount
y1
160
,000
155
29.4
%14
,696
,948
1614
,756
,948
Dye
r Cou
nty
00
08
337
.5%
2,79
7,59
98
2,79
7,59
9D
yers
burg
00
04
410
0.0%
4,35
0,00
04
4,35
0,00
0Fa
yette
Cou
nty
22
2,30
0,00
06
450
.0%
1,45
0,00
08
3,75
0,00
0Fe
ntre
ss C
ount
y0
00
66
100.
0%3,
165,
000
63,
165,
000
Fran
klin
Cou
nty
00
011
654
.5%
2,50
5,00
011
2,50
5,00
0H
umbo
ldt
00
03
266
.7%
3,48
5,00
03
3,48
5,00
0M
ilan
SSD
11
1,70
0,00
02
266
.7%
800,
000
32,
500,
000
Tren
ton
SSD
00
03
00.
0%0
30
Bra
dfor
d SS
D0
00
20
0.0%
02
0G
ibso
n C
ount
y SS
D0
00
90
0.0%
09
0G
iles C
ount
y0
00
86
75.0
%1,
702,
000
81,
702,
000
Gra
inge
r Cou
nty
00
08
337
.5%
370,
000
837
0,00
0G
reen
e C
ount
y0
00
165
31.3
%1,
100,
000
161,
100,
000
Gre
enev
ille
11
2,40
0,00
06
571
.4%
5,25
4,54
57
7,65
4,54
5G
rund
y C
ount
y3
35,
150,
000
43
42.9
%1,
968,
000
77,
118,
000
Ham
blen
Cou
nty
00
018
844
.4%
17,0
24,0
0018
17,0
24,0
00H
amilt
on C
ount
y7
712
,398
,000
6524
33.3
%12
,595
,000
7224
,993
,000
Han
cock
Cou
nty
00
03
310
0.0%
945,
271
394
5,27
1H
anco
ck0.
0%$9
60
Ham
blen
0.0%
$1,6
87H
amilt
on9.
7%$5
80
Gre
ene
14.3
%$2
,765
Gru
ndy
42.9
%$3
,426
Gra
inge
r0.
0%$1
05G
reen
e0.
0%$1
65
Gib
son
0.0%
$0G
iles
0.0%
$441
Gib
son
0.0%
$0G
ibso
n0.
0%$0
Gib
son
0.0%
$3,3
31G
ibso
n33
.3%
$1,2
90
Fent
ress
0.0%
$1,5
13Fr
ankl
in0.
0%$4
63
Dye
r0.
0%$1
,667
Faye
tte25
.0%
$1,1
63
Dic
kson
5.9%
$1,8
04D
yer
0.0%
$730
Dec
atur
0.0%
$694
DeK
alb
16.7
%$1
49
Cum
berla
nd0.
0%$2
,277
Dav
idso
n14
.3%
$10,
775
Cro
cket
t0.
0%$1
,029
Cro
cket
t0.
0%$0
Cof
fee
0.0%
$293
Cro
cket
t0.
0%$1
44
Cof
fee
0.0%
$0
DRAFT

WWW.TN.GOV/TACIR242
Building Tennessee’s Tomorrow: Anticipating the State’s Infrastructure Needs
Scho
ol S
yste
mSc
hool
C
ount
Est
imat
ed
Upg
rade
Cos
tSc
hool
C
ount
Est
imat
ed
Upg
rade
Cos
tSc
hool
C
ount
Est
imat
ed
Upg
rade
Cos
t*C
ount
ySc
hool
s with
U
pgra
de N
eeds
Scho
ols w
ith
Upg
rade
Nee
dsPe
r St
uden
t
Tab
le E
-6.
Ove
rall
Scho
ol R
atin
gs a
nd C
osts
to U
pgra
de C
ompo
nent
s to
Exc
elle
nt o
r G
ood
Con
ditio
nB
y Sc
hool
Sys
tem
and
Ove
rall
Scho
ol R
atin
g w
ith C
ost p
er S
tude
nt b
y Sc
hool
Sys
tem
Fiv
e-ye
ar P
erio
d Ju
ly 2
016
thro
ugh
June
202
1
Ove
rall
Fair
or
Poor
Con
ditio
nO
vera
ll E
xcel
lent
or
Goo
d C
ondi
tion
All
Scho
ols
Har
dem
an C
ount
y0
00
93
33.3
%3,
870,
000
93,
870,
000
Har
din
Cou
nty
00
07
342
.9%
558,
508
755
8,50
8H
awki
ns C
ount
y0
00
1817
85.0
%5,
706,
000
185,
706,
000
Rog
ersv
ille
00
01
00.
0%0
10
Hay
woo
d C
ount
y0
00
55
100.
0%5,
827,
000
55,
827,
000
Hen
ders
on C
ount
y0
00
96
66.7
%3,
745,
000
93,
745,
000
Lexi
ngto
n0
00
21
50.0
%50
0,00
02
500,
000
Hen
ry C
ount
y0
00
63
50.0
%31
5,00
06
315,
000
Paris
SSD
00
03
133
.3%
8,00
0,00
03
8,00
0,00
0H
ickm
an C
ount
y0
00
81
11.1
%12
5,00
08
125,
000
Hou
ston
Cou
nty
00
05
120
.0%
80,0
005
80,0
00H
umph
reys
Cou
nty
00
07
571
.4%
9,45
0,00
07
9,45
0,00
0Ja
ckso
n C
ount
y0
00
42
50.0
%80
0,00
04
800,
000
Jeff
erso
n C
ount
y0
00
1310
76.9
%24
,320
,000
1324
,320
,000
John
son
Cou
nty
00
07
228
.6%
135,
000
713
5,00
0K
nox
Cou
nty
11
2,83
3,67
786
3439
.1%
22,1
71,0
3287
25,0
04,7
09La
ke C
ount
y2
210
,660
,000
10
0.0%
03
10,6
60,0
00La
uder
dale
Cou
nty
33
35,1
00,0
004
342
.9%
330,
000
735
,430
,000
Law
renc
e C
ount
y0
00
137
53.8
%1,
966,
849
131,
966,
849
Lew
is C
ount
y0
00
40
0.0%
04
0Li
ncol
n C
ount
y0
00
81
12.5
%2,
300,
000
82,
300,
000
Faye
ttevi
lle0
00
31
33.3
%2,
100,
000
32,
100,
000
Loud
on C
ount
y0
00
90
0.0%
09
0Le
noir
City
00
03
310
0.0%
3,88
0,00
03
3,88
0,00
0M
cMin
n C
ount
y1
16,
716,
348
88
88.9
%3,
831,
340
910
,547
,688
Ath
ens
00
05
510
0.0%
6,26
0,00
05
6,26
0,00
0Et
owah
00
01
110
0.0%
1,00
0,00
01
1,00
0,00
0M
cNai
ry C
ount
y0
00
94
44.4
%57
7,50
09
577,
500
McN
airy
0.0%
$138
McM
inn
0.0%
$3,9
88M
cMin
n0.
0%$2
,832
Loud
on0.
0%$1
,714
McM
inn
11.1
%$1
,912
Linc
oln
0.0%
$1,4
65Lo
udon
0.0%
$0
Lew
is0.
0%$0
Linc
oln
0.0%
$600
Laud
erda
le42
.9%
$8,5
73La
wre
nce
0.0%
$298
Kno
x1.
1%$4
32La
ke66
.7%
$13,
515
Jeff
erso
n0.
0%$3
,399
John
son
0.0%
$67
Hum
phre
ys0.
0%$3
,274
Jack
son
0.0%
$545
Hic
kman
0.0%
$37
Hou
ston
0.0%
$61
Hen
ry0.
0%$1
07H
enry
0.0%
$4,7
34
Hen
ders
on0.
0%$9
68H
ende
rson
0.0%
$567
Haw
kins
0.0%
$0H
ayw
ood
0.0%
$2,0
03
Har
din
0.0%
$162
Haw
kins
0.0%
$827
Har
dem
an0.
0%$1
,083
DRAFT

243WWW.TN.GOV/TACIR
Appendix E: School System Infrastructure Needs by County
Scho
ol S
yste
mSc
hool
C
ount
Est
imat
ed
Upg
rade
Cos
tSc
hool
C
ount
Est
imat
ed
Upg
rade
Cos
tSc
hool
C
ount
Est
imat
ed
Upg
rade
Cos
t*C
ount
ySc
hool
s with
U
pgra
de N
eeds
Scho
ols w
ith
Upg
rade
Nee
dsPe
r St
uden
t
Tab
le E
-6.
Ove
rall
Scho
ol R
atin
gs a
nd C
osts
to U
pgra
de C
ompo
nent
s to
Exc
elle
nt o
r G
ood
Con
ditio
nB
y Sc
hool
Sys
tem
and
Ove
rall
Scho
ol R
atin
g w
ith C
ost p
er S
tude
nt b
y Sc
hool
Sys
tem
Fiv
e-ye
ar P
erio
d Ju
ly 2
016
thro
ugh
June
202
1
Ove
rall
Fair
or
Poor
Con
ditio
nO
vera
ll E
xcel
lent
or
Goo
d C
ondi
tion
All
Scho
ols
Mac
on C
ount
y0
00
84
50.0
%1,
180,
500
81,
180,
500
Mad
ison
Cou
nty
00
023
2310
0.0%
14,4
20,0
0023
14,4
20,0
00M
ario
n C
ount
y3
29,
370,
000
72
20.0
%2,
443,
225
1011
,813
,225
Ric
hard
City
SSD
00
01
00.
0%0
10
Mar
shal
l Cou
nty
11
116,
382
93
30.0
%1,
030,
821
101,
147,
203
Mau
ry C
ount
y3
21,
995,
000
1713
65.0
%5,
653,
000
207,
648,
000
Mei
gs C
ount
y0
00
42
50.0
%45
6,00
04
456,
000
Mon
roe
Cou
nty
33
18,2
55,8
539
650
.0%
3,23
5,00
012
21,4
90,8
53Sw
eetw
ater
00
04
375
.0%
3,90
0,00
04
3,90
0,00
0M
ontg
omer
y C
ount
y0
00
3931
79.5
%68
,218
,000
3968
,218
,000
Moo
re C
ount
y1
115
,800
,000
10
0.0%
02
15,8
00,0
00M
orga
n C
ount
y2
237
8,00
06
225
.0%
850,
000
81,
228,
000
Obi
on C
ount
y0
00
74
57.1
%48
5,00
07
485,
000
Uni
on C
ity0
00
33
100.
0%2,
406,
208
32,
406,
208
Ove
rton
Cou
nty
00
09
555
.6%
7,23
8,00
09
7,23
8,00
0Pe
rry
Cou
nty
00
04
250
.0%
142,
000
414
2,00
0Pi
cket
t Cou
nty
00
02
150
.0%
200,
000
220
0,00
0Po
lk C
ount
y0
00
61
16.7
%11
0,00
06
110,
000
Putn
am C
ount
y0
00
2010
50.0
%3,
700,
000
203,
700,
000
Rhe
a C
ount
y0
00
71
14.3
%10
0,00
07
100,
000
Day
ton
00
01
00.
0%0
10
Roa
ne C
ount
y1
15,
500,
000
163
17.6
%70
0,00
017
6,20
0,00
0R
ober
tson
Cou
nty
11
20,7
00,0
0019
1680
.0%
62,5
68,0
0020
83,2
68,0
00R
uthe
rfor
d C
ount
y0
00
4716
34.0
%31
,569
,000
4731
,569
,000
Mur
free
sbor
o0
00
127
58.3
%5,
250,
000
125,
250,
000
Scot
t Cou
nty
00
07
342
.9%
1,12
5,00
07
1,12
5,00
0O
neid
a SS
D0
00
30
0.0%
03
0Se
quat
chie
Cou
nty
00
03
133
.3%
450,
000
345
0,00
0Se
quat
chie
0.0%
$199
Scot
t0.
0%$3
96Sc
ott
0.0%
$0
Rut
herf
ord
0.0%
$740
Rut
herf
ord
0.0%
$658
Roa
ne5.
9%$9
42R
ober
tson
5.0%
$7,5
86
Rhe
a0.
0%$2
4R
hea
0.0%
$0
Polk
0.0%
$47
Putn
am0.
0%$3
45
Perr
y0.
0%$1
36Pi
cket
t0.
0%$2
77
Obi
on0.
0%$1
,538
Ove
rton
0.0%
$2,3
36
Mor
gan
25.0
%$4
05O
bion
0.0%
$142
Mon
tgom
ery
0.0%
$2,1
40M
oore
50.0
%$1
8,55
1
Mon
roe
25.0
%$4
,015
Mon
roe
0.0%
$2,5
45
Mau
ry10
.0%
$643
Mei
gs0.
0%$2
66
Mar
ion
0.0%
$0M
arsh
all
10.0
%$2
16
Mad
ison
0.0%
$1,1
54M
ario
n20
.0%
$2,9
32
Mac
on0.
0%$3
21
DRAFT

WWW.TN.GOV/TACIR244
Building Tennessee’s Tomorrow: Anticipating the State’s Infrastructure Needs
Scho
ol S
yste
mSc
hool
C
ount
Est
imat
ed
Upg
rade
Cos
tSc
hool
C
ount
Est
imat
ed
Upg
rade
Cos
tSc
hool
C
ount
Est
imat
ed
Upg
rade
Cos
t*C
ount
ySc
hool
s with
U
pgra
de N
eeds
Scho
ols w
ith
Upg
rade
Nee
dsPe
r St
uden
t
Tab
le E
-6.
Ove
rall
Scho
ol R
atin
gs a
nd C
osts
to U
pgra
de C
ompo
nent
s to
Exc
elle
nt o
r G
ood
Con
ditio
nB
y Sc
hool
Sys
tem
and
Ove
rall
Scho
ol R
atin
g w
ith C
ost p
er S
tude
nt b
y Sc
hool
Sys
tem
Fiv
e-ye
ar P
erio
d Ju
ly 2
016
thro
ugh
June
202
1
Ove
rall
Fair
or
Poor
Con
ditio
nO
vera
ll E
xcel
lent
or
Goo
d C
ondi
tion
All
Scho
ols
Sevi
er C
ount
y0
00
3024
80.0
%18
,798
,885
3018
,798
,885
Shel
by C
ount
y54
5418
4,51
2,47
013
311
561
.5%
196,
280,
770
187
380,
793,
240
Arli
ngto
n0
00
43
75.0
%91
4,00
04
914,
000
Bar
tlett
33
16,8
50,0
008
545
.5%
63,1
88,2
0011
80,0
38,2
00C
ollie
rvill
e1
15,
700,
000
76
75.0
%7,
345,
000
813
,045
,000
Ger
man
tow
n4
427
,600
,000
11
20.0
%77
5,00
05
28,3
75,0
00La
kela
nd0
00
10
0.0%
01
0M
illin
gton
11
4,00
0,00
03
375
.0%
1,67
0,00
04
5,67
0,00
0Sm
ith C
ount
y1
180
0,00
08
444
.4%
788,
200
91,
588,
200
Stew
art C
ount
y0
00
65
83.3
%2,
615,
000
62,
615,
000
Sulli
van
Cou
nty
33
56,4
20,0
0019
1359
.1%
4,86
5,00
022
61,2
85,0
00B
risto
l2
238
,470
,000
64
50.0
%17
,763
,049
856
,233
,049
Kin
gspo
rt0
00
1210
76.9
%8,
887,
000
128,
887,
000
Sum
ner C
ount
y0
00
4830
62.5
%64
,400
,729
4864
,400
,729
Tipt
on C
ount
y0
00
146
42.9
%1,
423,
000
141,
423,
000
Har
tsvi
lle-T
rous
dale
0
00
32
66.7
%1,
250,
000
31,
250,
000
Uni
coi C
ount
y0
00
71
14.3
%15
0,00
07
150,
000
Uni
on C
ount
y0
00
106
60.0
%1,
628,
300
101,
628,
300
Van
Bur
en C
ount
y0
00
22
100.
0%79
0,00
02
790,
000
War
ren
Cou
nty
00
011
541
.7%
4,29
9,10
011
4,29
9,10
0W
ashi
ngto
n C
ount
y0
00
158
53.3
%14
,972
,000
1514
,972
,000
John
son
City
00
011
654
.5%
4,03
0,00
011
4,03
0,00
0W
ayne
Cou
nty
00
08
450
.0%
1,82
5,00
08
1,82
5,00
0W
eakl
ey C
ount
y0
00
1110
90.9
%14
,149
,976
1114
,149
,976
Whi
te C
ount
y0
00
97
77.8
%11
,285
,000
911
,285
,000
Will
iam
son
Cou
nty
00
042
2150
.0%
77,2
92,0
0042
77,2
92,0
00Fr
ankl
in S
SD0
00
86
75.0
%16
,395
,000
816
,395
,000
Wils
on C
ount
y0
00
2010
50.0
%59
,297
,190
2059
,297
,190
Leba
non
SSD
00
06
583
.3%
560,
000
656
0,00
014
013
5$
716,
437,
730
1,59
391
552
.62%
$1,
747,
843,
293
1,73
3$
2,46
4,28
1,02
3*
Doe
s not
incl
ude
syst
em-w
ide
need
s.
Wils
on0.
0%$1
58G
rand
Tot
al7.
82%
$2,5
64
Will
iam
son
0.0%
$4,7
69W
ilson
0.0%
$3,4
46
Whi
te0.
0%$2
,924
Will
iam
son
0.0%
$2,1
29
Way
ne0.
0%$8
24W
eakl
ey0.
0%$3
,366
Was
hing
ton
0.0%
$1,7
42W
ashi
ngto
n0.
0%$5
19
Van
Bur
en0.
0%$1
,092
War
ren
0.0%
$676
Uni
coi
0.0%
$65
Uni
on0.
0%$4
67
Tipt
on0.
0%$1
30Tr
ousd
ale
0.0%
$1,0
11
Sulli
van
0.0%
$1,2
43Su
mne
r0.
0%$2
,239
Sulli
van
13.6
%$6
,191
Sulli
van
25.0
%$1
4,18
0
Smith
11.1
%$5
25St
ewar
t0.
0%$1
,306
Shel
by25
.0%
$2,2
33
Shel
by80
.0%
$4,9
54Sh
elby
0.0%
$0
Shel
by27
.3%
$9,4
16Sh
elby
12.5
%$1
,626
Shel
by28
.9%
$3,2
95Sh
elby
0.0%
$183
Sevi
er0.
0%$1
,318
DRAFT

245WWW.TN.GOV/TACIR
Appendix E: School System Infrastructure Needs by County
Cou
nty
Scho
ol S
yste
mSc
hool
Cou
ntC
lass
room
C
ount
Cou
ntL
TG
CC
ount
Cou
ntL
TG
CC
ount
Cou
ntL
TG
CC
ount
LT
GC
C
ount
And
erso
nA
nder
son
Cou
nty
1865
452
580
.3%
00
0.0%
012
919
.7%
22
0.31
%A
nder
son
Clin
ton
393
7883
.9%
370
0.0%
015
16.1
%0
3739
.78%
And
erso
nO
ak R
idge
843
030
470
.7%
710
2.3%
411
627
.0%
1425
5.81
%B
edfo
rdB
edfo
rd C
ount
y14
520
410
78.8
%15
183.
5%5
9217
.7%
020
3.85
%B
ento
nB
ento
n C
ount
y8
220
169
76.8
%0
41.
8%3
4721
.4%
36
2.73
%B
leds
oeB
leds
oe C
ount
y5
149
112
75.2
%0
21.
3%0
3523
.5%
33
2.01
%B
loun
tB
loun
t Cou
nty
2084
666
278
.3%
050
5.9%
013
415
.8%
00
0.0%
Blo
unt
Alc
oa4
181
148
81.8
%0
00.
0%0
3318
.2%
00
0.0%
Blo
unt
Mar
yvill
e7
385
271
70.4
%0
30.
8%0
111
28.8
%1
10.
26%
Bra
dley
Bra
dley
Cou
nty
1755
645
782
.2%
2413
2.3%
686
15.5
%13
437.
73%
Bra
dley
Cle
vela
nd9
385
326
84.7
%5
00.
0%0
5915
.3%
05
1.3%
Cam
pbel
lC
ampb
ell C
ount
y15
437
342
78.3
%0
30.
7%0
9221
.1%
00
0.0%
Can
non
Can
non
Cou
nty
716
412
576
.2%
07
4.3%
032
19.5
%0
00.
0%C
arro
llC
arro
ll C
ount
y2
3520
57.1
%10
00.
0%0
1542
.9%
414
40.0
%C
arro
llH
ollo
w R
ock-
Bru
ceto
n SS
D2
6754
80.6
%0
00.
0%0
1319
.4%
00
0.0%
Car
roll
Hun
tingd
on S
SD4
130
106
81.5
%0
00.
0%0
2418
.5%
00
0.0%
Car
roll
McK
enzi
e SS
D3
123
9274
.8%
00
0.0%
031
25.2
%0
00.
0%C
arro
llSo
uth
Car
roll
SSD
138
2257
.9%
61
2.6%
015
39.5
%0
615
.79%
Car
roll
Wes
t Car
roll
SSD
310
278
76.5
%0
00.
0%0
2423
.5%
00
0.0%
Car
ter
Car
ter C
ount
y15
449
340
75.7
%18
4610
.2%
363
14.0
%3
245.
35%
Car
ter
Eliz
abet
hton
516
211
872
.8%
02
1.2%
242
25.9
%6
84.
94%
Che
atha
mC
heat
ham
Cou
nty
1351
745
588
.0%
00
0.0%
062
12.0
%0
00.
0%C
hest
erC
hest
er C
ount
y6
192
166
86.5
%0
21.
0%0
2412
.5%
11
0.52
%C
laib
orne
Cla
ibor
ne C
ount
y13
424
312
73.6
%15
133.
1%2
9923
.3%
118
4.25
%C
lay
Cla
y C
ount
y4
8974
83.1
%0
22.
2%2
1314
.6%
02
2.25
%C
ocke
Coc
ke C
ount
y12
351
271
77.2
%0
267.
4%0
5415
.4%
99
2.56
%C
ocke
New
port
172
6286
.1%
00
0.0%
010
13.9
%0
00.
0%C
offe
eC
offe
e C
ount
y10
431
358
83.1
%29
71.
6%0
6615
.3%
130
6.96
%
Tab
le E
-7.
Exi
stin
g Sc
hool
Cla
ssro
om C
ount
s by
Scho
ol S
yste
mIn
clud
ing
Cou
nts o
f Cla
ssro
oms i
n L
ess T
han
Goo
d C
ondi
tion
(LT
GC
)F
ive-
year
Per
iod
July
201
6 th
roug
h Ju
ne 2
021
Tot
alPe
rman
ent C
lass
room
sPo
rtab
le C
lass
room
sO
ther
Cla
ssro
oms
Tot
al L
TG
C
Cla
ssro
oms
DRAFT

WWW.TN.GOV/TACIR246
Building Tennessee’s Tomorrow: Anticipating the State’s Infrastructure Needs
Cou
nty
Scho
ol S
yste
mSc
hool
Cou
ntC
lass
room
C
ount
Cou
ntL
TG
CC
ount
Cou
ntL
TG
CC
ount
Cou
ntL
TG
CC
ount
LT
GC
C
ount
Tab
le E
-7.
Exi
stin
g Sc
hool
Cla
ssro
om C
ount
s by
Scho
ol S
yste
mIn
clud
ing
Cou
nts o
f Cla
ssro
oms i
n L
ess T
han
Goo
d C
ondi
tion
(LT
GC
)F
ive-
year
Per
iod
July
201
6 th
roug
h Ju
ne 2
021
Tot
alPe
rman
ent C
lass
room
sPo
rtab
le C
lass
room
sO
ther
Cla
ssro
oms
Tot
al L
TG
C
Cla
ssro
oms
Cof
fee
Man
ches
ter
376
6585
.5%
00
0.0%
011
14.5
%0
00.
0%C
offe
eTu
llaho
ma
721
316
677
.9%
00
0.0%
047
22.1
%1
10.
47%
Cro
cket
tC
rock
ett C
ount
y5
142
113
79.6
%0
00.
0%0
2920
.4%
00
0.0%
Cro
cket
tA
lam
o1
4842
87.5
%0
00.
0%0
612
.5%
22
4.17
%C
rock
ett
Bel
ls1
3732
86.5
%0
00.
0%0
513
.5%
00
0.0%
Cum
berla
ndC
umbe
rland
Cou
nty
1251
839
977
.0%
027
5.2%
2792
17.8
%2
295.
6%D
avid
son
Dav
idso
n C
ount
y14
76,
354
5,35
084
.2%
814
323
5.1%
4168
110
.7%
8393
814
.76%
Dec
atur
Dec
atur
Cou
nty
411
910
487
.4%
02
1.7%
013
10.9
%1
10.
84%
DeK
alb
DeK
alb
Cou
nty
619
616
383
.2%
12
1.0%
231
15.8
%3
63.
06%
Dic
kson
Dic
kson
Cou
nty
1650
342
183
.7%
514
2.8%
068
13.5
%0
50.
99%
Dye
rD
yer C
ount
y8
335
227
67.8
%0
51.
5%0
103
30.7
%0
00.
0%D
yer
Dye
rsbu
rg4
326
258
79.1
%20
00.
0%0
6820
.9%
121
6.44
%Fa
yette
Faye
tte C
ount
y8
304
247
81.3
%24
62.
0%6
5116
.8%
2151
16.7
8%Fe
ntre
ssFe
ntre
ss C
ount
y6
173
147
85.0
%0
63.
5%5
2011
.6%
05
2.89
%Fr
ankl
inFr
ankl
in C
ount
y11
458
398
86.9
%0
00.
0%0
6013
.1%
00
0.0%
Gib
son
Hum
bold
t3
112
8979
.5%
00
0.0%
023
20.5
%1
10.
89%
Gib
son
Mila
n SS
D3
188
147
78.2
%27
10.
5%0
4021
.3%
1239
20.7
4%G
ibso
nTr
ento
n SS
D3
140
9668
.6%
00
0.0%
044
31.4
%0
00.
0%G
ibso
nB
radf
ord
SSD
243
3069
.8%
06
14.0
%0
716
.3%
00
0.0%
Gib
son
Gib
son
Cou
nty
SSD
931
122
171
.1%
010
3.2%
080
25.7
%0
00.
0%G
iles
Gile
s Cou
nty
832
328
287
.3%
03
0.9%
038
11.8
%0
00.
0%G
rain
ger
Gra
inge
r Cou
nty
831
124
378
.1%
06
1.9%
062
19.9
%0
00.
0%G
reen
eG
reen
e C
ount
y16
475
390
82.1
%2
163.
4%0
6914
.5%
02
0.42
%G
reen
eG
reen
evill
e7
232
177
76.3
%43
00.
0%0
5523
.7%
1053
22.8
4%G
rund
yG
rund
y C
ount
y7
177
138
78.0
%43
105.
6%10
2916
.4%
1265
36.7
2%H
ambl
enH
ambl
en C
ount
y18
571
474
83.0
%0
61.
1%0
9115
.9%
11
0.18
%H
amilt
onH
amilt
on C
ount
y72
2,88
32,
397
83.1
%11
999
3.4%
3238
713
.4%
4619
76.
83%
Han
cock
Han
cock
Cou
nty
391
7683
.5%
00
0.0%
015
16.5
%0
00.
0%DRAFT

247WWW.TN.GOV/TACIR
Appendix E: School System Infrastructure Needs by County
Cou
nty
Scho
ol S
yste
mSc
hool
Cou
ntC
lass
room
C
ount
Cou
ntL
TG
CC
ount
Cou
ntL
TG
CC
ount
Cou
ntL
TG
CC
ount
LT
GC
C
ount
Tab
le E
-7.
Exi
stin
g Sc
hool
Cla
ssro
om C
ount
s by
Scho
ol S
yste
mIn
clud
ing
Cou
nts o
f Cla
ssro
oms i
n L
ess T
han
Goo
d C
ondi
tion
(LT
GC
)F
ive-
year
Per
iod
July
201
6 th
roug
h Ju
ne 2
021
Tot
alPe
rman
ent C
lass
room
sPo
rtab
le C
lass
room
sO
ther
Cla
ssro
oms
Tot
al L
TG
C
Cla
ssro
oms
Har
dem
anH
arde
man
Cou
nty
932
528
086
.2%
08
2.5%
037
11.4
%2
20.
62%
Har
din
Har
din
Cou
nty
731
424
778
.7%
03
1.0%
064
20.4
%0
00.
0%H
awki
nsH
awki
ns C
ount
y18
557
473
84.9
%0
00.
0%0
8415
.1%
22
0.36
%H
awki
nsR
oger
svill
e1
5045
90.0
%0
00.
0%0
510
.0%
00
0.0%
Hay
woo
dH
ayw
ood
Cou
nty
524
922
188
.8%
05
2.0%
023
9.2%
11
0.4%
Hen
ders
onH
ende
rson
Cou
nty
926
420
678
.0%
05
1.9%
053
20.1
%6
62.
27%
Hen
ders
onLe
ton
211
194
84.7
%0
00.
0%0
1715
.3%
00
0.0%
Hen
ryH
enry
Cou
nty
626
420
878
.8%
00
0.0%
056
21.2
%0
00.
0%H
enry
Paris
SSD
314
111
279
.4%
200
0.0%
029
20.6
%1
2114
.89%
Hic
kman
Hic
kman
Cou
nty
832
326
180
.8%
00
0.0%
062
19.2
%0
00.
0%H
oust
onH
oust
on C
ount
y5
106
8883
.0%
00
0.0%
018
17.0
%0
00.
0%H
umph
reys
Hum
phre
ys C
ount
y7
267
233
87.3
%18
00.
0%0
3412
.7%
018
6.74
%Ja
ckso
nJa
ckso
n C
ount
y4
141
117
83.0
%0
21.
4%0
2215
.6%
00
0.0%
Jeff
erso
nJe
ffer
son
Cou
nty
1360
144
173
.4%
027
4.5%
013
322
.1%
33
0.5%
John
son
John
son
Cou
nty
716
213
684
.0%
00
0.0%
026
16.0
%1
10.
62%
Kno
xK
nox
Cou
nty
874,
058
3,18
778
.5%
2024
36.
0%2
628
15.5
%3
250.
62%
Lake
Lake
Cou
nty
310
873
67.6
%35
65.
6%2
2926
.9%
1653
49.0
7%La
uder
dale
Laud
erda
le C
ount
y7
341
300
88.0
%85
41.
2%0
3710
.9%
1710
229
.91%
Law
renc
eLa
wre
nce
Cou
nty
1346
738
883
.1%
617
3.6%
062
13.3
%0
61.
28%
Lew
isLe
wis
Cou
nty
419
417
288
.7%
02
1.0%
020
10.3
%0
00.
0%Li
ncol
nLi
ncol
n C
ount
y8
296
262
88.5
%0
00.
0%0
3411
.5%
00
0.0%
Linc
oln
Faye
ttevi
lle3
8674
86.0
%8
00.
0%0
1214
.0%
08
9.3%
Loud
onLo
udon
Cou
nty
936
128
478
.7%
04
1.1%
073
20.2
%0
00.
0%Lo
udon
Leno
ir C
ity3
124
105
84.7
%0
10.
8%0
1814
.5%
00
0.0%
McM
inn
McM
inn
Cou
nty
937
429
278
.1%
133
267.
0%0
5615
.0%
513
836
.9%
McM
inn
Ath
ens
510
477
74.0
%0
00.
0%0
2726
.0%
66
5.77
%M
cMin
nEt
owah
132
2887
.5%
80
0.0%
04
12.5
%0
825
.0%
McN
airy
McN
airy
Cou
nty
934
127
680
.9%
06
1.8%
059
17.3
%5
51.
47%
DRAFT
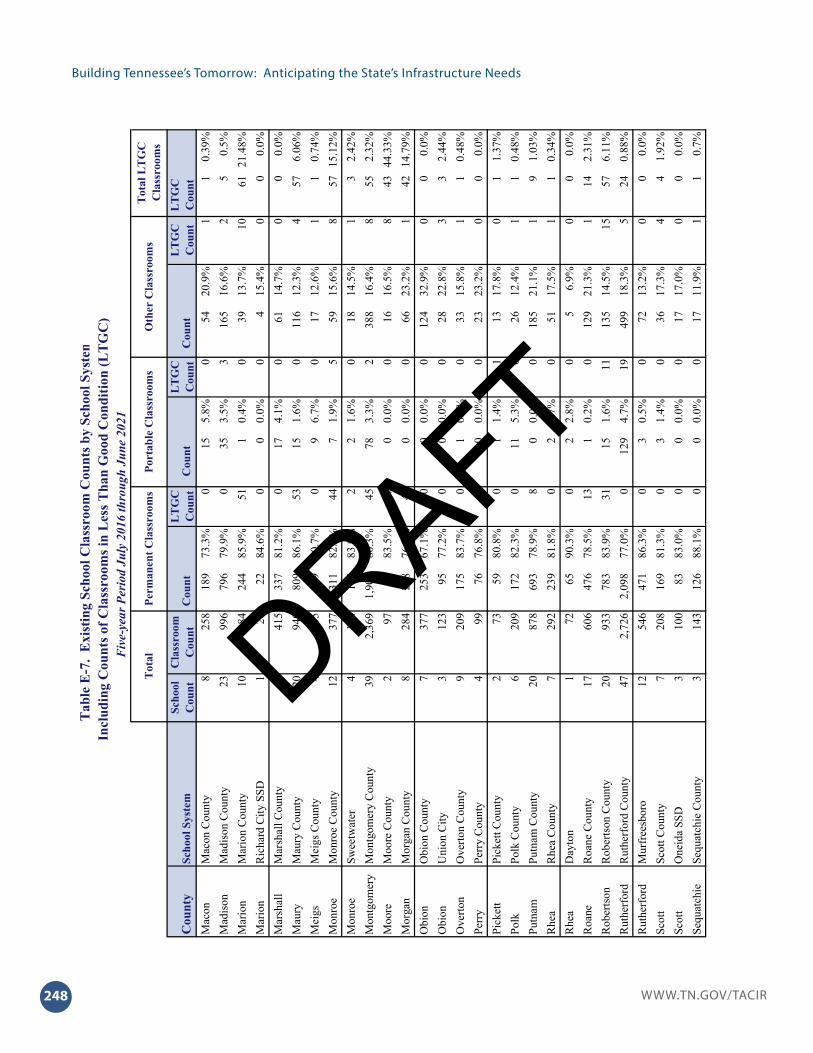
WWW.TN.GOV/TACIR248
Building Tennessee’s Tomorrow: Anticipating the State’s Infrastructure Needs
Cou
nty
Scho
ol S
yste
mSc
hool
Cou
ntC
lass
room
C
ount
Cou
ntL
TG
CC
ount
Cou
ntL
TG
CC
ount
Cou
ntL
TG
CC
ount
LT
GC
C
ount
Tab
le E
-7.
Exi
stin
g Sc
hool
Cla
ssro
om C
ount
s by
Scho
ol S
yste
mIn
clud
ing
Cou
nts o
f Cla
ssro
oms i
n L
ess T
han
Goo
d C
ondi
tion
(LT
GC
)F
ive-
year
Per
iod
July
201
6 th
roug
h Ju
ne 2
021
Tot
alPe
rman
ent C
lass
room
sPo
rtab
le C
lass
room
sO
ther
Cla
ssro
oms
Tot
al L
TG
C
Cla
ssro
oms
Mac
onM
acon
Cou
nty
825
818
973
.3%
015
5.8%
054
20.9
%1
10.
39%
Mad
ison
Mad
ison
Cou
nty
2399
679
679
.9%
035
3.5%
316
516
.6%
25
0.5%
Mar
ion
Mar
ion
Cou
nty
1028
424
485
.9%
511
0.4%
039
13.7
%10
6121
.48%
Mar
ion
Ric
hard
City
SSD
126
2284
.6%
00
0.0%
04
15.4
%0
00.
0%M
arsh
all
Mar
shal
l Cou
nty
1041
533
781
.2%
017
4.1%
061
14.7
%0
00.
0%M
aury
Mau
ry C
ount
y20
940
809
86.1
%53
151.
6%0
116
12.3
%4
576.
06%
Mei
gsM
eigs
Cou
nty
413
510
980
.7%
09
6.7%
017
12.6
%1
10.
74%
Mon
roe
Mon
roe
Cou
nty
1237
731
182
.5%
447
1.9%
559
15.6
%8
5715
.12%
Mon
roe
Swee
twat
er4
124
104
83.9
%2
21.
6%0
1814
.5%
13
2.42
%M
ontg
omer
yM
ontg
omer
y C
ount
y39
2,36
91,
903
80.3
%45
783.
3%2
388
16.4
%8
552.
32%
Moo
reM
oore
Cou
nty
297
8183
.5%
350
0.0%
016
16.5
%8
4344
.33%
Mor
gan
Mor
gan
Cou
nty
828
421
876
.8%
410
0.0%
066
23.2
%1
4214
.79%
Obi
onO
bion
Cou
nty
737
725
367
.1%
00
0.0%
012
432
.9%
00
0.0%
Obi
onU
nion
City
312
395
77.2
%0
00.
0%0
2822
.8%
33
2.44
%O
verto
nO
verto
n C
ount
y9
209
175
83.7
%0
10.
5%0
3315
.8%
11
0.48
%Pe
rry
Perr
y C
ount
y4
9976
76.8
%0
00.
0%0
2323
.2%
00
0.0%
Pick
ett
Pick
ett C
ount
y2
7359
80.8
%0
11.
4%1
1317
.8%
01
1.37
%Po
lkPo
lk C
ount
y6
209
172
82.3
%0
115.
3%0
2612
.4%
11
0.48
%Pu
tnam
Putn
am C
ount
y20
878
693
78.9
%8
00.
0%0
185
21.1
%1
91.
03%
Rhe
aR
hea
Cou
nty
729
223
981
.8%
02
0.7%
051
17.5
%1
10.
34%
Rhe
aD
ayto
n1
7265
90.3
%0
22.
8%0
56.
9%0
00.
0%R
oane
Roa
ne C
ount
y17
606
476
78.5
%13
10.
2%0
129
21.3
%1
142.
31%
Rob
erts
onR
ober
tson
Cou
nty
2093
378
383
.9%
3115
1.6%
1113
514
.5%
1557
6.11
%R
uthe
rfor
dR
uthe
rfor
d C
ount
y47
2,72
62,
098
77.0
%0
129
4.7%
1949
918
.3%
524
0.88
%R
uthe
rfor
dM
urfr
eesb
oro
1254
647
186
.3%
03
0.5%
072
13.2
%0
00.
0%Sc
ott
Scot
t Cou
nty
720
816
981
.3%
03
1.4%
036
17.3
%4
41.
92%
Scot
tO
neid
a SS
D3
100
8383
.0%
00
0.0%
017
17.0
%0
00.
0%Se
quat
chie
Sequ
atch
ie C
ount
y3
143
126
88.1
%0
00.
0%0
1711
.9%
11
0.7%
DRAFT

249WWW.TN.GOV/TACIR
Appendix E: School System Infrastructure Needs by County
Cou
nty
Scho
ol S
yste
mSc
hool
Cou
ntC
lass
room
C
ount
Cou
ntL
TG
CC
ount
Cou
ntL
TG
CC
ount
Cou
ntL
TG
CC
ount
LT
GC
C
ount
Tab
le E
-7.
Exi
stin
g Sc
hool
Cla
ssro
om C
ount
s by
Scho
ol S
yste
mIn
clud
ing
Cou
nts o
f Cla
ssro
oms i
n L
ess T
han
Goo
d C
ondi
tion
(LT
GC
)F
ive-
year
Per
iod
July
201
6 th
roug
h Ju
ne 2
021
Tot
alPe
rman
ent C
lass
room
sPo
rtab
le C
lass
room
sO
ther
Cla
ssro
oms
Tot
al L
TG
C
Cla
ssro
oms
Sevi
erSe
vier
Cou
nty
301,
015
834
82.2
%0
60.
6%0
175
17.2
%7
70.
69%
Shel
bySh
elby
Cou
nty
187
8,75
67,
407
84.6
%2,
023
381
4.4%
2796
811
.1%
250
2,30
026
.27%
Shel
byA
rling
ton
433
327
883
.5%
012
3.6%
043
12.9
%0
00.
0%Sh
elby
Bar
tlett
1173
264
187
.6%
132
81.
1%2
8311
.3%
914
319
.54%
Shel
byC
ollie
rvill
e8
595
521
87.6
%10
710
1.7%
264
10.8
%26
135
22.6
9%Sh
elby
Ger
man
tow
n5
364
296
81.3
%24
439
10.7
%27
298.
0%24
295
81.0
4%Sh
elby
Lake
land
170
6491
.4%
02
2.9%
04
5.7%
00
0.0%
Shel
byM
illin
gton
423
619
381
.8%
258
3.4%
835
14.8
%3
3615
.25%
Smith
Smith
Cou
nty
927
719
971
.8%
286
2.2%
672
26.0
%2
3613
.0%
Stew
art
Stew
art C
ount
y6
172
138
80.2
%0
00.
0%0
3419
.8%
00
0.0%
Sulli
van
Sulli
van
Cou
nty
2284
170
984
.3%
7117
2.0%
711
513
.7%
1896
11.4
1%Su
lliva
nB
risto
l8
288
243
84.4
%37
00.
0%0
4515
.6%
2158
20.1
4%Su
lliva
nK
ings
port
1257
039
869
.8%
06
1.1%
016
629
.1%
00
0.0%
Sum
ner
Sum
ner C
ount
y48
2,08
11,
733
83.3
%16
643.
1%0
284
13.6
%12
281.
35%
Tipt
onTi
pton
Cou
nty
1470
460
585
.9%
02
0.3%
097
13.8
%0
00.
0%Tr
ousd
ale
Har
tsvi
lle-T
rous
dale
3
130
9976
.2%
00
0.0%
031
23.8
%1
10.
77%
Uni
coi
Uni
coi C
ount
y7
212
163
76.9
%0
41.
9%0
4521
.2%
11
0.47
%U
nion
Uni
on C
ount
y10
236
171
72.5
%0
41.
7%0
6125
.8%
11
0.42
%V
an B
uren
Van
Bur
en C
ount
y2
5648
85.7
%0
00.
0%0
814
.3%
00
0.0%
War
ren
War
ren
Cou
nty
1146
541
489
.0%
03
0.6%
248
10.3
%1
30.
65%
Was
hing
ton
Was
hing
ton
Cou
nty
1559
850
484
.3%
022
3.7%
072
12.0
%0
00.
0%W
ashi
ngto
nJo
hnso
n C
ity11
514
404
78.6
%22
00.
0%0
110
21.4
%0
224.
28%
Way
neW
ayne
Cou
nty
824
321
086
.4%
22
0.8%
031
12.8
%2
41.
65%
Wea
kley
Wea
kley
Cou
nty
1141
533
179
.8%
00
0.0%
084
20.2
%4
40.
96%
Whi
teW
hite
Cou
nty
931
325
681
.8%
27
2.2%
250
16.0
%1
51.
6%W
illia
mso
nW
illia
mso
n C
ount
y42
2,09
21,
774
84.8
%0
341.
6%0
284
13.6
%2
20.
1%W
illia
mso
nFr
ankl
in S
SD8
395
334
84.6
%20
00.
0%0
6115
.4%
020
5.06
%W
ilson
Wils
on C
ount
y20
1,19
31,
001
83.9
%0
231.
9%0
169
14.2
%0
00.
0%W
ilson
Leba
non
SSD
628
225
590
.4%
03
1.1%
024
8.5%
00
0.0%
Stat
ewid
e1,
733
72,6
9959
,408
81.7
2%4,
649
2,12
02.
92%
278
11,1
7115
.37%
787
5,71
47.
86%
DRAFT

WWW.TN.GOV/TACIR250
Building Tennessee’s Tomorrow: Anticipating the State’s Infrastructure Needs
School System Estimated Cost
Anderson County 17 94.4% $ 2,350,248Clinton 1 33.3% 25,000Oak Ridge 5 62.5% 5,270,000Bedford County 0 0.0% 0Benton County 8 100.0% 769,200Bledsoe County 2 40.0% 195,000Blount County 20 100.0% 2,044,870Alcoa 3 75.0% 140,000Maryville 0 0.0% 0Bradley County 2 11.1% 128,500Cleveland 4 44.4% 240,000Campbell County 12 80.0% 2,255,000Cannon County 6 85.7% 110,031Carroll County 0 0.0% 0Hollow Rock-Bruceton SSD 0 0.0% 0Huntingdon SSD 0 0.0% 0McKenzie SSD 3 100.0% 45,000South Carroll SSD 0 0.0% 0West Carroll SSD 0 0.0% 0Carter County 15 100.0% 359,214Elizabethton 1 20.0% 115,253Cheatham County 0 0.0% 0Chester County 3 50.0% 233,600Claiborne County 8 61.5% 650,000Clay County 0 0.0% 0Cocke County 10 83.3% 996,607Newport 1 100.0% 65,000Coffee County 0 0.0% 0Manchester 0 0.0% 0Tullahoma 0 0.0% 0Crockett County 0 0.0% 0Alamo 1 100.0% 60,000Bells 1 100.0% 30,000Cumberland County 12 100.0% 280,000Davidson County 1 0.7% 4,000Decatur County 0 0.0% 0DeKalb County 1 14.3% 4,000Dickson County 0 0.0% 650,000Dyer County 0 0.0% 0Dyersburg 4 100.0% 90,000
County Existing Schools Affected
Per Student
Anderson $369
Technology Needs
Benton $360Bledsoe $113Blount $190
Anderson $28Anderson $1,192Bedford $0
Bradley $44Campbell $412Cannon $57
Blount $74Blount $0Bradley $13
Carroll $34Carroll $0Carroll $0
Carroll $0Carroll $0Carroll $0
Chester $83Claiborne $152Clay $0
Carter $69Carter $47Cheatham $0
Coffee $0Coffee $0Crockett $0
Cocke $223Cocke $91Coffee $0
Davidson $0Decatur $0DeKalb $1
Crockett $103Crockett $80Cumberland $39
Dickson $79Dyer $0Dyer $34
Table E-8. Technology Needs at Existing Public SchoolsTotal Estimated Cost and Cost per Student by School System
Five-year Period July 2016 through June 2021
DRAFT

251WWW.TN.GOV/TACIR
Appendix E: School System Infrastructure Needs by County
School System Estimated CostCounty Existing Schools Affected
Per Student
Technology Needs
Table E-8. Technology Needs at Existing Public SchoolsTotal Estimated Cost and Cost per Student by School System
Five-year Period July 2016 through June 2021
Fayette County 5 62.5% 210,000Fentress County 6 100.0% 450,000Franklin County 11 100.0% 900,000Humboldt 1 33.3% 160,000Milan SSD 0 0.0% 0Trenton SSD 0 0.0% 0Bradford SSD 0 0.0% 0Gibson County SSD 0 0.0% 0Giles County 1 12.5% 60,000Grainger County 8 100.0% 483,237Greene County 16 100.0% 1,164,130Greeneville 7 100.0% 769,998Grundy County 7 100.0% 645,000Hamblen County 15 83.3% 920,800Hamilton County 0 0.0% 0Hancock County 1 33.3% 8,400Hardeman County 0 0.0% 0Hardin County 7 100.0% 761,946Hawkins County 3 15.0% 1,464,411Rogersville 0 0.0% 0Haywood County 3 60.0% 618,243Henderson County 3 33.3% 89,495Lexington 1 50.0% 98,000Henry County 6 85.7% 296,654Paris SSD 0 0.0% 0Hickman County 8 88.9% 1,500,000Houston County 0 0.0% 0Humphreys County 5 71.4% 410,000Jackson County 1 25.0% 75,000Jefferson County 7 53.8% 498,000Johnson County 1 14.3% 20,150Knox County 22 25.3% 3,472,953Lake County 1 33.3% 150,000Lauderdale County 0 0.0% 0Lawrence County 0 0.0% 0Lewis County 0 0.0% 0Lincoln County 3 37.5% 15,000Fayetteville 0 0.0% 0Loudon County 2 22.2% 956,600Lenoir City 0 0.0% 0
Fayette $65Fentress $215Franklin $166
Gibson $0Gibson $0Giles $16
Gibson $153Gibson $0Gibson $0
Grundy $310Hamblen $91Hamilton $0
Grainger $137Greene $174Greene $278
Hawkins $212Hawkins $0Haywood $213
Hancock $9Hardeman $0Hardin $220
Henry $0Hickman $449Houston $0
Henderson $23Henderson $111Henry $100
Johnson $10Knox $60Lake $190
Humphreys $142Jackson $51Jefferson $70
Lincoln $4Lincoln $0Loudon $205
Lauderdale $0Lawrence $0Lewis $0
Loudon $0
DRAFT

WWW.TN.GOV/TACIR252
Building Tennessee’s Tomorrow: Anticipating the State’s Infrastructure Needs
School System Estimated CostCounty Existing Schools Affected
Per Student
Technology Needs
Table E-8. Technology Needs at Existing Public SchoolsTotal Estimated Cost and Cost per Student by School System
Five-year Period July 2016 through June 2021
McMinn County 0 0.0% 0Athens 4 80.0% 700,000Etowah 1 100.0% 285,000McNairy County 7 77.8% 226,400Macon County 0 0.0% 0Madison County 23 100.0% 10,809,200Marion County 4 40.0% 400,000Richard City SSD 0 0.0% 0Marshall County 0 0.0% 0Maury County 0 0.0% 0Meigs County 0 0.0% 0Monroe County 7 58.3% 164,000Sweetwater 4 100.0% 205,000Montgomery County 38 97.4% 3,741,000Moore County 2 100.0% 200,000Morgan County 6 75.0% 802,500Obion County 0 0.0% 0Union City 3 75.0% 25,300Overton County 6 60.0% 941,000Perry County 0 0.0% 0Pickett County 1 33.3% 130,000Polk County 0 0.0% 0Putnam County 16 76.2% 390,000Rhea County 0 0.0% 0Dayton 0 0.0% 0Roane County 17 100.0% 1,224,993Robertson County 20 95.2% 7,227,000Rutherford County 0 0.0% 0Murfreesboro 0 0.0% 0Scott County 1 14.3% 35,000Oneida SSD 0 0.0% 0Sequatchie County 3 60.0% 105,000Sevier County 0 0.0% 0Shelby County 117 62.6% 51,165,723Arlington 4 100.0% 750,000Bartlett 3 27.3% 480,000Collierville 8 100.0% 1,211,750Germantown 3 60.0% 300,000Lakeland 1 100.0% 84,000Millington 4 100.0% 425,000
McMinn $807McNairy $54Macon $0
McMinn $0McMinn $446
Marshall $0Maury $0Meigs $0
Madison $865Marion $99Marion $0
Moore $235Morgan $265Obion $0
Monroe $31Monroe $134Montgomery $117
Pickett $180Polk $0Putnam $36
Obion $16Overton $304Perry $0
Robertson $658Rutherford $0Rutherford $0
Rhea $0Rhea $0Roane $186
Sevier $0Shelby $443Shelby $150
Scott $12Scott $0Sequatchie $47
Shelby $93Shelby $167
Shelby $56Shelby $151Shelby $52
DRAFT
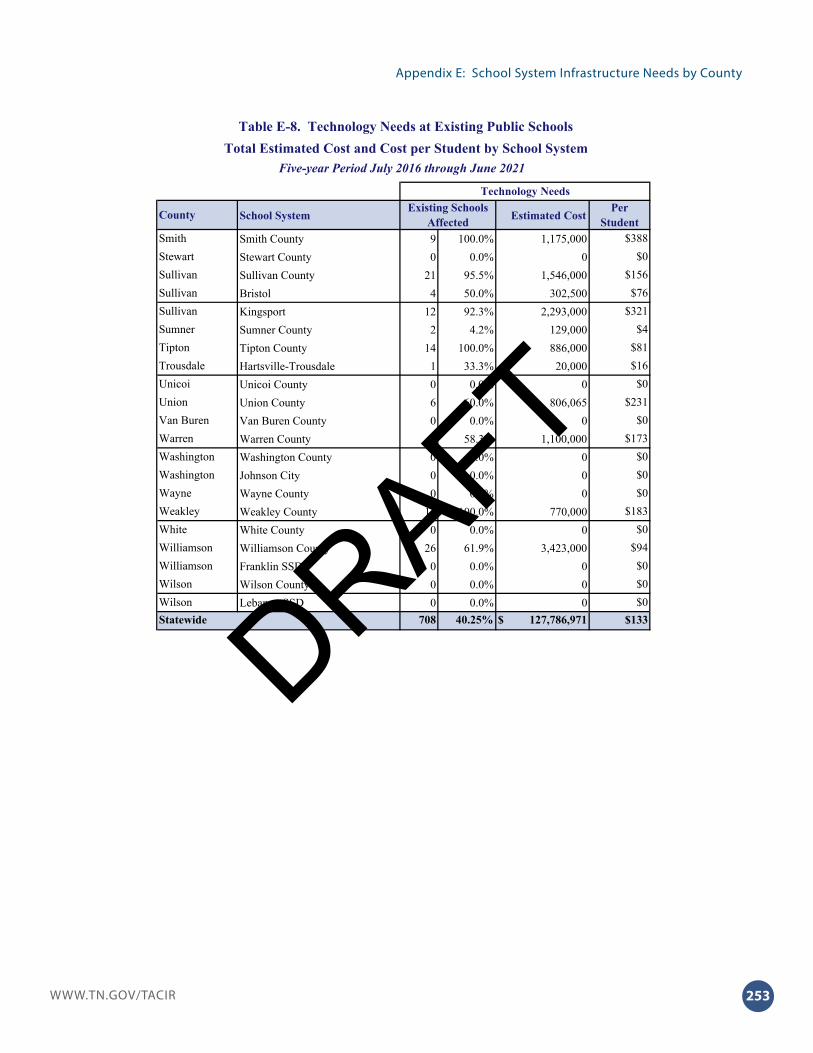
253WWW.TN.GOV/TACIR
Appendix E: School System Infrastructure Needs by County
School System Estimated CostCounty Existing Schools Affected
Per Student
Technology Needs
Table E-8. Technology Needs at Existing Public SchoolsTotal Estimated Cost and Cost per Student by School System
Five-year Period July 2016 through June 2021
Smith County 9 100.0% 1,175,000Stewart County 0 0.0% 0Sullivan County 21 95.5% 1,546,000Bristol 4 50.0% 302,500Kingsport 12 92.3% 2,293,000Sumner County 2 4.2% 129,000Tipton County 14 100.0% 886,000Hartsville-Trousdale 1 33.3% 20,000Unicoi County 0 0.0% 0Union County 6 60.0% 806,065Van Buren County 0 0.0% 0Warren County 7 58.3% 1,100,000Washington County 0 0.0% 0Johnson City 0 0.0% 0Wayne County 0 0.0% 0Weakley County 11 100.0% 770,000White County 0 0.0% 0Williamson County 26 61.9% 3,423,000Franklin SSD 0 0.0% 0Wilson County 0 0.0% 0Lebanon SSD 0 0.0% 0
708 40.25% $ 127,786,971
Sullivan $76Sullivan $321Sumner $4
Smith $388Stewart $0Sullivan $156
$231Van Buren $0Warren $173
Tipton $81Trousdale $16Unicoi $0
Statewide $133
Williamson $0Wilson $0Wilson $0
Weakley $183White $0Williamson $94
Washington $0Washington $0Wayne $0
Union
DRAFT
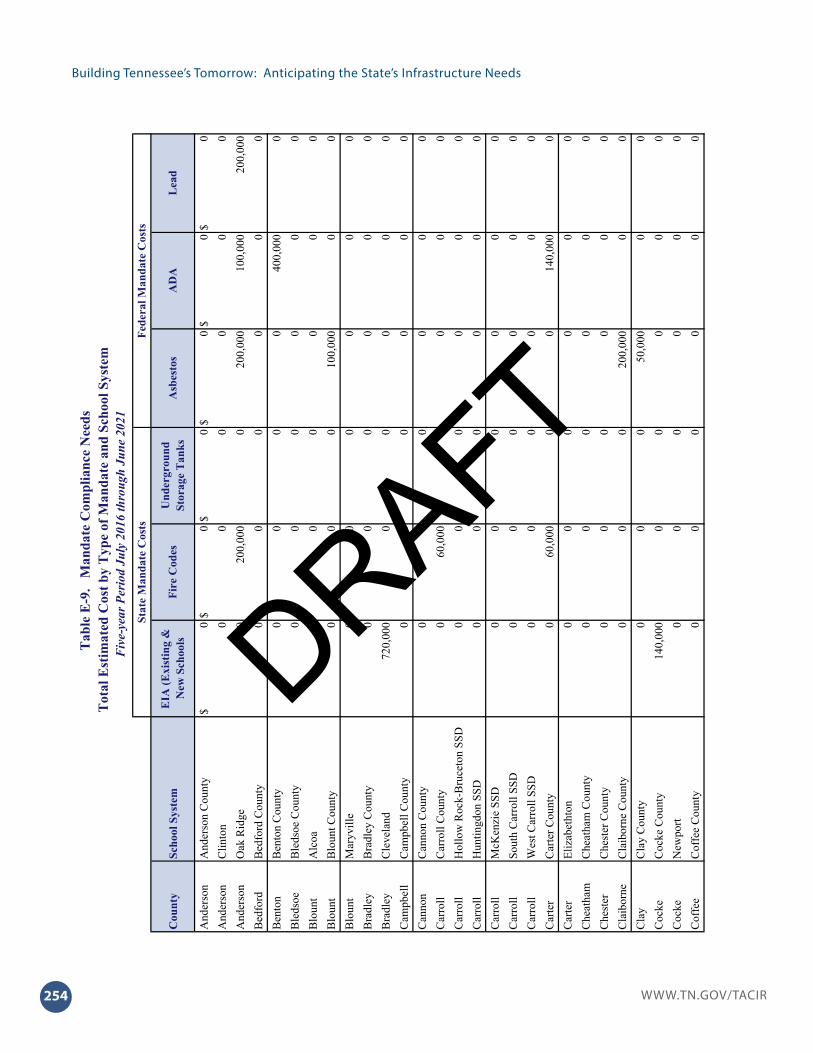
WWW.TN.GOV/TACIR254
Building Tennessee’s Tomorrow: Anticipating the State’s Infrastructure Needs
Cou
nty
Scho
ol S
yste
m
And
erso
nA
nder
son
Cou
nty
$0
$0
$0
$0
$0
$0
And
erso
nC
linto
n0
00
00
0A
nder
son
Oak
Rid
ge0
200,
000
020
0,00
010
0,00
020
0,00
0B
edfo
rdB
edfo
rd C
ount
y0
00
00
0B
ento
nB
ento
n C
ount
y0
00
040
0,00
00
Ble
dsoe
Ble
dsoe
Cou
nty
00
00
00
Blo
unt
Alc
oa0
00
00
0B
loun
tB
loun
t Cou
nty
00
010
0,00
00
0B
loun
tM
aryv
ille
00
00
00
Bra
dley
Bra
dley
Cou
nty
00
00
00
Bra
dley
Cle
vela
nd72
0,00
00
00
00
Cam
pbel
lC
ampb
ell C
ount
y0
00
00
0C
anno
nC
anno
n C
ount
y0
00
00
0C
arro
llC
arro
ll C
ount
y0
60,0
000
00
0C
arro
llH
ollo
w R
ock-
Bru
ceto
n SS
D0
00
00
0C
arro
llH
untin
gdon
SSD
00
00
00
Car
roll
McK
enzi
e SS
D0
00
00
0C
arro
llSo
uth
Car
roll
SSD
00
00
00
Car
roll
Wes
t Car
roll
SSD
00
00
00
Car
ter
Car
ter C
ount
y0
60,0
000
014
0,00
00
Car
ter
Eliz
abet
hton
00
00
00
Che
atha
mC
heat
ham
Cou
nty
00
00
00
Che
ster
Che
ster
Cou
nty
00
00
00
Cla
ibor
neC
laib
orne
Cou
nty
00
020
0,00
00
0C
lay
Cla
y C
ount
y0
00
50,0
000
0C
ocke
Coc
ke C
ount
y14
0,00
00
00
00
Coc
keN
ewpo
rt0
00
00
0C
offe
eC
offe
e C
ount
y0
00
00
0
Stat
e M
anda
te C
osts
Fede
ral M
anda
te C
osts
Tab
le E
-9.
Man
date
Com
plia
nce
Nee
dsT
otal
Est
imat
ed C
ost b
y T
ype
of M
anda
te a
nd S
choo
l Sys
tem
Fiv
e-ye
ar P
erio
d Ju
ly 2
016
thro
ugh
June
202
1
Lea
dE
IA (E
xist
ing
&
New
Sch
ools
Fire
Cod
esU
nder
grou
nd
Stor
age
Tan
ksA
sbes
tos
AD
A
DRAFT

255WWW.TN.GOV/TACIR
Appendix E: School System Infrastructure Needs by County
Cou
nty
Scho
ol S
yste
m
Stat
e M
anda
te C
osts
Fede
ral M
anda
te C
osts
Tab
le E
-9.
Man
date
Com
plia
nce
Nee
dsT
otal
Est
imat
ed C
ost b
y T
ype
of M
anda
te a
nd S
choo
l Sys
tem
Fiv
e-ye
ar P
erio
d Ju
ly 2
016
thro
ugh
June
202
1
Lea
dE
IA (E
xist
ing
&
New
Sch
ools
Fire
Cod
esU
nder
grou
nd
Stor
age
Tan
ksA
sbes
tos
AD
A
Cof
fee
Man
ches
ter
00
00
00
Cof
fee
Tulla
hom
a0
00
00
0C
rock
ett
Ala
mo
00
00
00
Cro
cket
tB
ells
00
00
00
Cro
cket
tC
rock
ett C
ount
y0
00
00
0C
umbe
rland
Cum
berla
nd C
ount
y0
00
01,
100,
000
0D
avid
son
Dav
idso
n C
ount
y0
00
04,
200,
200
0D
ecat
urD
ecat
ur C
ount
y0
00
00
0D
eKal
bD
eKal
b C
ount
y0
00
00
0D
icks
onD
icks
on C
ount
y0
00
00
0D
yer
Dye
r Cou
nty
00
00
00
Dye
rD
yers
burg
01,
000,
000
00
00
Faye
tteFa
yette
Cou
nty
00
00
00
Fent
ress
Fent
ress
Cou
nty
300,
000
00
00
0Fr
ankl
inFr
ankl
in C
ount
y0
00
00
0G
ibso
nB
radf
ord
SSD
00
00
00
Gib
son
Gib
son
Cou
nty
SSD
00
00
00
Gib
son
Hum
bold
t0
00
00
0G
ibso
nM
ilan
SSD
00
00
00
Gib
son
Tren
ton
SSD
00
00
00
Gile
sG
iles C
ount
y0
00
00
0G
rain
ger
Gra
inge
r Cou
nty
00
00
00
Gre
ene
Gre
ene
Cou
nty
00
00
00
Gre
ene
Gre
enev
ille
075
,000
00
145,
000
0G
rund
yG
rund
y C
ount
y0
00
00
0H
ambl
enH
ambl
en C
ount
y0
00
00
0H
amilt
onH
amilt
on C
ount
y0
00
00
0H
anco
ckH
anco
ck C
ount
y0
00
00
0DRAFT

WWW.TN.GOV/TACIR256
Building Tennessee’s Tomorrow: Anticipating the State’s Infrastructure Needs
Cou
nty
Scho
ol S
yste
m
Stat
e M
anda
te C
osts
Fede
ral M
anda
te C
osts
Tab
le E
-9.
Man
date
Com
plia
nce
Nee
dsT
otal
Est
imat
ed C
ost b
y T
ype
of M
anda
te a
nd S
choo
l Sys
tem
Fiv
e-ye
ar P
erio
d Ju
ly 2
016
thro
ugh
June
202
1
Lea
dE
IA (E
xist
ing
&
New
Sch
ools
Fire
Cod
esU
nder
grou
nd
Stor
age
Tan
ksA
sbes
tos
AD
A
Har
dem
anH
arde
man
Cou
nty
00
00
00
Har
din
Har
din
Cou
nty
00
00
00
Haw
kins
Haw
kins
Cou
nty
065
,000
00
00
Haw
kins
Rog
ersv
ille
00
00
00
Hay
woo
dH
ayw
ood
Cou
nty
00
00
00
Hen
ders
onH
ende
rson
Cou
nty
00
00
00
Hen
ders
onLe
ton
00
00
00
Hen
ryH
enry
Cou
nty
00
00
00
Hen
ryPa
ris S
SD0
00
00
0H
ickm
anH
ickm
an C
ount
y0
00
00
0H
oust
onH
oust
on C
ount
y0
00
00
0H
umph
reys
Hum
phre
ys C
ount
y0
00
00
0Ja
ckso
nJa
ckso
n C
ount
y0
00
00
0Je
ffer
son
Jeff
erso
n C
ount
y0
00
00
0Jo
hnso
nJo
hnso
n C
ount
y0
00
00
0K
nox
Kno
x C
ount
y0
00
309,
872
1,33
9,04
20
Lake
Lake
Cou
nty
00
00
00
Laud
erda
leLa
uder
dale
Cou
nty
034
0,00
00
1,00
0,00
010
7,50
00
Law
renc
eLa
wre
nce
Cou
nty
00
00
150,
000
0Le
wis
Lew
is C
ount
y0
00
00
0Li
ncol
nFa
yette
ville
00
00
00
Linc
oln
Linc
oln
Cou
nty
00
00
00
Loud
onLe
noir
City
00
00
00
Loud
onLo
udon
Cou
nty
00
00
00
McM
inn
Ath
ens
600,
000
00
016
7,00
00
McM
inn
Etow
ah0
00
00
0M
cMin
nM
cMin
n C
ount
y0
00
084
,000
0M
cNai
ryM
cNai
ry C
ount
y3,
000,
000
00
010
0,00
00
DRAFT

257WWW.TN.GOV/TACIR
Appendix E: School System Infrastructure Needs by County
Cou
nty
Scho
ol S
yste
m
Stat
e M
anda
te C
osts
Fede
ral M
anda
te C
osts
Tab
le E
-9.
Man
date
Com
plia
nce
Nee
dsT
otal
Est
imat
ed C
ost b
y T
ype
of M
anda
te a
nd S
choo
l Sys
tem
Fiv
e-ye
ar P
erio
d Ju
ly 2
016
thro
ugh
June
202
1
Lea
dE
IA (E
xist
ing
&
New
Sch
ools
Fire
Cod
esU
nder
grou
nd
Stor
age
Tan
ksA
sbes
tos
AD
A
Mac
onM
acon
Cou
nty
00
060
,000
00
Mad
ison
Mad
ison
Cou
nty
02,
100,
000
02,
675,
000
500,
000
0M
ario
nM
ario
n C
ount
y0
00
00
0M
ario
nR
icha
rd C
ity S
SD0
00
00
0M
arsh
all
Mar
shal
l Cou
nty
00
00
00
Mau
ryM
aury
Cou
nty
019
5,00
00
00
0M
eigs
Mei
gs C
ount
y0
00
00
0M
onro
eM
onro
e C
ount
y0
00
00
0M
onro
eSw
eetw
ater
00
00
00
Mon
tgom
ery
Mon
tgom
ery
Cou
nty
50,0
0025
0,00
00
50,0
001,
180,
000
0M
oore
Moo
re C
ount
y0
00
00
0M
orga
nM
orga
n C
ount
y0
00
00
0O
bion
Obi
on C
ount
y0
00
00
0O
bion
Uni
on C
ity0
00
55,0
000
0O
verto
nO
verto
n C
ount
y0
00
00
0Pe
rry
Perr
y C
ount
y0
00
00
0Pi
cket
tPi
cket
t Cou
nty
00
00
00
Polk
Polk
Cou
nty
00
00
00
Putn
amPu
tnam
Cou
nty
00
00
75,0
000
Rhe
aD
ayto
n0
00
00
0R
hea
Rhe
a C
ount
y0
00
00
0R
oane
Roa
ne C
ount
y0
00
250,
000
00
Rob
erts
onR
ober
tson
Cou
nty
00
01,
700,
000
250,
000
0R
uthe
rfor
dM
urfr
eesb
oro
00
00
00
Rut
herf
ord
Rut
herf
ord
Cou
nty
175,
000
00
385,
376
00
Scot
tO
neid
a SS
D0
00
00
0Sc
ott
Scot
t Cou
nty
00
00
00
Sequ
atch
ieSe
quat
chie
Cou
nty
330,
000
00
00
0DRAFT

WWW.TN.GOV/TACIR258
Building Tennessee’s Tomorrow: Anticipating the State’s Infrastructure Needs
Cou
nty
Scho
ol S
yste
m
Stat
e M
anda
te C
osts
Fede
ral M
anda
te C
osts
Tab
le E
-9.
Man
date
Com
plia
nce
Nee
dsT
otal
Est
imat
ed C
ost b
y T
ype
of M
anda
te a
nd S
choo
l Sys
tem
Fiv
e-ye
ar P
erio
d Ju
ly 2
016
thro
ugh
June
202
1
Lea
dE
IA (E
xist
ing
&
New
Sch
ools
Fire
Cod
esU
nder
grou
nd
Stor
age
Tan
ksA
sbes
tos
AD
A
Sevi
erSe
vier
Cou
nty
00
00
150,
000
0Sh
elby
Arli
ngto
n0
00
00
0Sh
elby
Bar
tlett
00
020
0,00
01,
150,
000
0Sh
elby
Col
lierv
ille
00
00
00
Shel
byG
erm
anto
wn
055
0,00
00
02,
800,
000
0Sh
elby
Lake
land
00
00
00
Shel
byM
illin
gton
00
00
750,
000
0Sh
elby
Shel
by C
ount
y5,
315,
000
1,47
0,30
00
11,5
33,0
0028
,434
,897
0Sm
ithSm
ith C
ount
y0
00
00
0St
ewar
tSt
ewar
t Cou
nty
00
00
00
Sulli
van
Bris
tol
01,
300,
000
00
1,05
0,00
00
Sulli
van
Kin
gspo
rt0
00
022
5,00
00
Sulli
van
Sulli
van
Cou
nty
5,00
0,00
010
0,00
00
047
5,00
00
Sum
ner
Sum
ner C
ount
y0
00
090
,000
0Ti
pton
Tipt
on C
ount
y0
00
00
0Tr
ousd
ale
Har
tsvi
lle-T
rous
dale
50
,000
00
00
0U
nico
iU
nico
i Cou
nty
00
00
00
Uni
onU
nion
Cou
nty
00
00
00
Van
Bur
enV
an B
uren
Cou
nty
00
00
00
War
ren
War
ren
Cou
nty
00
00
00
Was
hing
ton
John
son
City
00
00
00
Was
hing
ton
Was
hing
ton
Cou
nty
00
00
00
Way
neW
ayne
Cou
nty
00
00
00
Wea
kley
Wea
kley
Cou
nty
00
00
00
Whi
teW
hite
Cou
nty
00
010
0,00
00
0W
illia
mso
nFr
ankl
in S
SD0
00
00
0W
illia
mso
nW
illia
mso
n C
ount
y0
00
00
0W
ilson
Leba
non
SSD
00
00
150,
000
0W
ilson
Wils
on C
ount
y3,
000,
000
00
2,29
8,75
00
0G
rand
Tot
al$
18,6
80,0
00$
7,76
5,30
0$
0$
21,1
66,9
98$
45,3
12,6
39$
200,
000
DRAFT