Appendix D Traffic Modelling Assessment · Test 4 is the same as Test 2 but rather than running...
49
Ngauranga Triangle Strategy Study Short List Options Assessment Report Appendix D Traffic Modelling Assessment SINCLAIR KNIGHT MERZ I:\ZBIFW\Projects\ZB00938\Deliverables\Short Options Assessment\FINAL\Short Options Report - 090925 - Final 091109.docx
-
Upload
vuonghuong -
Category
Documents
-
view
213 -
download
0
Transcript of Appendix D Traffic Modelling Assessment · Test 4 is the same as Test 2 but rather than running...

Ngauranga Triangle Strategy Study Short List Options Assessment Report
Appendix D Traffic Modelling Assessment
SINCLAIR KNIGHT MERZ I:\ZBIFW\Projects\ZB00938\Deliverables\Short Options Assessment\FINAL\Short Options Report - 090925 - Final 091109.docx

Short List Assessment
SINCLAIR KNIGHT MERZ
D:\Documents and Settings\tsmall\Desktop\090901Modelling Report.docx PAGE i
Contents 1. Link Road 1
1.1. Summary of Options 1 1.1.1. Test 1 1 1.1.2. Test 2 2 1.1.3. Test 3 2 1.1.4. Test 4 2 1.1.5. Test 5 2 1.1.6. Test 6 2 1.2. Traffic modelling assumptions 2 1.2.1. Test 1 3 1.2.2. Test 2 3 1.2.3. Test 3 5 1.2.4. Test 4 6 1.2.5. Test 5 7 1.2.6. Test 6 8 1.3. 2016 Traffic modelling outputs 8 1.3.1. State Highway travel times 9 1.3.2. Link road travel times 12 1.3.2.1. Grenada to SH2 12 1.3.2.2. Grenada to Petone Esplanade 14 1.3.3. Flows on link road 17 1.3.4. Flows on Petone Esplanade 18 1.3.5. Flows on SH58 21 1.3.6. Flows on SH2 between Petone and Dowse 22 1.3.7. Network statistics 23 1.3.7.1. AM peak 24 1.3.7.2. Inter peak 24 1.3.7.3. PM peak 25
2. Cross Valley Link 26 2.1. Summary of options 26 2.1.1. Test 7 26 2.1.2. Test 8 26 2.1.3. Test 9 26 2.1.4. Test 10 26 2.1.5. Test 11 26 2.1.6. Test 12 26 2.1.7. Test 13 26 2.1.8. Test 16 26 2.1.9. Test 17 26
Short List Assessment
SINCLAIR KNIGHT MERZ D:\Documents and Settings\tsmall\Desktop\090901Modelling Report.docx PAGE ii
2.2. Traffic modelling assumptions 27 2.2.1. Test 7 27 2.2.2. Test 8 27 2.2.3. Test 9 28 2.2.4. Test 10 28 2.2.5. Test 16 29 2.2.6. Test 17 30 2.3. 2016 Traffic modelling outputs 31 2.3.1. Flows on Petone Esplanade 31 2.3.2. Network statistics 35 2.3.2.1. AM peak 35 2.3.2.2. Inter peak 36 2.3.2.3. PM peak 36
3. Combination of Options 37 3.1. Summary of options 37 3.1.1. Test 14 37 3.1.2. Test 15 37 3.2. Traffic modelling assumptions 37 3.2.1. Test 14 37 3.2.2. Test 15 37 3.3. 2016 Traffic modelling outputs 37 3.3.1. State Highway travel times 37 3.3.2. Flows on link road 39 3.3.3. Flows on Petone Esplanade 41 3.3.4. Network statistics 44 3.3.4.1. AM peak 44 3.3.4.2. Inter peak 45 3.3.4.3. PM peak 45

Short List Assessment
SINCLAIR KNIGHT MERZ D:\Documents and Settings\tsmall\Desktop\090901Modelling Report.docx PAGE 1
1. Link Road 1.1. Summary of Options
The following notation has been used to describe the variations in the link road (as noted in Figure 1-1 below).
– A1 – Connection at SH1 south of Grenada North interchange
– A2 – Connection to Westchester Drive East
– B3 - As per Figure 1-1
– C3 - As per Figure 1-1
– D1 – Connection only to Petone Esplanade
– D2 – Connection only to SH2
– D3 – Connection to both Petone Esplanade and SH2
– D4 – Connection to Dowse Interchange
– D5 – Parallel link from Horokiwi to Petone Figure 1-1 Option diagram
1.1.1. Test 1
Test 1 is the 2016/2026 do minimum (DM) scenario which includes all permitted developments and planned consented upgrades in the model area. Of particular relevance to this study are the inclusion of the Dowse interchange, Korokoro Road intersection, Melling interchange, Kennedy Good Bridge and SH2/SH58 interchange upgrades.
Short List Assessment
SINCLAIR KNIGHT MERZ D:\Documents and Settings\tsmall\Desktop\090901Modelling Report.docx PAGE 2
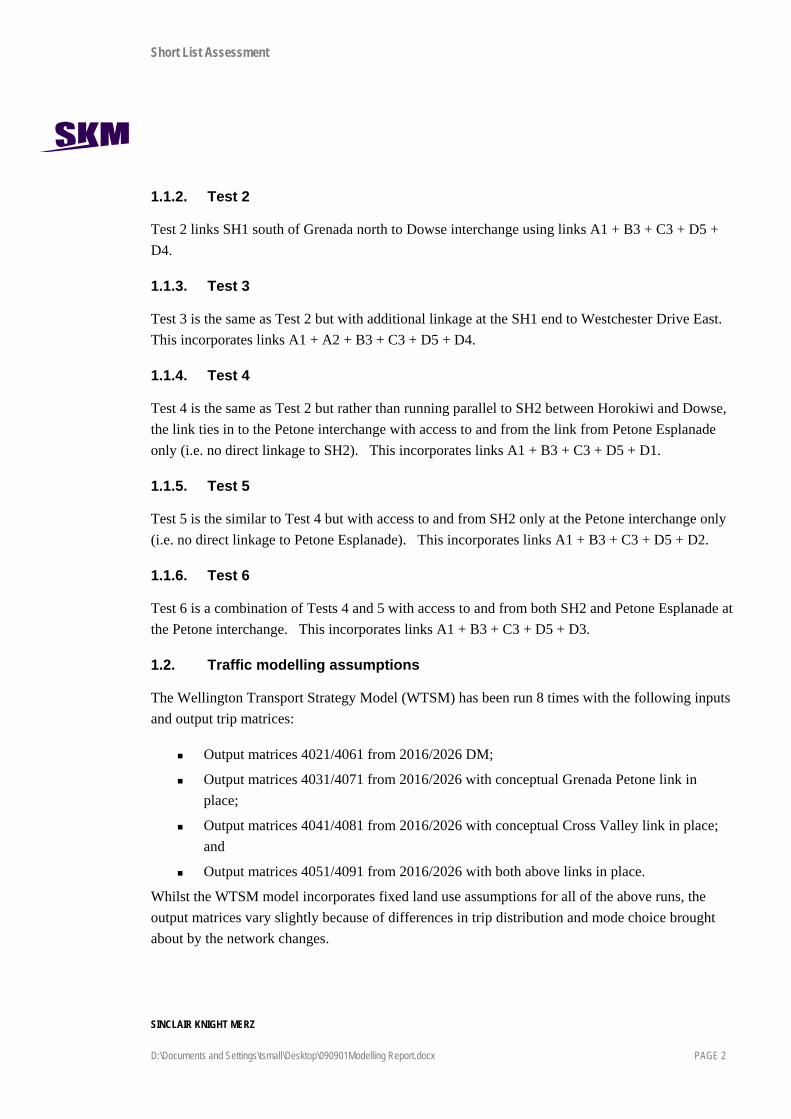
1.1.2. Test 2
Test 2 links SH1 south of Grenada north to Dowse interchange using links A1 + B3 + C3 + D5 + D4.
1.1.3. Test 3
Test 3 is the same as Test 2 but with additional linkage at the SH1 end to Westchester Drive East. This incorporates links A1 + A2 + B3 + C3 + D5 + D4.
1.1.4. Test 4
Test 4 is the same as Test 2 but rather than running parallel to SH2 between Horokiwi and Dowse, the link ties in to the Petone interchange with access to and from the link from Petone Esplanade only (i.e. no direct linkage to SH2). This incorporates links A1 + B3 + C3 + D5 + D1.
1.1.5. Test 5
Test 5 is the similar to Test 4 but with access to and from SH2 only at the Petone interchange only (i.e. no direct linkage to Petone Esplanade). This incorporates links A1 + B3 + C3 + D5 + D2.
1.1.6. Test 6
Test 6 is a combination of Tests 4 and 5 with access to and from both SH2 and Petone Esplanade at the Petone interchange. This incorporates links A1 + B3 + C3 + D5 + D3.
1.2. Traffic modelling assumptions
The Wellington Transport Strategy Model (WTSM) has been run 8 times with the following inputs and output trip matrices:
Output matrices 4021/4061 from 2016/2026 DM;
Output matrices 4031/4071 from 2016/2026 with conceptual Grenada Petone link in place;
Output matrices 4041/4081 from 2016/2026 with conceptual Cross Valley link in place; and
Output matrices 4051/4091 from 2016/2026 with both above links in place.
Whilst the WTSM model incorporates fixed land use assumptions for all of the above runs, the output matrices vary slightly because of differences in trip distribution and mode choice brought about by the network changes.

Short List Assessment
SINCLAIR KNIGHT MERZ D:\Documents and Settings\tsmall\Desktop\090901Modelling Report.docx PAGE 3
The WTSM matrices are disaggregated to the SATURN zonal system using a methodology developed as part of the upgrade of the Transmission Gully SATURN model which is used here, known as the Ngauranga Triangle SATURN model.
The matrix total for each of the matrices developed from the WTSM runs are shown in Table 1-1 below:
Table 1-1 Matrix totals
1.2.1. Test 1
The DM SATURN models incorporate coding to reflect network upgrades which has been peer reviewed as part of the Transmission Gully SATURN model build. Test 1 uses WTSM matrices 4021 and 4061 for the 2016 and 2026 model runs respectively (these are defined in 1.2 above).
1.2.2. Test 2
All tests incorporating a link between Grenada and Petone (Tests 2 to 6) tie in at SH1 as shown in Figure 1-2 below. This interchange layout is purely to facilitate access and egress to SH1 for all movements.

Short List Assessment
SINCLAIR KNIGHT MERZ D:\Documents and Settings\tsmall\Desktop\090901Modelling Report.docx PAGE 4
Figure 1-2 SH1 interchange
Figure 1-3 below shows the approximate alignment of the new link road between SH1 and SH2.
Figure 1-3 Additional links
SH1 north
Link Road
SH1 south
Petone
Dowse
Westchester

Short List Assessment
SINCLAIR KNIGHT MERZ D:\Documents and Settings\tsmall\Desktop\090901Modelling Report.docx PAGE 5
The new link road is assumed to tie in at the new Dowse interchange which is assumed to be a roundabout as shown in Figure 1-4 below:
Figure 1-4 Dowse interchange
The length of the new link is approximately 8km between SH1 and SH2 at Dowse. The free flow speed has been assumed as 70kph with a capacity of 4000 PCU/HR in each direction. A speed flow curve has been applied with minimum speed 45kph when volumes are at 4000 PCU/HR (at which point intersection delays would be incorporated).
WTSM matrices 4031 and 4071 are used for the 2016 and 2026 model runs respectively.
1.2.3. Test 3
Test 3 utilises the same assumptions as for Test 2 but with an additional connection from Westchester Drive East to the link Road. This is shown in Figure 1-5 below and is assumed to be 0.7 km in length (distance between node 3106 and node 1918).
SH2 north
SH2 south

Short List Assessment
SINCLAIR KNIGHT MERZ D:\Documents and Settings\tsmall\Desktop\090901Modelling Report.docx PAGE 6
Figure 1-5 A2 link to Westchester Drive East
WTSM matrices 4031 and 4071 are used for the 2016 and 2026 model runs respectively.
1.2.4. Test 4
The new link road connection directly to Petone Esplanade is shown in Figure 1-6 below:
SH1 north
Link Road
Westchester Drive East
A2 link

Short List Assessment
SINCLAIR KNIGHT MERZ D:\Documents and Settings\tsmall\Desktop\090901Modelling Report.docx PAGE 7
Figure 1-6 Petone Esplanade linkage
Vehicles access the new link road from the SH2 southbound on ramp (node 252). Vehicles from the link road accessing Petone Esplanade do so via node 1182 and on to the roundabout at 1100. The distance to the Petone interchange from SH1 is assumed to be approximately 6.5km.
WTSM matrices 4031 and 4071 are used for the 2016 and 2026 model runs respectively.
1.2.5. Test 5
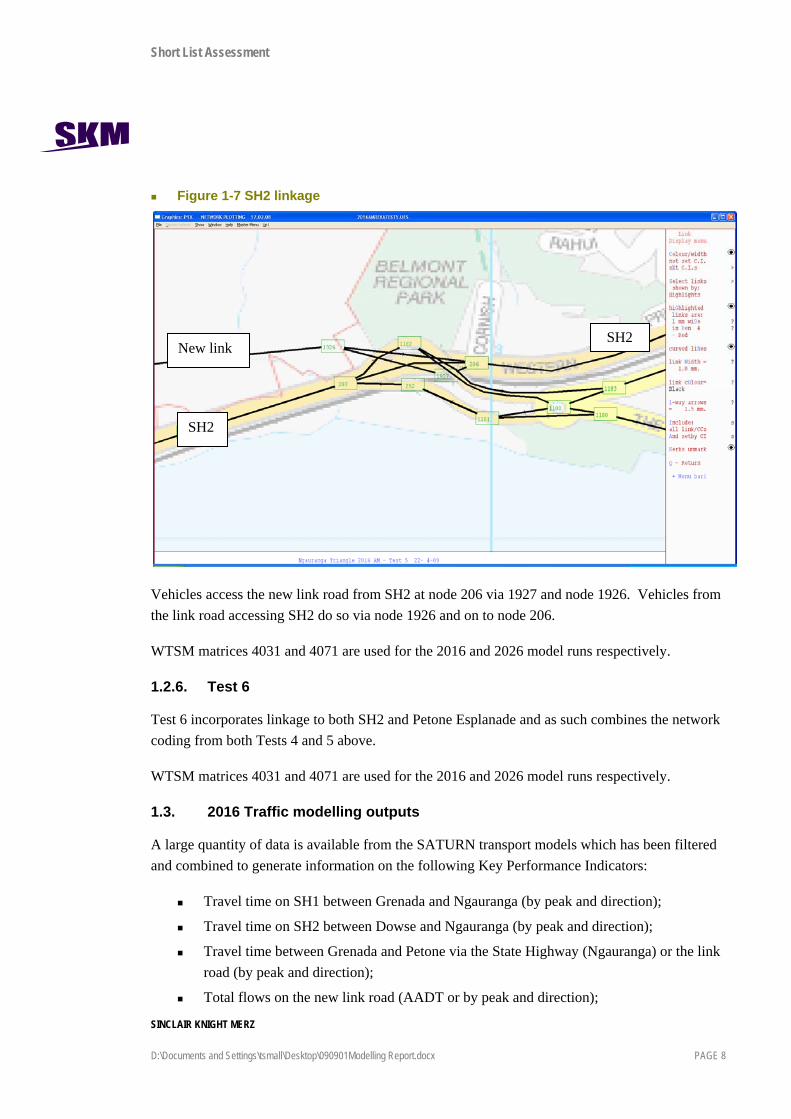
The new link road connection directly to SH2 is shown in Figure 1-7 below:
New link
Petone Esplanade
SH2
Short List Assessment
SINCLAIR KNIGHT MERZ D:\Documents and Settings\tsmall\Desktop\090901Modelling Report.docx PAGE 8
Figure 1-7 SH2 linkage
Vehicles access the new link road from SH2 at node 206 via 1927 and node 1926. Vehicles from the link road accessing SH2 do so via node 1926 and on to node 206.
WTSM matrices 4031 and 4071 are used for the 2016 and 2026 model runs respectively.
1.2.6. Test 6
Test 6 incorporates linkage to both SH2 and Petone Esplanade and as such combines the network coding from both Tests 4 and 5 above.
WTSM matrices 4031 and 4071 are used for the 2016 and 2026 model runs respectively.
1.3. 2016 Traffic modelling outputs
A large quantity of data is available from the SATURN transport models which has been filtered and combined to generate information on the following Key Performance Indicators:
Travel time on SH1 between Grenada and Ngauranga (by peak and direction);
Travel time on SH2 between Dowse and Ngauranga (by peak and direction);
Travel time between Grenada and Petone via the State Highway (Ngauranga) or the link road (by peak and direction);
Total flows on the new link road (AADT or by peak and direction);
New link SH2
SH2

Short List Assessment
SINCLAIR KNIGHT MERZ D:\Documents and Settings\tsmall\Desktop\090901Modelling Report.docx PAGE 9
Total vehicle and HCV flows on Petone Esplanade between Fitzherbert Street and Queen Street (AADT or by peak and direction);
Total flows on SH58 immediately to the west of SH2;
Total flows on SH2 between Petone and Dowse;
Total vehicle KMs travelled (VKT) on the network;
Total travel time on the network; and
Total vehicle delay on the network.
An important point to note when comparing options is that Test 1 (the DM) has a different trip matrix from WTSM than Tests 2 to 6. This means that total network statistics are likely to be different due to different total numbers of vehicles. 2016 model results are given in detail here, with commentary provided on any noticeable qualitative differences in the 2026 modelling.
1.3.1. State Highway travel times
There is a reduction in flow of between 350 and 500 PCU/HR on SH1soutbound in the congested AM peak which significantly improves the travel time on this route. This reduction is shown in Figure 1-8 below.
Figure 1-8 SH1 Travel times

Short List Assessment
SINCLAIR KNIGHT MERZ D:\Documents and Settings\tsmall\Desktop\090901Modelling Report.docx PAGE 10
Note that since the southbound volumes in the AM peak (approximately 5,500PCU/HR) are still significantly higher than the inter and PM peaks (approximately 2,000PCU/HR) the option travel times are still of the order of three minutes quicker in the inter and PM peaks. The lower flows in the inter and PM peaks mean that the applied speed flow curves are having only a minor influence on the travel time for larger changes in flow.
The lower flows for SH1 northbound in all three peaks mean that any reductions due to the inclusion of the link road have limited effect on the travel times on this route.
There are limited changes in flow in the AM peak (less than 100PCU/HR change) but larger reduction of the order of 300PCU/HR and 500PCU/HR in the inter and PM peaks respectively for SH2 southbound. The largest impact on travel time is in the PM peak as is shown in Figure 1-9 below with a reduction in the order of one minute. The impact of the flow reduction in the inter peak is limited due to the lower levels of congestion in this period.
On SH2 northbound there are significant reductions of the order of 600PCU/HR and 400PCU/HR in the AM and inter peaks respectively with slight increases in the PM peak (due to the change in matrix from WTSM). As can be seen in Figure 1-9, the effects on travel time are limited in the inter and PM peaks with a slight reduction in the AM peak.
The modelling results for 2026 show the same patterns as the 2016 modelling, with higher traffic volumes meaning travel times of the order of less than a minute higher in the peak southbound direction in the AM peak and less than two minutes higher in the peak northbound direction in the PM peak. There are minimal changes in the counter peak direction.

Short List Assessment
SINCLAIR KNIGHT MERZ D:\Documents and Settings\tsmall\Desktop\090901Modelling Report.docx PAGE 11
Figure 1-9 SH2 travel times

Short List Assessment
SINCLAIR KNIGHT MERZ D:\Documents and Settings\tsmall\Desktop\090901Modelling Report.docx PAGE 12
Again, the 2026 modelling shows similar qualitative differences between the tests, with less than a minutes change in travel times from 2016.
1.3.2. Link road travel times
As stated in Section 1.1, the connections at the eastern end of the link road are slightly different for each test with connections at Dowse (Tests 2 and 3), Petone Esplanade (Test 4) and SH2 at Petone (Test 5), or a combination (Test 6). Due to these differences in connections, travel times have been collated on the following routes:
Link EB/WB SH2: From Grenada to Dowse interchange via the link road (Tests 2, 3, 5 and 6);
SH EB/WB SH2: From Grenada to Dowse interchange via SH1 and SH2 (Tests 1, 2, 3, 5 and 6);
Link EB/WB Pet: From Grenada to Petone Esplanade via the link road (Tests 2, 3, 4 and 6); and
SH EB/WB Pet: From Grenada to Petone Esplanade via SH1 and SH2 (Tests 1, 2, 3, 4 and 6).
1.3.2.1. Grenada to SH2
The major differences in travel time eastbound between Grenada and SH2 occur in the AM peak as can be seen in Figure 1-10 below:

Short List Assessment
SINCLAIR KNIGHT MERZ D:\Documents and Settings\tsmall\Desktop\090901Modelling Report.docx PAGE 13
Figure 1-10 Eastbound travel times to SH2
Key points of note are:
All options remove a significant amount or traffic from SH1 southbound (see Section 1.3.1) and hence the eastbound route is of the order of two minutes quicker than without the link road in place;
The link road is approximately six minutes quicker than using the state highways in all options;
It has been assumed in Tests 2 and 3 that vehicles travel from Dowse to Petone via Udy Street and Cuba Street; and
No route has been assumed from the link road to Petone in Test 4.
The 2026 modelling shows similar qualitative trends with general increases in travel times of approximately 4% from 2016 for Test 2 to Test 6. The Test 1travel times increase by approximately 10% in the AM Peak. There is a less than 5% increase in travel time in the IP and PM Peak for all tests. These increases are for the portion of the journey on the state highway with no changes in the travel time for the link road.
In the westbound direction, the main differences are in the PM peak as can be seen in Figure 1-11 below:

Short List Assessment
SINCLAIR KNIGHT MERZ D:\Documents and Settings\tsmall\Desktop\090901Modelling Report.docx PAGE 14
Figure 1-11 Westbound travel times from SH2
Note that as in the eastbound direction in the AM peak, the introduction of the link road improves travel times on the state highways, and the link road is of the order of five minutes quicker than using the state highways.
The modelling results for 2026 show the same patterns as the 2016 modelling. For Test 1 there is a minor increase in travel time in the AM peak in the order of less than a minute. In the IP peak the travel times increase by about 4 minutes and in the PM peak travel times increase in the order of 6 minutes. The travel time for the link road stays approximately the same.
1.3.2.2. Grenada to Petone Esplanade
Due to the difference connectivity of Test 4 and Test 5, the travel time to Petone Esplanade east of Cuba Street has also been assessed for each test.
In the eastbound direction, the travel time savings are lower than to SH2 as can be seen in Figure 1-12 below:

Short List Assessment
SINCLAIR KNIGHT MERZ D:\Documents and Settings\tsmall\Desktop\090901Modelling Report.docx PAGE 15
Figure 1-12 Eastbound travel times to Petone Esplanade
Note that all options improve travel times on the state highways as in Section 1.3.2.1. The travel times for Tests 2 and 3 are approximately two minutes higher than for Tests 4 and 6 due to the additional distance to travel via Udy Street and Cuba Street rather than feeding straight on to the Esplanade.
Again, the link road provides travel time savings over using the state highway, although in the inter peak this is limited for Tests 2 and 3 due to the relatively congestion free travel on the state highways with similar levels of congestion in Hutt City as in the AM and PM peaks.
In the westbound directions, as can be seen in Figure 1-13, the PM peak shows the largest reductions in travel time.

Short List Assessment
SINCLAIR KNIGHT MERZ D:\Documents and Settings\tsmall\Desktop\090901Modelling Report.docx PAGE 16
Figure 1-13 Westbound travel times to Petone Esplanade
Note that Test 5 has increased traffic volumes from WTSM matrix but no mechanism for this traffic to easily get to Grenada. This means that volumes turning on to SH2 are larger in Test 2 than in other tests. A reduced capacity was implemented in the base model at the merge onto SH2 to reflect the observed levels of delay at this interchange. In 2016 the traffic demands from Petone Esplanade onto SH2 approach this capacity and hence the delays become unstable with very small fluctuations in flow causing significant changes in delay. Test 5 has slightly higher traffic volumes making this turn which means that volumes exceed capacity and an additional three minutes delay is experienced over Tests 4 and 6, and approximately two minutes additional delay over Tests 2 and 3.
Travel times in the westbound direction in 2026 have similar patterns to those in 2016. The general increases in travel time from 2016 to 2026 are relatively minor in the AM and inter peaks (of the order of 4%). In the PM peak, with the Hutt Road roundabout at capacity, there are significant increases in delay here, of the order of 20-40% (approximately 3 minutes). With this intersection at capacity the routing becomes unstable with vehicles switching to routes via Jackson Street and Hutt Road.

Short List Assessment
SINCLAIR KNIGHT MERZ D:\Documents and Settings\tsmall\Desktop\090901Modelling Report.docx PAGE 17
1.3.3. Flows on link road
As can be seen in Figure 1-14 below, there is very little difference in flows on the link road between Tests 2 to 6. This is in part due to the use of a fixed trip matrix meaning that only vehicle rerouting affects influence the total volumes with mode choice and distribution assumed to be fixed.
Figure 1-14 Eastbound and westbound total PCU flows on link road

Short List Assessment
SINCLAIR KNIGHT MERZ D:\Documents and Settings\tsmall\Desktop\090901Modelling Report.docx PAGE 18
As can be seen above, the flows are predominantly eastbound (Grenada to Petone) in the AM peak, westbound (Petone to Grenada) in the PM peak with an approximately equal split in the inter peak.
Similar total flows are indicated by the 2026 models for each time period. The overall flows increase by approximately 100 vehicles per hour.
The formula developed as part of the Transmission Gully toll study (based on traffic counts on SH1 in Wellington) was used to factor up peak hour volumes to daily flows:
Daily flow = 2 × AM + 12.4 × IP + 2 × PM
This results in the daily volumes as seen in Figure 1-15 below:
Figure 1-15 Daily total PCU flows on link road
Consistent with the peak hourly volumes, there is little variation in two-way daily flow on the link road between the Tests with volumes varying between 23,500 and 25,500 PCU/day
1.3.4. Flows on Petone Esplanade
There are differences in flows on Petone Esplanade between the Tests as can be seen in Figure 1-16 below.
In the AM peak the flows are predominantly westbound and in the PM peak the flows are predominantly eastbound with a balance in the inter peak.
In the AM peak, in comparison to Test 1 (the DM) flows are slightly reduced in Test 2 and Test 3 due to the link road feeding traffic in at Dowse. Test 5 also shows a reduction over Test 1 due to

Short List Assessment
SINCLAIR KNIGHT MERZ D:\Documents and Settings\tsmall\Desktop\090901Modelling Report.docx PAGE 19
the link road having no direct connection to Petone Esplanade. Tests 4 and 6 however, with the direct connection to Petone Esplanade, result in significant increases in flow, approximately 200 PCU/HR eastbound and westbound.
The changes are less marked in the inter peak period (although the percentage changes are similar). The PM peak has a slightly higher increase in flow in the westbound direction for Tests 4 and 6. The large increase westbound is due to the release of the bottleneck at the Petone interchange reducing delays here significantly.
Figure 1-16 Eastbound and westbound total PCU flows on Petone Esplanade
The total flows eastbound and westbound show the same patterns as the 2016 outputs. Again, the westbound direction for Test 4 and Test 6 show slightly higher increases in the flows. The flows change in each test in the order of 100 200 vehicles per hour.
HCV volumes on Petone Esplanade are of the order of 30-100vph each of the peak hours modelled. The changes in flows with each of the options follow the same patterns as for total vehicles.

Short List Assessment
SINCLAIR KNIGHT MERZ D:\Documents and Settings\tsmall\Desktop\090901Modelling Report.docx PAGE 20
Figure 1-17 Eastbound and westbound HCV flows on Petone Esplanade
The HCV flows for the year 2026 show the same pattern as for the 2016 outputs. The HCV flows for all three time periods increase by approximately 20 HCVs per hour.
Using the same daily factors as stated in Section 1.3.3, the total daily flows on Petone Esplanade are shown in Figure 1-18 below. The daily flows show the same trends as for the peak hours with increases of the order of 20% for Test 4 and 10% for Test 6 and decreases of the order of 5% for all other Tests compared to Test 1.

Short List Assessment
SINCLAIR KNIGHT MERZ D:\Documents and Settings\tsmall\Desktop\090901Modelling Report.docx PAGE 21
Figure 1-18 Daily total PCU flows on Petone Esplanade
Between 2016 and 2026 Daily flow changes increase by about 2000 - 4000 vehicles with the highest increase for Tests 4 and 6.
1.3.5. Flows on SH58
The total daily flows on SH58 are shown in Figure 1-19 below.
Figure 1-19 Daily total PCU flows on SH58

Short List Assessment
SINCLAIR KNIGHT MERZ D:\Documents and Settings\tsmall\Desktop\090901Modelling Report.docx PAGE 22
Note that the presence of any link road reduced the AADT from approximately 15,500 PCU to 13,000 PCU. Test 5 and Test 6 with the link road tying directly into SH2 at Petone Esplanade appear to attract slightly more traffic from SH58, but this is only of the order of 500 PCU.
Between 2016 and 2026 the daily total flow on SH 58 changes by about 2000 vehicles a day.
1.3.6. Flows on SH2 between Petone and Dowse
With the additional linkage provided between Grenada and Petone, there may be considerable impacts on the traffic volumes on SH2. The new link is likely to cause reductions in flows on SH2 south of Petone as traffic reroutes to the link road, but there are likely to be increases on SH2 north of Petone due to the increases attractiveness of travel between Grenada and the Hutt area facilitated by the link road which is implicit in the WTSM matrices used.
The maximum hourly one way traffic volumes from each test are shown in Figure 1-20 below:
Figure 1-20 SH2 maximum hourly one way traffic volumes
Note that with Test 2 and Test 3 joining SH2 at Dowse interchange, any increase in traffic from Grenada is not added to this portion of SH2 and so maximum one way flows are approximately 2800 PCU/HR. Tests 5 and 6 which tie in to SH2 at Petone have maximum flows in excess of 3200 PCU/HR which is approaching two lane’s capacity. For a theoretical saturation flow of 4000 PCU/HR, a rule of thumb for flow breakdown is a V/C ratio of 85% which would be reached at a flow of 3400 PCU/HR.
The outputs for the 2026 model show the same patterns. As with the 2016 traffic, Test 5 and 6 have higher maximum flows per hour than the other 4 tests. Test 5 reaches approximately 3500 PCU/HR and hence would exceed the V/C ratio of 85%.

Short List Assessment
SINCLAIR KNIGHT MERZ D:\Documents and Settings\tsmall\Desktop\090901Modelling Report.docx PAGE 23
Using the same formulae as in Section 1.3.3, the two way daily flows on SH2 are shown in Figure 1-21 below:
Figure 1-21 SH2 two way daily flows
Note that overall (incorporating non peak direction travel) Test 2 and Test 3 actually reduce the daily traffic volumes on SH2 with Test 5 and Test 6 showing marked increases.
The outputs for the 2026 show similar patterns to the 2016 outputs. The total daily flows increase by approximately 6000 PCUs per day
1.3.7. Network statistics
General network statistics have been extracted from the SATURN model. This includes data from vehicles travelling on all of the modelled area from SH1 south of Ngauranga interchange to SH1 north of McKays Crossing and SH2 north of SH58. The statistics presented in the following sections are:
Transient queues are those which build up and dissipate throughout the modelled period (for example at signals each cycle);
Over capacity queues are those which build up throughout the modelled period and carry over into the next period;
Link cruise time is the total amount of time spent on links which is made up of free flow time and delays due to queuing on links;
Total travel time includes the cruise time and additional delays at intersections from over capacity queues;

Short List Assessment
SINCLAIR KNIGHT MERZ D:\Documents and Settings\tsmall\Desktop\090901Modelling Report.docx PAGE 24
Total travel distance; and
Average travel speed is the ration of total distance to total time.
These are presented for the AM, inter and PM peaks separately.
The minimum value for each statistic is highlighted in green, with the minimum “non-DM” value highlighted in yellow if the DM has the minimum value.
It should be noted that overall network statistics are subject to model “noise” which is particularly prevalent in larger models such as the NT SATURN model. This means that small differences in convergence can alter delays and general network performance in areas which appear unrelated to any model alterations. The risk of this is minimised in the NT SATURN model by ensuring good convergence of all model runs and by checking of areas of high delay which are sensitive to small changes in flow.
1.3.7.1. AM peak
The general network statistics for the AM peak are shown in Table 1-2 below:
Table 1-2 AM peak network statistics
Note here that due to the change in distribution in the applied WTSM matrix, the lowest statistics are generally for Test 1, the Do Minimum. Tests 3 and 6 stand out as having the lower general statistics with:
Test 3 having the lowest level of general queuing and associated delays; and
Test 6 having the lowest overall travel time and distance on the network.
1.3.7.2. Inter peak
The general network statistics for the inter peak are shown in Table 1-3 below:

Short List Assessment
SINCLAIR KNIGHT MERZ D:\Documents and Settings\tsmall\Desktop\090901Modelling Report.docx PAGE 25
Table 1-3 Inter peak network statistics
In the less congested inter peak, the lower overall travel time and distance in Test 6 are also reflected by lower levels of transient queuing.
1.3.7.3. PM peak
The general network statistics for the PM peak are shown in Table 1-4 below:
Table 1-4 PM peak network statistics
Again, Test 1 generally shows the lowest overall network figures due to the difference in distribution of traffic inherent in the WTSM matrices. Again, Test 6 generally shows the lowest overall network statistics.

Short List Assessment
SINCLAIR KNIGHT MERZ D:\Documents and Settings\tsmall\Desktop\090901Modelling Report.docx PAGE 26
2. Cross Valley Link 2.1. Summary of options
2.1.1. Test 7
Test 7 incorporates traffic calming works on Petone Esplanade and Jackson Street.
2.1.2. Test 8
Test 8 includes a Cross Valley Link between Wakefield Street and White Lines West.
2.1.3. Test 9
Test 8 includes a Cross Valley Link between Wakefield Street and Randwick Road following the rail alignment, diverging from Wakefield Street where Wakefield Street passes below Cuba Street.
2.1.4. Test 10
Test 10 includes upgrading the existing Udy Street and Cuba Street to two lanes in each direction with a free flow speed of 70kph on Udy Street, retaining the 50kph free flow speed on Cuba Street.
2.1.5. Test 11
Test 11 is a combination of Test 7 and Test 8.
2.1.6. Test 12
Test 12 is a combination of Test 7 and Test 9.
2.1.7. Test 13
Test 13 is a combination of Test 7 and Test 10
2.1.8. Test 16
Test 16 involves increasing the free flow speed on Petone Esplanade to 70kph between Hutt Road and Waione Road, and providing 2 full lanes in each direction.
2.1.9. Test 17
Test 17 provides an alternative eastbound route to Petone Esplanade via SH2, Dowse Interchange, Hutt Road, Udy Street and Cuba Street. Petone Esplanade is closed to traffic from SH2 and Hutt Road and Udy Street are upgraded to 70kph and 2 lanes in an eastbound direction.

Short List Assessment
SINCLAIR KNIGHT MERZ D:\Documents and Settings\tsmall\Desktop\090901Modelling Report.docx PAGE 27
2.2. Traffic modelling assumptions
Note that for the Cross Valley Link model WTSM matrices 4041/4081 have been used.
2.2.1. Test 7
The SATURN model networks have reflected traffic calming by reducing the free flow speed on Petone Esplanade and Jackson Street to 30kph as marked with the purple dashed line in Figure 2-1 below:
Figure 2-1 Traffic calming extents
2.2.2. Test 8
Test 8 incorporates a link from Wakefield Street at Hutt Road to Whites Line West terminating at a roundabout on Randwick Road. The free flow speed has been modelled as 70kph along the length of Wakefield Street, the Cross Valley Link and Whites Line West with a capacity of 3600 PCU/HR to reflect two lanes in each direction. The roundabout at Whites Line West / Randwick Street has been coded as a two lane roundabout with a circulating capacity of 3000 PCU/HR. Wakefield Street terminates at its western end at a priority intersection with Hutt Road. The link is denoted as a purple dashed line in Figure 2-2.
SH2
Petone Esplanade

Short List Assessment
SINCLAIR KNIGHT MERZ D:\Documents and Settings\tsmall\Desktop\090901Modelling Report.docx PAGE 28
Figure 2-2 Wakefield to Whites Line West Cross Valley Link
2.2.3. Test 9
The Test 9 alignment across the Hutt Valley means that there is unlikely to be any operation detail between Test 9 and Test 8 at the level of detail of the SATURN model. For the purposes of this study, Test 8 and Test 9 utilise the same SATURN modelling results.
2.2.4. Test 10
Test 10 has been coded by simply increasing the capacity (to two lanes or 3600vph in each direction) and free flow speed (to 70kph) on Udy Street with a two lane roundabout at its intersection with Hutt Road at its western end. The free flow speed on Waione Street has been increased to 60kph between Cuba Street and East Street with a 50kph free flow speed remaining on Cuba Street. The capacity has also been increased on Cuba Street and its intersections with Udy Street and Waione Street to provide 3600vph capacity along this corridor. This has involved the signalisation of Udy Street / Cuba Street intersection as well as increasing the size of the Cuba Street / Waione Street intersection. The extent of these network modifications are indicated by the purple dashed line in Figure 2-3 below:
SH2
Dowse Interchange
Cross Valley Link
Short List Assessment
SINCLAIR KNIGHT MERZ D:\Documents and Settings\tsmall\Desktop\090901Modelling Report.docx PAGE 29
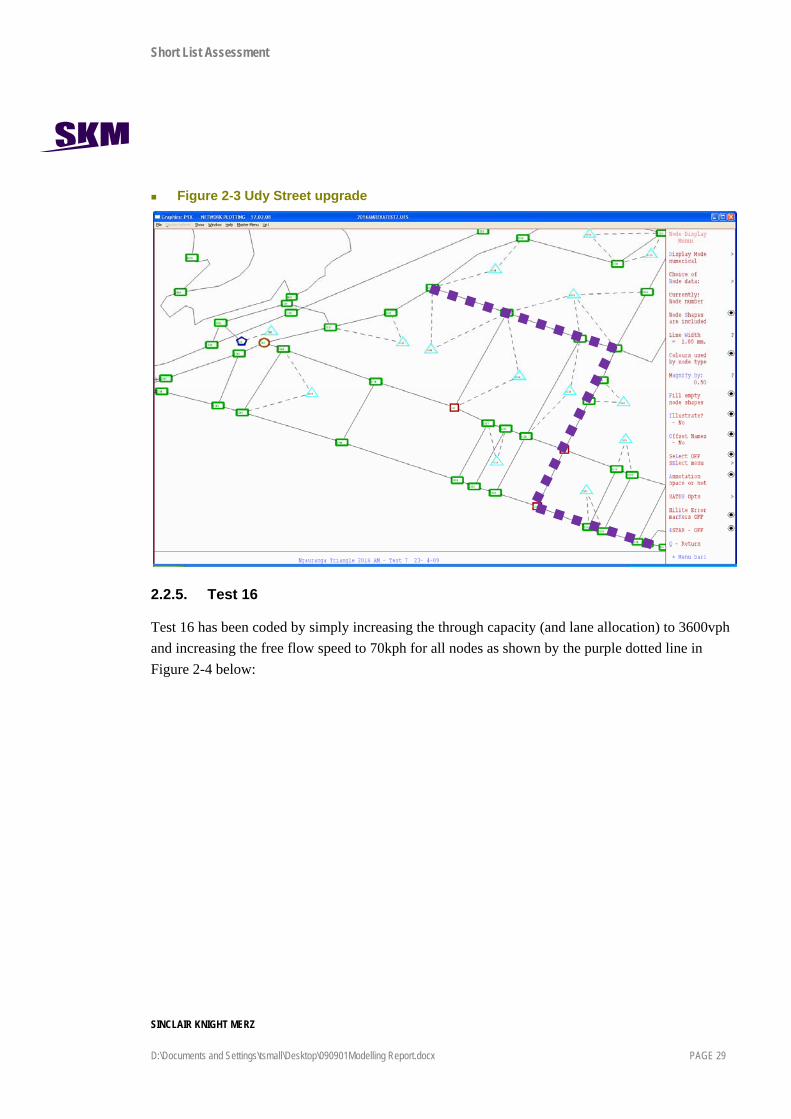
Figure 2-3 Udy Street upgrade
2.2.5. Test 16
Test 16 has been coded by simply increasing the through capacity (and lane allocation) to 3600vph and increasing the free flow speed to 70kph for all nodes as shown by the purple dotted line in Figure 2-4 below:

Short List Assessment
SINCLAIR KNIGHT MERZ D:\Documents and Settings\tsmall\Desktop\090901Modelling Report.docx PAGE 30
Figure 2-4 Petone Esplanade upgrade
2.2.6. Test 17
Test 17 involves offering an alternative eastbound route to Petone Esplanade using the following coding:
A reduction in free flow speed on Petone Esplanade and Jackson Street to 30kph in the eastbound direction between Hutt Road and Cuba Street (the blue dotted lines in Figure 2-5);
An increase in the free flow speed on Petone Esplanade to 70kph in the westbound direction between Cuba Street and Hutt Road;
Banning the movement from SH2 to Petone Esplanade (the red no entry symbol in Figure 2-5);
Increasing the speed to 70kph on Hutt Road, Cuba Street, Udy Street and Waione Street as well as providing 2 lanes eastbound capacity (the purple dotted line in Figure 2-5); and
Providing a two lane roundabout at the Hutt Road / Udy Street intersection and a signalised intersection at Udy Street / Cuba Street (as in Test 10).

Short List Assessment
SINCLAIR KNIGHT MERZ D:\Documents and Settings\tsmall\Desktop\090901Modelling Report.docx PAGE 31
Figure 2-5 Eastbound alternative route
Note that this is similar to the eastbound component of Test 10, but by banning the movement from SH2 to Petone Esplanade and improving the capacity on Hutt Road between Dowse interchange and Udy Street, the Udy Street / Cuba Street route becomes more favourable in the eastbound direction.
2.3. 2016 Traffic modelling outputs
A large quantity of data is available from the SATURN transport models which has been filtered and combined to generate information on the following Key Performance Indicators:
Total vehicle and HCV flows on Petone Esplanade (AADT or by peak and direction);
Total vehicle KMs travelled (VKT) on the network;
Total travel time on the network; and
Total vehicle delay on the network.
2.3.1. Flows on Petone Esplanade
There are differences in flows on Petone Esplanade between the Tests as can be seen in Figure 2-6 below.
In the AM peak the flows are predominantly westbound and in the PM peak the flows are predominantly eastbound with a balance in the inter peak. Note that the flows are generally lower

Short List Assessment
SINCLAIR KNIGHT MERZ D:\Documents and Settings\tsmall\Desktop\090901Modelling Report.docx PAGE 32
than in Tests 2 to 6 due to there being no additional connectivity from Grenada in these tests or implicit in the WTSM matrices used, and the various measures tested generally detract from the relative attractiveness of Petone Esplanade as a viable route choice.
Figure 2-6 Eastbound and westbound total PCU flows on Petone Esplanade
In the AM peak, the effect of the traffic calming on Petone Esplanade and Jackson Street can be determined by comparing:

Short List Assessment
SINCLAIR KNIGHT MERZ D:\Documents and Settings\tsmall\Desktop\090901Modelling Report.docx PAGE 33
Test 1 with Test 7 (noting that these Tests use different trip matrices);
Test 11 with Test 8; and
Test 13 with Test 10.
There is an approximate 30% reduction in eastbound volumes and a 20% reduction in westbound volumes in each of these comparisons.
The reductions are similar in the inter peak, with a more marked reduction in the eastbound direction in the PM peak and little change in the westbound direction. This is likely to be due to an increase in demand flow westbound across the Hutt Valley inherent in the WTSM matrices for the PM peak.
Test 11 which incorporates both the Cross Valley Link and traffic calming on Petone Esplanade and Jackson Street has the largest total impact on total traffic volumes on Petone Esplanade with an approximate 30% reduction in the AM and inter peaks and 50% reduction in the PM peak compared to Test 1.
Test 16 which involves the upgrading of Petone Esplanade to 70kph in each direction has the highest combination of eastbound and westbound flow. Test 17 has the highest flow westbound and the lowest flow eastbound on the Esplanade. It is noted that although traffic from SH2 has been banned from joining the Esplanade at the Hutt Road roundabout, there is an element of rerouting via Hutt Road and Jackson Street rather than the intended alternative route of SH2 and Udy Street via the Dowse interchange.
Total flows for the 2026 outputs show similar patterns to the 2016 outputs with an increase of traffic of approximately 50 – 100 vehicles.
HCV volumes on Petone Esplanade are of the order of 30-100vph each of the peak hours modelled. The changes in flows with each of the options follow the same patterns as for total vehicles.
Short List Assessment
SINCLAIR KNIGHT MERZ D:\Documents and Settings\tsmall\Desktop\090901Modelling Report.docx PAGE 34
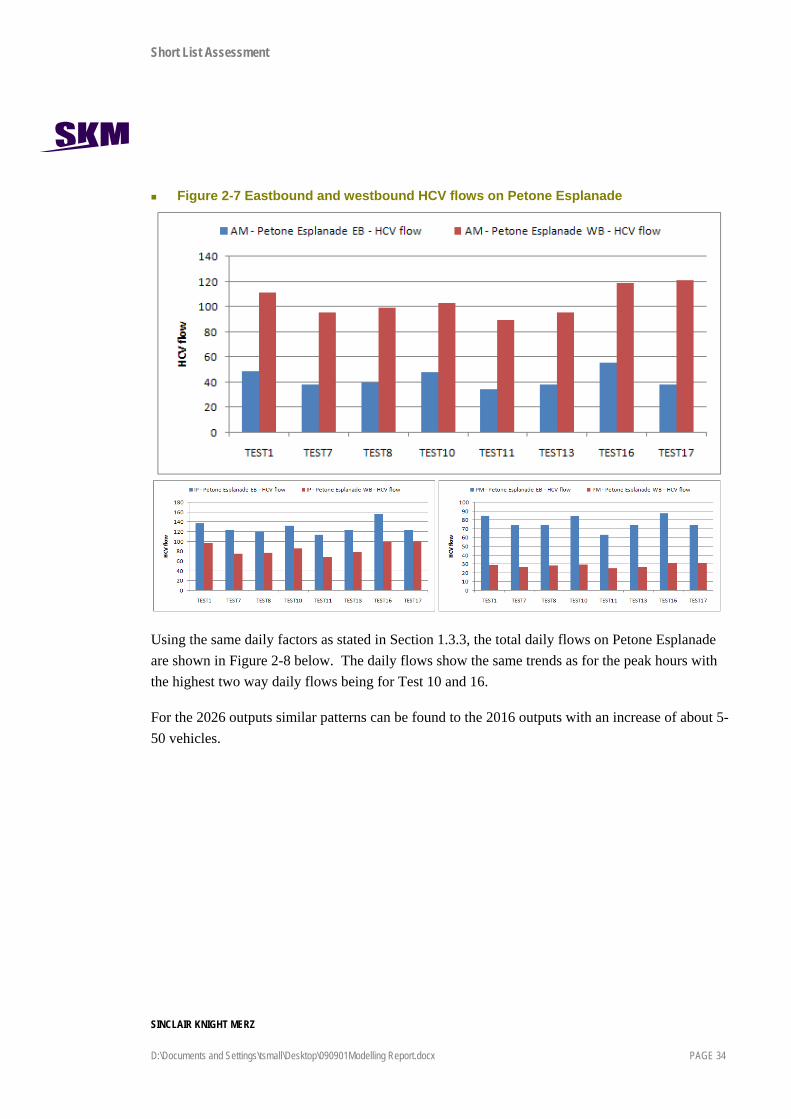
Figure 2-7 Eastbound and westbound HCV flows on Petone Esplanade
Using the same daily factors as stated in Section 1.3.3, the total daily flows on Petone Esplanade are shown in Figure 2-8 below. The daily flows show the same trends as for the peak hours with the highest two way daily flows being for Test 10 and 16.
For the 2026 outputs similar patterns can be found to the 2016 outputs with an increase of about 5-50 vehicles.
Short List Assessment
SINCLAIR KNIGHT MERZ D:\Documents and Settings\tsmall\Desktop\090901Modelling Report.docx PAGE 35
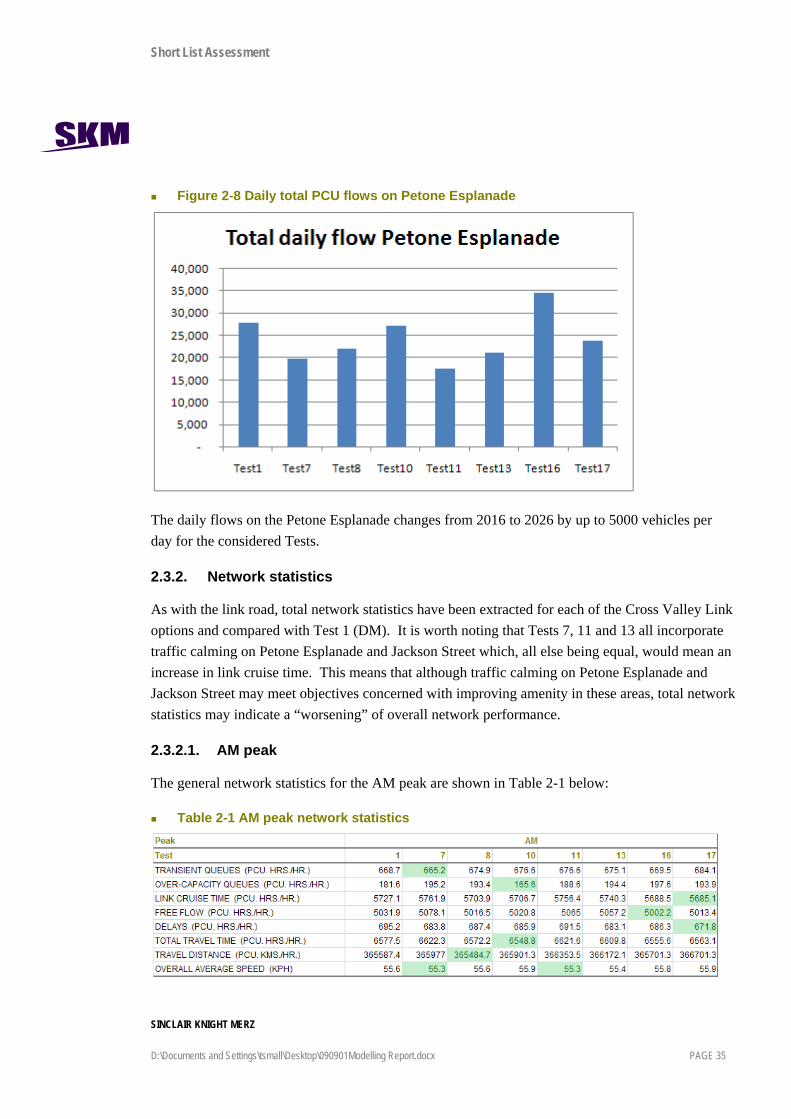
Figure 2-8 Daily total PCU flows on Petone Esplanade
The daily flows on the Petone Esplanade changes from 2016 to 2026 by up to 5000 vehicles per day for the considered Tests.
2.3.2. Network statistics
As with the link road, total network statistics have been extracted for each of the Cross Valley Link options and compared with Test 1 (DM). It is worth noting that Tests 7, 11 and 13 all incorporate traffic calming on Petone Esplanade and Jackson Street which, all else being equal, would mean an increase in link cruise time. This means that although traffic calming on Petone Esplanade and Jackson Street may meet objectives concerned with improving amenity in these areas, total network statistics may indicate a “worsening” of overall network performance.
2.3.2.1. AM peak
The general network statistics for the AM peak are shown in Table 2-1 below:
Table 2-1 AM peak network statistics

Short List Assessment
SINCLAIR KNIGHT MERZ D:\Documents and Settings\tsmall\Desktop\090901Modelling Report.docx PAGE 36
Test 8 and Test 10 which provide improved linkage across the Hutt Valley have the lowest total network travel time and distance. It is interesting to note that Test 13 which combines improvements to Udy Street with traffic calming on Petone Esplanade and Jackson Street actually marginally reduces over capacity queues. The additional capacity provided on the Esplanade by Tests 16 and 17 are reflected by lower delays and free flow travel time.
2.3.2.2. Inter peak
The general network statistics for the inter peak are shown in Table 2-2 below:
Table 2-2 Inter peak network statistics
In the inter peak, Test 8 shows the lowest overall VKT although delays are minimised in Test 10. Test 16 shows the largest improvement in queue reduction which would be expected given the additional capacity and increase in speed provided on the Esplanade in this test.
2.3.2.3. PM peak
The general network statistics for the PM peak are shown in Table 2-3 below:
Table 2-3 PM peak network statistics
As with the AM peak, Test 8 shows the lowest VKT with Test 16 generally showing lowest network statistics with regards to queues and delays.

Short List Assessment
SINCLAIR KNIGHT MERZ D:\Documents and Settings\tsmall\Desktop\090901Modelling Report.docx PAGE 37
3. Combination of Options 3.1. Summary of options
3.1.1. Test 14
Test 14 is a combination of Test 3 from section 1 and Test 11 from Section 2. Although Test 3 did not appear to have the same level of network performance, the close linkage between Wakefield Street and Dowse interchange mean that the two projects may be complementary and provide more combined benefits than the sum of each project’s individual benefits.
3.1.2. Test 15
Test 15 is a combination of Test 6 from section 1 and Test 11 from Section 2. This incorporates the benefits of the lower overall network travel time and VKT with the desirable increase in amenity of Petone Esplanade through the provision of an additional Cross Valley Link at Wakefield Street.
3.2. Traffic modelling assumptions
3.2.1. Test 14
Test 14 has been modelled by using a direct combination of coding from Test 3 and Test 11.
3.2.2. Test 15
Test 15 has been modelled by using a direct combination of coding from Test 6 and Test 11.
3.3. 2016 Traffic modelling outputs
The same KPIs as for Tests 1-6 have been produced for Tests 14 and 15.
An important point to note when comparing options is that Test 1 (the DM) has a different trip matrix from WTSM than Tests 2 to 6. This means that total network statistics are likely to be different due to different total numbers of vehicles.
3.3.1. State Highway travel times
There is a reduction in flow of approximately 4000 PCU/HR on SH1soutbound in Tests 14 and 15 (similar to Tests 3 and 6) in all three peaks but the effect is largest in the congested AM peak which shows significant improvements in the travel time on this route. This reduction is shown in Figure 3-1 below.

Short List Assessment
SINCLAIR KNIGHT MERZ D:\Documents and Settings\tsmall\Desktop\090901Modelling Report.docx PAGE 38
Figure 3-1 SH1 Travel times
Test 11 has been included since it is combined with Test 3 or Test 6 to make Test 14 or Test 15. With no link road existing in Test 11, the minor differences in travel time are likely to be due to changes in the WTSM matrix used with only very small changes in flow on SH1. Generally Tests 14 and 15 show similar travel times to Tests 3 and 6 as would be expected.
The lower flows for SH1 northbound in all three peaks mean that any reductions due to the inclusion of the link road have limited effect on the travel times on this route.
For the 2026 outputs the travel patterns for the AM and IP peak are similar to the 2016 outputs with an increase of about 1 minute. For the PM peak the overall pattern is the same but the model indicates that the upstream traffic on SH1 northbound increases north of where the new link road connects to the existing SH1. This indicates SH1 approaching capacity at the merge of the new link road leading to an additional delay of approximately 1 minute.
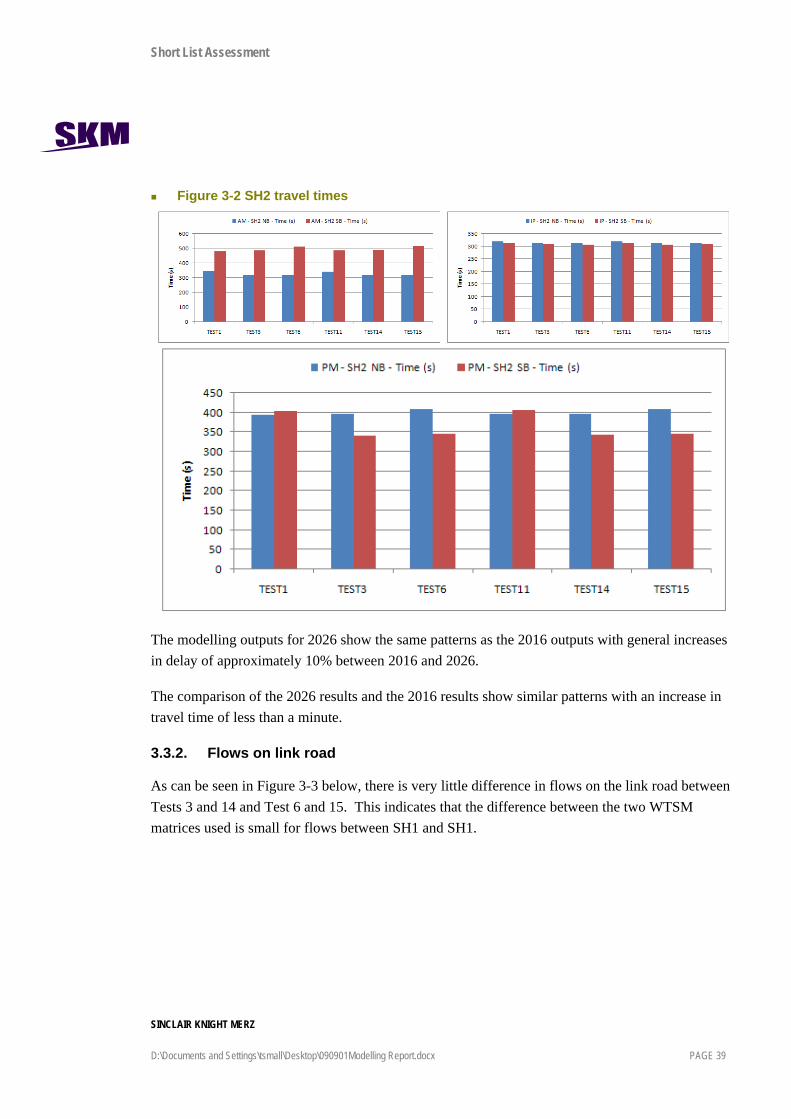
As with travel time routes on SH1, the travel times on SH2 are very similar between Tests 14 and 15 compared to Tests 3 and 6 as is shown in Figure 3-2 below.
Short List Assessment
SINCLAIR KNIGHT MERZ D:\Documents and Settings\tsmall\Desktop\090901Modelling Report.docx PAGE 39
Figure 3-2 SH2 travel times
The modelling outputs for 2026 show the same patterns as the 2016 outputs with general increases in delay of approximately 10% between 2016 and 2026.
The comparison of the 2026 results and the 2016 results show similar patterns with an increase in travel time of less than a minute.
3.3.2. Flows on link road
As can be seen in Figure 3-3 below, there is very little difference in flows on the link road between Tests 3 and 14 and Test 6 and 15. This indicates that the difference between the two WTSM matrices used is small for flows between SH1 and SH1.

Short List Assessment
SINCLAIR KNIGHT MERZ D:\Documents and Settings\tsmall\Desktop\090901Modelling Report.docx PAGE 40
Figure 3-3 Eastbound and westbound total PCU flows on link road
For the 2026 Grenada to Petone total flows the patterns are similar with an increase of vehicles in the order of 100 -200.
Using the same daily factors as stated in Section 1.3.3, this results in the daily volumes as seen in Figure 3-4 below:

Short List Assessment
SINCLAIR KNIGHT MERZ D:\Documents and Settings\tsmall\Desktop\090901Modelling Report.docx PAGE 41
Figure 3-4 Daily total PCU flows on link road
Daily flows in 2026 compared to the results for 2016 show an increase in flows of about 4500 PCUs.
The volumes are very slightly higher when the Cross Valley improvements are in place but only of the order of 0-3%.
3.3.3. Flows on Petone Esplanade
There are differences in flows on Petone Esplanade between the Tests as can be seen in Figure 3-5 below.
In the AM peak the flows are predominantly westbound and in the PM peak the flows are predominantly eastbound with a balance in the inter peak.
In all three peaks, Tests 14 and 15 show increases in flow on the Esplanade over Test 11 which doesn’t include any Grenada to Petone link, although the volumes are still significantly less than Test 1 or Test 3 and Test 6.

Short List Assessment
SINCLAIR KNIGHT MERZ D:\Documents and Settings\tsmall\Desktop\090901Modelling Report.docx PAGE 42
Figure 3-5 Eastbound and westbound total PCU flows on Petone Esplanade
HCV volumes on Petone Esplanade are of the order of 30-100vph each of the peak hours modelled. The changes in flows with each of the options follow the same patterns as for total vehicles.
The total flow on the Petone Esplanade shows the same pattern for the AM and PM for 2026 in comparison to 2016. The increase in flow is about 150 PCUs. For the IP the total flows eastbound stay approximately the same whereas the westbound flow increases by roughly 100 PCUs.

Short List Assessment
SINCLAIR KNIGHT MERZ D:\Documents and Settings\tsmall\Desktop\090901Modelling Report.docx PAGE 43
Figure 3-6 Eastbound and westbound HCV flows on Petone Esplanade
Using the same daily factors as stated in Section 1.3.3, the total daily flows on Petone Esplanade are shown in Figure 3-7 below.
The HCV flows for the 2026 outputs indicate the same patterns and an increase of about 10-25 HCVs.

Short List Assessment
SINCLAIR KNIGHT MERZ D:\Documents and Settings\tsmall\Desktop\090901Modelling Report.docx PAGE 44
Figure 3-7 Daily total PCU flows on Petone Esplanade
The lowest flows on Petone Esplanade are for Test 14 which combines traffic calming on the Esplanade with an additional Cross Valley Link between Wakefield Street and Whites Line West and a link from Grenada tying in at the Dowse interchange.
The 2026 daily PCU flows show the same structure as the2016 flows with an increase of about 2000 PCUs overall.
3.3.4. Network statistics
The same network statistics as provided in Sections 1 and 2 are provided below:
3.3.4.1. AM peak
The general network statistics for the AM peak are shown in Table 3-1 below:
Table 3-1 AM peak network statistics
Short List Assessment
SINCLAIR KNIGHT MERZ D:\Documents and Settings\tsmall\Desktop\090901Modelling Report.docx PAGE 45
Note here that due to the change in distribution in the applied WTSM matrix, the lowest statistics are generally for Test 1, the Do Minimum. Tests 3 and 11 stand out as having the lower general statistics with:
Test 3 having the lowest level of general queuing and associated delays; and
Test 11 having the lowest overall travel time and distance on the network.
From a network statistic perspective, the combination Tests 14 and 15 do not show any additional benefit over a simple Grenada-Petone link (Test 3 and Test 6), or a Cross Valley link with traffic calming on Petone Esplanade (Test 11).
It should be noted that:
Test 1 uses WTSM matrix 2021;
Tests 3 and 6 use WTSM matrix 2031;
Test 11 uses WTSM matrix 2041; and
Tests 14 and 15 use WTSM matrix 2051.
3.3.4.2. Inter peak
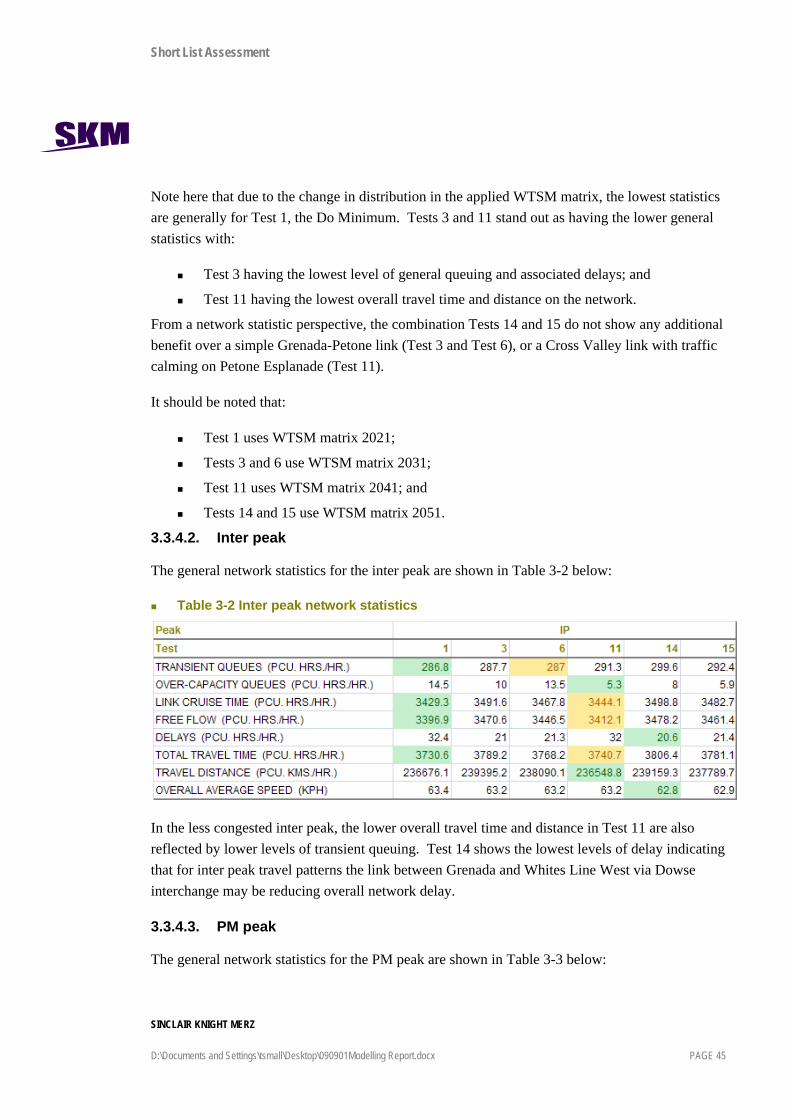
The general network statistics for the inter peak are shown in Table 3-2 below:
Table 3-2 Inter peak network statistics
In the less congested inter peak, the lower overall travel time and distance in Test 11 are also reflected by lower levels of transient queuing. Test 14 shows the lowest levels of delay indicating that for inter peak travel patterns the link between Grenada and Whites Line West via Dowse interchange may be reducing overall network delay.
3.3.4.3. PM peak
The general network statistics for the PM peak are shown in Table 3-3 below:

Short List Assessment
SINCLAIR KNIGHT MERZ D:\Documents and Settings\tsmall\Desktop\090901Modelling Report.docx PAGE 46
Table 3-3 PM peak network statistics
As with the inter peak, Test 11 appears to show the overall most favourable network performance with Test 14 having slightly lower overall network delay.