Appendix D Calculation of Horizontal and Vertical ......Appendix D . Calculation of Horizontal and...
18
Appendix D Calculation of Horizontal and Vertical Permeability in the Arbuckle A. Calculation of Permeability from NMR log of Well 1-32 First it was attempted to calculate NMR permeability using Coates and SDR equations. However, a reasonable match between calculated and core permeability could not be obtained using these equations, although several pre-factors of the equations were tried. It was decided to calculate permeability by relating core FZI to 1/(Swir*Phi) and using the new technique. Predicted permeability was first calculated based on FZI from 90-degree core permeability and the same process was repeated for max permeability of core samples. Pore structure in the Arbuckle is very complex and there are a lot of variations in pore size distribution (unimodal, bimodal, and trimodal) versus depth in very short intervals. Due to this complexity and non-homogeneity in pore size distribution, Arbuckle permeability was calculated based on pore size classification (micro, meso, and mega pores). FZI in each pore size class was correlated to 1/(Swir*Phi) of the same class. To obtain a better match between calculated permeability and core permeability, the Arbuckle was divided into two zones. Zone 1 was considered to be from 4,160 to 4,700 ft and zone 2 from 4,700 to 5,200 ft. Part 1: Determination of Permeability Using Permeability at 90 degree from Core Permeability in Zone 1 (4,160 – 4,700 ft) Permeability in zone 1 was calculated based on correlations between FZI from core and 1/(Swir*phi) from log. FZI from core data was calculated using permeability at 90 degree, and 1/(swir*phi) was calculated using effective porosity and irreducible water saturation from the NMR log. FZI and 1/(swir*phi) were sorted from low to high values. All FZI values less than 2 and 1/(swir*phi) values less than 48 were considered for micro pore sizes, which correspond to permeability values less than about 0.5 mD. Similarly, FZI from 2 to 11 and 1/(swir*phi) from 48 to 106 were considered for meso pore sizes, which correspond to permeability from about 0.5 to 25 mD. Finally, FZI from 11 to 150 and 1/(swir*phi) from 106 to 851 were considered for mega pore sizes, which correspond to permeability greater than about 25 mD. Table 1 lists the ranges. Table 1: Ranges of FZI and 1/(Swir*Phi) Approx k FZI Excel Row 1/(Swir*Phi) Excel Row Micro <0.5 <2.02 4–82 <48.62 4–430 Meso 0.5-25 2.02-10.97 83–170 48.62-106 431–937 Mega >25 10.97-150 170–246 106-851 938–1,083 Percentiles (5, 10, 20… 90) of FZI population in each class were correlated with respective percentiles of 1/(Swir*phi) population (figs. 1, 2, and 3). Four different correlations between FZI and
Transcript of Appendix D Calculation of Horizontal and Vertical ......Appendix D . Calculation of Horizontal and...
Appendix D
Calculation of Horizontal and Vertical Permeability in the Arbuckle
A. Calculation of Permeability from NMR log of Well 1-32
First it was attempted to calculate NMR permeability using Coates and SDR equations. However, a reasonable match between calculated and core permeability could not be obtained using these equations, although several pre-factors of the equations were tried. It was decided to calculate permeability by relating core FZI to 1/(Swir*Phi) and using the new technique. Predicted permeability was first calculated based on FZI from 90-degree core permeability and the same process was repeated for max permeability of core samples.
Pore structure in the Arbuckle is very complex and there are a lot of variations in pore size distribution (unimodal, bimodal, and trimodal) versus depth in very short intervals. Due to this complexity and non-homogeneity in pore size distribution, Arbuckle permeability was calculated based on pore size classification (micro, meso, and mega pores). FZI in each pore size class was correlated to 1/(Swir*Phi) of the same class.
To obtain a better match between calculated permeability and core permeability, the Arbuckle was divided into two zones. Zone 1 was considered to be from 4,160 to 4,700 ft and zone 2 from 4,700 to 5,200 ft.
Part 1: Determination of Permeability Using Permeability at 90 degree from Core
Permeability in Zone 1 (4,160 – 4,700 ft)
Permeability in zone 1 was calculated based on correlations between FZI from core and 1/(Swir*phi) from log. FZI from core data was calculated using permeability at 90 degree, and 1/(swir*phi) was calculated using effective porosity and irreducible water saturation from the NMR log. FZI and 1/(swir*phi) were sorted from low to high values. All FZI values less than 2 and 1/(swir*phi) values less than 48 were considered for micro pore sizes, which correspond to permeability values less than about 0.5 mD. Similarly, FZI from 2 to 11 and 1/(swir*phi) from 48 to 106 were considered for meso pore sizes, which correspond to permeability from about 0.5 to 25 mD. Finally, FZI from 11 to 150 and 1/(swir*phi) from 106 to 851 were considered for mega pore sizes, which correspond to permeability greater than about 25 mD. Table 1 lists the ranges.
Table 1: Ranges of FZI and 1/(Swir*Phi)
Approx k FZI Excel
Row 1/(Swir*Phi) Excel Row
Micro <0.5 <2.02 4–82 <48.62 4–430 Meso 0.5-25 2.02-10.97 83–170 48.62-106 431–937 Mega >25 10.97-150 170–246 106-851 938–1,083
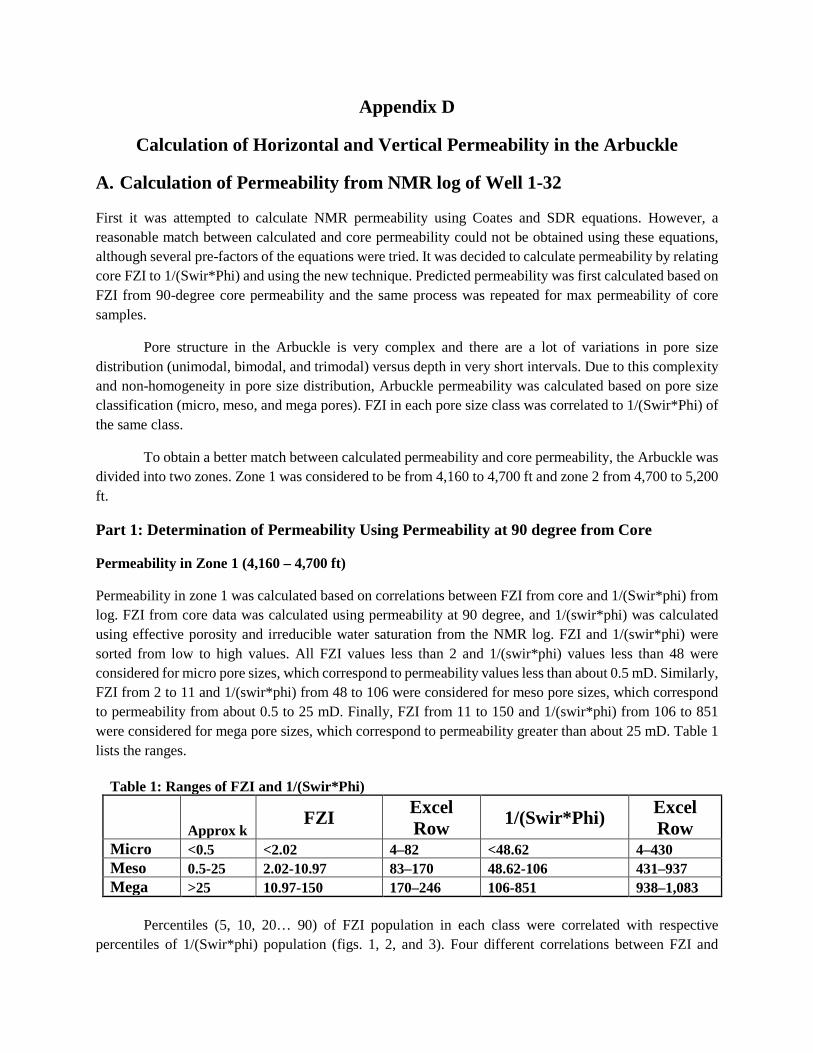
Percentiles (5, 10, 20… 90) of FZI population in each class were correlated with respective
percentiles of 1/(Swir*phi) population (figs. 1, 2, and 3). Four different correlations between FZI and
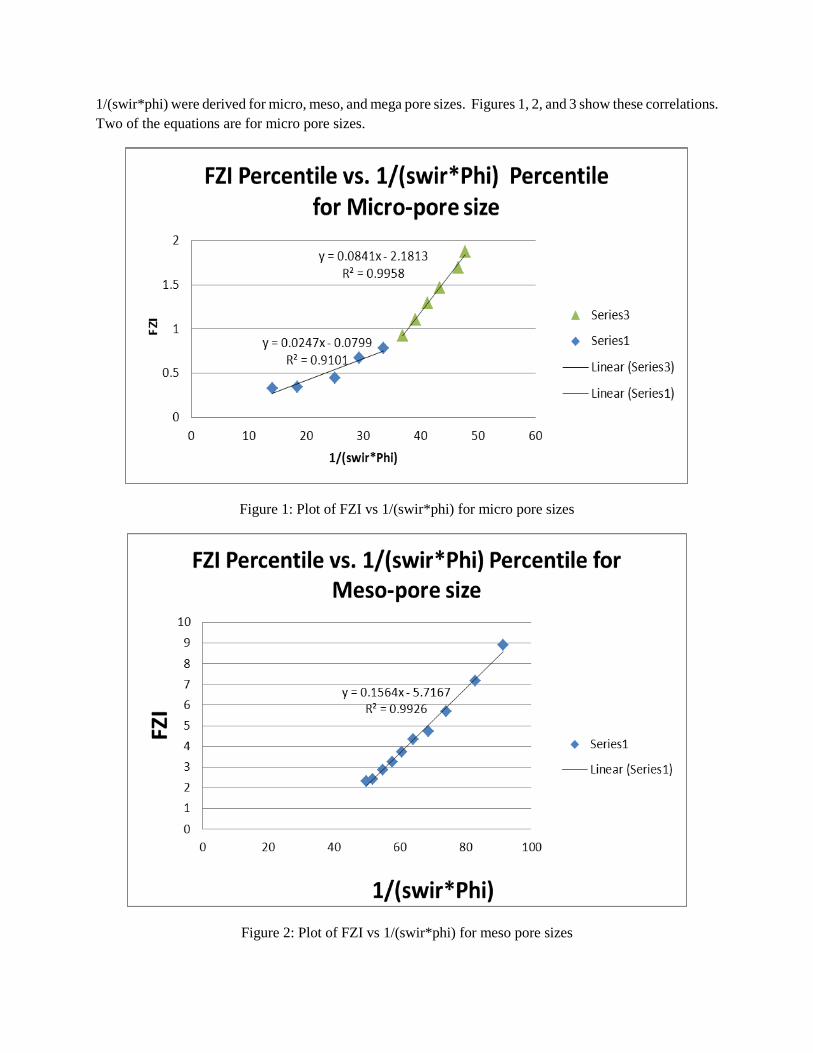
1/(swir*phi) were derived for micro, meso, and mega pore sizes. Figures 1, 2, and 3 show these correlations. Two of the equations are for micro pore sizes.
Figure 1: Plot of FZI vs 1/(swir*phi) for micro pore sizes
Figure 2: Plot of FZI vs 1/(swir*phi) for meso pore sizes
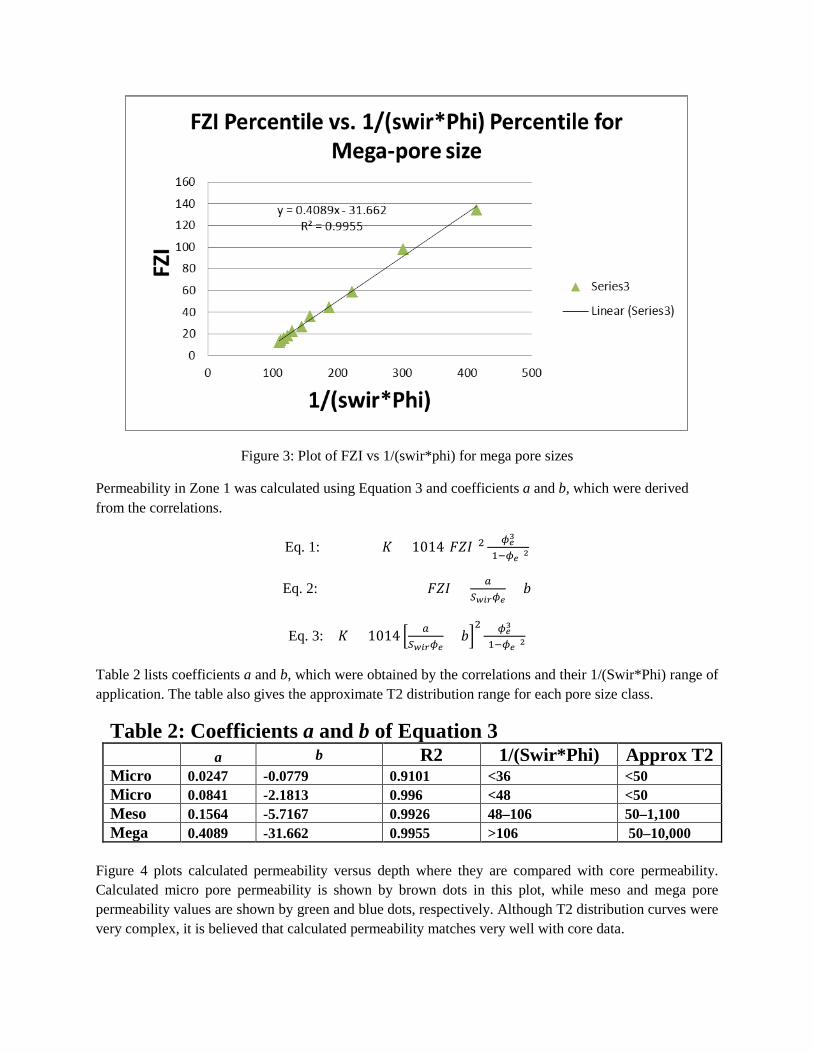
Figure 3: Plot of FZI vs 1/(swir*phi) for mega pore sizes
Permeability in Zone 1 was calculated using Equation 3 and coefficients a and b, which were derived from the correlations.
Eq. 1: 𝐾𝐾 = 1014[𝐹𝐹𝐹𝐹𝐹𝐹]2 𝜙𝜙𝑒𝑒3
(1−𝜙𝜙𝑒𝑒)2
Eq. 2: 𝐹𝐹𝐹𝐹𝐹𝐹 = 𝑎𝑎𝑆𝑆𝑤𝑤𝑤𝑤𝑤𝑤𝜙𝜙𝑒𝑒
+ 𝑏𝑏
Eq. 3: 𝐾𝐾 = 1014 � 𝑎𝑎𝑆𝑆𝑤𝑤𝑤𝑤𝑤𝑤𝜙𝜙𝑒𝑒
+ 𝑏𝑏�2 𝜙𝜙𝑒𝑒3
(1−𝜙𝜙𝑒𝑒)2
Table 2 lists coefficients a and b, which were obtained by the correlations and their 1/(Swir*Phi) range of application. The table also gives the approximate T2 distribution range for each pore size class.
Table 2: Coefficients a and b of Equation 3 a b R2 1/(Swir*Phi) Approx T2 Micro 0.0247 -0.0779 0.9101 <36 <50 Micro 0.0841 -2.1813 0.996 <48 <50 Meso 0.1564 -5.7167 0.9926 48–106 50–1,100 Mega 0.4089 -31.662 0.9955 >106 50–10,000
Figure 4 plots calculated permeability versus depth where they are compared with core permeability. Calculated micro pore permeability is shown by brown dots in this plot, while meso and mega pore permeability values are shown by green and blue dots, respectively. Although T2 distribution curves were very complex, it is believed that calculated permeability matches very well with core data.
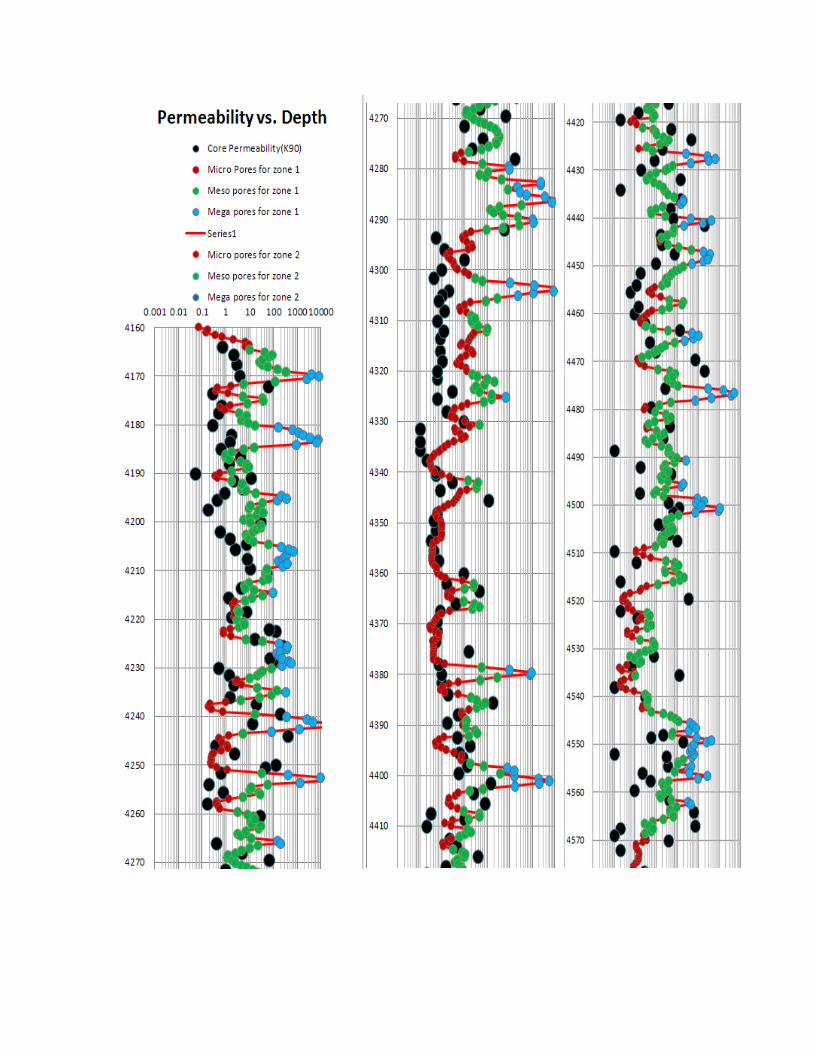
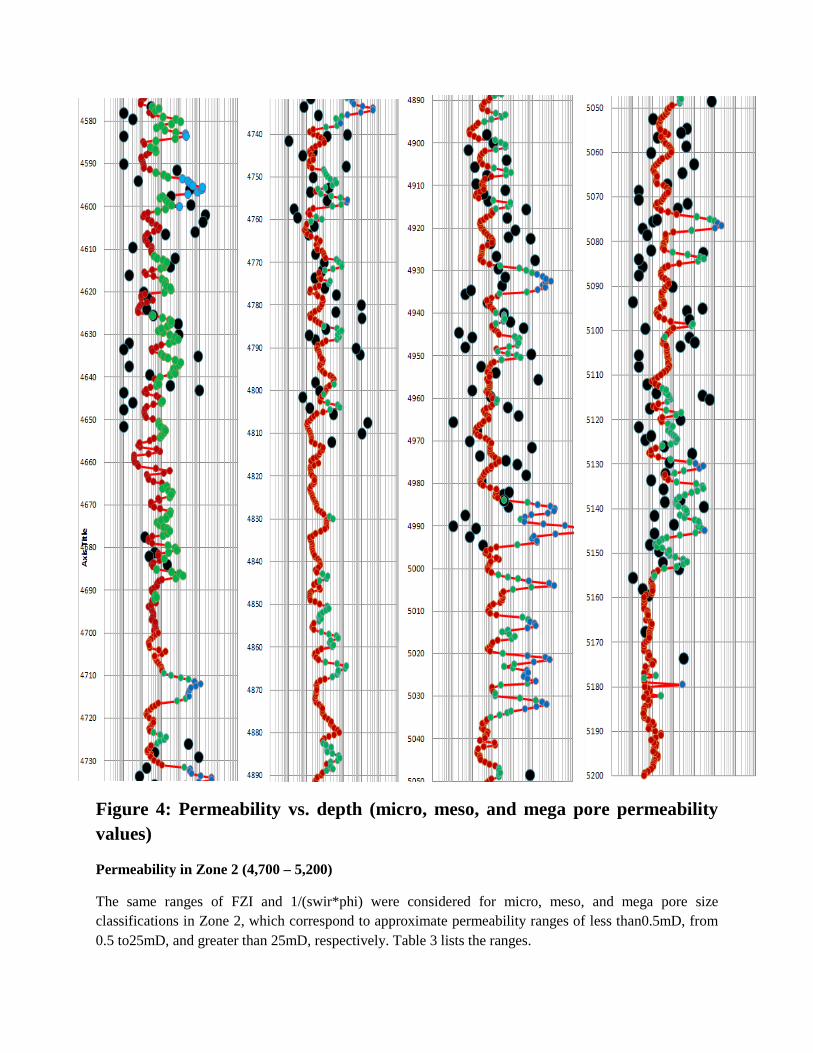
Figure 4: Permeability vs. depth (micro, meso, and mega pore permeability values)
Permeability in Zone 2 (4,700 – 5,200)
The same ranges of FZI and 1/(swir*phi) were considered for micro, meso, and mega pore size classifications in Zone 2, which correspond to approximate permeability ranges of less than0.5mD, from 0.5 to25mD, and greater than 25mD, respectively. Table 3 lists the ranges.
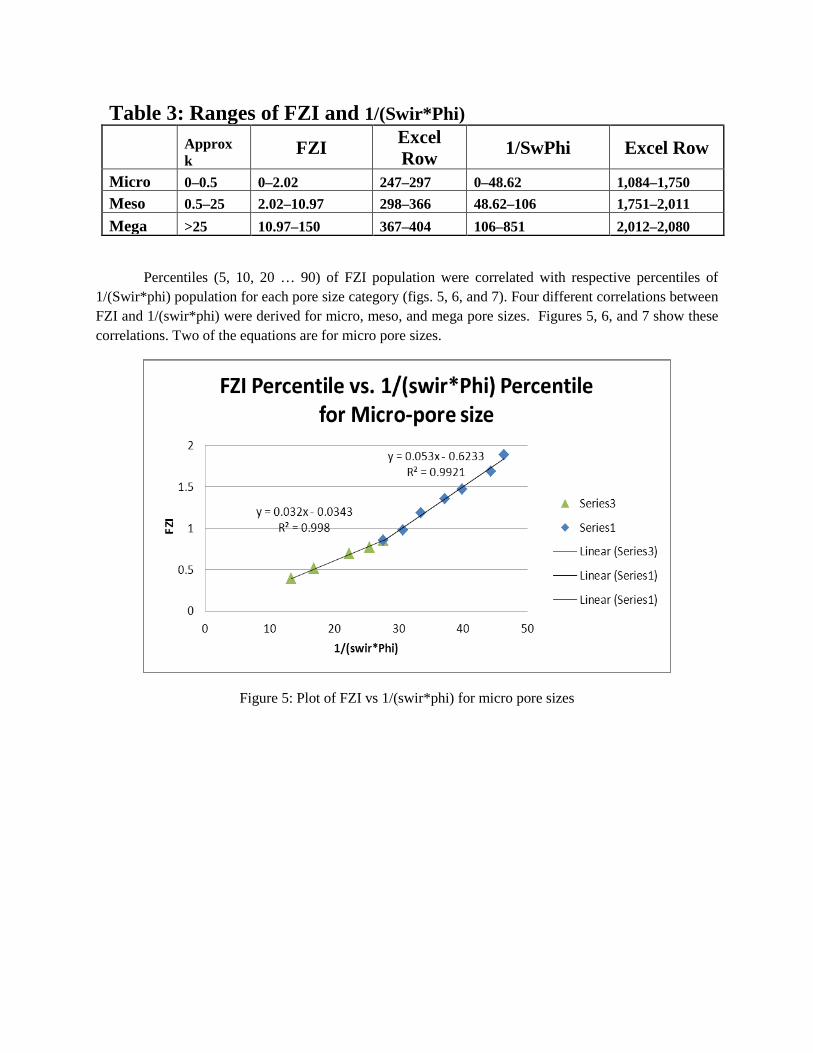
Table 3: Ranges of FZI and 1/(Swir*Phi)
Approx k
FZI Excel Row 1/SwPhi Excel Row
Micro 0–0.5 0–2.02 247–297 0–48.62 1,084–1,750 Meso 0.5–25 2.02–10.97 298–366 48.62–106 1,751–2,011 Mega >25 10.97–150 367–404 106–851 2,012–2,080
Percentiles (5, 10, 20 … 90) of FZI population were correlated with respective percentiles of 1/(Swir*phi) population for each pore size category (figs. 5, 6, and 7). Four different correlations between FZI and 1/(swir*phi) were derived for micro, meso, and mega pore sizes. Figures 5, 6, and 7 show these correlations. Two of the equations are for micro pore sizes.
Figure 5: Plot of FZI vs 1/(swir*phi) for micro pore sizes
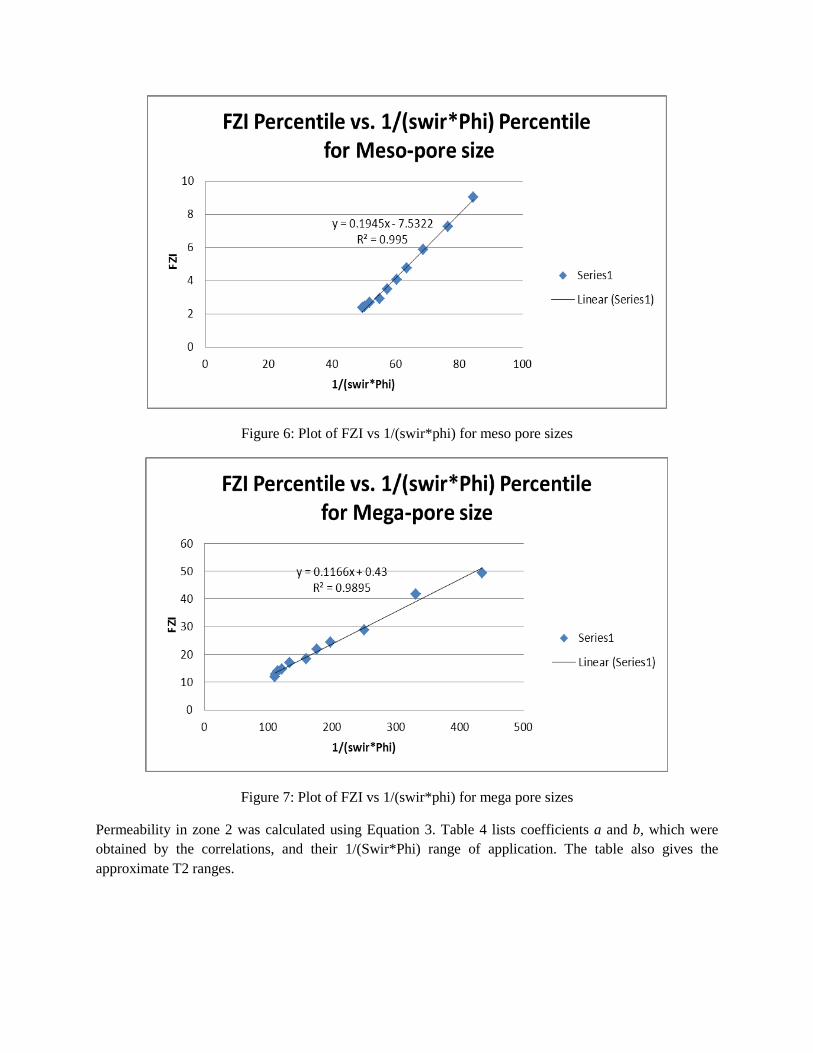
Figure 6: Plot of FZI vs 1/(swir*phi) for meso pore sizes
Figure 7: Plot of FZI vs 1/(swir*phi) for mega pore sizes
Permeability in zone 2 was calculated using Equation 3. Table 4 lists coefficients a and b, which were obtained by the correlations, and their 1/(Swir*Phi) range of application. The table also gives the approximate T2 ranges.
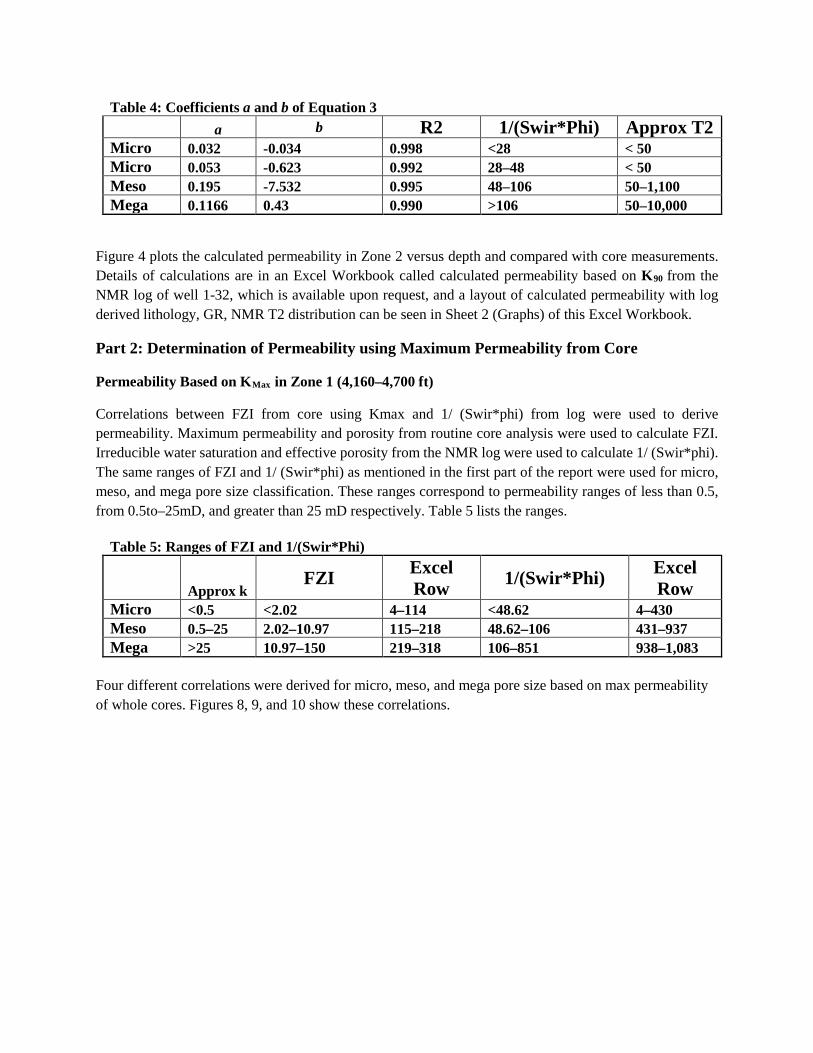
Table 4: Coefficients a and b of Equation 3 a b R2 1/(Swir*Phi) Approx T2 Micro 0.032 -0.034 0.998 <28 < 50 Micro 0.053 -0.623 0.992 28–48 < 50 Meso 0.195 -7.532 0.995 48–106 50–1,100 Mega 0.1166 0.43 0.990 >106 50–10,000
Figure 4 plots the calculated permeability in Zone 2 versus depth and compared with core measurements. Details of calculations are in an Excel Workbook called calculated permeability based on K90 from the NMR log of well 1-32, which is available upon request, and a layout of calculated permeability with log derived lithology, GR, NMR T2 distribution can be seen in Sheet 2 (Graphs) of this Excel Workbook.
Part 2: Determination of Permeability using Maximum Permeability from Core
Permeability Based on KMax in Zone 1 (4,160–4,700 ft)
Correlations between FZI from core using Kmax and 1/ (Swir*phi) from log were used to derive permeability. Maximum permeability and porosity from routine core analysis were used to calculate FZI. Irreducible water saturation and effective porosity from the NMR log were used to calculate 1/ (Swir*phi). The same ranges of FZI and 1/ (Swir*phi) as mentioned in the first part of the report were used for micro, meso, and mega pore size classification. These ranges correspond to permeability ranges of less than 0.5, from 0.5to–25mD, and greater than 25 mD respectively. Table 5 lists the ranges.
Table 5: Ranges of FZI and 1/(Swir*Phi)
Approx k FZI Excel
Row 1/(Swir*Phi) Excel Row
Micro <0.5 <2.02 4–114 <48.62 4–430 Meso 0.5–25 2.02–10.97 115–218 48.62–106 431–937 Mega >25 10.97–150 219–318 106–851 938–1,083
Four different correlations were derived for micro, meso, and mega pore size based on max permeability of whole cores. Figures 8, 9, and 10 show these correlations.
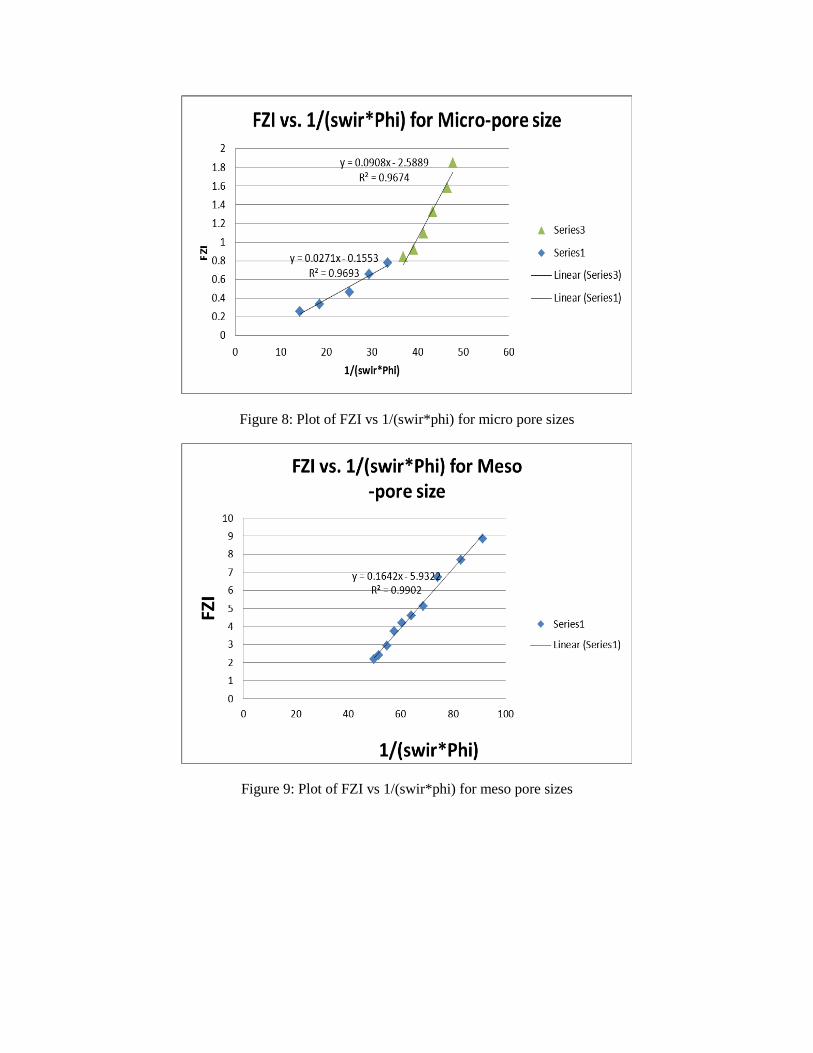
Figure 8: Plot of FZI vs 1/(swir*phi) for micro pore sizes
Figure 9: Plot of FZI vs 1/(swir*phi) for meso pore sizes
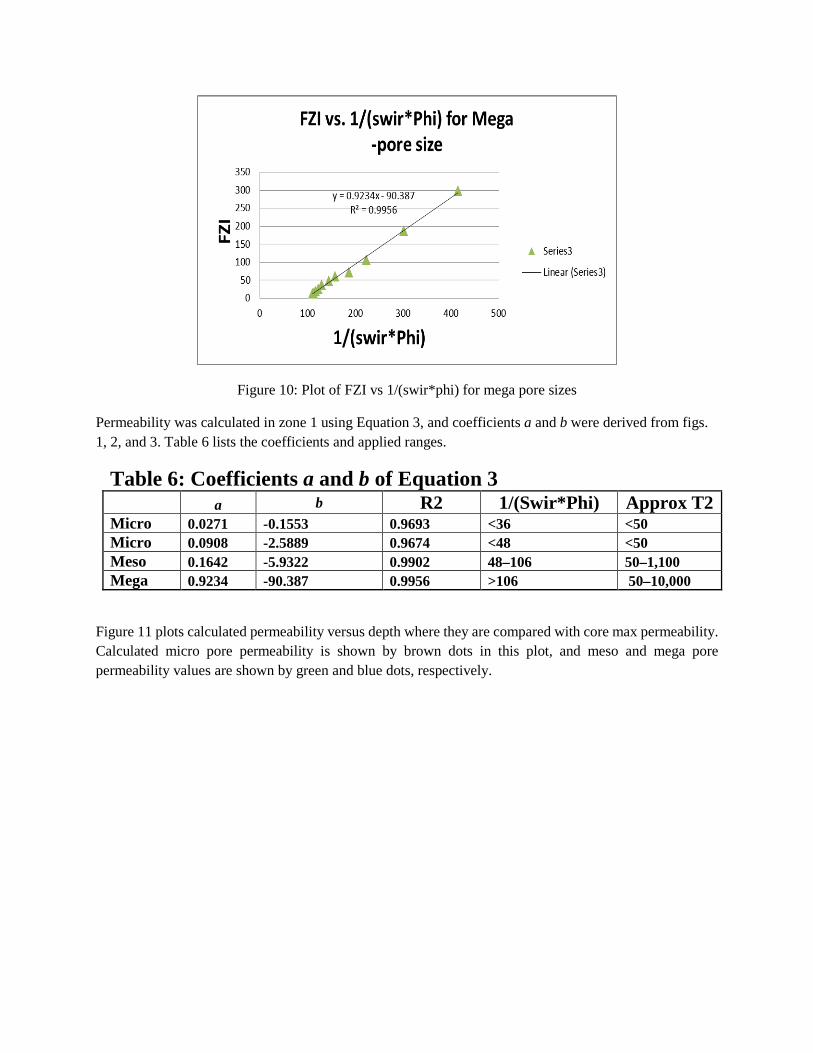
Figure 10: Plot of FZI vs 1/(swir*phi) for mega pore sizes
Permeability was calculated in zone 1 using Equation 3, and coefficients a and b were derived from figs. 1, 2, and 3. Table 6 lists the coefficients and applied ranges.
Table 6: Coefficients a and b of Equation 3 a b R2 1/(Swir*Phi) Approx T2 Micro 0.0271 -0.1553 0.9693 <36 <50 Micro 0.0908 -2.5889 0.9674 <48 <50 Meso 0.1642 -5.9322 0.9902 48–106 50–1,100 Mega 0.9234 -90.387 0.9956 >106 50–10,000
Figure 11 plots calculated permeability versus depth where they are compared with core max permeability. Calculated micro pore permeability is shown by brown dots in this plot, and meso and mega pore permeability values are shown by green and blue dots, respectively.
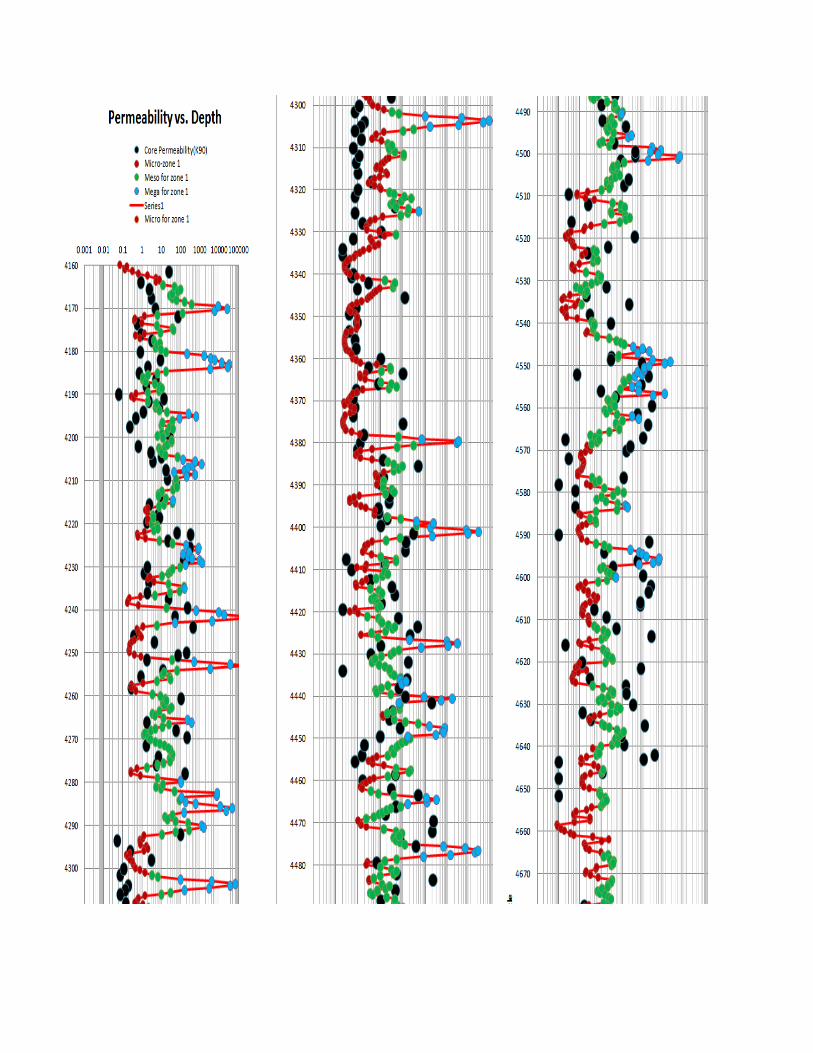
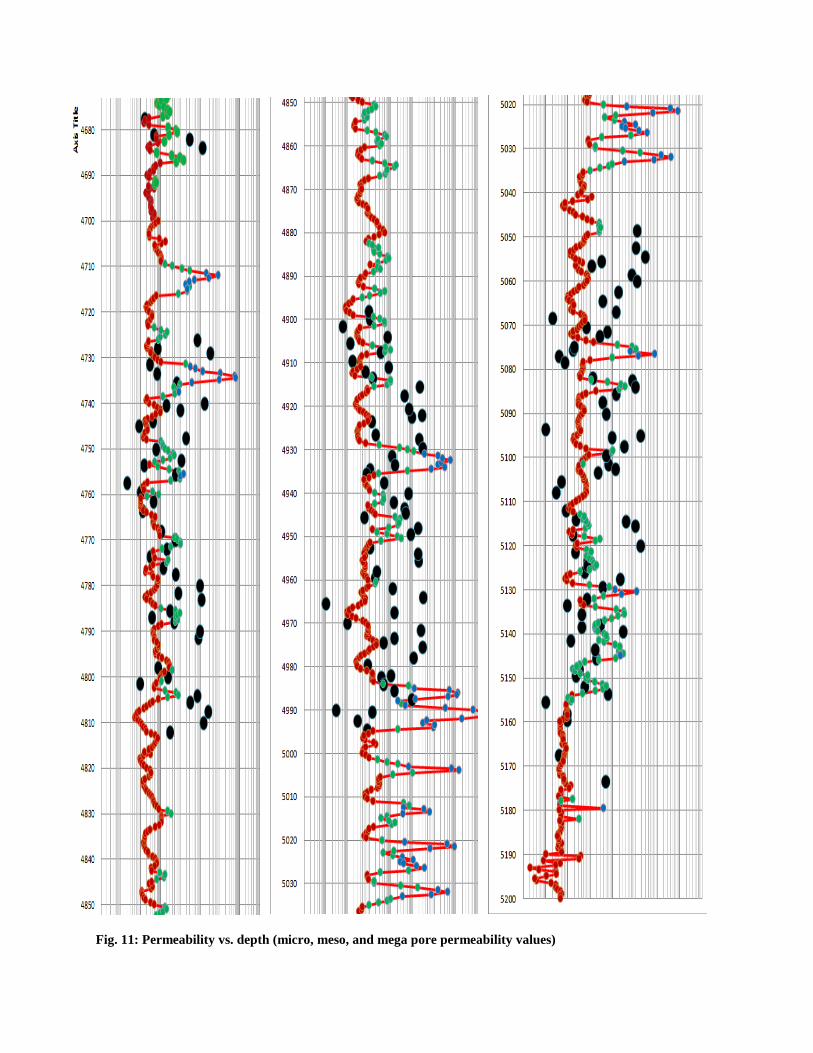
Fig. 11: Permeability vs. depth (micro, meso, and mega pore permeability values)
Permeability Based on KMax in Zone 2 (4,700 – 5,200)
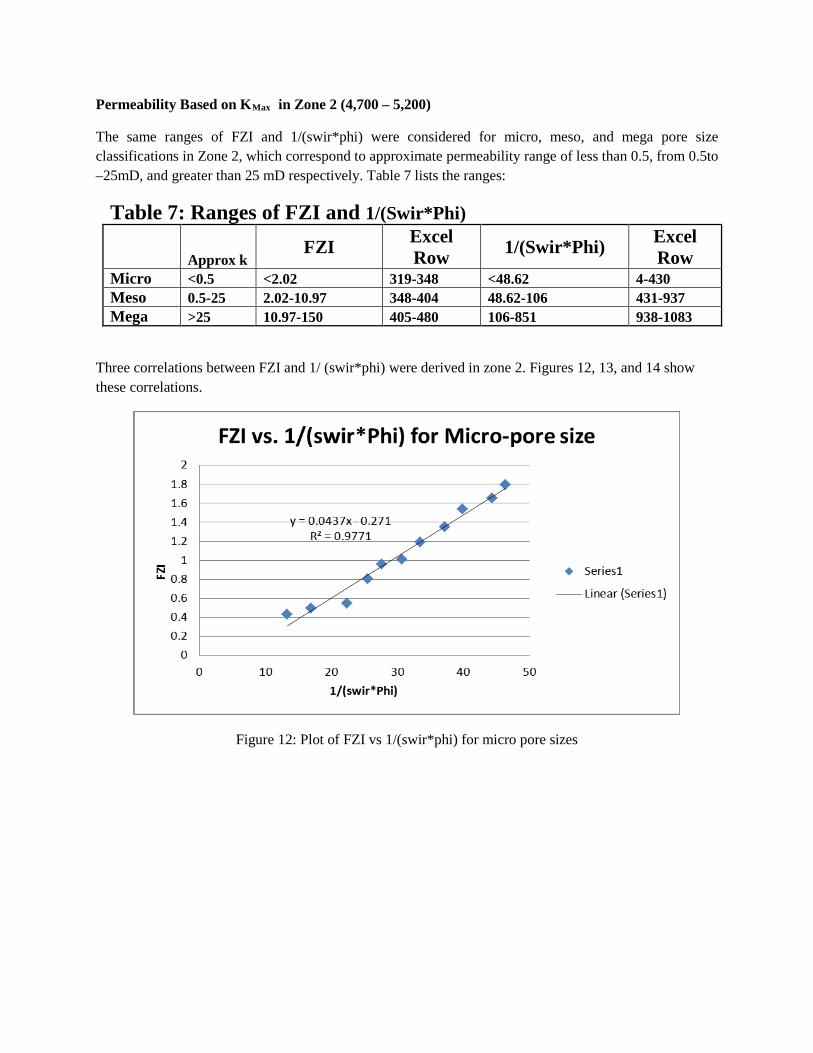
The same ranges of FZI and 1/(swir*phi) were considered for micro, meso, and mega pore size classifications in Zone 2, which correspond to approximate permeability range of less than 0.5, from 0.5to –25mD, and greater than 25 mD respectively. Table 7 lists the ranges:
Table 7: Ranges of FZI and 1/(Swir*Phi)
Approx k FZI Excel
Row 1/(Swir*Phi) Excel Row
Micro <0.5 <2.02 319-348 <48.62 4-430 Meso 0.5-25 2.02-10.97 348-404 48.62-106 431-937 Mega >25 10.97-150 405-480 106-851 938-1083
Three correlations between FZI and 1/ (swir*phi) were derived in zone 2. Figures 12, 13, and 14 show these correlations.
Figure 12: Plot of FZI vs 1/(swir*phi) for micro pore sizes
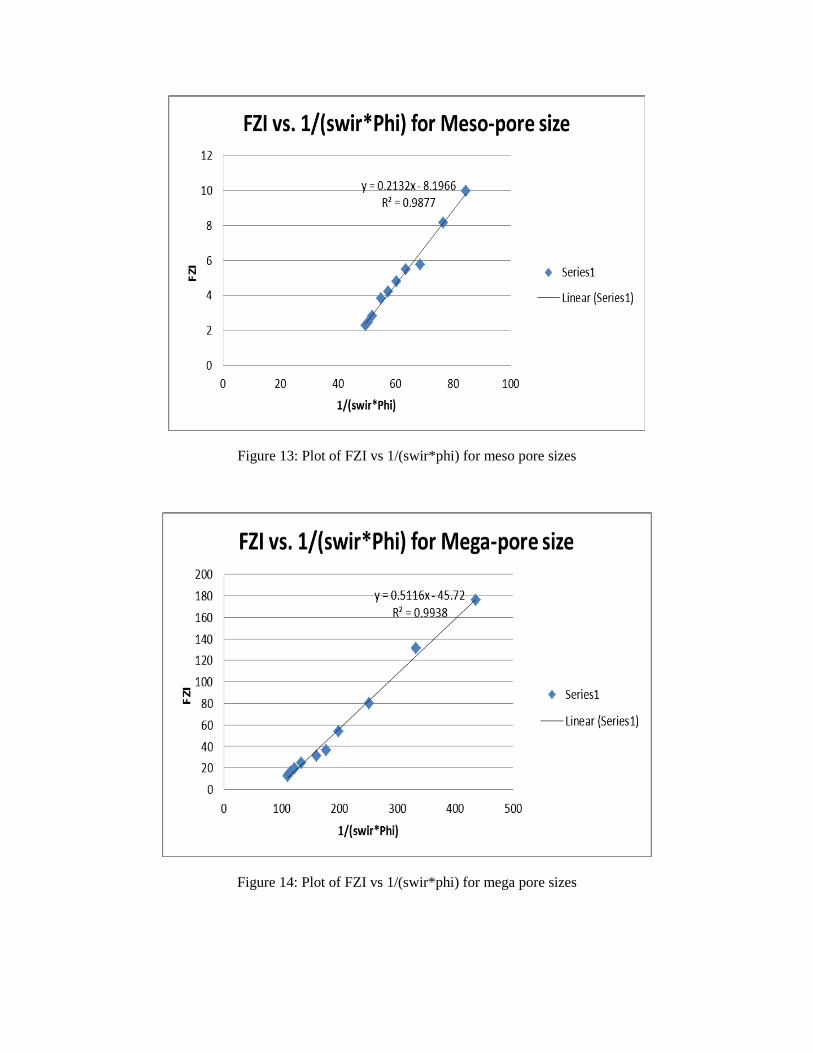
Figure 13: Plot of FZI vs 1/(swir*phi) for meso pore sizes
Figure 14: Plot of FZI vs 1/(swir*phi) for mega pore sizes
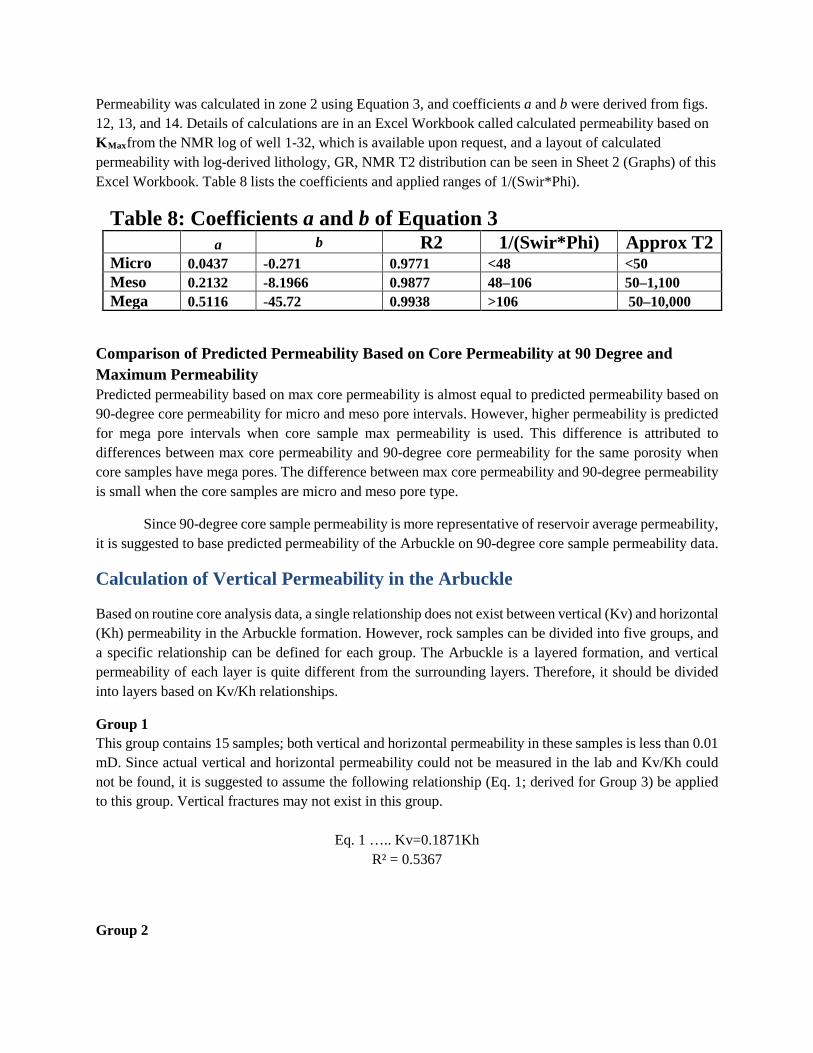
Permeability was calculated in zone 2 using Equation 3, and coefficients a and b were derived from figs. 12, 13, and 14. Details of calculations are in an Excel Workbook called calculated permeability based on KMaxfrom the NMR log of well 1-32, which is available upon request, and a layout of calculated permeability with log-derived lithology, GR, NMR T2 distribution can be seen in Sheet 2 (Graphs) of this Excel Workbook. Table 8 lists the coefficients and applied ranges of 1/(Swir*Phi).
Table 8: Coefficients a and b of Equation 3
a b R2 1/(Swir*Phi) Approx T2 Micro 0.0437 -0.271 0.9771 <48 <50 Meso 0.2132 -8.1966 0.9877 48–106 50–1,100 Mega 0.5116 -45.72 0.9938 >106 50–10,000
Comparison of Predicted Permeability Based on Core Permeability at 90 Degree and Maximum Permeability Predicted permeability based on max core permeability is almost equal to predicted permeability based on 90-degree core permeability for micro and meso pore intervals. However, higher permeability is predicted for mega pore intervals when core sample max permeability is used. This difference is attributed to differences between max core permeability and 90-degree core permeability for the same porosity when core samples have mega pores. The difference between max core permeability and 90-degree permeability is small when the core samples are micro and meso pore type.
Since 90-degree core sample permeability is more representative of reservoir average permeability, it is suggested to base predicted permeability of the Arbuckle on 90-degree core sample permeability data.
Calculation of Vertical Permeability in the Arbuckle
Based on routine core analysis data, a single relationship does not exist between vertical (Kv) and horizontal (Kh) permeability in the Arbuckle formation. However, rock samples can be divided into five groups, and a specific relationship can be defined for each group. The Arbuckle is a layered formation, and vertical permeability of each layer is quite different from the surrounding layers. Therefore, it should be divided into layers based on Kv/Kh relationships.
Group 1 This group contains 15 samples; both vertical and horizontal permeability in these samples is less than 0.01 mD. Since actual vertical and horizontal permeability could not be measured in the lab and Kv/Kh could not be found, it is suggested to assume the following relationship (Eq. 1; derived for Group 3) be applied to this group. Vertical fractures may not exist in this group.
Eq. 1 ….. Kv=0.1871Kh R² = 0.5367
Group 2
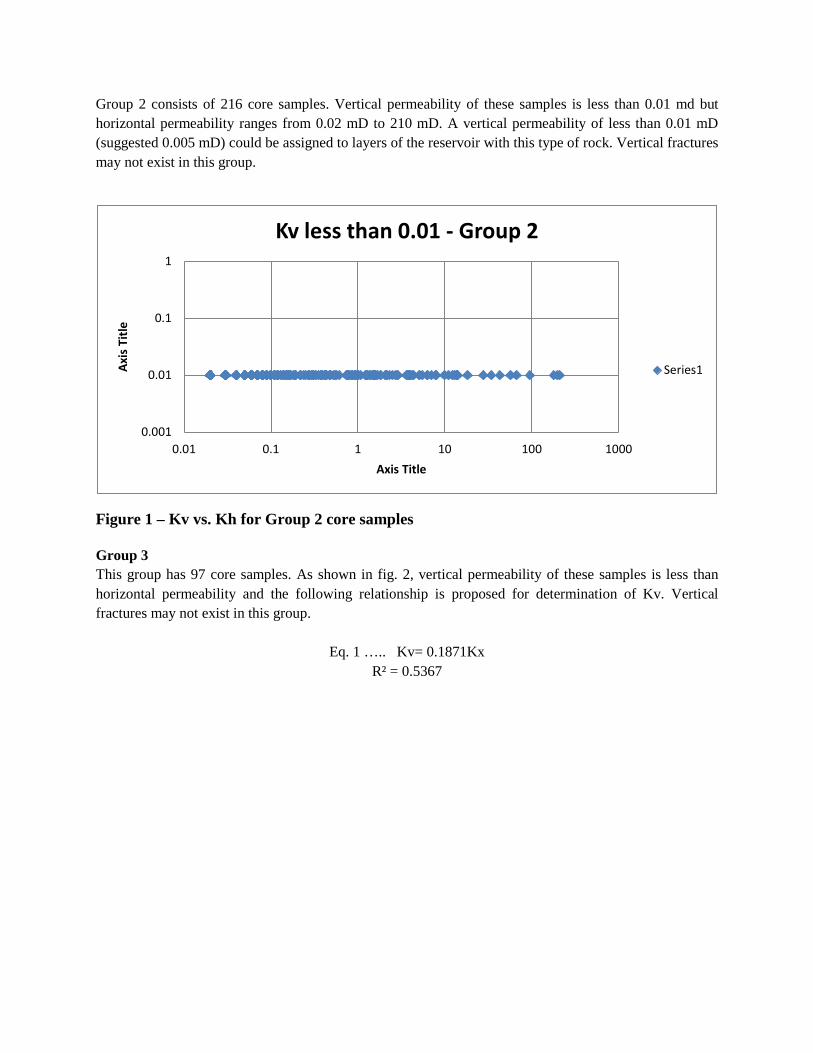
Group 2 consists of 216 core samples. Vertical permeability of these samples is less than 0.01 md but horizontal permeability ranges from 0.02 mD to 210 mD. A vertical permeability of less than 0.01 mD (suggested 0.005 mD) could be assigned to layers of the reservoir with this type of rock. Vertical fractures may not exist in this group.
Figure 1 – Kv vs. Kh for Group 2 core samples
Group 3 This group has 97 core samples. As shown in fig. 2, vertical permeability of these samples is less than horizontal permeability and the following relationship is proposed for determination of Kv. Vertical fractures may not exist in this group.
Eq. 1 ….. Kv= 0.1871Kx R² = 0.5367
0.001
0.01
0.1
1
0.01 0.1 1 10 100 1000
Axis
Titl
e
Axis Title
Kv less than 0.01 - Group 2
Series1
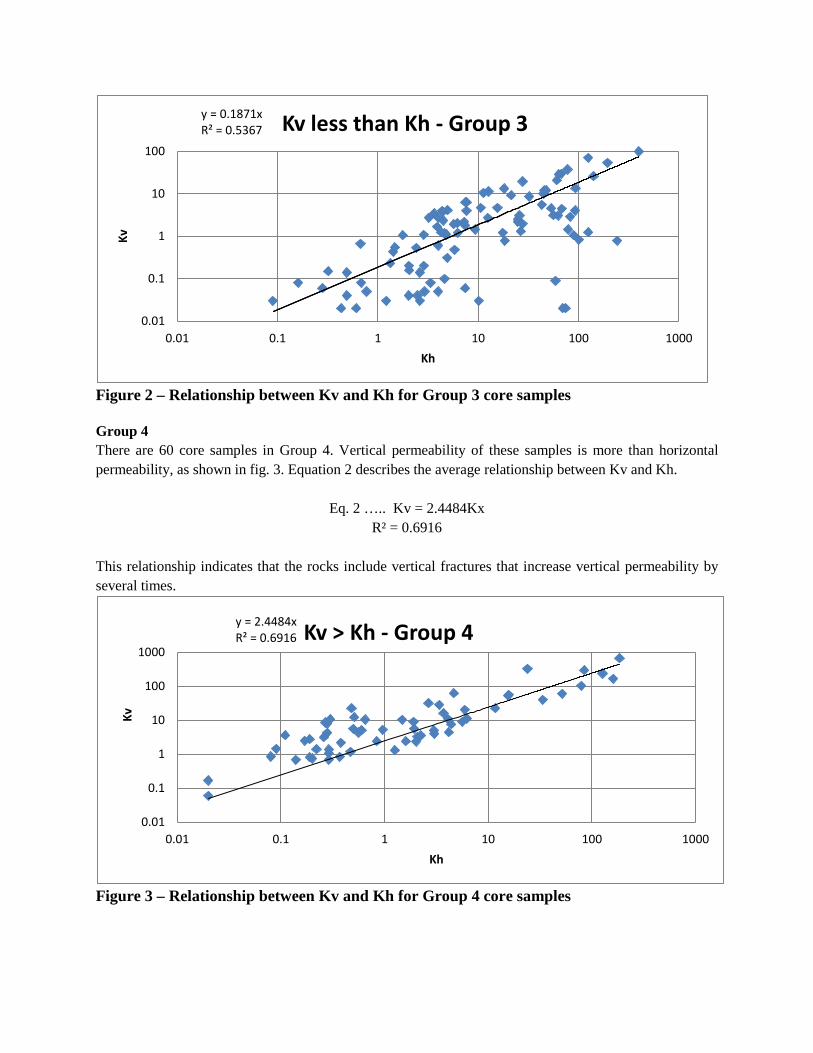
Figure 2 – Relationship between Kv and Kh for Group 3 core samples
Group 4 There are 60 core samples in Group 4. Vertical permeability of these samples is more than horizontal permeability, as shown in fig. 3. Equation 2 describes the average relationship between Kv and Kh.
Eq. 2 ….. Kv = 2.4484Kx R² = 0.6916
This relationship indicates that the rocks include vertical fractures that increase vertical permeability by several times.
Figure 3 – Relationship between Kv and Kh for Group 4 core samples
y = 0.1871xR² = 0.5367
0.01
0.1
1
10
100
0.01 0.1 1 10 100 1000
Kv
Kh
Kv less than Kh - Group 3
y = 2.4484xR² = 0.6916
0.01
0.1
1
10
100
1000
0.01 0.1 1 10 100 1000
Kv
Kh
Kv > Kh - Group 4
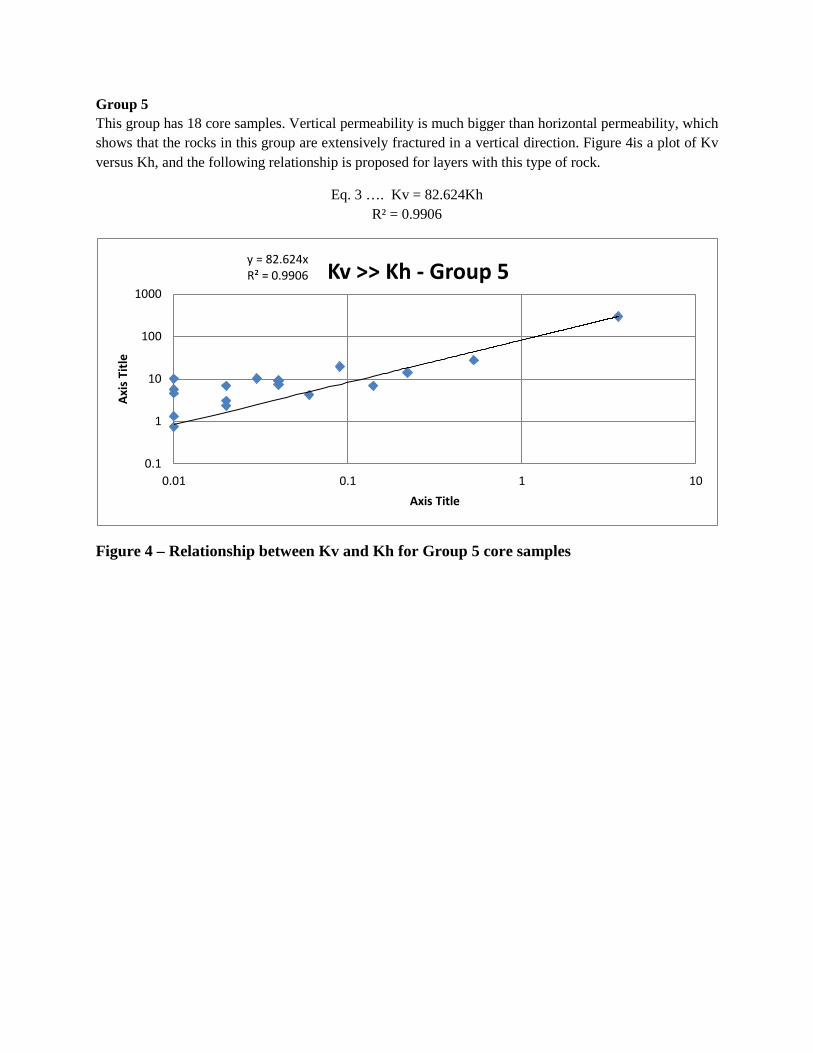
Group 5 This group has 18 core samples. Vertical permeability is much bigger than horizontal permeability, which shows that the rocks in this group are extensively fractured in a vertical direction. Figure 4is a plot of Kv versus Kh, and the following relationship is proposed for layers with this type of rock.
Eq. 3 …. Kv = 82.624Kh R² = 0.9906
Figure 4 – Relationship between Kv and Kh for Group 5 core samples
y = 82.624xR² = 0.9906
0.1
1
10
100
1000
0.01 0.1 1 10
Axis
Titl
e
Axis Title
Kv >> Kh - Group 5