
Appendix - Climate Change Protectiondeltacouncil.ca.gov/sites/default/files/2015/05/Draft_Shasta...
34
U.S. Department of the Interior Bureau of Reclamation November 2011 DRAFT Climate Change Projection Appendix: Summary of Potential Climate Change Projections and Impacts on the Study Area Resources Shasta Lake Water Resources Investigation, California Prepared by: United States Department of the Interior Bureau of Reclamation Mid-Pacific Region
Transcript of Appendix - Climate Change Protectiondeltacouncil.ca.gov/sites/default/files/2015/05/Draft_Shasta...

U.S. Department of the Interior Bureau of Reclamation November 2011
DRAFT
Climate Change Projection Appendix: Summary of Potential Climate Change Projections and Impacts on the Study Area Resources Shasta Lake Water Resources Investigation, California Prepared by: United States Department of the Interior Bureau of Reclamation Mid-Pacific Region


Contents
Contents Summary of Potential Climate Change Projections and Impacts on the Study Area
Resources ............................................................................................................................1 Regulatory Framework .................................................................................................................1
Federal ..............................................................................................................................1 State, Regional and Local ....................................................................................................3
Influence of Climate Changes on California ................................................................................5 Background on Global Climate Change & Emissions Projections ......................................6 Consideration of Global Change Effects on California .......................................................9
Major Findings ............................................................................................................................12 Global Climate Changes ....................................................................................................12 California Climate Changes ...............................................................................................13 Changes on Upper Sacramento River and at Shasta Lake .................................................17
References .....................................................................................................................................25
Tables Table 1. Summary of State Laws and Executive Orders that Address Climate Change .................4 Table 2. Climate Change Scenarios Used in the Reclamation Study ............................................10 Table 3. Climate Change Scenarios Used in 2006 DWR Report ..................................................11 Table 4. Mean of Projected Changes for Sacramento River at Bend Bridge, near Red Bluff, and
Contributing Watershed ..............................................................................................14 Table 5. Average Simulated CVP and SWP Allocations Considering Climate Change for 2030 15 Table 6. Percent Change in Annual Inflow to Shasta Lake ...........................................................19 Table 7. Months of Critical Shasta Lake Storage ..........................................................................20
Figures Figure 1. Global GHG Emissions for the IPCC Emission Scenarios ..............................................8 Figure 2. Average Monthly Inflows1 to Shasta Lake With and Without Climate Change
for 2030 .......................................................................................................................18 Figure 3. Median Percent Change in Annual Runoff for 2070s, Compared to 1990s ...................19 Figure 4. Shasta Lake End of September Exceedence for 2030 ....................................................20 Figure 5. Monthly Flood Control Frequency at Shasta Lake for 2030 ..........................................22
i DRAFT – November 2011

Shasta Lake Water Resources Investigation Climate Change Projection Appendix
Abbreviations and Acronyms °C degree Celsius °F degree Fahrenheit AR4 IPCC Assessment Report 4 on global climate change ARB California Air Resources Board BA Biological Assessment CalSim-II California Simulation model II for water resources CAT California Climate Action Team CALVIN engineering economic optimization model CEN Climate Effects Network CEQ Council on Environmental Quality CEQA California Environmental Quality Act CH4 methane CO2 carbon dioxide CO2e carbon dioxide equivalent CVP Central Valley Project D-1641 State Water Resources Control Board Water Right
Decision 1641 Delta Sacramento-San Joaquin Delta DOI Department of the Interior DSM2 Delta Simulation Model 2 DWR California Department of Water Resources EPA U.S. Environmental Protection Agency GCM General Circulation Model or Global Climate Model GHG greenhouse gas HFC hydrofluorocarbon IPCC Intergovernmental Panel on Climate Change ISB Independent Science Board MT metric ton N2O nitrous oxide NEPA National Environmental Policy Act NRDC Natural Resources Reference Council OCAP Operations Criteria and Plan PCM Parallel Climate Model PDEIS Preliminary Draft Environmental Impact Statement PFC perfluorocarbon Reclamation U.S. Department of the Interior, Bureau of Reclamation
ii DRAFT – November 2011
Contents
Reporting Rule Greenhouse Gas Reporting Rule SF4 sulfur hexaflouride SLWRI Shasta Lake Water Resource Investigation SRES Special Report on Emissions Scenarios State State of California SWP State Water Project SWRCB State Water Resources Control Board TAF Thousand acre-feet VIC Variable Infiltration Capacity model
iii DRAFT – November 2011
Shasta Lake Water Resources Investigation Climate Change Projection Appendix
iv DRAFT – November 2011
This page left blank intentionally.

Summary of Potential Climate Change Projections and Impacts on the Study Area Resources
Summary of Potential Climate Change Projections and Impacts on the Study Area Resources
This appendix provides a synopsis of Federal regulations for considering climate change in Federal planning processes, an overview of global climate projections and relevant research on climate change implications for California water resources, and a summary of key findings on the sensitivity of California water resources to climate changes, particularly those for Shasta Lake. This appendix provides context for the consideration of climate change within resource areas and cumulative condition chapters of the Shasta Lake Water Resources Investigation (SLWRI) Preliminary Draft Environmental Impact Statement (PDEIS). Assessments of specific impacts of climate change on environmental resource areas are discussed in the PDEIS.
While it is unlikely that any single project could have a significant impact on the projected production of greenhouse gas (GHG), the cumulative effect of human activities has been clearly linked to quantifiable changes in the composition of the atmosphere, which in turn have been shown to be the main cause of global climate change (IPCC, 2007). Possible effects of the SLWRI on GHG production are discussed in the “Air Quality and Climate” chapter of the PDEIS.
Regulatory Framework
Air quality in Shasta County is regulated by such agencies as the U.S. Environmental Protection Agency (EPA), the California Air Resources Board (ARB), and SCAQMD. Each of these agencies develops rules, regulations, policies, and/or goals to comply with applicable legislation. Although EPA regulations may not be superseded, both State and local regulations may be more stringent.
Federal Federal laws and regulations pertaining to climate change are discussed below.
Mandatory Greenhouse Gas Reporting Rule On September 22, 2009, the EPA released its final Greenhouse Gas Reporting Rule (Reporting Rule). The Reporting Rule is a response to the fiscal year 2008 Consolidated Appropriations Act (U.S. House of Representatives 2764, Public Law 110-161), which required EPA to develop “…mandatory reporting of greenhouse gases above appropriate thresholds in all sectors of the economy…”
1 DRAFT – November 2011

Shasta Lake Water Resources Investigation Climate Change Projection Appendix
The Reporting Rule would apply to most entities that emit 25,000 metric tons (MT) of carbon dioxide equivalent (CO2e) or more per year. Starting in 2010, facility owners are required to submit an annual GHG emissions report with detailed calculations of facility GHG emissions. The Reporting Rule would also mandate recordkeeping and administrative requirements in order for EPA to verify annual GHG emissions reports.
Environmental Protection Agency Findings On December 7, 2009, the EPA Administrator signed two distinct findings regarding GHGs under section 202(a) of the Clean Air Act:
• Endangerment Finding – The current and projected concentrations of the six key well-mixed greenhouse gases—carbon dioxide (CO2), methane (CH4), nitrous dioxide (N2O), hydrofluorocarbons (HFC), peroflourocarbons (PFC), and sulfur hexafluoride (SF6)—in the atmosphere threaten the public health and welfare of current and future generations.
• Cause or Contribute Finding – The Administrator finds that the combined emissions of these well-mixed GHGs from new motor vehicles and new motor vehicle engines contribute to the GHG pollution that threatens public health and welfare.
Council on Environmental Quality Draft National Environmental Policy Act Guidelines Because of uneven treatment of climate change under the National Environmental Policy Act (NEPA), the International Center for Technology Assessment, the National Resources Defense Council (NRDC), and Sierra Club filed a petition with the Council on Environmental Quality (CEQ) in March 2008, requesting that climate change analyses be included in all Federal environmental review documents. In response to the petition, as well as Executive Order 13514, CEQ issued new draft guidance on when and how to include GHG emissions and climate change impacts in environmental review documents under NEPA. CEQ’s guidance (issued on February 18, 2010) suggests that Federal agencies should consider opportunities to reduce GHG emissions caused by proposed Federal actions, and that the agencies adapt their actions to climate change impacts throughout the NEPA process and address these issues in their agency NEPA procedures. In the context of addressing climate change in environmental documentation, the two main NEPA considerations are as follows:
1. The effects of a proposed action and alternative actions on GHG emissions.
2. The impacts of climate change on a proposed action and alternative actions. CEQ notes that “significant” national policy decisions with “substantial” GHG impacts require analysis of their GHG effects(i.e., if a proposed action causes “substantial” annual direct emissions, or if a
2 DRAFT – November 2011

Summary of Potential Climate Change Projections and Impacts on the Study Area Resources
Federal agency action implicates energy conservation, reduced energy use or GHG emissions, and/or promotes renewable energy technologies that are cleaner and more efficient).
In these circumstances, information on GHG emissions (qualitative or quantitative) that is useful and relevant to the choice of a preferred action decision should be used when deciding among alternatives.
CEQ suggests that if a proposed action causes direct annual emissions of greater than 25,000 MTs CO2e, a quantitative and qualitative assessment may be meaningful to decision makers and the public. If annual direct emissions are less than 25,000 MT CO2e, CEQ encourages Federal agencies to consider whether the action’s long-term emissions should receive similar analysis.
State, Regional and Local Several laws and executive orders, summarized in Table 1, describe the authority for the State of California to monitor and address climate change. Many of these laws and orders pertain to implementation of the California Environmental Quality Act (CEQA). PDEIS Section 5.2 provides descriptions of the State authorizations and activities relevant to the SLWRI that address climate change, including CEQA.
The ARB coordinates and oversees local air pollution control programs in California; however, the ARB Scoping Plan (January 2009) identified local governments as “essential partners” in the effort to reduce GHG emissions, often having “broad influence and, in some cases, exclusive jurisdiction” over activities that contribute to GHG emissions through their planning and permitting processes, local ordinances, outreach and education efforts, and municipal operations. PDEIS Section 5.2 provides descriptions of the local and regional authorizations and activities relevant to the SLWRI that address climate change.
3 DRAFT – November 2011

Shasta Lake Water Resources Investigation Climate Change Projection Appendix
Table 1. Summary of State Laws and Executive Orders that Address Climate Change
Legislation Name
Signed into Law/ Ordered
Description CEQA Relevance
SB 1771 09/2000
Establishment of California Climate Registry to develop protocols for voluntary accounting and tracking of GHG emissions.
In 2007, DWR began tracking GHG emissions for all departmental operations.
AB 1473 07/2002
Directs ARB to establish fuel standards for noncommercial vehicles that would provide the maximum feasible reduction of GHGs.
Reduction of GHG emissions from noncommercial vehicle travel.
SB 1078, 107, EO S-14-08
09/2002, 09/2006, 11/2008
Establishment of renewable energy goals as a percentage of total energy supplied in the State.
Reduction of GHG emissions from purchased electrical power.
EO S-3-05, AB 32*
06/2005, 09/2006
Establishment of statewide GHG reduction targets and biennial science assessment reporting on climate change impacts and adaptation and progress toward meeting GHG reduction goals.
Projects required to be consistent with statewide GHG reduction plan and reports will provide information for climate change adaptation analysis.
SB 1368 9/2006 Establishment of GHG emission performance standards for base load electrical power generation.
Reduction of GHG emissions from purchased electrical power.
EO S-1-07 01/2007 Establishment of Low Carbon Fuel Standard.
Reduction of GHG emissions from transportation activities.
SB 97 08/2007 Directs OPR to develop guideline amendments for the analysis of climate change in CEQA documents.
Requires climate change analysis in all CEQA documents.
SB 375 09/2008
Requires metropolitan planning organizations to include sustainable communities strategies in their regional transportation plans.
Reduction of GHG emissions associated with housing and transportation.
EO S-13-08 11/2008
Directs the Natural Resources Agency to work with the National Academy of Sciences to produce a California Sea Level Rise Assessment Report and directs CAT to develop a California Climate Adaptation Strategy.
Information in the reports will provide information for climate change adaptation analysis.
Note: *Most significant laws and orders include SB 97 and EO S-13-08, elaborated further below. Key: AB = Assembly Bill ARB = California Air Resources Board CAT = Climate Action Team CEQA = California Environmental Quality Act DWR = California Department of Water Resources EO = Executive Order GHG = GHG OPR = Office of Planning and Research SB = Senate Bill
4 DRAFT – November 2011

Summary of Potential Climate Change Projections and Impacts on the Study Area Resources
Influence of Climate Changes on California
Climate change pertains to the entire planet, with regional variations that stem from the combination of regional and global conditions. The U.S. Department of the Interior, Bureau of Reclamation, (Reclamation) and the California Department of Water Resources (DWR) perform routine assessments on the sensitivity of California’s water resources to climate change. These assessments require a multi-step analysis with significant uncertainty being introduced in each step of the analysis chain. The process for evaluating water resource sensitivities involves the following, general steps:
1. The rate and volume of global GHG emissions is selected from a common set of emissions projections.
2. Complex Global Circulation Models (GCM) use the atmospheric composition of GHG identified in the first step as input, and simulate the resulting patterns of global atmospheric, oceanic and land surface conditions.
3. In a process referred to as downscaling, hydroclimatic outputs from the GCMs (e.g., precipitation) are adjusted from the large spatial scale of GCMs to a spatial scale appropriate for use in hydrologic models.
4. Hydrologic models simulate local conditions (e.g., stream flows, evapotranspiration) that result from the downscaled hydroclimatic parameters.
5. Simulated stream flows from the hydrologic models are used as input to water supply and operations models, which quantify the ability of a particular water resource system to meet performance objectives under the given hydrologic regime (i.e., reliability). Results from these models are the basis for assessing the sensitivity of particular water resource systems to changes in climate.
Uncertainties in this analytical process, particularly in the first three steps, are generally managed by considering a range of emissions, GCMs and/or downscaling techniques that encapsulate the range of variability among each.
The following sections provide an overview of global climate change and the range of available emissions projections, and a summary of recent research conducted by Reclamation and DWR on climate change and on California’s water resources. Differences in the selection of emissions scenarios and simulation models are noted where appropriate. Consolidated major findings from both Reclamation and DWR are presented later in this appendix.
5 DRAFT – November 2011

Shasta Lake Water Resources Investigation Climate Change Projection Appendix
Background on Global Climate Change & Emissions Projections Historical warming of the climate system, including Earth’s near-surface air and ocean temperatures, is now considered to be unequivocal (IPCC, 2007) with global surface temperature increasing approximately 1.33 degrees Fahrenheit (°F) over the last 100 years. Continued warming is projected to increase global average temperature between 2°F and 11°F over the next 100 years.
The causes of this warming have been identified as both natural processes and human actions. The Intergovernmental Panel on Climate Change (IPCC) concludes that variations in natural phenomena, such as solar radiation and volcanoes, produced most of the warming from preindustrial times to 1950, and had a small cooling effect afterward. However, after 1950, GHG concentrations resulting from human activity, such as fossil fuel burning and deforestation, have been responsible for most of the observed temperature increase (CEC, 2006). These conclusions have been endorsed by more than 45 scientific societies and academies of science, including all of the national academies of science of the major industrialized countries. Since 2007, no scientific body of national or international standing has maintained a dissenting opinion.
Increases in GHG concentrations in the Earth’s atmosphere are thought to be the main cause of human-induced climate change. GHGs naturally trap heat by impeding the exit of solar radiation that has struck the Earth and is reflected back into space. Some GHGs occur naturally and are necessary for keeping the Earth’s surface inhabitable. However, increases in the concentrations of these gases in the atmosphere during the last 100 years have decreased the amount of solar radiation that is reflected back into space, intensifying the natural greenhouse effect and resulting in the increase of global average temperature.
Principal GHGs are CO2, CH4, N2O, SF6, PFCs, HFCs, and water vapor. Each of the principal GHGs has a long atmospheric lifetime (1 year to several thousand years). In addition, the potential heat-trapping ability of each of these gases varies significantly. CH4 is 23 times as potent as CO2, while SF6 is 22,200 times more potent than CO2. Conventionally, GHGs have been reported as CO2e. CO2e takes into account the relative potency of non-CO2 GHGs and converts their quantities to an equivalent amount of CO2 so that all emissions can be reported as a single quantity.
The primary man-made processes that release these gases include burning of fossil fuels for transportation, heating, and electricity generation; agricultural practices that release CH4, such as livestock grazing and crop residue decomposition; and industrial processes that release smaller amounts of high global warming potential gases such as SF6, PFCs, and HFCs. Deforestation and land cover conversion have also been identified as contributing to global warming by reducing the Earth’s capacity to remove CO2 from the air and altering the Earth’s albedo or surface reflectance, allowing more solar radiation to be absorbed.
6 DRAFT – November 2011

Summary of Potential Climate Change Projections and Impacts on the Study Area Resources
Because future climatic conditions depend heavily on future human activities, IPCC has developed emissions scenarios to help project long-term trends in GHG emissions. These scenarios are described in the IPCC Special Report on Emissions Scenarios (SRES) (IPCC, 2000). Currently, there are 112 SRES scenarios which have been grouped into four families: A1, A2, B1, and B2. The variety in emissions scenarios reflects the uncertainty in potential human activities and, thereby, global emissions. Figure 1 shows the global GHG emissions for each scenario. IPCC summarizes the four scenario families as follows (IPCC, 2007):
A1. The A1 storyline and scenario family describes a future world of very rapid economic growth, global population that peaks in mid-century and declines thereafter, and the rapid introduction of new and more efficient technologies. Major underlying themes are convergence among regions, capacity building and increased cultural and social interactions, with a substantial reduction in regional differences in per capita income. The A1 scenario family develops into three groups that describe alternative directions of technological change in the energy system. The three A1 groups are distinguished by their technological emphasis: fossil-intensive (A1FI), non-fossil energy sources (A1T) or a balance across all sources (A1B) (where balanced is defined as not relying too heavily on one particular energy source, on the assumption that similar improvement rates apply to all energy supply and end use technologies).
A2. The A2 storyline and scenario family describes a very heterogeneous world. The underlying theme is self-reliance and preservation of local identities. Fertility patterns across regions converge very slowly, which results in continuously increasing population. Economic development is primarily regionally oriented and per capita economic growth and technological change more fragmented and slower than other storylines.
B1. The B1 storyline and scenario family describes a convergent world with the same global population, that peaks in mid-century and declines thereafter, as in the A1 storyline, but with rapid change in economic structures toward a service and information economy, with reductions in material intensity and the introduction of clean and resource-efficient technologies. The emphasis is on global solutions to economic, social and environmental sustainability, including improved equity, but without additional climate initiatives.
B2. The B2 storyline and scenario family describes a world in which the emphasis is on local solutions to economic, social
7 DRAFT – November 2011

Shasta Lake Water Resources Investigation Climate Change Projection Appendix
and environmental sustainability. It is a world with continuously increasing global population, at a rate lower than A2, intermediate levels of economic development, and less rapid and more diverse technological change than in the B1 and A1 storylines. While the scenario is also oriented towards environmental protection and social equity, it focuses on local and regional levels.
Source: IPCC, 2007 Notes: The emissions include CO2, CH4, N2O and F-gases.
Figure 1. Global GHG Emissions for the IPCC Emission Scenarios
The IPCC emissions scenarios have been widely used to research and characterize the range of potential climate changes and their effects, and to test strategies for mitigating negative impacts. Typical consideration of climate change on water resources involves a chain of models that first simulates atmospheric changes, and then considers how the atmosphere affects a region’s hydrology, and, finally, assesses how hydrologic changes alter the reliability of water resource operations within that region. Simulations of global atmospheric conditions are performed using GCMs, which predict how changes in atmospheric constituents affect atmospheric conditions, including what are termed hydroclimatic variables (e.g., wind speed, precipitation, and temperature). Several GCM simulations are available from a wide variety of
8 DRAFT – November 2011

Summary of Potential Climate Change Projections and Impacts on the Study Area Resources
research institutions, (e.g., U.S. Department of Energy sponsors climate research through the Parallel Climate Model (PCM)). Preferences for emissions scenarios and simulation models vary among research efforts. Throughout the following discussion, emissions scenarios and simulation models are noted with quantified results, where important.
Consideration of Global Change Effects on California The following discussion relies heavily on climate projections selected for study by the Climate Change Task Force (DOI, 2008), the U.S. Department of the Interior’s (DOI) Climate Effects Network (CEN), the Reclamation, and other research sponsored by the State of California (State) and DOI. Quantifications of change in both the climate and California’s hydrologic conditions have been taken from three main studies: Sensitivity of Future Central Valley Project and State Water Project Operations to Potential Climate Change and associated Sea Level Rise (Reclamation, 2008b), 2006 Progress on Incorporating Climate Change into Management of California’s Water Resources (DWR), and 2009 Climate Action Team Biennial Report (DWR). These studies generally agree with each other regarding likely trends for climate and hydrology in California. The studies and their methodologies are briefly described below. Major findings from these reports are discussed later in this report.
Federal Studies In 2008, Reclamation reported on potential climate change implications for Central Valley Project (CVP) and State Water Project (SWP) operations, consistent with the analytical framework featured in the CVP Operations Criteria and Plan (OCAP) Biological Assessment (BA) (Reclamation, 2008a). This report focuses on the sensitivity of CVP/SWP operations to a range of climate projections for 2030 (Table 2). Results show the sensitivity of CVP/SWP operations to four climate change projections that bracket a range of observed highs and lows among temperature and precipitation projections for California’s Central Valley. CVP/SWP operations are simulated using a version of California Simulation model II for water resources (CalSim-II), a water resources planning model for California, derived from the OCAP BA, but set up to simulate only the State Water Resources Control board (SWRCB) Water Right Decision 1641 (D-1641) regulatory constraints on CVP/SWP operations, and not other regulatory overlays (“Study 9.0”). The range of climate projections assumes 1-foot sea level rise and 10 percent increase in tidal range by 2030, as developed for companion studies by DWR.
Reclamation translated regional climate changes into monthly changes in surface water runoff and CVP/SWP reservoir inflows through the use of two runoff model applications: a set of SacSMA/Snow17 basin applications supporting Central Valley flood-forecasting operations, and a Central Valley Variable Infiltration Capacity (VIC) model application supporting past research studies. The modeled combination of sea level rise and surface water supply changes provides information for how CVP/SWP operations and dependent conditions (i.e., Sacramento-San Joaquin Delta (Delta) flows and velocities,
9 DRAFT – November 2011

Shasta Lake Water Resources Investigation Climate Change Projection Appendix
reservoir and river water temperatures) respond to the range of predicted climate changes.
Table 2. Climate Change Scenarios Used in the Reclamation Study
Study Basis for Projected Changes
Climate Implications for
California
Precipitation Change
(Percent)1
Temperature Change (°F)1
Study 9.0 Historical climate N/A 0 0
Study 9.1
Historical climate with 1-foot sea level raise N/A 0 0
Study 9.2 A2 emissions storyline Wetter, less warming 14 0.8
Study 9.3 A1B emissions storyline Wetter, more warming 14 2.9
Study 9.4 A2 emissions storyline Drier, less warming -11 0.8
Study 9.5 A2 emissions storyline Drier, more warming -11 2.9
Source: Reclamation, 2008b Notes: 1 Represents the change in 30-year-mean annual precipitation or temperature (2011-2040 mean from 1971-
2000 mean). Key: N/A = not applicable Reclamation = U.S. Department of the Interior, Bureau of Reclamation
The report assumed sufficient flexibility in district-level demand-management (e.g., shifts in cropping choices, irrigation technology) to counteract anticipated increases in crop-specific water needs resulting from climate change.
In 2011, to fulfill its requirements within section 9503 of the SECURE Water Act, Reclamation reported on potential changes in water availability and hydrology for eight major Reclamation watersheds, including California’s Sacramento and San Joaquin river watersheds. This study documents the trends of hydroclimatic variables (e.g., streamflows, April 1 snow volumes) across the western United States based on 112 emissions scenarios (IPCC, 2007). Results compare climatic conditions centered on the 2020s (i.e., water years 2020 through 2029), 2050s, and 2070s, with simulated hydroclimatic conditions in the 1990s.
State Studies In support of the Governor’s Executive Order S-3-05, DWR is authoring 13 studies that address the impact of climate change and its impact on water resources. These studies ascribe to one of four potential approaches: (1) a scenario approach based on selection of a limited number of GCM simulations as used by the California Climate Action Team (CAT), (2) an ensemble-informed approach based on 112 available emissions scenarios from the IPCC Fourth Assessment Report (AR4) (2007), (3) relative change approaches that apply perturbations to historical data to simulate the potential impacts of climate
10 DRAFT – November 2011
Summary of Potential Climate Change Projections and Impacts on the Study Area Resources
change, or (4) qualitative approaches. Over half of the studies use the first, scenario-based approach to assess the impacts of climate change.
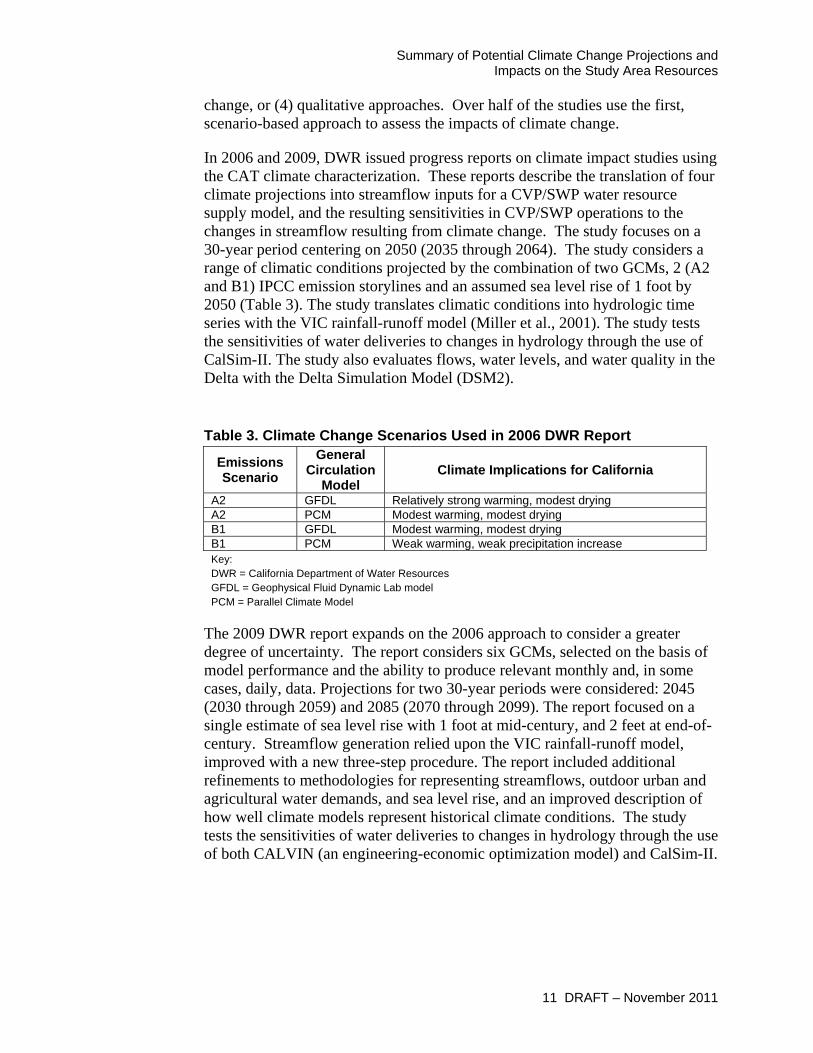
In 2006 and 2009, DWR issued progress reports on climate impact studies using the CAT climate characterization. These reports describe the translation of four climate projections into streamflow inputs for a CVP/SWP water resource supply model, and the resulting sensitivities in CVP/SWP operations to the changes in streamflow resulting from climate change. The study focuses on a 30-year period centering on 2050 (2035 through 2064). The study considers a range of climatic conditions projected by the combination of two GCMs, 2 (A2 and B1) IPCC emission storylines and an assumed sea level rise of 1 foot by 2050 (Table 3). The study translates climatic conditions into hydrologic time series with the VIC rainfall-runoff model (Miller et al., 2001). The study tests the sensitivities of water deliveries to changes in hydrology through the use of CalSim-II. The study also evaluates flows, water levels, and water quality in the Delta with the Delta Simulation Model (DSM2).
Table 3. Climate Change Scenarios Used in 2006 DWR Report
Emissions Scenario
General Circulation
Model Climate Implications for California
A2 GFDL Relatively strong warming, modest drying A2 PCM Modest warming, modest drying B1 GFDL Modest warming, modest drying B1 PCM Weak warming, weak precipitation increase Key: DWR = California Department of Water Resources GFDL = Geophysical Fluid Dynamic Lab model PCM = Parallel Climate Model
The 2009 DWR report expands on the 2006 approach to consider a greater degree of uncertainty. The report considers six GCMs, selected on the basis of model performance and the ability to produce relevant monthly and, in some cases, daily, data. Projections for two 30-year periods were considered: 2045 (2030 through 2059) and 2085 (2070 through 2099). The report focused on a single estimate of sea level rise with 1 foot at mid-century, and 2 feet at end-of-century. Streamflow generation relied upon the VIC rainfall-runoff model, improved with a new three-step procedure. The report included additional refinements to methodologies for representing streamflows, outdoor urban and agricultural water demands, and sea level rise, and an improved description of how well climate models represent historical climate conditions. The study tests the sensitivities of water deliveries to changes in hydrology through the use of both CALVIN (an engineering-economic optimization model) and CalSim-II.
11 DRAFT – November 2011

Shasta Lake Water Resources Investigation Climate Change Projection Appendix
Major Findings
The following section summarizes major findings from Reclamation (2008a, 2008b, 2011a) and DWR (2006, 2009, 2010) research on climate change. The discussion is organized by geographic extent, considering global changes, changes within California’s Central Valley, and then changes on the upper Sacramento River and Shasta Lake.
Global Climate Changes Assessments on global climate change have been periodically updated by the Intergovernmental IPCC since 1988. The IPCC released its AR4 in 2007, which offers statements and uncertainty estimates on recent trends, apparent human influence on those trends, and projections for various climate conditions. AR4 is the current standard reference for worldwide climate change assessment information and builds on previous work by the IPCC to develop plausible future scenarios of anthropogenic emissions of all relevant GHGs as well as other important climate forcing compounds that are commonly emitted into the atmosphere.
Some of the findings about future global climate trends and implications for the United States from the AR4 include the following (IPCC, 2007):
• Generally, warming between 2010 and 2039 will be in the range of 1 to 3 degrees Celsius (ºC). Later in the century, projected annual warming is greatest in the winter, with a possible increase of more than 5ºC at high latitudes.
• Warm extremes across North America are projected to become both more frequent and longer.
• Annual-mean precipitation is projected to decrease in the southwestern United States, but increase over the rest of the continent.
• Widespread increases in extreme precipitation will occur, with greater risks of not only flooding from intense precipitation, but also droughts from greater temporal variability in precipitation. In general, projected changes in precipitation extremes are larger than changes in annual-mean precipitation.
The AR4 notes the major projected impacts on water resources to be “effects on water resources relying on snowmelt; effects on some water supplies,” and states that “warming in western mountains is projected to cause decreased snowpack, more winter flooding and reduced summer flows, exacerbating competition for over-allocated water resources” (IPCC, 2007).
12 DRAFT – November 2011
Summary of Potential Climate Change Projections and Impacts on the Study Area Resources
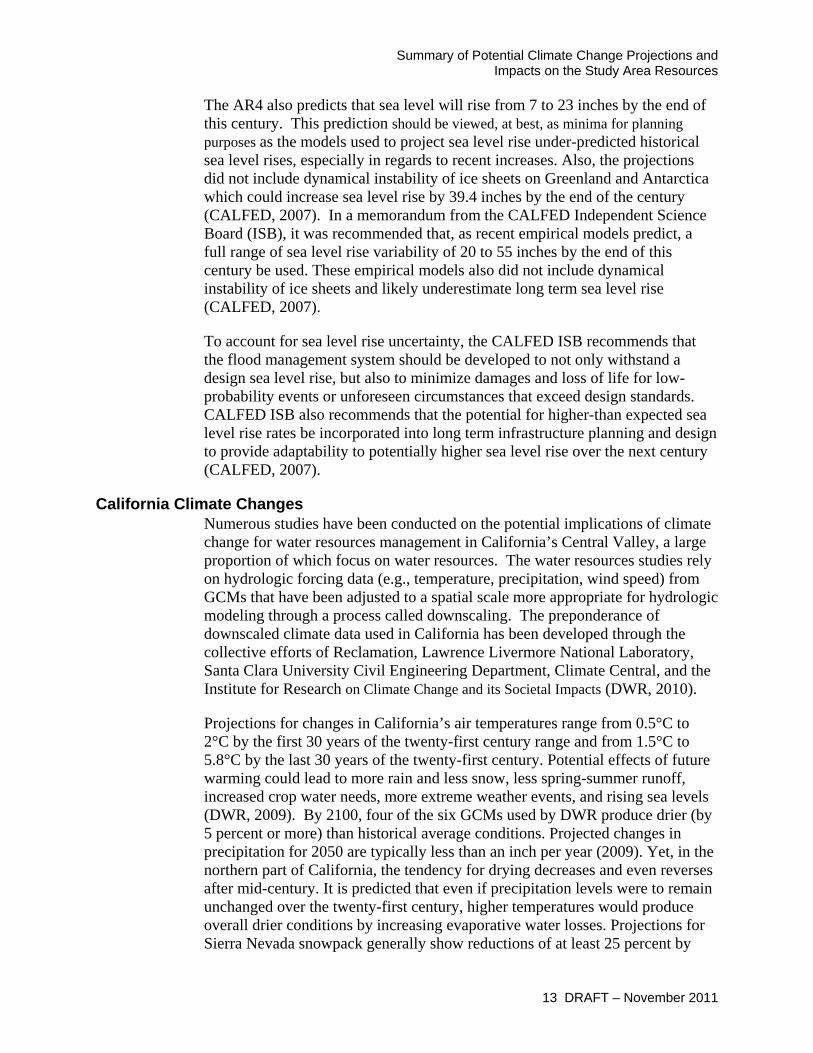
The AR4 also predicts that sea level will rise from 7 to 23 inches by the end of this century. This prediction should be viewed, at best, as minima for planning purposes as the models used to project sea level rise under-predicted historical sea level rises, especially in regards to recent increases. Also, the projections did not include dynamical instability of ice sheets on Greenland and Antarctica which could increase sea level rise by 39.4 inches by the end of the century (CALFED, 2007). In a memorandum from the CALFED Independent Science Board (ISB), it was recommended that, as recent empirical models predict, a full range of sea level rise variability of 20 to 55 inches by the end of this century be used. These empirical models also did not include dynamical instability of ice sheets and likely underestimate long term sea level rise (CALFED, 2007).
To account for sea level rise uncertainty, the CALFED ISB recommends that the flood management system should be developed to not only withstand a design sea level rise, but also to minimize damages and loss of life for low-probability events or unforeseen circumstances that exceed design standards. CALFED ISB also recommends that the potential for higher-than expected sea level rise rates be incorporated into long term infrastructure planning and design to provide adaptability to potentially higher sea level rise over the next century (CALFED, 2007).
California Climate Changes Numerous studies have been conducted on the potential implications of climate change for water resources management in California’s Central Valley, a large proportion of which focus on water resources. The water resources studies rely on hydrologic forcing data (e.g., temperature, precipitation, wind speed) from GCMs that have been adjusted to a spatial scale more appropriate for hydrologic modeling through a process called downscaling. The preponderance of downscaled climate data used in California has been developed through the collective efforts of Reclamation, Lawrence Livermore National Laboratory, Santa Clara University Civil Engineering Department, Climate Central, and the Institute for Research on Climate Change and its Societal Impacts (DWR, 2010).
Projections for changes in California’s air temperatures range from 0.5°C to 2°C by the first 30 years of the twenty-first century range and from 1.5°C to 5.8°C by the last 30 years of the twenty-first century. Potential effects of future warming could lead to more rain and less snow, less spring-summer runoff, increased crop water needs, more extreme weather events, and rising sea levels (DWR, 2009). By 2100, four of the six GCMs used by DWR produce drier (by 5 percent or more) than historical average conditions. Projected changes in precipitation for 2050 are typically less than an inch per year (2009). Yet, in the northern part of California, the tendency for drying decreases and even reverses after mid-century. It is predicted that even if precipitation levels were to remain unchanged over the twenty-first century, higher temperatures would produce overall drier conditions by increasing evaporative water losses. Projections for Sierra Nevada snowpack generally show reductions of at least 25 percent by
13 DRAFT – November 2011

Shasta Lake Water Resources Investigation Climate Change Projection Appendix
2050. Relatively less certain statements are offered about future precipitation-related events (e.g., changes in location, timing of precipitation, frequency of heavy precipitation events) (DWR, 2009).
The studies conducted by Reclamation (2008a) and DWR (2006; 2009) quantify potential changes in the reliability of California’s water resources that could result from the range of climate change projections. The central findings are consistent, and are described by topic area in the following subsections.
Annual Natural Runoff Changes in the timing and volumes of total annual runoff vary across models, studies, and projection periods. Table 4 summarizes Reclamation’s most recent evaluation of climate projections for the Sacramento River’s headwaters (2011a) and shows slight increases in precipitation for the Sacramento River through the mid-century, with a slight decline by the end of the century (relative to 1990 conditions). Over the past century, trends show that total water year runoff in the Sacramento Valley has remained about the same (DWR, 2009).
Monthly Distribution of Natural Runoff Predicted levels of warming would cause seasonality shifts, wherein a greater fraction of annual runoff occurs during periods of high precipitation (winter and early spring) and streamflows diminish during late spring and summer as a result of reductions to snow accumulation. Trends over the past century demonstrate a trend toward seasonality shifts. In the Sacramento Valley, the volume of runoff supported by snowmelt (represented by the fraction of annual runoff occurring between April and July) has already declined about 9 percent (Table 3) (DWR, 2006).
Table 4. Mean of Projected Changes for Sacramento River at Bend Bridge, near Red Bluff, and Contributing Watershed
Decade Change in
Precipitation (%)
Change in Mean
Temperature(°F)
April 1 SWE (%)
Runoff
Annual (%)
Dec–Mar (%)
Apr–Jul (%)
2020s 1.47 1.28 -61.2 3.28 7.01 -8.76 2050s 1.85 3.09 -85.22 4.11 11.63 -17.7 2070s -1.69 4.28 -98.16 -3.77 8.56 -30.87 Source: Reclamation, 2011a Key: % = percent change with respect to global climate around the 1990s °F= change in degrees Fahrenheit, with respect to global climate around the 1990s SWE = Snow water equivalent, representing the volume of water stored in snow
14 DRAFT – November 2011
Summary of Potential Climate Change Projections and Impacts on the Study Area Resources
Reservoir and River Water Temperatures Increases in mean-annual air temperature may also increase reservoir and river water temperatures. Changes in mean-annual precipitation toward wetter or drier conditions may offset or reinforce air temperature warming effects on reservoir and river water temperatures. Another potential change resulting from reductions in snowmelt and higher air temperatures is a change in the natural profile of river temperatures throughout the year. Increases in river temperatures could lead to increased water temperature of reservoir inflow, and reduction in “cold-water” supply (i.e., reservoir volume with water temperature less than the threshold temperature) at the beginning of the summer-fall stream temperature management season (Reclamation, 2008a). Additionally, one consequence of warmer rivers and streams would be less water available for ecosystem flow and temperature needs in the spring and summer. This could require dedication of more water, especially cold water stored behind reservoirs, to maintain existing fish habitat (DWR, 2009).
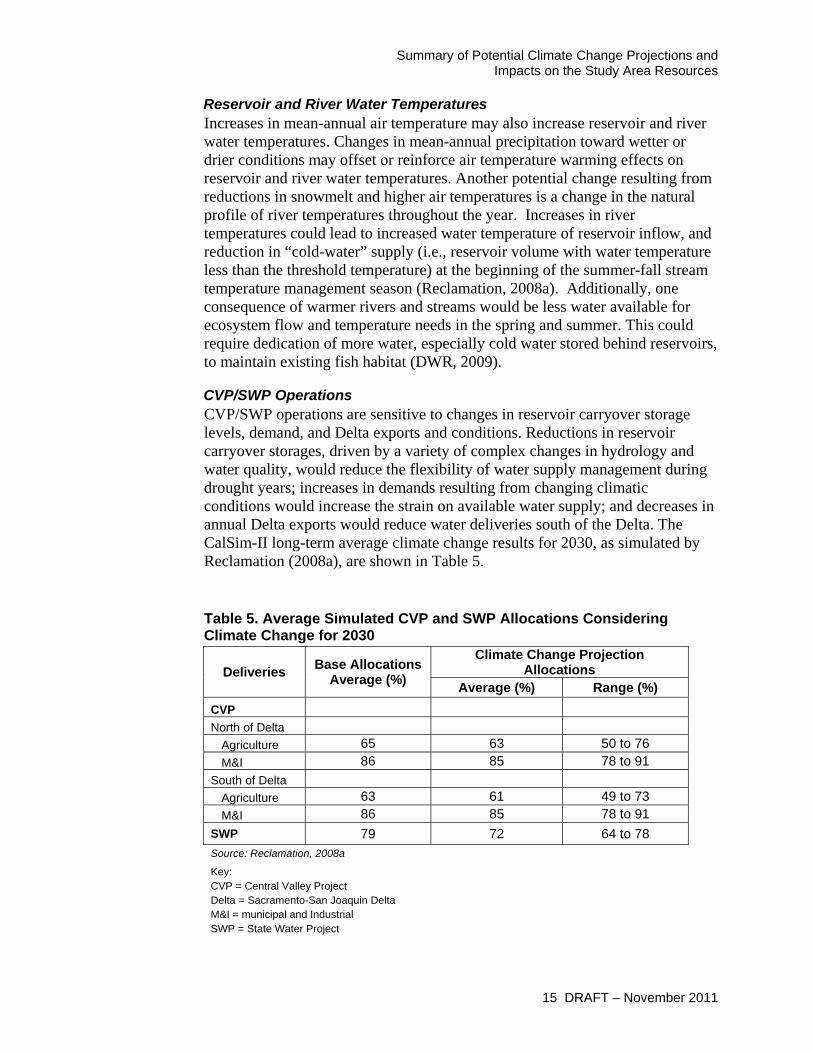
CVP/SWP Operations CVP/SWP operations are sensitive to changes in reservoir carryover storage levels, demand, and Delta exports and conditions. Reductions in reservoir carryover storages, driven by a variety of complex changes in hydrology and water quality, would reduce the flexibility of water supply management during drought years; increases in demands resulting from changing climatic conditions would increase the strain on available water supply; and decreases in annual Delta exports would reduce water deliveries south of the Delta. The CalSim-II long-term average climate change results for 2030, as simulated by Reclamation (2008a), are shown in Table 5.
Table 5. Average Simulated CVP and SWP Allocations Considering Climate Change for 2030
Deliveries Base Allocations Average (%)
Climate Change Projection Allocations
Average (%) Range (%) CVP North of Delta
Agriculture 65 63 50 to 76 M&I 86 85 78 to 91
South of Delta Agriculture 63 61 49 to 73 M&I 86 85 78 to 91
SWP 79 72 64 to 78 Source: Reclamation, 2008a
Key: CVP = Central Valley Project Delta = Sacramento-San Joaquin Delta M&I = municipal and Industrial SWP = State Water Project
15 DRAFT – November 2011

Shasta Lake Water Resources Investigation Climate Change Projection Appendix
Delta Flows Results showed that spring flows at the head of Old River are most affected by the wetter/warmer climate change conditions, which lead to increased flows during wetter years and decreased flows during drier years (Reclamation, 2008a). Sea level rise could affect Delta conditions and, therefore would affect water deliveries, yet these effects may be offset by increased upstream runoff and Delta outflow if climate change results in wetter conditions (Reclamation, 2008b).
Flood Management Flood management requires considering potential changes in extreme precipitation and runoff events. These extremes are difficult to project for a variety of reasons. GCMs operate on long time-steps (months) with relatively large spatial scales that ignore regional and local precipitation patterns and such data are not suitable to investigate peak flow runoff changes associated with climate change. The climate change studies also use a statistical process to modify historically-based reservoir inflows; thus the climate change scenarios preserve the historical hydrologic variability and do not reflect any potential changes in the frequency of extreme events. Additionally, human settlement patterns and water-management choices influence flood events substantially, and in a manner that is difficult to simulate (DWR, 2006). The Climate Change Task Force predicted that climate warming could result in more intense rainstorms, an increased occurrence of high-intensity rainfall, and earlier melting of seasonal snowpack; more events of rain or snow are expected consequences of climate change and may create more frequent and severe flooding associated with lakes and rivers (DOI, 2008). DWR suggests that higher snowlines may increase the frequency of flooding due to more frequent occasions of large-scale rainfall runoff. The magnitude and frequency of winter floods may increase because of temperature increases, even if precipitation patterns match historical climates. Temperature increases in the upper watershed areas will reduce the total area receiving snowfall, thus increasing the effective area receiving rainfall and generating runoff and increasing the magnitude of flood peaks. The frequency of floods may also increase because warming-induced “winter drizzles” of intermittent snowmelt into highland soils will maintain soil conditions that are more likely to generate runoff, even with low rainfall (DWR, 2009).
Agricultural Water Demand Future demand for agricultural water varies. A warming climate may lead to increased evapotranspiration rates from plants, soils, and open water surfaces. Net evaporation from reservoirs is projected to increase by 37 percent in a warmer-drier climate, but only by 15 percent in a warmer-only conditions, reducing available supplies accordingly, increased irrigation needs, increased agricultural water demands due to a longer growing season, and increased urban water use (Mastrandrea et. al, 2009). Studies show that a temperature increase of 3°C will result in a 5 percent increase in plant transpiration, unless there is a compensating decrease in solar radiation or other component of the plant energy
16 DRAFT – November 2011
Summary of Potential Climate Change Projections and Impacts on the Study Area Resources
budget (Hidalgo et al., 2005). Other factors related to climate change, such as possible changes in humidity, cloudiness, wind, and carbon dioxide could also affect evapotranspiration rates (DWR, 2006).
Changes in crop type, planting cycles, planting times, and crop productivity may occur as the result of climate change, although consensus has not been reached on how climate change would influence crops. Reclamation (Flores et al., 2011) predicts complex changes in crop demand and yield resulting from plant responses to climate change (including steady increases in atmospheric CO2 concentrations), which may increase yield and demand by the mid-century, but declines overall by 2100. DWR results suggest that climate change will decrease crop yields in the long-term, particularly for cotton, unless future climate change is minimized and/or adaptation of management practices and improved cultivars becomes widespread (DWR, 2009). Average projections for most of the studied crops indicate negative trends out to 2050, ranging from less than 5 percent decreases for table grapes production to nearly 20 percent average loss for cherries production by 2050 considering the effects of projected changes in average monthly minimum and maximum temperature and precipitation (DWR, 2009). However, demands could decrease because of increases in precipitation and water use adaptation strategies.
Water Quality Water quality may decrease because increasing air temperatures may lead to increased water temperature and, thus, potential for algal blooms, which can further reduce oxygen levels. Sea level rise may lead to saltwater intrusion into estuaries, bays, and coastal groundwater, and may change water quality and reduce freshwater supplies. Additionally, the Climate Change Task Force concluded that decreases in the volume of water, whether due to reduced precipitation or increased evapotranspiration, could increase the concentration of dissolved solids and chemical contaminants in rivers and lakes. Any increase in high-intensity storms may also wash from the land and transport more contaminants to bodies of water (DOI, 2008).
Energy The effect of climate change on energy production and consumption depends on changes in hydrology, operational requirements, and deliveries from the Delta. Both power generation and power use by the CVP and SWP are anticipated to decrease under climate change if both water deliveries and the storage of winter inflows decline (DWR, 2009).
Changes on Upper Sacramento River and at Shasta Lake Both Reclamation (2008a) and DWR (2006) studied how climate change affected operations of the CVP/SWP (including at Shasta Lake), assuming that adaptation to climate change had not occurred. Predicted changes in hydroclimatic variables were found to affect Shasta Lake independently, and also through effects of climate change on the CVP/SWP as a whole. Major findings are described by topic area in the following subsections.
17 DRAFT – November 2011

Shasta Lake Water Resources Investigation Climate Change Projection Appendix
Monthly Natural Runoff Monthly inflow into Shasta Lake is expected to increase in winter and early spring. The monthly inflow without climate change (base) and with climate change (scenario average) effects is shown in Figure 2. Average monthly inflows are based on the four scenarios studied in the 2008 Reclamation report and the four scenarios studied in the 2006 DWR report1 for 2030. The error bars show the range of inflows projected by the eight climate change scenarios.
0
200
400
600
800
1,000
1,200
1,400
OCT NOV DEC JAN FEB MAR APR MAY JUN JUL AUG SEP
Mon
thly Average
Reservoir Inflo
w (TA
F)
Base Climate Scenarios
Source combination of data from DWR, 2006, and Reclamation, 2008a Note: Error bars represent the range of average monthly inflows projected by the four Reclamation and four DWR scenarios. 1 Mean monthly value during CalSim-II simulation years from 1922-1994 (for Reclamation studies) and 1922-2003 (for
DWR studies). Figure 2. Average Monthly Inflows1 to Shasta Lake With and Without Climate
Change for 2030
Annual Natural Runoff Reclamation studies on A1 and A2 emissions (2008) show increases for Shasta Lake inflows through the mid-century, mostly stemming from predicted increases in annual precipitation in contributing upstream watersheds (Table 6). However, the composite prediction for runoff in Northern California, among all emissions scenarios, shows a possible decline in both precipitation and runoff by the 2070s (Figure 3; Reclamation, 2011a).
1 Data from the DWR 2006 report was used in lieu of the 2009 report as numerical values were available.
18 DRAFT – November 2011

Summary of Potential Climate Change Projections and Impacts on the Study Area Resources
Table 6. Percent Change in Annual Inflow to Shasta Lake
Study Precipitation Change (Percent)1
Temperature Change (°F)1 Percent Change
Study 9.2 14 0.8 16 Study 9.3 14 2.9 15 Study 9.4 -11 0.8 2 Study 9.5 -11 2.9 -8 Source: Reclamation, 2008a
Notes: 1 Represents the change in 30-year-mean annual precipitation or temperature (2011-2040 mean from
1971-2000 mean). Key °F = degrees Fahrenheit
Source: Reclamation, 2011a
Figure 3. Median Percent Change in Annual Runoff for 2070s, Compared to 1990s
Reservoir Storage Climate change induces shifts in inflow will likely lead to changes in the storage volume and operation of California’s reservoirs. Reclamation (2008a) and DWR (2006) predict various changes in the timing and volume of Shasta Lake storages, but a consistently reduced end-of-September carryover storage. The long-term mean simulated end-of-September storage at Shasta Lake is 2,721 thousand acre-feet (TAF) without climate change or sea level rise. Considering climate change and sea level rise scenarios, mean end-of-September Shasta Lake storage ranges from 2,292 TAF to 2,896 TAF (Figure 4). A significant drop in ability to maintain the 3,400 TAF end-of-September target is also predicted (Reclamation, 2008a).
19 DRAFT – November 2011

Shasta Lake Water Resources Investigation Climate Change Projection Appendix
0
500
1000
1500
2000
2500
3000
3500
4000
0%10%20%30%40%50%60%70%80%90%100%
Probability of Exceedence
Stor
age
(TAF
)
Sty9.0 Base Without 1' Sea Level Change Sty9.1 Base With 1' Sea Level ChangeSty9.4 Drier, Less Warming Sty9.2 Wetter, Less WarmingSty9.5 Drier, More Warming Sty9.3 Wetter, More Warming
Source: (Reclamation, 2008)
Figure 4. Shasta Lake End of September Exceedence for 2030
Climate change may also reduce storage in Shasta Lake to its dead pool in some critical years, meaning that the reservoir has no accessible storage and release rates are limited to the sum of instantaneous lake inflows minus lake evaporation. The 2006 DWR report simulated the number of months of critical storage (i.e., when Shasta Lake storage is at dead pool) for various climate change models (Table 7).
Table 7. Months of Critical Shasta Lake Storage Emissions Scenario
General Circulation Model
Months at Critical Storage
Historical N/A 1 A2 GFDL 31 A2 PCM 29 B1 GFDL 21 B1 PCM 0 Source: DWR, 2006 Key: GFDL = Geophysical Fluid Dynamic Lab model N/A = not applicable PCM = Parallel Climate Model
Reservoir Temperature The cold-water pool is expected to be lower in Shasta Lake considering climate change trends. Wetter conditions result in a general tendency for greater cold-water pool volumes than the drier climate scenarios. Regardless, all climate change projections resulted in reduced cold-water pool-volumes (Reclamation, 2008a).
20 DRAFT – November 2011

Summary of Potential Climate Change Projections and Impacts on the Study Area Resources
These potential changes to Shasta Lake may affect water supply, flood management, power generation, fish conservation, and Delta water quality.
Water Supply The availability of water supply is closely related to the natural water storage mechanism of reservoirs. Warmer temperatures may lead to changes in the timing, amount, and form of precipitation, changes in runoff timing and volume, sea level rise effects on Delta water quality, and changes in demand (DWR, 2006). Warmer conditions may increase water supply demands, with changes in crop and landscape irrigation; domestic, industrial, and commercial water use, evaporation water use; environmental water requirements; population; and agricultural practices. For example, an increase in temperature typically increases domestic water use because of the increased use of evaporative cooling, increased bathing, etc. Decreases in snowmelt runoff and increases in flood intensity could reduce the flexibility of water supply management. The loss of flexibility could lead to lower carry-over supplies, which reduces available supplies during drought years, leading to an increase in frequency of critical storage conditions and water supply shortfalls. Rising mean sea levels could increase saltwater intrusions into the Delta, which would reduce CVP deliveries and decrease annual Delta exports, thereby reducing water deliveries to CVP and SWP customers south of the Delta. Additionally, CVP deliveries may change to balance the allocation of CVP water supplies to satisfy current-year water demands and reservation of supplies to reduce the impacts of prolonged droughts.
Flood Management Projected changes in climate include increases in the frequency and magnitude of runoff events. The response of Shasta Lake to these changes varies, depending mostly upon the predicted changes in precipitation. Figure 5 shows the frequency of flood releases at Lake Shasta for a range of emissions scenarios and GCMs (DWR, 2006). Increases in extreme precipitation events, coupled with shifts in timing of reservoir inflow, could affect the reservoir’s ability to meet both flood control and water supply objectives. The design flood and flood control curves, which specify flood control operations, may need to change to accommodate larger storms and shifts in Shasta Lake inflows.
21 DRAFT – November 2011

Shasta Lake Water Resources Investigation Climate Change Projection Appendix
Source: DWR, 2006
Figure 5. Monthly Flood Control Frequency at Shasta Lake for 2030
Fish Conservation As described above, climate change induced shifts in Shasta Lake operations may reduce the end-of-September carryover storages. A decrease in Shasta Lake carryover storage could lead to some months when minimum instream flow requirements cannot be maintained. The cold-water pool is also expected to be lower in Shasta Lake considering climate change trends. Wetter conditions result in a general tendency to have greater cold-water pool volumes than the drier conditions, but increases in temperature (regardless of wetter or drier conditions) lead to reductions in cold-water volumes when compared to current conditions. A decrease in cold-water pool volume would compromise temperature goals for Shasta Lake releases, intended for improving habitat for winter-run Chinook salmon.
New fish habitat could become available as storms become more frequent and severe; however, reductions in spring and summer runoff in addition to changes in the temperature of spring and summer flow could have a degrading effect on overall aquatic habitat (NMFS, 2009).
Power Generation Climate warming is expected to raise the minimum altitude at which snow begins to accumulate in the Sierra Nevada Range, resulting in more abundant winter runoff and decreases in snow accumulation. Higher winter rainfall and reduced snow volumes will increase the portion of total annual runoff volume that occurs in the winter. Thus, more annual runoff will likely be passed through reservoirs at the time of the rainfall, in the winter, and will not be available for hydropower production later in the year. Less water in the reservoirs would
22 DRAFT – November 2011

Summary of Potential Climate Change Projections and Impacts on the Study Area Resources
also correlate to a decrease in CVP and SWP deliveries due to a lack of available water. This would result in a decrease in power demand and, therefore, power generation.
Delta Water Quality Many climate change scenarios predict a rise in sea level. This could result in increased salinity concentrations in the Delta, as quantified based on the X2 location. X2 refers to the geographic location of a 2 parts-per-thousand isohaline (contour line of equal salinity) in the Delta, in kilometers distance from the Golden Gate Bridge. SWRCB specifications for X2 locations approximate acceptable habitat conditions, and partly regulate water supply extractions from the Delta. X2 locations are particularly sensitive to mean sea level, and therefore predictions of sea level rise.
Taking into consideration a 1 foot increase in mean sea level, the X2 position moves further inland for drier scenarios and closer to the Golden Gate Bridge wetter scenarios. The impact to the X2 position from a change in sea level rise varies from 1 km to 3 km (Reclamation, 2008). A change in water quality in the Delta would force increased upstream release of stored water to maintain Delta water quality requirements while operating to meet Delta export objectives. A change in Delta conditions coupled with a change in Shasta Lake storage (resulting from a change in precipitation) may affect the reservoir’s ability to protect the Delta from saline intrusion.
Crop Demands As described above, a warming climate might be expected to increase crop water needs, agricultural water demands due to a longer growing season, and urban water use. An increase in crop demands coupled with reductions in Shasta Lake carryover storage could result in crop demands not being met. However, demands could decrease because of increases in precipitation and water use adaptation strategies.
23 DRAFT – November 2011
Shasta Lake Water Resources Investigation Climate Change Projection Appendix
24 DRAFT – November 2011
This page left blank intentionally.
References
References California Department of Water Resources (DWR). 2006. Progress on
Incorporating Climate Change into Management of California’s Water Resources. Technical Memorandum Report. California Department of Water Resources. Available at http://baydeltaoffice.water.ca.gov/climatechange.cfm. Accessed April 4, 2011.
⎯⎯⎯. 2009. Climate Action Team Report to the Governor and Legislature. Available at http://www.climatechange.ca.gov/publications/cat/index.html. Accessed April 4, 2011.
⎯⎯⎯. 2010. Climate Change Characterization and Analysis in California Water Resources Planning Studies. Final Report. December.
CALFED. See CALFED Independent Science Board.
CALFED Independent Science Board (CALFED). 2007. Sea Level Rise and Delta Planning. Memorandum to Michael Healey, Lead Scientist of the CALFED Bay-Delta Program. September 6, 2007.
California Energy Commission (CEC). 2006. Inventory of California Greenhouse Gas Emissions and Sinks: 1990 to 2004. (Staff Final Report). Publication CEC-600-2006-013-SF. Available: <http://www.climatechange.ca.gov/policies/ greenhouse_gas_inventory/index.html> and <http://www.energy.ca.gov/global_ climate_change/inventory/documents/index.html>. Last updated July 2008. Accessed April 20, 2009
DOI. See U.S. Department of the Interior, Task Force on Climate Change.
DWR. See California Department of Water Resources.
Flores, F., C. Young, M. Tansey, A. Munevar, and D. Yates. 2011. Modeling effects of climate on Agricultural Water Demands and Crop Yields. Presentation at California Water and Environmental Modeling Forum.
Hidalgo, H.G., D.R. Cayan, and M.D. Dettinger. 2005. Sources of Variability of Evapotranspiration in California. Journal of Hydrometeorology, 6. 3-19.
25 DRAFT – November 2011

Shasta Lake Water Resources Investigation Climate Change Projection Appendix
Intergovernmental Panel on Climate Change (IPCC). 2000. Special Report on Emissions Scenarios. (Nakicenovic, N., R. Swart, (eds.)) Cambridge University Press, Cambridge, United Kingdom, and New York, New York. 612 pp.
⎯⎯⎯. 2007. IPCC Fourth Assessment Report: Climate Change 2007. Available at http://www.ipcc.ch/publications_and_data/publications_and_data_reports.shtml. Accessed April 4, 2011.
IPCC. See Intergovernmental Panel on Climate Change.
Mastrandrea, Michael D., Claudia Tebaldi, Carolyn P. Snyder, and Stephen H. Schneider. 2009. Current and Future Impacts of Extreme Events in California. PIER Research Report, CEC-500-2009-026-D, Sacramento, CA: California Energy Commission.
Miller, N.L, K.E. Bashford, and E. Strem. 2001. Climate Change Sensitivity Study of California Hydrology: A Report to the California Energy Commission, Lawrence Berkeley National Laboratory technical Report No. 49110.
National Marine Fisheries Service (NMFS). 2009. Public Draft Recovery Plan for the Evolutionary Significant Units of Sacramento River Winter-Run Chinook Salmon and Central Valley Spring-Run Chinook Salmon and the Distinct Population Segment of Central Valley Steelhead. Sacramento, California. October.
NMFS. See National Marine Fisheries Service.
Reclamation. See U.S. Department of the Interior, Bureau of Reclamation.
U.S. Department of the Interior, Bureau of Reclamation. 2008a. Central Valley Project and State Water Project Operations Criteria and Plan Biological Assessment. Mid-Pacific Region. Sacramento, California. May.
⎯⎯⎯. 2008b. Sensitivity of Future CVP/SWP Operations to Potential Climate Change and Associated Sea Level Rise,” Appendix R in Biological Assessment on the Continued Long-term Operations of the Central Valley Project and the State Water Project.
⎯⎯⎯. 2011a. West-Wide Climate Risk Assessments: Bias-Corrected and Spatially Downscaled Surface Water Projections. Technical Memorandum No. 86-68210-2011-01. 138 pp.
⎯⎯⎯. 2011b. SECURE Water Act Section 9503(c) – Reclamation Climate Change and Water 2011.
26 DRAFT – November 2011
References
U.S. Department of the Interior, Task Force on Climate Change (DOI). 2008. Report of the Subcommittee on Land and Water Management. An Analysis of Climate Change Impacts and Options Relevant to the Department of the Interior’s Managed Lands and Waters.
27 DRAFT – November 2011

Shasta Lake Water Resources Investigation Climate Change Projection Appendix
28 DRAFT – November 2011
This page left blank intentionally.