Appendix C. Hydrology Modeling Report for Settlement Agreement · Model Evaluation of the...
25
Appendix C. Hydrology Modeling Report for Settlement Agreement
Transcript of Appendix C. Hydrology Modeling Report for Settlement Agreement · Model Evaluation of the...

Appendix C. Hydrology Modeling Report for Settlement Agreement

New Mexico Interstate Stream Commission
Model Evaluation of the Adjudication Settlement Agreement
Re: State ex rel State Engineer v. L.T. Lewis, et al. Pecos Settlement
Expert Report
Prepared by:
John Carron, Ph.D.
Hydrosphere Resource Consultants, Inc.
March 10, 2003
Revised: September 27, 2004

Model Evaluation of the Adjudication Settlement Agreement – Expert Report September 27, 2004
- 1 -
Introduction (March 10, 2003)
As part of the Pecos River Adjudication Settlement Negotiations, Hydrosphere was
asked to perform model simulations of the proposed Pecos River adjudication settlement
terms. The parties to the adjudication negotiations were interested in understanding how
the settlement terms would translate into actual water operations, and how those modified
operations would impact water supply to the various water users in the Pecos River basin.
This report provides a brief background on the modeling tools, discusses how the
adjudication settlement terms were translated into modeling assumptions and rules,
outlines the analysis process including definition of the resources of interest, and presents
the results of the analysis.
Introduction (September 27, 2004)
During the summer of 2004, the Interstate Stream Commission (ISC) asked
Hydrosphere to re-evaluate the terms of the Adjudication Settlement using updated
versions of the modeling tools used in the original report of March 10, 2003. The
rationale for these additional modeling activities was set forth in Section 3 of the
Settlement Agreement.
The original modeling tools have been updated and enhanced as part of several
ongoing efforts, including two NEPA EIS programs and the Adjudication Settlement
program itself. The models and associated data management tools have been reviewed
by several entities involved in these processes, including the Bureau of Reclamation, U.S.
Fish and Wildlife Service, the New Mexico State Engineer’s Office and Interstate Stream
Commission, and various private contractors to these and other interested parties.
Modeling Tools and Processes
A suite of models was used to evaluate the impacts of the proposed settlement
terms. The models include a RiverWare model of river and reservoir operations between
Santa Rosa Reservoir and Avalon Dam, two MODFLOW groundwater models of the

Model Evaluation of the Adjudication Settlement Agreement – Expert Report September 27, 2004
- 2 -
Roswell and Carlsbad groundwater basins (the RABGW and CAGW models,
respectively), a Pecos River Compact accounting model, and various pre- and post-
processing tools for performing data input/output functions and post-run analyses. A
schematic of the spatial extent of the Pecos basin represented by the models is shown in
Figure 1.
Pecos River RiverWare
Model
Roswell Artesian Basin Groundwater Model
Carlsbad Area Groundwater
ModelRed Bluff
Accounting Model
Santa Rosa Reservoir
Brantley Reservoir
NM / TX State Line
Pecos River RiverWare
Model
Roswell Artesian Basin Groundwater Model
Carlsbad Area Groundwater
ModelRed Bluff
Accounting Model
Santa Rosa Reservoir
Brantley Reservoir
NM / TX State Line Figure 1. Spatial Extent of the Pecos River Modeling Tools.

Model Evaluation of the Adjudication Settlement Agreement – Expert Report September 27, 2004
- 3 -
Model Objectives and Assumptions
The purpose of this modeling exercise is to evaluate the impact of the Pecos River
Adjudication Settlement agreement. The agreement anticipates a combination of land
retirement and groundwater pumping with the objectives of: a) permanent compliance
with the Pecos River Compact and Amended Decree and, b) avoiding the need for
priority administration of water in the basin. Central to achieving these objectives is
meeting certain threshold levels of water supply for the Carlsbad Irrigation District
(CID). Maintaining these threshold levels is important because of CID’s seniority in the
basin (the need to avoid a water rights “call”) and because water supply shortfalls have a
direct impact to stateline flows, and hence Compact compliance.
Two model scenarios were developed for this evaluation. The Baseline scenario, as
the name suggests, represents a baseline condition against which proposed actions may
be evaluated. However, it only represents those conditions or activities in the basin
which are permanent; thus, ongoing temporary leases of water by the ISC and bypass
operations for ESA compliance are not considered part of the baseline. The second
scenario - termed the Settlement scenario herein - simulates the operation of the system
under the Pecos river Adjudication Settlement agreement (the Settlement). The
Settlement scenario is essentially a translation of the Settlement agreement into model
rules and data. Simulation of the two scenarios, and evaluation of their results, provides
an estimate of the changes in water supply that is expected when the Settlement
agreement is implemented.
The models rely on historical hydrology for inputs, with current or proposed
operational rules superimposed on the hydrologic record. The models are reliable for
estimating the long-term impact of implementing a proposed action, but they should not
be used in any sense to predict water supply conditions at specific times and locations.
As stated previously, the Baseline scenario is intended to reflect the current
operations of the system, minus any ongoing short-term leases or modified operations.

Model Evaluation of the Adjudication Settlement Agreement – Expert Report September 27, 2004
- 4 -
The Settlement scenario is based largely on the Baseline scenario, with certain modified
operations. Model assumptions common to both scenarios include:
• Models are based on current / proposed operations and historical hydrology
(1967-1996).
• January 1, 2004 reservoir storage levels are used as initial condition for all
simulation runs.
• January 1, 2000 aquifer heads are used as initial conditions in the Carlsbad
Area Ground Water model.
• January 1, 2000 aquifer heads are used as initial conditions in the Roswell
Artesian Basin Ground Water model.
• No augmentation / bypass flows are allocated for the Pecos Bluntnose Shiner.
• Effects of permanent land retirements previously made through the PVACD
conservation program and NM ISC are included.
• Acme to Artesia base inflows are generated by the RABGW model, and are
based on combinations of historical and statistically generated pumping rates.
• No FSID lands were retired or leased for model runs.
• Total river pumper diversion rates are set at their combined decreed limit of
approximately 4,800 acre-feet per year.
• CID allotments are based on 25,055 acres.
• Willow Lake, Harroun, ISC purchased River Pumpers are retired.
The Baseline scenario includes all of the above assumptions, plus:
• The baseline scenario employs 1967 - 1996 historical pumping for the artesian
aquifer and alluvial pumping based on statistically-derived estimates using
data from 1991-2000.
• CID allotments are based on 25,055 acres. Delivery of CID water to 18,000
acres of irrigated land.
• CID supplemental well pumping limited to 3.0 acre-feet per acre at farm
headgate. Model assumes that 14,506 acres may be irrigated by supplemental
wells, per latest Hydrographic Survey of decreed lands.
• Avalon releases are due to conservation storage spills only.

Model Evaluation of the Adjudication Settlement Agreement – Expert Report September 27, 2004
- 5 -
The Settlement scenario is modified from the above as follows:
• The settlement scenario assumes the retirement of 11,000 acres in the Roswell
Basin; 3,000 acres irrigated by shallow aquifer, and 8,000 acres irrigated by
artesian aquifer.
• The settlement RABGW model uses modified stress files; retirement of
11,000 acres and augmentation pumping are distributed uniformly across both
the artesian and alluvial aquifers throughout Pecos Valley Artesian
Conservancy District (PVACD). Land retirement and augmentation pumping
is split between the artesian and alluvial aquifers in an 8:3 ratio (8,000 acres
artesian; 3,000 acres alluvial).
• Augmentation pumping in the Roswell basin, from retired PVACD lands, up
to 35,000 AF/year and 100,000 AF per 5-year accounting period, occurs when
CID divertable supplies at Avalon Reservoir are less than the prescribed target
supply volumes defined in the table below.
Table 1. CID Surface Water Supply Thresholds for Augmentation Pumping.
Target Date Target Supply
March 1 50,000 acre-feet
May 1 60,000 acre-feet
June 1 65,000 acre-feet
July 15 75,000 acre-feet
September 1 90,000 acre-feet
• The model accounts for the purchase of 6,000 acres in CID (by ISC), and
delivered or redistributed based on the logical rules below.
• CID allotments are based on 25,055 acres with delivery to 18,000 CID acres.
• CID supplemental well pumping limited to 3.697 acre-feet per acre at farm
headgate, per Settlement agreement. Model assumes that 14,506 acres may be
Model Evaluation of the Adjudication Settlement Agreement – Expert Report September 27, 2004
- 6 -
irrigated by supplemental wells, per latest Hydrographic Survey of decreed
lands.
• If there is a Compact delivery shortfall, remedy pumping occurs in the
Roswell basin and that water is delivered directly to the state line. This
pumping occurs in the fall and winter. A 10% transit loss is assumed for all
remedy water.
• The distribution of water from 6,000 acres of CID land purchased by ISC is
conditioned on the cumulative Compact credit and current water supply (ISC
water “yield” = 1.176 x allotment):
a. If CID irrigators’ supply < 50,000 acre-feet, ISC water is reallocated to
actively irrigated CID lands up to a total supply of 50,000 acre-feet. Once
the 50,000 acre-foot supply level has been reached, ISC may take delivery
of water until its allotment is equivalent to that of the irrigators.
b. If Compact credit < 50,000 acre-feet, and CID irrigators supply > 50,000
acre-feet, deliver ISC water to stateline 5x annually.
c. If 50,000 acre-feet < credit < 115,000 acre-feet, AND current supply <
90,000 acre-feet, ISC shall make its CID water available for re-distribution
to CID irrigators.
d. If 50,000 acre-feet < Compact credit < 115,000 acre-feet, AND current
CID supply > 90,000 acre-feet, ISC may take delivery of additional water
over 90,000 acre-feet until its allotment is equivalent to that of the
irrigators. Once ISC’s allotment is equal to the irrigators, water is alloted
to all 25,055 acres equally.
e. If credit > 115,000 acre-feet, ISC shall make its CID water available for
re-distribution to CID irrigators up to the decreed limit (3.697 acre-
feet/acre); If CID irrigators have their full allotment, excess water is held
over in storage.

Model Evaluation of the Adjudication Settlement Agreement – Expert Report September 27, 2004
- 7 -
Model Analysis and Resource Indicators
Several key resource indicators were identified to evaluate and compare the results
of the simulations. These include:
• Pecos river flows at Acme and Artesia.
• Augmentation pumping in the Roswell basin.
• Roswell basin aquifer storage.
• Base inflows in the Acme to Artesia reach.
• CID allotment and Main Canal deliveries.
• CID supplemental well pumping.
• Releases from Avalon Dam.
• Pecos River flow at the Red Bluff gage and total stateline deliveries.
• Pecos River compact obligations and departures. The results of the model simulations, based on the above resource indicators, are
discussed below.
Resource Indicator: Pecos River flows at Acme and Artesia
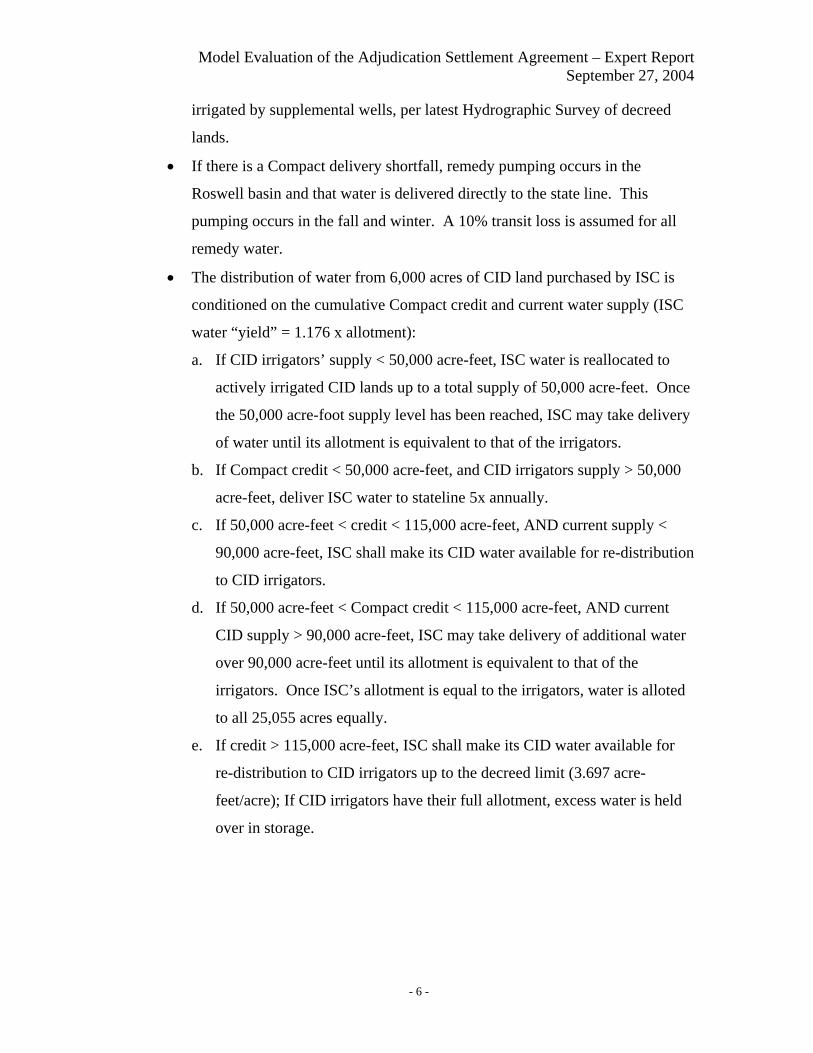
Flow statistics are generated from the RiverWare model at nodes representing the
“near Acme” and “near Artesia” gages (Figures 2 and 3). Augmentation pumping is
assumed delivered directly into Brantley Reservoir in the RiverWare model (with a 15%
transit loss). Previously, we had estimated the impacts of augmentation pumping on
flows at Artesia (Carron, 2003). However, it appears that much of the augmentation
pumping will occur below Artesia. In early drafts of the Settlement agreement, there was
a clause requiring a minimum flow at Artesia. This clause was not included in the final
agreement. We have therefore not included estimates of augmentation pumping on flows
at Artesia in this revised report.
Model Evaluation of the Adjudication Settlement Agreement – Expert Report September 27, 2004
- 8 -
Baseline SettlementMaximum 7356 6862Average 114 118Minimum 0 0
Acme Exceedence Values (cfs):50% 19.2 18.775% 10.0 9.790% 5.5 5.395% 3.4 3.399% 0.0 0.0
Acme Flow Statistics (cfs)
Figure 2: Flow Statistics at Acme.
Baseline SettlementMaximum 10230 10224Average 165 170Minimum 9 7
Artesia Exceedence Values (cfs):50% 75.9 75.975% 50.5 49.290% 30.1 29.095% 23.2 22.199% 15.9 14.1
Artesia Flow Statistics (cfs)
Figure 3: Flow statistics at Artesia.
Resource Indicator: Roswell Basin Aquifer Storage
Aquifer storage levels are derived from the RABGW model, and represent
departures in storage from a pre-development condition. Figures 4 and 5 show the
aquifer storage levels for both the artesian and shallow alluvial aquifers as a normalized
percentage of the estimated pre-development aquifer storage. Note that the general trend
for both aquifers is one of increasing storage throughout the simulation period, due to the
combined effects of retired PVACD lands and lower augmentation pumping
requirements. The simulations indicate that over the first 30 years following

Model Evaluation of the Adjudication Settlement Agreement – Expert Report September 27, 2004
- 9 -
implementation of the Settlement, the alluvial and artesian aquifers would recover
approximately 10% and 20%, respectively, compared to the baseline.
Layer 3 RABGW Model, Artesian AquiferPredevelopment Storage ~ 38.6 million acre-feet
-1.4%
-1.2%
-1.0%
-0.8%
-0.6%
-0.4%
1 4 7 10 13 16 19 22 25 28Year
Nor
mal
ized
Sto
rage
Def
icit
(Per
cent
Cha
nge
from
Pre
deve
lopm
ent S
tora
ge)
SettlementBaseline
Figure 4: Artesian Aquifer Storage. (Comparison of storage deficit for the baseline and settlement scenarios, normalized against pre-development storage conditions.)

Model Evaluation of the Adjudication Settlement Agreement – Expert Report September 27, 2004
- 10 -
Layer 1 RABGW Model, Alluvial AquiferPredevelopment Storage ~ 17.3 million acre-feet
-11.5%
-11.0%
-10.5%
-10.0%
-9.5%
-9.0%
-8.5%
-8.0%
1 4 7 10 13 16 19 22 25 28Year
Nor
mal
ized
Sto
rage
Def
icit
(Per
cent
Cha
nge
from
Pre
deve
lopm
ent S
tora
ge)
SettlementBaseline
Figure 5: Alluvial Aquifer Storage. (Comparison of storage deficit for the baseline and settlement scenarios, normalized against pre-development storage conditions.)
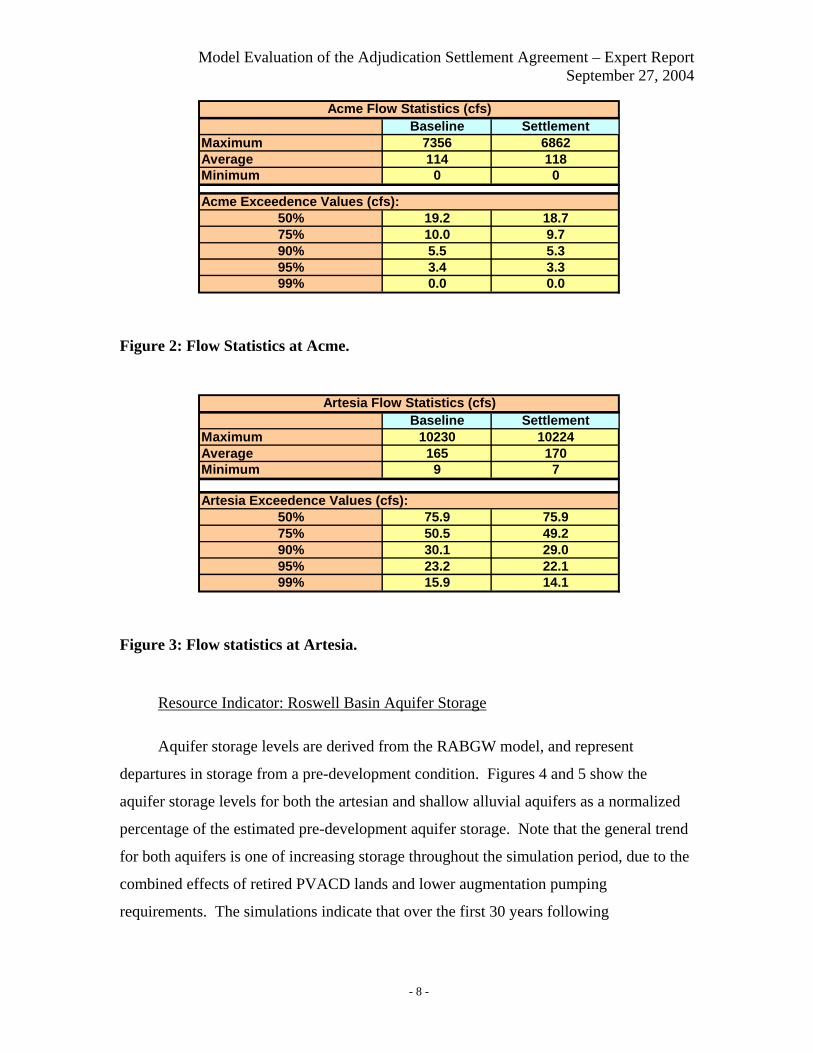
Resource Indicator: Base Inflows in the Acme to Artesia Reach
Base inflows between Acme and Artesia are generated from the RABGW model
and input to the RiverWare model as daily values. RABGW generates monthly average
flows, which are distributed evenly over the month when converting from monthly to
daily flow values. Annual volumes of baseflows from the RABGW model are shown in
Figure 6. The Settlement results indicate an initial reduction in baseflows as compared to
the baseline, due to significant augmentation pumping early in the simulation period,
followed by a recovery of baseflows to levels equal to and then greater than the baseline.
Over the long-term (i.e., beyond the 30-year simulation), we expect the baseflows to
continue to increase above what would be seen under the baseline.
Model Evaluation of the Adjudication Settlement Agreement – Expert Report September 27, 2004
- 11 -
Baseflows - Acme to Artesia
0
5,000
10,000
15,000
20,000
25,000
30,000
35,000
40,000
45,000
1 4 7 10 13 16 19 22 25 28Year
Ann
ual B
asef
low
(acr
e-fe
et)
Baseline: Average = 32852 AF
Settlement: Average = 32895 AF
Figure 6: Acme to Artesia Base Inflows.
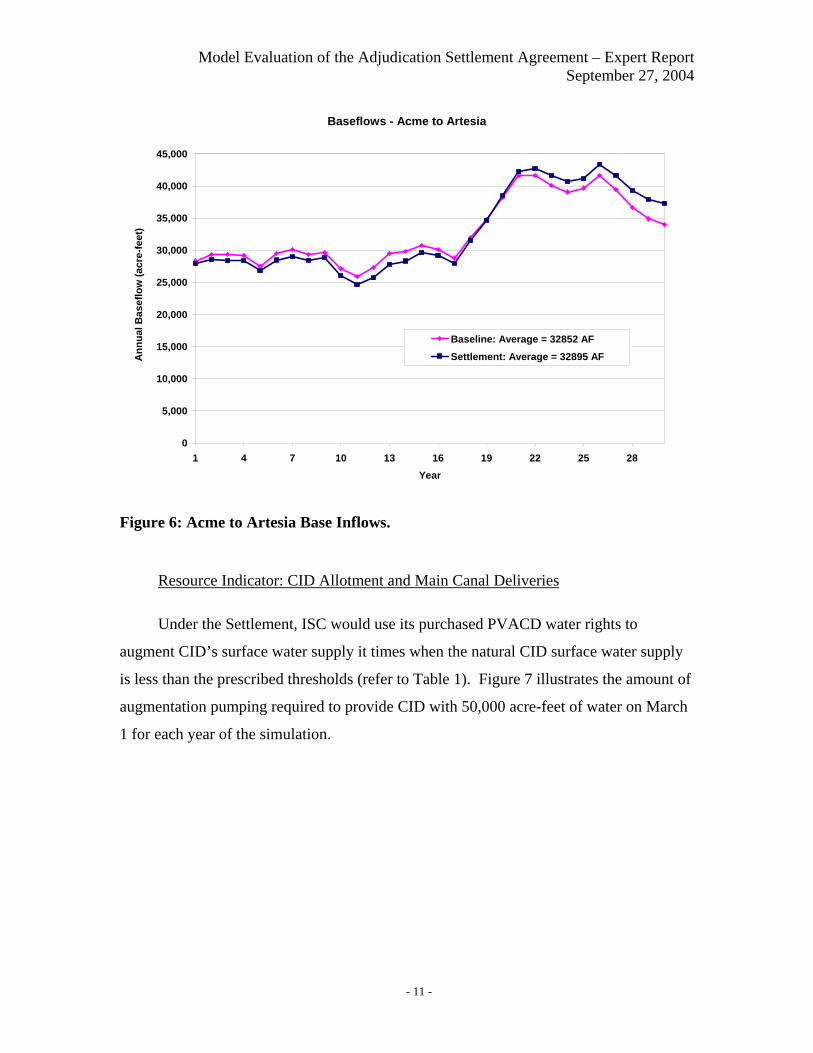
Resource Indicator: CID Allotment and Main Canal Deliveries
Under the Settlement, ISC would use its purchased PVACD water rights to
augment CID’s surface water supply it times when the natural CID surface water supply
is less than the prescribed thresholds (refer to Table 1). Figure 7 illustrates the amount of
augmentation pumping required to provide CID with 50,000 acre-feet of water on March
1 for each year of the simulation.

Model Evaluation of the Adjudication Settlement Agreement – Expert Report September 27, 2004
- 12 -
CID Surface Water Supply to meet March 1 Supply Targets(As measured at Brantley Reservoir)
0
20,000
40,000
60,000
80,000
100,000
120,000
140,000
1 4 7 10 13 16 19 22 25 28Year
Tota
l Sup
ply
at A
valo
n (a
cre-
feet
)
Augmentation from PVACD WellsPecos River Native Flow
March 1 shortfall due to 35,000 AF/year limit
March 1 shortfall due to 100,000 AF/ 5 year limit
Figure 7. Augmentation Pumping required to meet 50,000 AF March 1 Supply Target.
Total annual water supply, including augmentation pumping, is shown in figure 8.
The augmentation component of that supply is shown in figure 9. Note that in many
years, there is augmentation pumping even though the total supply exceeds 90,000 acre-
feet (Figure 8). In these years, the supply typically is low early in the year, which
triggers augmentation, but later increases due to large precipitation and flood events.
From figure 8, the impacts of the 35,000 acre-foot annual limit and 100,000 acre-foot 5-
year limit can clearly be seen. In years 1 and 11, for example, the 90,000 acre-foot
supply target cannot be met due to the annual augmentation pumping limit. Also
compare the values to targets for years 10, 14, and 15 where the total supply is less than
90,000 acre-feet because augmentation pumping is constrained by the 5-year 100,000
acre-foot limitation.

Model Evaluation of the Adjudication Settlement Agreement – Expert Report September 27, 2004
- 13 -
CID Surface Water Supply - September 1(As measured at Brantley Reservoir)
0
20,000
40,000
60,000
80,000
100,000
120,000
140,000
1 4 7 10 13 16 19 22 25 28Year
Tota
l Sup
ply
at A
valo
n (a
cre-
feet
)
Augmentation from PVACD Wells
Pecos River Native Flow
September 1 shortfalls due to 100,000 AF/ 5 year limit
September 1 shortfalls due to 35,000 AF/year limit
Figure 8. Total CID Supply from “Natural” and Augmentation Sources.
CID Augmentation Pumping from PVACD (Annual Volume at Well Head, AF)
0
5,000
10,000
15,000
20,000
25,000
30,000
35,000
40,000
1 4 7 10 13 16 19 22 25 28Year
Aug
men
tatio
n Pu
mpi
ng (a
cre-
feet
)
Settlement: Average = 12533 AF
Figure 9: Settlement Scenario Augmentation Pumping from PVACD.

Model Evaluation of the Adjudication Settlement Agreement – Expert Report September 27, 2004
- 14 -
Annual Final (September 1) CID Water Supply
0.0
0.5
1.0
1.5
2.0
2.5
3.0
3.5
4.0
1 4 7 10 13 16 19 22 25 28Year
Sept
. 1 C
ID A
llotm
ent (
feet
per
acr
e)
Baseline: Average = 3.18 ftSettlement: CID Irrigator Allotment including Redistribution: Average = 3.4 ft
Figure 10: Comparison of CID Allotments under Baseline and Settlement Scenarios.
Annual CID Diversions (at Avalon)
0
10,000
20,000
30,000
40,000
50,000
60,000
70,000
80,000
90,000
100,000
1 4 7 10 13 16 19 22 25 28Year
Ann
ual C
ID D
iver
sion
s (a
cre-
feet
)
Baseline: Average = 68592 AFSettlement: Average = 75701 AF
Figure 11: Comparison of Actual Diversions to CID Main Canal. Both scenarios assume 18,000 acres actively irrigated.

Model Evaluation of the Adjudication Settlement Agreement – Expert Report September 27, 2004
- 15 -
Another significant feature of the Settlement is the re-distribution of ISC’s CID
rights under certain water supply and Pecos River Compact conditions. Figure 10 shows
the change in allotments under the two scenarios. The increase in total allotment reflects
the combined impact of land retirement, augmentation, and redistribution. The average
increase in water available for irrigators due to implementation of the Settlement is 0.22
feet per year. Notice also that the Settlement tends to significantly benefit CID in dry
years. Under the baseline scenario, the minimum final allotment was 1.5 feet per year,
while under the Settlement, the minimum was about 2.2 feet per year. This benefit
extends into the early part of the irrigation season as well. The minimum March 1
allotment increased from 0.55 to 1.21 under the Settlement scenario. This increase in
early-season allotment translates into a higher proportion of early-season irrigation water
coming from surface supplies as opposed to supplemental wells.
Figure 11 shows the total actual diversions from Avalon Reservoir into the CID
Main Canal. Total annual diversions increase by about 7,100 acre-feet annually, or about
10%. This is equivalent to about 0.29 feet per irrigated acre.
Supplemental well pumping results are shown in Figure 12. Under the proposed
settlement, supplemental well pumping limits would be increased from 3.0 to 3.697 feet
per acre, to offset any potential under-deliveries of surface water. Total supplemental
well pumping is increased under the settlement scenario by about 1,800 acre-feet per
year. It is worth noting that as much as 12,500 acre-feet per year of supplemental
pumping is due to the increase in the decree limit for the supplemental well rights, and
not because of a reduced CID water supply. If the 3.0 feet per acre limit was in place
under the Settlement, supplemental pumping would in fact be significantly reduced.

Model Evaluation of the Adjudication Settlement Agreement – Expert Report September 27, 2004
- 16 -
Supplemental Well Pumping in CID
0
5,000
10,000
15,000
20,000
25,000
30,000
35,000
1 4 7 10 13 16 19 22 25 28Year
Ann
ual W
ell P
umpi
ng (a
cre-
feet
)
Baseline: Average = 6596 AFSettlement: Average = 8415 AF
Supplemental pumping limit increases to 3.697 acre-feet/acre under Settlement terms from the Baseline limit of 3.0 acre-f t/
Figure 12: Comparison of CID Supplemental Well Pumping. (Increase in pumping under settlement is due to increase of pumping limit from 3.0 to 3.697 acre-feet per acre.)
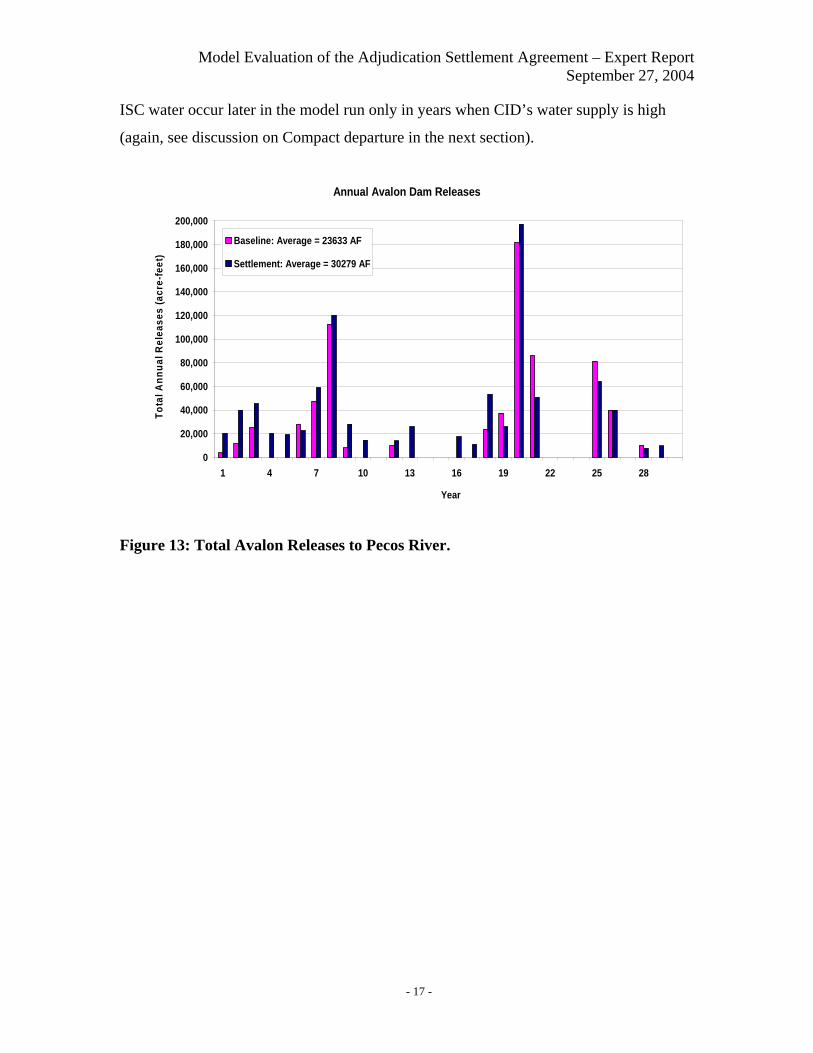
Resource Indicator: Releases from Avalon under Settlement Terms
Under baseline operations, the only releases from Avalon dam, other than to the
CID main canal, are due to conservation spills. The Settlement agreement includes
provisions that allow ISC to release its share of the CID allotment directly from Avalon
dam for purposes of complying with the Pecos River Compact. Figures 13 through 15
illustrate the impacts of the Settlement on Avalon Dam releases. Total releases from
Avalon increase by about 6,600 acre-feet annually (Figure 13). This average does not
include the remedy water bypasses totaling about 30,000 acre-feet in years when there is
a Compact delivery shortfall (see below for details on the Pecos River Compact).
Conservation spills decrease under the Settlement, on average, although the majority of
the changes occur late in the simulation period after a sizeable Compact credit has been
accumulated (Figure 14). Release of ISC’s CID water averages about 10,500 acre-feet
annually (Figure 15). Notice that the bulk of the ISC releases occur early in the
simulation period, when the stateline Compact credit is small. Additional deliveries of
Model Evaluation of the Adjudication Settlement Agreement – Expert Report September 27, 2004
- 17 -
ISC water occur later in the model run only in years when CID’s water supply is high
(again, see discussion on Compact departure in the next section).
Annual Avalon Dam Releases
0
20,000
40,000
60,000
80,000
100,000
120,000
140,000
160,000
180,000
200,000
1 4 7 10 13 16 19 22 25 28
Year
Tota
l Ann
ual R
elea
ses
(acr
e-fe
et)
Baseline: Average = 23633 AF
Settlement: Average = 30279 AF
Figure 13: Total Avalon Releases to Pecos River.

Model Evaluation of the Adjudication Settlement Agreement – Expert Report September 27, 2004
- 18 -
Annual Avalon Dam Conservation Spills
0
20,000
40,000
60,000
80,000
100,000
120,000
140,000
160,000
180,000
200,000
1 4 7 10 13 16 19 22 25 28
Year
Tota
l Ann
ual R
elea
ses
(acr
e-fe
et)
Baseline: Average = 23633 AF
Settlement: Average = 19257 AF
Figure 14: Avalon Releases to Pecos River due to Conservation Spills only.
Direct Deliveries to Stateline under Settlement Agreement
0
5,000
10,000
15,000
20,000
25,000
30,000
1 4 7 10 13 16 19 22 25 28Year
Ann
ual V
olum
e at
Sta
telin
e (a
cre-
feet
)
ISC Release of CIDWater Rights
Compact ShortfallRemedy Deliveries
Figure 15: Stateline Deliveries of ISC’s CID Water Rights and Remedy Water.

Model Evaluation of the Adjudication Settlement Agreement – Expert Report September 27, 2004
- 19 -
Resource Indicator: Red Bluff Flows, Stateline Deliveries, and Pecos River
Compact
The final set of resource indicators pertain to New Mexico’s obligations under the
Pecos River Compact and Amended Decree. One basic tenet of the Settlement agreement
is that by keeping CID’s water supply whole as much as possible (which increases return
flows to the Pecos River), and by direct delivery of a portion of the CID allotments which
would be purchased by NM ISC, New Mexico can increase its Compact credit to a level
that will allow it to more comfortably weather drought years without severely damaging
the region’s economy. The net impacts of the proposed settlement terms on stateline
flows are shown in Figure 16. Average annual flows at the stateline would increase by
about 9,500 acre-feet annually based on the model simulations. Additional water
delivered to the stateline as a result of remedy pumping total almost 30,000 acre-feet
(Figure 15). Corresponding to the increase in stateline flows is an increase in the average
annual and cumulative departure from the Compact obligation, as shown in Figure 17.
Comparison of Stateline Deliveries
0
50,000
100,000
150,000
200,000
250,000
300,000
1 4 7 10 13 16 19 22 25 28Year
Stat
elin
e Vo
lum
e (A
cre-
Feet
)
Baseline: Average = 78759 AFSettlement: Average = 88188 AFSettlement with Remedy Pumping
Figure 16: Total Flows at the Stateline (includes Red Bluff and Delaware).

Model Evaluation of the Adjudication Settlement Agreement – Expert Report September 27, 2004
- 20 -
Cumulative Compact Departure from Obligation
-200
-150
-100
-50
0
50
100
150
200
1 4 7 10 13 16 19 22 25 28
Year
Tota
l Dep
artu
re (1
000
acre
-feet
)
Baseline: Average = -5.44 KAF
Settlement w/Remedy Pumping: Average = 4.34 KAF
Figure 17: Comparison of Cumulative Compact Departure under the Baseline and Settlement Scenarios.
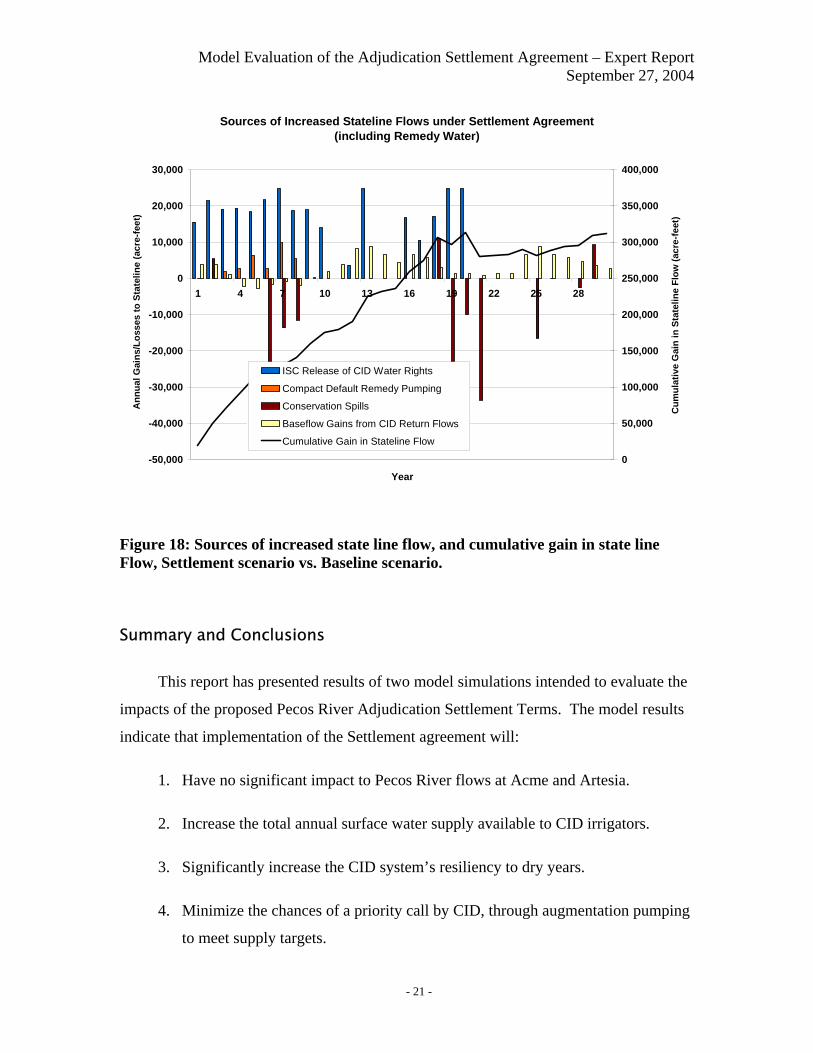
Finally, Figure 19 provides a breakdown of the additional sources of water that lead
to the additional stateline flows. The graph shows the cumulative gain in stateline flows
(in acre-feet) as the blue line, using the y-axis on the right. Using the left-hand y-axis,
the columns show year-by-year changes under the settlement scenario for Avalon spills,
baseflow gains, and ISC releases from Avalon, as compared to the baseline scenario.
Early in the simulation period, deliveries of ISC’s CID water directly from Avalon
account for much of the gain in stateline flow. In the later two-thirds of the period, in
addition to ISC releases, additional return flows and baseflow gains from the CID area
account for much of the gain.
Model Evaluation of the Adjudication Settlement Agreement – Expert Report September 27, 2004
- 21 -
Sources of Increased Stateline Flows under Settlement Agreement(including Remedy Water)
-50,000
-40,000
-30,000
-20,000
-10,000
0
10,000
20,000
30,000
1 4 7 10 13 16 19 22 25 28
Year
Ann
ual G
ains
/Los
ses
to S
tate
line
(acr
e-fe
et)
0
50,000
100,000
150,000
200,000
250,000
300,000
350,000
400,000
Cum
ulat
ive
Gai
n in
Sta
telin
e Fl
ow (a
cre-
feet
)
ISC Release of CID Water Rights
Compact Default Remedy Pumping
Conservation Spills
Baseflow Gains from CID Return Flows
Cumulative Gain in Stateline Flow
Figure 18: Sources of increased state line flow, and cumulative gain in state line Flow, Settlement scenario vs. Baseline scenario.
Summary and Conclusions
This report has presented results of two model simulations intended to evaluate the
impacts of the proposed Pecos River Adjudication Settlement Terms. The model results
indicate that implementation of the Settlement agreement will:
1. Have no significant impact to Pecos River flows at Acme and Artesia.
2. Increase the total annual surface water supply available to CID irrigators.
3. Significantly increase the CID system’s resiliency to dry years.
4. Minimize the chances of a priority call by CID, through augmentation pumping
to meet supply targets.

Model Evaluation of the Adjudication Settlement Agreement – Expert Report September 27, 2004
- 22 -
5. Over time, reduce total depletions in the Roswell basin and increase baseflows
to the Pecos River.
6. Increase baseflows / return flows from the Carlsbad basin to the Pecos River.
7. Provide for the direct delivery of water from Avalon dam to the stateline.
8. Minimize the possibility of the State of New Mexico defaulting on its Pecos
River Compact obligations, and most likely result in a cumulative credit over
the long-term.
References
Barroll, Peggy. 2002. The Carlsbad Area Groundwater Flow Model. Hydrology
Bureau, New Mexico Office of the State Engineer.
Carron, John. 2003. Pecos River Adjudication Settlement: Model Evaluation of
Adjudication Settlement Agreement. Final Report. March 10, 2003. Hydrosphere
Resource Consultants, Inc.
Hydrosphere Resource Consultants, Inc. 2003. The Carlsbad Area Ground Water
Model Data Processing Tool: User’s Manual and Technical Reference. Prepared for the
New Mexico Interstate Stream Commission.
The Hydrology/Water Operations Work Group for the Carlsbad Project Water
Operations and Water Supply Conservation NEPA Process (HWG). 2004. Volume 2:
Pecos River RiverWare Model Report. Referred to herein as (HWG Volume 2, 2004).
The Hydrology/Water Operations Work Group for the Carlsbad Project Water
Operations and Water Supply Conservation NEPA Process (HWG). 2004. Volume 3:
Roswell Artesian Basin Groundwater Model Documentation. Referred to herein as
(HWG Volume 3, 2004).

Model Evaluation of the Adjudication Settlement Agreement – Expert Report September 27, 2004
- 23 -
The Pecos River Adjudication Settlement Agreement, dated March 25, 2003, as
entered into by the state of New Mexico ex rel. the State Engineer; The New Mexico
Interstate Stream Commission; the United States of America, Department of the Interior,
Bureau of Reclamation; the Carlsbad Irrigation District; and the Pecos Valley Artesian
Conservancy District. Referred to herein as (Settlement Agreement, 2003).