
Appendix C Coastal Processesg · 2014-02-13 · Lowestoft Harbour 6 km Aldeburgh 44.5 km Pakefield...
53
Appendix C Review of Coastal Processes and Geomorphology
Transcript of Appendix C Coastal Processesg · 2014-02-13 · Lowestoft Harbour 6 km Aldeburgh 44.5 km Pakefield...

Appendix C Review of Coastal Processes and
Geomorphology


������������
Document title SUFFOLK SMP2 Sub-cell 3c
Review of Coastal Processes and Geomorphology
Document short title Coastal Processes
Status Draft Report
Date January 2009
Project name Suffolk SMP2 3c
Project number
Client Suffolk Coastal District Council
Reference /RCP1/301164/PBor
Rightwell House
Bretton Peterborough PE3 8DW
United Kingdom
+44 (0)1733 334455 Telephone Fax
[email protected] E-mail www.royalhaskoning.com Internet
����� �����������
��������� �� �����
Drafted by JGL Guthrie
Checked by
Date/initials check …………………. ………………….
Approved by
Date/initials approval …………………. ………………….


Coastal Processes /RCP1/301164/PBor Draft Report January 2009
CONTENTS Page
Review of Coastal Processes and Geomorphology i
1 INTRODUCTION 1 1.1 Review of Information 1 1.2 Reference System 5
2 OVERVIEW 6 2.1 Background. 6 2.2 Geology and Geomorphological Development (updated from
Dr. B D’Olier-SNS2, 2002) 7 2.2.1 North Norfolk and Suffolk 7 2.2.2 Thames Estuary – Orford Ness to North Foreland 13
3 SHORELINE PROCESSES 17 3.1 Tide and Water Levels 17 3.2 Wave Climate 20 3.2.1 Offshore Wave Climate 20 3.2.2 Inshore Wave Climates. 23 3.3 Sediment Transport (up dated from SNS2) 25 3.3.1 Corton to Southwold 25 3.3.2 Southwold to Landguard Point 29 3.4 Coastal Change 37 3.4.1 Base Data 37 3.4.2 Prediction of Shoreline Change. 39
Annex 1 Coastal Change Maps Annex 2 Assessment of Defences


Coastal Processes /RCP1/301164/PBor Draft Report C- 1 - January 2009
1 INTRODUCTION
1.1 Review of Information
The initial Shoreline Management Plan (SMP1) was produced in 1997, drawing on a considerable level of study for the Suffolk area; in particular work undertaken by the University of East Anglia during the 1970s and the Sea Defence Management Study (SDMS) undertaken by Halcrow Ltd. in the late 1980s, but also including various local studies at Felixstowe, The Deben, Aldeburgh and Southwold. It was recognised prior to and during the development of the SMP1 that, despite this information; due to the complex nature of the coast and lack of consistent monitoring data, there was still a high degree of uncertainty associated with coastal processes and geomorphological evolution. As a result of this uncertainty, the Environment Agency set up its long term strategic monitoring programme in 1990, providing now a record of shoreline behaviour covering some 17 years. A major strategy study was also undertaken (Lowestoft to Thorpeness Strategy) immediately following the SMP1. Broader scale studies, one examining the sediment pathways in the Southern North Sea (SNS2), another considering the overall management of internationally important habitats (CHaMPs), were also undertaken with national and European funding in 2002. These drew upon information gathered as part of the national Futurecoast Project, also concluded in 2002. Since SMP1, there have also been more local strategies, investigations and project based studies providing coverage of virtually all of the Suffolk coastline. The chronology and geographical extent of studies are shown in outline in Figure 1.1. The figure also identifies the various divisions of the coast. The initial division provided by SMP1 was into four nominal process units of Benacre (BEN), Minsmere (MIN), Orford (ORF) and Felixstowe (FEL). This has since been subdivided by other studies reflecting improved understanding of coastal behaviour or the specific intent of the different studies. As each study has added to this understanding, various policies for shoreline management have emerged. The current “With Present Management” (WPM) policy for various sections of the coast is highlighted in the final row of Figure 1.1. This forms the basis for the SMP2 review. This review of coastal processes and geomorphology aims to draw together findings from previous work together with inclusion of the most recent analysis based on monitoring. As such, the review draws directly from the high level reports (SMP1, Futurecoast, SNS2 and CHaMPs) providing an overview of the emerging understanding in relation to the needs of the SMP2 analysis; adding any subsequent information in confirmation or clarification of areas of continued uncertainty. The format of each of these high level reports is broadly similar, starting from a consideration of the general structure and context of the coastline, following this down to collate information with respect of individual sections of the coast. This review follows a similar structure: � Section 2 considers the broad scale background to the coast, discussing the
interaction between the coastline, the underlying geology and the nearshore area. This highlights the major sediment sources, pathways and sinks, dividing the coast

/RCP1/301164/PBor Coastal Processes January 2009 C- 2 - Draft Report
into two principal areas covering Norfolk and Suffolk, the Thames Estuary – Orford Ness to North Foreland.
� Section 3 focuses in on the shoreline processes, including information on water
levels, waves, sediment movement, coastal change and principal control features. This section also provides an estimate of future erosion based on the above information.
This review also incorporates information from the Estuary Strategy Studies for the area. A review of the estuary strategies in relation to potential impact of the coastal regime has been undertaken and is reported, in a format recommended by the SMP2 Procedural Guidance, as a separate appendix.

Coastal Processes /RCP1/301164/PBor Draft Report C- 3 - January 2009
Figure 1.1. Previous Studies

/RCP1/301164/PBor Coastal Processes January 2009 C- 4 - Draft Report
Table 1.1. List of Studies Identified in Figure 1.1
Investigations author Strategies author
I1 East Anglian Coastal Study R1, 3, 4, 6, 7, 8 & 9 UEA S1 Felixstowe Ferry Sea defence Study BMT
I2 East Anglian Coastal Research Programme R1, 5 & 7 UEA S2 Felixstowe Town Frontage Dobbie
I3 Wave measurement South Pier ABP S3 WDC Shoreline Strategy Babtie
I4 dredging impact A401 HR S4 Hollesley to Bawdsey Coastal Study Haskoning
I5 Dredging East of Southwold. HR S5 Lowestoft to Thorpeness Coastal Study Halcrow
I6 Analysis of Coastal Change (EA Profiles 1991 - 1998) EA S6 South Felixstowe Coastal Strategy - Coastal Processes Halcrow
I7 Coastal Impact study HR S7 North Felixstowe Strategy Haskoning
I8 Spits and Nesses Babtie S8 Kessingland to Benacre Denes Coastal Management study Black and Veatch
I9 Future Coast Halcrow S9 Thorpeness to Hollesley Strategy Plan - Coastal Processes Halcrow
I10 Suffolk Coast and Heaths Management Plan (CHaMPs) Haskoning S10 Dunwich cliffs to Sizewell Power stations Coastal Process Report Black and Veatch
I11 Southern North Sea Sediment Transport Study HR S11 South Felixstowe Coastal Strategy - Coastal Processes addendum Black and Veatch
I12 Unauthorized filling Easton Bavents Halcrow S12 South Felixstowe Coastal Strategy - SAR Black and Veatch
I13 Coastal Evolution in Suffolk EN
I14 Analysis of Coastal Change (EA Profiles 1991 - 2006) EA
I15 Blinks UEA
I16 Geomorphological analysis of East Lane Bawdsey EA
Projects Projects
P1 Provision of permanent defences- Easton Bavents P9 East Lane Project Appraisal Haskoning
P2 Supplementary Tests Children’s Corner P10 Slaughden Sea Defence Coastal processes Halcrow
P3 Southwold pier random wave model P11 Southwold Coastal Frontage - PAR Halcrow
P4 North Pier - Southwold P12 Scour Management HR
P5 Technical Report on Easton Bavents WDC P13 Walberswick to Dunwich Tidal Defence scheme- DN Env appraisal Halcrow
P6 South Pier - Walberswick P14
P7 Felixstowe Ferry Haskoning P15
P8 Bawdsey Manor Haskoning P16

Coastal Processes /RCP1/301164/PBor Draft Report C- 5 - January 2009
1.2 Reference System
Information collated throughout the development of the SMP2 has been mapped using a Geographical Information System (GIS). Although within this review every effort has been made to refer to specific location names, it has also been convenient to develop a reference system based on a chainage (or distance) along the coastline; thus allowing direct reference to mapped data. The SMP2 covers the extent of coast from Lowestoft Ness through to the area of Felixstowe Port; a distance of approximately 80km. The adopted chainage system starts in the north, to the north of Lowestoft Ness, and continues over the full length of the coastline. This is shown on two maps (Figures 1.2a and 1.2b) covering the northern area and the southern area respectively. Figures 1.2a and 1.2b. Adopted Chainage System
Table 2.2. Chainage (km.) of Principal Locations
Lowestoft Ness 4.5 km Thorpe Ness 40 km Lowestoft Harbour 6 km Aldeburgh 44.5 km Pakefield 8.5 km Orfordness Lighthouse 52.5 km Kessingland 13 km North Weir Point 61.5 km Southwold 23.5 km Felixstowe Ferry 70 km Blyth Estuary 25 km Cobbolds Point 73 km Dunwich 30 km Lowestoft Pier 75 km Sizewell 38.5 km Landguard Point 78.5 km
/RCP1/301164/PBor Coastal Processes January 2009 C- 6 - Draft Report
2 OVERVIEW
2.1 Background.
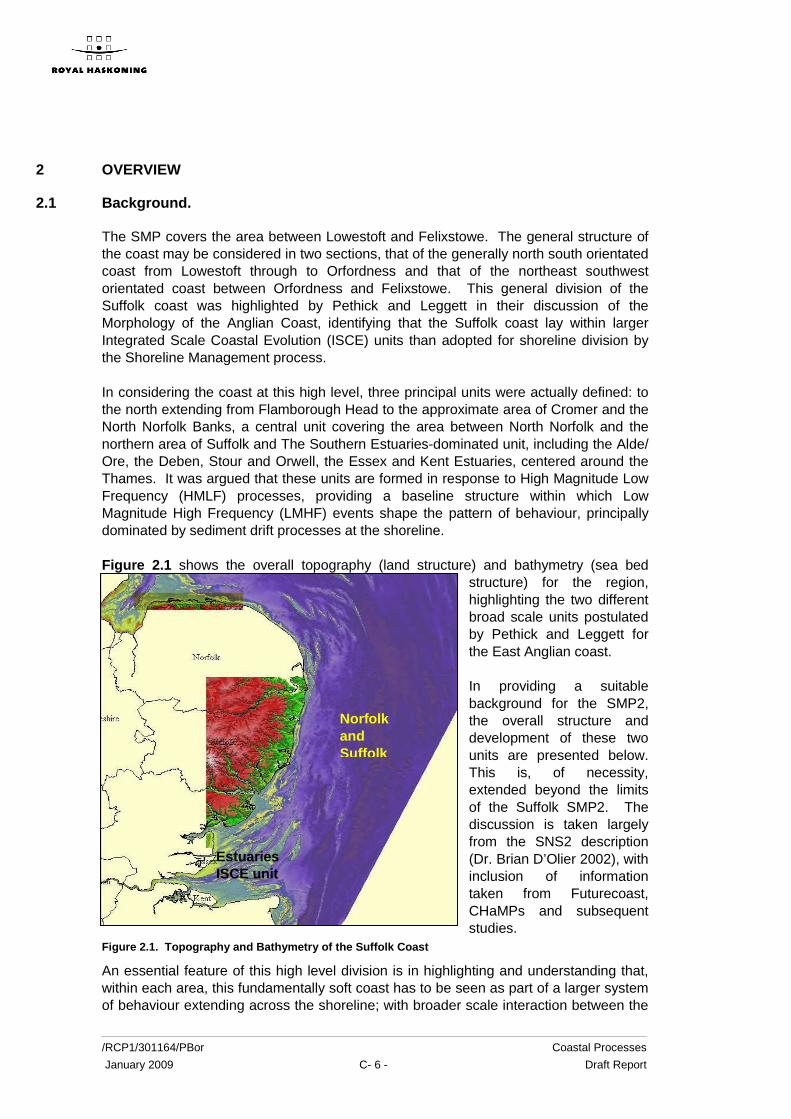
The SMP covers the area between Lowestoft and Felixstowe. The general structure of the coast may be considered in two sections, that of the generally north south orientated coast from Lowestoft through to Orfordness and that of the northeast southwest orientated coast between Orfordness and Felixstowe. This general division of the Suffolk coast was highlighted by Pethick and Leggett in their discussion of the Morphology of the Anglian Coast, identifying that the Suffolk coast lay within larger Integrated Scale Coastal Evolution (ISCE) units than adopted for shoreline division by the Shoreline Management process. In considering the coast at this high level, three principal units were actually defined: to the north extending from Flamborough Head to the approximate area of Cromer and the North Norfolk Banks, a central unit covering the area between North Norfolk and the northern area of Suffolk and The Southern Estuaries-dominated unit, including the Alde/ Ore, the Deben, Stour and Orwell, the Essex and Kent Estuaries, centered around the Thames. It was argued that these units are formed in response to High Magnitude Low Frequency (HMLF) processes, providing a baseline structure within which Low Magnitude High Frequency (LMHF) events shape the pattern of behaviour, principally dominated by sediment drift processes at the shoreline. Figure 2.1 shows the overall topography (land structure) and bathymetry (sea bed
structure) for the region, highlighting the two different broad scale units postulated by Pethick and Leggett for the East Anglian coast. In providing a suitable background for the SMP2, the overall structure and development of these two units are presented below. This is, of necessity, extended beyond the limits of the Suffolk SMP2. The discussion is taken largely from the SNS2 description (Dr. Brian D’Olier 2002), with inclusion of information taken from Futurecoast, CHaMPs and subsequent studies.
Figure 2.1. Topography and Bathymetry of the Suffolk Coast
An essential feature of this high level division is in highlighting and understanding that, within each area, this fundamentally soft coast has to be seen as part of a larger system of behaviour extending across the shoreline; with broader scale interaction between the
Estuaries ISCE unit
Norfolk and Suffolk

Coastal Processes /RCP1/301164/PBor Draft Report C- 7 - January 2009
hinterland and nearshore sea bed and with a geological history of sediment being reworked within this wider coastal zone. The present shoreline may best be appreciated as a man made construct, but also as an area of most obvious change and greatest dynamics. This is well expressed by J.A Steers in describing the whole area as where geological processes are actually in operation. Steer also, however, highlighted (JA Steers 1925) that as a result of the Neolithic Subsidence (3500 yrs before present) there would have been many peninsulas and headlands projecting into the sea and that these would have been subject to most rapid erosion. As such the records or observations of erosion rates based on historical evidence or those hindcast back from present records must be treated with caution. As the coastal form has matured, the nature of erosion and variation of erosion along the coast must also have changed.
2.2 Geology and Geomorphological Development (updated from Dr. B D’Olier-SNS2, 2002)
2.2.1 North Norfolk and Suffolk
Prior to the glacial events that have so shaped the North Sea, the area was largely dominated by marine conditions with large rivers bringing sediment in from much of England and the Continent (Gibbard 1988; Rose 1999 & 2002). Following this period, two glaciations can be identified from deposits both on the North Sea floor and within mainland England. The former, the Anglian glaciation, covered all of Norfolk and Suffolk and parts of Essex. At the time of the last glacial maximum some 18,000 years B.P. the ice front lay within the Wash and extended northeastwards into the central North Sea. Between these two glacial events there might have been a third, and in addition a whole series of interglacial sediments were deposited. The result is that at the present time, the sediments of the seabed off this coast and the sediments of the cliffed coastal sections, are of very mixed provenance and type. It is from these that the mobile sediments within the present marine environment are being largely derived by erosion. Winterton Ness to Benacre Ness (Parts of Subcells 3b and 3c) This zone is dominated by a number of sandbanks that might appear to be located in a position that is not conducive to their stability. Whilst it is unknown when they began to form, they are however located in a position relative to three important geomorphological features. These are the now, centrally positioned, buried valley of the River Yare, the Northern Upland that previously extended seawards from the area of Caister to Winterton, and the Southern Upland that extended to the east from the area of Gorleston southward as far as Kessingland. Due to the general southerly drift of sediment along and offshore from Winterton to Benacre, then it might be suggested that these banks – Cross Sands, Scroby Sands and Caister Shoal, formed originally as banner or headland banks from the Northern, Caister/Winterton Upland. Seismic evidence shows that the bedrock of this Northern Upland consists of the clay rich, lower divisions of the Westkapelle Ground Formation. These units more readily resist erosion due to their high clay content. This northern upland, which quite possibly extended northeastwards as far as the Newarp Banks, extended under Cockle Shoal, Winterton Overfalls and North Cross Sand where the sand thickness of the banks is very much thinner. Before erosion by the advancing sea

/RCP1/301164/PBor Coastal Processes January 2009 C- 8 - Draft Report
took place, the Upland was capped by glacial, clay rich deposits, of the Anglian, Lowestoft Formation. At present, the continuation of this headland is the high ground behind Winterton on Sea, which is capped by this same erosion resistant deposit. Immediately to the north of this headland was a less erosion resistant, more sandy deposit, the Cromer or Happisburgh Till deposited by an earlier advance of the Anglian ice sheet (Rose 2002). In this onshore area the present day drainage takes advantage of this same, sandier, more easily erodible deposit, as the Hundred Stream and the Thurne River flow southwestward toward the River Bure from higher ground that once lay offshore. The more volatile elements of the sandbank system are those that lie over the buried valley of the River Yare and consist of the South Scroby, Corton Sands and the Holme Sands. Here the sand thickness is greatest, allowing the tidal currents to erode, displace and deposit the upper layers of these sands without reaching an erosion resistant layer. Thus the navigation channels in this area are constantly changing. It is possible though unproven, that parts of the deep channels of Barley Picle and Caister Road between these banks were the location of streams that once ran off southwards from the Northern Upland into the River Yare. Certainly the bedrock surface is much lower under parts of Barley Picle than it is under Scroby Sands. The Southern Upland had an east-west aligned watershed that extended through the high ground north of Kessingland. Small streams probably ran north or northeast from this into the River Yare. This major river valley ran first eastwards (Arthurton et al 1994) but then turned southeastwards some 7/8 kms off the present coastline. Thus the banks are lying between two watersheds and within and upon, the substantial deposits of the old valley system of the River Yare. The work by Pethick and Leggett would suggest that the southerly flank of this bank system has been defined in response to HMLF wave events, forming, in effect, the southern extent of a submerged barrier island coast, protecting the inner lagoon from larger waves from the southeast. This would go someway in resolving the controversy (Carr, 1981; Lees, 1981; McCave, 1987; Robinson, 1966 and more latterly in the Spits and Nesses report 2000) as to the direction of sediment transport on the Banks and whether sediment is transferred to or from the shore in areas such as Benacre. Pethick and Leggett therefore suggest “the existence of two shorelines: an upper low magnitude shore marked by glacial cliff; and a net southerly sediment transport, and an outer , high magnitude shore, the Suffolk Banks, exhibiting a net northerly sediment transport.” Within this high level system there are certainly secondary affects as identified as part of the BLINKS research study of the Newcome Sands and the interactions between these southerly sand banks and the shore. Here it has been determined from the examination of historical charts that this southern area of the Lowestoft and Great Yarmouth Banks develop in a cyclic manner, moving through a deltaic and elongate states.
Coastal Processes /RCP1/301164/PBor Draft Report C- 9 - January 2009
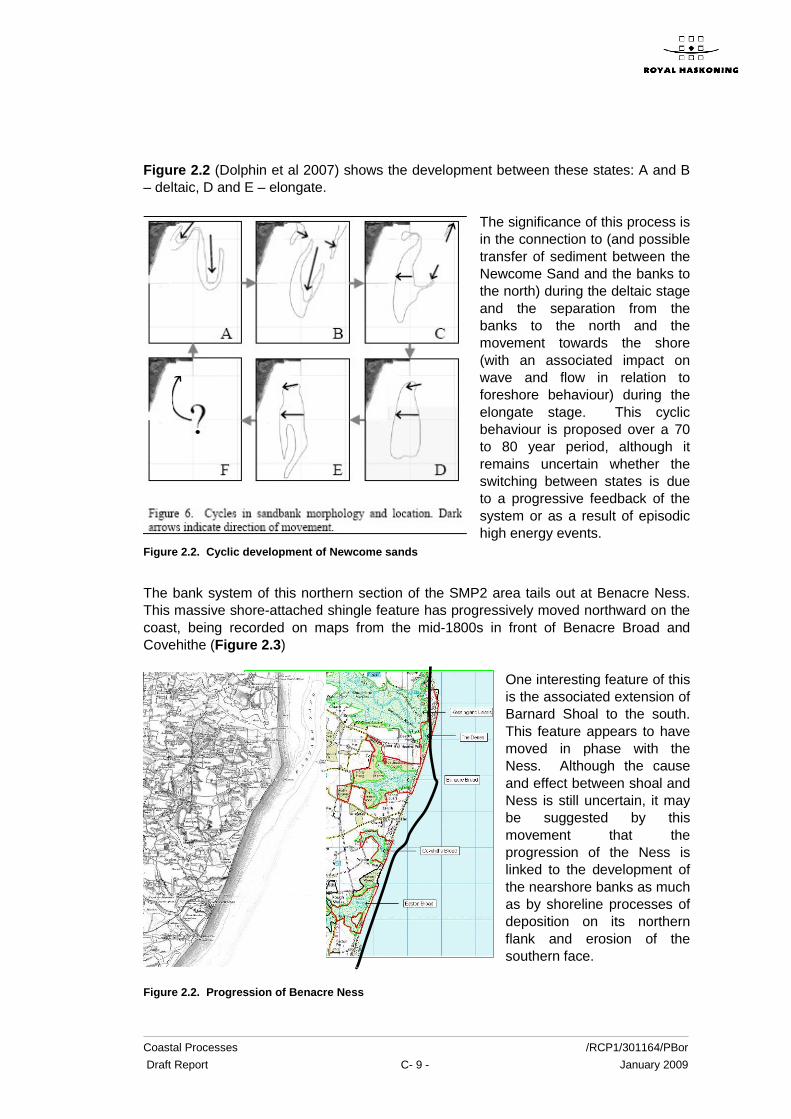
Figure 2.2 (Dolphin et al 2007) shows the development between these states: A and B – deltaic, D and E – elongate.
The significance of this process is in the connection to (and possible transfer of sediment between the Newcome Sand and the banks to the north) during the deltaic stage and the separation from the banks to the north and the movement towards the shore (with an associated impact on wave and flow in relation to foreshore behaviour) during the elongate stage. This cyclic behaviour is proposed over a 70 to 80 year period, although it remains uncertain whether the switching between states is due to a progressive feedback of the system or as a result of episodic high energy events.
Figure 2.2. Cyclic development of Newcome sands
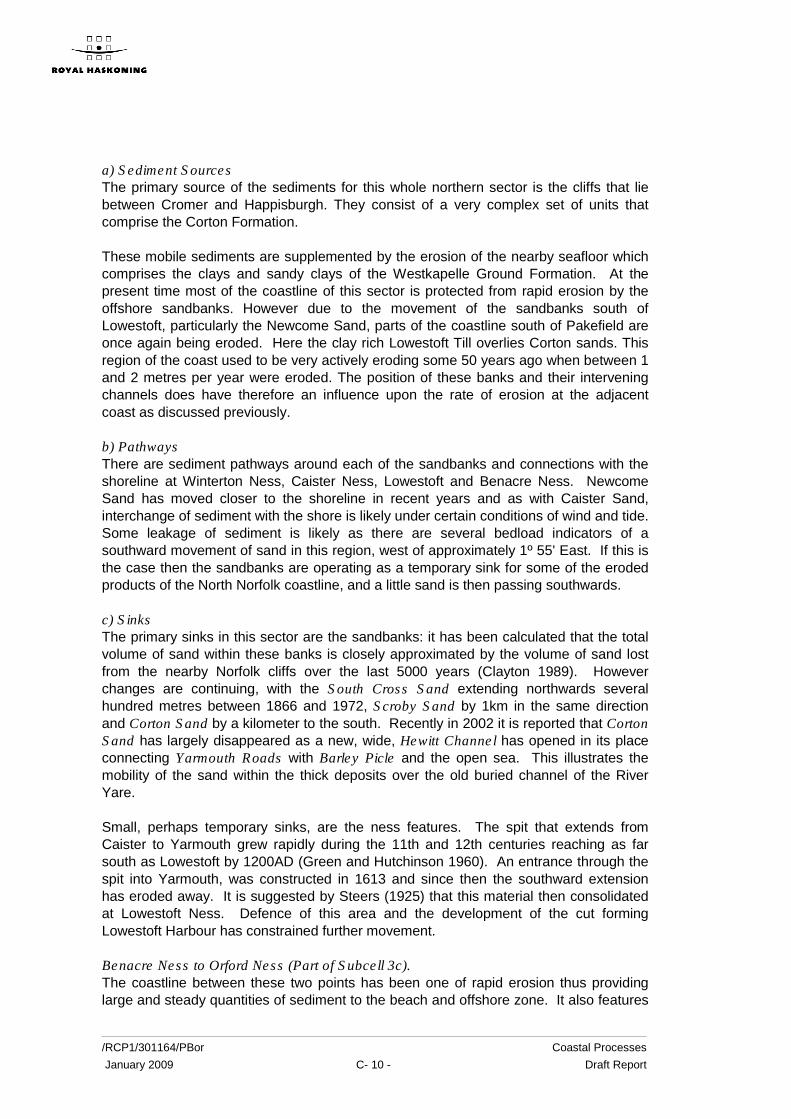
The bank system of this northern section of the SMP2 area tails out at Benacre Ness. This massive shore-attached shingle feature has progressively moved northward on the coast, being recorded on maps from the mid-1800s in front of Benacre Broad and Covehithe (Figure 2.3)
One interesting feature of this is the associated extension of Barnard Shoal to the south. This feature appears to have moved in phase with the Ness. Although the cause and effect between shoal and Ness is still uncertain, it may be suggested by this movement that the progression of the Ness is linked to the development of the nearshore banks as much as by shoreline processes of deposition on its northern flank and erosion of the southern face.
Figure 2.2. Progression of Benacre Ness
/RCP1/301164/PBor Coastal Processes January 2009 C- 10 - Draft Report
a) Sediment Sources The primary source of the sediments for this whole northern sector is the cliffs that lie between Cromer and Happisburgh. They consist of a very complex set of units that comprise the Corton Formation. These mobile sediments are supplemented by the erosion of the nearby seafloor which comprises the clays and sandy clays of the Westkapelle Ground Formation. At the present time most of the coastline of this sector is protected from rapid erosion by the offshore sandbanks. However due to the movement of the sandbanks south of Lowestoft, particularly the Newcome Sand, parts of the coastline south of Pakefield are once again being eroded. Here the clay rich Lowestoft Till overlies Corton sands. This region of the coast used to be very actively eroding some 50 years ago when between 1 and 2 metres per year were eroded. The position of these banks and their intervening channels does have therefore an influence upon the rate of erosion at the adjacent coast as discussed previously. b) Pathways There are sediment pathways around each of the sandbanks and connections with the shoreline at Winterton Ness, Caister Ness, Lowestoft and Benacre Ness. Newcome Sand has moved closer to the shoreline in recent years and as with Caister Sand, interchange of sediment with the shore is likely under certain conditions of wind and tide. Some leakage of sediment is likely as there are several bedload indicators of a southward movement of sand in this region, west of approximately 1º 55' East. If this is the case then the sandbanks are operating as a temporary sink for some of the eroded products of the North Norfolk coastline, and a little sand is then passing southwards. c) Sinks The primary sinks in this sector are the sandbanks: it has been calculated that the total volume of sand within these banks is closely approximated by the volume of sand lost from the nearby Norfolk cliffs over the last 5000 years (Clayton 1989). However changes are continuing, with the South Cross Sand extending northwards several hundred metres between 1866 and 1972, Scroby Sand by 1km in the same direction and Corton Sand by a kilometer to the south. Recently in 2002 it is reported that Corton Sand has largely disappeared as a new, wide, Hewitt Channel has opened in its place connecting Yarmouth Roads with Barley Picle and the open sea. This illustrates the mobility of the sand within the thick deposits over the old buried channel of the River Yare. Small, perhaps temporary sinks, are the ness features. The spit that extends from Caister to Yarmouth grew rapidly during the 11th and 12th centuries reaching as far south as Lowestoft by 1200AD (Green and Hutchinson 1960). An entrance through the spit into Yarmouth, was constructed in 1613 and since then the southward extension has eroded away. It is suggested by Steers (1925) that this material then consolidated at Lowestoft Ness. Defence of this area and the development of the cut forming Lowestoft Harbour has constrained further movement. Benacre Ness to Orford Ness (Part of Subcell 3c). The coastline between these two points has been one of rapid erosion thus providing large and steady quantities of sediment to the beach and offshore zone. It also features
Coastal Processes /RCP1/301164/PBor Draft Report C- 11 - January 2009
a number of ‘ness’ or uncliffed projections that appear to have an important bearing on sediment transport along the coast and as was seen further north, to the development of offshore sandbanks. On this stretch of coastline there are four of these nesses – Benacre Ness, Southwold, Thorpeness and Orford Ness. a) Sediment Sources The link of Orford Ness to its potential source will be described in more detail in a subsequent section, with cliffed areas to the north providing at times, large quantities of shingle, sands and clays. These deposits include the medium grained Chillesford Sand, the Chillesford Clay, the Easton Bavents Clay and the sandy, shingle rich, Westleton Beds. These units are collectively termed the Norwich Crag. Offshore the seabed is composed of clayey, silty, fine sands of the Westkapelle Ground Formation overlying the shelly, medium to coarse grained, sands of the Red Crag. A further formation, older than all the previously described units, lies immediately under and to the northeast of Thorpeness. This is the Coralline Crag, a bank-like body of sometimes silty, medium to coarse, shelly sands. That it is relatively resistant to erosion compared with the other deposits is seen from its composition and its concurrence with the bathymetry. Seismic evidence confirms this concurrence. It might appear that Thorpeness has a core of this more resistant geological unit and that its position is comparatively fixed by it. This together with more immediate changes in the Sizewell and Dunwich banks are examined in the Minsmere Frontage Coastal Process Report (2005) and this is further discussed in relation to current shoreline behaviour. In a few localities offshore, flint gravels are to be found that were deposited by the Middle Pleistocene, Thames/Medway River that ran towards the northeast. These are found overlying in localized patches, all of the previously mentioned deposits (Rose 2002). In a few places are to be found the more recent, small, drowned valleys of the Alde, Blyth, Minsmere and Hundred Rivers. Where still present after marine planation, these are largely filled with estuarine silts and clays that could be subject to erosion at times. All of these units are therefore acting as either major to very minor sources. As regards the ness at Southwold it is possible that its position is linked to the headland of Norwich Crag clays and Westleton Beds that limits the alignment of the Blyth River at this point. If the amount of shingle in the Westleton beds to the north were to rise appreciably as erosion proceeded there, then a southward extension of any resulting spit would move the ness position to the south also. Benacre Ness has been described (Robinson 1966) as having shown the greatest amount of movement of all the nesses along the East Anglian coast. This he ascribes to the presence of a near shore, dominant ebb stream. All the hydrographic surveys, except for that of 1824, show the seafloor bathymetry indicating an ebb dominant tidal stream near to the coast at this point. Subsequently the ness has migrated northwards. Others (Williams 1956) have ascribed the movement of this ness, 1 mile since 1840, to differences in the amount of sediment that is being provided from the eroding cliffs on either side, there being more on the north side. Since its movement northwards, the cliffs to the south at Covehithe have become increasingly exposed to erosion and thus should be providing more sediment but the movement northwards still continues. If supply was the key factor then the ness should have started to move south. What is

/RCP1/301164/PBor Coastal Processes January 2009 C- 12 - Draft Report
much more likely to have affected this northward migration are the changes to the sandbank configuration around Lowestoft, to the north. If sufficient flood tide flow can move close to the coast between Lowestoft and Benacre then this flood flow will erode the northern side of the ness whilst depositing the sediment on the south side thus moving it southwards. Study of the charts since 1824, show that there has been a decrease of this flood flow and an increase in the ebb dominance at Benacre. The position of Benacre Ness might therefore seem to be controlled by the configuration of the bank system close to the coast at Lowestoft and whether the inshore channel south of there, is flood or ebb dominant. Rates of cliff erosion are very variable, being relatively low at or close to the major nesses but elsewhere are highly variable. At Covehithe, between 1882 and 1903, 5.2metres were lost each year though it fell to 2.7metres between 1925 and 1952. At Benacre between 1925 and 1958, 5.8metres per year were lost. Further to the south at Dunwich, rates of erosion are just as variable being between 0.06 and 3.53 metres per year between 1587 and 1975, an average of 1.15m/year. At Easton Bavents, rates of approximately 2.80 metres are the average since 1849 (Carr 1979). From this it can be deduced that the coastline has receded some 10 –16 kilometers since marine erosion began some 8000 years ago. This is equivalent to the coastline being close to the present day, 30 metre, bathymetric contour. This hindcast of the position of the coast has to be treated with caution as highlighted by Steers (1925). Even so, huge volumes of sediment have been released for transportation into the nearby sinks both to the north, and in particular to the south and the Thames Estuary. b) Pathways The offshore zone, seaward as far as approximately 2º E, has a great number of mobility indicators including sand streaks and ribbons, megaripples and sandwaves. Where there is any indication of asymmetry, the movement is more frequently, towards the south, towards the Thames Estuary approaches though there are contrary indicators. These indicators are largely coast parallel and are part of the Southern North Sea nearshore sediment pathway (Kenyon et al 1981). Farther offshore sediment movement is indicated by bedforms as being more frequently towards the north. There is a complex pattern of movement around the Sizewell and Dunwich Banks though there is an essentially clockwise motion of the sediment. Along the beach and nearshore there is a general southerly movement, though due to local change in coastal orientation there can occasionally be a more local change to a northward direction on some coastal stretches. This is discussed later in relation to shoreline behaviour. c) Sinks Within this area there are a number of sinks. The nesses already discussed are only temporary sinks, storing sediment for a short time before its movement further along the coast or to the offshore zone (McCave 1978). There are a number of sandbanks that are sinks for fine to medium sand, including Aldeburgh Ridge, Aldeburgh Napes, Sizewell and Dunwich Banks. The Aldeburgh Ridge is positioned as a banner or headland bank, receiving sand from the sorting of material at the head of Orford Ness. In that, it is in a similar position to the

Coastal Processes /RCP1/301164/PBor Draft Report C- 13 - January 2009
Whiting Bank, nearby in the Thames Estuary. It is possible, therefore, that the Aldeburgh Napes, further to the east, was also at one time in a similar position but coastal retreat has left it isolated from this shoreline sediment pathway. The Sizewell Bank, a banner bank from the Coralline Crag core at Thorpeness, and Dunwich Banks have amalgamated since 1824 when they were separate entities. They have expanded northwards at an average rate of 49m/year up to 1965 (Carr 1979). At the same time the banks have moved shoreward at a rate of up to 10.7m/year. If this rate were to continue, these banks would amalgamate with the coastline by approximately 2150 AD. However it is more likely that the combined bank will become a banner bank to the north of Thorpeness. This could mean, if the channel between the bank and the coast becomes increasingly flood dominant, that the sand volumes moving south will increase in the future along the coastline, with the Sizewell/Dunwich Bank, Aldeburgh Ridge and the Whiting Banks being among the principle recipients. A comparison of the losses of sediment from the nearby coastline and the gains on these two offshore banks, suggest that these are of the same magnitude (Carr 1979). However sand could be moving in from the north or from offshore and thus complicate this simple relationship.
2.2.2 Thames Estuary – Orford Ness to North Foreland
This area extends from Southend and the mouth of the River Medway, as far to the east as 3ºE and between North Foreland, Kent and Orford Ness, Suffolk. The area, before recent postglacial sea level rise, comprised of 3 separate river valleys containing rivers flowing towards the east to their confluence with the River Rhine (D’Olier 1975). This combined drainage then ran south through the chalk escarpment of the Straits of Dover, into the lowland area of the English Channel, and to the sea. The 3 parts comprised of the Essex/Suffolk River Stour with its tributaries of the Orwell, Deben and Butley rivers; the Rivers Thames and Medway with their chief tributaries of the Crouch, Blackwater and Colne; and on the southern side, the River Stour of Kent and its principal tributary, the River Swale. This latter river system joined that of the Thames in the area of the outer reaches of the present Thames Estuary. These 3 major river valleys were separated by two narrow watersheds; the Naze to South Shipwash, and to the south, Warden Point to Shingles Patch. These promontories have been largely eroded away in the 7000 – 8000 years since the sea returned, progressively drowning the lower reaches of the river valleys on either side. Their chief expression at the present day is the eroding cliffs of The Naze, Essex and those of the Isle of Sheppey in Kent. These watersheds provided some of the sediment that is now found in sinks within the Thames Estuary, other sources being the fluvial sediments of these various palaeo- rivers, other small cliffed areas around the palaeo-river valleys and perhaps most importantly, sediments from the coast and floor of the area now occupied by the Southern Bight of the North Sea. As sea-level rose and marine influence began to be felt within the three estuaries at approximately 8500BP, material that lay in the Rhine/Thames valley to the east and south and from the exposed areas of Tertiary sands in the southeast, was transported westward into the palaeo channels of the various rivers that had drained the area of the present Thames Estuary (D’Olier 1972). Houbolt (1968) believed most of the sand lying

/RCP1/301164/PBor Coastal Processes January 2009 C- 14 - Draft Report
in the Southern Bight was derived from the River Rhine during and shortly after the last glaciation. At present there are still huge deposits of these Bligh Bank and Buitenbanken Formation (NERC/BGS 1991) sands and gravelly sands in the Southern Bight: much of these from the western side were transported into the Thames Estuary area during the early phases of the last marine transgression. During the transgression, tidal flat deposits (Elbow Formation) were laid down at the sea edge only to be largely eroded again as sea level continued to rise. Some remnants of the Elbow Formation are still to be found in the East Swin channel south of the Gunfleet Sand. As this transgression continued, a marine connection with the more northern parts of the North Sea was effected around 7,500 BP (Jelgersma 1979); then the principal tidal influence swung round to be more northeasterly. Sand entering then from these Rhine and intertidal deposits was swept up into the sandbanks and sand flats that overlie the old palaeo valleys and now dominate the later sedimentary sequences. At the present day the Thames Estuary is still a sink for decreased quantities of bedload transported sediment from these sources. Suspended sediments largely derived from eroding areas of London Clay cliffs at the Naze, the Isle of Sheppey and several areas of exposed seafloor, are to some extent trapped within these in some places, but a great deal is transported out of the estuary to become an important element within the North Sea ‘English River’, a current that intermittently flows northeastwards towards the northern Dutch coast and Heligoland Bight. Orford Ness, Suffolk to the Naze, Essex ( parts of Subcells 3c & 3d ). The southern boundary of this area is taken as the Naze to South Shipwash watershed. This consists of relatively erosion resistant, bedrock elements of the basal part of the London Clay Formation comprising of the Harwich Member. This erosion resistance is due to contained beds of volcanic ash some of which are cemented, particularly the 0.75metre thick, Harwich Stone Band. These beds gives rise to a number of named features of the seabed off the north Essex and south Suffolk coast, such as the Stone Banks, Naze Ledge, West Rocks, parts of the Roughs Shoal, Threshold and South Ship Head. Elsewhere in the area, the Wadgate and Felixstowe Ledges, the Kettle Bottom that acts as the core of the southern end of the Bawdsey Bank, the Flagstone that possibly helps to anchor the southern end of the Whiting Bank, are all expressions of this same basal unit of the London Clay. Bedrock is therefore at or close to seabed over much of this area. a) Sediment Sources Except for the Naze, there is very little sediment at present that can be described as a source material. The silty clays to silty sands that comprise the softer elements of the London Clay do provide some material under the action of strong tidal and wave activity, on exposed areas of the seabed, but as even the coarsest grain size from the London Clay is < 0.250mm, most of this is lost to the area as suspension load towards the northeast, or to the southwest into the East Swin (HR Wallingford report EX 3875).
Coastal Processes /RCP1/301164/PBor Draft Report C- 15 - January 2009
The cliffs at Bawdsey could, if the fronting shingle beach were to be overtopped, provide small inputs of London Clay material and some shelly sand from the overlying Early Pleistocene, Red Crag deposits. These were undoubtedly an important source before the shingle beach had elongated sufficiently from the north to protect them. This applies equally to the cliffs further to the south at Cobbolds Point, Felixstowe. At Orford Ness the high ground to the north west of the spit and upon which stands the town of Orford, comprises sandy, Pliocene, Coralline Crag with overlying Red Crag. This, the watershed between the southward flowing, Butley River and the eastward flowing, River Alde, once extended further to the southeast and had been progressively eroded back to its present position before the shingle spit extended from the north. Sediment from this cliff source could have been an important component up to the time that the cliff line became protected by this extended shingle spit. It is possible that the protective shingle ridge had hardly reached Orford by the 12th century, as the town was then a busy port. The shingle of Orford Spit has been largely derived from the exposures of the Pleistocene, Westleton Beds that outcrop on the Suffolk coast between the Minsmere and Hundred Rivers. At the present day sand is predominant within these deposits though shingle lenses and thin beds are also present. Inland the deposit shows thick beds of shingle and it is therefore very possible that the variable lithology of this deposit has contributed by longshore drift to successive influxes of shingle to the beaches and thus to the formation of the spit, as the cliffs to the north have in the past, eroded rapidly westwards. At other times sand was and is now, the principal sediment being released from the cliffs, though this is largely being contained locally at present. b) Pathways Sand movement around the Shipwash, Whiting and Cork sands is clockwise as evidenced by the asymmetry of sandwaves upon their flanks. To the north of the heads of the Shipwash and Bawdsey banks asymmetric bedforms indicate transport of material from the Southern Bight towards these two converging ‘heads’. In the northern section of the Shipway a sandwave field with asymmetric bedforms indicates sediment movement towards the north. Bawdsey Bank also exhibits this, making it an exception with anticlockwise circulation. Thus there are convergent sediment pathways supplying sediment to these two banks at their northern ends. At the southern end of the Shipwash sandbank a narrow train of southerly directed, sandwaves indicate a sediment pathway into the more central parts of the Thames Estuary. Thus of the five banks only the Shipwash appears to be losing some sediment and is therefore not a permanent sink. There does not appear to be any major sediment pathway linked to the nearshore zone from the Shipwash, Bawdsey and Whiting banks though their position relative to a once southeasterly extended, Orford Ness headland suggests they may have been initially formed as headland or banner banks in its lee. In that case Whiting Bank might be receiving sand winnowed from the mobile sandy shingle of Orford Ness spit. Also due to the close proximity of the Whiting Bank to the coast there may be some sediment interchange under severe wind generated current action.

/RCP1/301164/PBor Coastal Processes January 2009 C- 16 - Draft Report
c) Sinks There are 5 sandbanks in this area that act as sinks of sediment – Shipwash, Bawdsey, Whiting, Cutler and Cork. They are comprised of fine to medium sand, though the Cutler Bank, undoubtedly the most recently formed and still comprised only of an elongate train of sandwaves, is composed of coarse to medium shelly sand. Within these sands are found abundant evidence of a Pleistocene, Crag derivation, with distinctive shells indicating their source. This is also the case particularly in the sands of the Whiting and Bawdsey Banks, and in the sandwave fields that lie between the Shipwash and Bawdsey Banks. The buried channels of the Rivers’ Stour/Orwell, the Deben and to a small extent the Butley whose drowned channel has been largely lost through later peneplanation1, are sinks and are almost completely filled with sediments, generally ranging in a fining- upward sequence from gravel through to silty sands. These are partly fluvial sediments laid down by the river, partly estuarine as sea level rose and finally are marine sands. A major section that is not filled is the Cork Hole, part of the palaeo- Stour channel, where current velocities are too high at present to allow deposition of anything other than coarse sands and gravels, of which none are locally available. Also a small sink for fine muddy sands exists in the deeper water of the southern end of the Shipway channel where filling of the palaeo-Stour channel is also, as yet, incomplete.
1 Downcutting of the rock surface
Coastal Processes /RCP1/301164/PBor Draft Report C- 17 - January 2009
3 SHORELINE PROCESSES
3.1 Tide and Water Levels
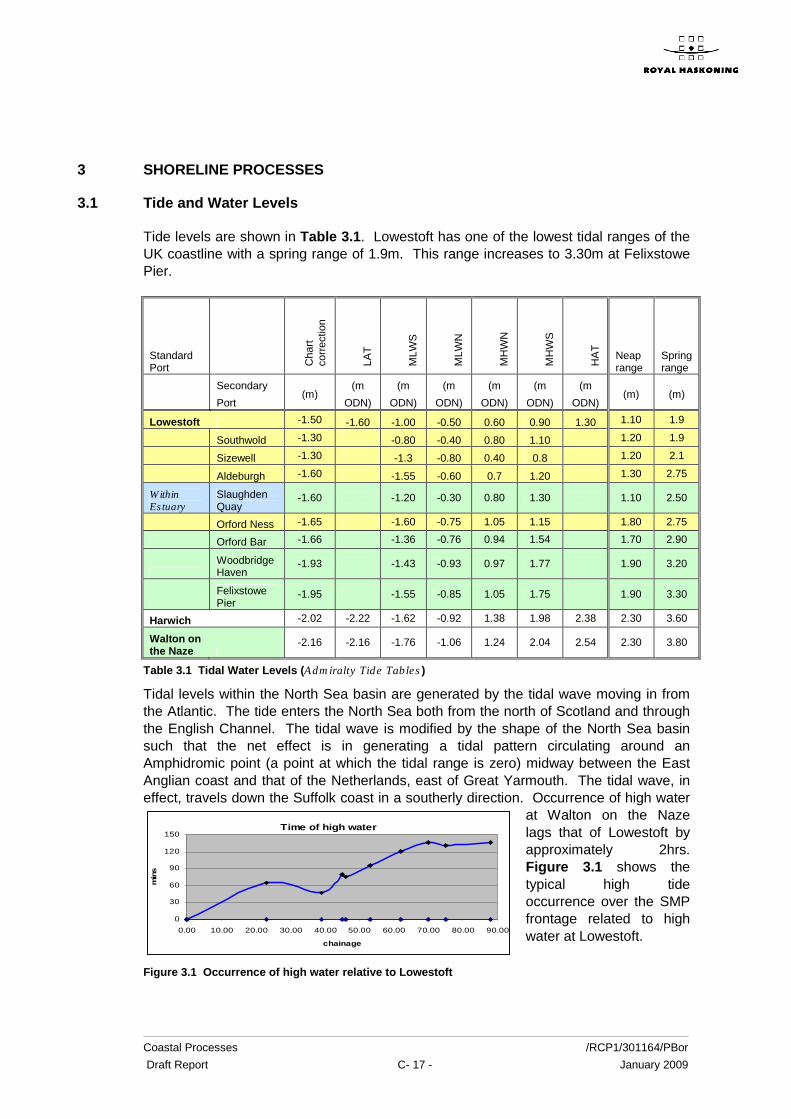
Tide levels are shown in Table 3.1. Lowestoft has one of the lowest tidal ranges of the UK coastline with a spring range of 1.9m. This range increases to 3.30m at Felixstowe Pier.
Standard Port C
hart
corr
ectio
n
LAT
MLW
S
MLW
N
MH
WN
MH
WS
HA
T
Neap range
Spring range
Secondary
Port (m)
(m
ODN)
(m
ODN)
(m
ODN) (m
ODN)
(m
ODN) (m
ODN) (m) (m)
Lowestoft -1.50 -1.60 -1.00 -0.50 0.60 0.90 1.30 1.10 1.9
Southwold -1.30 -0.80 -0.40 0.80 1.10 1.20 1.9
Sizewell -1.30 -1.3 -0.80 0.40 0.8 1.20 2.1
Aldeburgh -1.60 -1.55 -0.60 0.7 1.20 1.30 2.75
Within Estuary
Slaughden Quay
-1.60 -1.20 -0.30 0.80 1.30 1.10 2.50
Orford Ness -1.65 -1.60 -0.75 1.05 1.15 1.80 2.75
Orford Bar -1.66 -1.36 -0.76 0.94 1.54 1.70 2.90
Woodbridge Haven
-1.93 -1.43 -0.93 0.97 1.77 1.90 3.20
Felixstowe Pier
-1.95 -1.55 -0.85 1.05 1.75 1.90 3.30
Harwich -2.02 -2.22 -1.62 -0.92 1.38 1.98 2.38 2.30 3.60
Walton on the Naze
-2.16 -2.16 -1.76 -1.06 1.24 2.04 2.54 2.30 3.80
Table 3.1 Tidal Water Levels (Admiralty Tide Tables)
Tidal levels within the North Sea basin are generated by the tidal wave moving in from the Atlantic. The tide enters the North Sea both from the north of Scotland and through the English Channel. The tidal wave is modified by the shape of the North Sea basin such that the net effect is in generating a tidal pattern circulating around an Amphidromic point (a point at which the tidal range is zero) midway between the East Anglian coast and that of the Netherlands, east of Great Yarmouth. The tidal wave, in effect, travels down the Suffolk coast in a southerly direction. Occurrence of high water
at Walton on the Naze lags that of Lowestoft by approximately 2hrs. Figure 3.1 shows the typical high tide occurrence over the SMP frontage related to high water at Lowestoft.
Figure 3.1 Occurrence of high water relative to Lowestoft
Time of high water
0
30
60
90
120
150
0.00 10.00 20.00 30.00 40.00 50.00 60.00 70.00 80.00 90.00
chainage
min
s
/RCP1/301164/PBor Coastal Processes January 2009 C- 18 - Draft Report
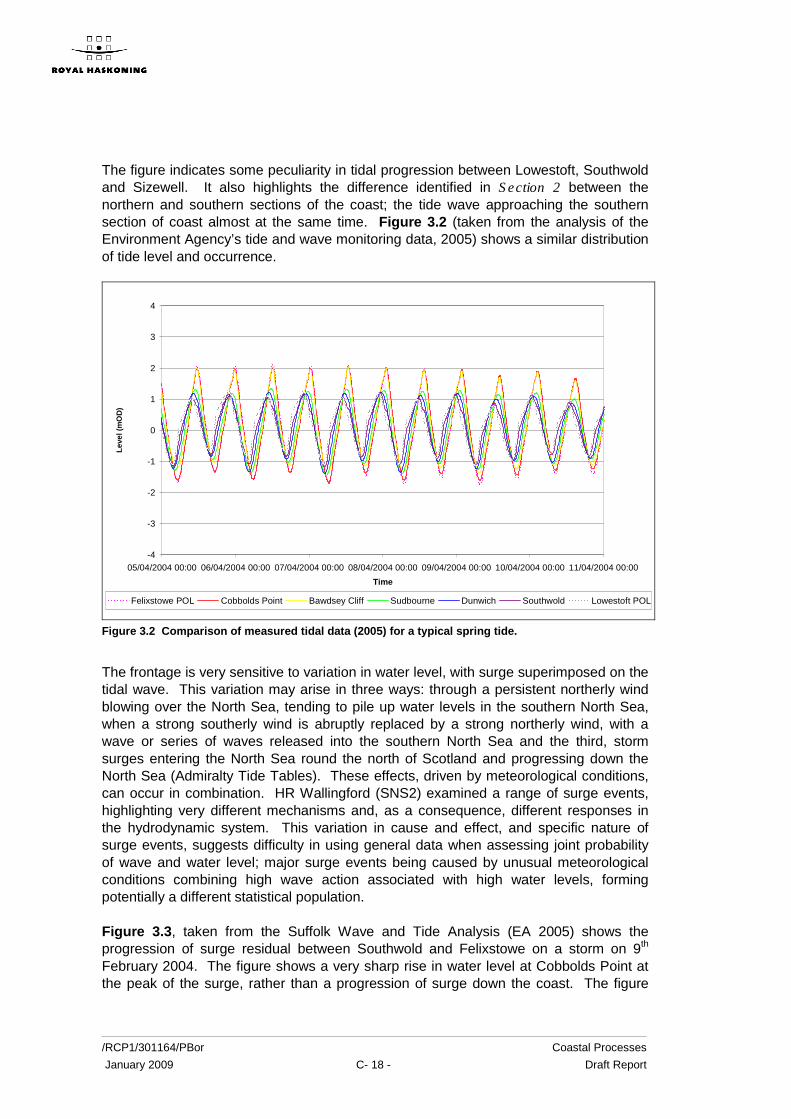
The figure indicates some peculiarity in tidal progression between Lowestoft, Southwold and Sizewell. It also highlights the difference identified in Section 2 between the northern and southern sections of the coast; the tide wave approaching the southern section of coast almost at the same time. Figure 3.2 (taken from the analysis of the Environment Agency’s tide and wave monitoring data, 2005) shows a similar distribution of tide level and occurrence.
-4
-3
-2
-1
0
1
2
3
4
05/04/2004 00:00 06/04/2004 00:00 07/04/2004 00:00 08/04/2004 00:00 09/04/2004 00:00 10/04/2004 00:00 11/04/2004 00:00
Time
Leve
l (m
OD
)
Felixstowe POL Cobbolds Point Bawdsey Cliff Sudbourne Dunwich Southwold Lowestoft POL
Figure 3.2 Comparison of measured tidal data (2005) for a typical spring tide.
The frontage is very sensitive to variation in water level, with surge superimposed on the tidal wave. This variation may arise in three ways: through a persistent northerly wind blowing over the North Sea, tending to pile up water levels in the southern North Sea, when a strong southerly wind is abruptly replaced by a strong northerly wind, with a wave or series of waves released into the southern North Sea and the third, storm surges entering the North Sea round the north of Scotland and progressing down the North Sea (Admiralty Tide Tables). These effects, driven by meteorological conditions, can occur in combination. HR Wallingford (SNS2) examined a range of surge events, highlighting very different mechanisms and, as a consequence, different responses in the hydrodynamic system. This variation in cause and effect, and specific nature of surge events, suggests difficulty in using general data when assessing joint probability of wave and water level; major surge events being caused by unusual meteorological conditions combining high wave action associated with high water levels, forming potentially a different statistical population. Figure 3.3, taken from the Suffolk Wave and Tide Analysis (EA 2005) shows the progression of surge residual between Southwold and Felixstowe on a storm on 9th February 2004. The figure shows a very sharp rise in water level at Cobbolds Point at the peak of the surge, rather than a progression of surge down the coast. The figure

Coastal Processes /RCP1/301164/PBor Draft Report C- 19 - January 2009
also highlights an earlier period where the surge results in two distinct peaks at Southwold and at Cobbolds Point.
Sou
thw
old
Nor
th
Dun
wic
h B
ay
Sud
bour
ne B
each
Baw
dsey
Clif
f
Cob
bold
s P
oint
Fel
ixst
owe
-21-18
-15-12
-9-6
-3peak
-0.60-0.40-0.200.00
0.20
0.40
0.60
0.80
1.00
1.20
1.40
1.60
Residual (m)
Location
timing to peak (hrs)
-21-18-15-12-9-6-3peak
Figure 3.3 Surge Residuals along the Suffolk Coast 9th February 2004.
Table 3.2 gives the extreme water levels (combination of surge and tide) for the frontage (Royal Haskoning 2007). Based on the length of records and quality of data the report suggests a medium level of confidence in these results.
Site ch
(km.) 1:1 yr. 1:5 yr.
1:10
yr.
1:25
yr.
1:50
yr.
1:100
yr.
1:250
yr.
1:500
yr.
1:1000
yr.
Corton 0 2.02 2.4 2.56 2.78 2.94 3.11 3.32 3.49 3.65
Lowestoft 6 2.04 2.42 2.58 2.8 2.96 3.13 3.34 3.51 3.67
Kessingland 13 2.04 2.42 2.58 2.79 2.96 3.12 3.33 3.49 3.65
Southwold 24 2.05 2.42 2.58 2.79 2.94 3.1 3.31 3.47 3.63
Dunwich 30 2.05 2.41 2.57 2.78 2.93 3.09 3.3 3.45 3.61
Sizewell 39 2.05 2.41 2.57 2.78 2.93 3.09 3.29 3.45 3.61
Aldeburgh 45 2.05 2.41 2.57 2.77 2.93 3.08 3.29 3.45 3.6
Orford Ness 53 2.06 2.42 2.58 2.78 2.94 3.09 3.3 3.46 3.61
Hollesley 62 2.35 2.72 2.87 3.08 3.24 3.39 3.6 3.76 3.91
Bawdsey 67 2.47 2.83 2.99 3.2 3.36 3.51 3.72 3.88 4.03
Felixstowe Ferry
70 2.53 2.89 3.05 3.26 3.42 3.57 3.78 3.94 4.09
Felixstowe Pier
75 2.65 3.01 3.17 3.38 3.54 3.69 3.9 4.06 4.21
Harwich 80 2.68 3.05 3.21 3.42 3.57 3.73 3.94 4.1 4.26
Walton-on-the-Naze
88 2.71 3.08 3.24 3.45 3.6 3.76 3.97 4.13 4.29
All values given as m. AOD
Table 3.4 Extreme Water Levels

/RCP1/301164/PBor Coastal Processes January 2009 C- 20 - Draft Report
Figure 3.4 shows the 1:1 yr, 1:100 yr and 1:1000 yr level distribution over the frontage, indicating a significant change in pattern over the southern half of the SMP area. The cause of the change in pattern potentially relates to the shoaling and influence of the bank system at Lowestoft and the shoaling and shoaling and reorientation of the coast beyond Orfordness.
Figure 3.4 Distribution of Extreme Water Levels. (Chainage O km at Corton)
It is important, however, to understand that on any specific event this distribution may alter. Recorded water levels for major events are shown in Table 3.3, highlighting this relative variation and reflecting the comments made earlier with respect to different conditions giving rise to different mechanism for surge generation and different synchronisation with the tide.
Event Extreme
predicted
1:100 yr
1953 1978 1983 1993
Site
Lowestoft (m AOD) 3.13 3.35 2.37 2.69 2.68
Water levels relative to Lowestoft (m)
Southwold - 0.03 - 0.04 - 0.12
Felixstowe Pier 0.44 0.67 0.82 0.27
Harwich 0.6 0.67
Holland on Sea 0.75 0.7 1.09 0.66
Table 3.5 Recorded Variation in Water relative to Lowestoft
3.2 Wave Climate
3.2.1 Offshore Wave Climate
Various offshore wave data has been and is now available relevant to the SMP area. Principal sources used in the most recent studies are from the Met Office model
Extreme water levels
1
1.5
2
2.5
3
3.5
4
4.5
0 10 20 30 40 50 60 70 80 90Chainage
m (
AO
D)
1:1 yr. 1:100 yr. 1:1000yr.

Coastal Processes /RCP1/301164/PBor Draft Report C- 21 - January 2009
prediction points EA04, EA05 and EA06; shown in Figure 3.5 (based on Suffolk Wave and Tide 2005). In addition, measured data has been available from Kentish Knock to
the south and Smith Knoll to the north. Current real time data is being collected as part of the Wavenet System, this has been in operation since 2002 promising to provide a long term record of actual wave condition in the future, although at present still a relatively short record. Various analysis has been undertaken of the offshore data. This has been collated and summary information is provided through the SMP2 GIS. Typical plots are shown in Figure 3.6.
Figure 3.5 Location of Offshore Data Points
Although in general terms there is an obvious similarity between the various records, highlighting the general dominance of waves from the north-northeast sector and the south- southwest; the north-northeast tending to include a higher occurrence of higher waves, there is also significant difference in offshore wave climate over the whole frontage. The most northerly site (Dowsing) shows a shift in the northerly sector towards the north, but also a significant element of waves from the southeast. EA04 and 05 show very similar patterns with a strong split in dominance between NNE and SSW. EA06 shows significantly greater spread of waves, with a spread of the northerly wave energy towards the east. Also this distribution picks out that, although overall wave occurrence from the southeast is relatively low, there can be relatively infrequent but high energy occurrence from this direction. This is less evident from the West Gabbard data, with this distribution more akin to that of EA05. The wind hindcast data shows greatest similarity to EA06, suggesting in this southerly area a drawing in of wave energy both from the northerly and southerly wave energy towards the east. In all studies, consideration has been given to the most appropriate offshore data set to be used in deriving inshore wave climates.

/RCP1/301164/PBor Coastal Processes January 2009 - 22 - Draft Report
Dowsing 2003 – 20061 EA042 EA053 EA064
Wave climate hind cast from wind data for Harwich 1973 – 19905 West Gabbard 2002 - 20061 References: 1 – Park & Vincent 2007; 2 – Southern Felixstowe Coastal Strategy, Halcrow 2003; 3 – Minsmere Frontage Coastal Study, Black and Veatch 2005; 4 – Thorpeness to Hollesley, Halcrow 2005; 5 – Harwich Channel Deepening, HR Wallingford 1995. Figure 3.6 Typical wave climates based on offshore sources
0° 15°
30°
45°
60°
75°
90°
105°
120°
135°
150°
165° 180°
195°
210°
225°
240°
255°
270°
285°
300°
315°
330°
345°
0% 4% 8% 12%Percentage
WaveHeight (m)
>0 - 0.5>0.5 - 1>1 - 1.5>1.5 - 2>2 - 2.5>2.5 - 3>3 - 3.5>3.5 - 4>4 - 4.5>4.5 - 5>5 - 5.5>5.5 - 6.5
02000
400060008000
10000
120001400016000
18000
occu
rren
ce
0 30 60 90 120 150 180 210 240 270 300 330
direction
Wave climate hindcast from wind data 1973 - 1990 6.5
6
5.5
5
4.5
4
3.5
3
2.5
2
1.5
1
0.5
0

Coastal Processes /RCP1/301164/PBor Draft Report C- 23 - January 2009
The Thorpeness to Hollesley study used data from both EA05 and EA06, in deriving data for inshore locations to north and south of Orford Ness. The Hollesley to Bawdsey study examined the difference between offshore data points and used data from EA06, recognising that predictions of inshore data north of Orford Ness may not fully represent wave climates over the frontage between Aldeburgh and Orford Ness.
3.2.2 Inshore Wave Climates.
The Suffolk Wave and Tide Analysis, although only based on a year of data, considered this issue in relation to inshore transformation. Figure 3.7 shows the correlation between offshore data and inshore measured data by direction.
0.00
10.00
20.00
30.00
40.00
50.00
60.00
70.00
80.00
0-45 45-90 90-135 135-180 180-225 225-270 270-315 315-360
Wave Direction Sectors (degrees)
Cor
rela
tion
Coe
ffici
ent (
%)
EA4 EA5 EA6
Southwold North Dunwich Bay
Sudbourne Beach Bawdsey Cliffs Comparison between offshore and Triaxys Gauge (figure 3.5)
EA4 EA5 EA6
Triaxys Gauge 62% 65% 80%
Cobbolds Point Figure 3.7 Correlation between offshore and inshore data.
Generally EA06 gives better correlation than other data for each inshore site, except at Southwold North when wave direction is north to east. Other exceptions are that EA05 gives better correlation at Sudbourne for directions NE/E and at Cobbolds Point for directions SE/S.
0.00
10.00
20.00
30.00
40.00
50.00
60.00
70.00
80.00
90.00
100.00
0-45 45-90 90-135 135-180 180-225 225-270 270-315 315-360
Wave Direction Sector (degrees)
Cor
rela
tion
Coe
ffic
ient
EA4EA5EA6
0.00
10.00
20.00
30.00
40.00
50.00
60.00
70.00
80.00
90.00
0-45 45-90 90-135 135-180 180-225 225-270 270-315 315-360
Wave Direction Sector (degrees)
Cor
rela
tion
Coe
ffic
ient
(%)
EA4 EA5 EA6
0.00
10.00
20.00
30.00
40.00
50.00
60.00
70.00
80.00
0-45 45-90 90-135 135-180 180-225 225-270 270-315 315-360
Wave Direction Sectors (degrees)
Cor
rela
tion
Coe
ffic
ent (
%)
EA4 EA5 EA6
0.00
10.00
20.00
30.00
40.00
50.00
60.00
70.00
80.00
0-45 45-90 90-135 135-180 180-225 225-270 270-315 315-360
Wave Direction Sectors (degrees)
Cor
rela
tion C
oef
ficie
nt (%
)
EA4 EA5 EA6
EA4 EA5 EA6
/RCP1/301164/PBor Coastal Processes January 2009 C- 24 - Draft Report
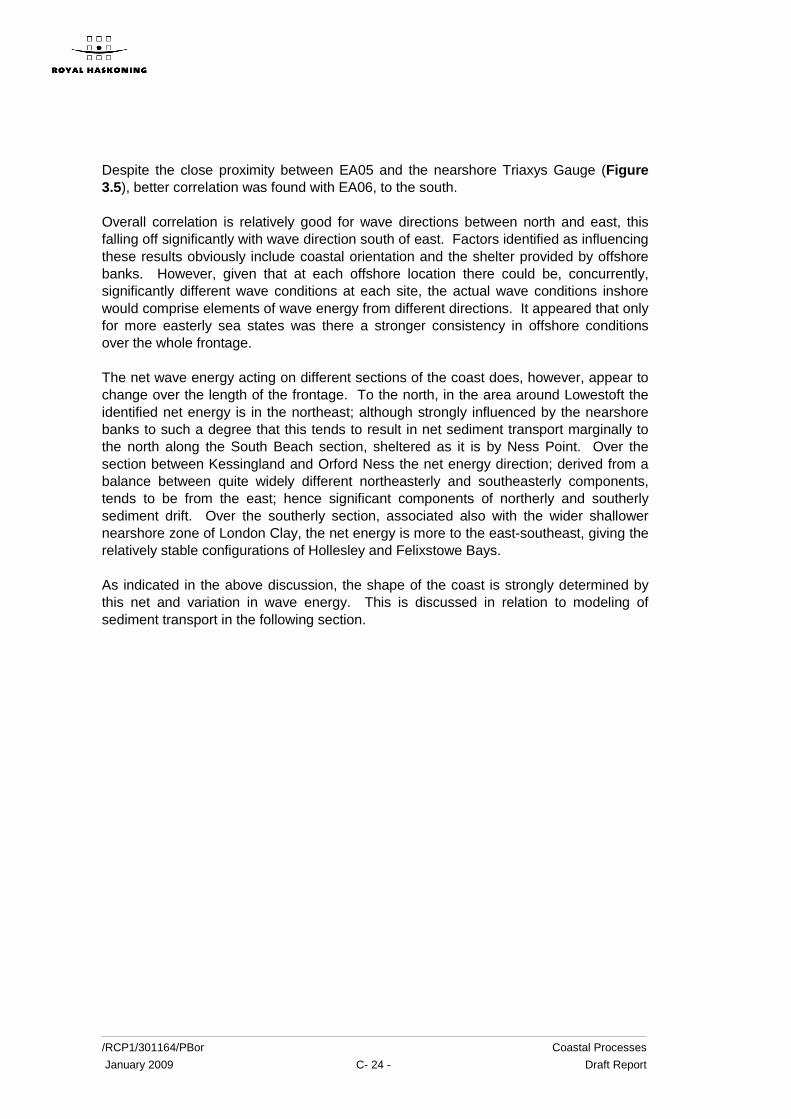
Despite the close proximity between EA05 and the nearshore Triaxys Gauge (Figure 3.5), better correlation was found with EA06, to the south. Overall correlation is relatively good for wave directions between north and east, this falling off significantly with wave direction south of east. Factors identified as influencing these results obviously include coastal orientation and the shelter provided by offshore banks. However, given that at each offshore location there could be, concurrently, significantly different wave conditions at each site, the actual wave conditions inshore would comprise elements of wave energy from different directions. It appeared that only for more easterly sea states was there a stronger consistency in offshore conditions over the whole frontage. The net wave energy acting on different sections of the coast does, however, appear to change over the length of the frontage. To the north, in the area around Lowestoft the identified net energy is in the northeast; although strongly influenced by the nearshore banks to such a degree that this tends to result in net sediment transport marginally to the north along the South Beach section, sheltered as it is by Ness Point. Over the section between Kessingland and Orford Ness the net energy direction; derived from a balance between quite widely different northeasterly and southeasterly components, tends to be from the east; hence significant components of northerly and southerly sediment drift. Over the southerly section, associated also with the wider shallower nearshore zone of London Clay, the net energy is more to the east-southeast, giving the relatively stable configurations of Hollesley and Felixstowe Bays. As indicated in the above discussion, the shape of the coast is strongly determined by this net and variation in wave energy. This is discussed in relation to modeling of sediment transport in the following section.

Coastal Processes /RCP1/301164/PBor Draft Report C- 25 - January 2009
3.3 Sediment Transport (up dated from SNS2)
The following discussion is taken principally from the collation of sediment transport provided within SNS2, updated to include further information from subsequent studies. The discussion is divided by sections of the coast. Figure 3.8 shows the frontage together with features in the nearshore area.
Figure 3.8 General view of the Suffolk Coast and associated nearshore area
3.3.1 Corton to Southwold
Description of the Coast Lowestoft The Ness feature at Lowestoft is the most easterly point of the British Isles. It may formed where alongshore drift of material from north Norfolk converged with a small amount travelling north from the cliffs on the Suffolk coast (although present-day
Lowestoft Ness
Benacre Ness
Southwold
Thorpe Ness
Aldeburgh
Orford Ness
Dunwich
Bawdsey Cliffs
Cobbolds Point
Landguard Point
Newcome Sand and
Barnard Shoal
Dunwich and Sizewell
Banks
Aldeburgh Ridge
Whiting Bank
Shipwash
Blyth
Minsmere
Alde Ore
Deben
Stour and Orwell
Hundred River
Waveney and Oulton
Broad
Hollesley Bay

/RCP1/301164/PBor Coastal Processes January 2009 C- 26 - Draft Report
estimates of transport rates are to the south on both the northern and southern side of the Ness). It is approximately 4km long and 300m wide at the apex. It is no longer a natural accretionary feature and has suffered progressive erosion over almost 100 years or so. The present position of the Ness is now maintained by seawalls and groynes to protect industrial development. Beaches along the wide foreshore fronting south Lowestoft are generally wide and sandy. However, at Pakefield (the southernmost part of Lowestoft) McCave (1977) reported that the beach was 98% shingle. The swift tidal currents around the Ness at Lowestoft, together with the sand bank orientation suggest that material is being moved offshore at this point (McCave, 1977). Since the development of Lowestoft Harbour the South Beach has developed, with an indication of northerly drift in this area. Benacre Ness Benacre Ness is a cuspate foreland (a low almost triangular promontory) of sand and shingle at Kessingland, south of Lowestoft. As discussed previously historic maps indicate that the Ness has been moving north, against the regional longshore drift direction, at a rate of about 20m/year (Birkbeck College and Babtie, 2000). it has accreted on the updrift side and migrated along the coast in the updrift direction. Birkbeck College and Babtie (2000) state that this occurred because the longshore transport is less than the sediment supply. Russell’s alternative model suggests that the northwards migration against the direction of longshore transport is due to differential accretion on the up-drift side and erosion at the down-drift side. Birkbeck College and Babtie (2000) also performed an analysis of bathymetric charts that supports the theory that the Ness is a site where sediment is lost from the beach and transferred offshore. Repeat surveys showed that the Ness was accreting at a rate of around 66,000m3/year (between 1995 and 1997). Birkbeck College and Babtie (2000) also concluded that sediment is being transferred offshore and is accumulating below the 12m contour. This conclusion agrees with McCave (1978). Covehithe to Southwold There is an undulating cliff line to the north of Southwold. It is intersected by a number of stretches of low-lying land backed by saltmarsh (Easton Broad and Easton Marshes for example). Cliff recession here is very rapid, providing a supply of sand to the beaches at Southwold. However, there has been a variation in the source material from gravel to sand with time as the gravel in the cliffs exists in localised banks. Moreover, continued coastal retreat threatens the stability of the shingle ridges, which protect the low lying marshland from inundation by the sea. McCave (1978) reported that from Kessingland and Covehithe the shingle percentage increases from 60% up to 100% at Orford. Estimates of longshore transport rates Vincent (1979) and Onyett and Simmonds (1983) The Vincent (1979) and Onyett and Simmonds (1983) methodologies used longshore sand transport rate was calculated using daily vector-averaged wind data from a single site, input into empirical equations to calculate the offshore wave heights. The results are summarised Table 3.6.

Coastal Processes /RCP1/301164/PBor Draft Report C- 27 - January 2009
mE mN Location Dir Q[m3/yr] Type Reference 655200 295500 North 162 20000 Wave Vincent(1979) 655500 294500 North 166 40000 Wave Onyett and
Simmonds(1983) 655700 293700 Lowestoft 180 500000 Wave Onyett and
Simmonds (1983)
654000 289000 Lowestoft South
5 41000 Wave Vincent(1979)
653750 287700 Lowestoft South
2 13000 Wave Onyett and Simmonds(1983)
653500 283350 Benacre South
200 105000 Wave Onyett and Simmonds(1983)
Table 3.6 Vincent (1979) Onyett and Simmonds (1983) transport rates from Lowestoft to Southwold
Halcrow, 1998, 1999, 2001b Halcrow calculated the longshore transport rate at Caister in 1998, between Great Yarmouth and Lowestoft in 1999 and between Lowestoft South and Thorpeness in 2001. In all three studies, Halcrow used their Beach Plan Shape Model. This is an evolutionary beach plan shape model that updates the beach plan position after calculating the longshore transport rate for every wave record at each model drift node. The results from the extensive 2001 study are included as far south as Southwold only in this section. The estimated drift rates from the three studies are shown in Table 3.7. Halcrow (1999) calculated the longshore transport rate at seven management units between Gorleston and Lowestoft (although only three full years of wind data was available). Longshore drift was, on average, to the south in all cases and the average annual rate for the 1998 bathymetry varied between 17,000m3/year and 60,000m3/year, with an average value of 30,000m3/year. mE mN Location Dir Q[m3/yr] Type Reference 652800 312500 Caister 161 100,000 Wave Halcrow(1998) 654150 298550 Corton 159 30,000 Wave Halcrow(1999) 654000 290300 Lowestoft
South 199 1,050 Wave Halcrow(2001b)
653700 286700 Kessingland 2 28,150 Wave Halcrow(2001b) 653800 284300 Benacre
Ness South 200 2,500 Wave Halcrow(2001b)
652800 281500 Covehithe 200 18,250 Wave Halcrow(2001b) 651400 277300 Southwold 190 3,100 Wave Halcrow(2001b) Table 3.7 Longshore transport rates by Halcrow from Caister to Southwold
Discussion of longshore transport rates The calculated transport rates between Corton and Lowestoft Ness are in the range 20,000m3/year to 60,000m3/year of sand. The Onyett and Simmonds value of 500,000m3/year at Lowestoft appears to be unreasonably large. It is much higher than the transport rates from other studies, or indeed, from other points on their own study. All transport rates are to the south here, though. The Halcrow (2001b) sediment
/RCP1/301164/PBor Coastal Processes January 2009 C- 28 - Draft Report
transport at South Lowestoft was very small but still southerly, whereas Vincent’s (1979) transport rate was to the north. Onyett and Simmonds (1983) and Halcrow (2001b) also predict northerly transport between Lowestoft and Kessingland. This is consistent with observations of erosion of the beach between Kessingland and Pakefield. The longshore transport returns to a southerly direction, probably on the northern side of Benacre Ness (although it is moving north towards the null point). The exact point at which the drift direction changes to the south is not known (and will vary with wave conditions and the bathymetry). Birkbeck College and Babtie (2000) concluded that historically Benacre Ness has moved north at a rate of about 20m/year. They calculated that the Ness is accreting (at around 60,000m3/year between 1995 and 1997) but that sediment was also lost offshore at the Ness. Their proposed mechanism for the northward migration was that the sediment supply exceeded sediment lost. For this to happen, with the Ness accreting and losing sediment offshore would have required a substantial sediment transport rate from the north or south to Benacre Ness. It is unlikely that such a supply could have come from littoral drift, given the proximity of the area of northerly drift near Kessingland and the southerly drift rates calculated from Benacre south. The sediment balance for Benacre Ness is therefore in some doubt. However, there does seem to be a link between Benacre Ness and the sandbanks to the north-east (HR Wallingford, 2002a). The overall interpretation of the sediment budget for Benacre Ness is that it is fed from the north by littoral drift but loses sand to the south by littoral drift and moves north by differential accretion and erosion. It also loses sand to offshore, with the likely destination of sand being the sandbanks to the northeast. The volume may undergo increases and decreases as the sediment budget varies in time. The Halcrow (2001b) longshore drift rates continue to the south as far as Thorpeness (the southern extent of the study). The transport rates are all low (less than 20,000m3/year, south of Benacre Ness). The rates calculated in previous studies by Vincent (1979) and Onyett and Simmonds (1983) and shown in Table 3.6 were all much higher, being in the range 100,000 – 200,000m3/year. However, these rates were all for sand transport and the beach material in this region increases from about 60% shingle to almost 100% shingle on moving south. Therefore (as Vincent pointed out) the transport rates from these studies are difficult to interpret in terms of changes to shingle beaches. Shingle is transported at a rate of the order of 1/15 that of sand. The Vincent (1979) and Onyett and Simmonds (1983) results are therefore broadly compatible with, although perhaps slightly larger than, the Halcrow (2001b) study when this is taken this into account. The Halcrow (2001b) results are therefore taken as the best estimates of mean longshore drift in this region. McCave (1978) provides evidence that the cliffs at Covehithe and Easton erode by about 30,000m3/year. He also used grain size analysis to suggest that material moves north and south from there, with the minority of this sand moving north towards Lowestoft. The longshore transport calculations suggest that there is no path north from the Covehithe and Easton cliffs to Lowestoft along the beach. This does not exclude the possibility of there being an offshore path. Conceptual sediment transport map Sediment enters this area by longshore transport from the north. Around Great Yarmouth the offshore banks produces a complicated pattern of wave transformation

Coastal Processes /RCP1/301164/PBor Draft Report C- 29 - January 2009
that induces some localised northerly sediment transport around South Denes. This offshore bank configuration is not stable, but varies in time, which alters the longshore transport on the beach significantly. The direction of mean transport at a point can change when the banks move. Tidal processes interact with wave-driven processes to move sediment offshore, in a complicated manner that is not included in present-day longshore drift rate models. The shoreline sediment transport is to the south between Great Yarmouth and Lowestoft. Some sediment is lost to offshore at the Ness. There is a drift null point around Kessingland, with localised drift to the north (towards Lowestoft). The beach is eroding around the site of the drift null point and this has been noted as a feature of the location north of Beneacre Ness as it has progressed northward. The longshore transport returns to the south on the southern side of Benacre Ness and remains southerly right down to Southwold. Benacre Ness is moving northwards towards the drift null point. The mechanism for its migration and its sediment balance are in some doubt. There does appear to be a sediment pathway between Benacre Ness and the offshore sandbanks to the north-east. There does not appear to be a sediment pathway north along the coast from the cliffs of Covehithe and Dunwich to Benacre Ness. Recently (1991-1996) there has been a reduction in the beach volume of around 2% per year between Great Yarmouth and Southwold, with the erosion decreasing to the south. Halcrow (Southwold Coastal Study 2005) also suggests that there is a strong sediment pathway in the nearshore zone such that material drawn down from the shore along the Covehythe cliffs may move rapidly southward.
3.3.2 Southwold to Landguard Point
Description of the Coast Southwold to Thorpe Ness The town of Southwold is situated on high ground and is fronted by a relatively narrow, heavily groyned sand and shingle beach. South of the town a wide sand shingle beach has built up against the north pier of Southwold Harbour. It is likely that sand is transported in suspension across the harbour entrance, since Walberswick Beach, south of the harbour is relatively stable. The entrance was entrained in the 16th century. Since then there has been a regression of 120m in the high water mark on the southern (downdrift) side (Taylor and Marsden, 1983). The shingle ridge between Walberswick and Dunwich now regularly overtops and fans of shingle are deposited on the low lying landward side. The orientation of the shoreline south of Walberswick forms a bay shape anchored at its southern end by the higher cliffs of Dunwich. The Dunwich and Minsmere cliffs are eroding, providing a source of sediment to the beach, estimated at 40,000m3/year by Clayton et al. (1983). South of the Minsmere cliffs is the low lying land of the Minsmere valley, fronted by a shingle ridge. The north south orientated coastline is historically relatively stable. The land then rises at Sizewell running into the Thorpe Ness Cliffs down to Thorpe Ness.

/RCP1/301164/PBor Coastal Processes January 2009 C- 30 - Draft Report
Thorpe Ness is formed on the outcrop of Red Crag, with an area of accumulated sediment. 8.1.2 Aldeburgh and Orford Ness to Shingle Street The town of Aldeburgh is situated south of the promontory of Thorpe Ness, which tends to restrict southward net littoral drift. Seawalls protect the town itself and the foreshore has in the past been heavily groyned. At present the northern part of the frontage, forming a bay between the southern end Aldeburgh town and Thorpe Ness is relatively stable. South of the town which has limited sediment supply from the north is protected by recently constructed defences. South of the Martello Tower, beyond the southern end of the town, is the beginning of Orford beach. This is a massive shingle bank that extends south as far as Orford Haven (North Weir Point) to form Orford Ness. This deflects the mouth of the River Alde from an approximately west to east alignment to a roughly north to south alignment. The change in alignment occurs at Slaughden, south of the town centre and to the north of Orford Ness. Changes in the rate of littoral drift or changes in the severity of wave action could affect the stability of Orford Ness, from the Martello Tower to Orford Haven. Fortunately, the shingle ridge along most of this frontage is wide. Any breach, however, could result in the inundation of large tracts of low-lying partly reclaimed marshland immediately landward of the ridge. Reversals of sediment movement on the northern part of the Ness between Slaughden and Aldeburgh have been noted (pers. comm.) when waves are from the southeast. Under these conditions, sediment moves north towards Aldeburgh. Orford Ness is a shingle cuspate foreland that shows changes in elevation attributed to changes in sea-level rise during its formation. Birkbeck College and Babtie (2000, henceforth BC&B) report that it appears to have formed since the rate of sea level rise slowed around 6000 years ago and was probably formed from a spit. It has been supplied with sediment by longshore transport from the north. The growth of the Ness is shown by ancient shorelines, preserved as shingle ridges. Orford Ness has gone through cyclic variations in plan shape and will continue to be extremely sensitive to wave climate. BC&B used an analysis of beach profile data from 1991 to 1997 to conclude that there is erosion on the northern side of the Ness and accretion along the southern side, this being confirmed by more recent study of the frontage (Thorpe Ness to Hollesley Halcrow 2007. BC&C also suggested erosion appeared to be greater than accretion at the apex, indicating a longer term erosion (or southwards translation) of the Ness. More recent data would suggest an effective flattening of the apex such that increasing erosion will tend to spread both north and south. This is possibly influenced by the presents of the nearshore banks and the gap between the banks at the apex (Figure 3.8). The shingle ridges continue south to Orford Haven, at which point shingle accumulates in a series of nearshore shingle banks. These form the route by which shingle is transported downdrift to the west of Shingle Street. Changes in the distribution of shingle banks off Orford Haven could also have a wide impact, by interrupting the supply of shingle to the downdrift coast.

Coastal Processes /RCP1/301164/PBor Draft Report C- 31 - January 2009
Hollesley to The River Deben At Bawdsey the land rises and the cliffs extend southwards to Bawdsey Manor, on the north side of the mouth of the River Deben. To the north of the cliffs is a wide low lying bay protected by a shingle bank, and behind this a flood defence. This frontage relies on the shingle beach as the primary defence against flooding. Although apparently quite stable this bank is dependent, ultimately, on the supply from Orford Spit across the mouth of the Alde Ore. There has been a period build up and release of sediment in front of Shingle Street. The shingle backed bay at present is held at its southern end by the defences at East Lane. The cliff to the south is erosive, but well protected by the shingle banks. The cliff is made of the same material as the few sandwaves that form Cutler Bank. There are extensive shingle banks (The Knolls) at Woodbridge Haven which provide a considerable amount of shelter from wave activity to the low-lying shoreline at Felixstowe Ferry on the south shore of the Haven. The Knolls are fed by southerly transport and act as a temporary sediment store, extending southwards as their volume increases. Some sediment can move across the estuary to the southern side, and occasionally the channel breaks through the banks and takes a more northerly alignment (Pettitt et al, 2001). The volume of sediment to the south of the new channel then moves onshore. It then moves into the Deben and up towards Felixstowe Ferry, or southwards towards Felixstowe. Felixstowe to Landguard Point The beach in front of Felixstowe is groyned along its entire length and negligible shoreline movement has occurred since the groynes were installed. Some of the groynes are now in a poor condition, however and short-term fluctuations in beach level threaten to undermine the seawalls or create an overtopping problem (Halcrow, 2001c). The beaches towards Landguard Point have a significantly greater shingle portion than along the rest of the Felixstowe frontage. As shingle requires a more severe wave condition to move it and most of the storms come from the northeast, this suggests a net southerly movement of shingle to the Point. Shingle used to be extracted from the beach at Landguard Point during the mid-1980s. Since then no extraction has taken place and Halcrow (2001c) noted that no significant accumulation of beach material had been witnessed. However, Halcrow (2001c) also report that from 1996-2000 shingle accumulations formed on the southern side of Landguard Jetty and migrated northwards toward the Port of Felixstowe. Leggett et al. (1998) calculated that beach volumes did not change, on average, during the period 1991– 1996 between Southwold and Felixstowe. Schans et al. (2001) noted that there were low average changes in the beach volumes and decreasing standard deviations between the river Deben and the Naze. Estimates of longshore drift rates between Southwold and Felixstowe Black and Veatch Black and Veatch undertook a detailed examination of drift as part of the Minsmere Coastal Study. The potential longshore drift rates were determined using the bulkrate algorithm described by Kamphuis (1991). A 12 year time series data set was used, with two sediment sizes representing coarse sand 2mm and typical shingle 10mm.

/RCP1/301164/PBor Coastal Processes January 2009 C- 32 - Draft Report
Standardised beach slopes were used. The results for both materials are shown in Table 3.8. The location for the modelling was based on the EA profiles for the frontage. mE mN Location Dir Q[m3/yr] Type Source Reedland
Marshes n 8000 Wave,
10mm sh Black and Veatch (2005)
Reedland Marshes
n 27500 Wave, 2mm sh
Black and Veatch (2005)
Dunwich Cliffs
s 3800 Wave, 10mm sh
Black and Veatch (2005)
Dunwich Cliffs
s 13000 Wave, 2mm sh
Black and Veatch (2005)
S1b2 s 5700 Wave, 10mm sh
Black and Veatch (2005)
S1b2 s 19700 Wave, 2mm sh
Black and Veatch (2005)
S1b4 n 2300 Wave, 10mm sh
Black and Veatch (2005)
S1b4 n 8100 Wave, 2mm sh
Black and Veatch (2005)
S1b6 n 600 Wave, 10mm sh
Black and Veatch (2005)
S1b6 n 2200 Wave, 2mm sh
Black and Veatch (2005)
Ness House
s 2700 Wave, 10mm sh
Black and Veatch (2005)
Ness House
s 9300 Wave, 2mm sh
Black and Veatch (2005)
Table 3.8 Black and Veatch results for the Walberswick to Thorpe Ness Frontage
Halcrow (2001b) The southern part of the Halcrow (2001b) study ran from Southwold to Thorpeness. The modelling was performed using the Beach Plan Shape Model. All their transport rates were low (less than or equal to 11,000m3/year) and all were to the south. The results are summarised in Table 3.9. mE mN Location Dir Q[m3/yr] Type Reference 651400 277300 Southwold 190 3,100 Wave Halcrow(2001b) 648400 271900 Reedland
Marshes 198 11,000 Wave Halcrow(2001b)
647800 264800 Sizewell 182 3,450 Wave Halcrow(2001b) 647800 260600 Thorpeness 178 300 Wave Halcrow(2001b) Table 3.9 Longshore transport rates from Southwold to Thorpeness (Halcrow, 2001b)
Vincent (1979) and Onyett and Simmonds (1983)

Coastal Processes /RCP1/301164/PBor Draft Report C- 33 - January 2009
The transport rates from Vincent (1979) and Onyett and Simmonds (1983) studies in this region are summarised in Table 3.10. The methodologies were described earlier. mE mN Location Dir Q[m3/yr] Type Source 651300 276500 Southwold 196 200,000 Wave Onyett and Simmonds
(1983) 650000 274250 Walberswick 224 210,000 Wave Onyett and Simmonds
(1983) 649200 273200 Walberswick 213 148,000 Wave Vincent(1979) 648100 270550 Dunwich 190 130,000 Wave Onyett and Simmonds
(1983) 648000 267700 Dunwich 0 101,000 Wave Vincent (1979) 647800 263200 Sizewell 180 85,000 Wave Vincent (1979) 647800 261300 Thorpeness North 178 200,000 Wave Onyett and
Simmonds (1983) 647500 259500 Thorpeness
South 202 55,000 Wave
Onyett and Simmonds (1983)
646000 251500 Aldeburgh 185 80,000 Wave Vincent (1979) 641300 246600 Orford 242 195,000 Wave Vincent (1979) 636500 242000 Shingle
Street 207 83,000 Wave Onyett and Simmonds
(1983) 636300 241300 Shingle
Street 198 64,000 Wave
Vincent (1979)
633150 237450 Bawdsey 230 210,000 Wave Onyett & Simmonds (1983)
630800 234400 Felixstowe 245 400,000 Wave Onyett & Simmonds (1983)
Table 3.10 Longshore transport rates by Vincent and Oynett and Simmonds from Southwold to Felixstowe.
Posford Duvivier (2000b) Posford Duvivier (2000b) used the coastal profile model UNIBEST-LT to analyse longshore transport rates between Orford Ness and Felixstowe. UNIBEST-LT models tide and wave induced longshore currents, wave set up and set down and longshore sediment transport distribution across the beach profile. The model contains various formulae for calculating the transport rate of sand or shingle due to predefined wave climate and tidal regime. Wave data were input to the model from the Southern Met Office offshore wave station. The calculated potential transport rates are shown in Table 3.11. mE mN Location Dir Q[m3/yr] Type Source 644200 248150 Orford
Ness 242 132,700 Wave Posford
Duvivier(2000b) 638750 245150 North Weir
Point 231 67,200 Wave Posford
Duvivier(2000b) 636900 242650 Shingle
Street 31 83,300 Wave Posford
Duvivier(2000b) 633150 237450 Bawdsey 227 141000 Wave Posford

/RCP1/301164/PBor Coastal Processes January 2009 C- 34 - Draft Report
Duvivier(2000b) 631750 235000 Felixstowe 210 62700 Wave Posford
Duvivier(2000b) Table 3.11 Mean potential longshore transport rates from Posford Duvivier (2000b)
HR Wallingford (1997) HR Wallingford (1997) used the DRCALC model to calculate the long-term average potential net drift on the upper shingle beach, above the 0m contour as a layer of shingle covers the upper beach from Deben Estuary to Landguard Point. DRCALC calculated the total longshore drift produced by the wave climate using the CERC formula. No data was available for the size distribution of the shingle so the model was run using an assumed size of shingle. The magnitudes of the transport rates are therefore uncertain, but the relative size and direction should be consistent. The wave model was run at mean high water level as the upper beach transport was affected more by waves arriving at higher water levels. A bathymetry from 1992 was used. The transport rates from 1973-1990 are given in Table 3.12. The results were very sensitive to beach direction. The net drift results from a balance between largest waves, which approach the beach from the east and larger numbers of smaller waves from the south-east and south. The results from the part of the study north of the Harwich Channel are shown in Table 3.12. HR Wallingford’s 1997 results were based on an earlier, 1993, set of model results. Halcrow (2001c), plus Dobbie and Partners (1990), IECS (1993) and SMP (1995) Most of the modelling results for Cobbolds Point to Landguard Point were reviewed in Halcrow (2001c). They included the longshore transport results of Dobbie and Partners (1990), IECS (1993), HR Wallingford (1997) and Shoreline Management Partnership (SMP, 1995). They did not include the work of Onyett and Simmonds (1983) or the Posford Duvivier (2000b) predictions from the southern end of their Hollesley to Bawdsey study (as reported earlier). They concluded that each successive modelling effort had improved on the previous ones. They then went on to model the area from Cobbolds Point to Landguard Point. The Halcrow (2001c) results are the most site-specific and calibrated results to date for that frontage. Indeed Halcrow (2001c) states that the rates that they calculated were not potential transport rates, but were ‘actual theoretical’ transport rates. mE mN Location Dir Q Type Source 632440 235350 Cobbolds
Point 210 36000 Wave Dobbie and
Partners(1990) 631055 234264 Landguard to
Cobbolds 247 90200 Wave Dobbie and
Partners(1990) 629949 233377 Landguard to
Cobbolds 210 33000 Wave Dobbie and
Partners(1990) 628982 231940 Landguard
Point 213 40000 Wave Dobbie and
Partners(1990) 628750 232000 Landguard
Point 205 60000 Wave IECS(1993)
634121 237377 Bawdsey 234 8500 Wave, Sh HR Wallingford(1997)
632440 235350 Cobbolds 30 3200 Wave, Sh HR

Coastal Processes /RCP1/301164/PBor Draft Report C- 35 - January 2009
Point Wallingford(1997) 631055 234264 Landguard to
Cobbolds 247 13600 Wave, Sh HR
Wallingford(1997) 629949 233377 Landguard to
Cobbolds 30 3900 Wave, Sh HR
Wallingford(1997) 628982 231940 Landguard
Point 213 3700 Wave, Sh HR
Wallingford(1997) 631600 234900 Cobbolds
Point 3100 SMP (1995)
630600 234450 Felixstowe Spa Gardens
13600 SMP (1995)
630100 234200 Felixstowe Pleasure Pier
9500 SMP (1995)
630640 234935 North of Cobbolds Point
37 500 Wave, Sh Halcrow(2001c)
631470 234830 South of Cobbolds Point
248 1250 Wave, Sh Halcrow(2001c)
630670 234440 Felixstowe Spa Gardens
240 2700 Wave, Sh Halcrow(2001c)
630130 234180 North of Pleasure Pier
235 2450 Wave, Sh Halcrow(2001c)
629780 233800 South of Pleasure Pier
33 1500 Wave, Sh Halcrow(2001c)
629280 232890 Felixstowe Manor End
27 5900 Wave, Sh Halcrow(2001c)
628830 232130 Landguard Common
33 11650 Wave, Sh Halcrow(2001c)
628380 231360 North of Landguard Point
34 6050 Wave Sh, Halcrow(2001c)
Table 3.12 Predicted longshore transport rates from Bawdsey to Landguard Point
Discussion of longshore drift rates from Southwold to Aldeburgh One result that is notable is the Vincent (1979) transport rate at Dunwich, which is to the north. The cause of this northward transport is the shelter provided by Dunwich Bank, which prevents waves from the north-east driving as much sediment south as they would have done, had the bank not been there. However, Vincent (1979) argued that the convergence of large quantities of sediment suggested by his results was unsupported by evidence from the site. The authors conclude that there is unlikely to be a significant drift reversal at this location and that Vincent’s result may have been due to difficulties in modelling the wave conditions inshore of Dunwich bank. The work by Black and Veatch (2005) also showed considerable variation in net drift patterns along the whole frontage, with effective null points at Minsmere sluice through to Sizewell. As with observations by Vincent, the presence of the nearshore bank was recorded as having a significant impact on drift rates. Halcrow observed that variation in the position

/RCP1/301164/PBor Coastal Processes January 2009 C- 36 - Draft Report
of the bank, particularly at the low point between banks could cause substantial local variation. All rates bar those of Vincent, suggest that Thorpeness acts a significant constraint on sediment movement. Halcrow indicate that sediment movement past Aldeburgh is relatively limited. Discussion of longshore drift rates from Aldeburgh to Shingle Street Sediment transport along this stretch of coastline has been studied by Posford Duvivier (2000b) Vincent (1979) and Onyett and Simmonds (1983) and Halcrow (2005). The transport rates are broadly in agreement from Aldeburgh past Orford Ness. The rates are similar along Shingle Street, but the Posford Duvivier direction is opposite to that predicted by Vincent and Onyett and Simmonds. The reason offered for this change in direction was that the local beach angle restricted the supply of sediment from the north. However, it may be possible that the offshore wave point used in the study was too far south to adequately represent the waves at that point. The Vincent and Onyett and Simmonds results were calculated for sand, in an area where the beaches are almost entirely of gravel. The high transport rates and low amount of sand present implies that any sand entering this stretch of coastline is rapidly transported through the area without settling to form sand beaches. The shingle moves more slowly and lower volumes are transported for a particular sand transport potential. In 1966/7 a beach recharge scheme moved 350,000m3 of shingle northwards from Orford Ness to Aldeburgh replenish the eroding shingle ridge. Taylor and Marsden (1983) reported that after 15 years most of it had disappeared, implying a transport rate of the order of 20,000m3/year of shingle. Discussion of longshore drift rates from River Deben to Landguard Point North of the River Deben (at Bawdsey) (1983) Posford Duvivier (2000b) and HR Wallingford (1997) agree that net drift is to the south, but the predicted volumes are significantly different. All HR Wallingford’s modelling is of shingle above the 0mCD contour, while Onyett and Simmonds and Posford’s modelling was for the entire beach width. Onyett and Simmonds, of course, modelled sand. The total longshore transport rate is a combination of the whole-beach sand modelling and the shingle modelling from the top of the beach. Longshore transport rates between Bawdsey and Landguard Point were calculated by Onyett and Simmonds (1983), Dobbie and Partners (1990), IECS (1993), HR Wallingford (1997), Shoreline Management Partnership (SMP, 1995), Posford Duvivier (2000b) and Halcrow (2001c). The Halcrow (2001c) results were produced following a review of previous studies. They are broadly in agreement with the HR Wallingford (1997) results. HR Wallingford (1997) and Halcrow (2001c) both predict very low northerly transport rates between Cobbolds Point and Bawdsey. Halcrow (2001c) state that north-easterly storms are refracted so that they are almost normal to the coast there, thereby inducing little littoral drift. They also stated that the more common but lower waves from the southeast will approach the shore at a more acute angle and cause the dominant drift. However, it is clear that the longshore transport direction along most of the coastline is from north to south and there is certainly southerly transport at the river Deben. Therefore any modelled northerly drift there must be a local phenomenon, caused by the change in beach orientation. Moreover, the

Coastal Processes /RCP1/301164/PBor Draft Report C- 37 - January 2009
modelled drift to the south of Cobbold’s Point is southerly (although Halcrow suggest that a substantial amount of sediment past the point is moved into the nearshore area). Cobbolds Point therefore appears to be a point of drift divergence but there would also have to be a point of drift convergence (or offshore transport) between Cobbold’s Point and the River Deben if this were so. This may be an unnecessarily complicated view of the situation as low net transport rates are rather unreliable as they tend to be the difference between two much larger terms. It is simpler to regard the broad pattern of longshore transport to be from north to south between the Deben and Felixstowe. There may be a small, local region of northerly drift in the north of Cobbolds Point; influence in part by the position of the Knolls, but the transport rates there are low and the variability large so this cannot be regarded as a major drift feature. Conceptual sediment transport map Longshore transport is southwards along most of this coastline. There is a supply of sediment of around 40,000m3/year from the eroding cliff at Dunwich. Drift past Thorpe Ness is low. The percentage of shingle on the beach increases to virtually 100% at Orfordness. It is believed that sand leaves the coast at Orfordness. There is southwards net movement of shingle along Orfordness, although the direction of transport can reverse under appropriate wave conditions. Schans et al. (2001) identified a boundary between regions of different beach behaviour near the southern tip of Orford Ness. The predicted longshore transport rates at Bawdsey Manor, just north of the River Deben were all to the south-west, implying that beach material from in front of Bawdsey Cliff may be carried across the River Deben entrance. This ties in with observations of downdrift erosion south of the old military fort at East Lane Bawdsey in 1996. The interpretation of longshore drift around Felixstowe is based on Halcrow (2001c). The broad pattern of longshore transport is from north to south between the Deben and Felixstowe. There may be a small, local region of northerly drift in the north of Cobbolds Point, but the transport rates there are low and the variability large so this cannot be regarded as a major drift feature. The Pleasure Pier to the south-west of Cobbolds Point would appear to be a point of drift convergence as the net drift is northwards between the Landguard Point and the Pleasure Pier, except for small reversals. The most notable exception is that there is southwards drift at Landguard Jetty. Some of the shingle moving south to Landguard Point then gets pushed into Harwich Harbour and north towards the harbour. There is little evidence of accretion at the Pleasure Pier however. Rather there are indications of erosion. Modelling by Halcrow (2001c) suggest that this area received a high concentration of wave energy and was therefore a point where beach material was transported offshore during storms.
3.4 Coastal Change
3.4.1 Base Data
All major studies have included an analysis of coastal change in terms of erosion and accretion. These are largely based upon the information collated as part of the Sea Defence Management Study (SDMS) which was itself based on an analysis of historical
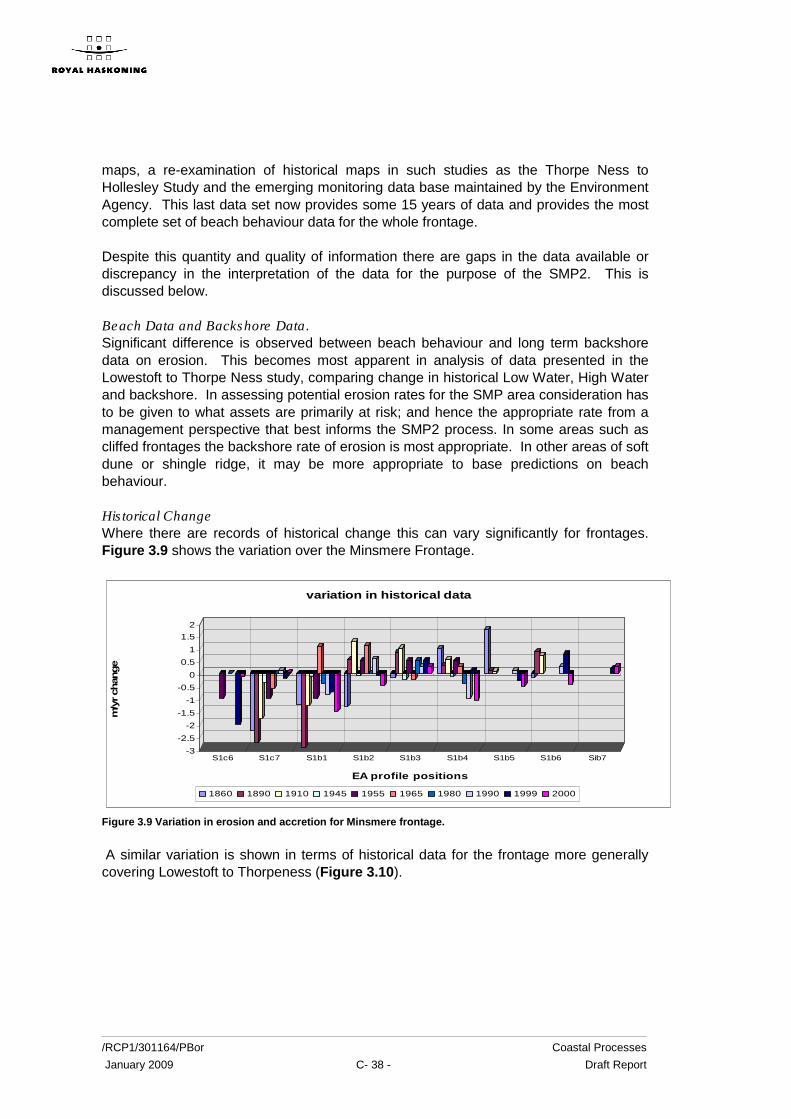
/RCP1/301164/PBor Coastal Processes January 2009 C- 38 - Draft Report
maps, a re-examination of historical maps in such studies as the Thorpe Ness to Hollesley Study and the emerging monitoring data base maintained by the Environment Agency. This last data set now provides some 15 years of data and provides the most complete set of beach behaviour data for the whole frontage. Despite this quantity and quality of information there are gaps in the data available or discrepancy in the interpretation of the data for the purpose of the SMP2. This is discussed below. Beach Data and Backshore Data. Significant difference is observed between beach behaviour and long term backshore data on erosion. This becomes most apparent in analysis of data presented in the Lowestoft to Thorpe Ness study, comparing change in historical Low Water, High Water and backshore. In assessing potential erosion rates for the SMP area consideration has to be given to what assets are primarily at risk; and hence the appropriate rate from a management perspective that best informs the SMP2 process. In some areas such as cliffed frontages the backshore rate of erosion is most appropriate. In other areas of soft dune or shingle ridge, it may be more appropriate to base predictions on beach behaviour. Historical Change Where there are records of historical change this can vary significantly for frontages. Figure 3.9 shows the variation over the Minsmere Frontage.
Figure 3.9 Variation in erosion and accretion for Minsmere frontage. A similar variation is shown in terms of historical data for the frontage more generally covering Lowestoft to Thorpeness (Figure 3.10).
-3
-2.5
-2
-1.5
-1
-0.5
0
0.5
1
1.52
m/y
r ch
ange
S1c6 S1c7 S1b1 S1b2 S1b3 S1b4 S1b5 S1b6 Sib7
EA profile positions
variation in historical data
1860 1890 1910 1945 1955 1965 1980 1990 1999 2000

Coastal Processes /RCP1/301164/PBor Draft Report C- 39 - January 2009
Figure 3.10 variation in patterns of erosion between Lowestoft and Thorpe Ness over time.
In certain areas it is possible to distinguish trends based on other coastal process and geomorphological evidence presented earlier. In other areas, such as Lowestoft and Cobbolds Point, defence of the coastline does not allow any true estimate of what erosion might have been, or might be, without defences. Estimates have to be developed from information based on similar coastal features, taking account of the nature of the shore and coastline.
3.4.2 Prediction of Shoreline Change.
Change and erosion or accretion of the frontage arises from movement of sediment. In areas of significant long-shore, or possible cross-shore, movement, where there is a net imbalance in supply compared to loss, there would be change. Most typically and strongly for this section of coast the frontage between Benacre Ness and Southwold is an area where material is moved south with little sediment supply from the north. In this area the soft cliffs are eroding providing a balance in foreshore material. The same is true, but to a lesser degree, for the frontage between Aldeburgh and Orford Ness; although here the beach is required to feed off it own bulk, hence the continuing thinning of the bank at Slaughden. A similar process is occurring at Orford Ness itself, where wave energy acting against the exposed apex results in feed obviously to the south but also possibly to some degree to the north. More locally and resisted by defences, there is erosion potential at significant hard points of the coast: at Lowestoft Ness, East Lane and Cobbolds Point. Other hard points such as to the southern end of Lowestoft South Beach, at Southwold, and the southern point of Aldeburgh, this pressure is local but more intermittently applies. In most other areas the coast, although there is still a through put of sediment, the overall balance of supply; occasionally disrupted by variation in drift supply or draw down of beaches, the coastline is relatively stable. Such underlying stability is seen at Lowestoft South Beach, Pakefield, south of Southwold and Walberswick to Dunwich; although over this frontage determined by the outfall of the Blyth, Dunwich to Thorpe
6
7.5 9
10.5 12
13.5 15
16.5 18
19.5 21
22.5 24
25.5 27
28.5 30
31.5 33
34.5 36
37.5 39
40.5 42
6
2006
Comparison of erosion rates from 1884-1905, 1905 -1946, 1946 - 1971, 1991-2006
-8--7 -7--6 -6--5 -5--4 -4--3 -3--2 -2--1 -1-0 0-1 1-2 2-3 3-4 4-5 5-6
6-7 7-8 8-9 9-10
67.
5 910
.5 1213
.5 1516
.5 1819
.5 2122
.5 2425
.5 2728
.5 3031
.5 3334
.5 3637
.5 3940
.5 42
6
2006
Chainage
Rates of measured erosion and accretion

/RCP1/301164/PBor Coastal Processes January 2009 C- 40 - Draft Report
Ness, Thorpe Ness to Aldeburgh, Hollesley Bay, the mouth of the Deben and at Felixstowe. Change along these more stable frontages is largely controlled by the various hard points or control features of the shoreline; such that the relative stability of Lowestoft South Beach is determined by the controls imposed by Lowestoft Ness and harbour, the headland to the south and the offshore banks. Similarly the position of Southwold controls to a degree the erosion of the cliffs immediately to the north. The Walberswick bay is influenced by Southwold, the Blyth outfall and Dunwich Cliffs, which also, along with the Minsmere cliffs and Thorpe Ness influence the Minsmere frontage. Thorpe Ness and the control imposed to the south of Aldeburgh allow the stability of the bay between. East Lane, as an artificial surrogate for the Bawdsey Cliffs, acts to contain Hollesley bay sediment and Cobbolds point and Landguard act to retain Felixstowe Bay. Changes in the position of any of these control features would result in a change in orientation of the bays between; as the coast re-adjusts to the change in balance between the angle of wave energy, the supply and loss of sediment. Change, within these more stable bays and frontages, is also determined by relative water level. In effect, any increase in water level relative to the profile of the shore will result in pressure for the shore to move landward. The ability to roll landward as a competent beach depends on the bulk of the shoreline profile. Where there is significant amount of material, in areas such as Orford Ness and Spit or within Hollesley Bay, the structure of the shore is likely to roll back maintaining its basic profile. In other areas such as Walberswick Bay, where there is already significant overtopping, this roll back is likely to progress as overwash fans of sediment, forming eventually into a series of barrier banks and lagoons. In estimating future erosion rates these various factors have to be considered: the control of the shore geomorphologically, the existing pressure for erosion; given the potential for increasing energy on the shore with increased water levels and increased wave height and the degree and nature of roll back of the shore as it adjusts to a new profile. The analysis over the epochs of the SMP2 (years 2025, 2055 and 2105) are presented as a spreadsheet (a copy of which is presented in the following tables 3.13 – No Active Intervention, and 3.14 – With Present management). No Active Intervention is defined as being the scenario where no further work is taken to maintain or mange defences. With Present Management is based on existing management practice prior to the conclusion of SMP2. The tables are set out estimating future erosion at 500m points (chainage) along the whole coast. These estimates are derived from a variety of data sources as discussed earlier. For each data point, for each of the baseline scenarios, three estimates of erosion distance are reported. The guidance figure is derived using Defra guidance for sea level rise and adjusting the average reported erosion accordingly over time. The high estimate uses the Defra guidance on sea level rise increased by 20%. This is applied to a higher value of existing erosion rate taken from available data. The low estimate of erosion uses the Defra guidance on sea level rise reduced by 20% and applies this to a lower value of existing erosion rate taken from available data. It should

Coastal Processes /RCP1/301164/PBor Draft Report C- 41 - January 2009
be noted that the erosion distances do not attempt to define probabilities to the high and low bands. The approach taken is to define a realistic range taken from the variation in existing data and taking account of potential range of uncertainty in sea level rise. The estimates take into account the presence of defences and are based on the residual life under the two baseline scenarios. Annex 1 to this appendix presents the estimated coastal change in map form. These maps cover information for the No Active Intervention scenario and the With Present Management scenario. The maps also show the Environment Agency Indicative Flood Zones areas together with identification of key environmental data. Reference should be made specifically to the latest Environment Agency Flood risk mapping in assessing flood risk. The flood risk zones are shown in relation to development of SMP policy only. A third set of maps are included showing the anticipated coastal change under SMP2 policy. The coast change has to be indicative in that, particularly in areas where the plan proposes managed realignment, further examination would be required in terms of the actual line taken to defence. Annex 2 to this appendix provides a summary of information on defences.

/RCP1/301164/PBor Coastal Processes January 2009 C- 42 - Draft Report
Table 3.13 Estimated range of erosion under the No Active Erosion scenario.

Coastal Processes /RCP1/301164/PBor Draft Report C- 43 - January 2009

/RCP1/301164/PBor Coastal Processes January 2009 C- 44 - Draft Report

Coastal Processes /RCP1/301164/PBor Draft Report C- 45 - January 2009
Table 3.14 Estimated range of erosion under the With Present Management scenario.

/RCP1/301164/PBor Coastal Processes January 2009 C- 46 - Draft Report

Coastal Processes /RCP1/301164/PBor Draft Report C- 47 - January 2009


![arXiv:1807.01232v2 [cs.CV] 25 Sep 2018 · Unclassified 1138. km 95.4 km 1750.8 km 164.5 km 3148.7 km Total 3685.0 km 425.3 km 3536.9 km 1029.5 km 8676.6 km 2.5 Challenge 3 - Las](https://static.fdocuments.in/doc/165x107/5f107f837e708231d44967c4/arxiv180701232v2-cscv-25-sep-2018-unclassiied-1138-km-954-km-17508-km.jpg)


