Appendix: Business Tax Burdens in Canada’s Major … ssentia oi nteiene e-Brief Appendix Appendix:...
23
1 Essential Policy Intelligence e-Brief Appendix Appendix: Business Tax Burdens in Canada’s Major Cities: The 2017 Report Card By Adam Found and Peter Tomlinson This appendix comprises three sections: a discussion on the economic impact of business taxation, the Business Property Tax Report Card evaluation and the tax data informing the METR estimates. The Economic Impact of Business Taxation: Burden, Response and Harm While the METR is a widely-recognized measure of the burden of a business tax, it is designed neither to measure the sensitivity of businesses to, nor the economic harm arising from, such a burden. In other words, the METR does not indicate the extent to which the value of business capital stock and investment (i.e., the ultimate tax base of any business tax) is reduced in response to business taxation, nor the associated economic damage. To measure responsiveness to taxation, economists appeal to the tax elasticity, which is the percentage reduction in the long-run value of the tax base for a one percent increase in the tax rate. 1 While technically speaking the tax elasticity is a negative number, often only its magnitude is discussed or graphed (i.e. the negative sign is suppressed) for ease of reference in economic studies. Adopting this convention, the tax elasticity curve increases with the tax rate, as would be expected. As a result, by incenting tax avoidance and evasion and by suppressing productive economic activity, a tax erodes its own base so long as that base is producible and/or mobile, which is almost always the case. 2 Hence, the tax elasticity can be translated into a tax base retention curve that relates the long-run value of the tax base (or percent of tax base value retained) to the tax rate. As would be expected, the tax base retention curve decreases with the tax rate. Going one step further, the tax base retention curve can then be translated into a revenue hill (i.e., Laffer curve) that relates long-run revenue to the tax rate. The top of the revenue hill corresponds to the revenue- maximizing tax rate, at which point the tax elasticity is equal to 1 (in magnitude). There is no defendable public policy rationale for levying a tax rate greater than the revenue-maximizing tax rate. That is, the revenue- maximizing tax rate is an upper bound for the socially optimal tax rate, if even such a positive tax rate exists for the tax in question. While the tax elasticity curve, tax base retention curve and revenue hill each in their own way reflect the response to a tax burden, they all indicate economic harm arises from taxation. This harm is quantifiable as the marginal cost of public funds (MCPF), which is the dollar amount the economy is damaged by a one dollar tax hike. 3 This statistic summarizes the cost of the economic inefficiencies (i.e., misallocation of resources) arising 1 This is sometimes also referred to as the tax-base elasticity, as in Found (2014b) and Ferede and Dahlby (2016). Also, by “tax rate” we implicitly mean “effective tax rate”. 2 A well-known exception is land, which is why land value taxation is efficient. 3 See Ferede and Dahlby (2016) for an excellent discussion of the MCPF and an application of it to corporate income, personal income and retail sales taxation in Canada.
Transcript of Appendix: Business Tax Burdens in Canada’s Major … ssentia oi nteiene e-Brief Appendix Appendix:...

1
Essential Policy Intelligence
e-BriefAppendix
Appendix: Business Tax Burdens in Canada’s Major Cities: The 2017 Report Card
By Adam Found and Peter Tomlinson
This appendix comprises three sections: a discussion on the economic impact of business taxation, the Business Property Tax Report Card evaluation and the tax data informing the METR estimates.
The Economic Impact of Business Taxation: Burden, Response and Harm
While the METR is a widely-recognized measure of the burden of a business tax, it is designed neither to measure the sensitivity of businesses to, nor the economic harm arising from, such a burden. In other words, the METR does not indicate the extent to which the value of business capital stock and investment (i.e., the ultimate tax base of any business tax) is reduced in response to business taxation, nor the associated economic damage.
To measure responsiveness to taxation, economists appeal to the tax elasticity, which is the percentage reduction in the long-run value of the tax base for a one percent increase in the tax rate.1 While technically speaking the tax elasticity is a negative number, often only its magnitude is discussed or graphed (i.e. the negative sign is suppressed) for ease of reference in economic studies. Adopting this convention, the tax elasticity curve increases with the tax rate, as would be expected.
As a result, by incenting tax avoidance and evasion and by suppressing productive economic activity, a tax erodes its own base so long as that base is producible and/or mobile, which is almost always the case.2 Hence, the tax elasticity can be translated into a tax base retention curve that relates the long-run value of the tax base (or percent of tax base value retained) to the tax rate. As would be expected, the tax base retention curve decreases with the tax rate.
Going one step further, the tax base retention curve can then be translated into a revenue hill (i.e., Laffer curve) that relates long-run revenue to the tax rate. The top of the revenue hill corresponds to the revenue-maximizing tax rate, at which point the tax elasticity is equal to 1 (in magnitude). There is no defendable public policy rationale for levying a tax rate greater than the revenue-maximizing tax rate. That is, the revenue-maximizing tax rate is an upper bound for the socially optimal tax rate, if even such a positive tax rate exists for the tax in question.
While the tax elasticity curve, tax base retention curve and revenue hill each in their own way reflect the response to a tax burden, they all indicate economic harm arises from taxation. This harm is quantifiable as the marginal cost of public funds (MCPF), which is the dollar amount the economy is damaged by a one dollar tax hike.3 This statistic summarizes the cost of the economic inefficiencies (i.e., misallocation of resources) arising
1 This is sometimes also referred to as the tax-base elasticity, as in Found (2014b) and Ferede and Dahlby (2016). Also, by “tax rate” we implicitly mean “effective tax rate”.
2 A well-known exception is land, which is why land value taxation is efficient.
3 See Ferede and Dahlby (2016) for an excellent discussion of the MCPF and an application of it to corporate income, personal income and retail sales taxation in Canada.
2
Essential Policy Intelligence
e-BriefAppendix
from the distortionary effect of taxation. Unsurprisingly, the MCPF is an increasing function of the tax elasticity, which in turn is an increasing function of the METR (Found 2017). Given these relationships, in future editions in this series we will consider relating our METR estimates to measures of responsiveness to and harm of business taxation.
Business Property Tax Report Card Results
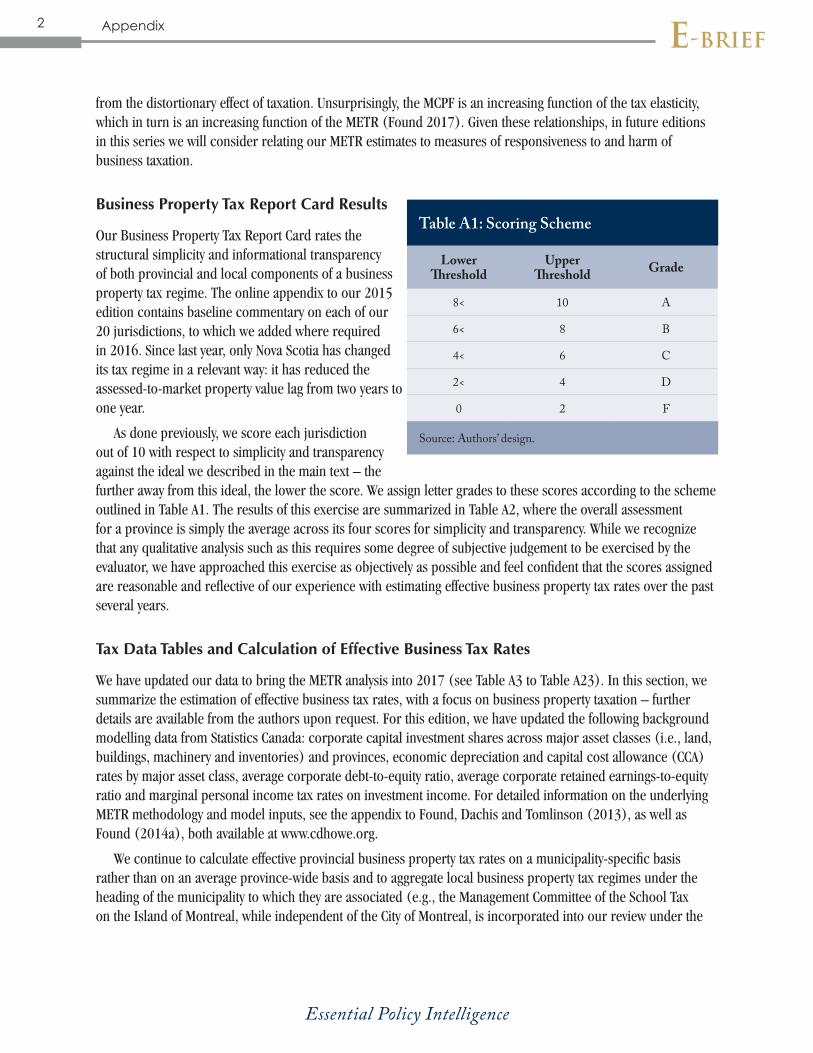
Our Business Property Tax Report Card rates the structural simplicity and informational transparency of both provincial and local components of a business property tax regime. The online appendix to our 2015 edition contains baseline commentary on each of our 20 jurisdictions, to which we added where required in 2016. Since last year, only Nova Scotia has changed its tax regime in a relevant way: it has reduced the assessed-to-market property value lag from two years to one year.
As done previously, we score each jurisdiction out of 10 with respect to simplicity and transparency against the ideal we described in the main text – the further away from this ideal, the lower the score. We assign letter grades to these scores according to the scheme outlined in Table A1. The results of this exercise are summarized in Table A2, where the overall assessment for a province is simply the average across its four scores for simplicity and transparency. While we recognize that any qualitative analysis such as this requires some degree of subjective judgement to be exercised by the evaluator, we have approached this exercise as objectively as possible and feel confident that the scores assigned are reasonable and reflective of our experience with estimating effective business property tax rates over the past several years.
Tax Data Tables and Calculation of Effective Business Tax Rates
We have updated our data to bring the METR analysis into 2017 (see Table A3 to Table A23). In this section, we summarize the estimation of effective business tax rates, with a focus on business property taxation – further details are available from the authors upon request. For this edition, we have updated the following background modelling data from Statistics Canada: corporate capital investment shares across major asset classes (i.e., land, buildings, machinery and inventories) and provinces, economic depreciation and capital cost allowance (CCA) rates by major asset class, average corporate debt-to-equity ratio, average corporate retained earnings-to-equity ratio and marginal personal income tax rates on investment income. For detailed information on the underlying METR methodology and model inputs, see the appendix to Found, Dachis and Tomlinson (2013), as well as Found (2014a), both available at www.cdhowe.org.
We continue to calculate effective provincial business property tax rates on a municipality-specific basis rather than on an average province-wide basis and to aggregate local business property tax regimes under the heading of the municipality to which they are associated (e.g., the Management Committee of the School Tax on the Island of Montreal, while independent of the City of Montreal, is incorporated into our review under the
Source: Authors’ design.
Lower Threshold
Upper Threshold Grade
8< 10 A
6< 8 B
4< 6 C
2< 4 D
0 2 F
Table A1: Scoring Scheme

3
Essential Policy Intelligence
e-BriefAppendix
heading of “Montreal”). To promote transparency and accountability, we make every reasonable effort to identify statutory business property tax rates by local levying authority in the data tables. Clearly, however, it would be too cumbersome to reflect these decompositions in the METR charts – we must strike a balance between precision and readability of the results.
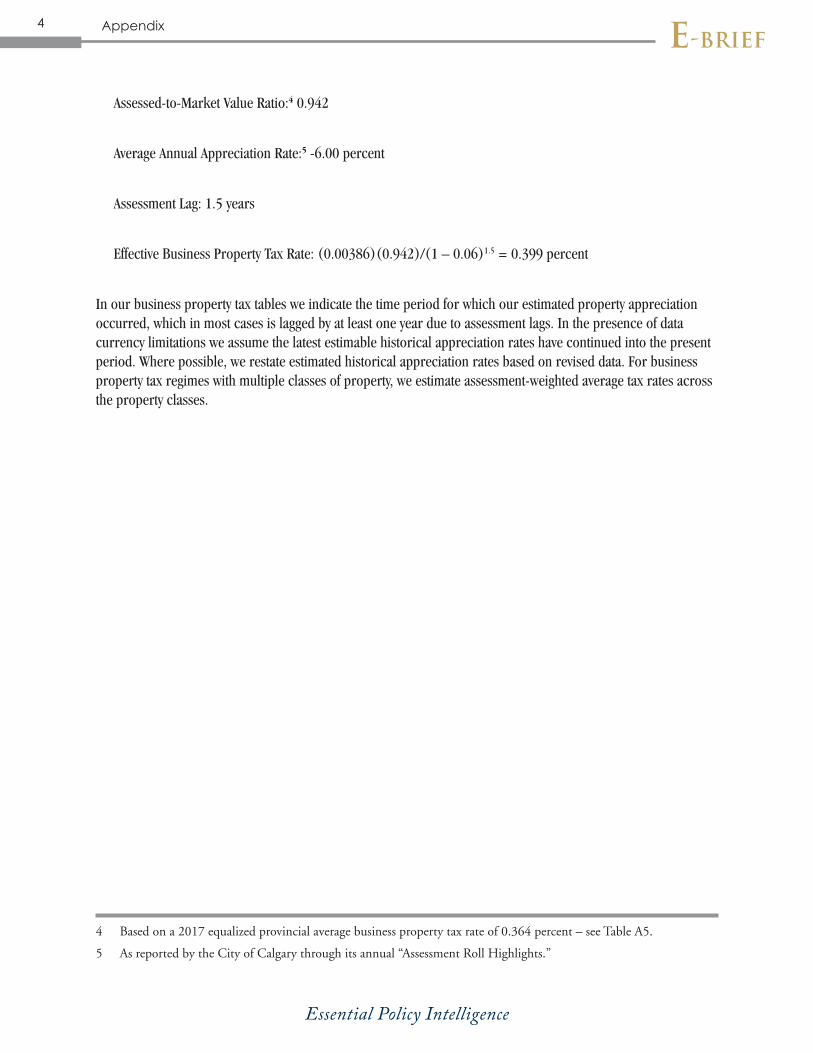
In many jurisdictions, effective business property tax rates differ from their statutory counterparts because of deviations from market-based valuation such as assessment discounts and lags between assessed and market property values engendered by the assessment system. As per our standard practice, we account for assessment lags greater than one year by discounting statutory business property tax rates in accordance with our estimated property appreciation rates. Here is how the calculation works using Alberta’s 2017 business property tax in Calgary as an example:
Statutory Business Property Tax Rate: 0.386 percent
Source: Authors’ calculations from government websites.
Province
Provincial BPT Regime Municipal BPT Regime Overall AssessmentSimplicity Transparency Simplicity Transparency
Score Grade Score Grade Score Grade Score Grade Score Grade
British Columbia 8.00 B 9.00 A 8.00 B 9.00 A 8.50 A
Alberta 6.50 B 3.50 D 6.00 C 8.00 B 6.00 C
Saskatchewan 5.00 C 3.50 D 6.00 C 7.00 B 5.38 C
Manitoba 4.50 C 3.00 D 2.00 F 5.00 C 3.63 D
Ontario 2.00 F 2.00 F 4.50 C 7.50 B 4.00 D
Quebec 3.00 D 2.50 D 4.00 D 6.50 B 4.00 D
New Brunswick 8.00 B 9.00 A 10.00 A 9.00 A 9.00 A
Nova Scotia 7.00 B 2.50 D 2.50 D 7.00 B 4.75 C
Prince Edward Island 9.50 A 10.00 A 9.50 A 7.50 B 9.13 A
Newfoundland and Labrador - - - - 7.00 B 7.00 B 7.00 B
National Average 4.75 C 3.66 D 5.44 C 7.55 B 5.40 C
Table A2: Business Property Tax Report Card – 2017
4
Essential Policy Intelligence
e-BriefAppendix
Assessed-to-Market Value Ratio:4 0.942
Average Annual Appreciation Rate:5 -6.00 percent
Assessment Lag: 1.5 years
Effective Business Property Tax Rate: (0.00386)(0.942)/(1 – 0.06)1.5 = 0.399 percent
In our business property tax tables we indicate the time period for which our estimated property appreciation occurred, which in most cases is lagged by at least one year due to assessment lags. In the presence of data currency limitations we assume the latest estimable historical appreciation rates have continued into the present period. Where possible, we restate estimated historical appreciation rates based on revised data. For business property tax regimes with multiple classes of property, we estimate assessment-weighted average tax rates across the property classes.
4 Based on a 2017 equalized provincial average business property tax rate of 0.364 percent – see Table A5.
5 As reported by the City of Calgary through its annual “Assessment Roll Highlights.”

5
Essential Policy Intelligence
e-BriefAppendix
Source: Authors’ calculations from government websites.
Year Property Class
Share of Assessment Base
Statutory BPT Rate
Industrial Property Tax
Credit
Effective BPT Rate
Percent
2013
Utilities 0.54 1.400 0.000 1.400
Major Industry 0.56 0.620 60.000 0.248
Light Industry 2.11 1.080 0.000 1.080
Commercial 96.79 0.620 0.000 0.620
All Business 100.00 0.634 0.333 0.632
2014
Utilities 0.52 1.360 0.000 1.360
Major Industry 0.52 0.600 60.000 0.240
Light Industry 2.60 0.600 0.000 0.600
Commercial 96.37 0.600 0.000 0.600
All Business 100.00 0.604 0.311 0.602
2015
Utilities 0.49 1.360 0.000 1.360
Major Industry 0.48 0.580 60.000 0.232
Light Industry 2.40 0.580 0.000 0.580
Commercial 96.64 0.580 0.000 0.580
All Business 100.00 0.584 0.286 0.582
2016
Utilities 0.46 1.350 0.000 1.350
Major Industry 0.41 0.540 60.000 0.216
Light Industry 2.21 0.540 0.000 0.540
Commercial 96.91 0.540 0.000 0.540
All Business 100.00 0.544 0.249 0.542
2017
Utilities 0.41 1.340 0.000 1.340
Major Industry 0.35 0.480 60.000 0.192
Light Industry 2.69 0.480 0.000 0.480
Commercial 96.54 0.480 0.000 0.480
All Business 100.00 0.484 0.212 0.483
Table A3: British Columbia BPT Rates

6
Essential Policy Intelligence
e-BriefAppendix
Source: Authors’ calculations from government websites.
Year Property Class
Share of Assessment
Base
Statutory BPT RateEffective
BPT RateCity of Vancouver
Metro Vancouver
Other Authorities
Total
Percent
2013
Utilities 0.54 3.636 0.022 0.324 3.982 3.982
Major Industry 0.56 3.298 0.021 0.278 3.597 3.597
Light Industry 2.11 0.820 0.021 0.200 1.041 1.041
Commercial 96.79 0.820 0.015 0.167 1.003 1.003
All Business 100.00 0.849 0.015 0.169 1.034 1.034
2014
Utilities 0.52 3.521 0.020 0.325 3.867 3.867
Major Industry 0.52 3.377 0.019 0.263 3.659 3.659
Light Industry 2.60 0.788 0.019 0.188 0.996 0.996
Commercial 96.37 0.788 0.014 0.163 0.965 0.965
All Business 100.00 0.816 0.014 0.165 0.995 0.995
2015
Utilities 0.49 3.361 0.019 0.325 3.704 3.704
Major Industry 0.48 3.368 0.019 0.262 3.649 3.649
Light Industry 2.40 0.735 0.019 0.187 0.940 0.940
Commercial 96.64 0.735 0.013 0.162 0.910 0.910
All Business 100.00 0.760 0.014 0.164 0.937 0.937
2016
Utilities 0.46 3.089 0.018 0.307 3.414 3.414
Major Industry 0.41 3.390 0.017 0.242 3.650 3.650
Light Industry 2.21 0.661 0.017 0.168 0.847 0.847
Commercial 96.91 0.661 0.013 0.140 0.814 0.814
All Business 100.00 0.684 0.013 0.142 0.838 0.838
2017
Utilities 0.41 2.838 0.015 0.300 3.153 3.153
Major Industry 0.35 3.451 0.014 0.237 3.703 3.703
Light Industry 2.69 0.580 0.014 0.148 0.743 0.743
Commercial 96.54 0.580 0.010 0.122 0.712 0.712
All Business 100.00 0.599 0.011 0.124 0.733 0.733
Table A4: Vancouver BPT Rates

7
Essential Policy Intelligence
e-BriefAppendix
Source: Authors’ calculations from government websites.
Year Property Class
Statutory BPT Rate Assessed-
to-Market Value Ratio
Average Appreciation
Rate
Assessment Lag
Effective BPT Rate
Levied in Calgary
Equalized Provincial
Average
Percent (except Assessed-to-Market Value Ratio and Assessment Lag)
2013 Non-Residential 0.330 0.370 1.120 20.00 1.5 0.281
2014 Non-Residential 0.342 0.372 1.089 11.00 1.5 0.318
2015 Non-Residential 0.346 0.367 1.061 7.00 1.5 0.332
2016 Non-Residential 0.378 0.364 0.963 -4.00 1.5 0.387
2017 Non-Residential 0.386 0.364 0.942 -6.00 1.5 0.399
Table A5: Alberta BPT Rates
Table A6: Calgary BPT Rates
Source: Authors’ calculations from government websites.
Year Property Class
Statutory BPT Rate Assessed- to-Market
Value Ratio
Effective BPT Rate
General BOT-Equivalent Total
Percent (except Assessed-to-Market Value Ratio)
2013 Non-Residential 1.099 0.308 1.407 1.120 1.575
2014 Non-Residential 1.069 0.262 1.331 1.089 1.449
2015 Non-Residential 1.074 0.228 1.301 1.061 1.381
2016 Non-Residential 1.215 0.184 1.399 0.963 1.347
2017 Non-Residential 1.388 0.133 1.521 0.942 1.434

8
Essential Policy Intelligence
e-BriefAppendix
Table A7: Saskatchewan BPT Rates
Source: Authors’ calculations from government websites.
Year Property Class
Statutory BPT Rate
Average Appreciation
Rate
Appreciation Period
Assessment Lag
Effective BPT Rate
Percent (except Appreciation Period and Assessment Lag)
2013 Commercial/Industrial 0.828 7.99 2011-2015 2 0.710
2014 Commercial/Industrial 0.828 7.99 2011-2015 3 0.657
2015 Commercial/Industrial 0.828 7.99 2011-2015 4 0.609
2016 Commercial/Industrial 0.828 7.99 2011-2015 5 0.564
2017 Commercial/Industrial 0.627 7.99 2011-2015 2 0.538
Table A8: Saskatoon BPT Rates
Source: Authors’ calculations from government websites.
Year Property Class
Tax Rate Multiplier
Statutory Uniform Tax Rate
Average Appreciation
Rate
Appreciation Period
Assessment Lag
Effective BPT Rate
Percent (except Appreciation Period and Assessment Lag)
2013 Commercial/Industrial 1.1765 0.751 7.99 2011-2015 2 0.758
2014 Commercial/Industrial 1.1684 0.799 7.99 2011-2015 3 0.741
2015 Commercial/Industrial 1.1676 0.840 7.99 2011-2015 4 0.721
2016 Commercial/Industrial 1.1661 0.872 7.99 2011-2015 5 0.693
2017 Commercial/Industrial 1.1945 0.695 7.99 2011-2015 2 0.712

9
Essential Policy Intelligence
e-BriefAppendix
Source: Authors’ calculations from government websites.
Year Property Class
Share of Assessment
Base
Assessment Discount
Rate
Statutory BPT Rate
Average Apprecia-tion Rate
Apprecia-tion Period
Assessment Lag
Effective BPT Rate
Percent (except Appreciation Period and Assessment Lag)
2013
Pipeline 0.23 50.00 1.175 13.37 2012-2014 2.75 0.416
Railway 1.76 75.00 1.175 8.26 2012-2014 2.75 0.236Other Business 98.02 35.00 1.175 5.64 2012-2014 2.75 0.657
All Business 100.00 35.74 1.175 5.71 2012-2014 2.75 0.649
2014
Pipeline 0.21 50.00 1.149 13.37 2012-2014 1.75 0.461
Railway 1.88 75.00 1.149 8.26 2012-2014 1.75 0.250Other Business 97.90 35.00 1.149 5.64 2012-2014 1.75 0.679
All Business 100.00 35.79 1.149 5.71 2012-2014 1.75 0.670
2015
Pipeline 0.21 50.00 1.175 13.37 2012-2014 2.75 0.416
Railway 1.86 75.00 1.175 8.26 2012-2014 2.75 0.236Other Business 97.93 35.00 1.175 5.64 2012-2014 2.75 0.656
All Business 100.00 35.78 1.175 5.71 2012-2014 2.75 0.648
2016
Pipeline 0.20 50.00 1.089 13.37 2012-2014 1.75 0.437
Railway 2.06 75.00 1.089 8.26 2012-2014 1.75 0.237Other Business 97.74 35.00 1.089 5.64 2012-2014 1.75 0.643
All Business 100.00 35.85 1.089 5.71 2012-2014 1.75 0.634
2017
Pipeline 0.20 50.00 1.049 13.37 2012-2014 2.75 0.371
Railway 2.07 75.00 1.049 8.26 2012-2014 2.75 0.211Other Business 97.73 35.00 1.049 5.64 2012-2014 2.75 0.586
All Business 100.00 35.86 1.049 5.71 2012-2014 2.75 0.578
Table A9: Manitoba BPT Rates

10
Essential Policy Intelligence
e-BriefAppendix
Year School Division
Share of Portioned
Assessment Base
Statutory BPT Rate
Percent
2013
Winnipeg 44.25 1.335
St. James-Assiniboia 15.23 1.335
Pembina Trails 12.04 1.311
Seven Oaks 3.60 1.672
Seine River 1.75 1.537
Interlake 2.29 1.516
Louis Riel 11.67 1.330
River East Transcona 9.17 1.459
All School Divisions 100.00 1.363
2014
Winnipeg 44.28 1.511
St. James-Assiniboia 14.91 1.226
Pembina Trails 12.21 1.213
Seven Oaks 3.52 1.494
Seine River 1.75 1.456
Interlake 2.51 1.400
Louis Riel 11.75 1.241
River East Transcona 9.08 1.332
All School Divisions 100.00 1.380
Table A10: Winnipeg Local School Division BPT Rates
Year School Division
Share of Portioned
Assessment Base
Statutory BPT Rate
Percent
2015
Winnipeg 43.43 1.560
St. James-Assiniboia 15.05 1.268
Pembina Trails 12.93 1.239
Seven Oaks 3.38 1.564
Seine River 1.73 1.520
Interlake 2.46 1.438
Louis Riel 11.76 1.307
River East Transcona 9.25 1.360
All School Divisions 100.00 1.423
2016
Winnipeg 42.99 1.445
St. James-Assiniboia 14.90 1.242
Pembina Trails 13.16 1.209
Seven Oaks 3.41 1.537
Seine River 1.73 1.407
Interlake 2.47 1.316
Louis Riel 12.16 1.276
River East Transcona 9.19 1.300
All School Divisions 100.00 1.349
2017
Winnipeg 42.99 1.501
St. James-Assiniboia 14.90 1.311
Pembina Trails 13.16 1.243
Seven Oaks 3.41 1.613
Seine River 1.73 1.446
Interlake 2.47 1.373
Louis Riel 12.16 1.325
River East Transcona 9.19 1.335
All School Divisions 100.00 1.402
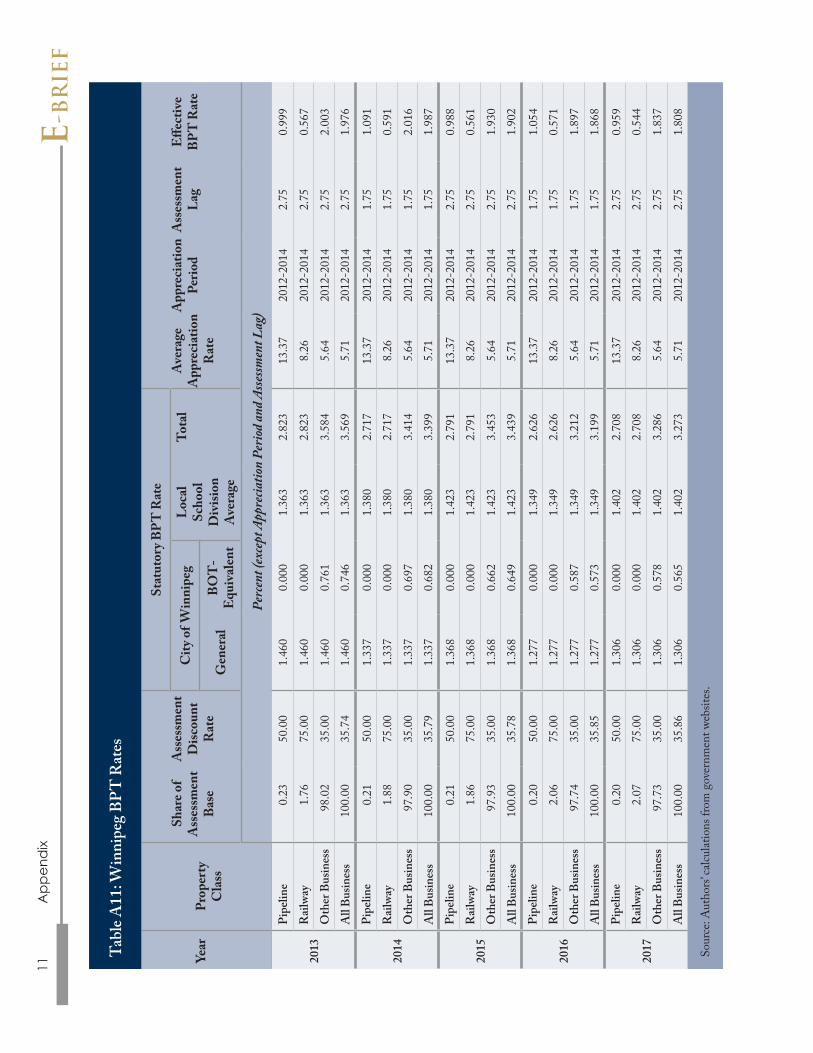
Source: Authors’ calculations from government websites.
Sour
ce: A
utho
rs’ c
alcul
atio
ns fr
om g
over
nmen
t web
sites
.
Year
Prop
erty
C
lass
Shar
e of
Ass
essm
ent
Base
Ass
essm
ent
Disc
ount
R
ate
Stat
utor
y BPT
Rat
eA
vera
ge
App
reci
atio
n R
ate
App
reci
atio
n Pe
riod
Ass
essm
ent
Lag
Effe
ctiv
e B
PT R
ate
City
of W
inni
peg
Loca
l Sc
hool
D
ivisi
on
Ave
rage
Tota
l
Gen
eral
BOT
-E
quiv
alen
t
Perc
ent (
exce
pt A
ppre
ciatio
n Pe
riod
and A
ssessm
ent L
ag)
2013
Pipe
line
0.23
50.0
01.
460
0.00
01.
363
2.82
313
.37
2012
-201
42.
750.
999
Rai
lway
1.76
75.0
01.
460
0.00
01.
363
2.82
38.
2620
12-2
014
2.75
0.56
7
Oth
er B
usin
ess
98.0
235
.00
1.46
00.
761
1.36
33.
584
5.64
2012
-201
42.
752.
003
All
Busin
ess
100.
0035
.74
1.46
00.
746
1.36
33.
569
5.71
2012
-201
42.
751.
976
2014
Pipe
line
0.21
50.0
01.
337
0.00
01.
380
2.71
713
.37
2012
-201
41.
751.
091
Rai
lway
1.88
75.0
01.
337
0.00
01.
380
2.71
78.
2620
12-2
014
1.75
0.59
1
Oth
er B
usin
ess
97.9
035
.00
1.33
70.
697
1.38
03.
414
5.64
2012
-201
41.
752.
016
All
Busin
ess
100.
0035
.79
1.33
70.
682
1.38
03.
399
5.71
2012
-201
41.
751.
987
2015
Pipe
line
0.21
50.0
01.
368
0.00
01.
423
2.79
113
.37
2012
-201
42.
750.
988
Rai
lway
1.86
75.0
01.
368
0.00
01.
423
2.79
18.
2620
12-2
014
2.75
0.56
1
Oth
er B
usin
ess
97.9
335
.00
1.36
80.
662
1.42
33.
453
5.64
2012
-201
42.
751.
930
All
Busin
ess
100.
0035
.78
1.36
80.
649
1.42
33.
439
5.71
2012
-201
42.
751.
902
2016
Pipe
line
0.20
50.0
01.
277
0.00
01.
349
2.62
613
.37
2012
-201
41.
751.
054
Rai
lway
2.06
75.0
01.
277
0.00
01.
349
2.62
68.
2620
12-2
014
1.75
0.57
1
Oth
er B
usin
ess
97.7
435
.00
1.27
70.
587
1.34
93.
212
5.64
2012
-201
41.
751.
897
All
Busin
ess
100.
0035
.85
1.27
70.
573
1.34
93.
199
5.71
2012
-201
41.
751.
868
2017
Pipe
line
0.20
50.0
01.
306
0.00
01.
402
2.70
813
.37
2012
-201
42.
750.
959
Rai
lway
2.07
75.0
01.
306
0.00
01.
402
2.70
88.
2620
12-2
014
2.75
0.54
4
Oth
er B
usin
ess
97.7
335
.00
1.30
60.
578
1.40
23.
286
5.64
2012
-201
42.
751.
837
All
Busin
ess
100.
0035
.86
1.30
60.
565
1.40
23.
273
5.71
2012
-201
42.
751.
808
Tabl
e A11
: Win
nipe
g BP
T R
ates
11e
-Br
ief
App
end
ix

12
Essential Policy Intelligence
e-BriefAppendix
Source: Authors’ calculations from government websites.
Year Property Class
Statutory BPT Rate
Average Appreciation
Rate
Appreciation Period
Assessment Lag
Effective BPT Rate
Percent (except Appreciation Period and Assessment Lag)
2013 Non-Residential 1.260 7.24 2012-2016 4 0.953
2014 Non-Residential 1.220 7.25 2012-2016 4 0.922
2015 Non-Residential 1.190 7.25 2012-2016 4 0.899
2016 Non-Residential 1.180 7.26 2012-2016 4 0.892
2017 Non-Residential 1.140 7.26 2012-2016 4 0.861
Table A12: Ontario BPT Rates Levied on New Construction

13
Essential Policy Intelligence
e-BriefAppendix
Source: Authors’ calculations from government websites.
Year Property Class
Share of Assessment
Base
Statutory BPT Rate
Average Appreciation
Rate
Appreciation Period
Assess-ment Lag
Effective BPT Rate
Percent (except Appreciation Period and Assessment Lag)
2013
General Commercial 46.61 1.672 7.51 2012-2016 4 1.251
Residual Commercial – Band 1 17.71 1.478 7.51 2012-2016 4 1.107
Residual Commercial – Band 2 27.19 1.672 7.51 2012-2016 4 1.251
Industrial 8.21 1.666 4.40 2012-2016 4 1.403
Pipeline 0.29 1.027 1.99 2012-2016 4 0.949
All Business 100.00 1.635 7.24 2012-2016 4 1.237
2014
General Commercial 47.08 1.606 7.51 2012-2016 4 1.202
Residual Commercial – Band 1 17.83 1.374 7.51 2012-2016 4 1.028
Residual Commercial – Band 2 26.93 1.606 7.51 2012-2016 4 1.202
Industrial 7.86 1.601 4.40 2012-2016 4 1.347
Pipeline 0.30 1.000 1.99 2012-2016 4 0.925
All Business 100.00 1.562 7.25 2012-2016 4 1.182
2015
General Commercial 47.41 1.539 7.51 2012-2016 4 1.152
Residual Commercial – Band 1 17.98 1.283 7.51 2012-2016 4 0.961
Residual Commercial – Band 2 26.61 1.539 7.51 2012-2016 4 1.152
Industrial 7.70 1.539 4.40 2012-2016 4 1.295
Pipeline 0.30 0.982 1.99 2012-2016 4 0.908
All Business 100.00 1.491 7.25 2012-2016 4 1.128
2016
General Commercial 47.66 1.457 7.51 2012-2016 4 1.091
Residual Commercial – Band 1 18.12 1.256 7.51 2012-2016 4 0.940
Residual Commercial – Band 2 26.40 1.457 7.51 2012-2016 4 1.091
Industrial 7.53 1.449 4.40 2012-2016 4 1.220
Pipeline 0.30 0.956 1.99 2012-2016 4 0.884
All Business 100.00 1.419 7.26 2012-2016 4 1.072
2017
General Commercial 47.66 1.380 7.51 2012-2016 4 1.033
Residual Commercial – Band 1 18.12 1.205 7.51 2012-2016 4 0.902
Residual Commercial – Band 2 26.40 1.380 7.51 2012-2016 4 1.033
Industrial 7.53 1.370 4.40 2012-2016 4 1.153
Pipeline 0.30 0.928 1.99 2012-2016 4 0.858
All Business 100.00 1.346 7.26 2012-2016 4 1.018
Table A13: Toronto BPT Rates

14e
-Br
ief
App
end
ix
Sour
ce: A
utho
rs’ c
alcul
atio
ns fr
om g
over
nmen
t web
sites
.
Year
Prop
erty
Cla
ss
Stat
utor
y BPT
Rat
e
Ave
rage
A
ppre
ciat
ion
Rat
e
App
reci
atio
n Pe
riod
Ass
essm
ent
Lag
Effe
ctiv
e B
PT R
ate
City
of M
ontr
eal
Boro
ugh
Ave
rage
Man
agem
ent
Com
mitt
ee
of th
e Sch
ool
Tax o
n th
e Is
land
of
Mon
trea
l
Tota
lG
ener
alW
ater
Roa
ds
Perc
ent (
exce
pt A
ppre
ciatio
n Pe
riod
and A
ssessm
ent L
ag)
2013
Non
-Res
iden
tial
3.36
30.
427
0.02
80.
096
0.20
54.
118
2.71
2012
-201
53.
53.
750
2014
Non
-Res
iden
tial
3.30
90.
477
0.02
70.
096
0.19
54.
103
2.71
2012
-201
51.
53.
942
2015
Non
-Res
iden
tial
3.25
10.
355
0.02
50.
095
0.18
83.
914
2.71
2012
-201
52.
53.
661
2016
Non
-Res
iden
tial
3.17
20.
341
0.02
40.
092
0.17
83.
807
2.71
2012
-201
53.
53.
466
2017
Non
-Res
iden
tial
3.14
70.
318
0.02
30.
090
0.17
83.
757
2.71
2012
-201
51.
53.
610
Tabl
e A14
: Mon
treal
BPT
Rat
es
15
Essential Policy Intelligence
e-BriefAppendix
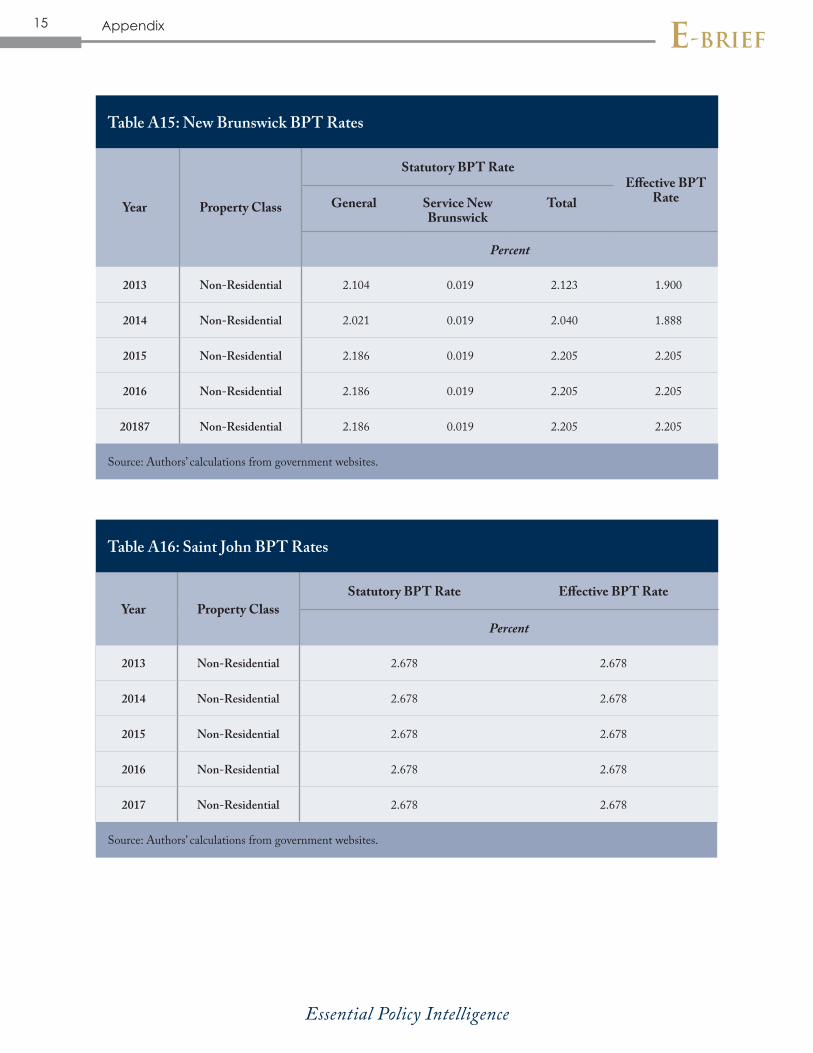
Source: Authors’ calculations from government websites.
Year Property Class
Statutory BPT RateEffective BPT
RateGeneral Service New Brunswick
Total
Percent
2013 Non-Residential 2.104 0.019 2.123 1.900
2014 Non-Residential 2.021 0.019 2.040 1.888
2015 Non-Residential 2.186 0.019 2.205 2.205
2016 Non-Residential 2.186 0.019 2.205 2.205
20187 Non-Residential 2.186 0.019 2.205 2.205
Table A15: New Brunswick BPT Rates
Source: Authors’ calculations from government websites.
Year Property ClassStatutory BPT Rate Effective BPT Rate
Percent
2013 Non-Residential 2.678 2.678
2014 Non-Residential 2.678 2.678
2015 Non-Residential 2.678 2.678
2016 Non-Residential 2.678 2.678
2017 Non-Residential 2.678 2.678
Table A16: Saint John BPT Rates
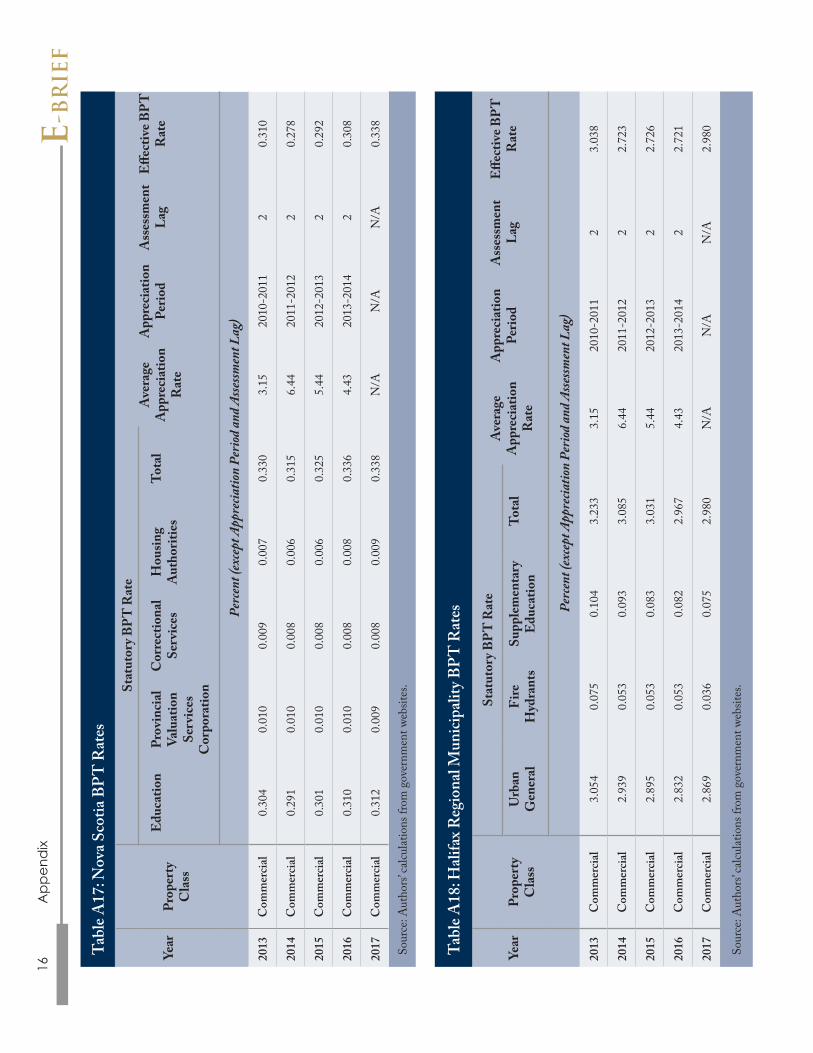
Sour
ce: A
utho
rs’ c
alcul
atio
ns fr
om g
over
nmen
t web
sites
.
Year
Prop
erty
C
lass
Stat
utor
y BPT
Rat
eA
vera
ge
App
reci
atio
n R
ate
App
reci
atio
n Pe
riod
Ass
essm
ent
Lag
Effe
ctiv
e BPT
R
ate
Edu
catio
nPr
ovin
cial
Va
luat
ion
Serv
ices
C
orpo
ratio
n
Cor
rect
iona
l Se
rvic
esH
ousin
g A
utho
ritie
sTo
tal
Perc
ent (
exce
pt A
ppre
ciatio
n Pe
riod
and A
ssessm
ent L
ag)
2013
Com
mer
cial
0.30
40.
010
0.00
90.
007
0.33
03.
1520
10-2
011
20.
310
2014
Com
mer
cial
0.29
10.
010
0.00
80.
006
0.31
56.
4420
11-2
012
20.
278
2015
Com
mer
cial
0.30
10.
010
0.00
80.
006
0.32
55.
4420
12-2
013
20.
292
2016
Com
mer
cial
0.31
00.
010
0.00
80.
008
0.33
64.
4320
13-2
014
20.
308
2017
Com
mer
cial
0.31
20.
009
0.00
80.
009
0.33
8N
/AN
/AN
/A0.
338
Tabl
e A17
: Nov
a Sco
tia B
PT R
ates
16e
-Br
ief
App
end
ix
Sour
ce: A
utho
rs’ c
alcul
atio
ns fr
om g
over
nmen
t web
sites
.
Year
Prop
erty
C
lass
Stat
utor
y BPT
Rat
eA
vera
ge
App
reci
atio
n R
ate
App
reci
atio
n Pe
riod
Ass
essm
ent
Lag
Effe
ctiv
e BPT
R
ate
Urb
an
Gen
eral
Fire
H
ydra
nts
Supp
lem
enta
ry
Edu
catio
nTo
tal
Perc
ent (
exce
pt A
ppre
ciatio
n Pe
riod
and A
ssessm
ent L
ag)
2013
Com
mer
cial
3.05
40.
075
0.10
43.
233
3.15
2010
-201
12
3.03
8
2014
Com
mer
cial
2.93
90.
053
0.09
33.
085
6.44
2011
-201
22
2.72
3
2015
Com
mer
cial
2.89
50.
053
0.08
33.
031
5.44
2012
-201
32
2.72
6
2016
Com
mer
cial
2.83
20.
053
0.08
22.
967
4.43
2013
-201
42
2.72
1
2017
Com
mer
cial
2.86
90.
036
0.07
52.
980
N/A
N/A
N/A
2.98
0
Tabl
e A18
: Hal
ifax R
egio
nal M
unici
palit
y BPT
Rat
es
17
Essential Policy Intelligence
e-BriefAppendix
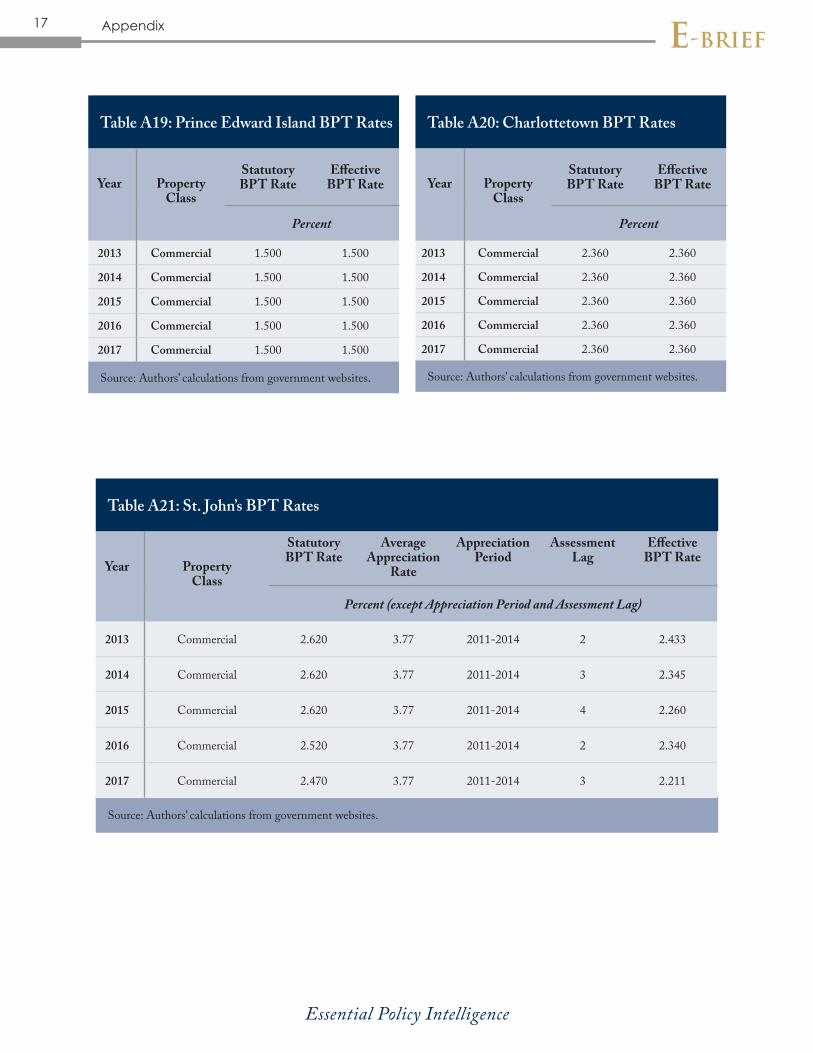
Source: Authors’ calculations from government websites.
Year Property Class
Statutory BPT Rate
Effective BPT Rate
Percent
2013 Commercial 1.500 1.500
2014 Commercial 1.500 1.500
2015 Commercial 1.500 1.500
2016 Commercial 1.500 1.500
2017 Commercial 1.500 1.500
Table A19: Prince Edward Island BPT Rates
Source: Authors’ calculations from government websites.
Year Property Class
Statutory BPT Rate
Effective BPT Rate
Percent
2013 Commercial 2.360 2.360
2014 Commercial 2.360 2.360
2015 Commercial 2.360 2.360
2016 Commercial 2.360 2.360
2017 Commercial 2.360 2.360
Table A20: Charlottetown BPT Rates
Source: Authors’ calculations from government websites.
Year Property Class
Statutory BPT Rate
Average Appreciation
Rate
Appreciation Period
Assessment Lag
Effective BPT Rate
Percent (except Appreciation Period and Assessment Lag)
2013 Commercial 2.620 3.77 2011-2014 2 2.433
2014 Commercial 2.620 3.77 2011-2014 3 2.345
2015 Commercial 2.620 3.77 2011-2014 4 2.260
2016 Commercial 2.520 3.77 2011-2014 2 2.340
2017 Commercial 2.470 3.77 2011-2014 3 2.211
Table A21: St. John’s BPT Rates

18
Essential Policy Intelligence
e-BriefAppendix
Source: Authors’ calculations from government websites.
Year Tax Parameter
BC AB SK MB ON QC NB NS PE NL Source
Percent
2013
Federal CIT 15.00 15.00 15.00 15.00 15.00 15.00 15.00 15.00 15.00 15.00
Canada Revenue Agency; Provincial Websites
Provincial CIT 11.00 10.00 12.00 12.00 11.50 11.90 12.00 16.00 16.00 14.00Federal ITC – Man. Buildings 0.00 0.00 0.00 0.00 0.00 0.00 10.00 10.00 10.00 10.00Federal ITC – Man. Machinery 0.00 0.00 0.00 0.00 0.00 0.00 10.00 10.00 10.00 10.00Provincial ITC – Man. Buildings 0.00 0.00 5.00 10.00 0.00 4.00 0.00 0.00 10.00 9.00Provincial ITC – Man. Machinery 0.00 0.00 5.00 10.00 0.00 4.00 0.00 0.00 10.00 9.00
Provincial RST 7.00 0.00 5.00 8.00 0.00 0.00 0.00 0.00 0.00 0.00
Provincial BPT 0.634 0.330 0.828 1.175 1.260 0.000 2.123 0.330 1.500 0.000 Provincial and Municipal Websites; Authors’ CalculationsMunicipal BPT 1.034 1.407 0.751 3.569 1.635 4.118 2.678 3.233 2.360 2.620
Provincial LTT 2.000 0.000 0.300 2.000 1.500 1.500 0.500 0.000 1.000 0.400 Provincial and Municipal WebsitesMunicipal LTT 0.000 0.000 0.000 0.000 1.000 1.000 0.000 1.500 0.000 0.000
2014
Federal CIT 15.00 15.00 15.00 15.00 15.00 15.00 15.00 15.00 15.00 15.00
Canada Revenue Agency; Provincial Websites
Provincial CIT 11.00 10.00 12.00 12.00 11.50 11.90 12.00 16.00 16.00 14.00Federal ITC – Man. Buildings 0.00 0.00 0.00 0.00 0.00 0.00 10.00 10.00 10.00 10.00Federal ITC – Man. Machinery 0.00 0.00 0.00 0.00 0.00 0.00 10.00 10.00 10.00 10.00Provincial ITC – Man. Buildings 0.00 0.00 5.00 10.00 0.00 4.00 0.00 0.00 10.00 9.00Provincial ITC – Man. Machinery 0.00 0.00 5.00 10.00 0.00 4.00 0.00 0.00 10.00 9.00
Provincial RST 7.00 0.00 5.00 8.00 0.00 0.00 0.00 0.00 0.00 0.00
Provincial BPT 0.584 0.342 0.828 1.149 1.220 0.000 2.040 0.315 1.500 0.000 Provincial and Municipal Websites; Authors’ CalculationsMunicipal BPT 0.937 1.331 0.799 3.399 1.562 4.103 2.678 3.085 2.360 2.620
Provincial LTT 2.000 0.000 0.300 2.000 1.500 1.500 0.500 0.000 1.000 0.400 Provincial and Municipal WebsitesMunicipal LTT 0.000 0.000 0.000 0.000 1.000 1.000 0.000 1.500 0.000 0.000
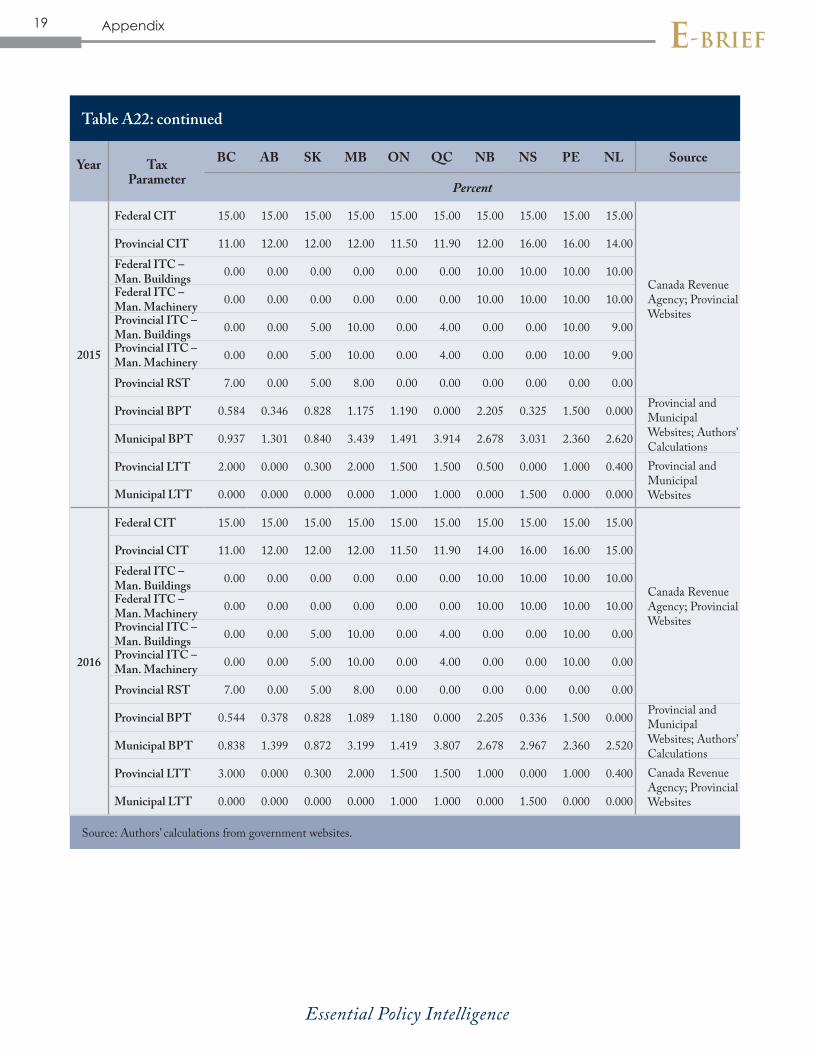
Table A22: Statutory Business Tax and ITC Rates
19
Essential Policy Intelligence
e-BriefAppendix
Year Tax Parameter
BC AB SK MB ON QC NB NS PE NL Source
Percent
2015
Federal CIT 15.00 15.00 15.00 15.00 15.00 15.00 15.00 15.00 15.00 15.00
Canada Revenue Agency; Provincial Websites
Provincial CIT 11.00 12.00 12.00 12.00 11.50 11.90 12.00 16.00 16.00 14.00Federal ITC – Man. Buildings 0.00 0.00 0.00 0.00 0.00 0.00 10.00 10.00 10.00 10.00Federal ITC – Man. Machinery 0.00 0.00 0.00 0.00 0.00 0.00 10.00 10.00 10.00 10.00Provincial ITC – Man. Buildings 0.00 0.00 5.00 10.00 0.00 4.00 0.00 0.00 10.00 9.00Provincial ITC – Man. Machinery 0.00 0.00 5.00 10.00 0.00 4.00 0.00 0.00 10.00 9.00
Provincial RST 7.00 0.00 5.00 8.00 0.00 0.00 0.00 0.00 0.00 0.00
Provincial BPT 0.584 0.346 0.828 1.175 1.190 0.000 2.205 0.325 1.500 0.000 Provincial and Municipal Websites; Authors’ CalculationsMunicipal BPT 0.937 1.301 0.840 3.439 1.491 3.914 2.678 3.031 2.360 2.620
Provincial LTT 2.000 0.000 0.300 2.000 1.500 1.500 0.500 0.000 1.000 0.400 Provincial and Municipal WebsitesMunicipal LTT 0.000 0.000 0.000 0.000 1.000 1.000 0.000 1.500 0.000 0.000
2016
Federal CIT 15.00 15.00 15.00 15.00 15.00 15.00 15.00 15.00 15.00 15.00
Canada Revenue Agency; Provincial Websites
Provincial CIT 11.00 12.00 12.00 12.00 11.50 11.90 14.00 16.00 16.00 15.00Federal ITC – Man. Buildings 0.00 0.00 0.00 0.00 0.00 0.00 10.00 10.00 10.00 10.00Federal ITC – Man. Machinery 0.00 0.00 0.00 0.00 0.00 0.00 10.00 10.00 10.00 10.00Provincial ITC – Man. Buildings 0.00 0.00 5.00 10.00 0.00 4.00 0.00 0.00 10.00 0.00Provincial ITC – Man. Machinery 0.00 0.00 5.00 10.00 0.00 4.00 0.00 0.00 10.00 0.00
Provincial RST 7.00 0.00 5.00 8.00 0.00 0.00 0.00 0.00 0.00 0.00
Provincial BPT 0.544 0.378 0.828 1.089 1.180 0.000 2.205 0.336 1.500 0.000 Provincial and Municipal Websites; Authors’ CalculationsMunicipal BPT 0.838 1.399 0.872 3.199 1.419 3.807 2.678 2.967 2.360 2.520
Provincial LTT 3.000 0.000 0.300 2.000 1.500 1.500 1.000 0.000 1.000 0.400 Canada Revenue Agency; Provincial WebsitesMunicipal LTT 0.000 0.000 0.000 0.000 1.000 1.000 0.000 1.500 0.000 0.000
Table A22: continued
Source: Authors’ calculations from government websites.

20
Essential Policy Intelligence
e-BriefAppendix
Year Tax Parameter
BC AB SK MB ON QC NB NS PE NL Source
Percent
2017
Federal CIT 15.00 15.00 15.00 15.00 15.00 15.00 15.00 15.00 15.00 15.00
Canada Revenue Agency; Provincial Websites
Provincial CIT 11.00 12.00 11.50 12.00 11.50 11.80 14.00 16.00 16.00 15.00Federal ITC – Man. Buildings 0.00 0.00 0.00 0.00 0.00 0.00 10.00 10.00 10.00 10.00Federal ITC – Man. Machinery 0.00 0.00 0.00 0.00 0.00 0.00 10.00 10.00 10.00 10.00Provincial ITC – Man. Buildings 0.00 0.00 6.00 9.00 0.00 0.00 0.00 0.00 10.00 0.00Provincial ITC – Man. Machinery 0.00 0.00 6.00 9.00 0.00 0.00 0.00 0.00 10.00 0.00
Provincial RST 7.00 0.00 6.00 8.00 0.00 0.00 0.00 0.00 0.00 0.00
Provincial BPT 0.484 0.386 0.627 1.049 1.140 0.000 2.205 0.338 1.500 0.000 Provincial and Municipal Websites; Authors’ CalculationsMunicipal BPT 0.733 1.521 0.695 3.273 1.346 3.757 2.678 2.980 2.360 2.470
Provincial LTT 3.000 0.000 0.300 2.000 2.000 1.500 1.000 0.000 1.000 0.400 Provincial and Municipal WebsitesMunicipal LTT 0.000 0.000 0.000 0.000 2.000 1.000 0.000 1.500 0.000 0.000
Table A22: continued
Source: Authors’ calculations from government websites.
21
Essential Policy Intelligence
e-BriefAppendix
Year Tax ParameterBC AB SK MB ON QC NB NS PE NL
Percent
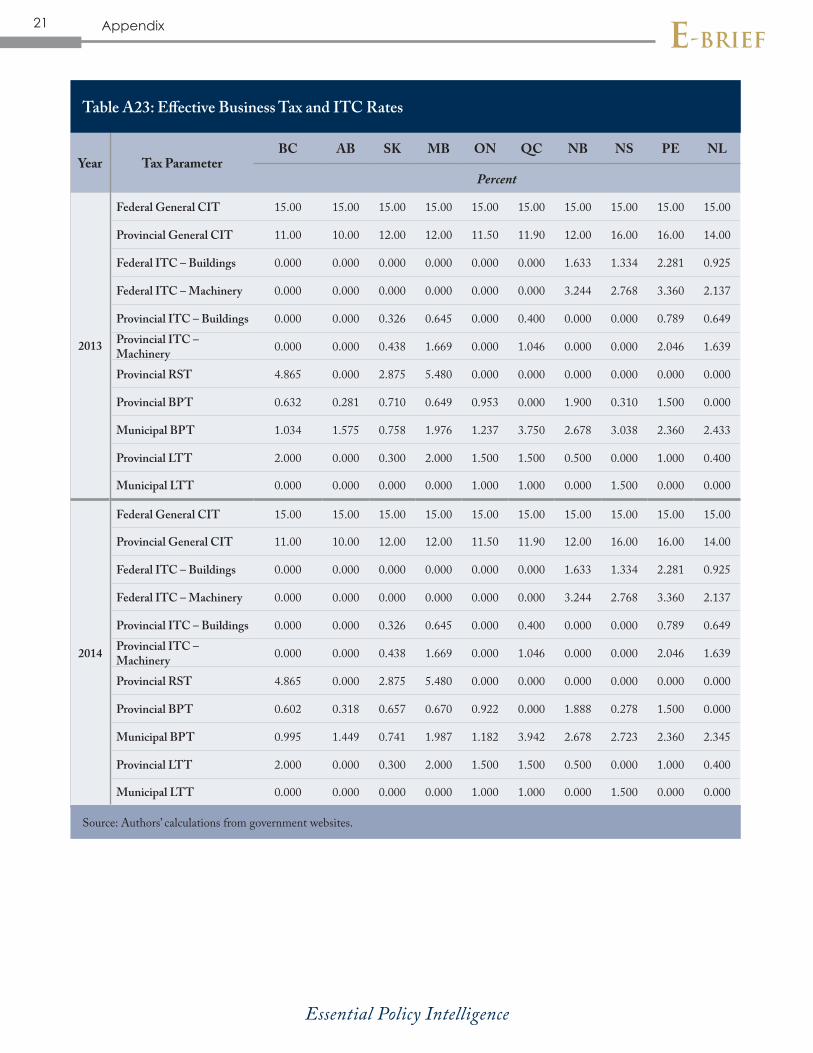
2013
Federal General CIT 15.00 15.00 15.00 15.00 15.00 15.00 15.00 15.00 15.00 15.00
Provincial General CIT 11.00 10.00 12.00 12.00 11.50 11.90 12.00 16.00 16.00 14.00
Federal ITC – Buildings 0.000 0.000 0.000 0.000 0.000 0.000 1.633 1.334 2.281 0.925
Federal ITC – Machinery 0.000 0.000 0.000 0.000 0.000 0.000 3.244 2.768 3.360 2.137
Provincial ITC – Buildings 0.000 0.000 0.326 0.645 0.000 0.400 0.000 0.000 0.789 0.649Provincial ITC – Machinery 0.000 0.000 0.438 1.669 0.000 1.046 0.000 0.000 2.046 1.639
Provincial RST 4.865 0.000 2.875 5.480 0.000 0.000 0.000 0.000 0.000 0.000
Provincial BPT 0.632 0.281 0.710 0.649 0.953 0.000 1.900 0.310 1.500 0.000
Municipal BPT 1.034 1.575 0.758 1.976 1.237 3.750 2.678 3.038 2.360 2.433
Provincial LTT 2.000 0.000 0.300 2.000 1.500 1.500 0.500 0.000 1.000 0.400
Municipal LTT 0.000 0.000 0.000 0.000 1.000 1.000 0.000 1.500 0.000 0.000
2014
Federal General CIT 15.00 15.00 15.00 15.00 15.00 15.00 15.00 15.00 15.00 15.00
Provincial General CIT 11.00 10.00 12.00 12.00 11.50 11.90 12.00 16.00 16.00 14.00
Federal ITC – Buildings 0.000 0.000 0.000 0.000 0.000 0.000 1.633 1.334 2.281 0.925
Federal ITC – Machinery 0.000 0.000 0.000 0.000 0.000 0.000 3.244 2.768 3.360 2.137
Provincial ITC – Buildings 0.000 0.000 0.326 0.645 0.000 0.400 0.000 0.000 0.789 0.649Provincial ITC – Machinery 0.000 0.000 0.438 1.669 0.000 1.046 0.000 0.000 2.046 1.639
Provincial RST 4.865 0.000 2.875 5.480 0.000 0.000 0.000 0.000 0.000 0.000
Provincial BPT 0.602 0.318 0.657 0.670 0.922 0.000 1.888 0.278 1.500 0.000
Municipal BPT 0.995 1.449 0.741 1.987 1.182 3.942 2.678 2.723 2.360 2.345
Provincial LTT 2.000 0.000 0.300 2.000 1.500 1.500 0.500 0.000 1.000 0.400
Municipal LTT 0.000 0.000 0.000 0.000 1.000 1.000 0.000 1.500 0.000 0.000
Table A23: Effective Business Tax and ITC Rates
Source: Authors’ calculations from government websites.

22
Essential Policy Intelligence
e-BriefAppendix
2015
Federal General CIT 15.00 15.00 15.00 15.00 15.00 15.00 15.00 15.00 15.00 15.00
Provincial General CIT 11.00 12.00 12.00 12.00 11.50 11.90 12.00 16.00 16.00 14.00
Federal ITC – Buildings 0.000 0.000 0.000 0.000 0.000 0.000 1.633 1.334 2.281 0.925
Federal ITC – Machinery 0.000 0.000 0.000 0.000 0.000 0.000 3.244 2.768 3.360 2.137
Provincial ITC – Buildings 0.000 0.000 0.326 0.645 0.000 0.400 0.000 0.000 0.789 0.649Provincial ITC – Machinery 0.000 0.000 0.438 1.669 0.000 1.046 0.000 0.000 2.046 1.639
Provincial RST 4.865 0.000 2.875 5.480 0.000 0.000 0.000 0.000 0.000 0.000
Provincial BPT 0.582 0.332 0.609 0.648 0.899 0.000 2.205 0.292 1.500 0.000
Municipal BPT 0.937 1.381 0.721 1.902 1.128 3.661 2.678 2.726 2.360 2.260
Provincial LTT 2.000 0.000 0.300 2.000 1.500 1.500 0.500 0.000 1.000 0.400
Municipal LTT 0.000 0.000 0.000 0.000 1.000 1.000 0.000 1.500 0.000 0.000
2016
Federal General CIT 15.00 15.00 15.00 15.00 15.00 15.00 15.00 15.00 15.00 15.00
Provincial General CIT 11.00 12.00 12.00 12.00 11.50 11.90 14.00 16.00 16.00 15.00
Federal ITC – Buildings 0.000 0.000 0.000 0.000 0.000 0.000 1.633 1.334 2.281 0.925
Federal ITC – Machinery 0.000 0.000 0.000 0.000 0.000 0.000 3.244 2.768 3.360 2.137
Provincial ITC – Buildings 0.000 0.000 0.326 0.645 0.000 0.400 0.000 0.000 0.789 0.000Provincial ITC – Machinery 0.000 0.000 0.438 1.669 0.000 1.046 0.000 0.000 2.046 0.000
Provincial RST 4.865 0.000 2.875 5.480 0.000 0.000 0.000 0.000 0.000 0.000
Provincial BPT 0.542 0.387 0.564 0.634 0.892 0.000 2.205 0.308 1.500 0.000
Municipal BPT 0.838 1.347 0.693 1.868 1.072 3.466 2.678 2.721 2.360 2.340
Provincial LTT 3.000 0.000 0.300 2.000 1.500 1.500 1.000 0.000 1.000 0.400
Municipal LTT 0.000 0.000 0.000 0.000 1.000 1.000 0.000 1.500 0.000 0.000
Source: Authors’ calculations from government websites.
Table A23: continued
Year Tax ParameterBC AB SK MB ON QC NB NS PE NL
Percent
23
Essential Policy Intelligence
e-BriefAppendix
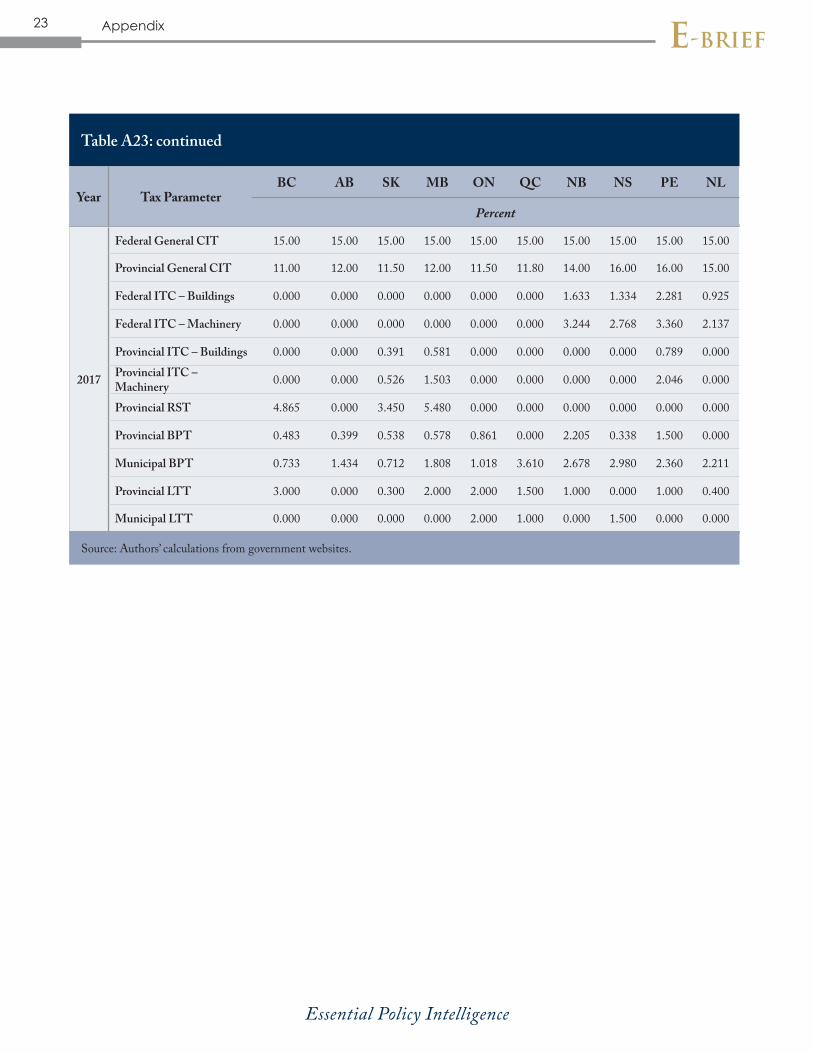
2017
Federal General CIT 15.00 15.00 15.00 15.00 15.00 15.00 15.00 15.00 15.00 15.00
Provincial General CIT 11.00 12.00 11.50 12.00 11.50 11.80 14.00 16.00 16.00 15.00
Federal ITC – Buildings 0.000 0.000 0.000 0.000 0.000 0.000 1.633 1.334 2.281 0.925
Federal ITC – Machinery 0.000 0.000 0.000 0.000 0.000 0.000 3.244 2.768 3.360 2.137
Provincial ITC – Buildings 0.000 0.000 0.391 0.581 0.000 0.000 0.000 0.000 0.789 0.000Provincial ITC – Machinery 0.000 0.000 0.526 1.503 0.000 0.000 0.000 0.000 2.046 0.000
Provincial RST 4.865 0.000 3.450 5.480 0.000 0.000 0.000 0.000 0.000 0.000
Provincial BPT 0.483 0.399 0.538 0.578 0.861 0.000 2.205 0.338 1.500 0.000
Municipal BPT 0.733 1.434 0.712 1.808 1.018 3.610 2.678 2.980 2.360 2.211
Provincial LTT 3.000 0.000 0.300 2.000 2.000 1.500 1.000 0.000 1.000 0.400
Municipal LTT 0.000 0.000 0.000 0.000 2.000 1.000 0.000 1.500 0.000 0.000
Source: Authors’ calculations from government websites.
Table A23: continued
Year Tax ParameterBC AB SK MB ON QC NB NS PE NL
Percent