Appendix B: Assessing Pittsburgh’s industry and academic ... · 58 Capturing the Next Economy...
14
58 Capturing the Next Economy Appendix B: Assessing Pittsburgh’s industry and academic core competencies to support innovation-led development From a regional economic development perspective, local “core competencies” represent a critical mass of know-how. 42 The competencies are represented by the expertise and creative activity across product development and process improvements in industry, as well as by the advancement of scholarly activity and technology transfer and the creation of pools of specialized talent in the region’s research institutions. This appendix presents details of a core competency analysis undertaken for the Pittsburgh region. The analysis involved an in-depth quantitative investigation of documented innovation-related output (patents and publications) by local industry and research institutions. This quantitative data study was supplemented by one- on-one interviews with industry executives and senior leadership and leading faculty at Pittsburgh research institutions to gather further intelligence and guidance on the focus of research and innovation activity. Patent analysis A classic indicator of core technology competencies is patent innovation activity. Patents are a primary means for inventors to protect their product innovations from being copied, and as such can be a good proxy for market-ready innovation. Although there are other forms of intellectual property protection through copyrights, trademarks, and trade secrets, patents are among the most widely used form of protection of novel technological inventions. The analysis of patent innovation activity focuses only on patents invented by Pittsburgh residents in order to more precisely measure the innovation generated within the region rather than the innovations that Pittsburgh companies import from outside inventors as assignees of intellectual property. Because it can take several years from the time of initial application for a patent award to be issued, the analysis also considers patent awards along with patent applications in order to provide a more current assessment of recent innovation activities. The 17,000-plus patent awards and applications filed by inventors residing in Pittsburgh from 2009 to 2015 constitute a significant database to consider innovation activity in the region. While the University of Pittsburgh (Pitt) and Carnegie Mellon University (CMU) were among the top five patent generators in Pittsburgh—with a combined 839 patent awards and applications over the 2009 to 2015 period—the vast majority of patent generation is affiliated with industry. Leading patent areas To identify where Pittsburgh stands out in patent innovation activity, the analysis first considered those specific patent classifications where Pittsburgh is a national leader based on a strong standing in specialization and quality within specific technology areas: • Patent specialization is measured by whether a patent classification area has a higher level of concentration in the Pittsburgh region than in the nation relative to overall patenting volume. • Patent quality is measured by whether a patent classification area has a higher level of citations per patent in that classification area than the national average. This metric can be viewed as a measure of patent impact in terms of contributing to follow-on innovation activity. By routinely citing prior patents as references in documenting their new intellectual property, patentees demonstrate the influence and importance of these earlier patents on future innovation. Pittsburgh stands out as a national leader in 93 patent classification areas by having both a higher level of concentration and a higher level of citations. These patent classification areas reflect detailed areas of innovation in certain technology platforms in which Pittsburgh stands out and can also be grouped together in broader innovation categories.
Transcript of Appendix B: Assessing Pittsburgh’s industry and academic ... · 58 Capturing the Next Economy...

58 Capturing the Next Economy
Appendix B: Assessing Pittsburgh’s industry and academic core competencies to support innovation-led development
From a regional economic development perspective, local “core competencies” represent a critical mass of know-how.42 The competencies are represented by the expertise and creative activity across product development and process improvements in industry, as well as by the advancement of scholarly activity and technology transfer and the creation of pools of specialized talent in the region’s research institutions.
This appendix presents details of a core competency analysis undertaken for the Pittsburgh region. The analysis involved an in-depth quantitative investigation of documented innovation-related output (patents and publications) by local industry and research institutions. This quantitative data study was supplemented by one-on-one interviews with industry executives and senior leadership and leading faculty at Pittsburgh research institutions to gather further intelligence and guidance on the focus of research and innovation activity.
Patent analysis
A classic indicator of core technology competencies is patent innovation activity. Patents are a primary means for inventors to protect their product innovations from being copied, and as such can be a good proxy for market-ready innovation. Although there are other forms of intellectual property protection through copyrights, trademarks, and trade secrets, patents are among the most widely used form of protection of novel technological inventions.
The analysis of patent innovation activity focuses only on patents invented by Pittsburgh residents in order to more precisely measure the innovation generated within the region rather than the innovations that Pittsburgh companies import from outside inventors as assignees of intellectual property. Because it can take several years from the time of initial application for a patent award to be issued, the analysis also considers patent awards along with patent applications in order to provide a more current assessment of recent innovation activities.
The 17,000-plus patent awards and applications filed by inventors residing in Pittsburgh from 2009 to 2015 constitute a significant database to consider innovation activity in the region. While the University of Pittsburgh (Pitt) and Carnegie Mellon University (CMU) were among the top five patent generators in Pittsburgh—with a combined 839 patent awards and applications over the 2009 to 2015 period—the vast majority of patent generation is affiliated with industry.
Leading patent areas
To identify where Pittsburgh stands out in patent innovation activity, the analysis first considered those specific patent classifications where Pittsburgh is a national leader based on a strong standing in specialization and quality within specific technology areas:
• Patent specialization is measured by whether a patent classification area has a higher level of concentration in the Pittsburgh region than in the nation relative to overall patenting volume.
• Patent quality is measured by whether a patent classification area has a higher level of citations per patent in that classification area than the national average. This metric can be viewed as a measure of patent impact in terms of contributing to follow-on innovation activity. By routinely citing prior patents as references in documenting their new intellectual property, patentees demonstrate the influence and importance of these earlier patents on future innovation.
Pittsburgh stands out as a national leader in 93 patent classification areas by having both a higher level of concentration and a higher level of citations. These patent classification areas reflect detailed areas of innovation in certain technology platforms in which Pittsburgh stands out and can also be grouped together in broader innovation categories.

59 Capturing the Next Economy
These leading patent classifications fall into 14 broader innovation categories, reflecting multiple leading patent classifications (Table B-1). Six of these categories had substantial numbers of patents:
• Data analytics, software, storage, and information technology.
• Medical and surgical devices.
• Pharmaceuticals.
• Polymers, coatings, and compositions.
• Materials analysis.
• Electronic components.
Table B-1: Broad technology categories of leading patent innovation areas by total number of patents and number of patent classifications
Broad categories of leading patent innovation areas
Total number of patents
Number of patent classifications
Data analytics, software, storage, & IT 1055 11
Medical & surgical devices 927 9
Pharmaceuticals 721 9
Polymers, coatings, & compositions 505 11
Materials analysis 433 4
Organic chemistry 415 8
Electronic components 394 11
Machine tools & manufacturing 231 6
Biochemistry & microbiology 188 2
Chemical processing equipment 127 3
Instrumentation & sensors 121 4
Metallurgy & surface treatment of metals 109 3
Construction 91 3
Nuclear engineering 42 2
No categories 207 7
Total 5566 93
Source: Thomson Innovation, calculations by TEConomy Partners.

60 Capturing the Next Economy
Despite having high levels of patents and citations in broad industry categories, Pittsburgh’s highest levels of specialization and quality (citation rates) are found among the smaller categories of leading innovation areas, such as machine tools, nuclear engineering, and metallurgy, which suggests strong innovation niche focuses for the region in related technologies. Figure B-1 presents a comprehensive mapping of the levels of patent specialization (horizontal axis) and citation rates (vertical axis) across all patent innovation classifications. Each bubble represents a specific patent classification, and the color of the bubble shows the corresponding broad category of patent innovation to which that classification belongs. Those patent classifications located more toward the upper-right-hand quadrant represent the top leading areas of patent innovation, since their specialization and forward citation impact outpaces overall trends in the United States in the six-year period.
Across the full set of leading patent classifications, a closer
examination suggests that there are distinct areas of industry and university strengths within different leading innovation areas, with only a few shared areas of focus. Based on the mix of patent generation across industry and universities, it is possible to assess those leading patent classifications that represent industry, university, or shared strengths. Given that only 8 percent of the total patent activity in Pittsburgh is driven by universities, we used the following thresholds to assess the mixture of industry versus university concentration:
• University strengths were those leading patent classifications where more than 20 percent of the patents were generated from universities, or more than double the overall average.
• Industry strengths were those leading patent classifications where less than 10 percent were university-led or more than 90 percent were industry-led patents.
• Shared industry-university strengths were those leading patent classifications where university patents made up
Source: U.S. Census Bureau, American Community Survey, authors’ calculations.
Figure B-1: Mapping of Pittsburgh patent innovation based on specialization and forward citation rating, 2009-2015

61 Capturing the Next Economy
between 10 percent and 20 percent of the patents and industry also had a significant share.
Figure B-2, which details the overlap between industry and university focus areas, suggests that industry dominates in more advanced manufacturing innovation areas, while the university patent focus is primarily in biological and chemistry fields, with some areas of focus in electronics. However, in a number of leading patent invention areas there is a substantial overlap in industry and university activity, which may indicate the presence of bridging technologies. These shared areas of industry and university strength turn out to be highly relevant to the concept of “smart manufacturing,” or the use of information technology and data within the production process. These areas include pattern recognition, sensors, and image analysis.
Patent network analysis
The idea of bridging technologies is a powerful concept not just for connecting industry and university strengths but for assessing networks of patent innovation formed by the patterns of forward innovation that occur as patents age. The economic literature describing healthy innovation ecosystems suggests that the formation of such networks is one of the critical underpinnings of a robust innovation economy.
It is possible to identify networks across patent innovation within a region by analyzing the linkages of forward citations from a patent population of interest. Forward citations occur when a new patent filed cites a prior patent as a reference in documenting the new intellectual property created. This routinely occurs since the prior referenced
Figure B-2: Leading patent classifications by industry, universities, or both (shared strength)compared to U.S. overall

62 Capturing the Next Economy
patents usually contain fundamental ideas and concepts used in developing the new intellectual property of more recent patents. The original patent is thus said to generate forward citations in all patents that reference it.
Using network analysis algorithms, it is possible to construct networks of active linkages in patent activities across different Pittsburgh companies and research institutions based on the citation patterns of patents. The relationships reflected in the forward citations of patents serve to highlight where there are close innovation relationships and clusters of innovation activity taking place in Pittsburgh.
Pittsburgh’s patenting innovation landscape as described by the network of forward citation activity can be described as having a set of core patent innovation clusters that are highly interconnected, along with more focused niche patent clusters that are more stand-alone. Six core patent innovation networks were identified by the analysis of forward linkages:
• Polymers and coatings.
• Data storage devices (e.g., hard drives) and related infrastructure.
• Data analytics (with focus around finance, e-commerce), network operations and security, and software.
• Image analysis technologies (with focus around spectroscopy), optic sensors, and interactive image displays.
• Bioscience applications in pharmaceuticals and biochemistry.
• Medical devices (with focus areas in respiratory and spinal stabilization applications).
In addition, there were four more-focused patent innovation networks, including:
• Construction, well drilling, and other industrial treatment processes (e.g., water treatment).
• Electronics applications in semiconductor manufacturing/coatings, fuel cells, and connectors.
• Industrial milling and machining tools.
• Electrical switches and relays (with focus on protective and high-load applications).
A graphic illustration of these patent innovation networks is presented in Figure B-3, where each bubble represents different patent classifications coded based on broad technology focus areas; the lines show the connections from forward citation relationships between all the patent areas. The density of the connections among the core patent innovation networks is reflected in the tight links and proximity of the patent areas. What is also revealed in Figure B-3 among the core patent innovation networks is the connector or bridge role played by the patent innovation network of image analysis and optics, which corresponds closely to the leading patent classifications that are shared industry and university strengths. This can be observed in Figure B-3 by how the purple bubbles associated with image analysis and optics are found across the core patent innovation network areas and have dense connections to many other multidisciplinary technology areas. Additional analysis of network centrality across patent classifications confirms this bridging role of image analysis and optics technology platforms. It also suggests that two technology focuses related to the patent innovation network of image analysis and optics stand out as the foundation for connecting applications across the core patent innovation areas:
• Image analysis techniques (via pattern recognition, screening, machine learning, etc.) and image data storage (big data storage and access).
• Materials analysis technologies, revolving primarily around optic sensing applications such as spectroscopy.
It is also important to note that the niche focus patent innovation areas spanning nuclear engineering, machine tools, and some electronics, while highly compartmentalized, are also clearly linked to some of the top-performing leading patent classifications in terms of specialization and quality.
Summary of patent analysis
The analysis of patent activity in Pittsburgh suggests a wide

63 Capturing the Next Economy
range of innovation capabilities that can be counted as national leaders and regional innovation networks. These leading patent innovation areas include data analytics, data storage, polymers and coatings, pharmaceuticals, and medical and surgical devices.
Another leading and highly interconnected regional patent innovation area, image analysis and optics, is playing a strong bridging role in connecting several major innovation capabilities in Pittsburgh and represents a shared strength across industry and university patent activities. This bridging innovation strength in image analysis and optics is a foundation, together with data analytics and pattern recognition, in transformative innovations involving smart manufacturing, digital health, autonomous systems, and the Internet of Things. It suggests that Pittsburgh, by being linked to advanced manufacturing technologies and
advanced biomedical technologies, is well positioned to be a national leader in these transformations.
At the same time, a number of niche innovation areas, with a smaller number of patents, have especially high levels of patent specialization and quality that represent more isolated, stand-alone networks in Pittsburgh. These niche innovation areas include nuclear engineering, machine tools, and some electronics, and they represent areas of specialization in which the region has unique expertise and capabilities.
Another way to view the significance of Pittsburgh’s strengths as a national leader in patent activity and in regional innovation networks is to map its position in patent activity to the advanced industries driving the regional economy. Table B-2 presents this mapping and suggests a strong alignment of patent innovation strengths and
Figure B-3: Mapping of patent innovation networks found in Pittsburgh through forward citation analysis
Source: Thomson Innovation, calculations by TEConomy Partners.

64 Capturing the Next Economy
advanced industries critical to the region’s success.
This mapping suggests that for many of the advanced industries found in Pittsburgh, there is a strong connection to patent innovation strengths and networks in the region.
Academic research strengths
Another cornerstone to a region’s core technology competencies is the strength of its research institutions. Pittsburgh has a robust academic research base that generates more than $1.1 billion in annual research expenditures across Pitt, CMU, and Duquesne University. On a per capita basis, Pittsburgh stands 263 percent higher than the national average. Despite its existing size and
Table B-2: Mapping of leading patent innovation classifications and networks by advanced industry clusters
Advanced industry clusters
Crosswalk of innovation activity in Pittsburgh
Where is Pittsburgh a leader in patent activity?
Where does Pittsburgh have strong connections across patent areas?
Automation and industrial machineryTools for boring/drilling machines, milling cutters;navigation controls
Industrial milling and machining tools
Chemicals, polymers, and other non-metal materials
Polymers, coating compositions, chemical filtration processes Polymers and coatings
Computing, networking, information services, and internet applications Data processing, data networks
Data storage devices and infrastructure; data analytics, software, and networking; image analysis technologies
Corporate services n/a n/a
Electronics manufacturing
Protective and high-capacity switches and relays, semiconductors using organic materials, optical sensors
Semiconductors, fuel cells, and electrical connectors; electrical switches and relays
Energy Nuclear engineering
Engineering, commercial research, and technical services
Construction, well drilling, and industrial treatment processes
Finance and insurance Finance analytics products Data analytics, software, and networking
Health services Health ITData analytics, software, and networking; image analysis technologies
Medical technologyBiopharmaceuticals, respiratory devices, infusion devices, wearable sensors
Medical and surgical devices, bioscience applications in pharmaceuticals and biochemistry
Metals & metal processing Aluminum alloys

65 Capturing the Next Economy
strength, the Pittsburgh academic research base is quite dynamic, growing considerably faster than the U.S. average, with gains of 31 percent from 2009 to 2014 compared to 17 percent nationally.
While not all academic research leads to new breakthrough discoveries and commercialization activities that can be measured in terms of patent innovation and startup companies, it does support the talent and infrastructure needed to become world class in core technology competencies. The success of Pittsburgh research universities in winning competitive research funding is an important generator of scientific expertise, new talent generation of graduate and post-doctoral students, and advanced facilities that can often be important to economic development.
4. Fifteen research fields stand out with more than $10 million in annual research expenditures in Pittsburgh, led by medical sciences with $529 million, biological sciences with $171 million, and computer sciences with $118 million (see Table B-3).
While absolute size matters, not all research fields receive the same level of funding at the national level. One way to measure the excellence of Pittsburgh in research activity is to consider where it stands out compared to the national concentration of research activity, measured by a research location quotient. Two of the large research areas
in Pittsburgh stand out in this regard: computer sciences has six times the national research concentration level, and medical sciences has 1.5 times the national research concentration level. But other research fields also stand above the national research concentration level, including psychology, other life sciences (public health, nursing, etc.), multidisciplinary engineering, bioengineering, chemical engineering, and mathematical sciences.
Another way to consider the strengths of academic research expenditures beyond total funding and relative concentration is growth rates. Among the large research fields, computer science and biological sciences exceeded national growth from 2009 to 2014, while medical sciences did not keep pace. It is likely, though, that much of the increase in biological sciences was due to changes in reporting; the combined medical and biological sciences grew a robust 29 percent in Pittsburgh, compared to 14 percent nationally. Other research strengths in Pittsburgh that are outpacing the nation include other life sciences, psychology, and mathematical sciences. What is revealing from the growth rates is that there are a number of emerging research fields, including environmental sciences, mechanical engineering, and physics.

66 Capturing the Next Economy
Table B-3: Leading research fields in Pittsburgh by research expenditure, 2009-2014
Research field2009 ($ thousands)
2014 ($ thousands)
2014 location quotient
2014 per capita share compared to the national average
Pittsburgh percentage change, 2009-2014
U.S. percentage change, 2009-2014
Medical sciences 515,255 528,529 1.53 345% 2.60% 13.50%
Biological sciences 28,447 171,048 0.87 198% 501.30% 15.40%
Computer sciences 95,305 117,598 3.65 825% 23.40% 20.40%
Other life sciences 15,644 40,182 1.11 252% 156.90% 60.10%
Other engineering 35,074 38,999 1.16 262% 11.20% 4.10%
Psychology 15,433 22,945 1.2 272% 48.70% 17.30%
Chemistry 22,578 22,771 0.79 179% 0.90% 9.00%
Electrical engineering 22,187 22,708 0.55 124% 2.30% 34.30%
Bioengineering 14,688 18,468 1.16 262% 25.70% 47.00%
Physics 12,098 16,708 0.49 110% 38.10% 9.90%
Chemical engineering 12,380 14,988 0.99 224% 21.10% 30.30%
Environmental sciences 3,946 12,517 0.23 52% 217.20% 11.10%
Mechanical engineering 9,172 12,151 0.48 109% 32.50% 21.20%
Mathematical sciences 6,007 11,180 1.02 230% 86.10% 20.20%
Civil engineering 8,029 10,495 0.5 113% 30.70% 28.10%
Source: Web of Science.

67 Capturing the Next Economy
Yet another way to consider research excellence is through analysis of the collection of peer-reviewed publications generated by researcher talent at the region’s universities. This metric offers a broader view of competitive standing in scholarly activity.
A key advantage of an analysis of peer-reviewed publications is that it reflects more detailed fields of research than can be obtained through the reporting by research expenditures. Thomson Innovation’s Web of Science database tracks publications in peer-reviewed journals for universities in over 250 fields involving basic, applied, and clinical research.
To identify excellence in Pittsburgh, it is important not to focus solely on the volume of peer-reviewed publications across fields, since the number of journals can vary substantially by publication field, and some fields, such as physics, tend to have more multiple authors on publications. For instance, there were over 13,000 publications in the critical care field nationally, compared to just 2,800 in the robotics field. While the number of publications is an indication of the number of faculty involved, it does not provide insights into the areas of scholarly activity in which Pittsburgh stands out compared to the nation. As with research expenditures, a way to consider Pittsburgh’s distinct fields of national leadership in scholarly activity is to derive a publication location quotient, i.e., measure where the city has a higher concentration of publication activity compared to the nation.
In the number of peer-reviewed publications, the breadth of
scholarly activity across Pittsburgh’s academic institutions is revealed by 136 publication fields having at least 100 publications from 2009 to 2015 (Table B-4). The top fields in numbers of publications are primarily found in the life sciences, with surgery, neurosciences, oncology, and molecular biology/biochemistry each having over 2,000 publications from 2009 to 2015. This corresponds to the high level of research funding in medical and biological sciences in Pittsburgh. Still, among the 20 top fields in number of publications are several outside of life sciences, including particle physics, astronomy, material science, electrical engineering, and multidisciplinary chemistry.
Pittsburgh also stands out in having 80 publication fields with a higher level of specialization than the nation. Of these, the top 20 fields in publication location quotient each had more than 1.70 times the national average. Among the top leaders is a more diverse grouping of publication fields—robotics, gerontology, particle physics, critical care medicine, transplantation, psychiatry, and computer science/artificial intelligence—showing the diverse areas of distinct excellence found across Pittsburgh’s academic institutions.
It is interesting to note that among the top 20 publication fields in Pittsburgh, there are few fields that lead in both number of publications and publication location quotient. This suggests that examining both measures offers insights into Pittsburgh’s areas of strength in scholarly activity.

68 Capturing the Next Economy
Table B-4: Top 20 publication fields in Pittsburgh by number of publications and publication location quotient, 2009-2015
Publication fieldNumber of publications
Publication fieldPublication location quotient
Surgery 2,621 Robotics 4.46
Neurosciences 2,599 Gerontology 3.81
Oncology 2,094 Physics Particles Fields 3.59
Biochemistry Molecular Biology 2,081 Critical Care Medicine 3.41
Clinical Neurology 1,853 Transplantation 2.95
Multidisciplinary Sciences 1,727 Psychiatry 2.32
Psychiatry 1,697 Computer Science Artificial Intelligence 2.25
Physics Particles Fields 1,608 Psychology Developmental 2.11
Astronomy Astrophysics 1,542 Cell Tissue Engineering 2.04
Materials Science Multidisciplinary 1,434 Computer Science Software Engineering 2.03
Immunology 1,417 Rheumatology 2.01
Cell Biology 1,316 Otorhinolaryngology 1.99
Chemistry Physical 1,242 Neuroimaging 1.99
Engineering Electrical Electronic 1,144 Pathology 1.91
Endocrinology Metabolism 1,139 Respiratory System 1.88
Medicine Research Experimental 1,135 Physics Nuclear 1.77
Public Envir/Occupational Health 1,122 Psychology Clinical 1.77
Chemistry Multidisciplinary 1,071 Obstetrics Gynecology 1.75
Pharmacology Pharmacy 1,069 Engineering Biomedical 1.75
Cardiac Cardiovascular Systems 1,034 Rehabilitation 1.72
Source: Web of Science.

69 Capturing the Next Economy
Interviews with research leaders from Pitt, CMU, and Duquesne and national rankings from U.S. News & World Report confirm the breadth of research excellence found in Pittsburgh’s academic institutions.
• Interviews noted many areas of excellence that stand out across computer sciences, life sciences, material sciences, and energy:
* Computer sciences—machine learning, robotics, cyber-physical systems (Internet of Things), information assurance.
* Life sciences—cell and tissue engineering, rehabilitation, lung and respiratory systems, critical care, transplantation, women’s health, oncology, infection and immunity, personalized medicine, and bioinformatics.
* Materials—metals and additive manufacturing, soft materials, membrane materials, product design.
* Energy—energy materials, smart grid.
• U.S. News & World Report rankings have Pittsburgh academic institutions among the top 20 in many fields:
* 1st in computer sciences overall, including 1st in programming languages, 2nd in computer engineering, and 4th in computer systems (CMU)
* 2nd in robotics (CMU)
* 5th in women’s health (Pitt/UPMC)
* 8th in drug and alcohol abuse (Pitt/UPMC)
* 8th in electrical engineering (CMU)
* 8th in mechanical engineering (CMU)
* 9th in pediatrics (Pitt/UPMC)
* 10th in geriatrics (Pitt/UPMC)
* 11th in material sciences (CMU)
* 18th in bioengineering (Pitt)
In sum, the prominence of Pittsburgh’s academic research institutions is suggested across an analysis of research funding, publication activities, national rankings, and leadership interviews. While life sciences and computer sciences stand out in excellence, other academic research strengths are also apparent, especially in material sciences, engineering, and energy. The multidisciplinary nature of Pittsburgh’s academic research strengths also is revealed through standout fields such as robotics and biomedical engineering.
Alignment of core competencies with advanced industry clusters in Pittsburgh
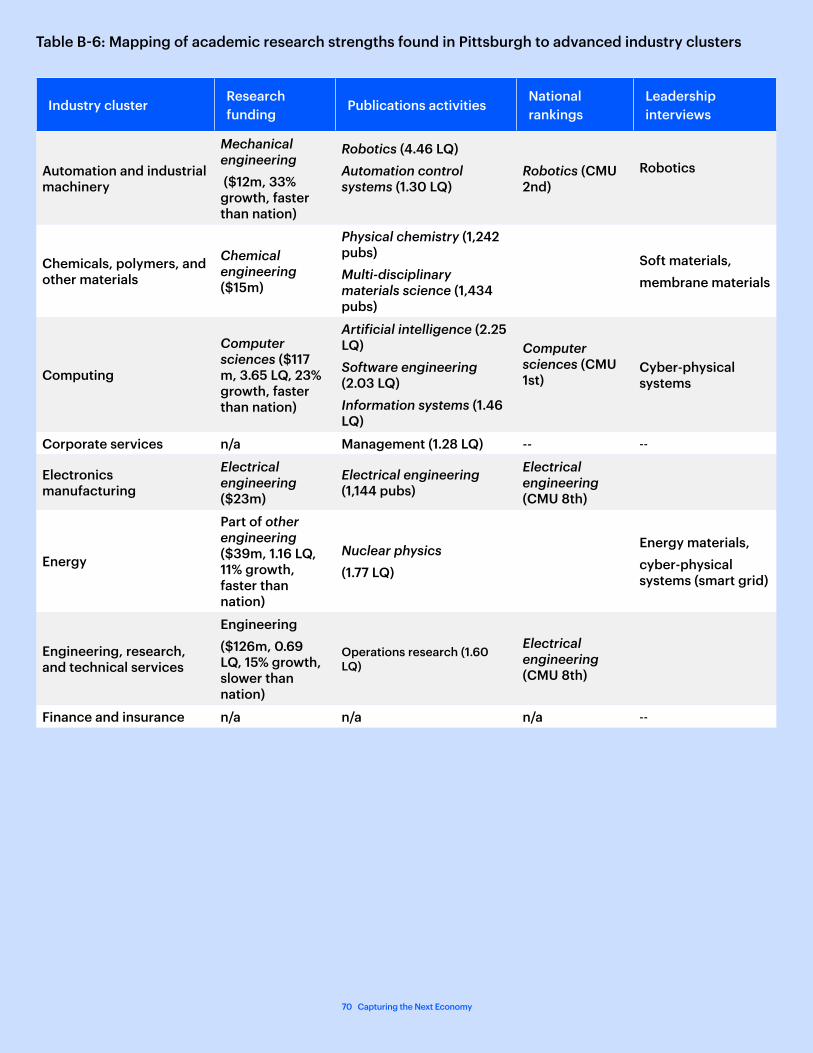
The significance of Pittsburgh’s strengths in patent activity and academic research for innovation-led development is illustrated by an alignment with advanced industry clusters that drives the regional economy. Table B-2 (on page 61) presents this mapping for patent innovation strengths and networks found, while Table B-6 maps this alignment across dimensions of research funding, publication activities, national rankings, and leadership interviews.
The implications of this strong alignment between patent innovation activity/academic research and the advanced industry clusters is that Pittsburgh is well-positioned to compete based on its innovative capacities across nearly all of its advanced industry clusters. This is a formidable position that opens many opportunities, particularly as advanced technological solutions become more and more interdisciplinary and involve increased industry-university partnerships.
70 Capturing the Next Economy
Table B-6: Mapping of academic research strengths found in Pittsburgh to advanced industry clusters
Industry clusterResearch funding
Publications activitiesNational rankings
Leadership interviews
Automation and industrial machinery
Mechanical engineering ($12m, 33% growth, faster than nation)
Robotics (4.46 LQ)Automation control systems (1.30 LQ)
Robotics (CMU 2nd)
Robotics
Chemicals, polymers, and other materials
Chemical engineering ($15m)
Physical chemistry (1,242 pubs)Multi-disciplinary materials science (1,434 pubs)
Soft materials,membrane materials
Computing
Computer sciences ($117 m, 3.65 LQ, 23% growth, faster than nation)
Artificial intelligence (2.25 LQ)Software engineering (2.03 LQ)Information systems (1.46 LQ)
Computer sciences (CMU 1st)
Cyber-physical systems
Corporate services n/a Management (1.28 LQ) -- --
Electronics manufacturing
Electrical engineering ($23m)
Electrical engineering (1,144 pubs)
Electrical engineering (CMU 8th)
Energy
Part of other engineering ($39m, 1.16 LQ, 11% growth, faster than nation)
Nuclear physics (1.77 LQ)
Energy materials,cyber-physical systems (smart grid)
Engineering, research, and technical services
Engineering($126m, 0.69 LQ, 15% growth, slower than nation)
Operations research (1.60 LQ)
Electrical engineering (CMU 8th)
Finance and insurance n/a n/a n/a --

71 Capturing the Next Economy
Industry clusterResearch funding
Publications activitiesNational rankings
Leadership interviews
Health services
Medical and biological sciences($700 m, 1.29 LQ, 30% growth, double U.S. average growth)
Other life sciences ($40m, 1.11 LQ, 157% growth, faster than nation)
Numerous clinical research fields
Medical informatics (1.46 LQ)
Women’s health (5th), drug & alcohol abuse (8th), pediatrics (9th), geriatrics (10th)
Lung and respiratory systems, critical care, transplantation, women’s health, oncology, infection and immunity, and personalized medicine
Medical technology
Medical and biological sciences($700 m, 1.29 LQ, 30% growth, double U.S. average growth)
Bioengineering ($18m, 1.16 LQ, 26% growth, slower than nation)
Cell and tissue engineering (2.04 LQ)Biomedical engineering(1.75 LQ)Biomaterials (1.58 LQ)Biochemistry/molecular biology (2,081 pubs) Cell biology (1,316 pubs)Immunology (1,417 pubs, 1.44 LQ)Pharmacology (1,069 pubs)Neuroimaging (1.99 LQ)Medical lab tech (1.46 LQ)Numerous clinical research fields
Cell and tissue engineering, rehabilitation, and bioinformatics
Metals & metal processing
Part of other engineering ($39m, 1.16 LQ, 11% growth, faster than nation)
Metallurgy (1.47 LQ) Metals and additive manufacturing