Appendix B - Arlington Public Schools B Observations (B1) Classroom Assessment Scoring System...
39
Appendix B Observations (B1) Classroom Assessment Scoring System (CLASS) Description Pages 1—5 (B2) Alignment of CLASS with APS Best Instructional Practices Pages 6—7 (B3) CLASS Domain and Dimension Scores Pages 8—20 (B4) Social Studies Observation Checklist Pages 21—38
Transcript of Appendix B - Arlington Public Schools B Observations (B1) Classroom Assessment Scoring System...

Appendix B
Observations
(B1) Classroom Assessment Scoring System (CLASS) Description Pages 1—5
(B2) Alignment of CLASS with APS Best Instructional Practices Pages 6—7
(B3) CLASS Domain and Dimension Scores Pages 8—20
(B4) Social Studies Observation Checklist Pages 21—38

Appendix B1
(B1) Page 1
Classroom Assessment Scoring System (CLASS)
What is CLASS?
The Classroom Assessment Scoring System (CLASS) is a classroom observation tool developed at the
University of Virginia’s Curry School of Education. It aims to provide a common lens and language
focused on classroom interactions that encourage student learning.
CLASS observations break down the complex classroom environment to help educators focus on boosting the effectiveness of their interactions with learners of all ages. Observations rely on categorizing interactions within the CLASS framework.
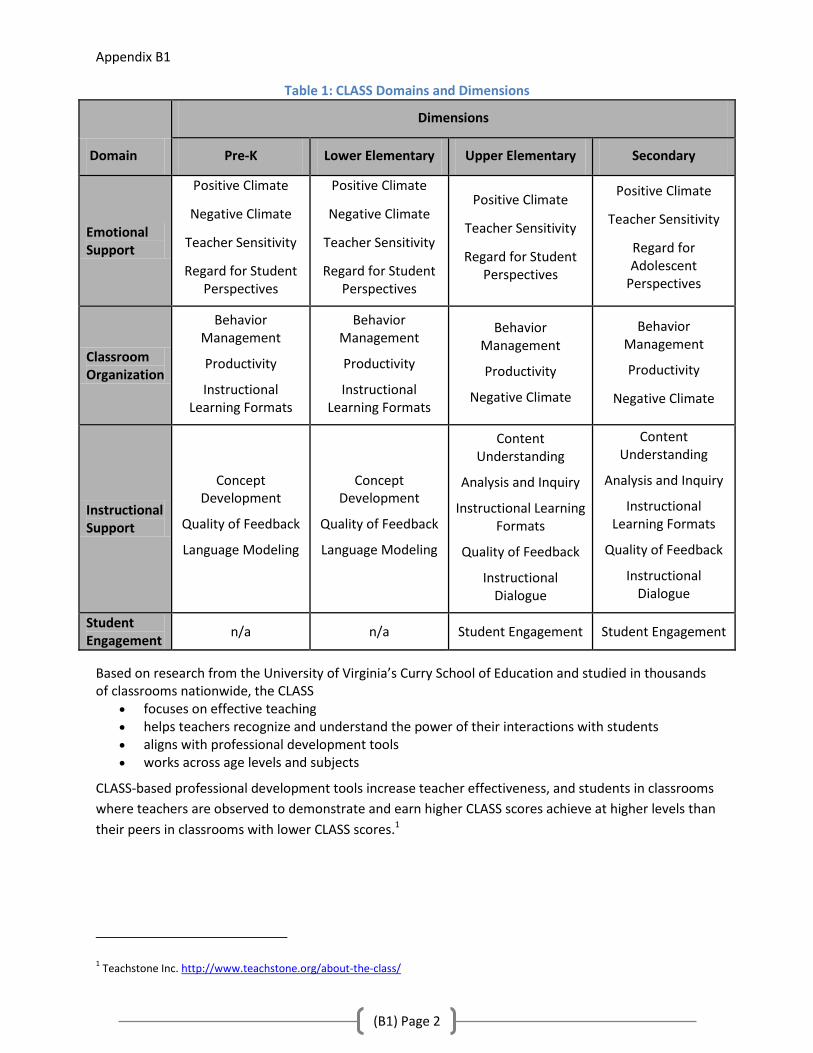
The CLASS tool organizes teacher-student interactions into three broad domains: Emotional Support,
Classroom Organization, and Instructional Support. The upper elementary and secondary tools include
an additional domain, Student Engagement. Within all domains except Student Engagement,
interactions are further organized into multiple dimensions. Table 1 lists the domains and dimensions
for each level.
Emotional Support: Students’ social and emotional functioning in the classroom is increasingly
recognized as an indicator of school readiness, a potential target for intervention, and even as a student
outcome that might be governed by a set of standards similar to those for academic achievement.
Students who are more motivated and connected to others are much more likely to establish positive
trajectories of development in both social and academic domains. Teachers’ abilities to support social
and emotional functioning in the classroom are therefore central to ratings of effective classroom
practices.
Classroom Organization: The classroom organization domain assesses a broad array of classroom
processes related to the organization and management of students’ behavior, time, and attention in the
classroom. Classrooms function best and provide the most opportunities for learning when students are
well-behaved, consistently have something to do, and are interested and engaged in learning tasks.
Instructional Support: The theoretical foundation for the instructional support domain is based on
research on children’s cognitive and language development. Thus the emphasis is on students’
construction of usable knowledge, rather than rote memorization, and metacognition—or the
awareness and understanding of one’s thinking process. As a result, the instructional support domain
does not make judgments about curriculum content; rather, it assesses the effectiveness of teachers’
interactions with students that support cognitive and language development.
Student Engagement: Unlike other domains, student engagement focuses strictly on student
functioning, and measures the overall engagement level of students in the classroom.
Appendix B1
(B1) Page 2
Table 1: CLASS Domains and Dimensions
Domain
Dimensions
Pre-K Lower Elementary Upper Elementary Secondary
Emotional Support
Positive Climate
Negative Climate
Teacher Sensitivity
Regard for Student Perspectives
Positive Climate
Negative Climate
Teacher Sensitivity
Regard for Student Perspectives
Positive Climate
Teacher Sensitivity
Regard for Student Perspectives
Positive Climate
Teacher Sensitivity
Regard for Adolescent
Perspectives
Classroom Organization
Behavior Management
Productivity
Instructional Learning Formats
Behavior Management
Productivity
Instructional Learning Formats
Behavior Management
Productivity
Negative Climate
Behavior Management
Productivity
Negative Climate
Instructional Support
Concept Development
Quality of Feedback
Language Modeling
Concept Development
Quality of Feedback
Language Modeling
Content Understanding
Analysis and Inquiry
Instructional Learning Formats
Quality of Feedback
Instructional Dialogue
Content Understanding
Analysis and Inquiry
Instructional Learning Formats
Quality of Feedback
Instructional Dialogue
Student Engagement
n/a n/a Student Engagement Student Engagement
Based on research from the University of Virginia’s Curry School of Education and studied in thousands of classrooms nationwide, the CLASS
focuses on effective teaching helps teachers recognize and understand the power of their interactions with students aligns with professional development tools works across age levels and subjects
CLASS-based professional development tools increase teacher effectiveness, and students in classrooms
where teachers are observed to demonstrate and earn higher CLASS scores achieve at higher levels than
their peers in classrooms with lower CLASS scores.1
1 Teachstone Inc. http://www.teachstone.org/about-the-class/
Appendix B1
(B1) Page 3
CLASS and Program Evaluation
APS conducts CLASS observations for all program evaluation reports, starting in the 2010-11 school year.
In the fall of 2010, the Office of Planning and Evaluation recruited retired teachers and administrators to
become certified CLASS observers. Certification is managed by the University of Virginia. Trainees
undergo in-depth training to help them use the tool effectively in the field. An assessment is used to
ensure that the observers have demonstrated reliability with the CLASS tool.
Each observation lasts approximately 30 minutes and observers are instructed to view either the
beginning or end of a class. Ten additional minutes are provided for coding of the observation. Self-
contained classrooms that serve ESOL/HILT students or students with a disability, as well as mainstream
classrooms with ESOL/HILT students or students with a disability, are included.
CLASS Scores
CLASS dimensions are scored on a 7-point scale consisting of Low (1, 2), Mid (3, 4, 5), and High (6, 7)
ranges. A score in the low range indicates an absence or lack of the behaviors associated with a given
dimension, while a score in the high range indicates a high presence of such behaviors. Scores in the
high range are desirable for all dimensions except for Negative Climate. With this dimension, the goal is
a low score, or an absence of negativity.
Research Foundations of CLASS
The CLASS framework is derived from developmental theory and research suggesting that interactions
between students and adults are the primary mechanism of child development and learning.
Elementary CLASS
Research provides evidence about the types of teacher-student interactions that promote positive social
and academic development. The Classroom Assessment Scoring System™ (CLASS) provides a reliable,
valid assessment of these interactions2
Selected studies demonstrate: • Higher levels of instructional support are related to preschoolers’ gains in pre-reading and math skills.3 • High levels of emotional support contribute to preschoolers’ social competence in the kindergarten
year.4 • High levels of emotional support are associated with growth in reading and math achievement from
kindergarten through fifth grade.5 • High levels of classroom organization are associated with gains in first graders’ literacy.6 • Kindergarten children are more engaged and exhibit greater self-control in classrooms offering more
effective teacher-child interactions.7
2 Karen LaParo, Robert Pianta, and Meghan Stuhlman, “Classroom Assessment Scoring System (CLASS): Findings from the Pre-K
Year,” Elementary School Journal, 104:5, pages 409-426. 3 Mashburn, Pianta, Hamre, Downer et al., Child Development,79, pages 732-749.
4 Timothy Curby, Jennifer Locasale-Crouch, Timothy Konold, Robert Pianta, Carollee Howes, Margaret Burchinal et al., “The
Relations of Observed Pre-K Classrooms Quality Profiles to Children’s Academic Achievement and Social Competence,” Early Education and Development, 19, pages 643-666. 5 Robert Pianta, Jay Belsky, Nathan Vandergrift, Renee Houts, Fred Morrison, and NICHD-ECCRN, “Classroom Effects on Children’s
Achievement Trajectories in Elementary School,” American Education Research Journal, 49, pages 365-397. 6 Claire Cameron Ponitz, Sara Rimm-Kaufman, Laura Brock, and Lori Nathanson, “Contributions of gender, early school
adjustment, and classroom organizational climate to first grade outcomes,” Elementary School Journal, 110, 142-162. 7 Sara Rimm-Kaufman, Timothy Curby, Kevin Grimm, Lori Nathanson and Laura Brock, “The Contribution of Children’s Self-
Regulation and Classroom Quality to Children’s Adaptive Behavior in Kindergarten,” Developmental Psychology, in-press. See
Appendix B1
(B1) Page 4
• First-grade children at risk for school failure perform on par with peers, both socially and academically, when exposed to classrooms with effective teacher-student interactions.8
Moreover, studies conducted in over 6,000 classrooms provide evidence that students in PK–5
classrooms with higher CLASS ratings realize greater gains in achievement and social skill development.9
Secondary CLASS
Research using the more recently developed secondary CLASS tool has shown that teachers’ skills in
establishing a positive emotional climate, their sensitivity to student needs, and their structuring of their
classroom and lessons in ways that recognize adolescents’ needs for a sense of autonomy and control,
for an active role in their learning, and for opportunities for peer interaction were all associated with
higher relative student gains in achievement.10
Alignment with APS Initiatives
Differentiation The four domains measured by the CLASS are essential in effectively differentiated classrooms. In
addition, dimensions such as teacher sensitivity, regard for student/adolescent perspectives, and
instructional learning formats specifically address behaviors necessary for effective differentiation.
Teacher Evaluation (Danielson)
The CLASS tool is heavily aligned with Charlotte Danielson’s Framework for Teaching11, which sets forth
standards for teaching behaviors in the areas of planning, instruction, classroom environment, and
professional responsibility. Danielson’s Levels of Performance rubrics are the foundation for all T-Scale
staff evaluation in APS.
Cultural Competence
There is strong alignment between Gay’s Exemplars of Culturally Responsive Behaviors12 and classroom
behaviors identified in the CLASS tool. The APS Council for Cultural Competence was established in 2003
to develop the framework for permanent, systemwide cultural competence activities including ongoing
cultural competence training for all staff. Cultural competence is a set of attitudes, skills, behaviors, and
policies that enable organizations and staff to work effectively in cross-cultural situations.
SIOP
Many of the dimensions of the CLASS are aligned with components of the Sheltered instruction
Observation Protocol (SIOP)13, an approach to teaching that promotes content-area learning and
also NICHD ECCRN, “A Day in Third Grade: A Large- Scale Study of Classroom Quality and Teacher and Student Behavior,” Elementary School Journal, 105, pages 305-323. 8 Bridget Hamre and Robert Pianta, “Can Instructional and Emotional Support in First Grade Classrooms Make a Difference for
Children At Risk of School Failure?” Child Development, 76, pages 949-967. 9 Website http://curry.virginia.edu/uploads/resourceLibrary/CLASS-MTP_PK-12_brief.pdf Center for Advanced Study of
Teaching and Learning Charlottesville, Virginia, Measuring and Improving Teacher-Student Interactions in PK-12 Settings to Enhance Students’ Learning 10
Joseph P. Allen, Anne Gregory, Amori Mikami, Janetta Lun, Bridget Hamre, and Robert C. Pianta, “Observations of Effective Teaching in Secondary School Classrooms: Predicting Student Achievement with the CLASS-S.” Submitted. 11
Charlotte Danielson (2007), Enhancing Professional Practice: A Framework for Teaching, Alexandria, VA: ASCD. 12
Geneva Gay (2000). Culturally Responsive Teaching: Theory, Research, & Practice. New York: Teachers College Press.
13 Website http://siop.pearson.com/about-siop
Appendix B1
(B1) Page 5
language development for English language learners. SIOP encourages teachers to adapt grade-level
content lessons to the students’ levels of English proficiency, while focusing on English language
development to help students increase their proficiency in academic English.
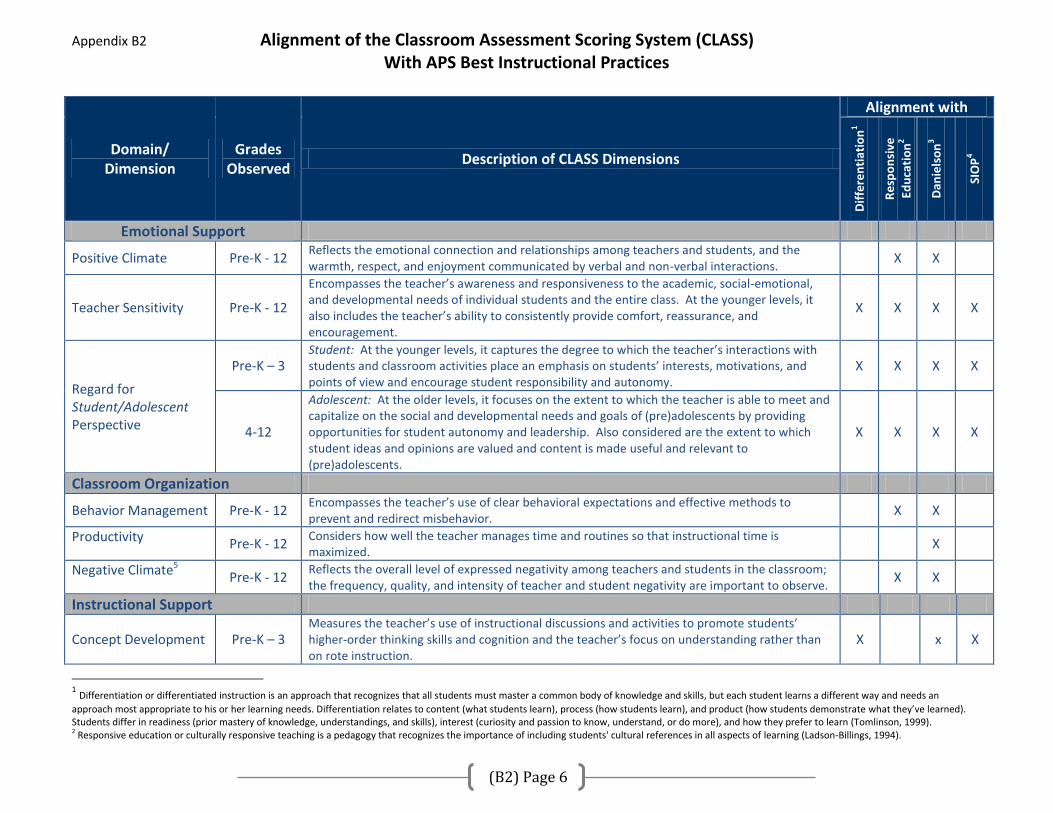
Appendix B2 Alignment of the Classroom Assessment Scoring System (CLASS) With APS Best Instructional Practices
(B2) Page 6
Domain/ Dimension
Grades Observed
Description of CLASS Dimensions
Alignment with
Dif
fere
nti
atio
n1
Re
spo
nsi
ve
Edu
cati
on
2
Dan
iels
on
3
SIO
P4
Emotional Support
Positive Climate Pre-K - 12 Reflects the emotional connection and relationships among teachers and students, and the warmth, respect, and enjoyment communicated by verbal and non-verbal interactions.
X X
Teacher Sensitivity Pre-K - 12
Encompasses the teacher’s awareness and responsiveness to the academic, social-emotional, and developmental needs of individual students and the entire class. At the younger levels, it also includes the teacher’s ability to consistently provide comfort, reassurance, and encouragement.
X X X X
Regard for Student/Adolescent Perspective
Pre-K – 3 Student: At the younger levels, it captures the degree to which the teacher’s interactions with students and classroom activities place an emphasis on students’ interests, motivations, and points of view and encourage student responsibility and autonomy.
X X X X
4-12
Adolescent: At the older levels, it focuses on the extent to which the teacher is able to meet and capitalize on the social and developmental needs and goals of (pre)adolescents by providing opportunities for student autonomy and leadership. Also considered are the extent to which student ideas and opinions are valued and content is made useful and relevant to (pre)adolescents.
X X X X
Classroom Organization
Behavior Management Pre-K - 12 Encompasses the teacher’s use of clear behavioral expectations and effective methods to prevent and redirect misbehavior.
X X
Productivity Pre-K - 12 Considers how well the teacher manages time and routines so that instructional time is maximized.
X
Negative Climate5 Pre-K - 12
Reflects the overall level of expressed negativity among teachers and students in the classroom; the frequency, quality, and intensity of teacher and student negativity are important to observe.
X X
Instructional Support
Concept Development Pre-K – 3 Measures the teacher’s use of instructional discussions and activities to promote students’ higher-order thinking skills and cognition and the teacher’s focus on understanding rather than on rote instruction.
X x X
1 Differentiation or differentiated instruction is an approach that recognizes that all students must master a common body of knowledge and skills, but each student learns a different way and needs an
approach most appropriate to his or her learning needs. Differentiation relates to content (what students learn), process (how students learn), and product (how students demonstrate what they’ve learned). Students differ in readiness (prior mastery of knowledge, understandings, and skills), interest (curiosity and passion to know, understand, or do more), and how they prefer to learn (Tomlinson, 1999). 2 Responsive education or culturally responsive teaching is a pedagogy that recognizes the importance of including students' cultural references in all aspects of learning (Ladson-Billings, 1994).

Appendix B2 Alignment of the Classroom Assessment Scoring System (CLASS) With APS Best Instructional Practices
(B2) Page 7
Domain/ Dimension
Grades Observed
Description of CLASS Dimensions
Alignment with
Dif
fere
nti
atio
n1
Re
spo
nsi
ve
Edu
cati
on
2
Dan
iels
on
3
SIO
P4
Content Understanding
4-12
Refers to both the depth of the lesson content and the approaches used to help students comprehend the framework, key ideas, and procedures in an academic discipline. At a high level, this refers to interactions among the teacher and students that lead to an integrated understanding of facts, skills, concepts, and principles.
X X X
Analysis and Inquiry 4-12
Assesses the degree to which the teacher facilitates students’ use of higher-level thinking skills, such as analysis, problem solving, reasoning, and creation through the application of knowledge and skills. Opportunities for demonstrating metacognition, i.e. thinking about thinking, are also included.
X X X
Instructional Learning Formats6
Pre-K - 12 Focuses on the ways in which the teacher maximizes students’ interest and engagement in learning. This includes the teacher’s use of interesting and engaging lessons and materials, active facilitation, and clarity of learning objectives.
X X X X
Quality of Feedback Pre-K - 12 Assesses the degree to which feedback expands and extends learning and understanding and encourages student participation. (At the secondary level, significant feedback may be provided by peers)
X X X
Language Modeling Pre-K-3 Captures the quality and amount of the teacher’s use of language-stimulation and language-facilitation techniques.
X X
Instructional Dialogue 4-5
Captures the purposeful use of dialogue- structured, cumulative questioning and discussion which guide and prompt students- to facilitate students’ understanding of content and language development. The extent to which these dialogues are distributed across all students in the class and across the class period is important to this rating.
X X
Student Engagement 4-12
Intended to capture the degree to which all students in the class are focused and participating in the learning activity presented or facilitated by the teacher. The difference between passive engagement and active engagement is of note in this rating.
X X X
3
Danielson’s Domains of Teaching Responsibility frame the APS teacher evaluation process and are based on Charlotte Danielson’s Enhancing Professional Practice. The domains are the areas in which T-Scale
employees are evaluated and are the foundation for Best Instructional Practices. For classroom based teachers they include: Planning and Preparation, Classroom Environment, Instruction and Professional Responsibilities. For non-classroom-based teachers the domains are: Planning and Preparation, Environment, Delivery of Service, and Professional Responsibilities. 4
Sheltered instruction Observation Protocol (SIOP) is an approach to teaching that promotes content-area learning and language development for English language learners. Teachers adapt grade-level content
lessons to the students’ levels of English proficiency, while focusing on English language development to help students increase their proficiency in academic English. 5 This dimension falls under the Emotional Support domain at the pre-K and lower elementary levels. 6 This dimension falls under the Classroom Organization domain at the pre-K and lower elementary levels.
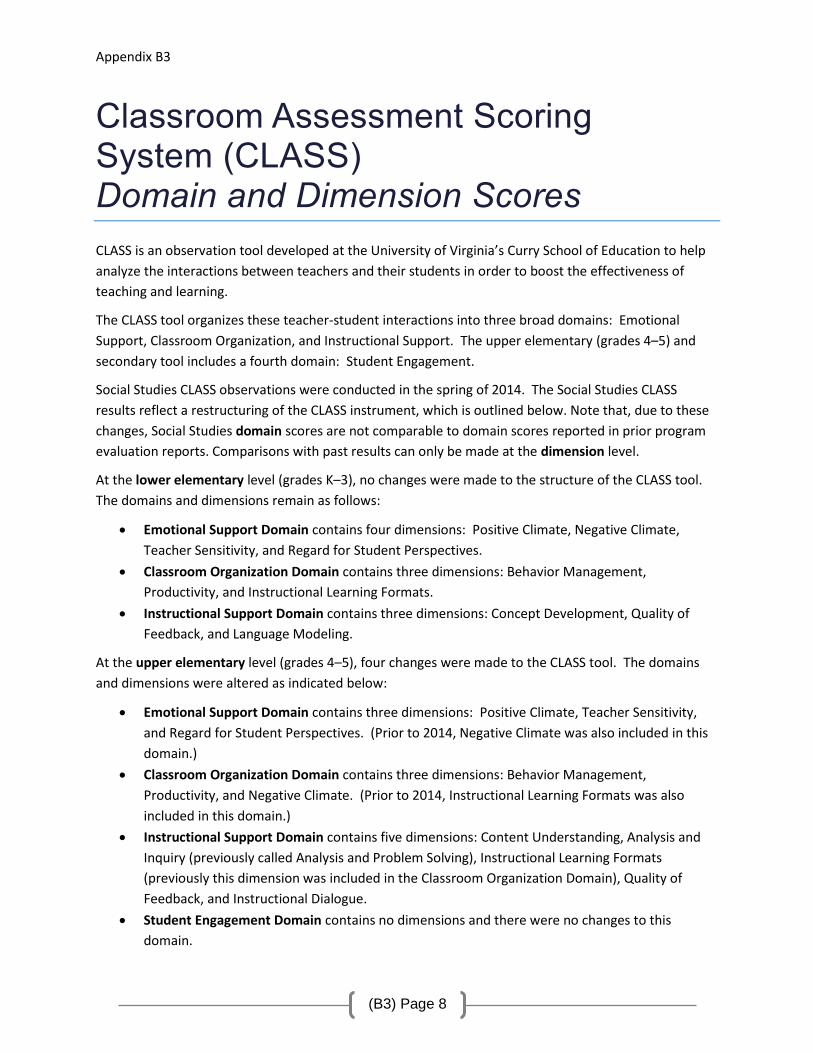
Appendix B3
(B3) Page 8
Classroom Assessment Scoring System (CLASS) Domain and Dimension Scores
CLASS is an observation tool developed at the University of Virginia’s Curry School of Education to help
analyze the interactions between teachers and their students in order to boost the effectiveness of
teaching and learning.
The CLASS tool organizes these teacher-student interactions into three broad domains: Emotional
Support, Classroom Organization, and Instructional Support. The upper elementary (grades 4–5) and
secondary tool includes a fourth domain: Student Engagement.
Social Studies CLASS observations were conducted in the spring of 2014. The Social Studies CLASS
results reflect a restructuring of the CLASS instrument, which is outlined below. Note that, due to these
changes, Social Studies domain scores are not comparable to domain scores reported in prior program
evaluation reports. Comparisons with past results can only be made at the dimension level.
At the lower elementary level (grades K–3), no changes were made to the structure of the CLASS tool.
The domains and dimensions remain as follows:
Emotional Support Domain contains four dimensions: Positive Climate, Negative Climate,
Teacher Sensitivity, and Regard for Student Perspectives.
Classroom Organization Domain contains three dimensions: Behavior Management,
Productivity, and Instructional Learning Formats.
Instructional Support Domain contains three dimensions: Concept Development, Quality of
Feedback, and Language Modeling.
At the upper elementary level (grades 4–5), four changes were made to the CLASS tool. The domains
and dimensions were altered as indicated below:
Emotional Support Domain contains three dimensions: Positive Climate, Teacher Sensitivity,
and Regard for Student Perspectives. (Prior to 2014, Negative Climate was also included in this
domain.)
Classroom Organization Domain contains three dimensions: Behavior Management,
Productivity, and Negative Climate. (Prior to 2014, Instructional Learning Formats was also
included in this domain.)
Instructional Support Domain contains five dimensions: Content Understanding, Analysis and
Inquiry (previously called Analysis and Problem Solving), Instructional Learning Formats
(previously this dimension was included in the Classroom Organization Domain), Quality of
Feedback, and Instructional Dialogue.
Student Engagement Domain contains no dimensions and there were no changes to this
domain.
Appendix B3
(B3) Page 9
At the middle school and high school levels, four changes were made to the CLASS tool. The domains
and dimensions were altered as indicated below:
Emotional Support Domain contains three dimensions: Positive Climate, Teacher Sensitivity,
and Regard for Adolescent Perspectives. (Prior to 2014, Negative Climate was also included in
this domain.)
Classroom Organization Domain contains three dimensions: Behavior Management,
Productivity, and Negative Climate. (Prior to 2014, Instructional Learning Formats was also
included in this domain.)
Instructional Support Domain contains five dimensions: Content Understanding, Analysis and
Inquiry (previously called Analysis and Problem Solving), Instructional Learning Formats
(previously this dimension was included in the Classroom Organization Domain), Quality of
Feedback, and Instructional Dialogue (this dimension was added to middle school and high
school in 2014).
Student Engagement Domain contains no dimensions.
Scores are assigned for each dimension within a domain on a scale of 1 to 7, with 7 being the best
possible score. However, the dimension of Negative Climate uses a reverse scale, with a score of 1
considered the best, as it indicates a lack of negativity.
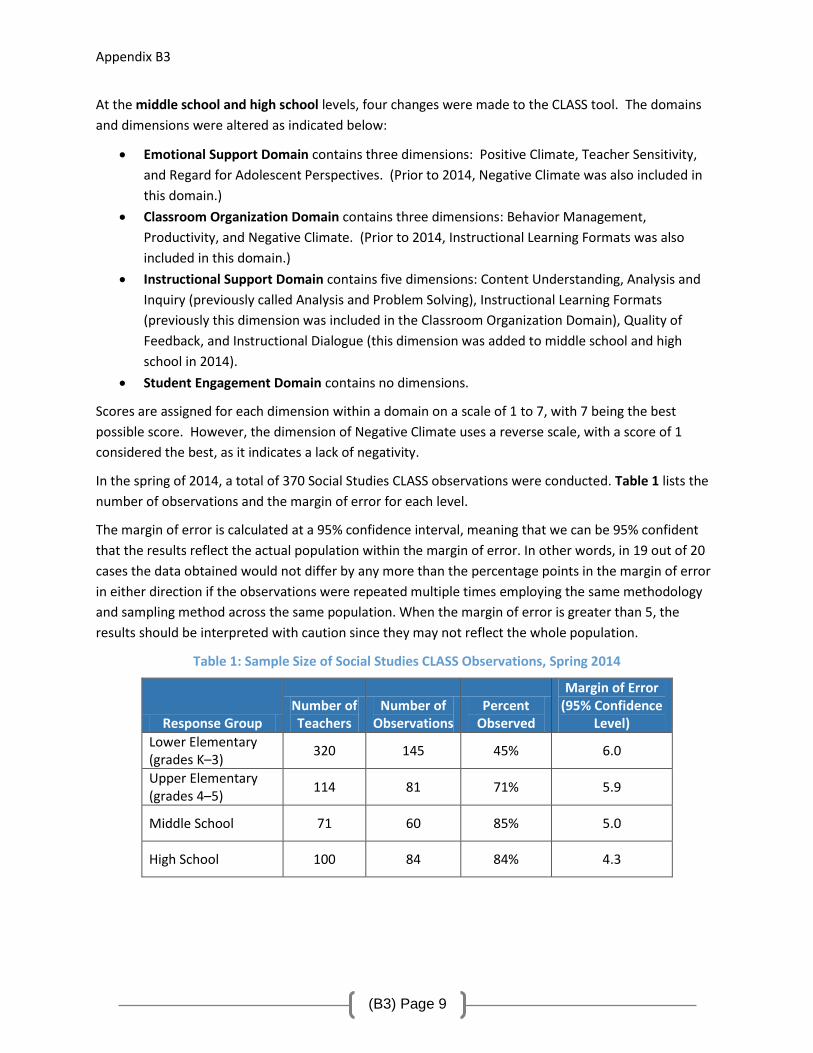
In the spring of 2014, a total of 370 Social Studies CLASS observations were conducted. Table 1 lists the
number of observations and the margin of error for each level.
The margin of error is calculated at a 95% confidence interval, meaning that we can be 95% confident
that the results reflect the actual population within the margin of error. In other words, in 19 out of 20
cases the data obtained would not differ by any more than the percentage points in the margin of error
in either direction if the observations were repeated multiple times employing the same methodology
and sampling method across the same population. When the margin of error is greater than 5, the
results should be interpreted with caution since they may not reflect the whole population.
Table 1: Sample Size of Social Studies CLASS Observations, Spring 2014
Response Group Number of Teachers
Number of Observations
Percent Observed
Margin of Error (95% Confidence
Level)
Lower Elementary (grades K–3)
320 145 45% 6.0
Upper Elementary (grades 4–5)
114 81 71% 5.9
Middle School 71 60 85% 5.0
High School 100 84 84% 4.3

Appendix B3
(B3) Page 10
Table 2 shows (1) the total number of Social Studies classes observed in the spring of 2014 at the lower
elementary level (grades K–3), (2) the mean score (scale of 1–7) achieved, and (3) the associated
standard deviation for each CLASS domain and dimension.
Table 2: Average Domain and Dimension Scores for Lower Elementary Social Studies, Spring 2014
Average Domain and Dimension Scores
Lower Elementary
N Mean Std.
Deviation
Emotional Support 145 5.7 0.7
Positive Climate 144 5.6 1.0
Negative Climate1 144 1.1 0.3
Teacher Sensitivity 143 5.6 1.0
Regard for Student Perspectives
144 4.7 1.2
Classroom Organization 145 5.8 1.0
Behavior Management 144 5.6 1.1
Productivity 142 6.1 1.0
Instructional Learning Formats
143 5.5 1.1
Instructional Support 145 4.3 1.3
Concept Development 145 4.3 1.5
Quality of Feedback 144 4.4 1.4
Language Modeling 144 4.3 1.4
1 A lower score is desirable for the Negative Climate Dimension. The Negative Climate score is reversed when
calculating the Emotional Support Domain score.
Appendix B3
(B3) Page 11
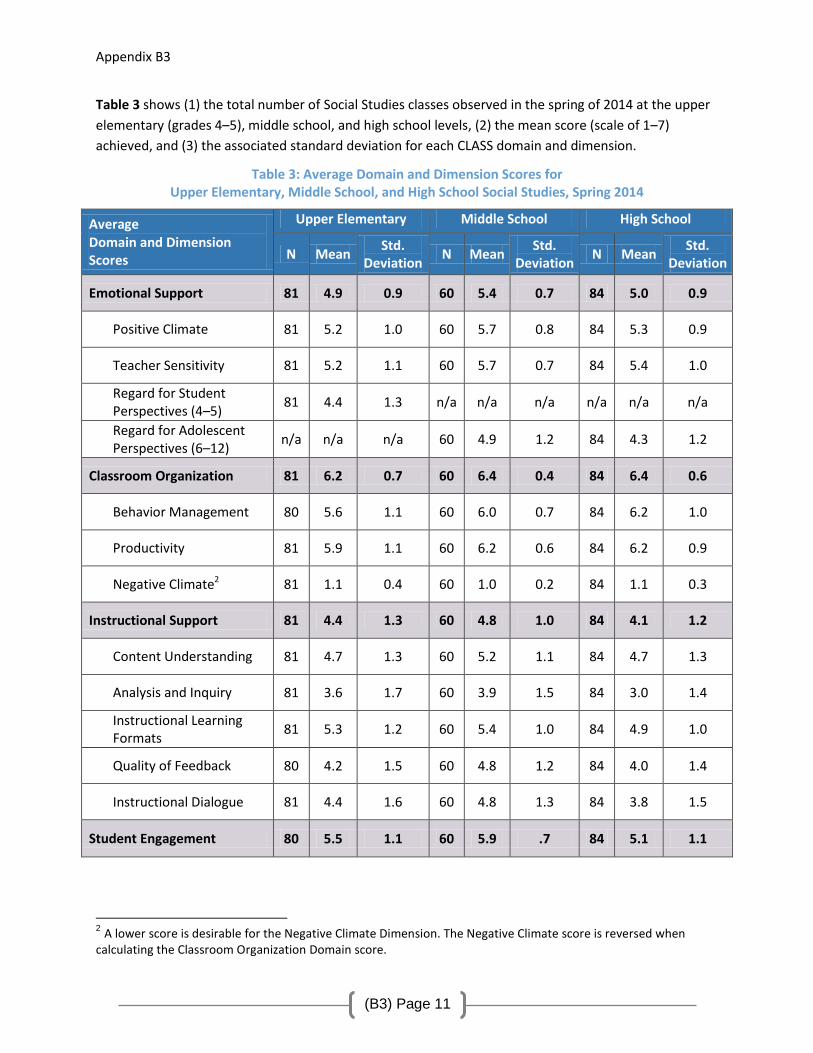
Table 3 shows (1) the total number of Social Studies classes observed in the spring of 2014 at the upper
elementary (grades 4–5), middle school, and high school levels, (2) the mean score (scale of 1–7)
achieved, and (3) the associated standard deviation for each CLASS domain and dimension.
Table 3: Average Domain and Dimension Scores for Upper Elementary, Middle School, and High School Social Studies, Spring 2014
Average Domain and Dimension Scores
Upper Elementary Middle School High School
N Mean Std.
Deviation N Mean
Std. Deviation
N Mean Std.
Deviation
Emotional Support 81 4.9 0.9 60 5.4 0.7 84 5.0 0.9
Positive Climate 81 5.2 1.0 60 5.7 0.8 84 5.3 0.9
Teacher Sensitivity 81 5.2 1.1 60 5.7 0.7 84 5.4 1.0
Regard for Student Perspectives (4–5)
81 4.4 1.3 n/a n/a n/a n/a n/a n/a
Regard for Adolescent Perspectives (6–12)
n/a n/a n/a 60 4.9 1.2 84 4.3 1.2
Classroom Organization 81 6.2 0.7 60 6.4 0.4 84 6.4 0.6
Behavior Management 80 5.6 1.1 60 6.0 0.7 84 6.2 1.0
Productivity 81 5.9 1.1 60 6.2 0.6 84 6.2 0.9
Negative Climate2 81 1.1 0.4 60 1.0 0.2 84 1.1 0.3
Instructional Support 81 4.4 1.3 60 4.8 1.0 84 4.1 1.2
Content Understanding 81 4.7 1.3 60 5.2 1.1 84 4.7 1.3
Analysis and Inquiry 81 3.6 1.7 60 3.9 1.5 84 3.0 1.4
Instructional Learning Formats
81 5.3 1.2 60 5.4 1.0 84 4.9 1.0
Quality of Feedback 80 4.2 1.5 60 4.8 1.2 84 4.0 1.4
Instructional Dialogue 81 4.4 1.6 60 4.8 1.3 84 3.8 1.5
Student Engagement 80 5.5 1.1 60 5.9 .7 84 5.1 1.1
2 A lower score is desirable for the Negative Climate Dimension. The Negative Climate score is reversed when
calculating the Classroom Organization Domain score.
Appendix B3
(B3) Page 12
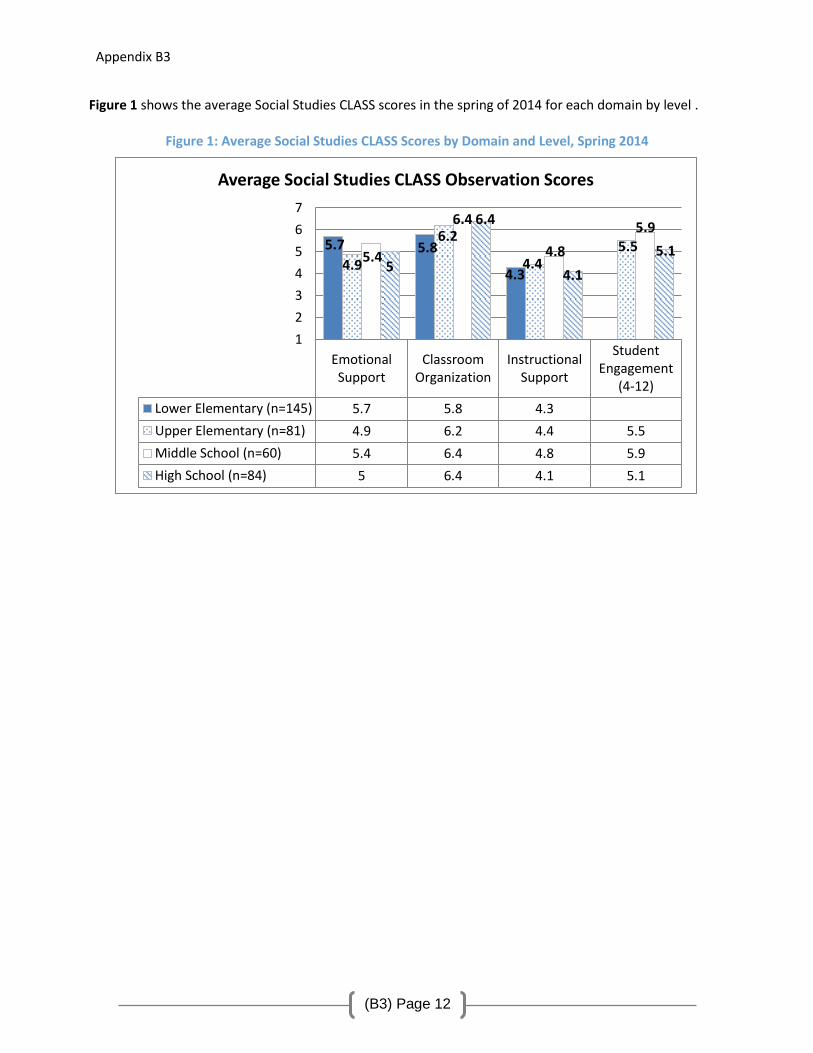
Figure 1 shows the average Social Studies CLASS scores in the spring of 2014 for each domain by level .
Figure 1: Average Social Studies CLASS Scores by Domain and Level, Spring 2014
EmotionalSupport
ClassroomOrganization
InstructionalSupport
StudentEngagement
(4-12)
Lower Elementary (n=145) 5.7 5.8 4.3
Upper Elementary (n=81) 4.9 6.2 4.4 5.5
Middle School (n=60) 5.4 6.4 4.8 5.9
High School (n=84) 5 6.4 4.1 5.1
5.7 5.8
4.3 4.9
6.2
4.4 5.5
5.4
6.4
4.8
5.9
5
6.4
4.1
5.1
1
2
3
4
5
6
7
Average Social Studies CLASS Observation Scores
Appendix B3
(B3) Page 13
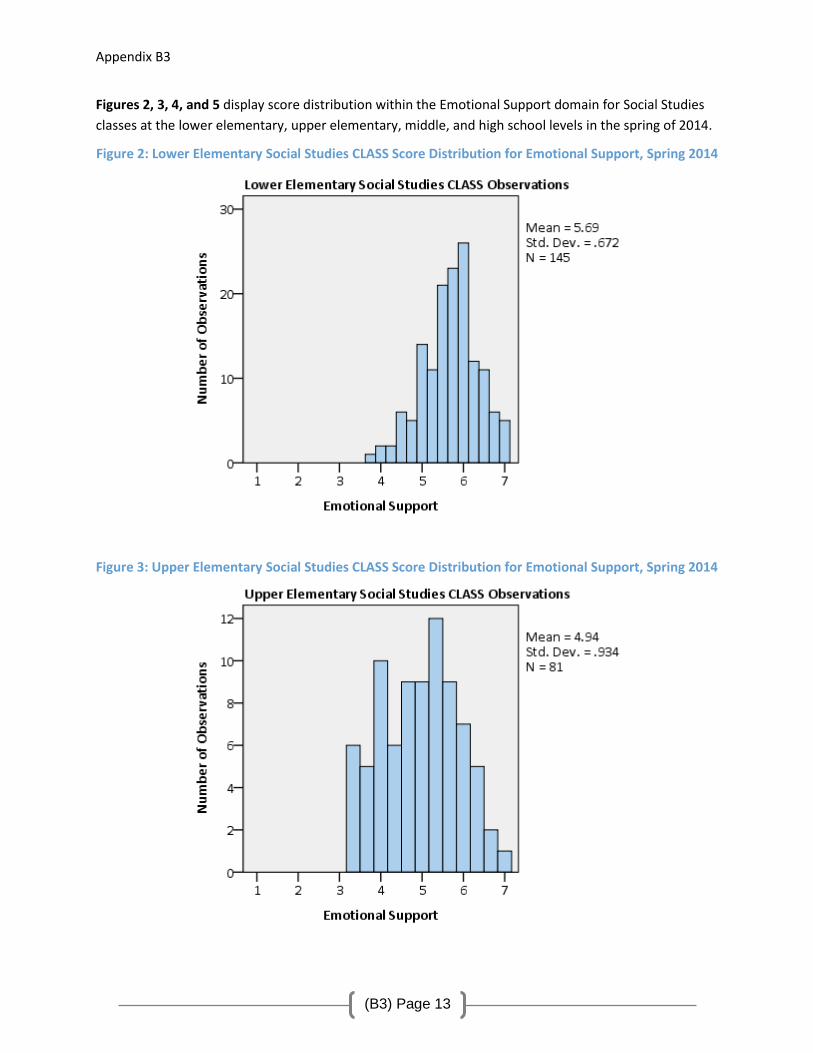
Figures 2, 3, 4, and 5 display score distribution within the Emotional Support domain for Social Studies
classes at the lower elementary, upper elementary, middle, and high school levels in the spring of 2014.
Figure 2: Lower Elementary Social Studies CLASS Score Distribution for Emotional Support, Spring 2014
Figure 3: Upper Elementary Social Studies CLASS Score Distribution for Emotional Support, Spring 2014

Appendix B3
(B3) Page 14
Figure 4: Middle School Social Studies CLASS Score Distribution for Emotional Support, Spring 2014
Figure 5: High School Social Studies CLASS Score Distribution for Emotional Support, Spring 2014
Appendix B3
(B3) Page 15
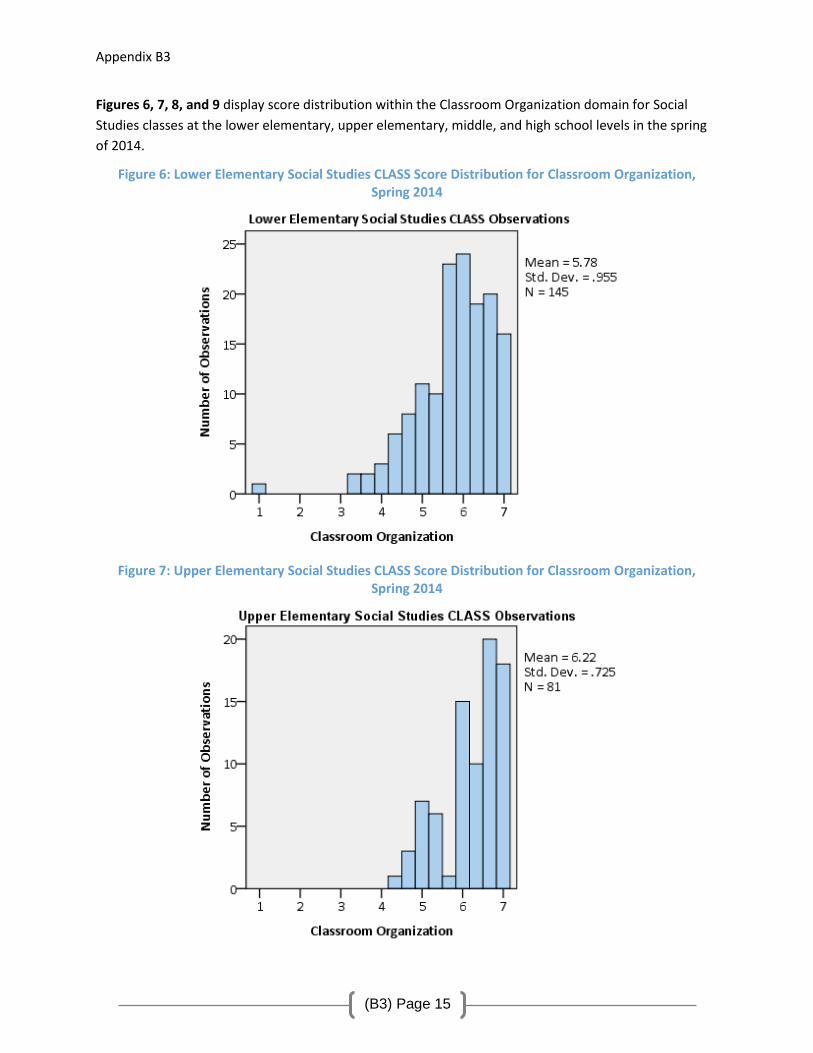
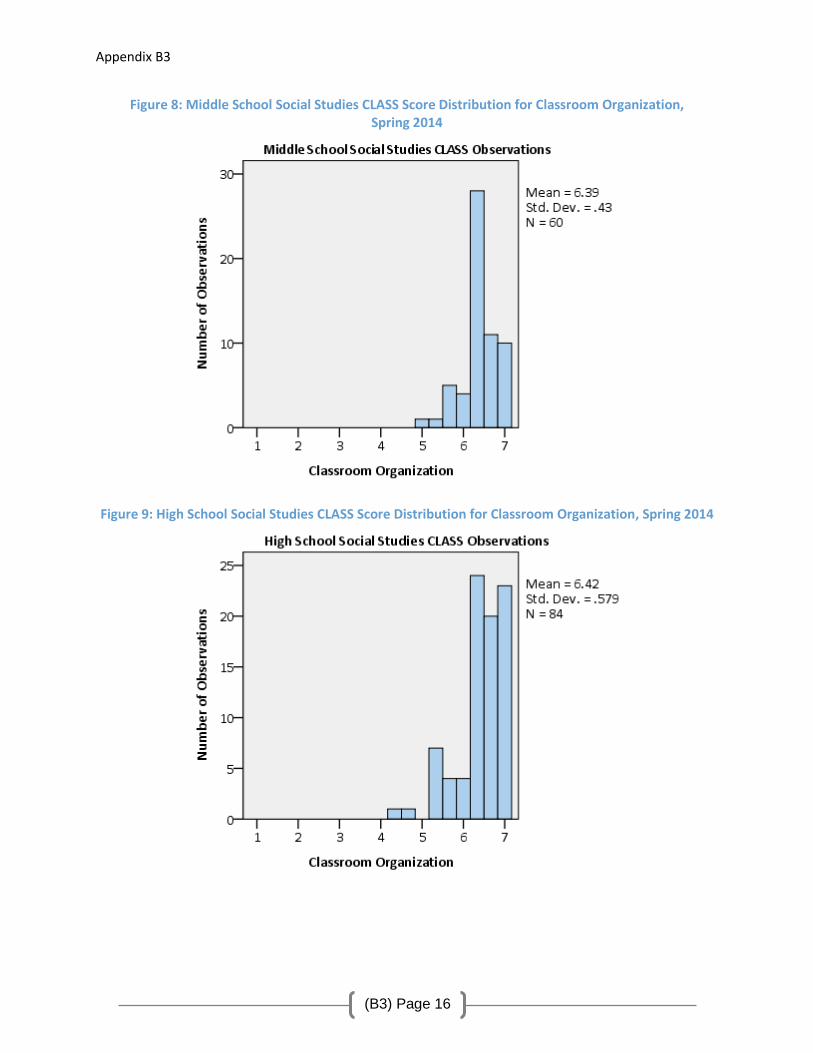
Figures 6, 7, 8, and 9 display score distribution within the Classroom Organization domain for Social
Studies classes at the lower elementary, upper elementary, middle, and high school levels in the spring
of 2014.
Figure 6: Lower Elementary Social Studies CLASS Score Distribution for Classroom Organization, Spring 2014
Figure 7: Upper Elementary Social Studies CLASS Score Distribution for Classroom Organization,
Spring 2014
Appendix B3
(B3) Page 16
Figure 8: Middle School Social Studies CLASS Score Distribution for Classroom Organization, Spring 2014
Figure 9: High School Social Studies CLASS Score Distribution for Classroom Organization, Spring 2014
Appendix B3
(B3) Page 17
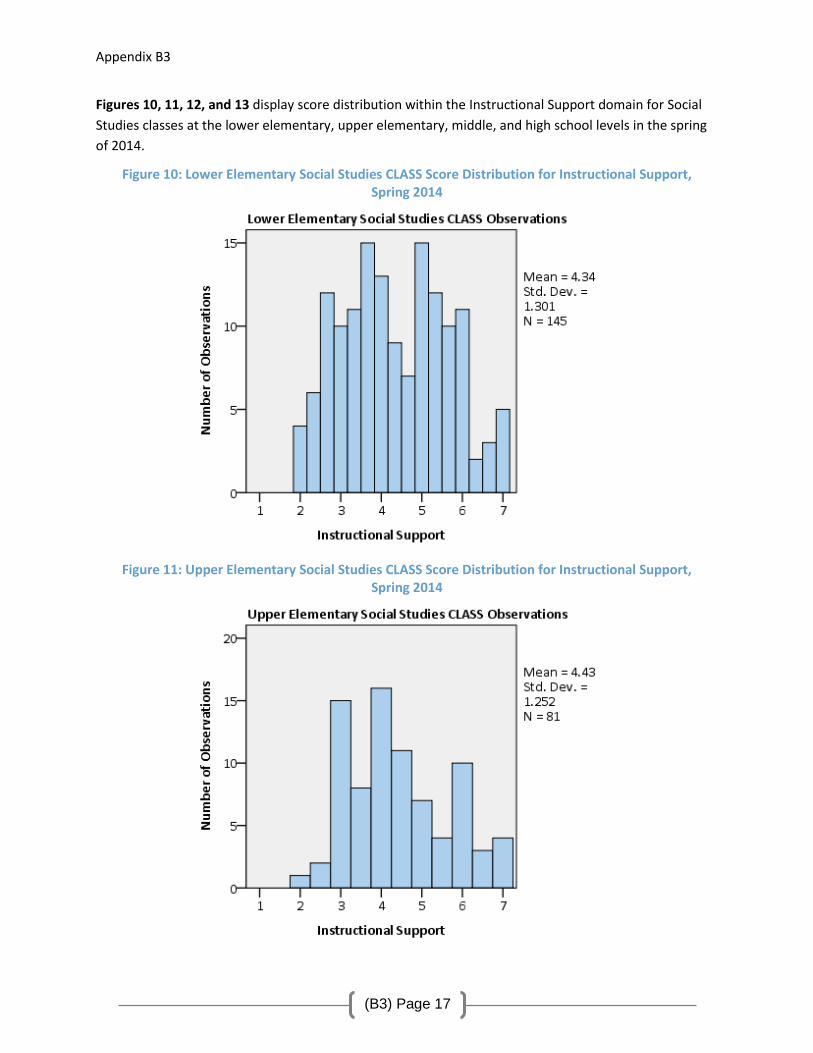
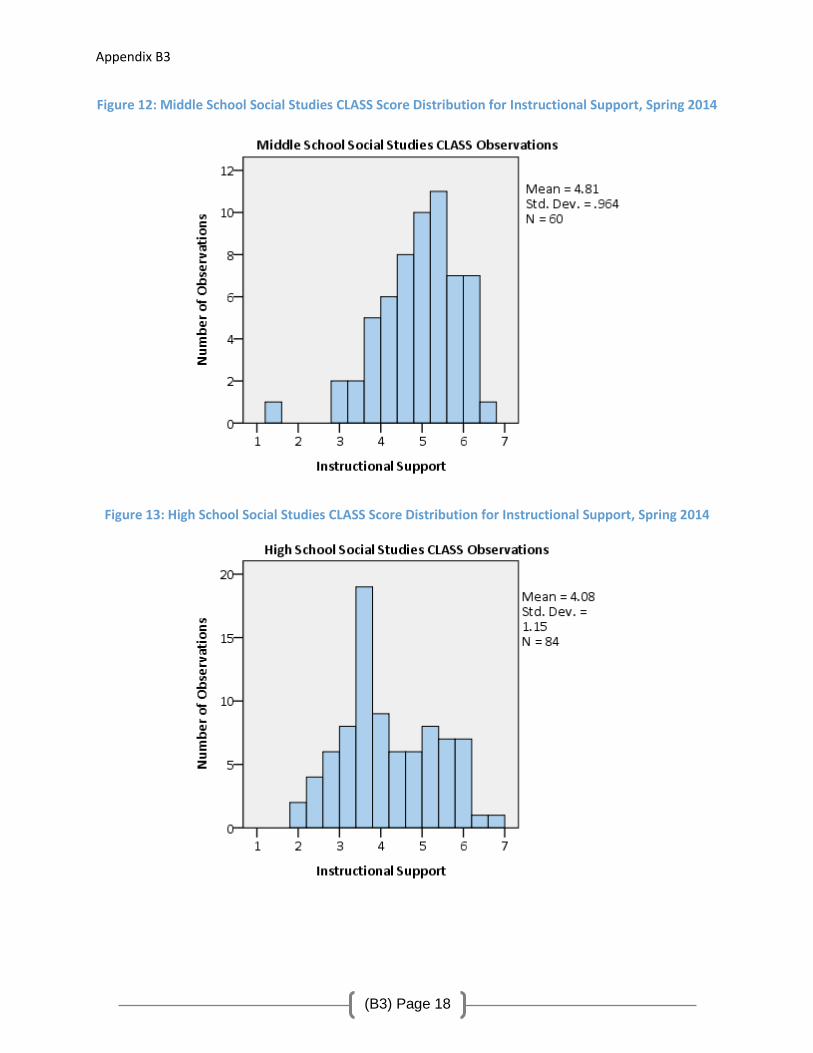
Figures 10, 11, 12, and 13 display score distribution within the Instructional Support domain for Social
Studies classes at the lower elementary, upper elementary, middle, and high school levels in the spring
of 2014.
Figure 10: Lower Elementary Social Studies CLASS Score Distribution for Instructional Support, Spring 2014
Figure 11: Upper Elementary Social Studies CLASS Score Distribution for Instructional Support,
Spring 2014
Appendix B3
(B3) Page 18
Figure 12: Middle School Social Studies CLASS Score Distribution for Instructional Support, Spring 2014
Figure 13: High School Social Studies CLASS Score Distribution for Instructional Support, Spring 2014
Appendix B3
(B3) Page 19
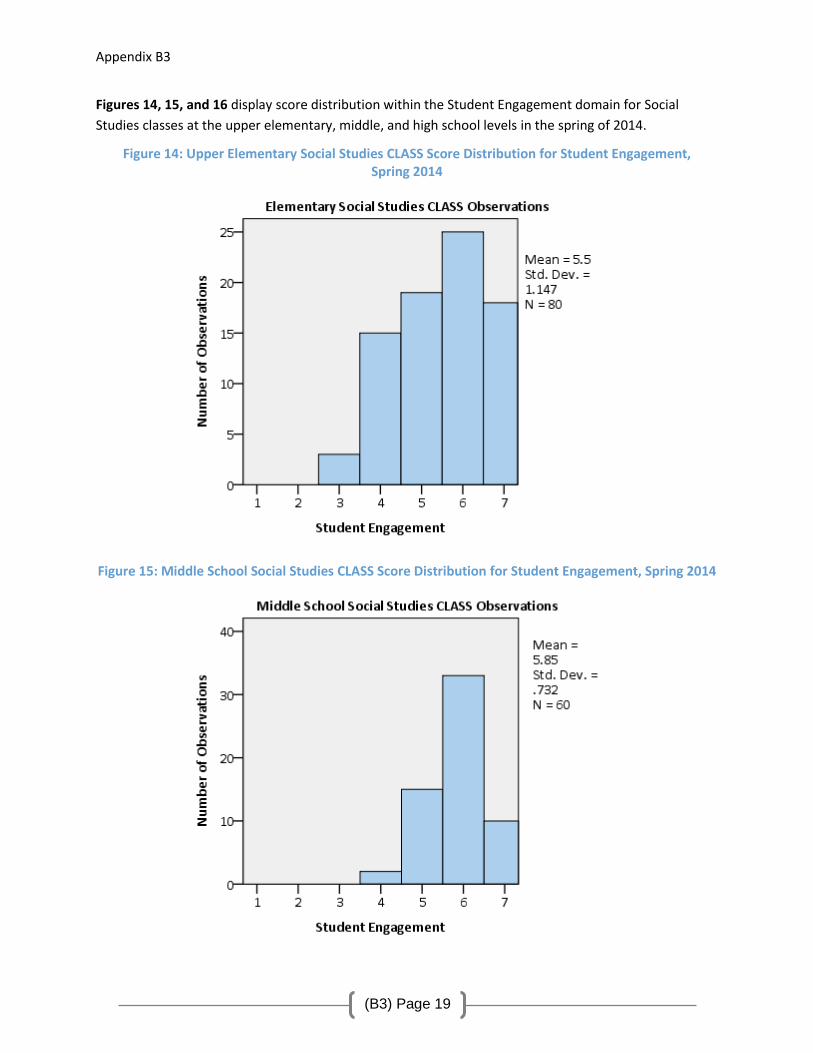
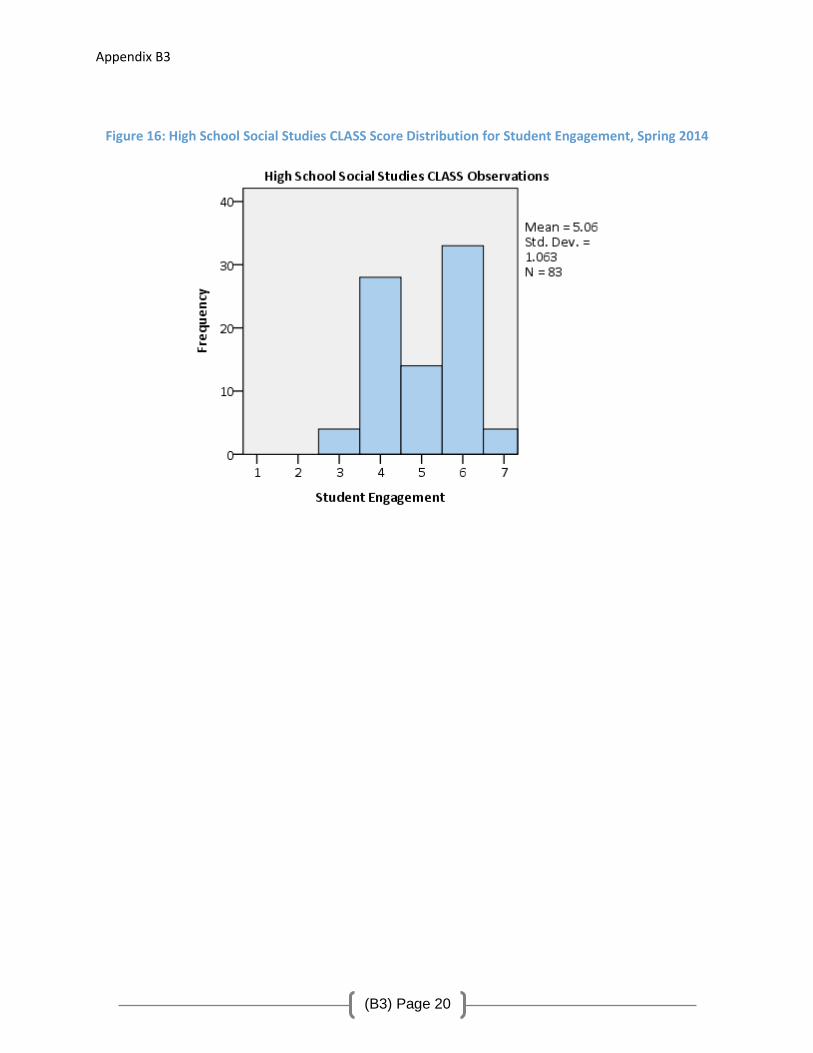
Figures 14, 15, and 16 display score distribution within the Student Engagement domain for Social
Studies classes at the upper elementary, middle, and high school levels in the spring of 2014.
Figure 14: Upper Elementary Social Studies CLASS Score Distribution for Student Engagement, Spring 2014
Figure 15: Middle School Social Studies CLASS Score Distribution for Student Engagement, Spring 2014
Appendix B3
(B3) Page 20
Figure 16: High School Social Studies CLASS Score Distribution for Student Engagement, Spring 2014
Appendix B4
(B4) Page 21
Social Studies Observation Checklist
As part of the Social Studies evaluation, an observation checklist was developed to assess the degree to
which best practices were incorporated into Social Studies instruction at the elementary, middle school,
and high school levels. This report outlines the process used to develop and administer the checklist,
and summarizes the findings.
Checklist Background and Methodology
The APS Social Studies checklist complements the CLASS (Classroom Assessment Scoring System)
observations that are conducted as part of APS program evaluations. While CLASS observations focus
on the quality of teacher-student interactions, content area observation checklists focus on how well a
particular content area is supported in APS classrooms.
The Social Studies checklist was developed by the Social Studies Office in conjunction with the Office of
Planning and Evaluation. It contained 15 specific items that could be assigned one of the following five
scores:
Not Evident – The element was not observed at all.
Ineffective – The teacher inadequately addressed the students’ learning needs.
Developing/Needs Improvement – The teacher inconsistently used strategies and practices that
met individual learning needs.
Effective – The teacher engaged the students’ learning by using a variety of strategies and
practices to meet individual learning needs.
Highly Effective – In addition to meeting the standard, the teacher optimized students’
opportunities to learn by engaging them in higher order thinking and/or enhanced performance
skills.
An additional four questions were used to collect information about the use of various resources (staff,
materials, and technology) during Social Studies instruction.
The Offices of Planning and Evaluation and Social Studies trained 11 retired Social Studies teachers to
use the instructional checklist during a six-hour training session in which they watched video-taped
lessons and used the checklist to rate the various items being examined. Training participants engaged
in discussion around what they observed, and they discussed their individual checklist results together.
Finally, the participants watched a video-taped lesson and used the checklist independently. Their
results were deemed to be reliable.
Appendix B4
(B4) Page 22
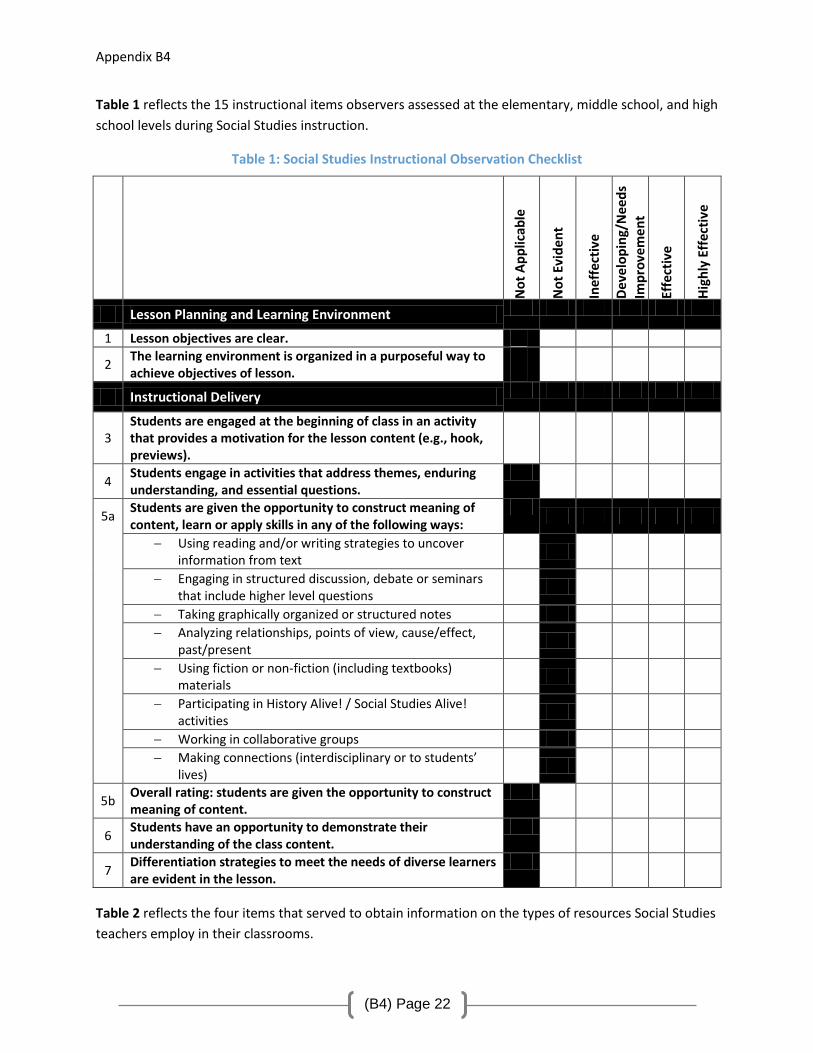
Table 1 reflects the 15 instructional items observers assessed at the elementary, middle school, and high
school levels during Social Studies instruction.
Table 1: Social Studies Instructional Observation Checklist
No
t A
pp
licab
le
No
t Ev
iden
t
Inef
fect
ive
De
velo
pin
g/N
eed
s
Imp
rove
me
nt
Effe
ctiv
e
Hig
hly
Eff
ecti
ve
Lesson Planning and Learning Environment
1 Lesson objectives are clear.
2 The learning environment is organized in a purposeful way to achieve objectives of lesson.
Instructional Delivery
3 Students are engaged at the beginning of class in an activity that provides a motivation for the lesson content (e.g., hook, previews).
4 Students engage in activities that address themes, enduring understanding, and essential questions.
5a Students are given the opportunity to construct meaning of content, learn or apply skills in any of the following ways:
Using reading and/or writing strategies to uncover information from text
Engaging in structured discussion, debate or seminars that include higher level questions
Taking graphically organized or structured notes
Analyzing relationships, points of view, cause/effect, past/present
Using fiction or non-fiction (including textbooks) materials
Participating in History Alive! / Social Studies Alive! activities
Working in collaborative groups
Making connections (interdisciplinary or to students’ lives)
5b Overall rating: students are given the opportunity to construct meaning of content.
6 Students have an opportunity to demonstrate their understanding of the class content.
7 Differentiation strategies to meet the needs of diverse learners are evident in the lesson.
Table 2 reflects the four items that served to obtain information on the types of resources Social Studies
teachers employ in their classrooms.
Appendix B4
(B4) Page 23
Table 2: Social Studies Resource Observation Checklist
8 Is there another teacher or assistant in the classroom? O No O Yes—Teacher O Yes—Teaching Assistant O Yes—Unsure
9
If there is another teacher or assistant, what is his/her role? (Check all that apply.)
O Clarifying directions O Delivering instruction O Checking for understanding
O Working with students O Clarifying vocabulary O Dictating
O Asking probing questions with small groups
O Helping with classroom organization
O Addressing behavior O Other
10
Students and/or teachers use the following resources during class period: (Check all that apply.)
O Textbooks O Literature selections O Maps
O Interactive Notebooks O Realia/artifacts O Technology
O Primary source documents O Manipulatives O None of the above
11
Use of technology is: (Check all that apply)
O Interactive O Enhancing instruction and fostering understanding
O Actively engaging students in learning tasks
O None of the above
O Not applicable—Use of technology not evident
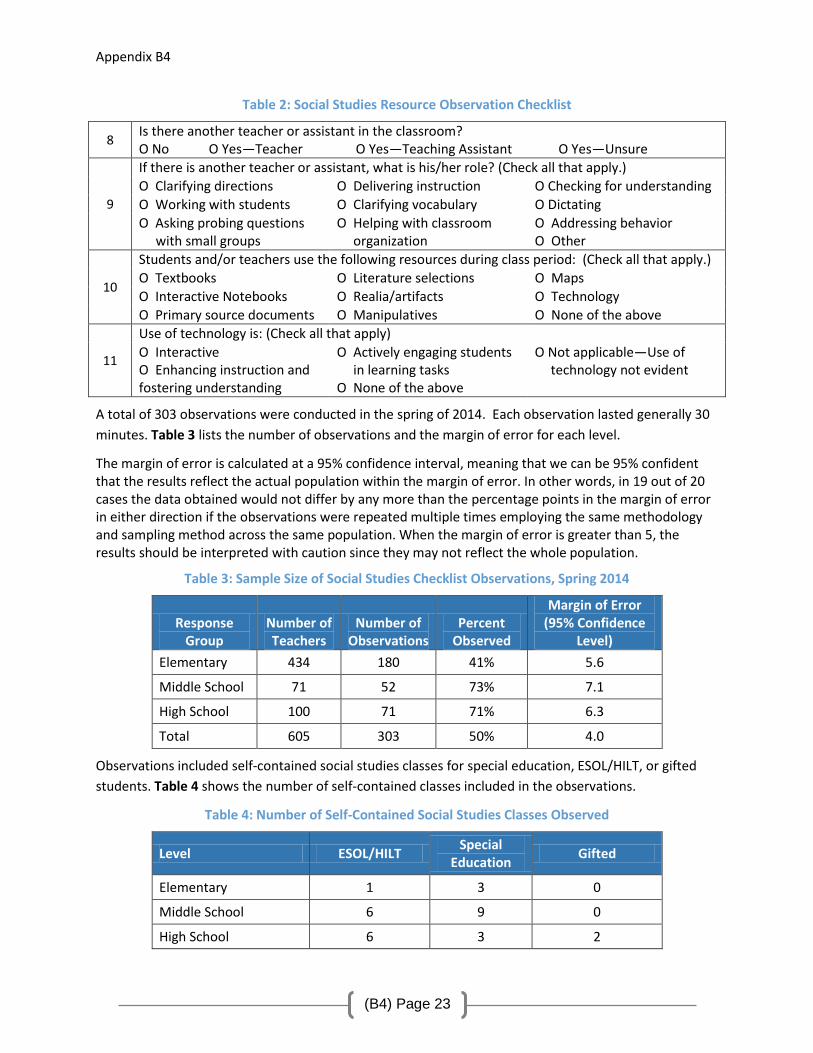
A total of 303 observations were conducted in the spring of 2014. Each observation lasted generally 30
minutes. Table 3 lists the number of observations and the margin of error for each level.
The margin of error is calculated at a 95% confidence interval, meaning that we can be 95% confident that the results reflect the actual population within the margin of error. In other words, in 19 out of 20 cases the data obtained would not differ by any more than the percentage points in the margin of error in either direction if the observations were repeated multiple times employing the same methodology and sampling method across the same population. When the margin of error is greater than 5, the results should be interpreted with caution since they may not reflect the whole population.
Table 3: Sample Size of Social Studies Checklist Observations, Spring 2014
Response Group
Number of Teachers
Number of Observations
Percent Observed
Margin of Error (95% Confidence
Level)
Elementary 434 180 41% 5.6
Middle School 71 52 73% 7.1
High School 100 71 71% 6.3
Total 605 303 50% 4.0
Observations included self-contained social studies classes for special education, ESOL/HILT, or gifted
students. Table 4 shows the number of self-contained classes included in the observations.
Table 4: Number of Self-Contained Social Studies Classes Observed
Level ESOL/HILT Special
Education Gifted
Elementary 1 3 0
Middle School 6 9 0
High School 6 3 2
Appendix B4
(B4) Page 24
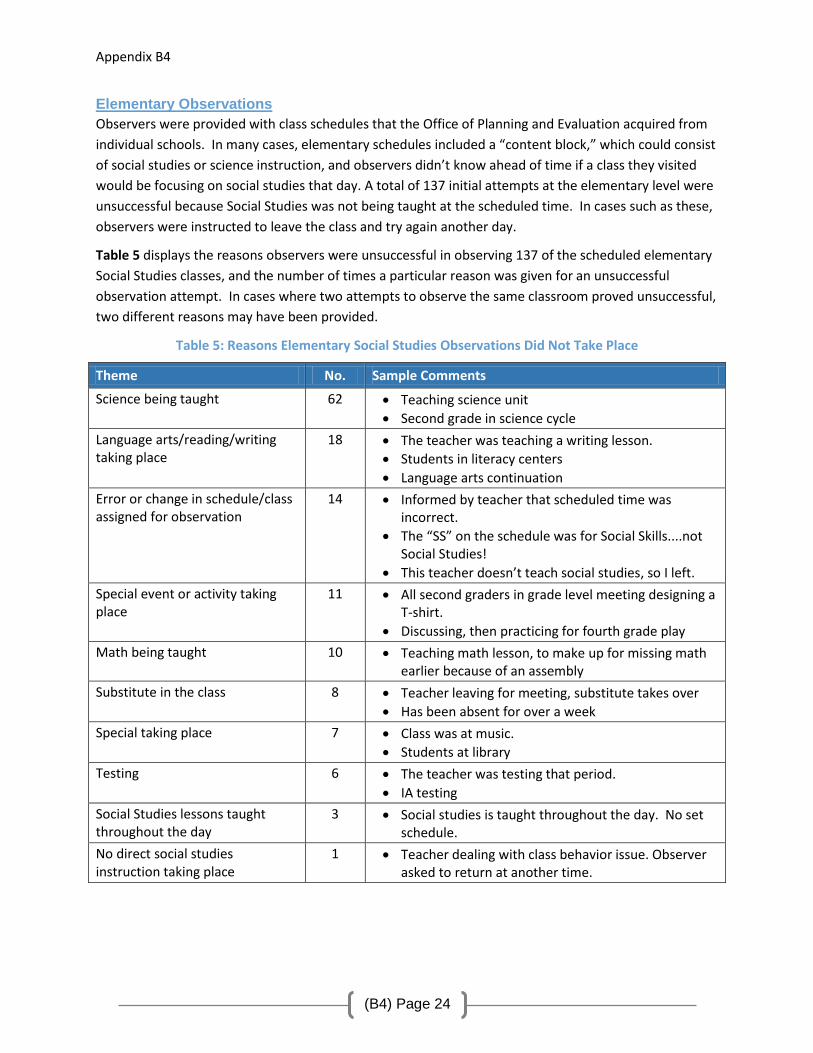
Elementary Observations
Observers were provided with class schedules that the Office of Planning and Evaluation acquired from
individual schools. In many cases, elementary schedules included a “content block,” which could consist
of social studies or science instruction, and observers didn’t know ahead of time if a class they visited
would be focusing on social studies that day. A total of 137 initial attempts at the elementary level were
unsuccessful because Social Studies was not being taught at the scheduled time. In cases such as these,
observers were instructed to leave the class and try again another day.
Table 5 displays the reasons observers were unsuccessful in observing 137 of the scheduled elementary
Social Studies classes, and the number of times a particular reason was given for an unsuccessful
observation attempt. In cases where two attempts to observe the same classroom proved unsuccessful,
two different reasons may have been provided.
Table 5: Reasons Elementary Social Studies Observations Did Not Take Place
Theme No. Sample Comments
Science being taught 62 Teaching science unit
Second grade in science cycle
Language arts/reading/writing taking place
18 The teacher was teaching a writing lesson.
Students in literacy centers
Language arts continuation
Error or change in schedule/class assigned for observation
14 Informed by teacher that scheduled time was incorrect.
The “SS” on the schedule was for Social Skills....not Social Studies!
This teacher doesn’t teach social studies, so I left.
Special event or activity taking place
11 All second graders in grade level meeting designing a T-shirt.
Discussing, then practicing for fourth grade play
Math being taught 10 Teaching math lesson, to make up for missing math earlier because of an assembly
Substitute in the class 8 Teacher leaving for meeting, substitute takes over
Has been absent for over a week
Special taking place 7 Class was at music.
Students at library
Testing 6 The teacher was testing that period.
IA testing
Social Studies lessons taught throughout the day
3 Social studies is taught throughout the day. No set schedule.
No direct social studies instruction taking place
1 Teacher dealing with class behavior issue. Observer asked to return at another time.
Appendix B4
(B4) Page 25
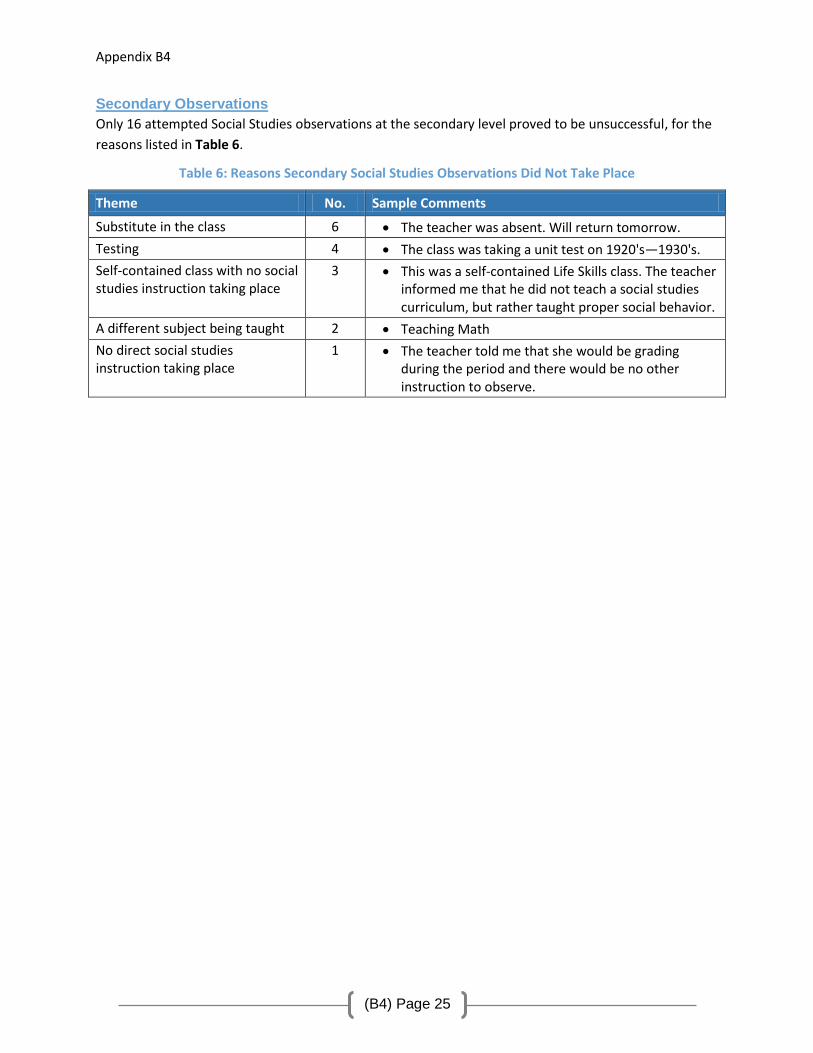
Secondary Observations
Only 16 attempted Social Studies observations at the secondary level proved to be unsuccessful, for the
reasons listed in Table 6.
Table 6: Reasons Secondary Social Studies Observations Did Not Take Place
Theme No. Sample Comments
Substitute in the class 6 The teacher was absent. Will return tomorrow.
Testing 4 The class was taking a unit test on 1920's—1930's.
Self-contained class with no social studies instruction taking place
3 This was a self-contained Life Skills class. The teacher informed me that he did not teach a social studies curriculum, but rather taught proper social behavior.
A different subject being taught 2 Teaching Math
No direct social studies instruction taking place
1 The teacher told me that she would be grading during the period and there would be no other instruction to observe.
Appendix B4
(B4) Page 26
Social Studies Instructional Checklist Results
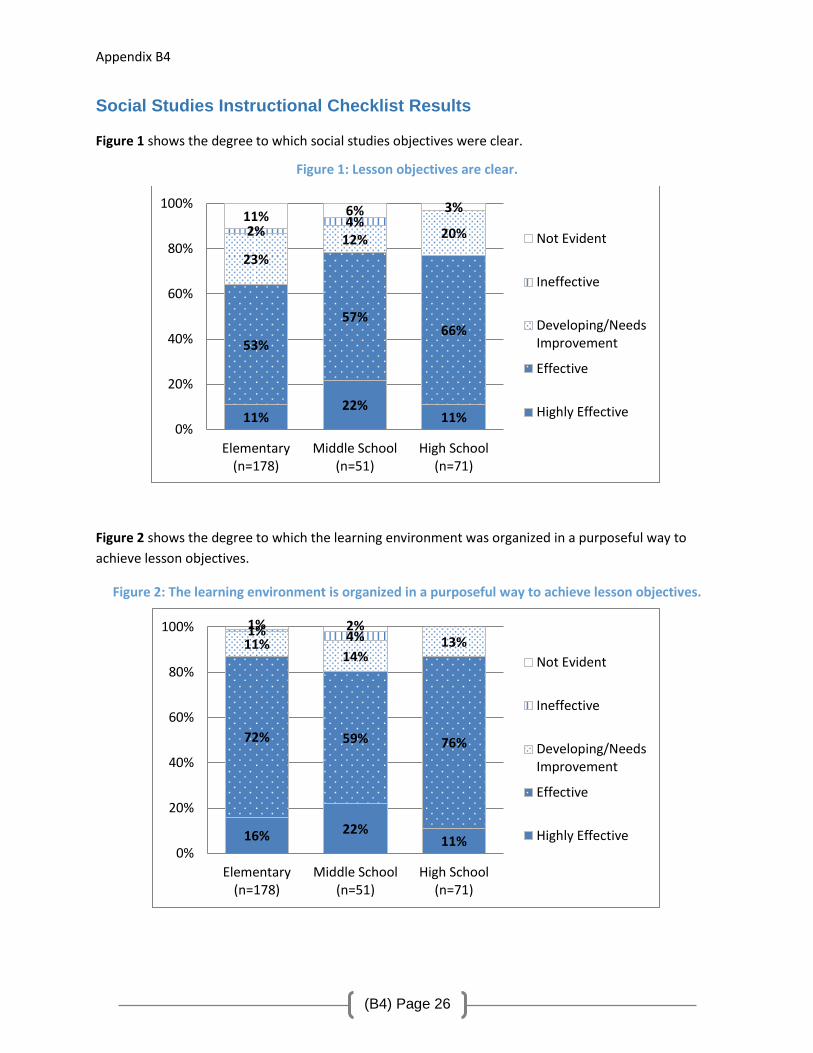
Figure 1 shows the degree to which social studies objectives were clear.
Figure 1: Lesson objectives are clear.
Figure 2 shows the degree to which the learning environment was organized in a purposeful way to
achieve lesson objectives.
Figure 2: The learning environment is organized in a purposeful way to achieve lesson objectives.
11% 22%
11%
53%
57% 66%
23%
12% 20% 2% 4% 11% 6% 3%
0%
20%
40%
60%
80%
100%
Elementary(n=178)
Middle School(n=51)
High School(n=71)
Not Evident
Ineffective
Developing/NeedsImprovement
Effective
Highly Effective
16% 22% 11%
72% 59% 76%
11% 14%
13% 1% 4% 1% 2%
0%
20%
40%
60%
80%
100%
Elementary(n=178)
Middle School(n=51)
High School(n=71)
Not Evident
Ineffective
Developing/NeedsImprovement
Effective
Highly Effective

Appendix B4
(B4) Page 27
Figure 3 shows the degree to which students are engaged at the beginning of class in an activity that
provides a motivation for the lesson content (e.g., hook, previews, etc.).
Figure 3: Students are engaged at the beginning of class in an activity that provides motivation for the lesson content (e.g., hook, previews, etc.).
NOTE: Ratings do not reflect 12% of elementary observations and 29% of the high school observations,
which were marked as “not applicable” for this item. Not all observers were present at the beginning of
each observed class.
Figure 4 shows the degree to which students engage in activities that address themes, enduring
understanding, and essential questions.
Figure 4: Students engage in activities that address themes, enduring understanding, and essential questions.
8%
33% 18%
48%
40% 55%
30%
17% 8%
4% 6%
6%
9% 4% 12%
0%
20%
40%
60%
80%
100%
Elementary(n=156)
Middle School(n=52)
High School(n=49)
Not Evident
Ineffective
Developing/NeedsImprovement
Effective
Highly Effective
9% 21% 18%
62% 44% 54%
23%
14%
17%
2%
12% 3%
5% 10% 9%
0%
20%
40%
60%
80%
100%
Elementary(n=179)
Middle School(n=52)
High School(n=71)
Not Evident
Ineffective
Developing/NeedsImprovement
Effective
Highly Effective
Appendix B4
(B4) Page 28
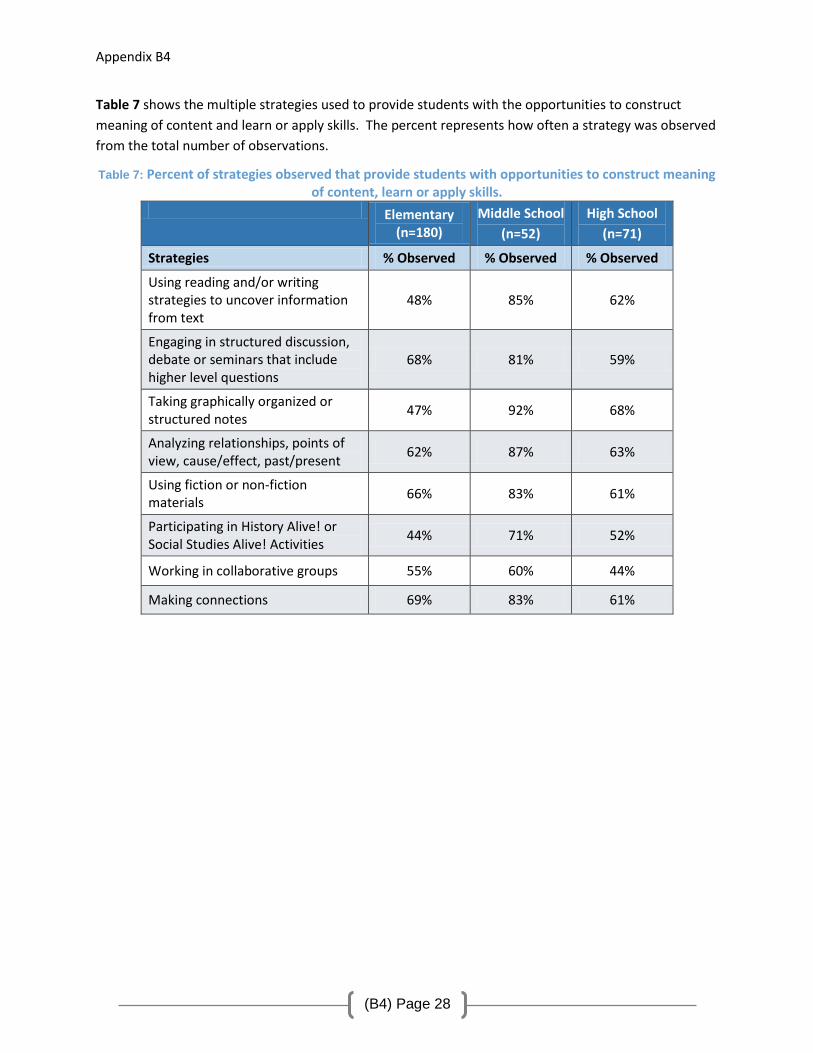
Table 7 shows the multiple strategies used to provide students with the opportunities to construct
meaning of content and learn or apply skills. The percent represents how often a strategy was observed
from the total number of observations.
Table 7: Percent of strategies observed that provide students with opportunities to construct meaning of content, learn or apply skills.
Elementary (n=180)
Middle School
(n=52)
High School
(n=71)
Strategies % Observed % Observed % Observed
Using reading and/or writing strategies to uncover information from text
48% 85% 62%
Engaging in structured discussion, debate or seminars that include higher level questions
68% 81% 59%
Taking graphically organized or structured notes
47% 92% 68%
Analyzing relationships, points of view, cause/effect, past/present
62% 87% 63%
Using fiction or non-fiction materials
66% 83% 61%
Participating in History Alive! or Social Studies Alive! Activities
44% 71% 52%
Working in collaborative groups 55% 60% 44%
Making connections 69% 83% 61%
Appendix B4
(B4) Page 29
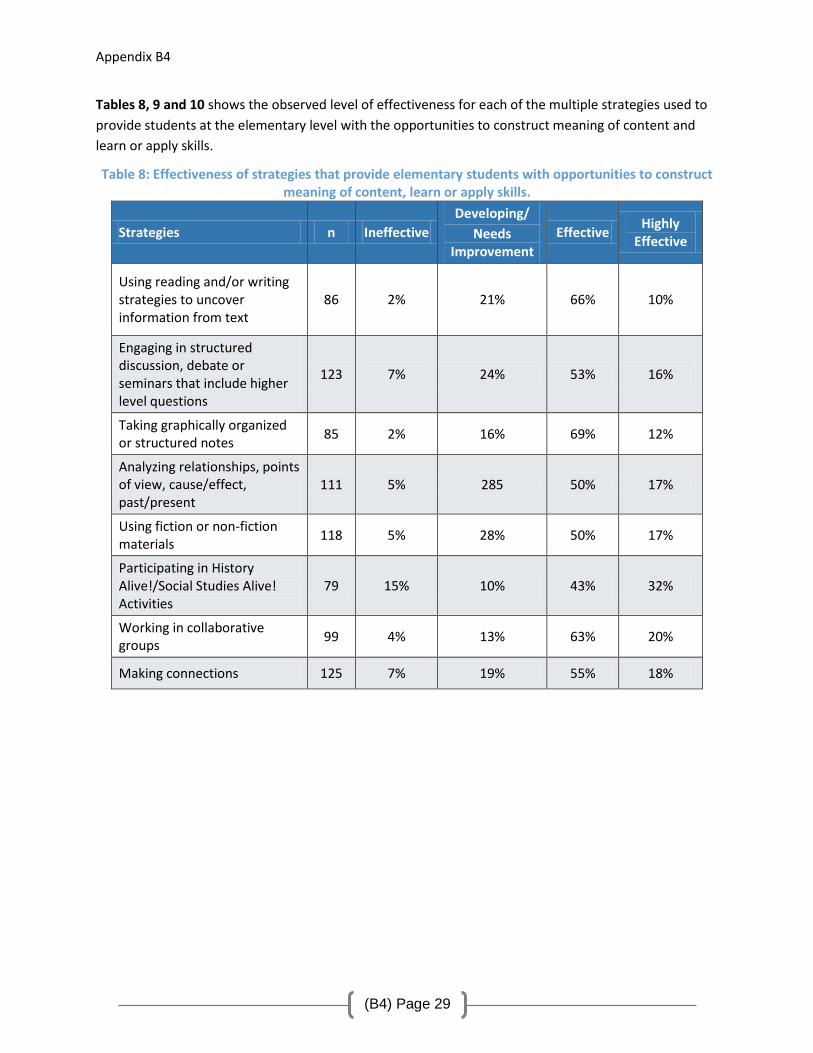
Tables 8, 9 and 10 shows the observed level of effectiveness for each of the multiple strategies used to
provide students at the elementary level with the opportunities to construct meaning of content and
learn or apply skills.
Table 8: Effectiveness of strategies that provide elementary students with opportunities to construct meaning of content, learn or apply skills.
Strategies n Ineffective
Developing/
Needs Improvement
Effective Highly
Effective
Using reading and/or writing strategies to uncover information from text
86 2% 21% 66% 10%
Engaging in structured discussion, debate or seminars that include higher level questions
123 7% 24% 53% 16%
Taking graphically organized or structured notes
85 2% 16% 69% 12%
Analyzing relationships, points of view, cause/effect, past/present
111 5% 285 50% 17%
Using fiction or non-fiction materials
118 5% 28% 50% 17%
Participating in History Alive!/Social Studies Alive! Activities
79 15% 10% 43% 32%
Working in collaborative groups
99 4% 13% 63% 20%
Making connections 125 7% 19% 55% 18%
Appendix B4
(B4) Page 30
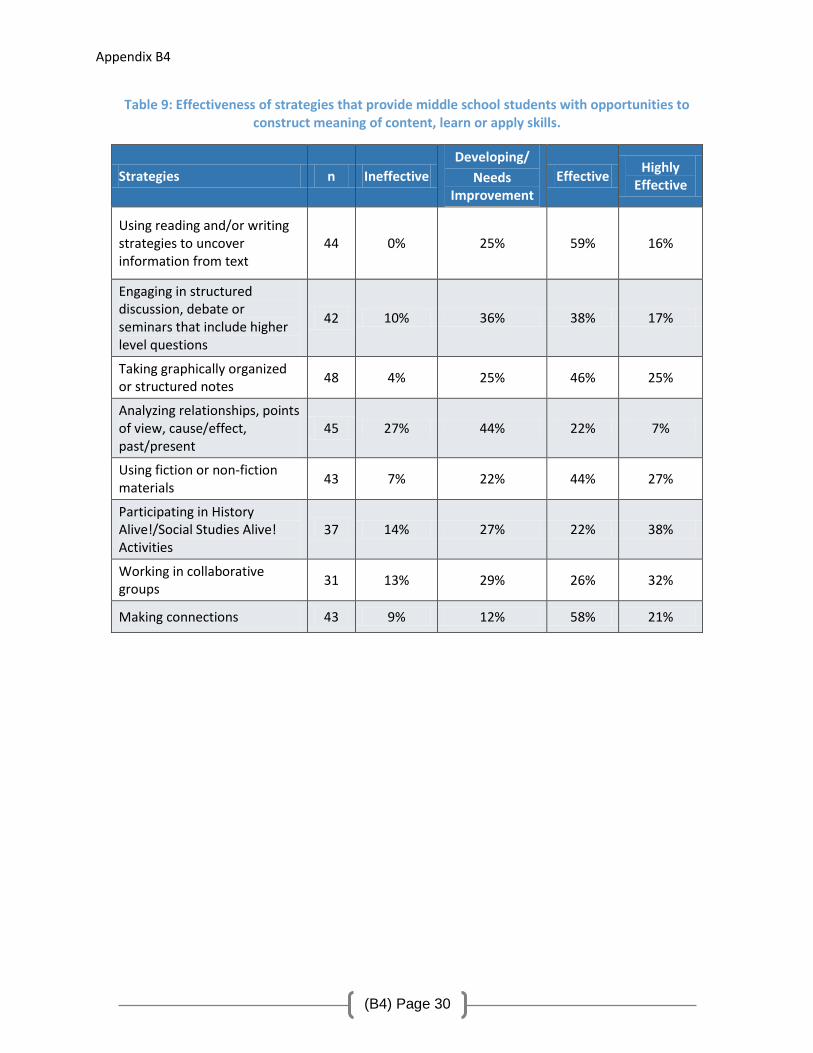
Table 9: Effectiveness of strategies that provide middle school students with opportunities to construct meaning of content, learn or apply skills.
Strategies n Ineffective
Developing/
Needs Improvement
Effective Highly
Effective
Using reading and/or writing strategies to uncover information from text
44 0% 25% 59% 16%
Engaging in structured discussion, debate or seminars that include higher level questions
42 10% 36% 38% 17%
Taking graphically organized or structured notes
48 4% 25% 46% 25%
Analyzing relationships, points of view, cause/effect, past/present
45 27% 44% 22% 7%
Using fiction or non-fiction materials
43 7% 22% 44% 27%
Participating in History Alive!/Social Studies Alive! Activities
37 14% 27% 22% 38%
Working in collaborative groups
31 13% 29% 26% 32%
Making connections 43 9% 12% 58% 21%

Appendix B4
(B4) Page 31
Table 10: Effectiveness of strategies that provide high school students with opportunities to construct meaning of content, learn or apply skills.
Strategies n Ineffective
Developing/
Needs Improvement
Effective Highly
Effective
Using reading and/or writing strategies to uncover information from text
49 2% 20% 65% 12%
Engaging in structured discussion, debate or seminars that include higher level questions
49 4% 20% 51% 24%
Taking graphically organized or structured notes
63 2% 14% 75% 10%
Analyzing relationships, points of view, cause/effect, past/present
57 4% 23% 51% 23%
Using fiction or non-fiction materials
56 4% 23% 51% 23%
Participating in History Alive!/Social Studies Alive! Activities
30 30% 30% 37% 3%
Working in collaborative groups
45 18% 29% 44% 9%
Making connections 57 2% 23% 54% 21%

Appendix B4
(B4) Page 32
Based on the observation data collected in the tables above, observers came up with an overall rating
for how effective efforts were at providing students with opportunities to construct meaning of content
and learn or apply skills during social studies lessons. Figure 13 displays these overall results.
Figure 5: Overall Rating: Students are given the opportunity to construct meaning of content.
Figure 14 shows the degree to which students have an opportunity to demonstrate their understanding
of the class content.
Figure 6: Students have an opportunity to demonstrate their understanding of the class content.
14% 23%
16%
55% 48% 64%
26% 23%
19% 3% 6% 2%
0%
20%
40%
60%
80%
100%
Elementary(n=178)
Middle School(n=52)
High School(n=67)
Not Evident
Ineffective
Developing/NeedsImprovement
Effective
Highly Effective
9%
29% 19%
61%
42% 59%
23% 25% 16%
2% 4% 4% 6%
0%
20%
40%
60%
80%
100%
Elementary(n=180)
Middle School(n=52)
High School(n=69)
Not Evident
Ineffective
Developing/NeedsImprovement
Effective
Highly Effective
Appendix B4
(B4) Page 33
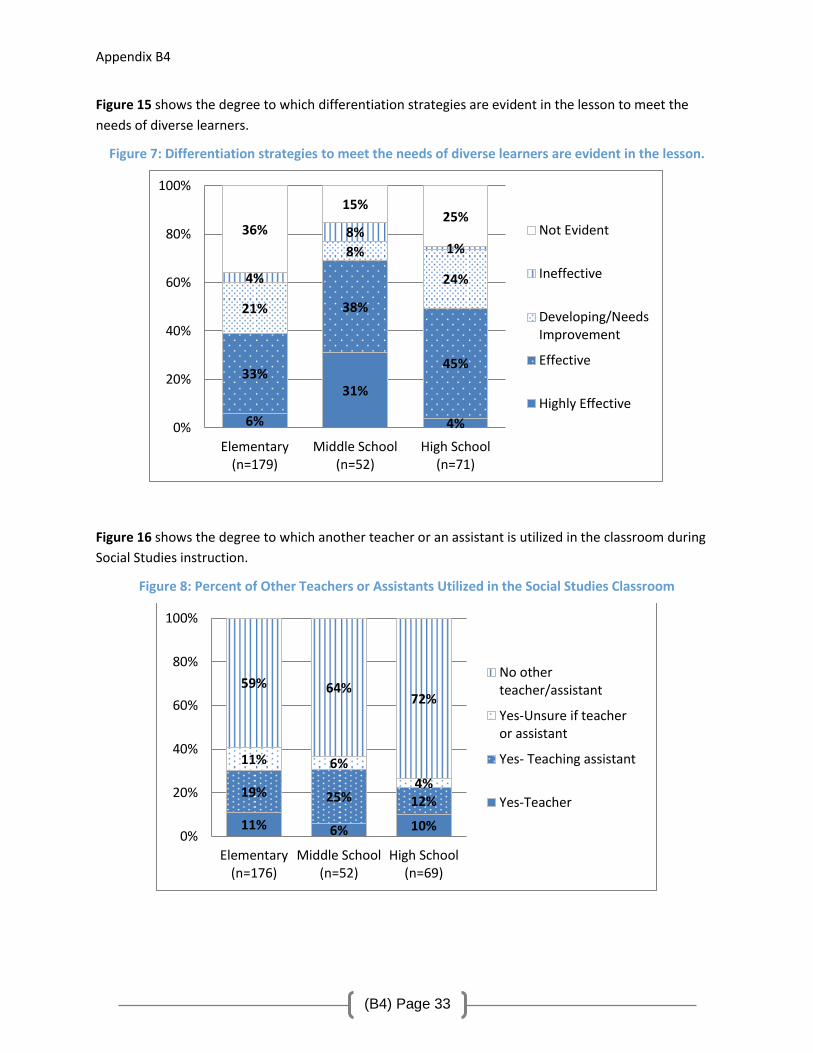
Figure 15 shows the degree to which differentiation strategies are evident in the lesson to meet the
needs of diverse learners.
Figure 7: Differentiation strategies to meet the needs of diverse learners are evident in the lesson.
Figure 16 shows the degree to which another teacher or an assistant is utilized in the classroom during
Social Studies instruction.
Figure 8: Percent of Other Teachers or Assistants Utilized in the Social Studies Classroom
6%
31%
4%
33%
38%
45%
21%
8%
24% 4%
8% 1%
36%
15% 25%
0%
20%
40%
60%
80%
100%
Elementary(n=179)
Middle School(n=52)
High School(n=71)
Not Evident
Ineffective
Developing/NeedsImprovement
Effective
Highly Effective
11% 6% 10%
19% 25% 12%
11% 6%
4%
59% 64% 72%
0%
20%
40%
60%
80%
100%
Elementary(n=176)
Middle School(n=52)
High School(n=69)
No otherteacher/assistant
Yes-Unsure if teacheror assistant
Yes- Teaching assistant
Yes-Teacher

Appendix B4
(B4) Page 34
Table 11 shows the percent of observations where another teacher or an assistant were observed in a
specified role during social studies instruction at the elementary school level.
Table 11: Percentage of Observations where Specified Roles of Other Teachers or Assistants were Observed during Social Studies Instruction at the Elementary School Level
Roles Teacher (n=20)
Teaching Assistant
(n=33) Unsure if teacher or
assistant (n=20)
Clarifying directions 35% 18% 15%
Working with students 75% 42% 50%
Asking probing questions with small groups 40% 9% 5%
Delivering instruction 45% 3% 10%
Clarifying vocabulary 50% 12% 5%
Dictating 10% 3% 0%
Checking for understanding 55% 12% 20%
Helping out with organization of the class 45% 45% 25%
Addressing Behavior 35% 58% 15%
Other 15% 30% 40%
Table 12 shows the percent of observations where another teacher or an assistant were observed in a
specified role during social studies instruction at the middle school level.
Table 12: Percentage of Observations where Specified Roles of Other Teachers or Assistants were Observed during Social Studies Instruction at the Middle School Level
Roles Teacher (n<5)*
Teaching Assistant
(n=13) Unsure if teacher or
assistant (n<5)*
Clarifying directions 62%
Working with students 85%
Asking probing questions with small groups 0%
Delivering instruction 15%
Clarifying vocabulary 31%
Dictating 8%
Checking for understanding 54%
Helping out with organization of the class 77%
Addressing Behavior 38%
Other 23%
If n is less than 5, responses are not reported

Appendix B4
(B4) Page 35
Table 13 shows the percent of observations where another teacher or an assistant were observed in a
specified role during social studies instruction at the high school level.
Table 13: Percentage of Observations where Specified Roles of Other Teachers or Assistants were Observed during Social Studies Instruction at the High School Level
Roles Teacher (n=7)
Teaching Assistant
(n=8) Unsure if teacher or
assistant (n=<5)
Clarifying directions 29% 50%
Working with students 100% 75%
Asking probing questions with small groups 0% 13%
Delivering instruction 29% 13%
Clarifying vocabulary 14% 0%
Dictating 0% 0%
Checking for understanding 57% 63%
Helping out with organization of the class 71% 63%
Addressing Behavior 57% 10%
Other 14% 50%
If n is less than 5, responses are not reported
Table 14 shows the percent of observations where students were using specific resources.
Table 14: Resources Utilized by Students during Social Studies Instruction
Roles Elementary
(n=180)
Middle School (n=52)
High School (n=71)
Textbooks 24% 27% 32%
Interactive notebooks 31% 67% 25%
Primary source documents 7% 29% 14%
Literature selections 14% 23% 6%
Realia/artifacts 2% 0% 3%
Manipulatives 17% 6% 0%
Maps 11% 25% 13%
Technology 9% 29% 31%

Appendix B4
(B4) Page 36
Table 15 shows the percent of observations where teachers were using specific resources.
Table 15: Resources Utilized by Teachers during the Social Studies Instruction
Roles Elementary
(n=180)
Middle School (n=52)
High School (n=71)
Textbooks 16% 10% 3%
Interactive notebooks 3% 17% 4%
Primary source documents 10% 23% 6%
Literature selections 25% 6% 1%
Realia/artifacts 3% 0% 1%
Manipulatives 5% 6% 0%
Maps 19% 19% 11%
Technology 34% 46% 65%
The final item in the Observation Checklist asked observers to identify technology use in the social
studies classroom. Observers had the option to select “not applicable” if technology was not evident
during the observation. Figure 22 shows the degree to which technology use was evident during
observations.
Figure 9: The Use of Technology during Social Studies Instruction
63% 71%
87%
37% 29%
13%
0%
20%
40%
60%
80%
100%
Elementary(n=180)
Middle School(n=52)
High School(n=71)
Technology not evidentduring the observation
Technology utilizedduring the observation
Appendix B4
(B4) Page 37
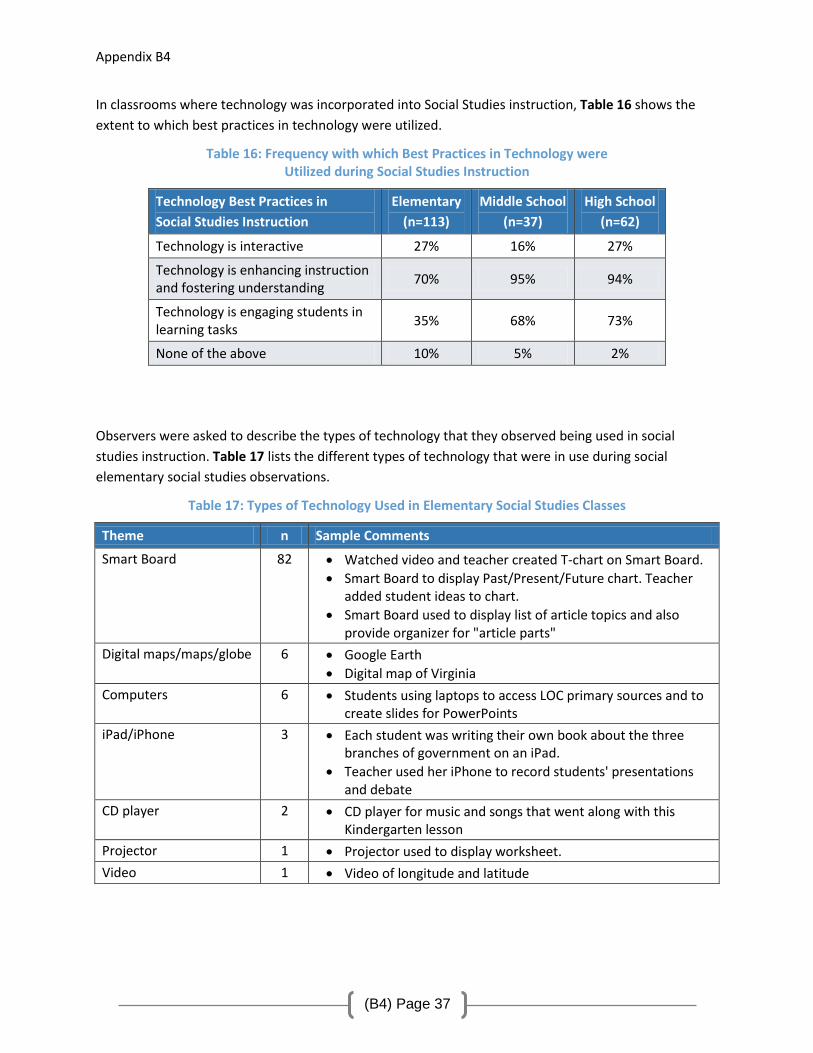
In classrooms where technology was incorporated into Social Studies instruction, Table 16 shows the
extent to which best practices in technology were utilized.
Table 16: Frequency with which Best Practices in Technology were Utilized during Social Studies Instruction
Technology Best Practices in
Social Studies Instruction
Elementary
(n=113)
Middle School
(n=37)
High School
(n=62)
Technology is interactive 27% 16% 27%
Technology is enhancing instruction and fostering understanding
70% 95% 94%
Technology is engaging students in learning tasks
35% 68% 73%
None of the above 10% 5% 2%
Observers were asked to describe the types of technology that they observed being used in social
studies instruction. Table 17 lists the different types of technology that were in use during social
elementary social studies observations.
Table 17: Types of Technology Used in Elementary Social Studies Classes
Theme n Sample Comments
Smart Board 82 Watched video and teacher created T-chart on Smart Board.
Smart Board to display Past/Present/Future chart. Teacher added student ideas to chart.
Smart Board used to display list of article topics and also provide organizer for "article parts"
Digital maps/maps/globe 6 Google Earth
Digital map of Virginia
Computers 6 Students using laptops to access LOC primary sources and to create slides for PowerPoints
iPad/iPhone 3 Each student was writing their own book about the three branches of government on an iPad.
Teacher used her iPhone to record students' presentations and debate
CD player 2 CD player for music and songs that went along with this Kindergarten lesson
Projector 1 Projector used to display worksheet.
Video 1 Video of longitude and latitude
Appendix B4
(B4) Page 38
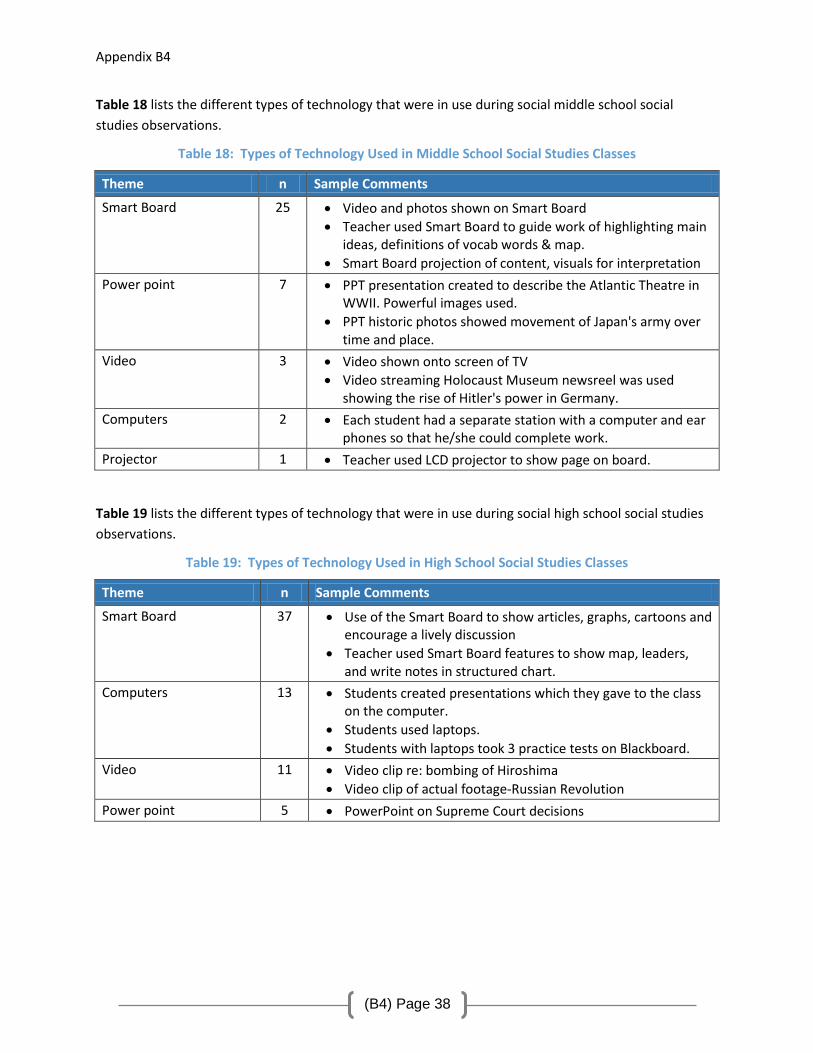
Table 18 lists the different types of technology that were in use during social middle school social
studies observations.
Table 18: Types of Technology Used in Middle School Social Studies Classes
Theme n Sample Comments
Smart Board 25 Video and photos shown on Smart Board
Teacher used Smart Board to guide work of highlighting main ideas, definitions of vocab words & map.
Smart Board projection of content, visuals for interpretation
Power point 7 PPT presentation created to describe the Atlantic Theatre in WWII. Powerful images used.
PPT historic photos showed movement of Japan's army over time and place.
Video 3 Video shown onto screen of TV
Video streaming Holocaust Museum newsreel was used showing the rise of Hitler's power in Germany.
Computers 2 Each student had a separate station with a computer and ear phones so that he/she could complete work.
Projector 1 Teacher used LCD projector to show page on board.
Table 19 lists the different types of technology that were in use during social high school social studies
observations.
Table 19: Types of Technology Used in High School Social Studies Classes
Theme n Sample Comments
Smart Board 37 Use of the Smart Board to show articles, graphs, cartoons and encourage a lively discussion
Teacher used Smart Board features to show map, leaders, and write notes in structured chart.
Computers 13 Students created presentations which they gave to the class on the computer.
Students used laptops.
Students with laptops took 3 practice tests on Blackboard.
Video 11 Video clip re: bombing of Hiroshima
Video clip of actual footage-Russian Revolution
Power point 5 PowerPoint on Supreme Court decisions