APPENDIX B Airport Hazards - New Jersey B_NEP00… · Airport Hazards . NEP0011 - Airport Hazards ....
95
APPENDIX B Airport Hazards
Transcript of APPENDIX B Airport Hazards - New Jersey B_NEP00… · Airport Hazards . NEP0011 - Airport Hazards ....

APPENDIX B
Airport Hazards


NEP0011 - Airport Hazards
525-529 South 17th Street, Newark, NJ
Newark International Airport
Lakehurst Naval Air Station
Atlantic City International Airport

loLow-cost ca

NPIAS 2013-2017 illustrated by GRA, Incorporated
Report to Congress
National Plan of Integrated Airport Systems (NPIAS)
2013–2017
Report of the Secretary of Transportation to the United States Congress Pursuant to Title 49 U.S. Code, Section 47103 The NPIAS 2013–2017 report will be available online at: http://www.faa.gov/airports/planning_capacity/npias/reports
U.S. Department of Transportation Federal Aviation Administration


National Plan of Integrated Airport Systems (2013-2017) i
Table of Contents EXECUTIVE SUMMARY .............................................................................................................. IV
Development Estimates .............................................................................................................v Estimates by Airport Type ........................................................................................... vi Estimates by Type of Development ............................................................................ vii
Status of Airline and Airport Industry ................................................................................... viii CHAPTER 1: AIRPORT SYSTEM COMPOSITION ...................................................................1
Overview ....................................................................................................................................1 Guiding Principles for the National Airport System..................................................................2 Airports in the NPIAS (3,355) ...................................................................................................3 Commercial Service Airports (499) ...........................................................................................4
Large Hubs (29) .............................................................................................................4 Medium Hubs (36) .........................................................................................................5 Small Hubs (74) .............................................................................................................5 Nonhub Primary (239) ...................................................................................................6 Nonprimary Commercial Service (121) .........................................................................6
General Aviation Airports (2,563) .............................................................................................6 Reliever Airports (268) ..............................................................................................................7
New Airports (25) ......................................................................................................................7 Airports Not Included in the NPIAS ..........................................................................................8 Evolution of the National Airport System .................................................................................8 Use of the National Airport System .........................................................................................10
Commercial Airline Operations ...................................................................................10 General Aviation ..........................................................................................................11
General Aviation Airports: National Assets ...........................................................................13
CHAPTER 2: SYSTEM OBJECTIVES AND PERFORMANCE ...............................................17 Overview ..................................................................................................................................17 Supporting National Air Transportation System Objectives ...................................................17
U.S. Department of Transportation ..............................................................................17 Federal Aviation Administration .................................................................................17
FAA’s Office of the Associate Administrator for Airports .........................................18 Factors Indicating System Performance ..................................................................................19 Safety (Safety) .........................................................................................................................19
Preventing Runway Incursions ....................................................................................20 Maintaining Safe Airport Conditions...........................................................................21
Wildlife Hazard Mitigation ..........................................................................................24 Capacity (Economic Competitiveness) ....................................................................................26
Congestion and Delay ..................................................................................................27 Air Carrier On-Time Performance ...............................................................................27
Delay Indicators ...........................................................................................................28 Airport Capacity – A National Look ...........................................................................29 Alternative Capacity Enhancement Methods ...............................................................30
Environmental (Environmental Sustainability and Livable Communities) .............................36 Air Quality ...................................................................................................................36

ii National Plan of Integrated Airport Systems (2013-2017)
Airport Sustainability Efforts .......................................................................................37 Environmental Streamlining ........................................................................................37 Environmental Research ..............................................................................................38 Environmental Management Systems at Airports .......................................................38 Livability ......................................................................................................................39 Water Quality ...............................................................................................................39 Noise ..........................................................................................................................40
Runway Pavement Condition (State of Good Repair) .............................................................42 Pavement Research ......................................................................................................43
Surface Accessibility (Livable Communities/Economic Competitiveness) ............................44
Financial Performance (Economic Competitiveness) ..............................................................46
CHAPTER 3: AVIATION FORECASTS ......................................................................................51 Overview ..................................................................................................................................51 Activity Forecasts ....................................................................................................................51
Commercial Aviation ...................................................................................................51 Cargo ..........................................................................................................................53 General Aviation ..........................................................................................................54 Fractional Ownership ...................................................................................................55 Very Light Jets or Microjets ........................................................................................55 Light-Sport Aircraft .....................................................................................................56 Unmanned Aircraft Systems ........................................................................................56
Commercial Spaceports ...............................................................................................57 Implications of Forecasted Activity on Airports .....................................................................57 Other Factors Impacting Airports ............................................................................................58
New Large Aircraft ......................................................................................................59 Airport Privatization ....................................................................................................60 Conversion of Military Surplus Airfields and Civilian Use of Military Airfields .......60 Innovations ...................................................................................................................61
CHAPTER 4: DEVELOPMENT REQUIREMENTS ..................................................................63 Capital Planning Overview ......................................................................................................63 Development Costs ..................................................................................................................66
Development Categories ..........................................................................................................69 Safety and Security ......................................................................................................69 Reconstruction .............................................................................................................70 Standards ......................................................................................................................70
Environment .................................................................................................................71 Terminal Building ........................................................................................................72 Surface Access .............................................................................................................72 Airfield Capacity ..........................................................................................................73 New Airports ................................................................................................................73
Other ..........................................................................................................................73
Changing the Way We Look at Airports .................................................................................73
Anticipated Sources of Funding...............................................................................................75 Additional Costs Not Included in the NPIAS ..........................................................................76

National Plan of Integrated Airport Systems (2013-2017) iii
This page intentionally left blank

iv National Plan of Integrated Airport Systems (2013-2017)
EXECUTIVE SUMMARY The National Plan of Integrated Airport Systems (NPIAS) for Fiscal Years (FY) 2013 to 2017 is submitted to Congress in accordance with title 49 U.S. Code (U.S.C.), section 47103. The plan identifies 3,355 public-use airports1 (3,330 existing and 25 proposed) that are significant to national air transportation and therefore eligible to receive grants under the Federal Aviation Administration (FAA) Airport Improvement Program (AIP). Airport capital development needs are driven by current and forecast traffic; use and age of facilities; and changing aircraft technology which requires airports to update or replace equipment and infrastructure. The development data contained in this report were largely compiled in FY 2011 and validated during FY 2012. Since the last report was prepared 2 years ago, construction costs have increased moderately, about 2.8 percent.2 The FAA estimates that over the next 5 years (2013 to 2017), there will be $42.5 billion of AIP eligible infrastructure projects. This is a decrease of 19 percent ($9.8 billion) from the report issued 2 years ago and reflects a decrease in estimated needs for all airport categories and all types of airport development except projects to improve airfield capacity, which increased 2.5 percent, mostly at the large hub airports. Terminal related development had another major drop this reporting period, down by 43 percent from the 2011 report. Development to improve surface access also decreased for the second consecutive report, with a 46 percent decrease.
The NPIAS identifies AIP eligible and justified airport improvements that are planned within the next 5 years. Improvements included in the NPIAS are considered in the FAA’s Airport Capital Improvement Plan process. The NPIAS also supports the goals identified in the FAA strategic plan, entitled “Destination 2025,” for safety, efficiency, access, and environmental sustainability by identifying airport improvements that will help achieve those goals. Sixty-three percent of the identified development is intended to rehabilitate existing infrastructure, maintain a state of good repair, and keep airports up to standards for the aircraft that use them. Thirty-seven percent of the 1 The word “airport,” as identified in this report, includes landing areas developed for conventional fixed-wing aircraft, helicopters, and seaplanes. 2 Source: Civil Works Construction Cost Index System calculated by the U.S. Army Corps of Engineers, March 31, 2011. Comparing construction costs for FY 2009 to 2011.

National Plan of Integrated Airport Systems (2013-2017) v
development in the report is intended to accommodate growth in travel, including more passengers, cargo and activity, and larger aircraft. Funds for airport development are derived from a variety of sources including Federal/State/local grants, bond proceeds, passenger facility charges (PFC), airport-generated funds (landing and terminal fees, parking, and concessions revenues), and tenant and third-party financing. The availability of funding sources and their adequacy to meet needs varies with type of airport and level of activity. Chapter 2 of this report addresses the condition and performance of the national airport system, highlighting six topic areas: safety, capacity, environment, pavement condition, surface accessibility, and financial performance. The findings are favorable, indicating the system is safe, convenient, well maintained, and significantly supported by non-Federal revenue (rents, fees, and taxes paid by users). DEVELOPMENT ESTIMATES
The 5-year AIP eligible development needs contained in this report decreased 19 percent from the estimate in the 2011 report.3 This decrease is due to the current economic situation, reduced aviation activity levels, projects having been completed or having a funding source for the project identified, and a comprehensive review of projects. Capital development reflects the economic situation of the communities that own airports. In the last 2 years, communities have opted to defer development projects until aviation activity levels rebound. Several development programs, totaling $2 billion, were completed or received PFC approval and are therefore no longer included in the NPIAS (e.g., a terminal project at Los Angeles International, a people mover at Fort Lauderdale/Hollywood International, and a terminal project at Norman Mineta San Jose International). The FAA undertook a comprehensive review of the approximately 23,000 projects at existing and proposed NPIAS airports. This review resulted in approximately 3,700 projects being adjusted, deferred, or removed. Cost estimates in the NPIAS are obtained primarily from airport master and State system plans prepared by planning and engineering firms for airport sponsors, including local and State agencies. These plans are usually funded in part by the FAA, are consistent with FAA forecasts of aeronautical activity, follow FAA guidelines, and have been reviewed and accepted by FAA planners who are familiar with local conditions. Efforts have been made to obtain realistic estimates of development needs that coincide with local and State capital improvement plans. The estimates only include development to be undertaken by airport sponsors. The development reflected in the NPIAS is based on planning documents available through 2011. As a planning document, the NPIAS should not be used in evaluating investment priorities. Generally, development estimates do not include contingency costs (increases in cost based on 3 Estimates reflect the dollars at the time the report was prepared (2013 report reflects 2011 dollars; 2011 report reflects 2009 dollars).

vi National Plan of Integrated Airport Systems (2013-2017)
change in design or construction uncertainty) or normal price escalation due to inflation (annual increase in costs). The NPIAS includes only planned development that is eligible to receive Federal grants under the AIP. For airports across the country, the infrastructure requirements needed to implement a localizer performance with vertical guidance (LPV), using FAA’s wide area augmentation system (WAAS), are still being assessed and therefore may not be fully captured in this report.
Estimates by Airport Type
The 499 commercial service airports (large hubs, medium hubs, small hubs, nonhubs, and nonprimary commercial service) account for 15 percent of the airports and 69 percent of the total development in this report. Large hubs have the greatest estimated development needs, accounting for $15 billion (35 percent) of the $42.5 billion identified. The 2,563 general aviation and 268 reliever airports make up 77 and 8 percent of the airports and account for 23 and 7 percent of the total development, respectively, contained in the report. Development estimates for all eight airport categories decreased since the last report. The largest decreases in development were for the large hubs ($2.7 billion, a 15-percent decrease) and medium hubs ($2.3 billion, a 31-percent decrease). Costs for large hubs reflect continued decreases or deferrals of terminal development projects and decreases in access projects. The decrease in terminal development reflects the funding of a few terminal projects through PFCs and a few that were deferred beyond 2017 (i.e., no longer within the 5-year window of this report). When FAA approves collection of PFCs for airport development, the project is considered funded and therefore is no longer included in the NPIAS. Since the last report, the FAA has approved PFC collections for significant projects at Los Angeles International, Fort Lauderdale-Hollywood International, Dallas/ Fort Worth International, and San Diego International.

National Plan of Integrated Airport Systems (2013-2017) vii
Estimates by Type of Development
Planned development is divided into 10 categories based on the purpose of the development. Twenty-eight percent of the development contained in this report is primarily to bring existing airports up to current design standards and 25 percent is to replace or rehabilitate airport facilities, mostly pavement and lighting systems. A significant amount is to increase airfield capacity (23 percent) and to modify, replace, and construct passenger terminal buildings (8 percent) to accommodate more passengers, larger aircraft, new security requirements, and increased competition among airlines. Capacity remains the largest development category for the large hubs with an increase of $1.2 billion since the last report. This includes major development programs at Philadelphia International, Chicago O’Hare International, Hartsfield-Jackson Atlanta International, and Denver International. As airports respond to a changing aviation environment, their development needs also change. Total development needs decreased across every development category, except capacity, which saw a slight increase. Costs to replace or rehabilitate airport pavement and associated equipment decreased 9 percent from 2011 to 2013. Development to bring existing airports up to design standards decreased 22 percent, and development to increase airfield capacity increased 2.5 percent from the last report. Development to modify, replace, and construct passenger terminal buildings decreased 43 percent ($2.7 billion), and this was after a 31-percent decrease in 2011. Development to improve surface access also decreased for the second consecutive report, with a 46-percent decrease ($1.1 billion).
viii National Plan of Integrated Airport Systems (2013-2017)
STATUS OF AIRLINE AND AIRPORT INDUSTRY
The financial condition of the U.S. airline industry has continued to change, adjusting capacity to seize opportunities, contracting in times of economic distress, creating new revenue sources (e.g., charging fees for baggage check-in, and meal service), and introducing services that were not previously available (e.g., premium boarding and fare-lock fees). After posting net losses for eight consecutive quarters, the industry (passenger and cargo carriers combined) posted profits in both 2010 and 2011. Demand for air travel in 2011 grew slowly, with system revenue passenger miles increasing 3.5 percent as enplanements increased 2.5 percent. In 2011, the 16 carriers reporting on-time performance recorded an overall on-time arrival rate of 76.3 percent, a decline from 2010’s rate of 78.7 percent. The majority of airports in the national airport system have adequate airport capacity and few delays. However, there are airports that continue to experience delays. In 2011, there were five airports with average departure delays of more than 12 minutes per operation and two airports with average arrival delays of more than 14 minutes. Commercial service airports have several sources to fund airport projects, including Federal/ State/local grants, bond proceeds backed by general airport revenues, PFCs, airport-generated funds, and tenant and third-party financing. The majority of the development projects at major U.S. airports are funded through the capital markets, most commonly through airport revenue bonds. The overall creditworthiness of U.S. airports remains strong. Overall, the finances of the primary airports are stable; however, airports are carefully managing operating, financing, and capital expenses and seeking responsible opportunities to increase nonaeronautical revenue.

National Plan of Integrated Airport Systems (2013-2017) ix
This page intentionally left blank


National Plan of Integrated Airport Systems (2013-2017) 1
CHAPTER 1: AIRPORT SYSTEM COMPOSITION OVERVIEW
The aviation system plays a key role in the success, strength, and growth of the U.S. economy. Economic activity attributed to civil aviation-related goods and services totaled $1.3 trillion in 20094. Approximately 617,128 active pilots, 222,520 general aviation aircraft, and 7,185 air carrier aircraft utilize 19,786 landing areas consisting of 14,615 private-use (closed to the public) and 5,171 public-use (open to the public) facilities. Airports contributed nearly $79 billion in total output to the U.S. economy in 2009.5
Type of Facility Total U.S. Facilities
Private-Use Facilities
Public-Use Facilities
NPIAS Facilities
Airport 13,451 8,571 4,880 3,280
Heliport 5,658 5,590 68 10
Seaplane Base 498 283 215 40
Balloonport 13 12 1
Gliderport 35 31 4
Ultralight 131 128 3
Total 19,786 14,615 5,171 3,330
The FAA, in concert with State aviation agencies and local planning organizations, identifies public-use airports that are important to the system for inclusion in the NPIAS. Sixty-four percent (3,330) 6 of the 5,171 public-use airports are included in the NPIAS. There are 1,841 existing public-use airports that are not included in the NPIAS because they do not meet the minimum entry criteria,7 are located at inadequate sites, cannot be expanded and improved to provide a safe and efficient airport, or are located within 20 miles of another NPIAS airport. All primary and commercial service airports and selected general aviation airports are included in the NPIAS. The NPIAS report identifies for Congress and the public those airports included in the national system, the role they serve, and the amounts and types of airport development eligible for Federal funding under the AIP over the next 5 years. An airport must be included in the NPIAS to be eligible to receive a grant under the AIP.
4 The Economic Impact of Civil Aviation on the U.S. Economy, issued in August 2011. 5 The Economic Impact of Civil Aviation on the U.S. Economy, by State, issued December 2011. 6 The word “airport,” as identified in this report, includes landing areas developed for conventional fixed-wing aircraft, helicopters, and seaplanes. 7 NPIAS entry criteria is contained in FAA Order 5090.3C, Field Formulation of the National Plan of Integrated Airport Systems (NPIAS), available online at: http://www.faa.gov/regulations_policies/orders_notices/index.cfm/go/document.information/documentID/12754 .
2 National Plan of Integrated Airport Systems (2013-2017)
GUIDING PRINCIPLES FOR THE NATIONAL AIRPORT SYSTEM
The airport system envisioned when civil aviation was in its infancy, has been developed and nurtured by close cooperation with airport sponsors and other local agencies, as well as Federal and State agencies. The general principles guiding Federal involvement were reviewed in 2011 by the FAA and the aviation industry and minor updates were made, but the core principles were reaffirmed. To meet the demand for air transportation, the airport system should have the following attributes: Airports should be safe and efficient, located where people will use them, and developed and
maintained to appropriate standards. Airports should be affordable to both users and Government, relying primarily on producing self-
sustaining revenue and placing minimal burden on the general revenues of the local, State, and Federal Governments.
Airports should be flexible and expandable and able to meet increased demand and to accommodate new aircraft types.
Airports should be permanent with assurance that they will remain open for aeronautical use over the long term.
Airports should be compatible with surrounding communities, maintaining a balance between the needs of aviation, the environment, and the requirements of residents.
Airports should be developed in concert with improvements to the air traffic control system and technological advancements.
The airport system should support a variety of critical national objectives, such as defense, emergency readiness, law enforcement, and postal delivery.
The airport system should be extensive, providing as many people as possible with convenient access to air transportation, typically by having most of the population within 20 miles of a NPIAS airport.
The airport system is critical to the national transportation system and helps air transportation contribute to a productive national economy and international competitiveness.
In addition to these principles specific to airport development, a guiding principle for Federal infrastructure investment, as stated in Executive Order 12893,8 is that such investments must be cost beneficial. The FAA implements these principles by using program guidance to ensure the effective use of Federal aid. A national priority system guides the distribution of funds supplemented when necessary by specific requirements for additional analysis or justification. For example, larger airport capacity development projects must be shown to be cost beneficial in order to receive support under the AIP.
8 Executive Order 12893, Principles for Federal Infrastructure Investments, was issued in the Federal Register on January 31, 1994, and has not been revoked. See www.archives.gov/federal-register/executive-orders/pdf/12893.pdf .

National Plan of Integrated Airport Systems (2013-2017) 3
AIRPORTS IN THE NPIAS (3,355)
The NPIAS contains 3,355 landing facilities. This includes 3,330 existing facilities and 25 proposed airports. Ninety-eight percent (3,253) of the NPIAS airports are owned by public entities, and 77 are privately owned.
Airports are further classified as commercial service (primary and nonprimary), reliever, or general aviation. The NPIAS also contains 25 proposed airports that are anticipated to be developed over the 5-year period covered by this report. The proposed airports are classified in the same categories as existing airports. This map shows the distribution of the 3,330 existing NPIAS airports by the airport category. This includes 3,280 airports, 10 heliports, and 40 seaplane bases. Every state has airports in the NPIAS. The complete list of NPIAS airports is contained in Appendix A.

4 National Plan of Integrated Airport Systems (2013-2017)
COMMERCIAL SERVICE AIRPORTS9 (499)
Commercial service airports are defined as public airports receiving scheduled passenger service and having 2,500 or more enplaned passengers per year. There are 499 commercial service airports which are divided into primary (378) and nonprimary (121). The 378 primary airports have more than 10,000 annual passenger enplanements (also referred to as boardings). Primary airports receive an annual apportionment of at least $1 million in AIP funds10 with the amount determined by the number of enplaned passengers. Calendar Year (CY) 2010 enplanements determine FY 2012 passenger apportionments. The 121 nonprimary commercial service airports have between 2,500 and 10,000 annual passenger enplanements. The 378 primary airports are grouped into four categories defined in statute: large, medium, and small hubs and nonhub airports. Large Hubs (29)
Large hubs are those airports that each account for 1 percent or more of total U.S. passenger enplanements.11 Some of these passengers originate in the local community, and some are connecting passengers transferring from one flight to another. Five large hub airports — San Diego International, LaGuardia, General Edward Lawrence Logan International, Fort Lauderdale-Hollywood International, and Orlando International— primarily serve passengers that originate in the community or who are traveling specifically to those destinations. Many other large hub airports
9 In May 2009, Branson Airport opened in Branson, Missouri. This privately owned public-use airport was built with private funds and has scheduled air carrier service. As a privately owned airport, it does not meet the legislative requirement to be classified as a commercial service airport so it is not included in the NPIAS. 10 Primary airports receive $1 million when AIP funding levels meet or exceed $3.2 billion 11The FAA’s use of the term hub airport is slightly different than that of airlines, which use it to denote an airport with significant connecting traffic by one or more carriers. The hub categories used by the FAA are defined in title 49 U.S.C., Section 40102 (2004).

National Plan of Integrated Airport Systems (2013-2017) 5
support higher percentages of passengers who are traveling through the airport to connect to another flight, rather than starting or ending their travel at these airports. Such connecting traffic can account for more than 65 percent of passenger activity at airports such as Charlotte/Douglas International and Hartsfield-Jackson Atlanta International. The 29 large hub airports account for 70 percent of all passenger enplanements. Large hub airports tend to concentrate on airline and freight operations and have limited general aviation activity. Four large hub airports (Salt Lake City International, Honolulu International, McCarran International, and Minneapolis-St. Paul International/Wold Chamberlain) have an average of 198 based aircraft, but the other 25 large hubs have an average of 25 based aircraft. Thus, locally based general aviation plays a small role at most large hub airports. The Nation’s air traffic delay problems tend to be concentrated at certain large hub airports. Delays occur primarily during instrument weather conditions (i.e., reduced ceiling and visibility) when runway capacity is reduced below that needed to accommodate traffic levels. Because of the number of connecting flights supported by these airports, delays among these busy large hub airports can quickly ripple throughout the system, causing delays at smaller airports nationwide.
Medium Hubs (36)
Medium hubs are defined in statute as airports that each account for between 0.25 percent and 1 percent of total U.S. passenger enplanements. The 36 medium hub airports account for 19 percent of all U.S. enplanements. Medium hub airports usually have sufficient capacity to accommodate air carrier operations and a substantial amount of general aviation activity. Two medium hub airports have an average of 628 based aircraft—Dallas Love Field and John Wayne Airport-Orange County—while the other 34 medium hub airports have an average of 95 based aircraft. Small Hubs (74)
Small hubs are defined in statute as airports that enplane 0.05 percent to 0.25 percent of total U.S. passenger enplanements. There are 74 small hub airports that together account for 8 percent of all enplanements. Less than 25 percent of the runway capacity at small hub airports is used by airline operations, so these airports can accommodate a great deal of general

6 National Plan of Integrated Airport Systems (2013-2017)
aviation activity, with an average of 128 based aircraft at each airport. These airports are typically uncongested and do not have significant air traffic delays. Nonhub Primary (239)
Commercial service airports that enplane less than 0.05 percent of all commercial passenger enplanements but have more than 10,000 annual enplanements are categorized as nonhub primary airports. There are 239 nonhub primary airports that together account for 3 percent of all enplanements. These airports are also heavily used by general aviation aircraft, with an average of 92 based aircraft. Nonprimary Commercial Service (121)
Nonprimary commercial service airports that have between 2,500 and 10,000 annual passenger enplanements are categorized as nonprimary commercial service airports. There are 121 of these airports in the NPIAS, and they account for 0.1 percent of all enplanements. These airports have some scheduled air carrier service but are used mainly by general aviation. These airports have an average of 23 based aircraft. GENERAL AVIATION AIRPORTS (2,563)
Airports that do not receive scheduled commercial service or that do not meet the criteria for classification as a commercial service airport may be included in the NPIAS as general aviation airports if they account for enough activity (having usually at least 10 based aircraft) and are at least 20 miles from the nearest NPIAS airport. These 2,563 airports, with an average of 30 based aircraft, account for 34 percent of the Nation’s general aviation fleet. They

National Plan of Integrated Airport Systems (2013-2017) 7
are the closest source of air transportation for about19 percent of the population and are particularly important to rural areas. General aviation contributed $38.8 billion in economic output in 2009. Factoring in manufacturing and visitor expenditures, general aviation accounted for an economic contribution of $76.5 billion. These airports also support a number of critical functions ranging from flight training, emergency preparedness, and law enforcement. For more information, please see the section General Aviation Airports: National Assets on page 13. RELIEVER AIRPORTS (268)
Due to different operating requirements between small general aviation aircraft and large commercial aircraft, general aviation pilots often find it difficult to use a congested commercial service airport.12 In recognition of this, the FAA has encouraged the development of high-capacity general aviation airports in major metropolitan areas. These specialized airports, called relievers, provide pilots with attractive alternatives to using congested hub airports. They also provide general aviation access to the surrounding area. To be eligible for reliever designation, these airports must be open to the public, have 100 or more based aircraft, or have 25,000 annual itinerant operations. The 268 reliever airports have an average of 184 based aircraft, which in total represents 22 percent of the Nation’s general aviation fleet. The reliever program, which was established in 1962, has evolved over the years. Currently, many of the airports designated as relievers serve their own economic and operational role and do not primarily relieve congestion at another airport. NEW AIRPORTS (25)
The NPIAS identifies 25 proposed airports that are anticipated to be developed over the 5-year period covered by this report. These new airports are shown separately in Appendix A and are included in the list of airports by State in Appendix A. New airports are identified by a location identifier beginning with a plus symbol (i.e., +07W) and include 19 new general aviation airports,
12 Large commercial aircraft typically operate at much higher speeds than small general aviation aircraft. It can be challenging to have both types of aircraft use the same runways during periods of high commercial aircraft activity due to variances in approach airspeed and wake turbulence considerations. Some of the busiest airports are in Class B and C airspace, which have specific requirements for aircraft equipage and pilot qualifications. In addition, general aviation pilots may be less familiar with air traffic control procedures used at airports that primarily serve air carrier operations.

8 National Plan of Integrated Airport Systems (2013-2017)
4 nonprimary commercial service, and 2 new primary airports. Of the two new primary airports, one would replace the existing airport in Hailey, Idaho, which is constrained. The other new primary airport is proposed to help meet the demand for aviation in the Chicago area. Four airports (two general aviation and two nonprimary commercial service airports) are scheduled to open in 2012 (three in Alaska and one in Kansas). Appendix A does not identify new airports not expected to be under development by 2017. AIRPORTS NOT INCLUDED IN THE NPIAS
There are 19,786 landing facilities in the United States. Seventy-four percent (14,615) of these facilities are closed to the public and therefore are not eligible for inclusion in the NPIAS. The FAA identifies public-use airports that are important to the national airport system for inclusion in the NPIAS. Of the 5,171 existing public-use airports, 3,330 are included in the NPIAS. The remaining 1,841 public-use airports are not included in the NPIAS because they do not meet the minimum entry criteria, are located at inadequate sites, cannot be expanded and improved to provide a safe and efficient airport, or are located within 20 miles of another NPIAS airport. The facilities not included in the NPIAS have an average of 3-based aircraft compared to 30-based aircraft at the average NPIAS general aviation airport. Each State has an aviation system plan that determines the development needed to establish a viable system of airports within that State. Each system plan involves examining the interaction of the airports with the aviation service requirements, economy, population, and surface transportation of a State’s geographic area. State plans define an airport system that is consistent with established State goals and objectives for economic development, transportation, land use, and environmental matters. State plans contain about 4,200 public-use airports. Airports included in the State plans but not in the NPIAS are usually smaller airports with State or regional significance. Appendix A contains a summary of airport counts by state. EVOLUTION OF THE NATIONAL AIRPORT SYSTEM
The first airport in the United States opened in 1909 in College Park, Maryland. Today, it is a general aviation airport. Many airports opened as private landing strips or military airfields in the 1920s, 1930s, and 1940s. Some like Salt Lake City International evolved into today’s commercial service airports. Salt Lake began as a simple landing strip in 1911, became an air mail facility known as Woodward Field in 1920, and ultimately was developed into the large hub airport it is today. Other early landing strips, such as Gauthier’s Flying Field just north of Chicago, evolved from a modest grass strip in the 1920s into a thriving general aviation airport with hundreds of based aircraft and about 90,000 take-offs and landings annually. The airport is currently named Chicago Executive Airport and serves the general and business aviation sectors of the Chicago metropolitan area. Still other airports were established and continue to serve as general aviation facilities providing access to small communities and remote areas. Airports have evolved over the past 80 to 90 years to meet the specific needs of the communities they serve as well as the national aviation system.

National Plan of Integrated Airport Systems (2013-2017) 9
The United States turned its attention to the development of civilian aviation after the end of World War II. This included the development of a national network of airports and a national airport plan. The plan identified existing and proposed new airports to serve the commercial and general aviation needs of a growing and dispersed population. Specific criteria were established to ensure that the network of airports met national needs at a reasonable cost. Based on the type of airport, these criteria included number of based aircraft, number of annual operations, scheduled air carrier service, and proximity to other airports in the national plan. Criteria also permitted inclusion of airports that met special needs such as access to remote populations. The national airport plan released in 1951 identified 2,657 existing airports and 2,288 proposed airports. Many of the proposed airports identified in the 1951 plan were constructed in the 1950s. Today, less than 1 percent of the national plan airports are proposed new airports. Aviation in the United States has matured, resulting in a fairly consistent number of airports included in the Nation’s airport plan. Although the number of federally designated NPIAS airports has remained steady, many airports have changed in size and complexity to meet the travel demands of a growing population and expanding economy. There has been dramatic growth in the country’s population over the last 40 years. Coupled with substantial migration to the west and south, this growth has resulted in changing
This map does not capture the population boom that has occurred since 2010 in the north central part of the United States due to oil exploration.

10 National Plan of Integrated Airport Systems (2013-2017)
aviation needs. Some communities have grown into major business centers requiring sophisticated operations. Other regions have seen population decline as the nature of work has changed over time. With the advent of new technology, airports will continue to evolve. Although the Nation’s airports have evolved differently over the past decades, they remain an integral part of U.S. lifestyle and commerce. Some airports are large in size and have multiple runways and facilities. Others are relatively small and may need only a short, single runway to serve a critical purpose. The role of an airport is not necessarily directly related to its size or its facilities. Today, airports fulfill very diverse roles from moving people and cargo and serving agricultural needs, to providing community access and air ambulance services, to supporting private transportation using the smallest piston aircraft to the most sophisticated jets. Because of this, the United States has the largest, most diverse and efficient system of airports in the world. USE OF THE NATIONAL AIRPORT SYSTEM
Commercial Airline Operations
The national airport system is a reflection of the types of aircraft using the airports and subsequent economic activity. Of the 3,330 airports contained in the NPIAS, 499 of these airports accommodate commercial airline service. Commercial airline service represents the most widely known aspect of the aviation industry and includes the carriage of passengers on aircraft. The last decade has been turbulent for commercial air service, resulting in wide variations in annual passenger boardings (e.g., declines in 2001 and 2002 after 9/11 and in 2009 and 2010 from the economic recession) at NPIAS airports. International passenger boardings on U.S. carriers at U.S. airports reached an all-time high in 2011 at 81 million. Despite the effects of the recent recession on passenger enplanements, the 2011 total enplanements were about 33.1 million higher than they were in 2000. Domestic enplanements represent approximately 89 percent of total U.S. passenger traffic at commercial service airports.

National Plan of Integrated Airport Systems (2013-2017) 11
There have also been changes in aircraft operations at airports with airport traffic control towers between 2000 and 2011. In 2011, air carrier operations were down more than 15 percent from the peak experienced in 2000. Air taxi/commuter operations as well were down 26 percent in 2011 from their 2005 high. The reductions in aircraft operations reflect air carrier’s upgauging aircraft as well as better matching available seats with demand. Air taxi/commuter operations grew annually through 2005, when operations peaked, as the major air carriers shifted flights to their regional partners. Air taxi/commuter operations have decreased 26 percent since the peak in 2005. The combined activities of air carrier and air taxi/commuter operations account for approximately 44 percent of total operations at airports with airport traffic control towers. Total operations by military aircraft were slightly higher in 2011 than 2008, which was the lowest annual total in the past 10 years. Similar to general aviation and air carrier/air taxi/commuter activities, overall military aircraft activity was 8.9 percent lower in 2011 than in 2000. Military operations are a function of defense missions and can fluctuate annually based on national defense needs. General Aviation
Eighty-five percent of NPIAS airports are classified as general aviation and reliever airports and serve mainly general aviation activity. General aviation activity has seen declining numbers of total operations since 2000, declining at an average annual rate of 3.0 percent. Much of the decline in the later parts of the decade can be attributed to economic conditions and high fuel prices. The term “general aviation” encompasses a diverse range of commercial, governmental, and recreational uses. While it is often easier to consider what general aviation doesn’t include—scheduled airline and military activity—this does not sufficiently define general aviation activity. To better understand this segment of the industry and the resulting requirements for the airport and air traffic system, each year the FAA surveys the general aviation community through general aviation and part 13513 activity surveys. These surveys ask respondents to indicate the types of uses of their aircraft and the number of hours flown, as well as the type of aircraft flown, flying conditions, fuel consumption, and aircraft age.
13 Title 14 Code of Federal Regulations (CFR), part 135 – Operating Requirements: Commuter and On Demand Operations and Rules Governing Persons on Board Such Aircraft.

12 National Plan of Integrated Airport Systems (2013-2017)
Table 1 summarizes the results of the CY 2010 surveys by types of uses. The percentages are based on the number of actual hours flown. While personal use of general aviation aircraft (32.3 percent) is the single largest use category, the combined nonpersonal uses of general aviation aircraft represent the majority of all general aviation activity. In 2010, the combined nonpersonal and part 135 uses represented approximately 68 percent of total hours flown. While some of this activity may have occurred at commercial service airports, the majority of activity occurred primarily at general aviation airports.
Table 1: General Aviation and Part 135 Activity Survey Actual Hours Flown by Use, 2010
Category Percent of Total
General Aviation Use
Personal Use 32.3%
Instructional 15.7%
Corporate 10.9%
Business 9.6%
Aerial Observation 6.7%
Aerial Application 4.3%
Other 3.6%
Aerial Other 1.3%
Other Work 1.0%
External Load (Rotorcraft) 0.6%
Sightseeing 0.7%
Air Medical 0.8%
Subtotal 87.5%
On-Demand Federal Aviation Regulation Part 135 Use
Air Taxi and Air Tours 10.0%
Part 135 Air Medical 2.5%
Subtotal Part 135 Use 12.5%
Total All Uses 100.0% Source: General Aviation and Part 135 Activity Surveys – CY 2010
It is notable that instructional uses comprise the second largest use category. For 20 years, the majority of commercial airline pilots have been trained through civilian training systems rather than through the military. Instructional training for all pilots, whether pursuing flying recreationally or as a career, is best conducted away from commercial service airports to preserve commercial service airport capacity and enhance reliability for airline schedules. For these reasons, instructional training is currently focused at general aviation airports. The results of the survey demonstrate the role general aviation plays in accommodating commerce throughout the United States. It is estimated that thousands of passengers are carried on business and corporate aircraft each year. Business and corporate aircraft also move air freight,14 ensuring
14 It should be noted that large transport aircraft carrying air cargo are included with the air carrier counts as many of these operators operate under similar regulations to commercial airlines carrying passengers.

National Plan of Integrated Airport Systems (2013-2017) 13
overnight delivery for high-priority business documents from rural communities and providing just-in-time delivery of parts to manufacturing plants. On-demand air taxi services provide air access to communities not served by commercial airlines. Air medical services provide rapid access to emergency medical services that cannot be provided on scheduled airline aircraft and in many rural parts of the country, which may not be served by scheduled airline activity. Aerial application includes activities such as fertilizing for agricultural purposes or fighting forest fires. Aerial observations include patrolling pipelines or the electrical grid infrastructure to ensure safety and reliability of these energy systems, identifying forest fires early in their development, or surveying wildlife and natural habitats. General aviation also encompasses many activities not fully captured by these use categories. Examples include the Civil Air Patrol, which provides nearly all of the inland search and rescue missions, or homeland security, law enforcement, and disaster relief activities by other Government agencies. General aviation also includes the humanitarian services such as transporting patients to medical centers or delivering relief supplies to areas following natural disasters. As evidenced by the diverse range of activities, general aviation has various land use, airspace, and air traffic requirements that are much different from the requirements for commercial air service. This necessitates a system of airports that is flexible in design and construction to accommodate these uses. General aviation airports are included in the NPIAS because they have the capacity to accommodate these varied uses and roles.
GENERAL AVIATION AIRPORTS: NATIONAL ASSETS
In cooperation with the aviation community, the FAA conducted a top-down review of the existing network of 2,952 NPIAS airports15 used mostly by general aviation aircraft. The results of this effort are contained in the May 2012 report entitled “General Aviation Airports: A National Asset.” 16 As part of the 18-month effort, the FAA documented the important airport roles and aeronautical functions these facilities provide to their communities and the national airport system. These functions, shown in Figure 1, include emergency preparedness and response, direct transportation of people and freight, commercial applications such as agricultural spraying, aerial surveying and oil exploration, and many others. Many of these functions cannot be supported efficiently or economically at primary airports.
15 Included in the 2,952 NPIAS airports are nonprimary commercial service, general aviation, and reliever airports. 16 This report is available on-line at: http://www.faa.gov/airports/planning_capacity/ga_study/.

14 National Plan of Integrated Airport Systems (2013-2017)
Figure 1: Types of Aeronautical Functions Serving Public Interest
General aviation facilities were divided into categories based on existing activity measures (e.g., the number and types of based aircraft and volume and types of flights). Of the 2,952 general aviation facilities studied, 2,455 were grouped into the four new categories shown in Table 2.
Table 2: New General Aviation Categories
National (84)
Regional (467)
Local (1,236)
Basic (668)
Supports the national
airport system by providing
communities with access to
national and global
markets. These airports
have very high levels of
activity with many jets and
multiengine propeller
aircraft. These airports
average about 200 total
based aircraft, including 30
jets.
There are 84 airports that
meet this definition.
Supports regional
economies by connecting
communities to regional
and national markets.
These airports have high
levels of activity with some
jets and multiengine
propeller aircraft. These
airports average about 90
total based aircraft
including 3 jets.
There are 467 airports
that meet this definition.
Supplements local
communities by providing
access to local and
regional markets. These
airports have moderate
levels of activity with some
multiengine propeller
aircraft. These airports
average about 33-
based propeller-driven
aircraft and no jets.
There are 1,232 airports
and 4 seaplane facilities
that meet this definition.
Supports general aviation
activities, often serving critical
aeronautical functions within
the local community such as
emergency response and
access to remote
communities. These airports
have moderate levels of
activity with an average of 10
propeller-driven aircraft and
no jets.
There are 645 airports,
20 seaplane facilities, and
3 heliports that meet this
definition.

National Plan of Integrated Airport Systems (2013-2017) 15
The map below, Figure 2, illustrates the location of the 2,455 airports in the four categories. The new categories are also included Appendix A.
Figure 2: General Aviation Airports in the Four New Categories
The FAA was unable to establish a clearly defined category for the remaining 497 facilities. They have a broad range of different types of activity and characteristics and cannot readily be described as a clear group or category. These 497 facilities are currently unclassified and require further study, planned for FY 2013. While these new categories do not impact an airport’s eligibility for Federal funding, they will assist the FAA in determining the appropriate types of development to support each airport’s role and function. The FAA will ask the States and local airport owners to provide updated information on the aeronautical functions supported at each facility and the level and sophistication of flying taking place there. These updates will be part of the normal State system planning process, supported by individual master plan updates and regional or metropolitan system plans. Future development of general aviation facilities included in the NPIAS will continue to be based on eligible and justified needs and priorities, with these new categories providing a more consistent framework within which to evaluate proposed projects. Chapter 4 of this report provides development estimates for each of the new categories.

16 National Plan of Integrated Airport Systems (2013-2017)
This page intentionally left blank

National Plan of Integrated Airport Systems (2013-2017) 17
CHAPTER 2: SYSTEM OBJECTIVES AND PERFORMANCE OVERVIEW
This chapter will describe the U.S. Department of Transportation (DOT) transportation goals and FAA objectives for the national air transportation system. It will highlight the performance of the airport system in six key areas: safety, capacity, environmental, runway pavement condition, surface accessibility, and airport finance. Major FAA initiatives that will improve the performance of the national air transportation system in these six areas are also included in this chapter. SUPPORTING NATIONAL AIR TRANSPORTATION SYSTEM OBJECTIVES
The NPIAS supports DOT and FAA objectives for the air transportation system, as shown below. DOT objectives are contained in the Strategic Plan for FYs 2012 through 2016. The long-term, strategic vision for the FAA is outlined in Destination 2025 which replaced the FAA’s “Flight Plan” in FY 2012. U.S. Department of Transportation
DOT’s Strategic Plan sets the direction for the DOT to provide safe, efficient, convenient, and sustainable transportation choices through five strategic goals that are supported by a wide-ranging management goal to make the DOT a high-performance, outcome-driven agency. Each of the five goals below are reflected in the next section (Factors Indicating System Performance). 1. Safety: Improve public health and safety by reducing transportation-related fatalities and
injuries. 2. State of Good Repair: Ensure the United States proactively maintains its critical transportation
infrastructure in a state of good repair. 3. Economic Competitiveness: Promote transportation policies and investments that bring lasting
and equitable economic benefits to the Nation and its citizens. 4. Livable Communities: Foster livable communities through place-based policies and
investments that increase transportation choices and access to transportation services. 5. Environmental Sustainability: Advance environmentally sustainable policies and investments
that reduce carbon and other harmful emissions from transportation sources. Federal Aviation Administration
The FAA supports DOT strategic goals with five mission-based strategic goals listed below. The specific objectives within each goal are available online.17
1. Next Level of Safety: By achieving the lowest possible accident rate and always improving safety, all users of our aviation system can arrive safely at their destinations. We will advance aviation safety worldwide.
17 FAA’s Destination 2025 is available online at: http://www.faa.gov/about/plans_reports/.

18 National Plan of Integrated Airport Systems (2013-2017)
2. Delivering Aviation Access through Innovation: Enhance the flying experience of the traveling public and other users by improved access to and increased capacity of the nation’s aviation system. Ensure airport and airspace capacity are more efficient, predictable, cost-effective, and matched to public needs.
3. Sustaining Our Future: To develop and operate an aviation system that reduces aviation’s environmental and energy impacts to a level that does not constrain growth and is a model for sustainability.
4. Improved Global Performance through Collaboration: Achieve enhanced safety, efficiency, and sustainability of aviation around the world. Provide leadership in a collaborative standard setting and creation of a seamless global aviation system.
5. Workplace of Choice: Create a workplace of choice marked by integrity, fairness, diversity, accountability, safety and innovation. Our workforce will have the skills, abilities, and support systems required to achieve and sustain the Next Generation Air Transportation System (NextGen).
FAA’s Office of the Associate Administrator for Airports
Each organization within FAA sets annual performance goals in support of FAA and DOT strategic goals. The Airports’ organization is responsible for preparing the NPIAS and administering the AIP, which by improving the safety, capacity, and condition of the airport system contribute substantially to achieving the strategic goals described in Destination 2025 and the FAA Office of Airports Business Plan. Listed below are a few of the major goals that the Airports’ organization has set for FY 201218: 1. Complete all practicable runway safety area (RSA) improvements by 2015. 2. Maintain the rate of serious runway incursions (Categories A and B) caused by vehicle
pedestrian deviations (VPDs) at or below 2 percent of total VPDs. 3. Reduce hazards to aircraft from bird strikes by having part 139 certificated airports that
experienced a triggering event, such as multiple bird strikes or engine ingestion, initiate a wildlife hazard assessment in 2012.
4. Develop a proactive safety culture at part 139 certificated airports through airport design standards and inspections.
5. Maintain runway pavement in excellent, good, or fair condition for 93 percent of paved runways in the NPIAS.
6. Determine the currency of part 150 studies completed by large, medium, and small airports, as part of a longer-term plan to reduce noise impacts through sound insulation for 50 percent of residents in noise impacted homes within significantly impacted areas of large, medium, and small hub airports by 2018.
7. Improve airport environmental quality through a 6-year plan to develop guidance and establish final eligibility requirements to enable large hub airports to develop recycling and energy reduction programs and to reduce ozone emissions in EPA-designated nonattainment areas.
8. Improve airport environmental quality through sustainability planning, recycling, energy reduction, emissions reduction, and environmental management systems.
9. Maintain average age of total Office of Airports advisory circulars (ACs) to 5 years or less.
18 The FY 2012 FAA Office of Airports Business Plan is available online at: http://www.faa.gov/about/plans_reports/.

National Plan of Integrated Airport Systems (2013-2017) 19
FACTORS INDICATING SYSTEM PERFORMANCE
Six key factors help identify the level of system performance: safety, capacity, environmental performance, pavement condition, surface transportation accessibility, and financial performance. However, the six factors are not equally sensitive to capital improvements, and increased investment in airport infrastructure is not the only way to improve performance. For example, Federal aid to airports can be useful when focusing on specific issues, such as the provision of airport rescue and firefighting equipment, development of safety areas around runways, removal of obstructions in runway approach paths, and planning and implementing noise compatibility measures. These six Airports’ factors align with the five strategic goals contained in DOT’s Strategic Plan (shown in parentheses). SAFETY (SAFETY)
The United States has not only the largest and most complex aviation system in the world, but also one of the safest as demonstrated by the low accident rate. The airport, as a key component of the aviation system, is an important contributor to the resulting safety record. Although the airport is rarely determined to be a cause of an aircraft accident, it may be cited as a contributing factor that impacts the severity of an accident.
The FAA has made runway safety a focus, and the aviation community has made great progress in improving runway safety. Through a joint effort between the FAA and the aviation industry, a Runway Safety Council was formed to look into the root causes of runway incursions. The Council comprises representatives from various parts of the aviation industry. A working group integrates investigations of severe runway incursions and conducts a root cause analysis. The working group then presents its root cause analysis to the Council and makes recommendations on ways to improve runway safety. The Council reviews the recommendations. If accepted, the recommendations are assigned to the part of the FAA and/or the industry that is best able to control the root cause and
Source: National Transportation Safety Board Aviation Accident Statistics http://www.ntsb.gov/data/aviation_stats.html.

20 National Plan of Integrated Airport Systems (2013-2017)
prevent further runway incursions. The Council tracks recommendations to ensure appropriate action is taken. Preventing Runway Incursions
To operate safely and efficiently, the aviation system relies on communication and coordination among air traffic controllers, pilots, airports, and airport vehicle operators. Their actions can cause or avert runway incursions. The International Civil Aviation Organization (ICAO) defines a runway incursion as any occurrence at an airport involving the incorrect presence of an aircraft, vehicle, or person on the protected area of a surface designated for the landing and takeoff of aircraft. Each incursion is classified based on the severity of the incident into one of four categories. Category A, the most severe, is where a collision was narrowly avoided. Category D, the least severe, is where there was no collision hazard. In 2008, the United States implemented the ICAO definition of a runway incursion, and incidents formerly classified as a surface incident19 are now classified as a runway incursion. Table 3 summarizes runway incursion data since 2008, reflecting the previous and current methodologies for incursion classification.
Table 3: Historical Runway Incursions
Fiscal Year Number of Incursions
2008 1,009
2009 951
2010 966
2011 954 Source: FAA Office of Runway Safety
The reduction in the number and severity of runway incursions is one of the FAA’s top priorities. The number of serious runway incursions—classified as Categories A and B—continued to fall from a total of 67 in FY 2000 to just 7 in FY 2011. This is a 90-percent decline. Between FY 2008 and FY 2010, Categories A and B events fell at a rate of 50 percent per year. The FAA has deployed advanced technologies to address runway incursions and reduce the risks of runway collisions at commercial airports. A newer ground surveillance system called ASDE-3/AMASS (Airport Surface Detection Equipment-Model 3/Airport Movement Area Safety System) has been deployed to further enhance safety. Airport Surface Detection Equipment-Model X (ASDE-X) provides more precise surface detection technology. ASDE-X is currently installed at 34 busy airports in the United States. The FAA has developed runway status lights (RWSL) technology to increase situational awareness for aircrews and airport vehicle drivers and thus serve as an added layer of runway safety. RWSL technology is currently under evaluation at four test airports: Boston-Logan, Dallas/Fort Worth, San Diego, and Los Angeles International. The FAA is deploying RWSL systems at 23 airports: Atlanta, Boston, Charlotte, Chicago (O’Hare), Dallas/Fort Worth, Denver, Detroit, Ft. Lauderdale,
19 Previously, an incident without an aircraft in potential conflict, such as an unauthorized aircraft crossing an empty runway, was defined as a surface incident and not a runway incursion.

National Plan of Integrated Airport Systems (2013-2017) 21
Houston (George Bush), Las Vegas, Los Angeles, Minneapolis, New York (John F. Kennedy, LaGuardia, and Newark), Orlando, Philadelphia, Phoenix, San Diego, San Francisco, Seattle-Tacoma, and Washington (Baltimore and Dulles). In terms of infrastructure improvements, the FAA uses AIP funds to enhance airport safety and support the agency’s goal of reducing accidents, fatalities, and runway incursions. With the help of the AIP, airports can reconfigure taxiways to optimize both safety and efficiency. Airport operators can build perimeter roads around the airfield so vehicles do not have to be driven across taxiways and runways. AIP funds are also used to meet updated standards for runway marking and signs, eliminating confusion on airfields. These updates have included changing the airfield marking standard for taxiway centerlines at 75 airports (based on enplanements) to require special markings that will alert pilots when they are approaching hold short lines and working with airport operators to install stop bars20 at certain runway/taxiway intersections. Additional methods include recommending that airports improve how they provide information on rapidly changing runway and taxiway construction and closings. The FAA wants airports to provide airlines and pilots with diagrams giving the latest information on runway construction and closings. They could distribute this information by email, on a Web site, or by hand. It would supplement Notices to Airmen (NOTAM), which are currently printed as text or delivered verbally, and thus do not have diagrams. The FAA is also taking steps to further automate the NOTAM process. The majority of runway incursions are caused by pilots in violation of regulations and/or air traffic control instructions—also known as pilot deviations. The FAA completed an analysis of taxi clearances and found that more explicit instructions are needed from controllers to pilots. The FAA has issued requirements for controllers to give explicit directions to pilots on precise routes to travel from the gate to the runway. The FAA has also issued requirements for aircraft to have crossed all intervening runways prior to receiving a takeoff clearance. The FAA aviation safety inspectors now verify that pilots have current surface movement charts (airport diagrams) available and are using them. Airport managers and fixed-base operators participate in runway safety action teams to address airport-specific factors (e.g., procedures, environment, and infrastructure) that affect runway safety. The FAA requires driver training programs for all airport operators who access the airfield movement areas at commercial airports.21 Maintaining Safe Airport Conditions
The FAA helps airports maintain safe conditions by developing airport design standards, based on airport design categories, which apply to facilities throughout the system. Airports agree to meet these FAA standards when they accept AIP funds for capital improvements to their facilities. The FAA standards address physical layout characteristics such as runway length and width, runway/taxiway/taxilane separation, RSAs, lighting, signs, and markings. The standards also
20 A stop bar is a series of in-pavement and elevated red lights that indicate to pilots that they may not cross. 21 For more information on FAA runway safety initiatives, visit http://www.faa.gov/airports/runway_safety/.

22 National Plan of Integrated Airport Systems (2013-2017)
address material characteristics (e.g., pavement, wiring, and luminance of lights and issues such as aircraft rescue and firefighting equipment and operations, snow removal equipment and operations, and wildlife hazard management. In another effort to promote safety, the FAA’s Office of Airports has focused contract and staff resources on updating standards contained in ACs. Many AIP-funded projects must comply with the safety standards contained in the ACs. In the last 2 years, the FAA updated 31 ACs. Further, the Office of Airports continued to meet its goal of maintaining the average age of ACs at less than 5 years. The FAA’s Office of Airports continues efforts on two research programs: the Airport Technology Research and the Airport Cooperative Research Program (ACRP). The Airport Technology Research was authorized $29.25 million in funding in FY 2012. This research is conducted at the FAA's Technical Center in Atlantic City, New Jersey, in the areas of airport planning and design, airport lighting and marking, runway safety, wildlife hazard mitigation near airports, aircraft rescue and fire fighting, and pavement design and construction. The results of the research are used to update ACs and equipment specifications to provide guidance to airport sponsors and consultants. The ACRP undertakes applied research in a variety of airport subject areas, including administration, environment, policy and planning, safety, security, human resources, design, construction, maintenance, and operations. As of January 2012, the ACRP has initiated 205 research projects and produced 93 publications. A complete listing of all ACRP research projects and research results is available free of charge on the Transportation Research Board ACRP Web site.22 FAA airport design standards have developed over time and provide the necessary dimensions to accommodate aircraft operations, as well as an extra margin of safety. For example, the standards for RSAs are designed to minimize damage to aircraft and injuries to occupants when an aircraft unintentionally strays from or overruns the runway during an operation. The standards provide for graded areas contiguous to the runway edges that are free of ruts, humps, and other surface irregularities. Only objects required to be there because of their function, such as runway lights or signs, can be in the RSA. These objects must be frangible by being mounted so that they break away if struck by an aircraft. Adherence to design standards ensures the consequences of incidents are less likely to be severe. Runway Safety Areas (RSA)
As aircraft have become larger, faster, and more demanding, the required RSA dimensions have increased. As a result, many RSAs at commercial service airports do not meet current FAA standards. The FAA accelerated the improvement of RSAs that do not meet agency design standards and is actively working with airport sponsors and local communities to improve, as rapidly as possible, the remaining nonstandard RSAs. At the end of FY 2011, 87 percent of the RSAs identified have been improved, to the extent practicable, under AIP. Approximately 47 percent of the RSAs have been improved, to the extent practicable, using both AIP and Air Traffic Organization’s (ATO) funded facilities and equipment projects. This initiative is included in the FAA’s strategic plan, Destination 2025.
22 The TRB ACRP Web site is located at: http://www.trb.org/acrp/.

National Plan of Integrated Airport Systems (2013-2017) 23
For some airports, however it is not possible to acquire sufficient land to meet RSA standards. For those cases, FAA, in partnership with industry and airport operators, conducted research to develop a soft-ground arrestor system to quickly stop aircraft that overrun the end of a runway. On the basis of that research, FAA issued a specification for Engineered Material Arresting Systems (EMAS). EMAS is generally a bed of highly crushable concrete material that is installed at the ends of the runway, although FAA also certified a new type of EMAS during FY 2012. Regardless of which material is used, an EMAS bed provides a safety enhancement on runway ends where there is not enough level, cleared land for a standard RSA. When an aircraft leaves the runway traveling at high speed, the landing gear will crush the EMAS bed and the aircraft will come to a quick and safe stop. EMAS has been installed at more than 63 runway ends at 42 airports and there are plans under contract to install or replace 3 EMAS systems at 3 additional U.S. airports. Safety Management System (SMS)
In 2001, the ICAO adopted an amendment to Annex 14, Aerodromes, of the Convention on International Civil Aviation requiring all member states to establish SMS initiatives for certificated international airports. The ICAO defines an SMS as a “systematic approach to managing safety, including the necessary organizational structures, accountabilities, policies, and procedures.”23 An SMS provides an organization’s management with a set of decision-making tools that can be used to plan, organize, direct, and control its business activities in a manner that enhances safety and ensures compliance with regulatory standards. The FAA supports harmonization of international standards making U.S. aviation safety regulations consistent with ICAO standards and recommended practices. Pilot Studies
Therefore, the FAA is developing SMS standards for certificated airports under title 14 Code of Federal Regulations (CFR), part 139. 24 There are currently 545 public-use airports certificated under title 14 CFR, part 139, and therefore subject to annual part 139 safety inspections to determine continued compliance with regulatory safety standards. Since 2007, the FAA has initiated numerous pilot studies to evaluate the development of SMS at a variety of certificated airports.25 More than 30 certificated airports of varying size and operations have participated in the studies. Participating airports reviewed existing safety standards to determine if they met the intent of typical SMS requirements. They then developed SMS manuals and implementation plans based in part on their findings.
The pilot studies allowed airports and the FAA to gain experience establishing airport-specific SMS that are tailored for the individual airport. Additionally, this experience provided best practices and lessons learned that the FAA is using as it considers how to incorporate SMS standards into part 139. 23 See ICAO, Safety Management Manual, at 6.5.3 ICAO Doc. 9859-AN/474 (2nd ed. 2009). 24 Airport certification is required by statute and governed by title 14 CFR, part 139, Airport Certification. Part 139 establishes 22 areas of safety standards, ranging from specific items, such as the condition of runway surfaces and training requirements for aircraft rescue and fire fighting personnel, to more general requirements for the development of an Airport Emergency Plan and a Wildlife Hazard Management Plan. A certificated airport may use AIP funding to meet certain requirements under part 139 certification standards, such as acquiring aircraft rescue and firefighting equipment. 25 A list of participating airports is available online at: http://www.faa.gov/airports/airport_safety/safety_management_systems/.

24 National Plan of Integrated Airport Systems (2013-2017)
To continue the analysis into the next phase of SMS, the FAA launched another study in FY 2010 aimed at implementing the SMS at a small number of airports. The study provided funding for participating airports to implement certain processes developed under the original pilot studies. It also required the airports to conduct safety risk analysis to proactively identify hazards and mitigate risks in their operations and development, as well as conduct audits and inspections of their SMS programs to gain lessons learned from implementation and review the effectiveness of their SMS in proactively identifying safety issues on the airport. To participate, airports had to have participated in the earlier studies. Thirteen airports participated in this study, which ended in February 2012. The FAA compiled the results of the study and included them in the draft AC 150/5200-37A, Safety Management Systems for Airports, released June 29, 2012. Safety Risk Management (SRM)
The FAA’s Office of Airports is also implementing the SMS within its own processes and procedures. Beginning in June 2011, certain documentation submitted to the FAA for approval must undergo Safety Risk Management assessment. Airport layout plans, modifications of standards, and construction safety phasing plans must incorporate proactive risk assessment aimed at considering safety issues throughout the entire project development cycle from planning to construction. At this time, the SRM assessments are only applicable to new projects at large hub airports. Wildlife Hazard Mitigation
The FAA’s Office of Airports has overseen a wildlife management program for more than 50 years in an effort to keep airports safe by making them less attractive to all types of wildlife. The FAA program manages airport wildlife hazards through a number of avenues, including regulation, agency guidance, ACs, AIP funding for hazard assessment and eligible mitigation, and ongoing education. A number of new wildlife hazard management initiatives were implemented and are underway, including:
Updating the national wildlife strike database and making it more user-friendly for the public. The FAA began collecting data in the 1990s for use by the Airports organization, academia, and researchers as a means of improving airport safety and reducing wildlife hazards.
The FAA issued a certification alert to airport operators on June 11, 2009, reminding them of their obligation under part 139 to conduct wildlife hazard assessments if they experience a “triggering event” as outlined in section 139.337 (b).26 After issuing the certification alert, the FAA identified 96 airports that had experienced these types of events, but had not conducted an assessment. The FAA notified the airport operators at these airports and required them to do an evaluation. As of December 2011, approximately 32 airports had completed assessments, 51 had initiated assessments, and 13 have applied for funding for assessments in 2012. The FAA provides AIP funds for assessments and for the development of a follow-on wildlife hazard management plan (WHMP), if needed.
The FAA initiated rulemaking that would make it mandatory for every certificated airport to conduct a wildlife hazard assessment and prepare a WHMP. The FAA is continuing to develop a program to conduct wildlife hazard site visits and/or assessments at approximately 2,700 general
26 For additional information on part 139 visit: http://www.faa.gov/airports/airport_safety/part139_cert/.

National Plan of Integrated Airport Systems (2013-2017) 25
aviation airports. The program will have a phased-in approach that the FAA expects will take through the year 2020 to complete because of the large number of assessments and site visits required. As of May 2012, several general aviation airports have already initiated assessments. The FAA will make AIP funding available for these assessments.
The FAA identified gaps among certificated airports, air carriers, and general aviation airports in reporting wildlife strikes. The FAA is conducting outreach to the aviation community to close the reporting gaps.27 Outreach activities include printing posters that promote strike reporting and distributing several thousand of them to certificated airports, general aviation airports, aviation schools, private industry groups, and state aviation organizations. The FAA also funded two ACRP studies since 2010 that specifically deal with wildlife hazard mitigation at airports. ACRP Synthesis 23: Bird Harassment, Repellent, and Deterrent Techniques for Use on and Near Airports, and ACRP Report 32: Guidebook for Addressing Aircraft/Wildlife Hazards at General Aviation Airports, were published in 2011 and 2010, respectively. Copies of the report were distributed to 2,700 general aviation airports.
The FAA conducted usability studies, and in 2010, retooled the wildlife hazard Web site (http://wildlife-mitigation.tc.faa.gov) to make it more user friendly and to allow more advanced data mining. The new site (http://wildlife.faa.gov) has search fields that enable users to find data on specific airports, airlines, and engine types, as well as by date and state without having to download the entire database. The new Web site is continuously being updated to add more data and resources.
The FAA continued evaluating the performance of low-cost portable bird radars that are capable of detecting and tracking birds on or near airports. Bird radar systems were deployed at Seattle-Tacoma, Chicago O’Hare, John F. Kennedy, and Dallas/Fort Worth International airports. The intent is to develop a performance specification that will enable airports that need this capability to competitively procure bird radars using AIP grant funding.
For the last 15 years, the FAA and the U.S. Department of Agriculture have conducted a research program to make airports safer by reducing the risks of aircraft-wildlife collisions. The research efforts designed to improve wildlife management techniques and practices on and near airports include:
Methods for making airport habitats less attractive to species that are the most dangerous in terms of aircraft collisions. This is accomplished by studying which species use the airport property, how they behave in that environment, and why they are attracted.
Techniques for controlling species by restricting access to attractive features, such as stormwater ponds.
Technologies for harassing and deterring hazardous species. Investigating the types of grasses and agricultural crops that will attract the least amount of
hazardous wildlife. Studying behavioral reactions of birds and mammals to approaching vehicles and understanding
bird movements and flight behaviors to better predict where and when bird strikes are more likely.
27 A copy of the report can be found online at: http://www.airporttech.tc.faa.gov/safety/downloads.

26 National Plan of Integrated Airport Systems (2013-2017)
The FAA cosponsors the Bird Strike Committee USA as part of its continued public outreach and education effort to increase awareness within the aviation community about wildlife hazards. This is an international forum where biologists, engineers, airline personnel, and others come together to exchange ideas and learn about the latest technology to mitigate wildlife hazards. The FAA has established a working group with the National Association of State Aviation Officials (NASAO) Wildlife Committee, per a memorandum of understanding between the FAA and the NASAO, in order to increase awareness and educate the State aviation community.
CAPACITY (ECONOMIC COMPETITIVENESS)
The capacity of the airport system is affected by many factors, including the layout of individual airports, the manner in which airspace is organized and used, airport operating procedures, weather conditions, the aircraft type using the system, and the application of technology. The majority of airports in our national aviation system have adequate airport capacity and little or no delay. A major concern in airport planning is the adequacy of the runways and taxiways to handle anticipated aircraft operations safely and efficiently. A single runway with a parallel taxiway can normally accommodate approximately 200,000 annual aircraft operations. The FAA provides guidance to help airport sponsors in deciding when airfield capacity improvements should be considered. Current FAA guidance recommends that capacity planning starts when aircraft activity reaches 60 to 75 percent of an airport’s airfield capacity. With major airfield improvements often taking 10 or more years from concept to opening, this recommendation allows adequate lead time so the needed improvement can be completed before the problem becomes critical. Before a new runway or runway extension can be built, the FAA must assess potential environmental impacts that may result from airport development projects. The FAA’s authorizing statute requires the FAA to implement a process for expedited and coordinated environmental reviews of certain airport capacity, safety, and security projects. In addition, the FAA is continuing to work closely with the busiest airports to ensure environmental studies for major runway projects or airfield reconfigurations are completed on schedule. The FAA establishes environmental impact analysis teams, maximizes the use of available staff and consultant resources, and utilizes recommended best practices for accomplishing its environmental work in a timely manner. The FAA works with other Federal and State environmental resource agencies to achieve concurrent reviews, analyses, and permit approvals to the greatest extent possible. Schedules are established with key milestones and monitored along with a process to elevate and resolve disputes or disagreements between parties. Over the last decade, infrastructure projects at 20 of the busiest airports across the country have also provided these airports with the potential to accommodate more than 2 million additional operations each year. This is a significant accomplishment. Moving forward, new airport infrastructure will continue to play a vital role in increasing capacity. A comprehensive overhaul of the U.S. national airspace system, known as NextGen, will make air travel more convenient and dependable, while ensuring that flights are as safe, secure, and hassle-

National Plan of Integrated Airport Systems (2013-2017) 27
free as possible. Through a continuous rollout of improvements and upgrades, the FAA is building the capability to guide and track air traffic more precisely and efficiently to save fuel and reduce noise and pollution. NextGen is better for the environment and the economy. NextGen is not a single system that is “turned on,” but rather an incremental implementation of new technologies and flight procedures that will make the overall flow of air traffic more efficient and stable. In 2012, the FAA released the annual update to its NextGen Implementation Plan.28 This plan details agency commitments in the near- and mid-term (2012–2018) and further engages aviation stakeholders as NextGen development and deployment continue. Airport capacity improvements will also benefit from integrated airport planning and development along with the implementation of planned NextGen performance-based navigation (PBN) procedures and capabilities. NextGen will benefit airports by providing tools to better accommodate future growth in a safe, efficient, and environmentally responsible manner. Airports are active participants in the implementation of NextGen across the national airspace system. While many investments in NextGen technologies are the responsibility of the FAA or aircraft operators, airports will also have opportunities to advance NextGen (see Alternative Capacity Enhancement Methods). However, new, expanded, or reconfigured airfield infrastructure will generally represent the most viable means of achieving significant capacity increases where needed. Congestion and Delay
The concentration of aircraft arrivals and departures at an airport can result in congestion and delay. Delay is an indicator that activity levels are approaching or exceeding throughput capacity levels. The impacts of delays can be measured in many ways and include direct costs such as increased fuel use and crew time, indirect costs such as the extra travel time for passengers, missed connections (resulting in delays on other airlines and their passengers), and increased air emissions. Delay is expressed in different metrics. For example, the DOT tracks the on-time performance of airlines and reasons for flights arriving after their scheduled arrival times. Other delay statistics are collected and used for specific purposes. For example, air traffic controllers identify instances where aircraft are delayed 15 minutes or more in a given flight segment. The FAA uses this information to monitor the day-to-day operation of the air traffic control system. Airport planners and designers use the average delay per aircraft operation as a measure of congestion, which is related to demand and capacity. This statistic can be forecasted and translated into a dollar cost of delay. Air Carrier On-Time Performance
The DOT defines a delayed operation as an aircraft arriving at or departing from a gate 15 minutes or more after its scheduled time. The number of arrivals and departures that are delayed 15 minutes or more is compiled by the DOT for busy airports and is reported monthly. In 2011,29 the 16 carriers reporting on-time performance recorded an overall on-time arrival rate of 76 percent with 4 percent of the flights cancelled.
28The 2012 NextGen Implementation Plan is available at: http://www.faa.gov/nextgen/implementation/. 29Data available at: http://www.transtats.bts.gov/HomeDrillChart.asp.

28 National Plan of Integrated Airport Systems (2013-2017)
Of the 19.8 percent of flights delayed in 2011,30 7 percent were delayed because the aircraft arrived late (previous flight with same aircraft arrived late, causing the present flight to depart late), 6 percent were delayed due to national aviation system delays (such as nonextreme weather conditions, runway closures, heavy traffic volume, and air traffic control), 5 percent were delayed due to air carrier delay (circumstances within the airline’s control such as maintenance or crew problems, aircraft cleaning, baggage loading, and fueling), 2 percent of the delays were attributed to cancelled or diverted flights, and less than 1 percent were delayed due to significant meteorological conditions that, in the judgment of the carrier, delayed or prevented the operation of a flight, such as tornado, blizzard, or hurricane. Delay Indicators
Through the Aviation System Performance Metrics (ASPM) system, the FAA tracks delay indicators at the 30 busiest airports, referred to as “core airports,”31 using reporting from participating airlines. Delays can be measured against the scheduled flight time or against the flight plan. For purposes of this analysis, flight plan data was used. Grouping the core 30 airports according to average arrival delay per operation, there were 17 airports experiencing more than 10 minutes of delay per arrival (e.g., 12 airports with 10 to 14 minutes and 5 with more than 14 minutes) in 2000. In 2007, the number of airports with an average arrival delay of more than 10 minutes had increased to 25. In 2011, the number of airports with more than 10 minutes of delay decreased to 10.
30Data available at: http://www.transtats.bts.gov/OT_Delay/OT_DelayCause1.asp?pn=1 . 31The FAA has identified those airports with the greatest impact on system performance as “core airports.” These core airports have more than 1 percent of passenger enplanements or .75 percent or more of the total nonmilitary itinerant operations.
Source: ASPM. Data available at: https://aspm.faa.gov/aspm/entryASPM.asp

National Plan of Integrated Airport Systems (2013-2017) 29
Grouping the core 30 airports according to average departure delay per operation shows that in 2000 there were 18 airports with more than 9 minutes of delay per departure. In 2007, the number of airports with an average departure delay of more than 9 minutes increased to 25. In 2011, the number of airports with more than 9 minutes of delay decreased to 18.
Airport Capacity – A National Look
In recognition of delays and congestion detailed above, the FAA has developed an ongoing series of reports, known as the Future Airport Capacity Task (FACT), to assess the future capacity of the Nation’s airports and metropolitan areas. FACT1 was published in June 2004, and an update, FACT2, was published in May 2007.32 The FACT2 analysis identified a significant number of the Nation’s airports and metropolitan areas that may need additional capacity in the future, if demand reaches forecast levels. Following the publication of FACT2, the FAA worked with airport sponsors to develop toolboxes of potential solutions and implementation plans that would further improve capacity and reduce delays. The systemwide analyses conducted in the FACT are intended to determine which airports and metropolitan areas have the greatest need for additional capacity. This is needed to inform FAA strategies about the timing and need for infrastructure improvements at the national level, for agency planning purposes. Since FACT2 was published, activity levels and forecasts have changed due to economic conditions and airline restructuring. In addition, new runways have opened and the Operational Evolution Partnership (OEP) has been completed. NextGen plans and performance capabilities have also matured. As a result, the FAA has started FACT3 to reexamine the identification of airports and metropolitan areas that are likely to be constrained in the future, based on information available today. The FACT3 is being developed in conjunction with airport operators, MITRE, and multiple FAA offices, including NextGen and Operations Planning and ATO’s Performance Analysis and Strategy. The scope of the analysis will include surface and gate constraints in addition to runway and airspace
32The FACT 2 report is available online at: http://www.faa.gov/airports/resources/publications/reports/media/fact_2.pdf.
Source: ASPM. Data available at: https://aspm.faa.gov/aspm/entryASPM.asp

30 National Plan of Integrated Airport Systems (2013-2017)
operations. Updated delay and performance criteria will be used to identify congested airports. The study will identify airports that are expected to be congested by 2020 or 2030 taking into consideration all anticipated airfield capacity improvements and NextGen procedures and technologies. The FAA expects to complete the FACT3 report in March 2013. Another ongoing series of reports issued by the FAA, known as Airport Capacity Benchmarks, examines the capacity of the major U.S. airports. A capacity benchmark is the hourly throughput of arrivals and departures that an airport’s runways are able to sustain during periods of high demand. The 2012 edition to the benchmark report updates previous versions that were published in 2001 and 2004. The 30 core airports are analyzed in the benchmarks, as are 3 additional airports that were identified in the FACT2 as capacity-constrained: Long Beach/Daugherty Field, Oakland International, and John Wayne Airport-Orange County. Information is provided on the facility’s layout, annual weather conditions, current operations, and recent and future (2020) improvements. Both air traffic control facility “call rates” and model-estimated hourly throughput rates are shown for the highest capacity configuration that is commonly used during visual, marginal, and instrument conditions. The model used for the benchmarks report is also used for the FACT3 as well as for the NextGen systems analysis evaluations. Alternative Capacity Enhancement Methods
While the construction of new runways and runway extensions can provide substantial improvement to capacity, new technology can also benefit some airports by reducing delays and increasing operational efficiency without substantial capital investment. Delays can be reduced, in part, by modifying air traffic control procedures or introducing new technologies to improve the flow of aircraft en route and in the terminal area. Changes in air traffic and flight procedures also have an impact on capacity. Airspace design changes, for example, can establish more effective airspace structures and provide better access and improved use of available runways. Navigation and Access
PBN instrument flight procedures are a key component of NextGen because they can improve the efficiency of airport arrivals and departures. For general aviation operators and some regional air carriers, WAAS/LPV approach procedures can provide near Category I minimums. Business jet operators and air carriers are more commonly equipped for area navigation (RNAV) and required navigation performance (RNP), which can support Category I minimums. As of May 31, 2012, there were 2,877 FAA-published LPV/LP approaches for use at U.S. airports. In fact, there were about 724 airports without instrument landing systems (ILSs) that have an LPV approach. Tens of thousands of general aviation aircraft are already equipped with global positioning system, and many thousands also have WAAS because it is an attractive upgrade. The FAA may opt for an incremental phase-out of the ILS Category I installations by 2025, as both WAAS/LPV and RNAV/ RNP provide more cost-effective and flexible instrument approach

National Plan of Integrated Airport Systems (2013-2017) 31
procedures.33 In addition, the FAA continues to evaluate Ground Based Augmentation System technology. Airports have the key role of discussing with their users the need for new or additional PBN procedures. A hub airport may serve air carriers that are actively seeking to expand the use of RNAV or RNP procedures, while a general aviation airport may benefit from a new WAAS/LPV approach procedure. An airport can request that the FAA initiate consideration and design of these procedures. Airports can facilitate the aeronautical survey and obstruction-mitigation and runway-lighting actions that may be needed to achieve lower minimums. The FAA also created an initiative called the Optimization of Airspace and Procedures in the Metroplex (OAPM). A metroplex is a metropolitan area where multiple airports are located. For example, the Southern California metroplex contains more than a dozen general aviation airports within its boundary, as well as major commercial airports such as Los Angeles International and Burbank’s Bob Hope. The FAA has identified 21 metroplex areas for studies and improvements aimed at deconflicting arrivals and departures by 2016. So far, studies have been completed for the Washington, DC, North Texas, Houston, Atlanta, Charlotte, Northern California, and Southern California metroplexes with design and implementation to follow. While large commercial airports are the primary beneficiaries of the airspace efficiency improvements, general aviation airports will also see improved efficiency and access. NextGen also offers the opportunity to increase access to smaller airports in the United States with Automatic Dependent Surveillance-Broadcast (ADS-B) and/or Wide Area Multilateration (WAM), instead of radar, for air traffic control surveillance. The FAA is rolling out ADS-B, the satellite-based surveillance system that will be fully deployed nationwide by 2013. Aircraft equipage with ADS-B will follow through 2020. The FAA is also studying the potential use of WAM as a backup to ADS-B in case of a GPS outage. Surface Surveillance and Departure Queue Management
Surface surveillance and management is another key area for airport involvement in NextGen. In 2011, the FAA completed installation of ASDE-X at 35 airports. Surface data can be shared among air traffic control, airports, ramp managers, and air carrier operations centers via the national airspace system enterprise services gateway. Data sharing enhances safety and traffic flow on runways, taxiways, and some ramps and improves collaborative decision making. The FAA plans to install enhancements to airport surface detection equipment, known as the Airport Surface Surveillance Capability (ASSC), at nine other international airports between 2014 and 2017: Portland, Ted Stevens Anchorage, Kansas City, Louis Armstrong New Orleans, Pittsburgh, San Francisco, Cincinnati/Northern Kentucky, Cleveland-Hopkins, and Andrews Air Force Base. While ASDE-X tracks surface movement of aircraft and vehicles using radar, multilateration, and ADS-B, ASSC collects data from multilateration and ADS-B only.
33Ground-based infrastructure improvements and obstruction removal may still be required in order to achieve optimal minimums.
32 National Plan of Integrated Airport Systems (2013-2017)
At airports with ADSE-X or ASSC, vehicles that regularly operate in the movement area can be equipped with ADS-B squitters. The squitters broadcast vehicle positions to air traffic control, aircraft equipped with ADS-B In, and the airport operations center. Situational awareness and safety is improved, particularly during construction projects and winter weather events. The FAA continues to research the need and technology options for nonmovement area surface surveillance, particularly in support of NextGen surface traffic management concepts that are also still in development. In 2010, the Port Authority of New York and New Jersey, airlines, and the FAA demonstrated a virtual departure queue management procedure at John F. Kennedy International. The new scheme assigned a time for pilots to contact air traffic controllers for clearance to taxi, rather than permitting pilots to push back from the gate and then wait an unpredictable amount of time with engines running for the taxi clearance. This change significantly reduced the number of aircraft in line waiting for takeoff with engines running, thus reducing the environmental impact of surface operations. The FAA tested a more automated system, Collaborative Departure Queue Management (CDQM), to optimize departure queues at Memphis International. This prototype CDQM system used real-time data sharing among the FAA, Delta Air Lines, and FedEx. A surface decision support system allocated available departure capacity among the various flights that were ready to go, in 10-minute blocks, so airlines could make decisions on when to push back their aircraft from the gate. Another version of CDQM that aims for a simple, low-cost solution is N-Control, a NextGen initiative demonstrated at Boston Logan International in 2010. The “N” refers to the maximum number of aircraft authorized to push back from the gate during a certain period of time. Departure queue management cannot eliminate delays, but it does shift them from the runways and taxiways to the ramp or gate area where aircraft can wait with engines off. The FAA is continuing to develop departure queue management options, with operational use expected in a few years. Improved Closely Spaced Parallel Runway Operations
As NextGen evolves, changes to airport planning and design standards will provide guidance on the way airports operate and plan for future infrastructure. For example, the FAA is evaluating several approaches to improving closely spaced parallel runway procedures. Changes like this may give airports greater design flexibility by allowing better use of existing runway layouts. The FAA is continuing to evaluate existing arrival and departure procedures at airports with multiple or closely spaced runways. The goal is to reduce the separation between aircraft as they approach closely spaced parallel runways, which will improve the arrival capacity on those runways especially during poor visibility conditions. To that end, analyses of independent and dependent runway standards, including blunder analyses and wake analyses, are ongoing. A blunder is when an aircraft drifts off its intended path during approach. Blunder analyses consider the necessary separation distance required for independent approaches to parallel runways in case of blunders. The current lateral separation standard for independent (concurrent) arrivals applies to runways spaced 4,300 or more feet apart. In 2011, the FAA completed blunder analyses and determined the lateral runway separation can be reduced for independent arrivals on parallel runways spaced closer than 4,300 feet apart. Using specific procedural and systems criteria, this standard could be reduced

National Plan of Integrated Airport Systems (2013-2017) 33
to 3,600 feet if approved via the FAA’s Safety Management System process. A planned update to FAA Order 7110.65, Air Traffic Control, will reflect these changes once the Safety Management System processes are complete. The FAA will continue to conduct blunder analyses on parallel runways spaced less than 3,600 feet apart. Additionally, an ongoing analysis of dependent approaches looks to reduce the current 1.5 nautical miles (nm) staggered separation for approaches to parallel runways spaced 2,500 feet or more apart, up to the independent runway separation standard. Today, there are five parallel runway pairs (at five airports) spaced less than 2,500 feet apart that are authorized for 1.5 nm dependent staggered approaches per FAA Order 7110.308, 1.5 Nautical Mile Dependent Approaches to Parallel Runways Spaced Less Than 2,500 Feet Apart. Work will continue through 2015 to authorize additional runway pairs, at additional airports, for this procedure. Also in 2015, the FAA is planning to reduce dependent staggered separation behind heavy aircraft (capable of takeoff weights greater than 255,000 pounds) and Boeing 757 aircraft operating on closely spaced parallel runways using instrument flight rules. In 2011, the FAA completed the evaluation of RNAV approaches (including RNP and WAAS/LPV) in place of ILS approaches for parallel runways. The FAA published changes to air traffic control procedures to allow combinations of RNAV and ILS approaches for simultaneous approaches on parallel runways spaced at least 2,500 feet apart and for independent approaches in January 2012. In 2015, the FAA expects to reduce wake turbulence separation standards during favorable wind conditions for departures on parallel runways during visual conditions. The FAA is continuing to work with the ICAO to update the wake separation standards based on analysis of wake generation, wake decay, and the effects experienced when an aircraft comes into contact with wake turbulence. The new separations will increase capacity while maintaining or enhancing safety by considering aircraft type-specific leader-follower aircraft pairings. Congestion Management
Congestion management is a broad term that includes a number of federally imposed administrative measures (e.g., slots, which limit the number of flights that may be scheduled) to reduce congestion and delay and allocate constrained capacity. Airport operators may seek to reduce congestion through revenue neutral peak hour pricing to encourage airlines to move operations to a less congested time or secondary airport.34 Another congestion management technique is using the International Air Transport Association (IATA) guidelines for schedule facilitated airports, in accordance with the Worldwide Scheduling Guidelines. An IATA “Level 2” designation enables the FAA to request all U.S. and foreign air carriers to report to the FAA their proposed scheduled operations for the schedule facilitated airport, which allows the FAA to closely monitor the traffic levels and prevent excessive scheduling and delays at that facility. This is not a common practice in the United States and has only been utilized at about six U.S. airports. However, the FAA has successfully implemented this congestion management technique at selected airports (e.g., Chicago O’Hare). 34 DOT Policy Regarding Airport Rates and Charges, 73 Federal Register 40434 (July 14, 2008); see also, Air Transport Association of America v. U.S. Department of Transportation, 613 F.3d 206, C.A.D.C (July 13, 2010) (No. 08-1293) denying petition for review of policy.

34 National Plan of Integrated Airport Systems (2013-2017)
The FAA prefers to expand capacity in an environmentally sound manner to meet demand because the aviation industry is a major economic engine providing support and jobs both for the country as a whole and for local communities. However, there are a handful of airports where demand exceeds capacity in the short term, pending capacity expansions, or in the long term, where capacity expansion is not a practical option. At these airports, as noted below, solutions are needed to address congestion and allocate limited space efficiently and fairly.
New York Metro Area
With persistent demand for New York area airspace and the limited ability to expand capacity, the FAA is presented with a challenge of how best to allocate scarce runway capacity. For decades, the FAA managed congestion at LaGuardia and John F. Kennedy International airports through the High Density Rule (HDR). However, Congress mandated the expiration of the HDR at both airports on January 1, 2007. To minimize congestion at LaGuardia, John F. Kennedy International, and Newark Liberty International after the expiration of the HDR, the FAA put temporary orders in place at all three New York metro airports that cap scheduled operations. The FAA is currently developing a proposed rule that would replace the orders at the three New York airports. The orders are currently scheduled to expire at the end of the summer 2013 scheduling season, whichever occurs first. The New York Area Program Integration Office was established to integrate the implementation of delay-reduction initiatives in the New York metropolitan area. It leads a matrix team with representatives from the FAA’s Air Traffic, Aviation Safety, Airports, and Aviation Policy, International Affairs and Environment Offices. The team has developed an Integrated Master Schedule and Delay Reduction Plan with all delay reduction initiatives and supporting projects. The New York, New Jersey, and Philadelphia (NY/NJ/PHL) airspace redesign project is critical to enhancing the efficiency and reliability of the airspace structure and the Air Traffic Control system. It is needed to accommodate current levels of traffic as well as future levels of growth. This will enhance safety and reduce both current and future delays in the NY/NJ/PHL metropolitan area. Additionally, an Airport System Capacity Planning Study was begun earlier this year by the Port Authority of New York and New Jersey to identify ways that its airports can accommodate future demand for air travel. The Port Authority operates five airports in the New York metropolitan area: LaGuardia, John F. Kennedy International, Newark Liberty International, Stewart International, and Teterboro. The study will analyze a range of alternatives, including physical improvements at existing airports to increase capacity and/or improve operational efficiency, new procedures to improve throughput, development of regional airports, demand management solutions, and the potential of alternative transportation modes to capture a larger share of air passenger demand. A subset of alternatives will be identified and carried forward for further evaluation.
Chicago International Airport
The FAA also continues to monitor congestion and delay at Chicago O’Hare International, although the airport is no longer operating under a regulatory limit on scheduled operations. The previous congestion management rule expired on October 31, 2008, in conjunction with the opening of the first new O’Hare Modernization Program runway in November 2008. However, in order to monitor traffic and delay levels, the FAA has maintained Chicago O’Hare as an International Air Transport Association (IATA) Level 2 schedule facilitated airport. As a Level 2 airport, the FAA obtains

National Plan of Integrated Airport Systems (2013-2017) 35
advance schedule information from U.S. and foreign air carriers, which will enable the FAA to identify and work with the carriers to voluntarily mitigate excessive scheduling and delays. San Francisco International Airport
In 2011, the FAA designated San Francisco International Airport as an IATA Level 2 airport in order to mitigate existing congestion and expected increased congestion due to runway safety area construction work. Under the IATA Level 2 process, beginning with the summer 2012 scheduling season, airlines operating or planning to operate flights submit planned schedules for the upcoming season. The FAA reviews the aggregate of planned schedules and determines whether they may cause significant congestion and delays in light of operational constraints and works with airlines to voluntarily adjust schedules to mitigate congestion and delay impact, as necessary. The FAA will reevaluate the IATA Level 2 designation for San Francisco International Airport following the completion of the construction at the airport. Airline Schedules
Congestion and delay are particularly sensitive to demand levels during peak periods. In periods when there are more flights planned than the actual throughput capacity of an airport, delay levels can increase. While the number of air passengers and air carrier operations were down in 2011, peak period demand levels remain high. Schedule reductions by the airlines to better meet travel demand have occurred during off peak hours. In making capacity reductions, the major airlines have shifted flights to smaller regional airline partners. While this gives better capacity control to airlines, it does not change the peak period demand levels. Use of General Aviation and Secondary Airports
Redistribution of traffic among airports to make more efficient use of facilities is another measure that can be used to reduce delays. General aviation airports have been identified and improved in metropolitan areas to provide general aviation pilots an attractive alternative to congested commercial service airports. Large metropolitan areas usually have a system of general aviation airports, one or more of which can accommodate corporate jet aircraft, with others designed for use by smaller, propeller-driven aircraft. Several former military airfields, with long runways and associated facilities, have been successfully converted to civil aviation use as secondary airports. General aviation airports have been successful at relocating general aviation activity from congested airports. As a result, general aviation activity at congested airports is a small percentage of total operations. Another factor that helps to limit delay is the ability of carriers to serve outlying, suburban airports, using them to reduce congestion at the principal airport. This regional approach is particularly effective in very large metropolitan areas that are the origin or destination point for many trips by air. Low-cost carriers often serve alternative airports in metropolitan areas and provide competition to carriers at the principal airport. Research – Capacity
Through the ACRP, the FAA is supporting research to provide better airport planning and design guidance. Future aviation demand will rely on the ability of airports to accommodate increased aircraft operations, larger aircraft, and more efficient passenger throughput. This capacity research

36 National Plan of Integrated Airport Systems (2013-2017)
program will prepare for those future needs while simultaneously solving near-term and current airport capacity issues. Two primary studies are currently underway: ACRP project 03-17, Evaluating Airfield Capacity, will lead to a guidebook to assist airport
planners with airfield and airspace capacity evaluation. The guidebook will present capacity modeling guidelines that will improve the decision making process for determining the appropriate level of modeling sophistication for a given study or project and improve consistency among airports. A functional prototype of modeling tools is also part of the project. The project has been completed and the publication process is underway.
ACRP project 03-20, Defining and Measuring Aircraft Delay and Airport Capacity Thresholds, will describe the various types of aircraft/flight delays and how these are calculated through existing major delays metrics. It will also offer guidance about when each delay metric should be used to evaluate airport improvements. The resulting guidebook is scheduled to be completed in the fall 2012.
The FAA will use the results of both projects to update AC 150/5060-5, Airport Capacity and Delay. ENVIRONMENTAL (ENVIRONMENTAL SUSTAINABILITY AND LIVABLE COMMUNITIES)
Community concern about environmental issues can impact both expansion and operation of existing airports. Environmental constraints also increase the difficulty of developing new airports. The problem is particularly serious in metropolitan areas where there is high aviation demand and also strong pressure to develop residential and other incompatible land uses near airports. In addition, airports in large metropolitan areas are frequently located in air quality nonattainment areas. Historically, communities have been concerned about noise levels, but they are also concerned about air quality, water pollution, and, most recently, climate change. Airports will be better neighbors as NextGen evolves. New flight procedures such as optimized profile descent arrivals (OPDs) allow aircraft to descend in the shortest route and at a minimum power setting, thereby reducing fuel consumption and emissions. New airframe and engine technologies and the development of renewable sustainable fuels will also improve noise, air quality, and greenhouse gas emissions. Air Quality
Many of the Nation’s airports are located in air quality nonattainment or maintenance areas. Air quality improvements in these areas are accomplished through State Implementation Plans, which provide controls and measures to meet health-based National Ambient Air Quality Standards under the Clean Air Act. The FAA provides financial support for airport air quality mitigation through the AIP and PFC Program. The FAA encourages early airport actions to reduce local emissions through the Voluntary Airport Low Emissions (VALE) Program. The goal of the VALE Program is to reduce air pollutants at commercial service airports. It is designed to provide airport sponsors with financial and regulatory incentives to stimulate early investment in proven low-emission airport technologies, including

National Plan of Integrated Airport Systems (2013-2017) 37
alternative fuel vehicles, and low-emission infrastructure, such as solar electricity generation and preconditioned air and electrical power for aircraft at the gate. The VALE Program was established in FY 2005, and to date, the FAA has invested approximately $108 million in AIP funds in 53 VALE projects at 31 commercial service airports. In addition, the FAA has developed enhanced aircraft arrival capabilities that will decrease aircraft fuel consumption, thereby reducing costs and emissions. During the past 5 years, the FAA has completed 34 Standard Terminal Arrival Routes with OPD capability. Traditional arrival procedures have multiple segments of level flight during descent and each step-down requires a change in power settings. OPD procedures enable arrival aircraft to descend from cruise altitude to final approach at or near idle power with few, if any, level-offs. Because aircraft can use lower and steady power settings, OPD procedures result in reduced fuel burn, lower aircraft exhaust emissions, and often less noise. Another type of efficient arrival procedure is the Tailored Arrival (TA), which provides fuel, emissions, and noise benefits similar to those of OPDs. TAs are now operational at Miami International, San Francisco International, and Los Angeles International, with additional use being considered at Ted Stevens Anchorage International and two Air Force bases. Airport Sustainability Efforts
The FAA continues to work closely with aviation stakeholders to promote sustainable airport development. Airport sustainability efforts include: Cooperative Research – The FAA has continued work with ACRP to conduct sustainability
research. Studies include a synthesis report on airport sustainability practices completed in 2008 and ongoing projects to develop decision tools and improvements to the Sustainable Aviation Guidance Alliance (SAGA) database. The SAGA database was created by industry stakeholders to provide information on sustainability measures at airports.
Airport Sustainability Planning – The FAA is continuing work on the Sustainable Master Plan Pilot Program. Initiated in 2010, the goal of the program is to make sustainability a core objective in airport planning. Ten airports are participating in the program preparing comprehensive sustainability plans that use baseline information to develop future goals for sustainable performance. Because of the very positive early results of the pilot program, the FAA began exploring the possibility of issuing additional airport sustainability planning grants for FY 2012 and beyond.
Airport Recycling and Emissions Reductions – In FY 2012, the FAA began convening industry groups to encourage development of airport recycling and emission reduction programs. The FAA is using input from stakeholders to develop guidance and timelines for program implementation at the Nation’s largest commercial service airports.
Environmental Streamlining
The FAA continues to address airport-related impacts on noise, air quality, and other environmental concerns. In doing so, it complies with many Federal laws, executive orders, and regulations. The FAA’s authorizing statute requires the FAA to streamline (i.e., improve efficiency and effectiveness) its environmental review of capacity projects at congested airports. The statute also requires the FAA to conduct streamlined environmental reviews for Administrator-designated safety or security projects at any airport. Further, the FAA streamlines its environmental review of any airport project

38 National Plan of Integrated Airport Systems (2013-2017)
the U.S. Secretary of Transportation chooses for “expedited processing” under Executive Order 13274, Environmental Stewardship and Transportation Infrastructure Project Reviews.35 Environmental Research
The FAA-funded ACRP is examining areas of airport-related environmental concerns and advancing the science and technology necessary for creating an environmentally friendly airport system. The FAA’s ACRP efforts are focusing on: Airport-related hazardous air pollutants and greenhouse gasses; The impact of airports on climate change and community noise; Developing alternative aviation fuels; Developing advanced noise and air emissions models; Promoting airport sustainability; Land use compatibility; Environmental management systems; and Integrating airport development and environmental review processes. Between 2005 and 2009, the FAA allocated $56 million toward an array of aviation design, construction, operation, and environmental research projects. In each fiscal year from 2010 through 2012, $15 million was provided for ACRP research, including $5 million specifically for environmental research. The FAA’s Office of Environment and Energy’s, Research and Development Program supports science and technology necessary for creating an environmentally friendly airport system. The program helps to: Reduce significant community noise and air quality emissions impacts in absolute terms; Limit or reduce the impact of aviation greenhouse gas emissions on global climate (including the
rate of fuel burn); Improve energy efficiency (including air traffic operations and alternative fuels development); Proactively address other environmental issues.
The program is also designed to better quantify aircraft noise and emissions and their environmental impacts, develop cost-beneficial impact mitigation options, and to develop ways for improving energy efficiency and alternate fuel sources. Environmental Management Systems at Airports
FAA’s AC 150/5050-8, Environmental Management Systems for Airport Sponsors, provides guidance to airport sponsors wanting to develop Environmental Management Systems (EMS).36 It also provides guidance to airport sponsors on the needed parts of an EMS. An EMS is a management framework based on the Plan-Do-Check-Act model. It helps organizations that adopt
35 Executive Order 13274 was issued in the Federal Register on September 23, 2002, and has not been revoked. See http://www.dot.gov/execorder/13274/index.htm. 36 AC 150/5050-8 is available online at: http://www.faa.gov/airports/resources/advisory_circulars/index.cfm/go/document.current/documentNumber/150_5050-8.

National Plan of Integrated Airport Systems (2013-2017) 39
an EMS to balance environmental performance with business objectives through a process of continual improvement. It has resulted in significant savings and cost avoidance for many organizations, including airport sponsors. Sponsors of large and medium hub airports can obtain AIP funding to assist in developing an EMS.37 Livability
DOT’s Livability Initiative is intended to enhance the economic and social well-being of all Americans by creating and maintaining a safe, reliable, integrated, and accessible transportation network that enhances choices for transportation users, provides easy access to employment opportunities and other destinations, and promotes positive effects on the surrounding community. The FAA supports this initiative through the VALE Program described above. The FAA also encourages the expansion of public transit connections to airports. Public transit connections are discussed later in the Surface Accessibility section. Water Quality
Many of the Nation’s airports are found near waterways and wetlands because when airports were originally built, the best available land suitable for an airport (flat and inexpensive) was found near water. Today, many airport activities can cause adverse water quality impacts. In particular, airport construction activities and seasonal airport anti-icing/deicing operations are major concerns. Airport construction activities often cause sediment-laden runoff to enter waterways. Biological and chemical breakdown of deicing chemicals in airport runoff can cause dissolved oxygen demands on receiving waters. Additives in deicing chemicals may be toxic to aquatic life. For years, the FAA has worked with the U.S. Environmental Protection Agency (EPA), airport operators, airlines, and industry groups on various water quality issues. Most recently the FAA consulted with EPA during the rulemaking process to help establish reasonable effluent limit guidelines for airport deicing activities. The final rule was published in the Federal Register on May 16, 2012.
The FAA continues to work with airport sponsors and airlines in the search for alternatives to glycol-based aircraft deicing chemicals. The FAA is also working with airport sponsors, industry associations, and other Federal agencies to ensure water quality mitigation does not create or improve habitats that attract wildlife and birds that are hazardous to aviation safety. The FAA also continues to participate in ACRP projects administered by the TRB: Preparing Guidance for Treatment of Deicing-Impacted Airport Stormwater (ACRP 02-29); Developing a Guidebook for Selecting Methods to Monitor Airport and Aircraft Deicing
Materials (ACRP 02-14); Developing a Report on Winter Design Storm Factors for Airport Stormwater Management
(ACRP 02-19); Beginning work on a study on Applying Whole Effluent Toxicity Testing to Airport Deicing
Runoff (ACRP 02-39);
37 Program Guidance Letter 07-06 is available online at: http://www.faa.gov/airports/aip/guidance_letters/.

40 National Plan of Integrated Airport Systems (2013-2017)
Addressing Water Resource Issues Affecting Airport Capacity Enhancement Planning (ACRP 02-11, published August 2011);
Alternative Aircraft and Airfield Deicing and Anti-Icing Formulations with Reduced Aquatic Toxicity and Biochemical Oxygen Demand (ACRP 02-01, published April 2010); and
Managing Runoff From Aircraft and Airfield Deicing and Anti-Icing Operations (ACRP 02-02, published December 2008).
Noise
The noise situation around airports has improved dramatically since 1976.38 At that time, an estimated six to seven million people living near airports in the United States were exposed to significant levels of aircraft noise.39 That number has decreased over time. It is estimated that the number of people in the United States living in areas adjacent to airports with noise levels above the day/night average sound level (DNL) of 65 decibels (dB) has decreased from approximately 500,000 in 2005 to approximately 323,000 in 2010. The increase in 2010 relative to 2009 as shown in the figure below was due to reduced operations in 2009. This order of magnitude reduction in the population exposed to significant aircraft noise is primarily due to reductions in aircraft source noise and the phase out of older Stage 1 and 2 aircraft over 75,000 pounds. On July 5, 2005, the FAA published a final rule on a new noise standard for subsonic jet airplanes and subsonic transport category large airplanes. This new noise standard, Stage 4, ensures that the latest available noise reduction technology is incorporated into new aircraft designs after that date. To help ensure continued noise reductions, efforts continue to develop and implement operational procedures that could reduce noise from today’s fleet as well as to develop quieter aircraft technology through the FAA’s Continuous Lower Emissions, Energy, and Noise Program, which could lower the noise from tomorrow’s fleet of aircraft.
38 In 1976, the DOT published its Aviation Noise Abatement Policy, which provided a course of action for reducing aviation noise impact. The principles contained in that document and subsequent legislative and regulatory action have resulted in a dramatic reduction in the number of Americans adversely exposed to aviation noise. An excerpt of that policy is available online at: http://www.faa.gov/about/office_org/headquarters_offices/apl/noise_emissions/planning_toolkit/. 39 Defined as DNL of 65 dB or higher in title 14 CFR part 150 section7 and Appendix A (Table 1) for residential land uses.

National Plan of Integrated Airport Systems (2013-2017) 41
The FAA established a noise exposure performance target in 1997 to reduce the number of people in the United States exposed to aircraft noise by 1 percent per year. This target was updated to reduce the number of people living in areas incompatible with aircraft noise by 4 percent per year in 2007 and rebaselined in 2010 to define 2005 as the base year. In addition, in 2011, within the context of Destination 2025, the FAA set a target to reduce to 300,000 people living in areas of significant aircraft noise by 2018. This target is aligned with the 4-percent reduction per year that the FAA has been working toward. Currently, the FAA is exceeding the 4-percent per annum performance target, achieving a 16-percent reduction in population exposed to significant noise since 2005. The FAA is expected to stay below the target in the near term, but steps may be needed in the future if the FAA is to reach the target. These steps may include new aircraft and engine technology and operational improvements. FAA’s Part 150 Program,40 established under the Aviation Safety and Noise Abatement Act of 1979 (recodified at 49 United States Code 47501 et. seq.), helps airport operators develop comprehensive noise and land use compatibility programs. Entrance into the part 150 program is voluntary for airport operators and leads to development of Noise Compatibility Programs (NCPs) and associated Noise Exposure Maps (NEMs) which identify land uses that are incompatible with airport noise and develop measures to reduce airport related noise impacts in the community. NEMs are also required for an airport that enters the part 150 program. The airport operator uses NEMs to evaluate current noise impacts and future incompatible development. The FAA determines whether the airport operator has prepared NEMs in accordance with part 150. After active and direct participation of affected parties, the airport operator can then submit an NCP outlining mitigation measures to improve noise and land use compatibility. Once an airport has entered the part 150 program, there are requirements to keep the NEMs and NCPs up to date related to the impact of noise on incompatible land uses. As of the end of FY 2011, there are 275 airports participating in the part 150 program, and 256 had NCPs approved by the FAA. In addition to first-time NCP approvals, the FAA has approved 134 updates to these programs. An FAA-approved NCP allows an airport to compete for Federal aid from the AIP noise set-aside for noise mitigation projects.41 Since 1982, 256 airports have received grants for part 150 studies, and over $5.7 billion has been granted for airport noise compatibility projects. Besides AIP funding, airports have collected and used PFCs for noise studies totaling $12.5 million and noise mitigation totaling nearly $3.4 billion. Over the past 35 years, considerable effort has been expended to provide relief to noise-impacted areas by funding noise mitigation projects under the AIP. Noise mitigation projects include residential and public building sound insulation, land acquisition, and relocating residents from noise-impacted areas. Noise compatibility efforts also promote preventive measures such as comprehensive planning, zoning, subdivision ordinances, building codes, and real-estate disclosure. In addition, airports have acquired noise-monitoring equipment and installed noise barriers to reduce ground run-up noise.
40 Title 14 CFR, part 150, Airport Noise Compatibility Planning. 41 Certain noise projects to benefit schools and medical facilities and mitigation in an approved Final Environmental Impact Statement can be federally funded without an approved NCP.

42 National Plan of Integrated Airport Systems (2013-2017)
The FAA has had an annual performance measure for the AIP noise set-aside program since it was established in FY 2003. The intent of the performance measure is to reduce the population exposed to significant levels (DNL 65dB or greater) of aircraft noise. In FYs 2003 and 2004, this measure tracked only resident population benefiting from noise funding. In FY 2005, this was expanded to include student populations. Resident benefits are tracked when the airport provides funding (with AIP assistance) for either sound insulation or relocation from the areas of significant airport noise. Student benefits are tracked when the airport provides funding (with AIP assistance) for noise insulation of schools or school relocation. Each year, the Airports’ Business Plan establishes a target reduction for resident and student populations. Slightly more than 30,000 residents and students have benefitted from noise funding in FYs 2010 and 2011. RUNWAY PAVEMENT CONDITION (STATE OF GOOD REPAIR)
Airfield pavement needs regular maintenance to seal cracks and repair damage; more significant rehabilitation may be needed on a 15- to 20-year cycle to remedy the effects of age, use, and exposure. Runway pavement in a state of good maintenance minimizes damage to aircraft and avoids unnecessary higher costs for major rehabilitation (e.g., full-depth reconstruction). As part of airport inspections, the FAA updates airport master records for public-use airports and reports the results through the Airport Safety Data Program. Runway pavement condition is classified as excellent (no visible deterioration), good (all cracks and joints sealed), fair (mild surface cracking, unsealed joints, some slab edge spalling), poor (large open cracks, slab surface and edge spalling, vegetation growing through cracks and joints), or failed (widespread, severe cracking with raveling and deterioration). The FAA’s performance goal is to ensure that not less than 93 percent of runways at airports in the NPIAS are maintained in excellent, good, or fair condition. Data for FY 2011 indicates that 97.5 percent of runways at NPIAS airports are rated excellent, good, or fair and 2.5 percent are rated poor or failed. Pavement at commercial service airports is better, with 98 percent of the runways rated excellent, good, or fair and 2 percent rated poor or failed. The figures below show the percentage of runways reported in excellent/good, fair, and poor/failed condition at NPIAS and commercial service airports over the last 25 years.
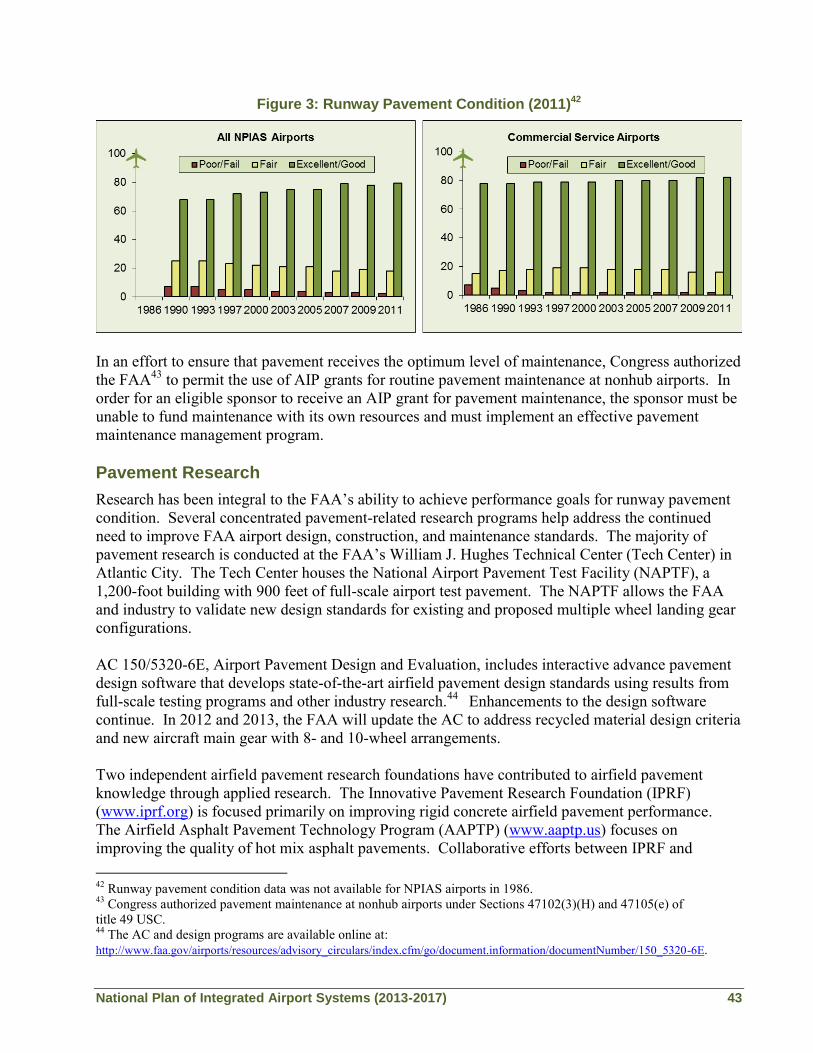
National Plan of Integrated Airport Systems (2013-2017) 43
Figure 3: Runway Pavement Condition (2011)42
In an effort to ensure that pavement receives the optimum level of maintenance, Congress authorized the FAA43 to permit the use of AIP grants for routine pavement maintenance at nonhub airports. In order for an eligible sponsor to receive an AIP grant for pavement maintenance, the sponsor must be unable to fund maintenance with its own resources and must implement an effective pavement maintenance management program. Pavement Research
Research has been integral to the FAA’s ability to achieve performance goals for runway pavement condition. Several concentrated pavement-related research programs help address the continued need to improve FAA airport design, construction, and maintenance standards. The majority of pavement research is conducted at the FAA’s William J. Hughes Technical Center (Tech Center) in Atlantic City. The Tech Center houses the National Airport Pavement Test Facility (NAPTF), a 1,200-foot building with 900 feet of full-scale airport test pavement. The NAPTF allows the FAA and industry to validate new design standards for existing and proposed multiple wheel landing gear configurations. AC 150/5320-6E, Airport Pavement Design and Evaluation, includes interactive advance pavement design software that develops state-of-the-art airfield pavement design standards using results from full-scale testing programs and other industry research.44 Enhancements to the design software continue. In 2012 and 2013, the FAA will update the AC to address recycled material design criteria and new aircraft main gear with 8- and 10-wheel arrangements. Two independent airfield pavement research foundations have contributed to airfield pavement knowledge through applied research. The Innovative Pavement Research Foundation (IPRF) (www.iprf.org) is focused primarily on improving rigid concrete airfield pavement performance. The Airfield Asphalt Pavement Technology Program (AAPTP) (www.aaptp.us) focuses on improving the quality of hot mix asphalt pavements. Collaborative efforts between IPRF and 42 Runway pavement condition data was not available for NPIAS airports in 1986. 43 Congress authorized pavement maintenance at nonhub airports under Sections 47102(3)(H) and 47105(e) of title 49 USC. 44 The AC and design programs are available online at: http://www.faa.gov/airports/resources/advisory_circulars/index.cfm/go/document.information/documentNumber/150_5320-6E.

44 National Plan of Integrated Airport Systems (2013-2017)
AAPTP resulted in improved understanding of airport pavement marking practices and life cycle cost analysis and contributed directly to improvements in FAA guidance. Other research is conducted through FAA-funded Centers of Excellence located throughout the United States (www.faa.gov/go/coe).
SURFACE ACCESSIBILITY (LIVABLE COMMUNITIES/ECONOMIC COMPETITIVENESS)
Airports are generally located to make air transportation as convenient and accessible as possible. The 2000 Census, extrapolated to 2011, reveals that almost every American resides within 20 miles of a NPIAS airport. Commercial service airports are within 20 miles of 63 percent of the population (77 percent when reliever airports are included). When general aviation airports are also included, 98 percent of the population lives within 20 miles of a NPIAS airport. Of the current total U.S. population of 311.9 million people, all but 6.5 million (2 percent) live within 20 miles of a NPIAS airport. An important component of the DOT livability initiative is to enhance transportation choices for users. Providing public transportation to airports is a means of meeting this goal. Statistics for major airports in the United States indicate an important, but limited, role of public transportation in airport access. Data collected in 200745 indicates that 35 percent of commercial service airports are served by another scheduled public transportation mode, predominately transit bus (city-wide or metropolitan area buses). Increasingly, commercial service airports are linked with public rail services. Table 4 provides a list of these U.S. airports and the type of rail service. Nationwide, air and rail are linked at 27 busy airports, including 5 airports served by more than one rail mode. In November 2011, a commuter rail connection opened at Theodore Francis Green State Airport. Current plans include the extension of rail to Salt Lake City (2015 opening), Denver International (2016 opening), Washington-Dulles International (2014 opening), and Honolulu International (design underway but no opening date released). This will reduce travel time by providing direct links to the airport and reduce traffic delays incurred by automobiles and buses. Airports are eligible to fund the dedicated on-airport portions of transit links through PFCs. 45 Bureau of Transportation Statistics, U.S. Department of Transportation, Special Report, Making Connections: Intermodal Links in the Public Transportation System, September 2007. See http://www.bts.gov/publications/special_reports_and_issue_briefs/.

National Plan of Integrated Airport Systems (2013-2017) 45
Table 4: Airports Served by Rail*
Anchorage Intercity (Amtrak)
Atlanta Heavy Rail
Boston Heavy Rail
Chicago O’Hare Commuter and Heavy Rail
Chicago Midway Heavy Rail
Cleveland Heavy Rail
Dallas-Ft. Worth Commuter Rail
Dallas Love Commuter Rail
Ft. Lauderdale Commuter Rail
Los Angeles Light Rail
Burbank-Glendale-Pasadena Intercity and Commuter Rail
Miami Commuter and Heavy Rail
Minneapolis-St. Paul Light Rail
Milwaukee Mitchell Intercity (Amtrak)
New York JFK Heavy Rail
New York Newark Intercity and Commuter
Philadelphia Commuter Rail
Phoenix Light Rail
Portland Light Rail
Theodore Francis Green State Airport Commuter Rail
San Francisco Heavy Rail
Oakland Intercity
Seattle-Tacoma Light Rail
South Bend Commuter Rail
St. Louis Lambert Light Rail
Baltimore-Washington Intercity, Commuter and Light Rail
Washington National Heavy Rail
*Some direct rail connections require a bus, people mover or other connection to the airport.
The link between the airport and surface/ground transportation modes is important. Airports must always be considered critical elements of the total transportation system. The FAA developed the document Best Practices–Surface Access to Airports to assist airport sponsors in planning and developing effective surface transportation to airports including public transportation.46 This document links to the following ground transportation planning documents: Intermodal Ground Access to Airports: A Planning Guide, Improving Public Transportation Access to Large Airports, and Strategies for Improving Public Transportation Access to Large Airports. The recently completed ACRP report, Airport Curbside and Terminal Area Roadway Operations, provides modeling tools to assist airports in planning for terminal curb and access roadway capacity enhancements based upon a level of service concept.
46 Best Practices-Surface Access to Airports issued in 2006 is available online at: http://www.faa.gov/airports/resources/publications/reports/media/bulletin_1_surface_access_best_practices.pdf.

46 National Plan of Integrated Airport Systems (2013-2017)
The High-Speed Intercity Passenger Rail Program launched in 2009 calls for a collaborative effort among the Federal Government, States, railroads, and other key stakeholders to help transform America’s transportation system through the creation of a national network of high-speed rail corridors. To meet this objective, the Federal Railroad Administration has solicited applications for more than $10 billion in grant funding made available through the American Recovery and Reinvestment Act and annual appropriations for FYs 2009 and 2010. To date, 39 states, the District of Columbia, and Amtrak have submitted applications requesting more than $75 billion—well in excess of the available funding— for projects and corridors in every region of the country. For aviation, high speed rail has the potential to offer travelers’ options of travel in high density corridors that may help relieve congestion at capacity-constrained airports. High-speed rail could expand destination choices with reduced travel times in comparison to bus or automobile service. Each of these benefits meets the goals of the DOT Livability Initiative.
ACRP has initiated a related project, ACRP 03-23: Integrating Aviation and Passenger Rail Planning. The objectives of this research are to (1) provide guidance to airport and rail operators, State and regional transportation planners, elected officials, and interested stakeholders that identifies planning process options, funding challenges, and potential actions; and (2) develop methods and tools necessary to improve integration of rail services with airports, particularly in congested corridors. The study is expected to be completed in September 2012. FINANCIAL PERFORMANCE (ECONOMIC COMPETITIVENESS)
An understanding of airport finance is essential to the formulation of a national aviation funding policy. Because NPIAS airports are owned and operated by thousands of State and local agencies, it is difficult to compile comprehensive data on the financial operations of all 3,330 existing NPIAS airports. However, the FAA requires commercial service airports, typically about 500 of the NPIAS airports, to report financial data annually, including revenue and expense information. Since the remaining 2,800 NPIAS airports, mostly general aviation, are not required to report financial information, there is limited financial data available for general aviation airports. The FAA uses data provided by the commercial service airports on FAA Form 5100-127, Operating and Financial Summary, for each fiscal year to evaluate the financial performance of the airports. In April 2010, the FAA completed modifications to FAA Form 5100-127 for use in reporting financial information beginning with FY 2009 data. These changes included the following: Added two categories of aeronautical revenue to distinguish between passenger and cargo; Provided for beginning and ending balances for net assets; Added a new section called Operating Statistics; and Removed Unrestricted Net Assets and replaced it with Unrestricted Cash and Investments.

National Plan of Integrated Airport Systems (2013-2017) 47
Total airport revenues for 515 commercial service airports47 were reported to be just over $22 billion in 2010. Total airport operating revenue, which includes both aeronautical and nonaeronautical revenue, totaled $16 billion (73 percent). Aeronautical operating revenue includes revenue from landing fees; rent from terminals, hangars, and tie downs; fuel sales, and other fees; it accounted for $8.6 billion (39 percent). Nonaeronautical operating revenue includes fees from parking and rental car operations, concessions, and retail operations; it accounted for $7.4 billion (34 percent). Nonoperating revenue from interest, grants, and passenger facility fees totaled $6 billion (27 percent), which includes $2.6 billion from PFCs, $2.7 billion from grants, and $380 million in interest income. PFC revenue is approximately 14 percent of large hub airport revenue, 12 percent of medium hub airport revenue, and 9 percent of revenues at small hub airports. Detailed information on Federal grants can be obtained from the FAA’s annual reports.48 The costs of airport operations and maintenance are a function of the age of the facilities and the nature of airline activity and other operations. Total expenses for the airports reporting financial information were estimated to be $13.7 billion, with $10.5 billion in operating expenses (77 percent) and $3.2 billion in nonoperating expenses (24 percent). There is considerable variation in net income by hub type and year with large hubs accounting for 47 percent of the net income reported in 2010. There is also variation in revenue sources and expenditures among airports. For example, concessions, rental car, and parking revenues are 27 percent of total revenues for large hub airports, 31 percent of revenues for medium hub airports, 29 percent for small hub airports, and 11 percent for nonhub primary and nonprimary commercial service airports. Table 5 provides a summary of 2010 revenue and expenses by hub type.
47Airport classification for fiscal year financial filing is based on the passenger activity in the preceding calendar year; i.e., an airport classified as commercial service in CY 2007 must file a report for its 2008 fiscal year. 48 AIP annual reports are available online at: http://www.faa.gov/airports/aip/grant_histories/.

48 National Plan of Integrated Airport Systems (2013-2017)
Table 5: Airport Operating and Financial Summary 2010 ($ millions)
Category 29 37 72 371 515
Large Hub Medium Hub Small Hub Nonhub Total
Aeronautical Operating Revenue
Aeronautical Operating Revenue
Landing Fees $2,244 $606 $183 $78 $3,111
Terminal Rents $2,897 $644 $248 $84 $3,873
Cargo and Hangar Rentals $339 $94 $57 $64 $554
Fixed-Base Operator Revenue $83 $38 $38 $39 $198
Apron Charges/Tie Downs $66 $43 $22 $7 $138
Fuel Sales and Taxes $122 $43 $33 $69 $267
Other Aeronautical Fees $333 $80 $30 $58 $501
Total Aeronautical Operating Revenue $6,084 $1,548 $611 $399 $8,642
Nonaeronautical Operating Revenue
Parking and Rental Car $2,531 $1,052 $550 $173 $4,306
Concessions $800 $158 $54 $14 $1,026
Terminal Rents $244 $29 $25 $8 $306
Land Rental and Nonterminal $244 $88 $93 $108 $533
Other Nonaeronautical Fees $1,074 $93 $63 $41 $1,271
Total Nonaeronautical Operating Revenue $4,893 $1,420 $785 $344 $7,442
Nonoperating Revenue
Passenger Facility Charges $1,914 $479 $187 $72 $2,652
Grant Receipts $627 $508 $520 $1,040 $2,695
Interest $277 $66 $20 $17 $380
Other $0 $229 $15 $76 $320
Total Nonoperating Revenue $2,818 $1,282 $742 $1,205 $6,047
TOTAL REVENUE $13,795 $4,250 $2,138 $1,948 $22,131
Operating Expenses
Personnel Compensation and Benefits $2,684 $802 $469 $346 $4,301
Contractual Services $2,245 $624 $245 $163 $3,277
Communications and Utilities $648 $185 $99 $67 $999
Supplies and Materials $263 $91 $68 $63 $485
Insurance, Claims, and Settlements $155 $43 $28 $24 $250
Other $831 $172 $102 $88 $1,193
Total Operating Expenses $6,826 $1,917 $1,011 $751 $10,505
Nonoperating Expenses
Interest Expense $2,321 $529 $179 $74 $3,103
Other $35 $13 $0 $50 $98
Total Nonoperating Expenses $2,356 $542 $179 $124 $3,201
TOTAL EXPENSES $9,182 $2,459 $1,190 $875 $13,706
Depreciation $3,170 $1,135 $601 $448 $5,354
NET INCOME $1,443 $656 $347 $625 $3,071
Other Information
Capital Expenditures $6,261 $2,224 $945 $1,435 $10,865
Bond Proceeds $8,722 $1,319 $604 $161 $10,806
Sale of Property, Contributed Capital, Other $338 $4 $7 $4 $353
Reporting Year Debt Payments $13,735 $1,934 $598 $245 $16,512
Indebtedness at End of Year $62,062 $13,551 $3,902 $1,782 $81,297
Source: Data collected by the FAA on FAA Form 5100-127 (Operating and Financial Summary) for fiscal years ending in 2010. Compliance Activity Tracking System, http://cats.airports.faa.gov/. Numbers may not add exactly due to rounding.

National Plan of Integrated Airport Systems (2013-2017) 49
The financial status of the Nation’s air carrier airports is stable with airports carefully managing operating, financing, and capital expenses. Airports are moving to shorter-term airline lease agreements in order to more efficiently control their assets and provide opportunities for competitive airline service. Airline lease agreements provide a measure of service and revenue stability. Airports have the ability to diversify and maximize revenue from concessions and other assets allowing greater revenue diversity and growth. Between 2002 and 2010, the total airport revenue and expenses reported for commercial service airports increased. However, airport revenue increased 35 percent and expenses increased 44 percent from 2002 to 2010. This disparity has led many airports in virtually every category to seek opportunities to increase nonaeronautical revenues. Commercial service airports have several sources to fund airport development projects, including Federal/State/local grants, bond proceeds, PFCs, airport-generated funds (landing and terminal fees and parking and concessions revenues), and tenant and third-party financing. A majority of the development projects at major U.S. airports are funded through the capital markets, most commonly through airport revenue bonds. Bond ratings range from B at the low end to AA at the high end. Airports with more economic and financial strength and diversity tend to achieve higher ratings, while smaller airports tend to be rated lower. Capital markets evaluate the creditworthiness of an airport based on several factors. These factors include the demand for air service in the region, the type of passenger demand (originating versus transferring), the number of commercial airports in the region, and the quantity and quality of service provided by the airlines. The overall creditworthiness of U.S. airports as a group remains strong. However, continuing fuel price volatility could force airlines to further reduce capacity which affects airports indirectly. Large and medium hubs typically have had strong credit ratings, and this is not expected to change in 2012. Nonhub primary and nonprimary commercial service airports have limited incomes and generally do not have robust operating surpluses to repay borrowed funds. As a result, small airports tend to rely more heavily on grants than larger airports to finance capital improvements.

50 National Plan of Integrated Airport Systems (2013-2017)
This page intentionally left blank

National Plan of Integrated Airport Systems (2013-2017) 51
CHAPTER 3: AVIATION FORECASTS OVERVIEW
There are several major factors that impact airport development requirements. One of the largest factors affecting airport facility requirements and the future pattern of capital investment is the demand for air transportation. The FAA uses a comprehensive process to guide future airfield development. It includes airport master planning, FAA airspace studies, environmental analysis and documentation, airfield modeling, and delay analysis, as well as benefit-cost analyses for larger capacity projects. Airfield simulation models are employed to estimate the level of delay associated with current and forecast operations for both the existing airfield and for planned improvements. Forecasts of future levels of aviation activity, which typically are part of an airport master plan, are the basis for airport planning decisions. These projections are used to determine the need and timing for new or expanded facilities. The FAA issues an annual forecast which is a top-down forecast for aviation activity in the United States for the next 20 years. The national forecast examines current commercial operations (passenger and cargo) and general aviation as well as emerging aircraft operations (e.g., fractional ownership, very light jets, light-sport aircraft, and unmanned aircraft systems) and projects current trends. The information contained in the Activity Forecasts section below is from the national forecast. The FAA also develops a bottom-up forecast, known as the Terminal Area Forecast (TAF).49 The TAF is the FAA’s forecast of aviation activity for all the existing NPIAS airports. These forecasts are prepared to meet the budget and planning needs of the FAA and provide information for use by State and local authorities, the aviation industry, and the public. ACTIVITY FORECASTS50
Commercial Aviation
The FAA projects aviation will continue to grow over the long term, despite tough economic times. Since 2000, several major events have led to reduced demand for air travel. These shocks include the terror attacks of September 11, skyrocketing prices for fuel, debt restructuring in Europe and the United States, and a global recession. In response to this period of extreme volatility, air carriers have fine-tuned their business models with the aim of minimizing financial losses by lowering operating costs, eliminating unprofitable routes
49 The Terminal Area Forecast is available online at: https://aspm.faa.gov/main/taf.asp 50 Source: FAA Aerospace Forecasts, FY 2012-2032, issued in March 2012. See http://www.faa.gov/about/office_org/headquarters_offices/apl/aviation_forecasts/aerospace_forecasts/2012-2032/.

52 National Plan of Integrated Airport Systems (2013-2017)
and grounding older, less fuel efficient aircraft. To increase operating revenues, carriers have initiated new services that customers are willing to purchase. Carriers have also started charging separately for services that were historically bundled in the price of a ticket. The capacity discipline exhibited by carriers and their focus on additional revenue streams bolstered the industry to profitability in 2011 for the second consecutive year. Going into the next decade, there is cautious optimism that the industry has moved from a boom-to-bust model to one of sustainable profits. The FAA now forecasts one billion passengers will be flown in 2024. Growth over the next 5 years will be moderate, with a return to historic levels of growth attainable only in the long term. This delayed trajectory represents the downward adjustments of the overall economy, here in the U.S. and abroad, and the aviation sector’s responses. One of the many factors influencing the delayed recovery is the uncertainty that surrounds the U.S. and European economies. Profitability for U.S. carriers will hinge on a stable environment for fuel prices, an increase in demand for corporate air travel, the ability to pass along fare increases to leisure travelers, and the continued generation of ancillary revenues. To navigate this volatile operating environment, mainline carriers will continue to drive down costs by better matching flight frequencies and/or aircraft gauge with demand, and/or grounding older aircraft, along with pressuring regional affiliates to accept lower fees for contract flying. In 2011, system revenue passenger miles increased 3.5 percent as enplanements increased 2.5 percent. Commercial air carrier domestic enplanements were up 2.3 percent while international enplanements were up 4.4 percent. The system-wide load factor continued to rise to 82.0 percent (up 0.1 points from 2010). Domestic enplanement market share continued to rise for low-cost carriers in 2011, while network and “other” carrier and regional carrier share decreased. Domestic low cost carrier enplanement shares increased by 1.1 points to 28.4 percent, while the share of network and “other” carriers fell by 0.4 points to 46.8 percent and regional carrier share dropped by 0.6 points to 24.8 percent. Table 6 summarizes commercial aviation over the 20-year forecast period. International enplanements are forecast to grow at a slightly higher rate than domestic enplanements. Aircraft operations are expected to grow 1 percent per year.

National Plan of Integrated Airport Systems (2013-2017) 53
Table 6: U.S. Aviation Activity Forecasts
FY20111 FY2032 Annual Growth
Enplanements (millions)
Domestic 649.9 1,044.1 2.3%
International 80.8 188.8 4.1%
Total 730.7 1,233.0 2.5%
Aircraft Operations (thousands) 2
Air Carrier 12,866.0 19,489.7 2.0%
Commuter/Air Taxi 9,278.5 12,742.3 1.5%
General Aviation 25,964.9 27,765.4 0.3%
Military 2,603.3 2,629.8 0.0%
Total 50,739.8 62,627.2 1.0%
Air Cargo Revenue Ton Miles (millions)
Domestic 12,048.4 16,904.8 1.6%
International 25,208.3 84,900.4 6.0%
Total 37,251.7 101,805.2 4.9%
Active Aircraft
Piston-Powered 154,370 149,690 -0.1%
Turbine-Powered 21,190 38,380 2.9%
Rotorcraft 10,410 18,255 2.7%
Light-Sport 6,645 10,195 2.1%
Experimental/Other 29,905 36,685 1.1%
Total 222,520 253,205 0.6% Source: FAA Aerospace Forecasts, FY 2012-2032, issued in March 2012. See http://www.faa.gov/about/office_org/headquarters_offices/apl/aviation_forecasts/aerospace_forecasts/2012-2032/ 1 Estimated
2 At 512 FAA and Contract Towers.
Cargo
Air cargo, domestic and international freight/express and mail, is moved in the bellies of passenger aircraft and in dedicated all-cargo aircraft. Cargo carriers face price competition from alternative shipping modes such as trucks, container ships, and rail cars. Air cargo is very important to the U.S. economy, as illustrated by the fact that 31 percent of exports and 23 percent of imports measured by value in 2010 were shipped by air (see Figure 4).51 The importance of cargo and the export of goods is illustrated in the National Export Initiative (NEI) established by the President52 to enhance and coordinate Federal efforts to facilitate the creation of jobs in the United States through the promotion of exports. This initiative will improve conditions that directly affect the private sector’s ability to export by working to remove trade barriers abroad, by helping firms overcome the hurdles to entering new export markets, by assisting with financing, and by pursuing a Government-wide approach to export advocacy abroad. For more information on this important national initiative, please visit http://export.gov/.
51 Compiled by U.S. Department of Transportation, Research and Innovative Technology Administration, Bureau of Transportation Statistics, Pocket Guide to Transportation, 2012. 52 Executive Order 13534, National Export Initiative, was issued on March 10, 2010. See http://www.archives.gov/federal-register/executive-orders/2010.html

54 National Plan of Integrated Airport Systems (2013-2017)
Figure 4: Value of U.S. International Merchandise Exported and Imported by Mode 2010
Air transportation is the preferred mode for the shipment of high-value, lightweight, and perishable goods.53 In 2010, 7 of the 20 busiest international freight gateways (includes water ports, land ports, and airports) by value of shipment were airports. Lower shipping costs and more frequent service have made air cargo a major factor in the way global business is conducted. Air cargo is generally concentrated at busy commercial service airports. Air cargo flights usually occur during off-peak periods and do not substantially contribute to airport congestion and delay problems. The principal need for airport development to support cargo operations is related to cargo sorting and transfer facilities developed by the package express carriers. These airports must have high-capacity, all-weather runway systems to support reliable operations. The introduction of new large aircraft, such as the Airbus A380 and Boeing 747-8, in cargo service may demand facility improvements due to their size and weight capacities. Improvements may also be warranted at selected airports, such as John F. Kennedy, Los Angeles, Chicago O’Hare, San Francisco, Dallas-Fort Worth, Anchorage, Atlanta, and Miami to keep pace with rapid growth in international air cargo. General Aviation
The FAA forecasts the fleet54 and hours flown for single-engine piston aircraft, multiengine piston, turboprops, turbojets, piston and turbine-powered rotorcraft, light-sport, experimental, and other (which consists of gliders and lighter than air vehicles). The U.S. general aviation manufacturing sector continued to decline in CY 2011, although at a slower rate. Piston aircraft shipments by U.S. manufacturers decreased approximately 10.5 percent and turbine aircraft shipments (turboprop and business jets) by U.S. manufacturers declined 7.0 percent from CY 2010 to CY 2011. While continuing decreases in U.S. shipments reflected the fragile nature of the economic recovery, the pace of the decline has slowed. Along with the fall in shipments, general aviation activity at the FAA and contract tower airports fell 2.3 percent in 2011. While the signs of a slow economic recovery have been observed, difficulties in the general aviation industry continued in 2011. Based on figures released by the General Aviation Manufacturers
53 Air cargo accounts for less than 1 percent of imports and exports by weight. 54 The FAA forecasts active aircraft only. An active aircraft is one that flies at least 1 hour during the year.

National Plan of Integrated Airport Systems (2013-2017) 55
Association (GAMA),55 U.S. manufacturers of general aviation aircraft delivered an estimated 1,215 aircraft in CY 2011, 8.9 percent fewer than CY 2010. This translates into a fourth consecutive year of decline in shipments, although at a slower rate. Overall piston deliveries declined 10.5 percent, with single-engine deliveries down 9.1 percent and the much smaller multiengine category down 23.9 percent. In the turbine categories, turbojet deliveries were only slightly lower than that of last year, by 2.7 percent, while turboprops were down an estimated 13.8 percent. U.S. billings in CY 2011 are estimated to have totaled $8.4 billion, up 6.7 percent compared with 2010. Fractional Ownership
An important factor in business jet operations is fractionally owned aircraft. The concept of fractional ownership is where corporations or individuals purchase an interest in an aircraft (which can be as little as one sixteenth) and pay a fixed fee for operations and maintenance. Delivery of aircraft for these programs flourished until 2009. The recession has impacted the number of fractional share owners and aircraft. In 2011, the number of share owners and aircraft decreased for the third year. Table 7 summarizes fractional shares and number of aircraft between 1986 and 2011.
Table 7: Fractional Shares and Number of Aircraft in Use
Year Number
of Shares Number
of Aircraft
1998 1,551
1999 2,607
2000 3,834
2001 3,415 696
2002 4,098 776
2003 4,516 826
2004 4,765 865
2005 4,691 949
2006 4,863 984
2007 5,168 1,030
2008 5,179 1,094
2009 4,881 1,037
2010 4,862 1,027
2011 4,677 920 Source: GAMA
Very Light Jets or Microjets
Delivery of smaller affordable business jets (also referred to as very light jets, VLJs or microjets) began in 2007. VLJs are able to operate at smaller airports with shorter runways (runway lengths of 3,000 to 3,500 feet), thereby improving access to the national airspace system for rural areas and less-populated urban areas. However, VLJs used in air taxi service may require longer runway lengths due to title 14 CFR, part 135, requirements. The lower acquisition and operating costs of VLJs were believed at one time to have the potential to revolutionize the business jet market, particularly by being able to sustain a true on-demand air taxi service.
55 GAMA data is available online at http://www.speednews.com/DataList.aspx?tagId=5&name=GAMA+Deliveries.

56 National Plan of Integrated Airport Systems (2013-2017)
While initial forecasts called for over 400 aircraft to be delivered a year, events such as the recession along with the bankruptcy of Eclipse Aviation56 (a significant manufacturer) and DayJet (the largest on-demand air taxi service) have led the FAA to temper more recent forecasts. The worldwide delivery of VLJs in 2010 held up relatively well compared to the turbine jet market as a whole, helped in large part by the introduction of Embraer’s Phenom 100. Despite that, the impacts of the recession have led to dampened expectations. Light-Sport Aircraft
The final rule for sport aircraft, which went into effect on September 1, 2004, establishes new light-sport aircraft categories and allows aircraft manufacturers to build and sell completed aircraft without obtaining type and production certificates. Instead, aircraft manufacturers will build to industry consensus standards. This reduces development costs and subsequent aircraft acquisition costs. This new category places specific conditions on the design of the aircraft to limit them to “slow (less than 120 knots maximum) and simple” performance aircraft. New pilot training times are reduced and offer more flexibility in the type of aircraft the pilot would be allowed to operate. Viewed by many within the general aviation industry as a revolutionary change in the regulation of recreational aircraft, this rule is anticipated to significantly increase access to general aviation. At the end of 2010, there were an estimated 6,528 active light-sport aircraft. The FAA assumes about a 3-percent annual growth of the fleet until 2013. Thereafter, the rate of increase in the fleet is expected to slow to about 2 percent per year. By 2032, a total of 10,195 light sport aircraft are projected to be in the fleet. Unmanned Aircraft Systems
Unmanned Aircraft Systems (UASs) have historically supported military and security operations. However, interest in civil uses (e.g., aerial mapping, crop monitoring, communications, and commercial photography) is growing. The FAA’s main concern about UAS operations in U.S. airspace is safety—ensuring that UASs do not endanger current users or compromise the safety of persons or property on the ground. UASs come in a variety of shapes and sizes and serve many purposes. Some have wingspans as large as a Boeing 737 and some are smaller than a radio controlled model airplane. UAS have changed from remotely piloted vehicles with limited capabilities to semi- and fully autonomous vehicles with expanded potential commercial applications. In the United States alone, over 50 companies, universities, and government organizations are developing and producing some 155 unmanned aircraft designs. Projected annual growth is estimated at 12 percent for the UAS military market, with $94 billion in total UAS spending over the next 10 years. To address the increasing civil market and the desire by civilian operators to fly UASs, the FAA is developing new policies, procedures, and approval processes. The FAA is working closely with stakeholders in the UAS community to define operational and certification requirements. Increasing the use of UAS in the national airspace system also raises privacy concerns and the FAA recognizes that this issue needs to be addressed to integrate UAS more broadly into the airspace. 56 In June 2012, Eclipse Aerospace (i.e., purchased Eclipse Aviation assets) announced they would begin manufacturing Eclipse 550 VLJs, with deliveries to begin in mid-2013.

National Plan of Integrated Airport Systems (2013-2017) 57
Commercial Spaceports
The FAA’s Office of Commercial Space Transportation (AST) licenses and regulates U.S. commercial space launch activity, including launch vehicles, launch sites co-located with Federal installations, and non-Federal launch sites.57 AST’s mission is to license and regulate commercial space launch and reentry operations and launch sites to protect public health and safety, the safety of property, and the national security interests of the United States. Commercial space transportation generally consists of the launch of payloads or human participants into orbit for either commercial or government customers by private, nongovernment entities called launch services providers. Commercial space transportation also covers suborbital launches, where a vehicle containing a payload or human participants is launched on a trajectory that briefly goes into space but returns to Earth without going into orbit. AST also regulates the planned reentry of objects from space to Earth. Vehicles are launched from licensed locations, referred to as commercial spaceports. There were four FAA-licensed launches in 2010, down from 11 in 2008. In May 2011, the FAA and the Commercial Space Transportation Advisory Committee (COMSTAC) published their annual global forecast for commercial launch demand, the 2011 Commercial Space Transportation Forecasts. An average of 28.6 worldwide commercial space launches is forecast each year through 2020. Eight commercial spaceports—located in six states (Alaska, California, New Mexico, Oklahoma, Virginia, and Florida)—have FAA launch site operator licenses. At this time, three spaceport locations (Mojave Air and Spaceport, California; Clinton-Sherman Oklahoma Spaceport, Oklahoma; and Cecil Field Spaceport, Florida) are co-located with public-use NPIAS airports. Future consideration will be given to utilizing other NPIAS airports as spaceports through established application procedures. These airports have co-located facilities that accommodate both aviation and space operations, particularly space operations involving horizontally launched reusable vehicles. The FAA will continue to work with the space and aviation industries to identify spaceport locations and develop standards to ensure joint air and space operations are conducted in a safe, efficient, and environmentally responsible manner for all users of the national airspace system. IMPLICATIONS OF FORECASTED ACTIVITY ON AIRPORTS
The FAA’s aviation forecast predicts the industry will grow from 731 million passengers in 2011 to 1.2 billion in 2032. Cumulatively, air traffic growth for U.S. carriers measured by revenue passenger miles is expected to rise by more than 90 percent in the next 20 years. Airport tower operations are expected to increase by 23 percent. Also, the number of aircraft handled at FAA enroute centers is expected to increase by 50 percent.
57 Authorized by Executive Order 12465 and title 51 USC, subtitle V, chapter 509 (the Commercial Space Launch Act of 1984 as amended).

58 National Plan of Integrated Airport Systems (2013-2017)
The average size of domestic aircraft58 is expected to increase by 0.2 seats in FY 2012 to 122.8 seats. Average seats per aircraft for mainline carriers are projected to stay relatively flat as network carriers continue to reconfigure their domestic fleets. While demand for 70- to 90-seat aircraft continues to increase, we expect the number of 50-seat regional jets in service to fall, increasing the average regional aircraft size in 2012 by 0.5 seats to 56.8 seats per mile. Passenger trip length in domestic markets will decrease by 1.3 miles during the same period. Although the slow growth and expectations of a European recession has dampened the near-term prospects for general aviation, the long-term outlook remains favorable. We anticipate growth in business aviation demand, especially in the turbo jet and turbine rotorcraft markets, driven over the long term by growing U.S. and world economies. As the fleet grows, the number of general aviation hours flown is projected to increase an average of 1.7 percent a year through 2032. A substantial increase in aircraft operations at the busiest airports may warrant development of additional runways by airport operators. The increases in regional aircraft used to increase frequency and better match capacity may impact capacity even as total passengers carried grows at a slower rate. This is due to the number of operations by aircraft in the 70- to100-seat range that transport fewer passengers, yet still require the same runway access in the peak period as larger aircraft with more seating capacity. The planning and environmental review processes, which must be completed before a new runway can be built, generally take many years to complete and are often controversial. Airlines select airports as major stations, hubs, and/or international gateways for many reasons, including their potential for expansion as well as underlying demand and many other factors. Airport operators are willing to provide adequate runway capacity in order to ensure the airlines continue to operate there, rather than reducing operations in favor of a competing airport. Much of the additional capacity at transfer hubs is intended for use by commuter and regional airline aircraft, which transport passengers from smaller cities within several hundred miles of the hub. This traffic is expected to grow as regional carriers continue to acquire jet aircraft. However, new runways are not always feasible and alternative methods to increase capacity and reduce delays are being explored (see the Capacity section in Chapter 2). OTHER FACTORS IMPACTING AIRPORTS
Capacity is affected not only by the volume of air transportation but also by the way in which airlines and other users operate. The FAA anticipates that airlines will continue to concentrate their schedules at their primary hubs, where large numbers of flights converge in short periods of time to maximize the opportunity for passenger transfers. No additional airline hubs are expected to arise within the next 5 years. Increased point-to-point service, bypassing hubs, is occurring when warranted by market considerations. Low-cost carriers frequently serve major metropolitan areas by using less-congested, secondary commercial service airports where existing facilities are underutilized. In the past, this occurred in communities where the major hub was served by a legacy carrier. More recently, however, 58 Defined as seats per mile flown and computed by dividing available seat miles by miles flown.

National Plan of Integrated Airport Systems (2013-2017) 59
secondary airports are becoming a focus where the major hub is nearing capacity and is served by low-cost carriers. As an example, Phoenix-Mesa Gateway has regularly scheduled air service even though the major hub airport (Phoenix Sky Harbor International Airport) is already served by low-cost carriers. In some cases, however, service has been initiated at major airports. For example, low-cost carriers now operate a significant number of flights at the major airports in Las Vegas, Phoenix, Los Angeles, St. Louis, Philadelphia, Boston, and New York. This trend, in part, reflects a shift by airport operators toward practices that facilitate airline competition, such as preferential-use (vs. exclusive-use) gate leases, short-term (vs. long-term) lease and use agreements, adherence to competitive access assurances that are required when an airport uses PFCs to finance airline gates, and other airport business practices reflected in airport competition plans filed with the Office of the Secretary of Transportation and the FAA by medium and large hub airports that are dominated by one or two airlines. Additionally, low-cost carriers serving the New York-area slot-controlled airports have acquired slots, often through Government facilitation. The globalization of the airline industry, the rapid growth of air transportation in other parts of the world, and the increased range and reduced size of aircraft will combine to bring international passengers to more U.S. airports. The effects will vary but may include requirements for longer runways, terminal building expansion, and provision of Federal inspection facilities for immigration, customs, and agriculture at airports where international traffic is increasing. The increased number of jet aircraft in the general aviation fleet will result in a demand for longer runways at certain general aviation airports, particularly those with substantial use (500 or more annual operations) by business and corporate aircraft. New Large Aircraft
Airports in the United States are continuing to plan and develop new facilities for the next generation of large aircraft. The Airbus A380 (already in service) and the new Boeing 747-8 (entering service in 2012) require special consideration due to their fuselage length, wingspan, and weight. The Airbus 380’s 262-foot wingspan is 37 feet wider than the next largest aircraft, the 80-foot tail height is 16 feet taller than the next tallest aircraft, and the maximum takeoff weight of approximately 1.3 million pounds is 300,000 pounds heavier than the next heaviest aircraft in the fleet. The Boeing 747-8, at 250 feet in length, is 18 feet longer than the Airbus A380. The current distance between parallel taxiways and their runways, the configuration of taxiway systems, and the layout of terminal buildings are affected by the oversized wingspans (A380) and fuselage length (B-747-8). Underlying structures, such as bridges and culverts, will either require reinforcement to accommodate the aircraft’s heavier weight, or taxiing routes to avoid these structures will be needed. Currently, the A380 is being operated by foreign air carriers into five U.S. airports: Los Angeles International, John F. Kennedy International, San Francisco International, Washington Dulles International, and Miami International. Operations into George Bush Houston Intercontinental using the A380 are scheduled to begin in summer 2012. Up to a total of 12 airports could receive A380 service in the future. Freighter versions are also planned and could serve Ted Stevens Anchorage International and Memphis International. The orders for the B-747-8s are skewed toward freighter versions and toward international freight operators. Therefore, the locations for this aircraft will mirror those airports receiving A380 service. More importantly, because its wingspan is smaller

60 National Plan of Integrated Airport Systems (2013-2017)
than the A380, the B-747-8 is projected to operate at 24 U.S. airports in 2012. The FAA has been working with Boeing to ensure these airports will be able to accommodate the aircraft. Several airports are undertaking large modernization projects to improve airfield safety and efficiency and to prepare for projected increases in airplane size and passenger activity. Because airports are continuously upgrading terminals and airfields, it is difficult to determine exactly how much of those costs are solely attributable to accommodating the new large aircraft. Airports planning to receive service by new large aircraft started their preparations and financial planning for necessary improvements several years ago. Until all improvements can be made, the FAA has and will continue to work on a series of procedures and design processes, already in use by Airbus and Boeing, to safely accommodate these aircraft at existing airports. Airport Privatization
Public-use airports in the United States that are owned and operated by a public agency or a government entity such as a county, city, or State government are eligible for participation in the Airport Privatization Pilot Program. Congress established the Pilot Program (Title 49, Section 47134) in 1996 to determine if, once certain economic and legal impediments were removed, privatization could produce alternative sources of capital for airport development and provide benefits, such as improvements in customer service. The FAA Modernization and Reform Act of 2012 expanded the Pilot Program from five to ten airports. However, the requirement that the Pilot Program can include no more than one large hub airport and at least one general aviation airport remained unchanged. Public-owned general aviation airports can be leased or sold; public-owned air carrier airports can only be leased. Currently, three airports are participating in the program: Chicago Midway International (filling the one large hub airport slot): Luis Munoz Marin International in San Juan, Puerto Rico; and Hendry County’s Airglades in Clewiston, Florida. Six slots for the Pilot Program remain available.59 Conversion of Military Surplus Airfields and Civilian Use of Military Airfields
Since 1989, the Base Realignment and Closure (BRAC) Commission has made many military airfields available for conversion to civil aviation use. About 30 surplus military airfields have been converted to civil use by local communities. Most of these military airfields have long runways and associated facilities that can accommodate large civil aircraft. Twelve of the surplus military airfields have become commercial service airports. Two other surplus airfields (Sacramento Mather Airport, California and Rickenbacker International, Ohio) have significant cargo service. The remaining surplus airfields are in areas where additional general aviation airports are needed. Even before the establishment of the BRAC, military officials have cooperated with local communities across the country to provide civilian access to military airport facilities. These local arrangements add capacity to the national airport system and maximize public investment dollars by eliminating the duplication of airport facilities in a community for military and civilian activities. There are approximately 22 military installations that also allow civilian aircraft activity.
59 The application procedures and fact sheet is available online at: http://www.faa.gov/airports/airport_compliance/privatization/.
National Plan of Integrated Airport Systems (2013-2017) 61
The Department of Defense (DoD) has found it advantageous to operate from civilian airfields. Similar to civilian uses on military airfields, military activity at civilian airfields reduces public investments in airport infrastructure by taking advantage of existing civilian airfield capabilities for military purposes. As specified in National Guard Bureau Air National Guard Pamphlet 32-1001, Airport Joint Use Agreements for Military Use of Civilian Airfields, at airports where military units conduct a significant level of activity, DoD enters into an agreement with the local community to pay for costs related to the military use of the airfield. As of 2010, the military has agreements in place with approximately 65 civilian airports. Innovations
Efforts are underway to develop transportation and communication technology that may eventually affect the demand for conventional air transportation. High-speed trains are being demonstrated that could attract more passengers to rail in specific markets, and research is underway into magnetic levitation (maglev) vehicles. Teleconferencing and other electronic communication techniques could affect the demand for business air travel. These innovations may eventually have a significant effect on airport development needs, but this is not expected to occur during the next 5 years.

62 National Plan of Integrated Airport Systems (2013-2017)
This page intentionally left blank

National Plan of Integrated Airport Systems (2013-2017) 63
CHAPTER 4: DEVELOPMENT REQUIREMENTS CAPITAL PLANNING OVERVIEW
The development needed to provide an adequate national system of airports, as shown in this report, is derived from locally prepared airport master plans, airport system plans,60 capital improvement plans (CIPs), and airport inspections. These airport planning documents consider all significant aviation requirements and are also tied to the current use and condition of each airport and the forecast increase in activity. Typically, operators of individual airports prepare airport master plans, usually with the assistance of consultants. The FAA field offices review these plans, which follow a standard outline contained in FAA ACs that link development to current and forecast activity. Plans for major development, such as new runways or runway extensions, tend to be controversial, and the planning process provides interested parties with the opportunity to request a public hearing. Development that is not eligible for Federal AIP funding or not justified by the aviation activity forecast over the next 5 years is screened by FAA planners and is not entered into the NPIAS database. The combination of a planning process that links development to activity, an FAA review that culls out unnecessary and ineligible development, and the discussion of controversial proposals at public hearings results in reasonable and well-documented estimates of future airport project requirements. However, the actual timing and cost of development may vary from the airport master plan. For instance, projects may be deferred or developed in phases in order to reduce immediate costs, or conversely, an unexpected rapid increase in activity may justify accelerating certain development. State system plans are also used as a data source for the NPIAS. The state system plan includes airport locations considered important to State air transportation objectives, as well as those that are of sufficient national interest to be included in the NPIAS. An important function of the State planning process is to identify airports that meet national interest criteria, but which might not be identified as such by the FAA alone. These plans play a part in the development of airport role and condition and performance information. However, aviation system plan recommendations on capital development at individual airports or at a system of airports are usually secondary to master plan information. In these cases, the State or regional system plan identifies broad needs or priorities within its jurisdiction. The FAA encourages airports to consult with airlines and other user groups about major airport investment programs. Airlines have questioned the scope and timing of specific development proposals, including major new airports, ground access projects, and certain terminal and airfield improvements. The NPIAS generally reflects the airport operator’s viewpoint about the scope and schedule for proposed development. If proposals are downsized, rescheduled, or accomplished in phases, development costs could be lower or more protracted.
60 An airport master plan is a detailed, long-term development plan for an individual airport. Airport system plans (regional and State) study the performance and interaction of an entire aviation system to understand the interrelationships among and between individual airports.
64 National Plan of Integrated Airport Systems (2013-2017)
All development projects identified in the NPIAS are eligible for AIP funding; however, the planned development consistently exceeds the funding available from the AIP each year. In allocating AIP funds, the FAA must select projects that advance statutory goals as well as DOT and FAA objectives and enhance the national airport system. Investment decisions are made using structured selection criteria that help identify critical annual development needs within associated AIP funding levels. This annual internal process, known as the Airports Capital Improvement Plan (ACIP), is used by the FAA to select projects for AIP funding. The ACIP allows the FAA to determine and fund the most critical airport development needs within AIP funding limits set by Congress through the appropriation process. This is accomplished through establishing a process that, among other things, considers factors such as an airport’s service level, national priority rating, activity level, and hub status; type of project; and the agency’s goals for greater capacity, increased safety, security, and infrastructure preservation. Using this process the FAA is able to distribute funding made available under the AIP. AIP funding fall into two basic categories: apportioned funds (also known as entitlements) and discretionary funds. Entitlement funds (nearly 70 percent or $2.2 billion of the funding available for grants) are apportioned by formulas contained in statute each year to specific airport sponsors, types of airports, or States. The remaining amount of AIP funding is discretionary funding. The 30 percent remaining is discretionary funding and of that, approximately two-thirds is designated for specific projects or airport types such as airports in the Military Airports Program, noise mitigation and environmental projects. FAA requires benefit-cost analysis (BCA) to demonstrate the merit of capacity projects for which airport sponsors are seeking AIP discretionary funds. BCAs are required for capacity projects exceeding $10 million in Discretionary funds over the life of the project and for projects requesting a Letter of Intent. Executive Order 12893, Principles for Federal Infrastructure Investments, dated January 26, 1994, provided the impetus for the FAA’s Office of Airports to develop its benefit-cost evaluation criteria. The FAA does not require a BCA for other types of AIP projects because the authorizing statute exempts certain projects (such as noise projects) from the BCA process or the underlying value of this type of project has already been subject to economic evaluations required through regulation and Advisory Circulars (ACs The assessment of aviation benefits at airports is challenging due to the variation in operational scope between airport types. Large air carrier airports with substantial activity that frequently experience delays can be evaluated based on the benefits to passengers and aircraft operations of reducing or removing these delays. Standard methodologies and values are readily available for use in these assessments. The FAA has also developed delay propagation multipliers to capture downstream benefits of delay reduction associated with capacity AIP projects at 100 commercial service airports. However, only a small number of airports experience significant levels of congestion and delay. For the majority of airports, other economic benefits must also be assessed. Typically, this is done by assessing the operations of a new aircraft or aircraft class that would be able to use the airport as a result of the project. While a project may be justified operationally by relatively few operations of a new aircraft or class of aircraft, quantification of the associated benefit of these operations is a challenge. In addition, BCA’s cannot consider their mere shift of passengers or operations from one

National Plan of Integrated Airport Systems (2013-2017) 65
airport to another as a benefit to the system. Many benefits will not be realized until a project is completed and commissioned, which may be years after the BCA was completed. In addition, the benefits may be realized over a 20-year period and may vary from forecast results in the BCA for reasons having nothing to do with the quality of the BCA itself. While the FAA relies on BCA results, among other considerations, in making Discretionary funding decisions for capacity projects, BCA results are not generally used to determine a project’s ranking on the AIP Discretionary candidate list. Governing legislation for AIP identifies a number of other factors, such as safety, congestion relief, intermodal connections, quality of the environment, and capacity, for priority consideration. The FAA is exploring the development of methodologies for quantifying these factors in the future. In addition, other projects included in the candidate list are not subject to the BCA requirement. When required, the airport sponsor conducts a BCA using requirements developed by the FAA. The airport sponsor then submits its BCA and supporting documentation to the FAA for review and acceptance. Sometimes it is possible for an airport sponsor to conduct a BCA in conjunction with the development of the Airport Master Plan or environmental study. More typically, the airport sponsor conducts a BCA and submits it to the FAA prior to requesting AIP discretionary funds for the project. In general, a BCA must demonstrate the project’s benefits outweigh its costs before the FAA will consider the project eligible for Discretionary funding. This BCA requirement does not apply to reconstruction projects that do not change the operating characteristics of the airport. In addition to providing a BCA, airport sponsors seeking an LOI—a multiyear commitment of Federal AIP support for airfield project— must meet additional requirements, as discussed in Chapter 7. The FAA does not track the net benefits actually achieved after projects are completed. While projects requiring a BCA cannot be funded until the FAA accepts the BCA, the FAA can still include the project in the ACIP for planning purposes. Since the ACIP is a multiyear planning tool, it is possible for a project needing a BCA to be included in the ACIP for future-year funding consideration. During FY 2011, the FAA’s Office of Airports continued efforts to refine the BCA process with the goal of improving future assessments of the benefits of large-scale AIP projects. The first of these efforts was the completion and publication of the ACRP research project entitled “Effective Practices for Preparing Airport Improvement Benefit-Cost Analyses.” The report was finalized in June 2009 and looked at historical benefit assessment techniques used by airports and other modes in developing BCAs. Airport sponsors can now refer to the best practices found in this research when developing BCAs. The FAA’s Office of Airports has followed the synthesis research report with two additional studies. First, as a follow on to that effort, the FAA’s Office of Airports collaborated with the Office of Aviation Policy and Planning for new research through the ACRP. The ACRP is currently working on a research project entitled “Evaluating the Use of Passenger Air Travel for Capital Investment Planning and Benefit-Cost Analyses,” which will provide additional information for airports to better assess aviation benefits for capital improvement projects.
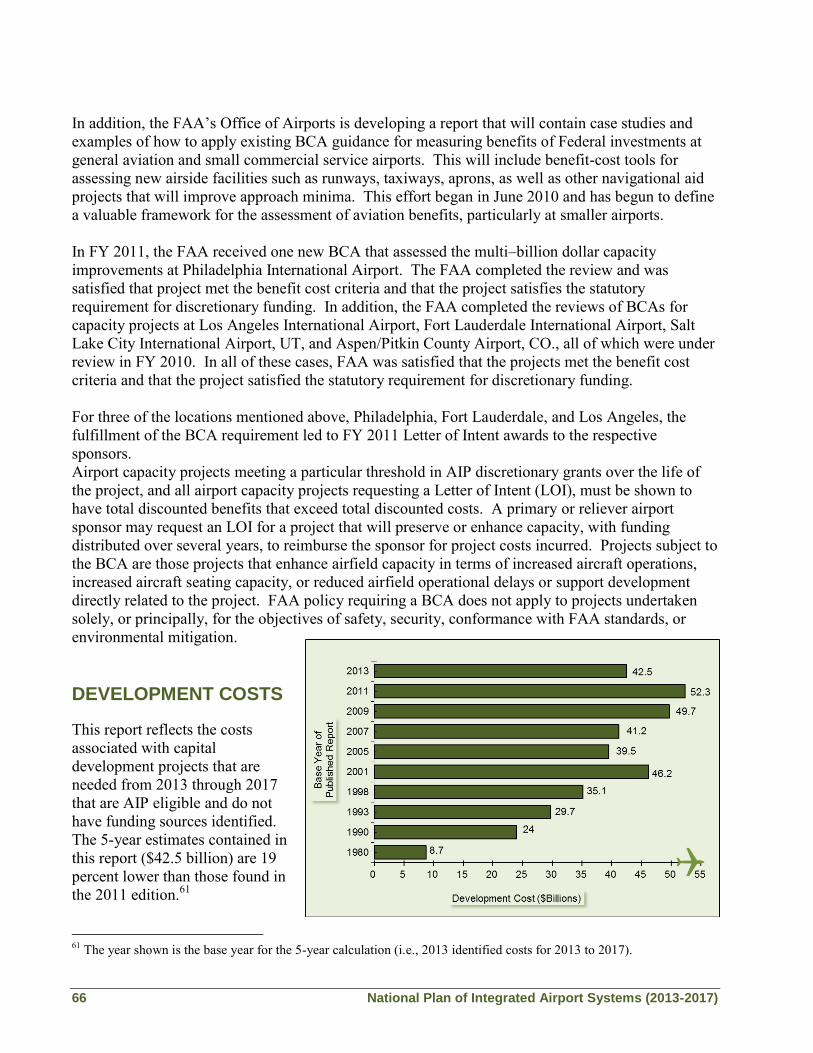
66 National Plan of Integrated Airport Systems (2013-2017)
In addition, the FAA’s Office of Airports is developing a report that will contain case studies and examples of how to apply existing BCA guidance for measuring benefits of Federal investments at general aviation and small commercial service airports. This will include benefit-cost tools for assessing new airside facilities such as runways, taxiways, aprons, as well as other navigational aid projects that will improve approach minima. This effort began in June 2010 and has begun to define a valuable framework for the assessment of aviation benefits, particularly at smaller airports. In FY 2011, the FAA received one new BCA that assessed the multi–billion dollar capacity improvements at Philadelphia International Airport. The FAA completed the review and was satisfied that project met the benefit cost criteria and that the project satisfies the statutory requirement for discretionary funding. In addition, the FAA completed the reviews of BCAs for capacity projects at Los Angeles International Airport, Fort Lauderdale International Airport, Salt Lake City International Airport, UT, and Aspen/Pitkin County Airport, CO., all of which were under review in FY 2010. In all of these cases, FAA was satisfied that the projects met the benefit cost criteria and that the project satisfied the statutory requirement for discretionary funding. For three of the locations mentioned above, Philadelphia, Fort Lauderdale, and Los Angeles, the fulfillment of the BCA requirement led to FY 2011 Letter of Intent awards to the respective sponsors. Airport capacity projects meeting a particular threshold in AIP discretionary grants over the life of the project, and all airport capacity projects requesting a Letter of Intent (LOI), must be shown to have total discounted benefits that exceed total discounted costs. A primary or reliever airport sponsor may request an LOI for a project that will preserve or enhance capacity, with funding distributed over several years, to reimburse the sponsor for project costs incurred. Projects subject to the BCA are those projects that enhance airfield capacity in terms of increased aircraft operations, increased aircraft seating capacity, or reduced airfield operational delays or support development directly related to the project. FAA policy requiring a BCA does not apply to projects undertaken solely, or principally, for the objectives of safety, security, conformance with FAA standards, or environmental mitigation. DEVELOPMENT COSTS
This report reflects the costs associated with capital development projects that are needed from 2013 through 2017 that are AIP eligible and do not have funding sources identified. The 5-year estimates contained in this report ($42.5 billion) are 19 percent lower than those found in the 2011 edition.61 61 The year shown is the base year for the 5-year calculation (i.e., 2013 identified costs for 2013 to 2017).

National Plan of Integrated Airport Systems (2013-2017) 67
This decrease is due to three factors: current economic situation, reduced aviation activity levels, or projects having been completed or funding sources identified. In some cases, a comprehensive review of proposed projects has enabled airport sponsors, State aeronautical agencies, or the FAA to conclude that certain projects will not be needed within the 5-year timeframe of the report. Capital development reflects the economic situation of the communities that own airports and in the last 2 years many communities have deferred projects. Several capacity projects that were planned have been postponed until aviation activity rebounds (e.g., runways at George Bush Intercontinental/Houston, Tucson International, and Palm Beach International). Several development programs were completed or received PFC approval and are therefore no longer included in the NPIAS (e.g., a terminal project at Los Angeles International, a people mover at Fort Lauderdale/Hollywood International, and a terminal project at Norman Mineta San Jose International). Lastly, the FAA undertook a comprehensive review of the 23,000 projects at existing and proposed airports in the NPIAS database resulting in approximately 3,700 projects being adjusted, deferred, or removed. Capital projects are categorized by type of airport and the purpose of the development. There are ten development purposes and seven airport types. Development totals by airport type and purpose are shown in Table 8. Costs associated with planning (master plans, regional and State system plans, and environmental studies) are not reflected in Table 9, Table 10, or Appendix A. For the 5-year period covered by this report, planning costs total $774 million. Medium hub airports account for 61 percent of the total planning cost and general aviation airports account for 17 percent.
Table 8: 2013 – 2017 NPIAS Cost by Airport and Development Category (2012 $ millions)
Development Category
Large Medium Small Nonhub Nonprimary
CS Reliever GA Total Percent
Safety $546 $289 $277 $470 $46 $102 $108 $1,838 4.3%
Security $287 $29 $48 $57 $14 $54 $247 $736 1.7%
Reconstruction $2,571 $1,669 $1,124 $1,435 $276 $920 $2,661 $10,656 25.1%
Standards $622 $792 $1,077 $1,696 $292 $1,499 $5,779 $11,756 27.6%
Environmental $919 $565 $155 $139 $4 $54 $87 $1,923 4.5%
Capacity $8,086 $639 $253 $190 $9 $198 $436 $9,811 23.1%
Terminal $1,583 $536 $522 $718 $17 $63 $132 $3,571 8.4%
Access $293 $511 $101 $150 $10 $82 $227 $1,374 3.2%
Other $35 $26 $32 $50 $3 $23 $101 $270 0.6%
New Airport $0 $0 $0 $0 $0 $0 $0 $610 1.4%
Total $14,941 $5,055 $3,589 $4,906 $670 $2,996 $9,777 $42,545 100%
Percentage 35% 12% 8% 12% 2% 7% 23% 1% 100%
Figure 5 highlights the total development by airport category since 2001. Every category of airport is shown with decreased development needs over the next 5 years. The most significant decreases were at the large and medium hub airports.
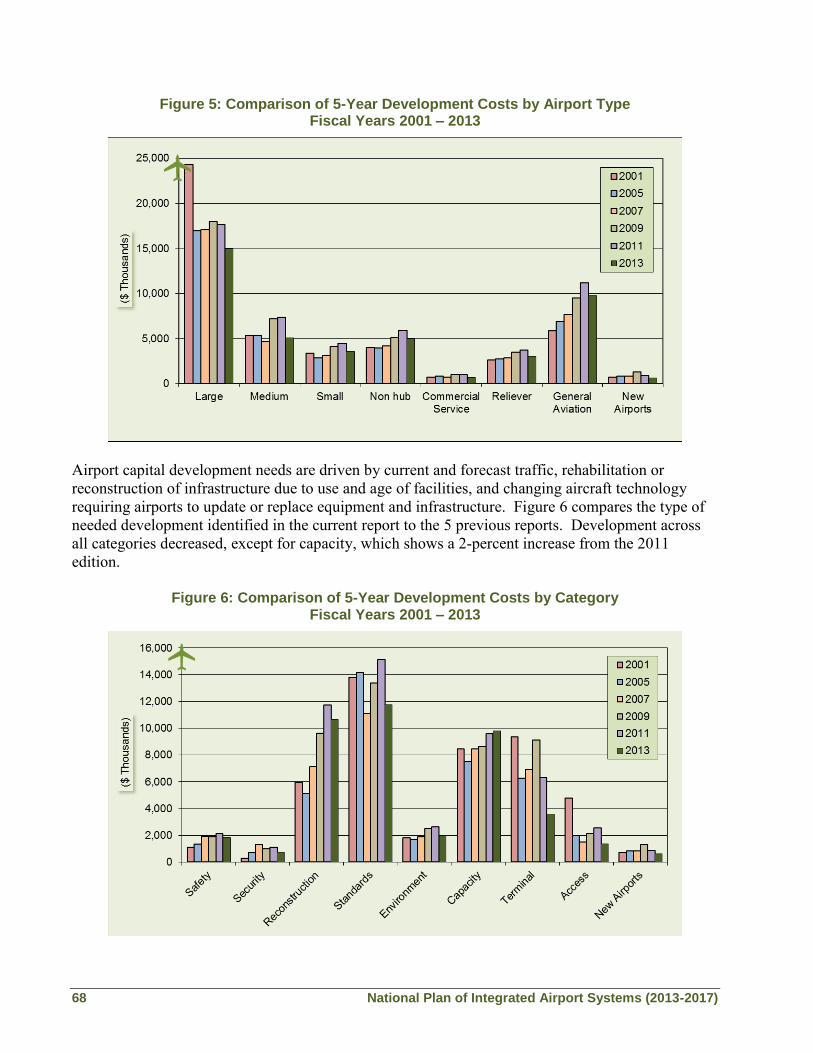
68 National Plan of Integrated Airport Systems (2013-2017)
Figure 5: Comparison of 5-Year Development Costs by Airport Type Fiscal Years 2001 – 2013
Airport capital development needs are driven by current and forecast traffic, rehabilitation or reconstruction of infrastructure due to use and age of facilities, and changing aircraft technology requiring airports to update or replace equipment and infrastructure. Figure 6 compares the type of needed development identified in the current report to the 5 previous reports. Development across all categories decreased, except for capacity, which shows a 2-percent increase from the 2011 edition.
Figure 6: Comparison of 5-Year Development Costs by Category Fiscal Years 2001 – 2013

National Plan of Integrated Airport Systems (2013-2017) 69
For comparison purposes the development requirements contained in the previous edition of the NPIAS (2011–2015) are shown below in Table 9.
Table 9: 2011 – 2015 NPIAS Cost by Airport and Development Category (2010 $ millions)
Development Category
Large Hub
Medium Hub
Small Hub
Nonhub Commercial
Service Reliever GA Total Percent
Safety $586 $265 $214 $642 $89 $78 $226 $2,101 4.0%
Security $540 $104 $33 $70 $13 $73 $259 $1,091 2.1%
Reconstruction $2,800 $1,636 $1,298 $1,762 $289 $1,095 $2,867 $11,748 22.2%
Standards $1,122 $1,381 $1,439 $1,966 $492 $1,989 $6,726 $15,116 28.4%
Environmental $1,404 $649 $222 $180 $7 $68 $104 $2,633 5.0%
Capacity $6,823 $1,288 $313 $278 $41 $312 $517 $9,573 19.5%
Terminal $3,009 $1,473 $793 $787 $37 $53 $163 $6,315 11.9%
Access $1,355 $553 $121 $182 $34 $83 $231 $2,561 4.8%
Other $27 $17 $55 $49 $7 $23 $97 $275 0.5%
New Airport $0 $0 $0 $0 $0 $0 $0 $869 1.6%
Total $17,668 $7,366 $4,489 $5,916 $1,009 $3,734 $11,148 $52,199 100.0%
Percentage 33.8% 14.1% 8.6% 11.3% 1.9% 7.2% 21.4% 1.6%
DEVELOPMENT CATEGORIES
All AIP eligible projects are categorized based on the principle purpose of the development. Listed below are the ten development categories, a short description of each, and some other relevant information. Safety and Security
Safety and security projects include development that is required by Federal regulation, airport certification procedures or design standards, and are intended primarily for the protection of human life. These two categories account for 6 percent ($2.6 billion) of the funding needs identified in the NPIAS. The FAA gives safety and security development the highest priority to ensure rapid implementation and to achieve the highest possible levels of safety and security. Projects included in the safety category include obstruction lighting and removal, acquisition of fire and rescue equipment, and improvements to runway safety areas. Safety development totals $1.8 billion, a decrease of $262 million from the last report. Large hubs account for 30 percent of the safety development.

70 National Plan of Integrated Airport Systems (2013-2017)
Security projects include perimeter fencing, security devices, and other security enhancements. Security development totals $736 million, a decrease of $355 million from the last report. Large hubs have identified security devices and enhancement projects totaling $287 million (39 percent). General aviation airports have identified $247 million (33 percent) in perimeter fencing. Reconstruction
Reconstruction includes development to replace or rehabilitate airport facilities, primarily pavement and lighting systems that have deteriorated due to weather or use and that have reached the end of their useful lives. This category, which accounts for about 25 percent ($10.6 billion) of NPIAS funding needs, includes the rehabilitation of pavement on a 15- to 20-year cycle. This category of development decreased by 9 percent and reflects a drop in reconstruction costs by every type of NPIAS airport. Failure to replace deteriorating pavement increases airport maintenance costs and can result in damage to aircraft propellers and engines, pooling of water and ice deposits, and eventually potholes that can damage landing gear. Airfield lighting cables and fixtures deteriorate with age, resulting in dim and unreliable lighting if they are not replaced. Reconstruction is included in the NPIAS when normal maintenance procedures are no longer economical and effective. Standards
Standards projects include development to bring existing airports up to design criteria recommended by the FAA. This remains the largest development category, accounting for 28 percent ($11.7 billion) of the NPIAS. Many commercial service airports were designed more than 50 years ago to serve relatively small and slow aircraft. They now serve larger and faster turboprop and jet aircraft. As a result,

National Plan of Integrated Airport Systems (2013-2017) 71
runways and taxiways must be relocated to provide greater clearance for aircraft with larger wingspans, and aircraft parking areas must be adapted to accommodate larger aircraft. Standards development at general aviation and reliever airports is generally justified to accommodate a substantial number of operations by a “critical” aircraft with sizes and operating characteristics that were not foreseen at the time of original construction. If this work is not undertaken, aircraft may be required to limit fuel or passenger loads because of inadequate runway length. FAA usually requires an indication that an aircraft type will account for at least 500 annual itinerant operations at an airport before the NPIAS includes development to accommodate it. For airports across the country, the infrastructure requirements needed to implement an approach, such as a LPV using the FAA’s WAAS, have not been independently assessed and, therefore, may not be specifically captured in this report. Aerial surveys are currently underway nationwide to help assess the obstacles that may impact the approach minimums to a particular runway. In addition, ongoing evaluations of airport master plans are occurring, which consider the airport infrastructure, like a parallel taxiway, that may need to be constructed to accommodate an LPV approach. Environment
The environment category includes projects designed to achieve an acceptable balance between airport operational requirements, environmental requirements, and the expectations of residents of the surrounding area for a quiet and clean environment. This development supplements the noise reductions that have been achieved by quieter aircraft and the use of noise abatement flight procedures. This category accounts for almost 5 percent ($1.9 billion) of NPIAS costs and includes the relocation of households and soundproofing of residences and public buildings in noise impacted areas underlying aircraft approach and departure paths. Environmental costs are concentrated at airports with frequent flights by jet aircraft (48 percent large hubs, 29 percent medium hubs, 8 percent small hubs, 7 percent nonhubs, and 7 percent reliever and general aviation airports). This development is part of an extensive Federal and industry program—involving land use planning, quieter aircraft, and noise abatement procedures—that has reduced the estimated number of people exposed to significant noise. Seventy percent ($1.3 billion) is for noise mitigation for residences or public buildings, noise monitoring systems, and

72 National Plan of Integrated Airport Systems (2013-2017)
compensation to property owners for overflights. Thirty percent of the cost is for environmental mitigation, which includes deicing handling and recycling facilities, replacement of impacted wetlands, and specialized equipment to support the Voluntary Airport Low Emissions Program for reducing airport air emissions. Terminal Building
Terminal building costs are incurred for development to accommodate more passengers and different aircraft (small regional jets and new large aircraft). Although this is the fourth largest development category, accounting for 8 percent ($3.6 billion) of the NPIAS costs, terminal costs have decreased 61 percent over the last 4 years. The NPIAS only includes the public use portion of terminals that are eligible for Federal aid (about 50 to 60 percent) and excludes revenue-generating areas62 such as areas that are leased by a single tenant or used by concessions, such as gift shops and restaurants. The development is concentrated at the busiest commercial service airports (44 percent large hubs, 15 percent medium hubs, 15 percent small hubs, and 20 percent nonhubs). Terminal development for all airport types decreased. This reflects the funding of several terminal projects through PFCs, completion of some projects, and the deferral of a few projects beyond 2017. Surface Access
Access includes the portion of airport ground access (highways and transit) that is within the airport property line and eligible for grants under the AIP. The large hubs account for 21 percent (down from $1.3 billion in 2011 to $293 million) and medium hubs account for 37 percent of the access development needs. Surface access currently accounts for 3 percent ($1.4 billion) of the NPIAS costs, down 46 percent from the last report. The FAA currently has research underway to assess the most critical surface access problems identified by airport sponsors. This includes curbside improvements and improving passenger access to the airport terminal from surface transportation facilities. The results of the research will be reported in the next edition of this report. 62 Some smaller public use airports such as nonhub primary airports can use AIP funds for public use areas of a terminal that are revenue-producing.

National Plan of Integrated Airport Systems (2013-2017) 73
Airfield Capacity
Airfield capacity is development that will improve an airport for the primary purpose of reducing delay and/or accommodating more passengers, cargo, aircraft operations, or based aircraft. This is the third largest development category, accounting for 23 percent ($9.8 billion) of the NPIAS, and includes new runway, taxiway, and apron construction and extensions. Development to improve airfield capacity increased 2.5 percent from the last report. The airfield capacity development included in this 5-year plan will help to reduce congestion. However, problems will remain in certain large metropolitan areas such as New York and Los Angeles. The FAA will continue to focus on the need for additional capacity and increased efficiency at those locations. New Airports
New airports are proposed in the NPIAS for communities that generate a substantial demand for air transportation and either do not have an airport or have an airport that cannot be improved to meet minimum standards of safety and efficiency. In addition, new commercial service and general aviation airports are recommended for communities where existing airports are congested and cannot be expanded to meet the forecast demand for air transportation. During the next 5 years, 19 general aviation airports, 2 nonprimary commercial service airports, and 2 nonhub primary airports are anticipated to open or be under development. This category accounts for 1.4 percent ($609 million) of all NPIAS development. Development costs in this category decreased by 30 percent from the last report, in part because some new airports that were under development have now been completed or are no longer being considered. Other
This category of development accounts for about one-half of 1 percent ($270 million) of the total development in the NPIAS. It includes fuel farms, utilities, and construction and rehabilitation of parking lots. General aviation and reliever airports account for 46 percent of this development. CHANGING THE WAY WE LOOK AT AIRPORTS
As mentioned at the end of Chapter 2, FAA released a study that examined 2,952 NPIAS airports that are primarily used by general aviation aircraft. The new airport categories for general aviation airports identified in this study have been incorporated into the NPIAS. Development to bring an airport up to current design standards recommended by the FAA is the largest category for each new airport category. The second largest development category is replacing or rehabilitating airport pavement and lighting systems. Table 10 contains the development totals for each airport category by purpose of development. These new categories will provide a consistent framework to evaluate

74 National Plan of Integrated Airport Systems (2013-2017)
proposed projects. The FAA will use the categories to measure changes in operation and development needs over time.
Table 10: 2013 – 2017 NPIAS Costs using the New General Aviation Categories 63
Category National Regional Local Basic Not
Classified TOTAL
Safety $75,705,614 $86,710,307 $70,021,759 $16,866,556 $7,026,559 $256,330,795
Security $30,588,072 $70,028,017 $116,979,036 $54,635,381 $42,428,521 $314,659,027
Reconstruction $566,808,683 $1,151,264,524 $1,408,160,656 $505,127,646 $225,522,854 $3,856,884,363
Standards $824,339,636 $2,215,374,810 $2,967,664,186 $1,013,246,603 $533,257,040 $7,553,882,275
Environmental $15,797,438 $9,895,920 $25,330,900 $13,827,647 $4,270,342 $69,122,247
Noise $59,033,952 $12,492,106 $4,410,211 $0 $0 $75,936,269
Capacity $167,431,296 $218,153,518 $168,522,546 $56,143,576 $32,282,883 $642,533,819
Terminal $48,187,551 $61,979,002 $70,218,522 $21,798,925 $9,867,688 $212,051,688
Access $47,984,641 $109,815,827 $104,412,928 $42,708,943 $13,451,896 $318,374,235
Other $7,571,000 $27,813,731 $49,226,059 $26,995,300 $15,686,691 $127,292,781
Total $1,843,447,883 $3,963,527,762 $4,984,946,803 $1,751,350,577 $883,794,474 $13,427,067,499
Airports in the four new categories account for $12.5 billion or 29 percent of the total $42.5 billion in development identified over the next 5 years. Figure 7 compares the average annual development needs for general aviation airports contained in the NPIAS by new category.
Figure 7: Average Annual Development per Airport for 2013 – 2017
63 This NPIAS report shows $883 million in projects that the FAA has deemed appropriate for inclusion in the NPIAS. However, the airports in this category will be reviewed to verify or update their activity levels. This review may result in different conclusions in the future regarding their capital infrastructure needs.

National Plan of Integrated Airport Systems (2013-2017) 75
The table below reflects the number of existing NPIAS airports by type, as well as the percentage of enplanements, based aircraft, and percentage of total development.
Number of
Airports Airport Type
Percentage of 2011 Total
Enplanements
Percentage of All Based Aircraft
1
Percentage of NPIAS
Cost2
29 Primary–Large Hub 69.9 0.6 35
36 Primary–Medium Hub 18.6 2.0 12
74 Primary–Small Hub 8.3 4.3 8
239 Primary–Nonhub 3.1 9.9 12
84 General Aviation–National 10.3 4
467 General Aviation–Regional 29.6 9
1,236 General Aviation–Local 27.8 12
668 General Aviation–Basic 3.6 4
497 General Aviation–Not Classified 1.9 2
3,330 Existing NPIAS Airports 99.9 74.4 98
1Based on active aircraft fleet of 222,520 aircraft in 2011.
2 Proposed airports, which account for 1 percent of total AIP eligible development, are not included in this
table.
ANTICIPATED SOURCES OF FUNDING
There are generally four sources of funds used to finance airport development: airport cash flow, bond proceeds, Federal/State/local grants, and PFCs. Access to these sources of financing varies widely among airports, with some large airports maintaining substantial cash reserves and the small commercial service and general aviation airports often requiring subsidies from local and State governments to fund operating expenses and finance modest improvements. Over the last 10 years, AIP grants have exceeded $3 billion annually. For the last 9 years, PFC collections have exceeded $2 billion annually (in many cases leveraged to pay debt service or much larger bond issues). In 2010, the commercial service airports reported grant receipts totaling $2.69 billion and PFC collections totaling $2.65 billion. These same airports reported total expenditures of $10.86 billion in airport development projects including projects eligible for AIP grants and projects ineligible for AIP grants, like automobile parking garages and hangars. 64 This is a decrease of $121 million from reported expenditures in 2008 of $10.98 billion. More than $18 billion in airport bonds were issued in 2011. This was due in part to an exemption from the Alternative Minimum Tax (AMT) for general airport revenue bonds. This exemption made airport revenue bonds more attractive to investors and reduced the interest rates for the airport. The exemption expired at the end of 2011. The AIP serves as an effective investment tool to fund safety, security, and airfield projects that rank highest in national priority. The PFC Program has broader eligibility than the AIP, particularly for terminal projects, noise compatibility measures, and costs associated with debt financing, and is
64 Airport Operating and Financial Summary, FY 2010 (FAA Form 127).

76 National Plan of Integrated Airport Systems (2013-2017)
available in significant and predictable amounts to large and medium hub airports. As a result, airports, especially large and medium hubs, have been directing the majority of their PFC revenues to landside projects such as terminal development, ground access systems, noise mitigation, and the financing costs of these projects. The majority of nonhub primary airports use PFC revenues as the local “match” funds for AIP grants. ADDITIONAL COSTS NOT INCLUDED IN THE NPIAS
The NPIAS only includes development that is eligible to receive Federal grants under the AIP. It does not include ineligible airport development, such as automobile parking structures, hangars, air cargo buildings, or the revenue-producing portion of large passenger terminal buildings.65 It also does not include: Development eligible under the PFC Program but ineligible under the AIP grant program, such
as gates and related areas. Improvements to highway and transit systems beyond the airport property line. Improvements to air traffic control and navigation aids that may be funded by the FAA’s
Facilities and Equipment Program, including most equipment for NextGen. Costs associated with modifying terminals to accommodate explosive detection systems. The
FAA is prohibited from funding these projects with AIP funding. However, these projects remain eligible under the PFC Program and under the Transportation Security Administration’s grant program.
Costs at airports for infrastructure improvements needed to take full advantage of WAAS/LPV approaches.
Development needed to address capacity shortfalls where no clear solution has yet emerged. Changes in eligibility for AIP resulting from the FAA Modernization and Reform Act of 2012
which was signed on February 14, 2012. Costs associated with planning (master plans, regional and State system plans, and
environmental studies). Between 2013 and 2017, total planning costs are estimated at $774 million, with medium hub airports accounting for 61 percent of the total and general aviation airports accounting for 17 percent.
65 The authorizing legislation allows nonprimary entitlement funds to be used for hangars, provided the FAA believes the airport has an adequate plan for financing all airside needs.