Appendix A1: Feed Ingredient Values and Spreadsheet · PDF fileFeed Ingredient Values and...
22
Appendix A1: Feed Ingredient Values and Spreadsheet Ration Calculator %/Lb Lb/Mix %/Lb Lbs/Mix %/Lb Lbs/Mix Kcal/Lb Kcal/Mix Ingredients: LBS %CP Protein Fat Fat Fiber Fiber Energy Energy Alfalfa Meal 17% 3.0% 24.0% 640 Aragonite 0.00% 0.0% 0.0% Barley 12% 2.0% 5.0% 1250 Corn Gluten Meal 60.0% 2.0% 5.0% 1700 Corn Grain Shell 8% 3.5% 2.9% 1520 Crab Meal 32.0% 2.0% 6.0% 675 Dicalcium Phosphate 0.00% 0.0% 0.0% DL Methionine 99.00% 0.0% 0.0% Fish Meal,60% 60% 7.7% 3.5% 1300 Fish meal, Sea-Lac 63% 10.0% 1.0% 1300 Hulless Oats 13.0% 4.0% 10.0% 1100 Hulless Oats 16.0% 6.0% 10.0% 1100 Lysine 99.00% 0.0% 0.0% Oats 10.0% 4.0% 3.0% 1100 Oil, Canola 2% 99.0% 5.0% 3900 Oil, Coconut 2% 99.0% 5.0% 3900 Oil, Soy Bean 0.0% 4.0% 10.5% 3950 Peas 22.4% 4.0% 6.3% 1300 Poultry Nutri-Balancer 0.00% 0.4% 1.2% 115 Shell Corn Grain 8% 3.5% 2.9% 1500 Soy Bean Meal,48% 47.0% 3.5% 5.0% 1020 Soybean Meal, Exp. 44.0% 7.0% 5.0% 1300 Soybeans, Roasted 38% 18.0% 5.0% 1500 Sunflower, Black Oil 18% 27.7% 31.0% 1200 Triticale 11% 1.5% 2.9% 1430 Wheat 12.0% 6.0% 5.0% 1380 Wheat 9% 3.5% 5.0% 1400 Wheat 14% 1.9% 2.9% 1440 Whole Canola 22% 40.0% 5.0% 2150 Total
-
Upload
phungthien -
Category
Documents
-
view
221 -
download
0
Transcript of Appendix A1: Feed Ingredient Values and Spreadsheet · PDF fileFeed Ingredient Values and...

Appendix A1: Feed Ingredient Values and Spreadsheet Ration Calculator
%/Lb Lb/Mix %/Lb
Lbs/Mix %/Lb
Lbs/Mix
Kcal/Lb Kcal/Mix Ingredients: LBS %CP Protein Fat Fat Fiber Fiber Energy Energy Alfalfa Meal 17% 3.0% 24.0% 640 Aragonite 0.00% 0.0% 0.0% Barley 12% 2.0% 5.0% 1250 Corn Gluten Meal 60.0% 2.0% 5.0% 1700 Corn Grain Shell 8% 3.5% 2.9% 1520 Crab Meal 32.0% 2.0% 6.0% 675 Dicalcium Phosphate 0.00% 0.0% 0.0% DL Methionine 99.00% 0.0% 0.0% Fish Meal,60% 60% 7.7% 3.5% 1300 Fish meal, Sea-Lac 63% 10.0% 1.0% 1300 Hulless Oats 13.0% 4.0% 10.0% 1100 Hulless Oats 16.0% 6.0% 10.0% 1100 Lysine 99.00% 0.0% 0.0% Oats 10.0% 4.0% 3.0% 1100 Oil, Canola 2% 99.0% 5.0% 3900 Oil, Coconut 2% 99.0% 5.0% 3900 Oil, Soy Bean 0.0% 4.0% 10.5% 3950 Peas 22.4% 4.0% 6.3% 1300 Poultry Nutri-Balancer 0.00% 0.4% 1.2% 115 Shell Corn Grain 8% 3.5% 2.9% 1500 Soy Bean Meal,48% 47.0% 3.5% 5.0% 1020 Soybean Meal, Exp. 44.0% 7.0% 5.0% 1300 Soybeans, Roasted 38% 18.0% 5.0% 1500 Sunflower, Black Oil 18% 27.7% 31.0% 1200 Triticale 11% 1.5% 2.9% 1430 Wheat 12.0% 6.0% 5.0% 1380 Wheat 9% 3.5% 5.0% 1400 Wheat 14% 1.9% 2.9% 1440 Whole Canola 22% 40.0% 5.0% 2150
Total

Appendix A2:
Feed Ingredient Values and Spreadsheet Ration Calculator (cont.)
%/Lb
Lbs/Mix %/Lb
Lbs/Mix %/Lb
Lbs/Mix %/Lb
Lbs/Mix
Ingredients: Calcium
Calcium Phos Phos Salt Salt Sodium
Sodium Alfalfa Meal 3.0% 0.25% Aragonite 37.0% 1.0% 0% 0.10% Barley 0.1% 0.40% 0% 0.02% Corn Gluten Meal 0.2% 0.58% 0% 0.02% Corn Grain Shell 0.0% 0.25% 0% 0.02% Crab Meal 15.0% 1.70% 2% 0.85% Dicalcium Phosphate 22.0% 18.5% 0.10% DL Methionine 0.0% 0.0% Fish Meal,60% 3.0% 2.00% 1% 0.40% Fish meal, Sea-Lac 5.0% 3.00% 1% 0.34% Hulless Oats 0.1% 0.35% 0.02% Hulless Oats 0.1% 0.35% 0.02% Lysine 0.0% 0.0% Oats 0.1% 0.36% 0% 0.06% Oil, Canola 0.0% 0.42% 0% 0.03% Oil, Coconut 0.0% 0.42% 0% 0.03% Oil, Soy Bean 0.1% 0.30% 0% 0.06% Peas 0.1% 0.45% 0.01% Poultry Nutri-Balancer 13.9% 10.7% 10.00% 4.60% Shell Corn Grain 0.0% 0.25% 0% 0.02% Soy Bean Meal,48% 0.2% 0.58% 0% 0.02% Soybean Meal, Exp. 0.2% 0.60% 0% 0.02% Soybeans, Roasted 0.3% 0.60% 0.02% Sunflower, Black Oil 0.2% 0.56% 0.09% Triticale 0.5% 0.30% 0% 0.20% Wheat 0.1% 0.40% 0% 0.06% Wheat 0.3% 0.58% 0% 0.02% Wheat 0.5% 0.41% 0% 0.02% Whole Canola 0.4% 0.64% 0% 0.02%
Total

Appendix A3: Feed Ingredient Values and Spreadsheet Ration Calculator (cont.)
UI/Lb UI/Mix UI/Lb UI/Mix UI/Lb UI/Lb MG/LB MG/Mix Ingredients: Vit A Vit A Vit D Vit D VitE Vit E Choline CHO Alfalfa Meal 486 Aragonite 0 Barley 0 Corn Gluten Meal 6069 Corn Grain Shell 750 1100 Crab Meal 200 Dicalcium Phosphate DL Methionine 0 0 Fish Meal,60% Fish meal, Sea-Lac 0 18955 Hulless Oats Hulless Oats 1400 Lysine 0 0 Oats 0 Oil, Canola 0 Oil, Coconut 0 486 Oil, Soy Bean 467 Peas 467 Poultry Nutri-Balancer 148400 53600 1667 920 Shell Corn Grain 750 Soy Bean Meal,48% 6069 Soybean Meal, Exp. 0 200 Soybeans, Roasted 1311 Sunflower, Black Oil 1364 Triticale 0 1182 Wheat 123 0 227 Wheat 209 Wheat 0 689 Whole Canola 0 1311
Total 200

Appendix A4:
Feed Ingredient Values and Spreadsheet Ration Calculator (cont.)
ppm/Lb MG/Mix ppm/Lb MG/Mix ppm/Lb MCG/Mix PPM PPM/Mix
Ingredients: Manganese Manganese Zinc Zinc Copper Copper Selenium Selenium Alfalfa Meal 38.2 38 14.08 Aragonite 286 Barley Corn Gluten Meal 30 11.36 15 Corn Grain Shell 6 15 3 Crab Meal Di-Calcium Phosphate 700 130 7 DL Methionine Fish Meal,60% 286 Fish meal, Sea-Lac 35.6 151 11.4 Hulless Oats Hulless Oats Lysine Oats 38.2 38 14.08 Oil, Canola 16 30 8 Oil, Coconut 16 30 8 Oil, Soy Bean 128.7 102 0.3 Peas 15 25 6 Poultry Nutri-Balancer 3295.6 2413.4 201 10 Shell Corn Grain 6 15 3 Soy Bean Meal,48% 32.3 60 28 Soybean Meal, Exp. 40 92 8 Soybeans, Roasted Sunflower, Black Oil 16.00 25.00 5.0 Triticale 0 32 10 Wheat 28 17 8.2 0 Wheat 32.3 60 28 Wheat 40 34 10 Whole Canola 30.0 11.4 15.0
Total
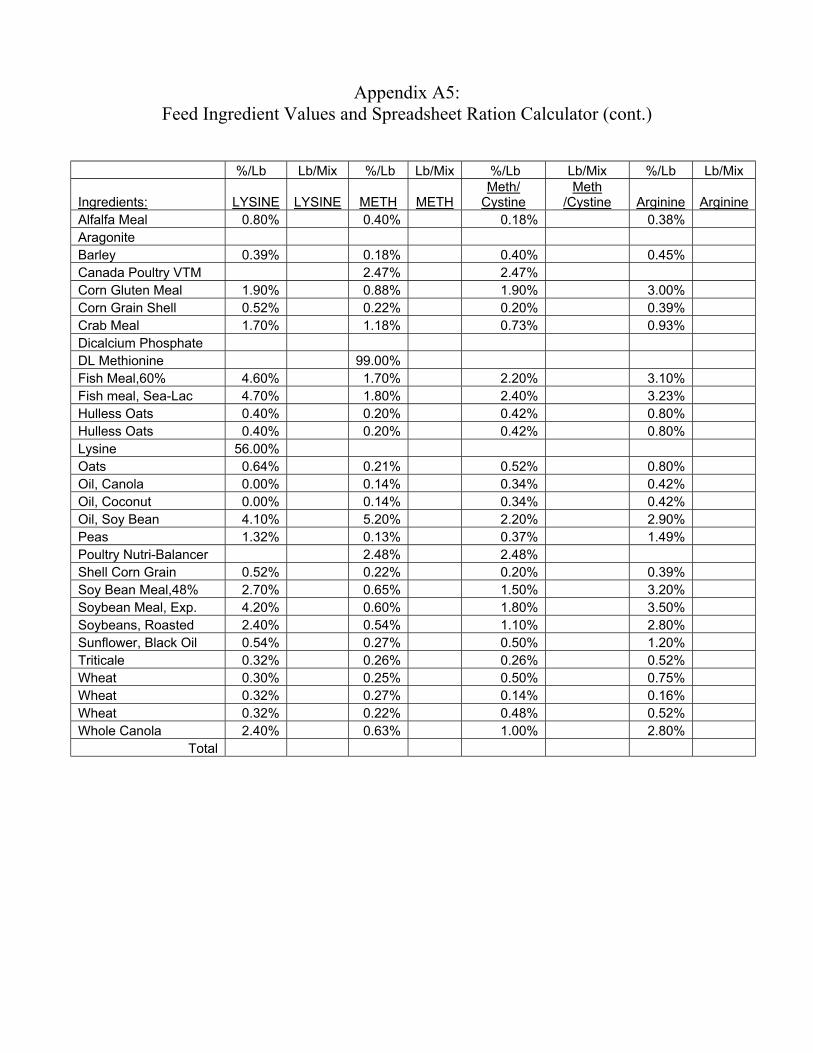
Appendix A5:
Feed Ingredient Values and Spreadsheet Ration Calculator (cont.)
%/Lb Lb/Mix %/Lb Lb/Mix %/Lb Lb/Mix %/Lb Lb/Mix
Ingredients:
LYSINE
LYSINE METH METH Meth/
Cystine Meth
/Cystine Arginine Arginine Alfalfa Meal 0.80% 0.40% 0.18% 0.38% Aragonite Barley 0.39% 0.18% 0.40% 0.45% Canada Poultry VTM 2.47% 2.47% Corn Gluten Meal 1.90% 0.88% 1.90% 3.00% Corn Grain Shell 0.52% 0.22% 0.20% 0.39% Crab Meal 1.70% 1.18% 0.73% 0.93% Dicalcium Phosphate DL Methionine 99.00% Fish Meal,60% 4.60% 1.70% 2.20% 3.10% Fish meal, Sea-Lac 4.70% 1.80% 2.40% 3.23% Hulless Oats 0.40% 0.20% 0.42% 0.80% Hulless Oats 0.40% 0.20% 0.42% 0.80% Lysine 56.00% Oats 0.64% 0.21% 0.52% 0.80% Oil, Canola 0.00% 0.14% 0.34% 0.42% Oil, Coconut 0.00% 0.14% 0.34% 0.42% Oil, Soy Bean 4.10% 5.20% 2.20% 2.90% Peas 1.32% 0.13% 0.37% 1.49% Poultry Nutri-Balancer 2.48% 2.48% Shell Corn Grain 0.52% 0.22% 0.20% 0.39% Soy Bean Meal,48% 2.70% 0.65% 1.50% 3.20% Soybean Meal, Exp. 4.20% 0.60% 1.80% 3.50% Soybeans, Roasted 2.40% 0.54% 1.10% 2.80% Sunflower, Black Oil 0.54% 0.27% 0.50% 1.20% Triticale 0.32% 0.26% 0.26% 0.52% Wheat 0.30% 0.25% 0.50% 0.75% Wheat 0.32% 0.27% 0.14% 0.16% Wheat 0.32% 0.22% 0.48% 0.52% Whole Canola 2.40% 0.63% 1.00% 2.80%
Total

Both Broiler Roaster Broiler Roaster Broiler Roaster
Pre-
Starter Starter
#1 Starter
#2 Grower
#1 Grower
#2 Finisher
#1 Finisher
#2 Approximate Protein 23 22 20 20 18 18 16 Metabolizable Energy (Kcal/Lb) 1386 1386 1318 1432 1364 1455 1386 Calcium (%) 1 0.95 0.95 0.92 0.92 0.9 0.9 Available Phosphorus (%) 0.45 0.42 0.42 0.4 0.4 0.38 0.38 Sodium (%) 0.19 0.18 0.18 0.18 0.18 0.18 0.18 Amino Acids (% of Diet) Argine 1.4 1.2 1.1 1.05 0.95 0.9 0.85 Lysine 1.35 1.2 1.05 1.1 0.9 0.9 0.8 Methionine 0.52 0.48 0.42 0.44 0.38 0.37 0.36 Methionine/Cystine 0.95 0.82 0.75 0.73 0.65 0.64 0.61 Tryptophan 0.22 0.2 0.18 0.17 0.15 0.14 0.13 Histidine 0.42 0.4 0.35 0.32 0.3 0.28 0.27 Leucine 1.5 1.4 1.2 1.1 1.0 1.0 0.9 Isoleucine 0.85 0.75 0.6 0.55 0.5 0.47 0.45 Phenylalanine 0.8 0.75 0.65 0.6 0.55 0.53 0.5 Phenylalanine+Tyrosine 1.5 1.4 1.2 1.1 1.0 1.0 0.9 Threonine 0.75 0.7 0.62 0.6 0.55 0.55 0.5 Valine 0.9 0.8 0.7 0.65 0.6 0.58 0.55 Vitamins (per Lb) Vitamin A (I.U.) 2955 2659 Vitamin D (I.U.) 1364 1227 Choline (mg) 364 327 Riboflavin (mg) 2.5 2.3 Pantothenic Acid (mg) 6.4 5.7 Vitamin B12 (mg) 0.006 0.005 Folic Acid (mg) 0.45 0.41 Biotin (mg) 0.09 0.08 Niacin (mg) 18.2 16.4 Vitamin K (mg) 0.9 0.8 Vitamin E (I.U.) 13.6 12.3 Thiamin (mg) 1.8 1.6 Pyridoxine (mg) 1.8 1.6 Trace Minerals (PPM) PPM
Manganese 70
Iron 80 Copper 10 Zinc 80 Selenium 0.3 Iodine 0.4
Note: Trace mineral requirements remain the same for all rations. * The information contained in this table has been obtained from Commercial Poultry Nutrition, by S. Leeson and J.D. Summers
Appendix B: Commercial Broiler-Roaster Nutritional Requirements

Feed Intake 0.28 0.26 0.24 0.22 0.2 0.18 0.16 Approximate Protein (%) 13 14 15.5 17 19 20.5 22.1 Metabolizable Energy (Kcal/Lb) 1227 1227 1275 1295 1295 1295 1318 Calcium (%) 3 3.25 3.5 3.6 3.8 4 4.25 Available Phosphorus (%) 0.35 0.4 0.4 0.42 0.45 0.45 0.47 Sodium (%) 0.17 0.18 0.18 0.19 0.2 0.2 0.22 Amino Acids (% of Diet) Argine 0.55 0.6 0.68 0.75 0.82 0.9 0.98 Lysine 0.49 0.56 0.63 0.7 0.77 0.84 0.91 Methionine 0.28 0.31 0.34 0.37 0.41 0.47 0.56 Methionine/Cystine 0.48 0.53 0.58 0.64 0.71 0.8 0.91 Tryptophan 0.1 0.12 0.14 0.15 0.17 0.18 0.2 Histidine 0.13 0.14 0.15 0.17 0.19 0.25 0.25 Leucine 0.64 0.73 0.82 0.91 1 1.09 1.18 Isoleucine 0.43 0.5 0.57 0.63 0.69 0.73 0.82 Phenylalanine 0.34 0.38 0.42 0.47 0.52 0.57 0.61 Phenylalanine+Tyrosine 0.55 0.65 0.75 0.83 0.91 0.99 1.08 Threonine 0.43 0.5 0.57 0.63 0.69 0.73 0.82 Valine 0.49 0.56 0.63 0.7 0.77 0.82 0.91 Vitamins (per Lb) Vitamin A (I.U.) 3410 Vitamin D (I.U.) 1150 Choline (mg) 550 Riboflavin (mg) 2 Pantothenic Acid (mg) 4.5 Vitamin B12 (mg) 0.005 Folic Acid (mg) 0.35 Biotin (mg) 0.07 Niacin (mg) 18 Vitamin K (mg) 1 Vitamin E (I.U.) 12 Thiamin (mg) 1 Pyridoxine (mg) 1.5 Trace Minerals (PPM) PPM Manganese 70 Iron 80 Copper 8 Zinc 60 Selenium 0.3 Iodine 0.4
Note: Trace mineral requirements remain the same for all rations. * The information contained in this table has been obtained from Commercial Poultry Nutrition, by S. Leeson and J.D. Summers
Appendix C: Commercial Layer Nutritional Requirements
Laying Hens Feed Intake per Day (Lb)

Starter
#1 Starter
#2 Grower
#1 Grower
#2 Developer Finisher Approximate Protein (%) 28 26 23 21.5 18 16 Metabolizable Energy (Kcal/Lb) 1320 1365 1385 1410 1455 1500 Calcium (%) 1.4 1.3 1.2 1.3 1 0.9 Available Phosphorus (%) 0.7 0.6 0.5 0.6 0.5 0.4 Sodium (%) 0.18 0.18 0.17 0.17 0.17 0.17 Amino Acids (% of Diet) Argine 1.6 1.55 1.4 1.25 1.02 0.95 Lysine 1.7 1.6 1.5 1.3 1.15 1 Methionine 0.62 0.55 0.5 0.47 0.42 0.34 Methionine/Cystine 1 0.9 0.8 0.76 0.67 0.58 Tryptophan 0.28 0.26 0.22 0.21 0.18 0.16 Histidine 0.57 0.55 0.48 0.45 0.37 0.32 Leucine 1.95 1.9 1.6 1.45 1.25 1.15 Isoleucine 1.13 1.05 0.9 0.85 0.72 0.65 Phenylalanine 1.03 0.95 0.82 0.79 0.67 0.6 Phenylalanine+Tyrosine 1.8 1.7 1.5 1.4 1.2 1 Threonine 1 0.95 0.85 0.78 0.67 0.61 Valine 1.2 1.15 1 0.9 0.75 0.65 Vitamins (per Lb) Vitamin A (I.U.) 4320 3865 7000 3182 Vitamin D (I.U.) 1230 1100 2200 1000 Choline (mg) 865 775 1500 682 Riboflavin (mg) 2.8 2.5 5 2.27 Pantothenic Acid (mg) 7.8 6.8 15 6.82 Vitamin B12 (mg) 0.006 0.006 0.012 0.01 Folic Acid (mg) 0.50 0.35 0.5 0.23 Biotin (mg) 0.12 1 0.15 0.07 Niacin (mg) 36.5 32 60 27.3 Vitamin K (mg) 1.0 1 1.5 0.7 Vitamin E (I.U.) 20.0 14 20 9.1 Thiamin (mg) 1.5 1.4 2.5 1.1 Pyridoxine (mg) 2.75 2.3 3 1.4 Trace Minerals (PPM) PPM PPM PPM Manganese 80 80 80 Iron 110 110 110 Copper 10 10 10 Zinc 80 80 80 Selenium 0.3 0.25 0.0015 Iodine 0.45 0.45 0.45
• The information contained in this table has been obtained from Commercial Poultry Nutrition, by
S. Leeson and J.D. Summers
Appendix D: Commercial Turkey Nutritional Requirements
Starter #1 Starter #2 Grower #1 Grower #2 Approximate Protein 22 20 18 16 Metabolizable Energy (Kcal/Lb) 1295 1320 1400 1420 Calcium (%) 0.8 0.83 0.76 0.75 Available Phosphorus (%) 0.4 0.42 0.38 0.35 Sodium (%) 0.18 0.18 0.18 0.18 Amino Acids (% of Diet) Argine 1.2 1.05 0.94 0.85 Lysine 1.1 0.96 0.86 0.78 Methionine 0.48 0.43 0.39 0.35 Methionine/Cystine 0.82 0.72 0.66 0.6 Tryptophan 0.22 0.18 0.16 0.15 Histidine 0.44 0.37 0.33 0.29 Leucine 1.56 1.28 1.16 1.04 Isoleucine 0.84 0.69 0.63 0.56 Phenylalanine 0.78 0.64 0.58 0.52 Phenylalanine+Tyrosine 1.52 1.24 1.12 1.01 Threonine 0.76 0.62 0.56 0.5 Valine 0.93 0.77 0.69 0.62 Vitamins (per Lb) Vitamin A (I.U.) 3650 Vitamin D (I.U.) 1140 Choline (mg) 365 Riboflavin (mg) 1.8 Pantothenic Acid (mg) 5.5 Vitamin B12 (mg) 0.005 Folic Acid (mg) 0.23 Biotin (mg) 0.1 Niacin (mg) 28 Vitamin K (mg) 0.7 Vitamin E (I.U.) 10 Thiamin (mg) 1 Pyridoxine (mg) 1.4 Trace Minerals (PPM) PPM Manganese 60 Iron 80 Copper 8 Zinc 60 Selenium 0.2 Iodine 0.4
Note: Trace mineral requirements remain the same for all rations. * The information contained in this table has been obtained from Commercial Poultry Nutrition, by S. Leeson and J.D. Summers
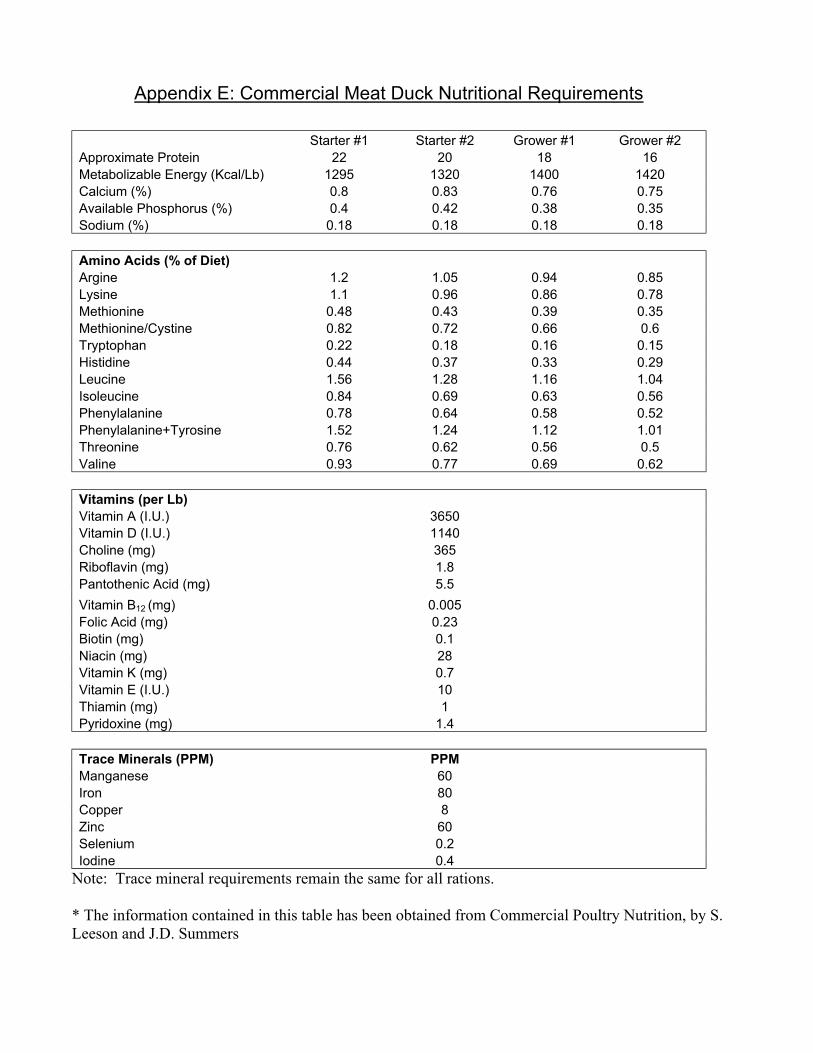
Appendix E: Commercial Meat Duck Nutritional Requirements

Appendix F: Commercial Broiler Sample Rations
Starter Grower Finisher Ingredients: 1 2 1 2 3 1 2 Corn 1137.5 541 1151.4 1212.8 1082.4 1302.8 1012 Wheat 0 400 0 0 350 0 540 Barley 0 400 0 0 0 0 0 Soybean Meal, 48% 700 535 625 610 460 516 340 Meat Meal, 50% 0 0 20 0 0 0 0 Fish Meal, 60% 0 0 40 0 0 0 0 Fat 70 34 90 90 20 94 20 Ground Limestone 34 32 26 30 30 30 30 Calcium Phosphate, 20% P 30 30 20 30 30 30 30 Iodized Salt 6 6 6 6 6 6 6 Vitamin: Mineral Premix1 20 20 20 20 20 20 20 Methionine 2.5 2 1.6 1.2 1.6 1.2 2 2000 2000 2000 2000 2000 2000 2000 Calculated Analysis: Crude Protein (%) 22.0 22.0 21.8 20 18 18 16.1 Digestible Protein (%) 17.7 17.7 17.7 16.2 14.4 14.2 12.9 Crude Fat (%) 5.9 5.9 7 7 3.4 7.3 3.4 Metabolized Energy (kcal/kg) 1391 1390 1429 1430 1374 1455 1386 Calcium (%) 1.00 1.00 0.98 0.95 0.95 0.94 0.96 Av. Phosphorus (%) 0.42 0.42 0.42 0.42 0.41 0.41 0.41 Sodium (%) 0.17 0.17 0.17 0.17 0.17 0.17 0.18 Methionine (%) 0.48 0.48 0.4 0.4 0.38 0.37 0.37 Methionine & Cystine (%) 0.82 0.82 0.71 0.71 0.65 0.64 0.61 Tryptophan (%) 0.31 0.31 0.28 0.28 0.25 0.25 0.22 Lysine (%) 1.25 1.25 1.1 1.1 0.93 0.96 0.78 Threonine (%) 0.94 0.94 0.86 0.86 0.75 0.78 0.65
1Use of additional Choline Chloride if vitamin premix does not contain this vitamin.
* The information contained in this table has been obtained from Commercial Poultry Nutrition, by S. Leeson and J.D. Summers

Appendix G: Commercial Roaster Sample Rations
Grower Finisher
Ingredients: 1 2 1 2 Corn 1200 1296 1058 1286 Wheat 198 280 280 280 Barley 0 0 100 0 Soybean Meal, 48% 440 320 380 320 Fat 80 20 100 30 Ground Limestone 30 30 30 30 Calcium Phosphate, 20% P 26 26 26 28 Iodized Salt 6 6 6 6 Vitamin: Mineral Premix1 20 20 20 20 Methionine 1.6 1.4 1.2 1 2001.6 1999.4 2001.2 2001 Calculated Analysis: Crude Protein (%) 17 15.1 16.1 15.1 Digestible Protein (%) 13.8 12 12.9 11.9 Crude Fat (%) 6.5 3.8 7.4 4.2 Crude Fiber (%) 2.4 2.5 2.7 2.5 Metabolized Energy (kcal/kg) 1443 1400 1457 1410 Calcium (%) 0.9 0.91 0.91 0.92 Av. Phosphorus (%) 0.38 0.38 0.38 0.39 Sodium (%) 0.17 0.17 0.17 0.17 Methionine (%) 0.37 0.34 0.34 0.32 Methionine & Cystine (%) 0.63 0.56 0.56 0.54 Tryptophan (%) 0.87 0.72 0.8 0.71 Lysine (%) 0.23 0.2 0.22 0.2 Threonine (%) 0.72 0.63 0.67 0.63
1Use of additional Choline Chloride if vitamin premix does not contain this vitamin
* The information contained in this table has been obtained from Commercial Poultry Nutrition, by S. Leeson and J.D. Summers

Appendix H: Commercial Layer Sample Rations
Ingredients: 1 2 3 Corn 1192 1305 1313 Wheat 0 0 240 Soybean Meal, 48% 560 468 220 Fat 40 20 20 Ground Limestone 156 156 156 Calcium Phosphate, 20% P 23 23 23 Iodized Salt 7 7 7 Vitamin: Mineral Premix1 20 20 20 Methionine 2 1 1 2000 2000 2000 Calculated Analysis: Crude Protein (%) 18.6 16.9 13 Digestible Protein (%) 17 15.4 11.7 Crude Fat (%) 4.4 3.6 4.2 Crude Fiber (%) 2.3 2.3 2.8 Metabolized Energy (kcal/kg) 1300 1295 1260 Calcium (%) 3.3 3.26 3.25 Av. Phosphorus (%) 0.41 0.4 0.4 Sodium (%) 0.19 0.19 0.18 Methionine (%) 0.42 0.34 0.28 Methionine & Cystine (%) 0.7 0.59 0.46 Lysine (%) 1.02 0.88 0.56
1Use of additional Choline Chloride if vitamin premix does not contain this vitamin
* The information contained in this table has been obtained from Commercial Poultry Nutrition, by S. Leeson and J.D. Summers

Appendix I: Commercial Turkey Sample Rations
Starter Grower Finisher
1Use of additional Choline Chloride if vitamin premix does not contain this vitamin * The information contained in this table has been obtained from Commercial Poultry Nutrition, by S. Leeson and J.D. Summers
Ingredients: 1 2 1 2 1 2 Corn 900 1000 1154 1234 1358 1482 Soybean Meal, 48% 772 672 530 444 360 292 Meat Meal, 50% 100 100 200 200 100 60 Fish Meal, 60% 100 100 0 0 0 0 Fat 42 60 58 58 110 92 Ground Limestone 20 16 12 14 20 18 Calcium Phosphate, 20% P 40 25 20 24 26 28 Iodized Salt 4 4 4 4 4 4 Vitamin: Mineral Premix1 20 20 20 20 20 20 Methionine 2.6 2 1.4 1.4 0 1.6 2000.6 1999 1999.4 1999.4 1998 1997.6 Calculated Analysis: Crude Protein (%) 27.9 26.0 23.2 21.5 17 15 Digestible Protein (%) 25.5 23.7 21.2 19.6 15.5 13.7 Crude Fat (%) 4.4 5.5 5.6 5.8 8.5 6.4 Crude Fiber (%) 3.5 3.4 3.4 3.4 3.4 3.4 Metabolized Energy (kcal/lb) 1315 1364 1394 1405 1477 1489 Calcium (%) 1.58 1.34 1.2 1.27 1.07 0.9 Av. Phosphorus (%) 0.85 0.69 0.63 0.66 0.5 0.46 Sodium (%) 0.18 0.18 0.18 0.18 0.17 0.16 Methionine (%) 0.61 0.56 0.5 0.47 0.78 0.69 Methionine & Cystine (%) 1.05 0.96 0.85 0.79 0.64 0.56 Lysine (%) 1.77 1.62 1.41 1.28 0.89 0.75 Tryptophan (%) 0.37 0.34 0.3 0.27 0.22 0.19 Threonine (%) 1.18 1.1 0.99 0.92 0.87 0.64

Appendix J: Pasture Broiler Sample Ration
Starter/Grower Ingredients: LBS Alfalfa Meal 100 Aragonite 25 Corn Grain Shell 1015 Fish meal 75 Oats 100 Vitamin Mineral Premix 60 Soybeans, Roasted 625 Total 2000 Nutrient Name: Units Amount Crude Protein % 19.4% Crude Fat % 8.1% Crude Fiber % 4.5% Calcium % 1.30% Phosphorus % 0.79% Salt added % 0.34% Sodium % 0.17% Energy Kcal/LB 1,379 Vitamin A IU/LB 4833 Vitamin D IU/LB 1608 Vitamin E IU/LB 50 Choline IU/LB 476 Biotin MCG/LB 50.7 Manganese IU/LB 58.9 Zinc IU/LB 47.9 Copper IU/LB 4.03 Selenium (added) IU/LB 0.30 Lysine % 1.26% Methionine % 0.45% Methionine/Cystine % 0.64% Arginine % 1.25%
* These tables have been created by Jeff Mattocks, the Fertrell Company.
Appendix K: Pasture Roaster Sample Ration
Finisher Ingredients: LBS Alfalfa Meal 100 Aragonite 25 Corn Grain Shell 1215 Fish meal 50 Oats 100 Vitamin Mineral Premix 60 Soybeans, Roasted 450 Total 2000 Nutrient Name: Units Amount Crude Protein % 16.1% Crude Fat % 6.8% Crude Fiber % 4.3% Calcium % 1.22% Phosphorus % 0.73% Salt added % 0.33% Sodium % 0.17% Energy Kcal/LB 1,384 Vitamin A IU/LB 4908 Vitamin D IU/LB 1608 Vitamin E IU/LB 50 Choline IU/LB 479 Biotin MCG/LB 54.0 Manganese IU/LB 58.9 Zinc IU/LB 47.7 Copper IU/LB 4.10 Selenium (added) IU/LB 0.30 Lysine % 1.05% Methionine % 0.40% Methionine/Cystine % 0.54% Arginine % 1.01%

Appendix L: Pasture Layer Sample Rations
First Laying Cycle Ingredients: LBS Alfalfa Meal 100 Aragonite 175 Corn Grain Shell 965 Oats 100 Vitamin Mineral Premix 60 Soybeans, Roasted 600 Total 2000 Nutrient Name: Units Amount Crude Protein % 16.5% Crude Fat % 7.5% Crude Fiber % 4.3% Calcium % 3.89% Phosphorus % 0.74% Salt added % 0.30% Sodium % 0.17% Energy Kcal/LB 1,274 Vitamin A IU/LB 4814 Vitamin D IU/LB 1608 Vitamin E IU/LB 50 Choline IU/LB 455 Biotin MCG/LB 48.7 Manganese IU/LB 69.3 Zinc IU/LB 46.4 Copper IU/LB 4.28 Selenium (added) IU/LB 0.30 Lysine % 1.04% Methionine % 0.37% Methionine/Cystine % 0.54% Arginine % 1.09%
* These tables have been created by Jeff Mattocks, the Fertrell Company.
Appendix M: Pasture Layer Sample Rations
Second Laying Cycle Ingredients: LBS Alfalfa Meal 100 Aragonite 200 Corn Grain Shell 1040 Oats 50 Vitamin Mineral Premix 60 Soybeans, Roasted 550 Total 2000 Nutrient Name: Units Amount Crude Protein % 15.6% Crude Fat % 7.0% Crude Fiber % 4.2% Calcium % 4.34% Phosphorus % 0.74% Salt added % 0.30% Sodium % 0.17% Energy Kcal/LB 1,266 Vitamin A IU/LB 4842 Vitamin D IU/LB 1608 Vitamin E IU/LB 50 Choline IU/LB 457 Biotin MCG/LB 49.5 Manganese IU/LB 70.8 Zinc IU/LB 46.5 Copper IU/LB 4.25 Selenium (added) IU/LB 0.30 Lysine % 0.99% Methionine % 0.36% Methionine/Cystine % 0.50% Arginine % 1.01%

Appendix N: Pasture Turkey Sample
Starter Ration
* These tables have been created by Jeff Mattocks, the Fertrell Company.
Appendix O: Pasture Turkey Sample Rations
Grower #1
Ingredients: LBS Alfalfa Meal 100 Aragonite 20 Corn Grain Shell 650 Dicalcium Phosphate 10 Fish Meal,63% 50 Vitamin Mineral Premix 70 Soybeans, Roasted 900 Wheat 200 Total 2000 Nutrient Name: Units Amount Crude Protein % 23.3% Crude Fat % 10.2% Crude Fiber % 5.0% Calcium % 1.31% Phosphorus % 0.93% Salt added % 0.38% Sodium % 0.19% Energy Kcal/LB 1,376 Vitamin A IU/LB 5450 Vitamin D IU/LB 1876 Vitamin E IU/LB 58 Choline IU/LB 461 Biotin MCG/LB 47.6 Manganese IU/LB 65.3 Zinc IU/LB 49.4 Copper IU/LB 4.08 Selenium (added) IU/LB 0.35 Lysine % 1.43% Methionine % 0.49% Methionine/Cystine % 0.76% Arginine % 1.56%
Ingredients: LBS Alfalfa Meal 100 Aragonite 15 Corn Grain Shell 295 Dicalcium Phosphate 10 Fish Meal,63% 100 Oats 250 Vitamin Mineral Premix 80 Soybeans, Roasted 950 Wheat 200 Total 2000 Nutrient Name: Units Amount Crude Protein % 25.7% Crude Fat % 10.7% Crude Fiber % 5.1% Calcium % 1.38% Phosphorus % 1.05% Salt added % 0.45% Sodium % 0.23% Energy Kcal/LB 1,314 Vitamin A IU/LB 6059 Vitamin D IU/LB 2144 Vitamin E IU/LB 67 Choline IU/LB 516 Biotin MCG/LB 49.7 Manganese IU/LB 74.1 Zinc IU/LB 55.8 Copper IU/LB 5.08 Selenium (added) IU/LB 0.40 Lysine % 1.60% Methionine % 0.54% Methionine/Cystine % 0.89% Arginine % 1.74%

Appendix P: Pastured Turkey Sample Rations
Grower #2 Ingredients: LBS Alfalfa Meal 100 Aragonite 20 Corn Grain Shell 750 Dicalcium Phosphate 10 Fish Meal,63% 50 Vitamin Mineral Premix 70 Soybeans, Roasted 700 Total 2000 Nutrient Name: Units Amount Crude Protein % 20.5% Crude Fat % 8.9% Crude Fiber % 4.9% Calcium % 1.29% Phosphorus % 0.90% Salt added % 0.38% Sodium % 0.20% Energy Kcal/LB 1,371 Vitamin A IU/LB 5494 Vitamin D IU/LB 1876 Vitamin E IU/LB 58 Choline IU/LB 506 Biotin MCG/LB 49.4 Manganese IU/LB 66.1 Zinc IU/LB 50.1 Copper IU/LB 4.33 Selenium (added) IU/LB 0.35 Lysine % 1.24% Methionine % 0.46% Methionine/Cystine % 0.69% Arginine % 1.34%
• These tables have been created by Jeff Mattocks, the Fertrell Company.
Appendix Q: Pastured Turkey Sample Rations
Finisher Ingredients: LBS Alfalfa Meal 100 Aragonite 20 Corn Grain Shell 920 Dicalcium Phosphate 0 Fish Meal,63% 50 Vitamin Mineral Premix 60 Soybeans, Roasted 450 Total 2000 Nutrient Name: Units Amount Crude Protein % 17.0% Crude Fat % 7.2% Crude Fiber % 4.8% Calcium % 1.08% Phosphorus % 0.72% Salt added % 0.33% Sodium % 0.17% Energy Kcal/LB 1,381 Vitamin A IU/LB 4822 Vitamin D IU/LB 1608 Vitamin E IU/LB 50 Choline IU/LB 527 Biotin MCG/LB 47.5 Manganese IU/LB 59.4 Zinc IU/LB 45.6 Copper IU/LB 4.18 Selenium (added) IU/LB 0.30 Lysine % 0.99% Methionine % 0.41% Methionine/Cystine % 0.58% Arginine % 1.06%


Appendix R:
Formulating Rations with the Pearson Square by T.L. Stanton1
Quick Facts...
The Pearson square ration formulation procedure is designed for simple rations. In order for the square to work, follow specific directions for its use. Nutrient contents of ingredients and nutrient requirements must be expressed on the same basis (i.e., dry-matter or "as-fed").
The Pearson square or box method of balancing rations is a simple procedure that has been used for many years. It is of greatest value when only two ingredients are to be mixed. In taking a close look at the square, several numbers are in and around the square. Probably one of the more important numbers is the number that appears in the middle of the square. This number represents the nutritional requirement of an animal for a specific nutrient. It may be crude protein or TDN, amino acids, minerals or vitamins.
In order to make the square work consistently, there are three very important considerations:
1. The value in the middle of the square must be intermediate between the two values that are used on the left side of the square. For example, the 14 percent crude protein requirement has to be intermediate between the soybean meal that has 45 percent crude protein or the corn that has 10 percent crude protein. If barley is used that has 12 percent crude protein and corn that has 10 percent crude protein, the square calculation method will not work because the 14 percent is outside the range of the values on the left side of the square.
2. Disregard any negative numbers that are generated on the right side of the square. Be concerned only with the numerical differences between the nutrient requirement and the ingredient nutrient values.
3. Subtract the nutrient value from the nutritional requirement on the diagonal and arrive at a numerical value entitled parts. By summing those parts and dividing by the total, you can determine the percent of the ration that each ingredient should represent in order to provide a specific nutrient level. Always subtract on the diagonal within the square in order to determine parts. Always double check calculations to make sure that you did not have a mathematical error. It also is very important to work on a uniform basis. Use a 100-percent dry-matter basis for nutrient composition of ingredients and requirements and then convert to an as-fed basis after the formulation is calculated. Corn represents (31.0 / 35.00) x 100 of the ration, or 88.57 percent. Soybean meal represents (4.0 / 35.00) x 100 of the ration, or .43 percent.
Check of the calculation: 88.57 lb corn at 10.0% CP = 8.86 11.43 lb SBM at 45.0% CP = 5.14 100.00 lb mixture contains = 14.00 lb CP, or 14 percent.

Using More Than Two Ingredients
It is possible to mix more than two ingredients using the Pearson square. For example, to prepare a 15 percent crude protein mixture that consists of a supplement of 60 percent soybean meal (45 percent crude protein) and 40 percent meat and bone scrap (50 percent crude protein), and a grain mixture of 65 percent corn (9 percent crude protein) and 35 percent oats (12 percent crude protein), take the following steps. Since only two components can be used in the Pearson square method, the ingredients are combined first as follows:
60% SBM x 45% crude protein = 27.0 40% MBS x 50% = 20.0 Protein in supplement mixture 47.0% 65% corn x 9.0% = 5.85 35% oats x 12.0% = 4.20 Protein in grain mix 10.05% 5.0 parts x 60% = 3.0 parts SBM 5.0 parts x 40% = 2.0 parts MBS 32.0 parts x 65% = 20.8 parts corn 32.0 parts x 35% = 11.2 parts oats 37.0 (3.0 / 37.0) = 8.11% SBM (2.0 / 37.0) = 5.41% MBS (20.8 / 37.0) = 56.21% corn (11.2 / 37.0) = 30.27% corn Check: 8.11 lb SBM at 45% CP = 3.65 lb 5.41 lb MBS at 50% CP = 2.70 lb 56.21 lb corn at 9% CP = 5.06 lb 30.27 lb oats at 12% CP = 3.64 lb 100.00 lb contains 15.05 lb or 15% CP

Expressing Feed Composition
The crude-protein value of a feed or the percentage of any other component (e.g., calcium or phosphorus) can be expressed several ways. The two most common methods of expression are on an as-fed basis or dry-matter basis. Use the following procedure to calculate composition on a dry-matter basis.
Crude protein value on an as-fed basis divided by dry-matter content of the feed times 100 equals the crude-protein content on a dry-matter basis. If alfalfa hay is used as an example, the crude protein value is 17 percent on an as-fed basis. On a dry-matter basis, the crude protein value of the hay is calculated as follows: 17 / 0.91 (moisture content of 9 percent) times 100 equals 18.7 percent crude protein.
To determine the total digestible nutrient (TDN) content of the above alfalfa on a dry-matter basis, follow the same procedure: 50 percent (TDN value on an as-fed basis) divided by 0.91 (dry-matter content of the feed) times 100 equals 54.9 percent TDN on a dry-matter basis. Likewise, the crude-protein content or the TDN value also can be expressed on the basis of any given dry-matter level. For example, if you use a 90-percent dry-matter basis, use the following calculation. Given a TDN value of 76 percent and a dry-matter content of 86 percent (14 percent moisture), what would be the TDN value of this feed on a 90 percent dry-matter basis?
(76 x .90) / .86 = 79.5 percent TDN on a 90 percent dry-matter basis.
Ration Composition Calculations
If you know the dry-matter composition of a specific ration and want to determine what that composition will be on an as-fed basis for mixing, make the calculations shown in Table 1.
Conversely, if you know the "as-fed" composition of the ration and the dry matter of each ingredient, determine the ration dry-matter composition as shown in Table 2. Table 1: Converting from dry matter to as-fed.
Feed
Ration dry-matter composition
Ingredient % dry matter Calculations
Ration as-fed composition
Corn silage 70 35 70/.35 = 200 (200/233) x 100 = 84.84 Alfalfa 30 90 30/.30 = 33
233 (33/233) x 100 = 14.16
Table 2: Converting from as-fed to dry matter.
Feed
Ration dry-matter composition
Ingredient % dry matter Calculations
Ration as-fed composition
Corn silage 65 35 65/.35 = 22.75 (22.75/54.25) x 100 = 41.94 Alfalfa 35 90 35/.90 = 31.50
54.25 (31.50/54.25) x 100 = 58.06

Colorado State University Cooperative Extension feedlot specialist and professor, animal sciences. 9/93. Reviewed 9/98. Updated Wednesday, May 02, 2001. Colorado State University Cooperative Extension. 1995-2001. Contact Cooperative Extension Web Manager. Home Page: www.ext.colostate.edu. Issued in furtherance of Cooperative Extension work, Acts of May 8 and June 30, 1914, in cooperation with the U.S. Department of Agriculture, Milan A. Rewerts, Director of Cooperative Extension, Colorado State University, Fort Collins, Colorado. Cooperative Extension programs are available to all without discrimination. No endorsement of products mentioned is intended nor is criticism implied of products not mentioned.