APPENDIX A - UM Students' Repository
41
235 APPENDIX A Twenty Five Techniques of Situational Prevention by Clark (1993)
Transcript of APPENDIX A - UM Students' Repository

235
APPENDIX ATwenty Five Techniques of Situational Prevention by Clark (1993)

236
Twenty Five Techniques of Situational Prevention by Clark (1993)Increase the
EffortIncrease theRisks
Reduce theRewards
ReduceProvocations
RemoveExcuses
1. Target HardenSteering columnlocks andimmobilisersAnti- robberyscreensTemper- proofpackaging
6. ExtendguardianshipTake routineprecautions: go outin group at night,leave signs ofoccupancy, carryphone“cocoon”neighbourhoodwatch
11. Conceal targetsOff –street parkingGender –neutralPhone directoriesUnmarked bulliontrucks
16. Reduce frustrationsand stressEfficient queues andpolite serviceExpanded seatingSoothing music /mutedlights
21. Set rulesRental agreementsHarassment codsHotel registration
2. Control access tofacilitiesEntry phonesElectronic cardaccessBaggage screening
7. Assist naturalsurveillanceImproved streetlightingDefensible spacedesignSupportwhistleblowers
12. Remove targetsRemove car radioWomen’s refugesPre paid cards forpay phone
17. Avoid disputesSeparate enclosures forrival soccer fansReduce crowding inpubsFixed cab fares
22. Postinstructions“No Parking”“Private Property”“ Extinguish campfires”
3. Screen exitsTicket needed forexitExport documentsElectronicmerchandise tags
8. ReduceanonymityTaxi driver Ids“How is mydriving?”decalsSchool uniforms
13. IdentifypropertyProperty markingVehicle licensingand parts markingCattle
18. Reduce emotionalarousalControls on violentpornographyEnforce goodbehaviour on soccerfieldProhibit racial slurs
23. AlertconscienceRoadside speeddisplay boardsSignature forcustomsdeclarations“Shoplifting isstealing”
4. DeflectOffendersStreet closuresSeparate bathroomfor womenDisperse pubs
9. utilize placemanagersCCTV for double-deck busesTwo clerks forconvenience storesReward vigilance
14. Disrupt marketsMonitors pawnshopsControls onclassified adsLicense streetvendors
19. neutralize peerpressure“Idiots drink and drive”“It is ok to say no”Disperse troublemakersat school
24. AssistcomplianceEasy librarycheckoutPublic lavatoriesLitter bins
5. Control tools/weaponsSmart gunsDisabling stolencell phonesRestrict spray paintsales to juveniles
10. Strengthenformal surveillanceRed light camerasBurglar alarmsSecurity guards
15. Deny benefitsInk merchandisetagsGraffiti cleaningSpeed humps
20. DiscouragingimitationRapid repair ofvandalismV-chips in TVsCensor details ofmodus operandi
25. Control drugsand alcoholBreathalysers inpubsServer interventionAlcohol free events
Source: Wortley & Mazerolle 2008

237
APPENDIX BThe effects of lighting on crime: American and British evaluations

238
Table 1: Street lighting evaluations not meeting inclusion criteriaAuthor, PublicationDate, and Location Reason for Not
Including
ProgrammeOther
InterventionsSample Size Follow-up
and Result
1Hack (1974),
Norfolk, Virginia,USA
Crime notmeasured (fear
of crimemeasured)
None n/a n/a
2Siemon and Vardell
(1974), Dade county,Florida, USA
No control areaused
None
1 publichousing,project
(LarchmontGardens)
9 months;class I crimes: -
22.9%(245 to 189);
class II crimes: -51.4% (72 to 35)
3Krause (1977), NewOrleans, Louisiana,
USA
No control areaused
None1 commercial
area
9 months;commercial night
time burglary(mean monthly
difference): -1.4
4
Kushmuk andWhittemore (1981),Griswold (1984),Lavarakas and
Kushmuk (1986),Portland, Oregon,
USA
Nonecomparablecontrol area(rest of city)
Multiple (e.g.security surveys,clean up days)
1 commercialstrip andadjacentstreets
34 months;commercial
burglarydecreased, othercrimes no change
(time seriesanalysis)
5Bachner (1985),
Camillus, New York,USA
No control areaused
none1 parking lotof shopping
mall
<1 year; vehiclebreak ins: “
virtuallyeliminated”
6Davidson and
Goodey (1991), Hull,England
No control areaused
none1 residential
area(Dukeries)
6 weeks;percentage ofvictimisations:+9.5% (63% to
69%)
7Virj and Winkel
(1991), Enkhuizen,the Netherlands
Crime notmeasured (fear
of crime andperceived risk of
victimisationmeasured)a
none n/a n/a
6
Atkins, Hussain andStorey (1991),Wondsworth,
England
Number ofcrimes too
small. Victimsurvey response
rate before=37%
none1 relit area, 1adjacent non
relit area
12 months:reported crime:14.5% (7480 to
6399)VS: 7 weeks: relit
crimes -35.9%(39 decreased to
25); controlcrimes -69.2%
(13 to 4)
9Ramsay and Newton
(1991), Hastings,England
Number ofcrimes too small
none1 relit area, 1control area
7 month:recorded crime in
relit area+40.0% (15 to
21); controlcrimes +30.6%
(85 to 111)

239
Author, PublicationDate, and Location
Reason for NotIncluding
ProgrammeOther
InterventionsSample Size
Follow-upand Result
10
Challinger (1992),South Australia andNorthern Territory,
Australia
No control areaused
Multiple (e.g.,target hardening
security staff)
35,000 publicpay phone
3 years; bvandalism:-
19.0% (1373 to1112)
11Nair, Ditton andPhilips (1993),
Glasgow, Scotland
No control areaused and crimenot measured(fear of crime
measured)
Multiple (e.g.,paths widened ,entry phones)
n/a n/a
12Tilley (1993),
Salford, EnglandNo control area
usednone 3 businesses
12 months; totalcrimes: -72.4%
(29 to 8)
13La Vigne (1994),
Austin, Texas, USANo control area
usednone
38convenience
stores
n/a; thefts ofgasoline: -65%
14
Ditton andNair(1994), Glascow
and HighBlantyre,Scotland
No control areaused
none1 residentialarea in both
sites
3 months; 2 sitescombined: total
personalvictimisation: -
50.0% (12 to 6);total vehicle
victimisation: -95.7% (23 to 1);
total policerecorded crime: -14.0% (57 to 49)
15
Painter (1994), 3areas in London,
England, EdmontonTower Hamlets
Hammersmith andFulham
No control areaused (for all 3
sites)
None (for all 3sites)
1 street and 1pedestrianfootpath, 1
street, 1 street
6 weeks; totalcrime (at night): -
85.7% (21 to3)6 weeks: total
crime at night -77.8% (18 to 4)12 months; totalcrime (at night):
2 to0
16Nair, Mc Nair and
Ditton (1997)Glasgow, Scotland
No control areaused
none1 carriage-
way
2 years;pestering/
following: -48.2% (112 to
85); sexualproposition: -
54.2% (24 to 11);assault/ mugging:
3 to 1; sexualassault: 1 to 0(all at night)
a Respectively, the questions asked were: “‘To what extent do you feel safe here?’“ and “‘How likely doyou think it is that you could be molested here?’“ (Vrij &Winkel, 1991, p. 211).b Follow-up period not specified for street lighting intervention. Notes: n/a. = not available or notapplicable. VS = Victim Survey.
Source : Farrington and Welsh ( 2002)

240
Table 2: American Street lighting evaluations meeting inclusion criteriaAuthor,
PublicationDate, andLocation
Context ofintervention
Type ofintervention
(otherinterventions)
Sample Size
Outcomemeasuresand datasource
Researchdesign
1
AtlantaRegional(1974)
Commission,Georgia
City Center(high robbery)
Improved (4X)street lighting
(none)
E=selectedstreets in
census tract27, C= restof streets incensus tract
27
Crime(robbery,
assault andburglary);
policerecords
Before-after,experimental –control; before
and after;periods= 12
months
2
Department ofInter-
governmentalFiscal Liaison(1973, 1974)Milwaukee,Wisconsin
Residentialarea and
commercialarea (olderresidents)
Improved (7X)street;
lighting; andproperty
offences)none
E= 1 area(3.5 miles ofstreets), C=1
adjacentarea
Crime(property
and personcategories);
policerecords
Before- after.Experimental-control; before
and after;periods= 12
month
3
Inskeep andGoff (1974),
Portland,Oregon
Residentialneighbourhood (high crime)
Improved(2X)street;
lighting;(none)
2 E areas; 2A areas; C=surrounding
areas
Crime(burglary,
assault andburglary);
police report
Before - after;experimental-control; before
and afterperiods= 6 or
11 months
4Wright et al.
(1974)Kansascity, Missouri
Residentialand
commercialareas (high
crime)
Improvedstreet lighting;
(none)
E= 129 relitblocks in 4relit areas;C=600 non-relit blocks
in sameareas
Crime(violent and
propertyoffences);
policerecords
Before – afterExperimental-control; before
and afterperiods= 12
months
5
HarrisburgPolice
Department(1976),
Harrisburg,Pennsylvania
Residentialand
commercialareas
Improvedstreet lighting
(none)
E=1 highcrime area;
C=1adjacent
area
Crime(violent and
propertyoffences);
policerecords
Before-after;experimental-control; before
and afterperiods= 12
months
6
Sternhell(1977), New
Orleans,Louisiana
Residentialand
commercialareas
Improve streetlighting (none)
E= 2 highcrime areas;
C=2adjacent
areas
Crime(burglary, vehicle
theft andassault);
policerecords
Before-after;experimental-control; beforeperiod=51mont
hs ;afterperiod=29
month
7
Lewis andSullivan
(1979), FortWorth, Texas
Residentialneighbourhoo
d
Improve (3X)street lighting;
(none)
E=1 highcrime area;
C=1adjacent
area
Crime(total);police
records;before and
after
Before-after;experimental-
control;periods=12
months
8
Quinet andNunn (1998),
Indiana police,Indiana
Residentialneighbourhoo
d
Improvedstreet lighting;
policeinitiatives)
E=2 multiBlock areas;C=2 areas
with no newlights
Calls forservice
(violent andpropertycrime);police
records
Before-after,experimental-control; before
and afterperiod= 6-9
months
Source : Farrington and Welsh ( 2002)
241
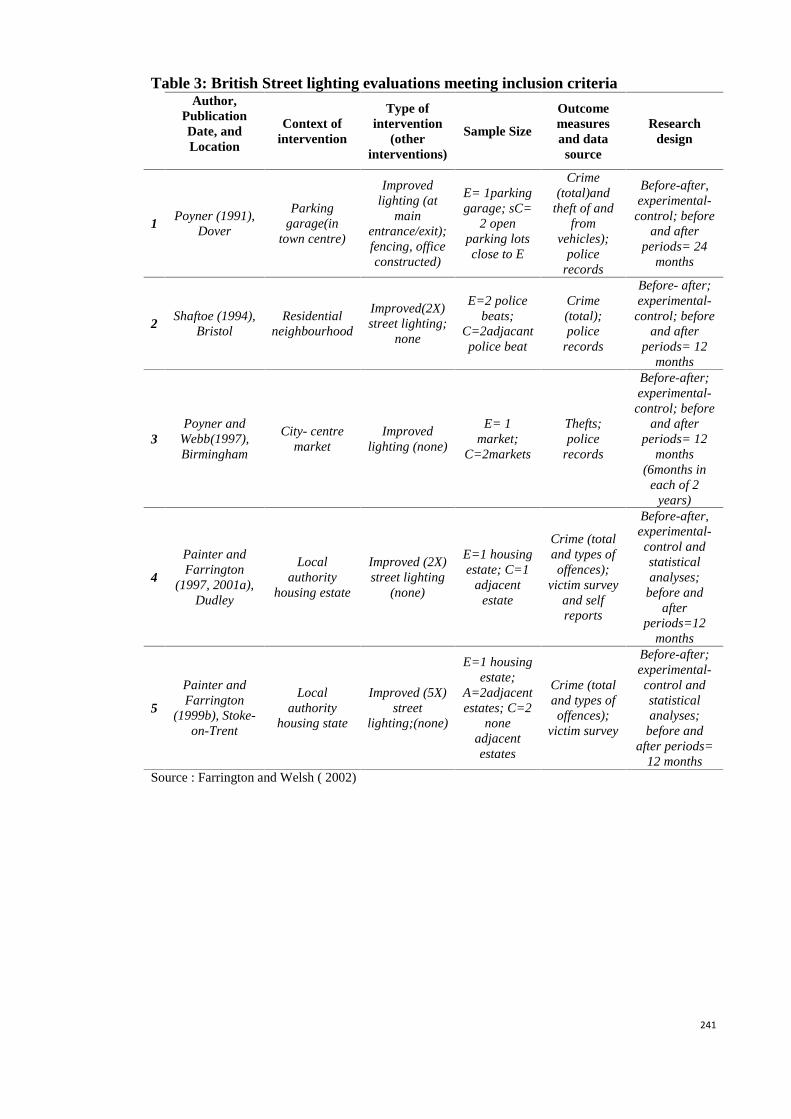
Table 3: British Street lighting evaluations meeting inclusion criteriaAuthor,
PublicationDate, andLocation
Context ofintervention
Type ofintervention
(otherinterventions)
Sample Size
Outcomemeasuresand datasource
Researchdesign
1Poyner (1991),
Dover
Parkinggarage(in
town centre)
Improvedlighting (at
mainentrance/exit);fencing, officeconstructed)
E= 1parkinggarage; sC=
2 openparking lotsclose to E
Crime(total)and
theft of andfrom
vehicles);police
records
Before-after,experimental-control; before
and afterperiods= 24
months
2Shaftoe (1994),
BristolResidential
neighbourhood
Improved(2X)street lighting;
none
E=2 policebeats;
C=2adjacantpolice beat
Crime(total);police
records
Before- after;experimental-control; before
and afterperiods= 12
months
3Poyner and
Webb(1997),Birmingham
City- centremarket
Improvedlighting (none)
E= 1market;
C=2markets
Thefts;police
records
Before-after;experimental-control; before
and afterperiods= 12
months(6months in
each of 2years)
4
Painter andFarrington
(1997, 2001a),Dudley
Localauthority
housing estate
Improved (2X)street lighting
(none)
E=1 housingestate; C=1
adjacentestate
Crime (totaland types ofoffences);
victim surveyand selfreports
Before-after,experimental-control andstatisticalanalyses;
before andafter
periods=12months
5
Painter andFarrington
(1999b), Stoke-on-Trent
Localauthority
housing state
Improved (5X)street
lighting;(none)
E=1 housingestate;
A=2adjacentestates; C=2
noneadjacentestates
Crime (totaland types ofoffences);
victim survey
Before-after;experimental-control andstatisticalanalyses;
before andafter periods=
12 monthsSource : Farrington and Welsh ( 2002)

242
APPENDIX COutdoor lighting equipments

243
Outdoor Lighting Equipments
Equipment should be evaluated, selected based upon its characteristic advantages and disadvantagesand applied correctly to provide lighting that is appropriate for specific functions. Lighting designrequirements and standards, streetscapes and aesthetic needs for both day time and night time urbanenvironment and energy efficiency are dominant factors in selecting the lighting fixtures. According toGerken et al. (2003) lighting components can be grouped together in terms of their functions and they aregenerally described as the optical system, the electrical system, and the structural system.
The optical system comprises of the light source (lamp), reflector, refractor, and housing whichcomprise a luminaire. The electrical system is made up of the ballast, wiring, photocells, and other minorcomponents. The structural system supports the luminaire and associated equipment and is comprised ofthe mounting brackets, pole, and foundation.
Optical system
Lamps: the most important element of illumination system is the light source.
“Lamp is the source made in order to produce an optical radiation usually visible” (Tichelen et al.,2007. P.22)
According to IESNA’s definition’s of the lamp as “An electric light source is a device, whichtransforms electrical energy, or power (in watts), into visible electromagnetic radiation, or light (lumens).The rate of converting electrical energy into visible light is call luminous efficacy and is measured inlumens per watt” (IESNA 2000, www.darksky.org).
A lamp is the principal determinant of the visual quality, economy, efficiency and energyconservation and is selected on the basis of cost and performance (Gerken et al., 2003). Cost factorsinclude purchase price, installation cost, and maintenance cost, energy efficiency and useful life.Performance factors include colour, lumen output and maintenance of lumen output (OLCR, 2001).
Several types of lamps have been used for street lights since 19 century. Incandescent, Fluorescent,Low Pressure Sodium (LPS), High Intensity Discharge (HID), Mercury Vapour (MV), Metal Halide(MH), High Pressure Sodium (HPS), Induction. Today, street lighting commonly uses high-intensitydischarge lamps, often HPS high pressure sodium lamps. Such lamps provide the greatest amount ofPhotopic illumination (well lit condition that allows human and animals colour perception) for the leastconsumption of electricity (Perth and Kinross Council, 2008).
To select a lamp, the colour of lighting should be considered where pedestrians are concerned. Goodcolour rendering helps objects appear naturally and pleasant to the public. Criminologists believe that toprovide good quality street lighting, white colour lamps are preferable to be used rather than thetraditional yellow/orange lamps as it allows better recognition of colours of clothing, hair, eyes ofpotential offenders. Colour rendition is more difficult under yellow-orange light source of sodium vapour.Considerable majority of people find it preferable and more pleasant (Philip, 2008).
Benefits of using white light are as follows:
“ It can give better colour rendering which helps better identification for police andresidents; It can effect to reduce fear of crime; It can increase reaction time of drivers byup to 50% which can improve road safety; Encourages and aids mobility of pedestriansduring the cover of darkness; Improves the night time street scene and the overall quality oflife of its residents and perhaps most relevant” (Perth & Kinross Council, 2008)
Ease and accuracy of colour rendition translate into a more attractive night time pedestrianatmosphere. They make streets feel safer and more attractive to pedestrians. For these reasons, the CrimePrevention through Environmental Design (CPTED) process favours white-blue street lighting overyellow-orange lighting (Salt City Street Lighting Master Plan, 2006).

244
Table 1 lists a variety of lamps for outdoor lighting currently available, with their performancecharacteristics:
Table 1.0 Overview of common street lighting types
Factor Incandescent Metal Halide High Pressure Sodium Induction
Efficiency (lumens/watt) 8-18 38 -75 72 – 115 64 - 73
Lumen/Maintenance 90 (85) 75 (65) 90 (70) 75 (50)
Lamp Life/(hours) 750 – 2000 10,000 – 20,000 18,000 – 24,000 100,000
Energy Use High Medium Low Low
Colour Rendition Very Good Very Good Moderate Very Good
Efficiency: lamp output efficiency at 50% lifetime of lampLumen maintenance: percent of initial lamp output at 50% lifetime of lamp and at end of lamp lifetime (in parentheses)Lamp life: approximate typical lifetime of lamps in hoursEnergy use: indicator of energy costsColour rendition: relative ability of average observer to accurately perceive colours under the light types shown
Incandescent Very inefficient and short life, street lights should be retrofitted for more energy efficient options
Mercury Vapour street lights should be retrofitted for more energy efficient options
High Pressure Sodium Energy efficient but poor colour rendering quality, shouldn’t be used if colour rendering is important
Low Pressure Sodium Very Energy efficient but very poor colour rendering quality
Metal Halide Energy efficient and provide good colour rendering quality,
Fluorescent Energy efficient and good colour rendering
Induction Efficient, good colour and long life but limited availability and less optical control
LED Long lasting, Durable, Cool, Mercury- free, More efficient, Cost effective, Light for remote areas
Source : NYSERDA ( 2002)
Luminaire: A luminaire is defined as a complete unit consisting of a lamp, together with the partsdesigned to distribute the light and shape it into desired pattern on the roadway, to position and protect thelamp, and to connect the lamp to the power supply. Components that make up a luminaire includereflector, refractor and the housing.
“luminaire is apparatus which distributes, filters or transforms the light transmitted from one ormore lamps and which includes, except the lamps themselves, all parts necessary for fixing andprotecting the lamps and, where necessary, circuit auxiliaries together with the means for connecting thelamps to the electric supply” (Tichelen et al., 2007.P.22)
Classification of light distributions is made on a plan view of a roadway which has superimposed onit a series of lines parallel with the roadway and another series transverse to the roadway (SUDAS, 2008).These lines, which are spaced in multiples and fractions of the mounting height, are referred to asLongitudinal Roadway Lines (LRL), and Transverse Roadway Lines (TRL), as shown in Figure 1
The spacing of luminaires is often influenced by the location of utility poles, block lengths, propertylines and the geometric configurations of the terrain features (IESNA, 2000). In order to avoid glare, lighttress pass and light pollution, glare shields may be added to control light distribution. There are four typesof optical system or shielding the luminaires that provide different degrees of control.
These include the following: Non-cut off, semi-cut off, cut off and full-cut off. Shielding is toreduce the lighting that escapes to the night sky and reduce glare. (Eley associates, 2002)
Non-cut off optics, allow light to be emitted in all directions and there is no limitation on lightdistribution at any angle;

245
Figure 2.0: Cut off LuminariesSource: Eley associates (2002)
Semi-cut off optics, allow most of the light to be emitted below 90 degrees, but some light (up to5%) to be emitted above 90 degrees
Cut off optics has more controlled lighting than semi-cut off. Less than 2.5% of the light is allowedto escape the fixture above 90 degrees;
Full-cut off optics put light on the ground below the fixture only. Full-cut off optics does not emitlight above 90 degrees;
Improved lighting programs usually consist of replacing the lamps and luminaires that is designedto efficiently provide appropriate lighting.
Figure 1.0: Light distribution patternsSource: SUDAS (2008)

246
Structural System
Pole: light poles are a significant visual element of lighting system in both day time and night time.They have a typical technical and economical life span from 30 to 50 years. “They are available in avariety of shapes, materials and finishes. They should be selected according to short or long term costs,functional considerations and aesthetic concerns” (Herculaneum Master Plan, 2006)
Different types of light poles consist of Concrete, Galvanized, Painted Steel, Weathered andDecorative Wood, Weathered Steel poles.
Poles are chosen based on their functional and aesthetics appropriateness. Proper height and spacingis important, as it can affect the illumination intensity, uniformity of light distribution and can reduceenergy and maintenance costs.
Pole spacing depends on the character and geometry of the road way, physical features, availabilityof maintenance and overall lighting objectives. In order to support the luminaire and pole structure, thefoundation must be designed to support the weight of the structure as well as resist wind loads andvibrations.
Electrical System
Cables and Wires: Under grounding overhead utility wires has been suggested as a key to achievingadequate street lighting. (Weaver,1997)
There are some advantages and disadvantages of underground eclectic facilities as follows:
Improving aesthetic, lowering tree trimming cost, reducing live wire contact, fewer outages duringnormal weather, fewer momentary interruptions, improved utility relations regarding tree trimming, fewerstructure impacting sidewalks are some of potential benefits of underground electric system (Brown,2007).
Stranded asset cost for existing overhead facilities, environmental damage including soil erosionand disruption of ecologically sensitive habitat, utility employee work hazards, during vault and manholeinspections, increase exposure to dig-ins, longer duration interruptions and more customers impact peroutage, susceptibility to flooding , storm surges and damage during post storm clean up, reducedflexibility for both operations and system expansions, reduced life expectancy, higher maintenance andoperating cost, higher cost for new data bandwidth are the potential disadvantages of underground electricfacilities (Brown 2007, Quanta Technology, 2009).
But studies have shown that the public found the landscape impacts of overhead lines unacceptableand it has been widely acknowledged by electricity industry (Cowell, 2003).
Controllers: Outdoor lighting is usually operated as needed from sunset to sunrise. Therefore, theobjectives and equipments should be employed to control unnecessary usage of lighting.
Timers prevent outdoor lights from being left on during the day and provide other operating houroptions if lighting is not needed throughout all hours of darkness
Motion detector turn on the light when on object moves within the range of the sensor; the time thelight remains on can be adjusted, typically up to 30 minutes and vary in price base on their sensitivity.
Photocell sensors can either turn lights on and off or be connected to a dimmer that graduallyadjusts lighting levels.

247
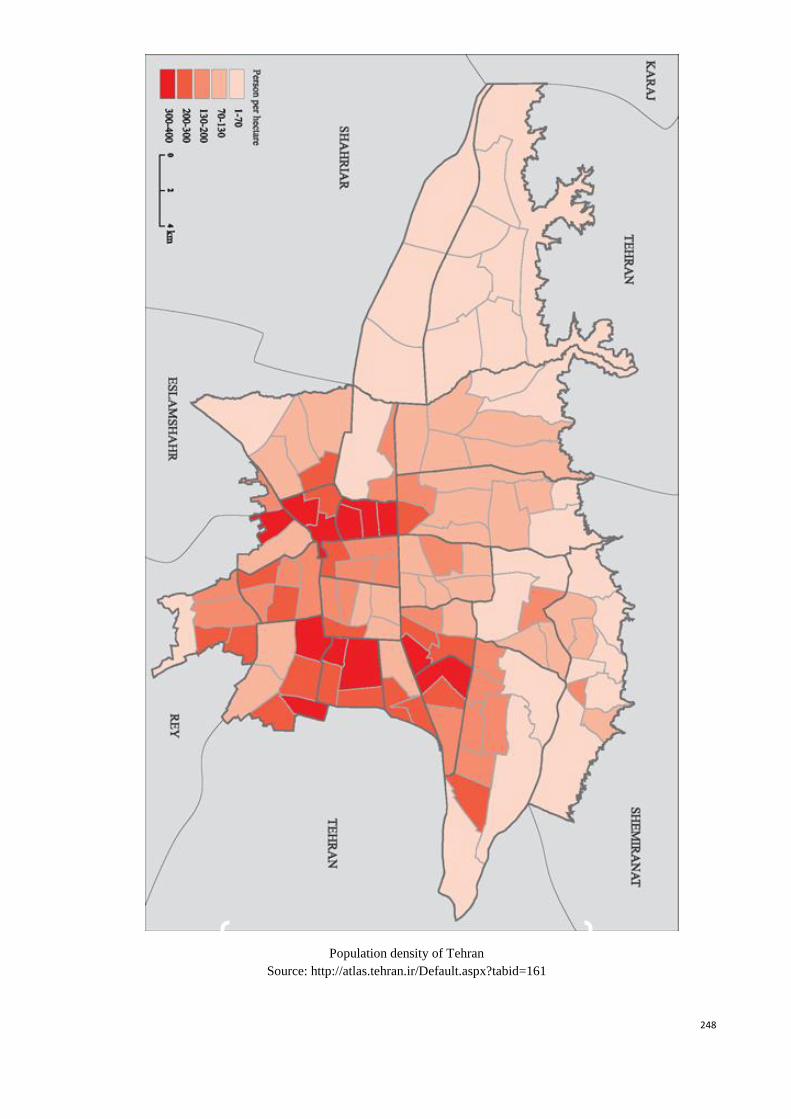
APPENDIX DPopulation density of Tehran urban areas
248
Population density of TehranSource: http://atlas.tehran.ir/Default.aspx?tabid=161

249
APPENDIX EQuestionnaire Survey (Persian and English version)

250

251

252

253

254

255

256

257

258
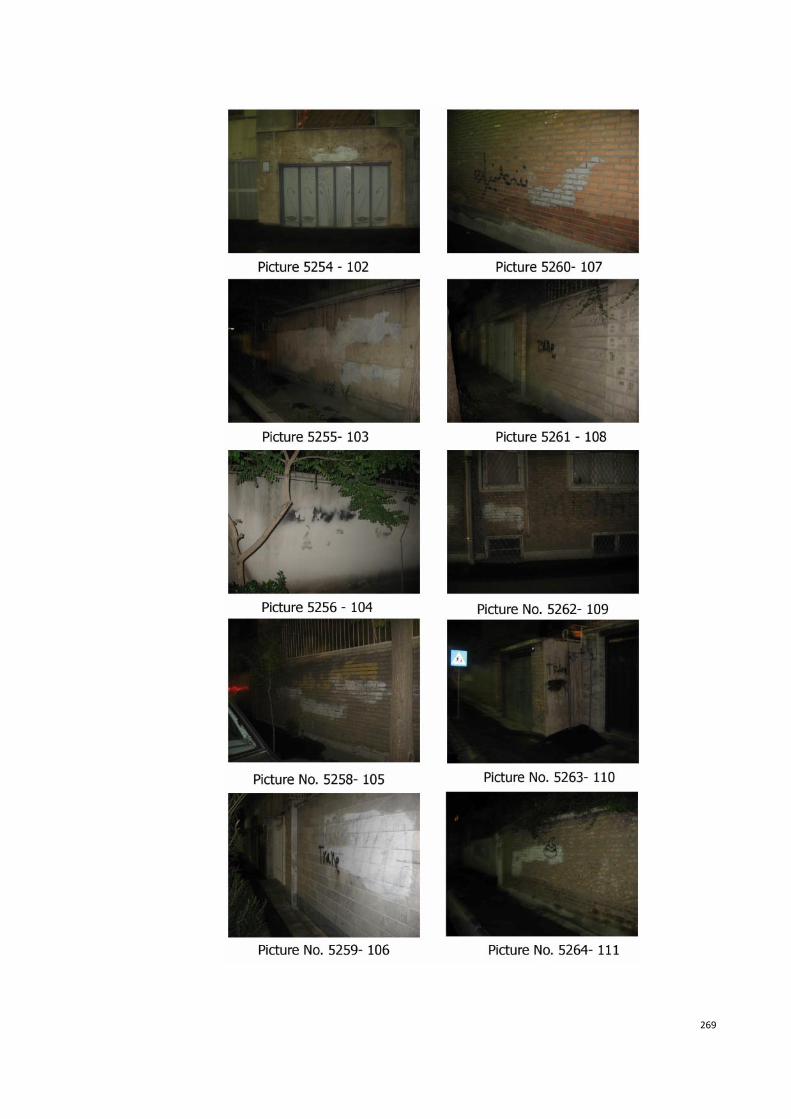
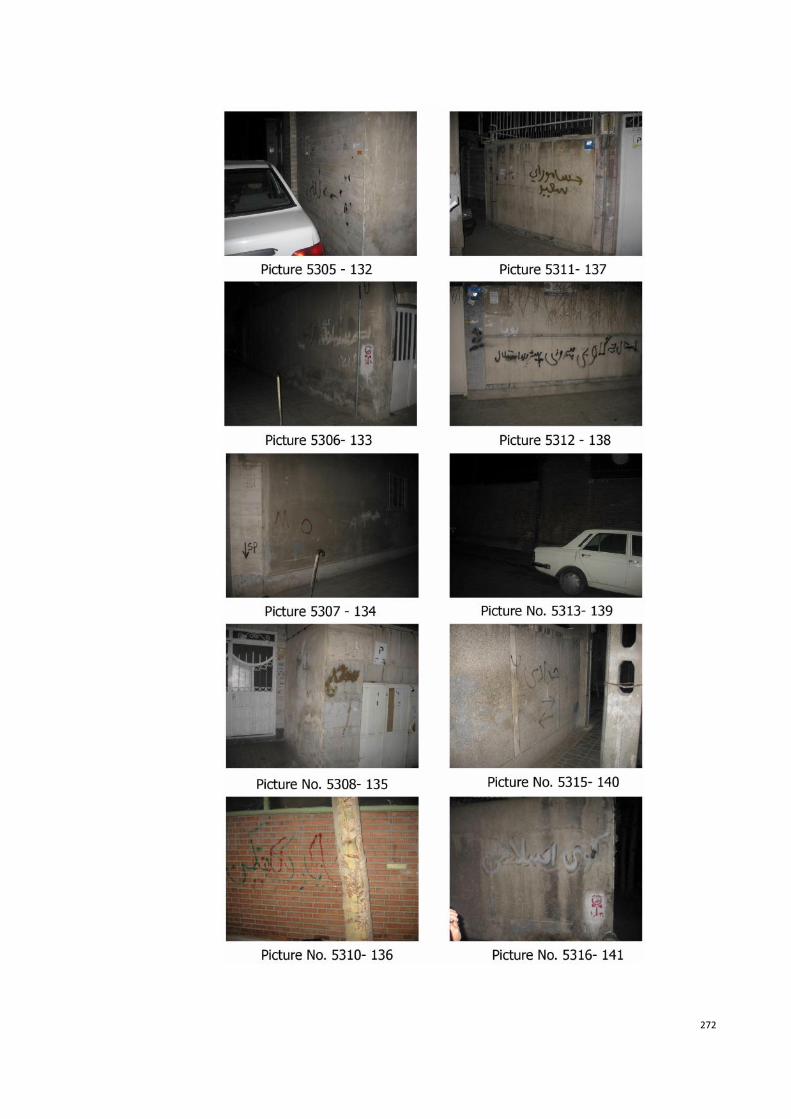
APPENDIX F
Observation survey: photos

259

260

261

262

263

264

265

266

267

268
269

270

271
272

273

274

275
PUBLICATIONS
a) Papers Published in 2009-2010
Rezaee S., SP Rao & Arbi E. (2010). Vandalism in Tehran, Iran: Influence of some ofthe Urban Environmental Factors. Journal of Design and the Built Environment(JDBE). Volume 6. June 2010.
Rezaee S. (2009). A review on the effects of improved lighting to prevent crime. 4TH
Asian Post Graduate Seminar, University Malaya. Faculty of the BuiltEnvironment. 14-16 April, 2009.
Rezaee S. (2009). The effects of Urban Environmental Factors to Prevent Vandalism inTehran, Iran. International Conference on Communication for SustainableTomorrow. University Saint Malaysia. School of Communication. 9-11 December2009.
Rezaee S., SP Rao & Arbi E. (2010). Vandalism In Urban Areas: Tehran, Iran. 5TH
Asian Post Graduate Seminar, University Malaya. Faculty of the BuiltEnvironment. 1-2 November 2010
b) Papers Submitted for Publication
Rezaee S., SP Rao & Arbi E. (2010). A Field Study of Perceptions by Juveniles onVandalism in Tehran , Iran. Pertanika Journal of Social Sciences and Humanities(JSSH). University Putra Malaysia