Appendix A Market Analysis - Norwalk, CT
46
Appendix A Market Analysis East Norwalk Neighborhood TOD Plan October 2020 Prepared for the City of Norwalk Prepared by Harriman I RKG I NV5
Transcript of Appendix A Market Analysis - Norwalk, CT

Appendix A Market AnalysisEast Norwalk Neighborhood TOD Plan
October 2020Prepared for the City of Norwalk
Prepared by Harriman I RKG I NV5

NORWALK EAST AVENUE TOD PLANNING STUDY
Existing Conditions and Market Analysis
May 2019 Prepared for Harriman
Prepared by RKG Associates
76 Canal Street Suite 401
Boston, MA 02143 617.847.8912

1
RKG Associates, Inc. is a multi-disciplinary consulting firm, founded in 1981. We serve private, public, and institutional clients and provide a comprehensive range of advisory, planning, marketing, and management services throughout the US and around the world. We’re proud that the projects we’re involved in are projects that get built – projects that happen – projects that work. RKG is headquartered in Alexandria, VA, and has offices in Boston, Atlanta, Dallas, and Durham, NH. This report was led by: Eric Halvorsen, AICP Vice President and Principal Ryan Kiracofe Senior Urban Planner & Real Estate Analyst

2
INTRODUCTION RKG Associates was retained by Harriman, in partnership with the City of Norwalk, Connecticut, to complete an economic and market analysis of the portion of the East Norwalk neighborhood within a half-mile radius of the East Norwalk train station (the “study area”). This first deliverable consists of an analysis of existing demographic and economic conditions for Norwalk and East Norwalk, and the market conditions for a variety of uses in the study area. This report includes an analysis of broad demographic and economic trends, a review of real estate development trends in Norwalk, and summaries of the market potential for residential, commercial, and light industrial uses in the study area.
KEY FINDINGS Norwalk and Fairfield County are some of Connecticut’s only communities experiencing economic and population growth. Between 2010 and 2017, Norwalk’s population grew by 4.6 percent to 88,537. Four of the state’s eight counties lost population over that period. Fairfield County is the only Connecticut county projected to experience population growth between now and 2023. Shifting demographics have changed Norwalk’s market for housing and amenities in the last decade. Norwalk is rapidly becoming more diverse; a declining number of white residents has been offset by growing black, Asian, and especially Hispanic/Latino populations. While Norwalk’s population is growing older, like most suburban areas across the country, the city has fared better than most at attracting 20- to 34-year-olds since 2010. Attracting these residents can help protect the local economy against risks that come with an aging population. Local incomes and wages have grown steadily, a trend not seen in most parts of the state. Median income growth of 12 percent and average wage growth of 14 percent since 2010 indicate that Norwalk’s residents and workers have benefitted from a strong national and New York City metro economy. Norwalk’s median household income of nearly $82,000, while not as high as the Fairfield County’s median, makes it one of the state’s highest-income communities. Retail, Healthcare, and Professional, Scientific, and Technical Services remained Norwalk’s largest employment sectors in 2017. Despite five percent employment growth since 2010, projections show Norwalk’s job count stabilizing, instead shifting workers into higher-earning jobs. The city’s growing knowledge economy will play an expanded role as the New York City region continues its shift towards technology, information services, and life sciences, and away from legacy manufacturing. While the forthcoming SoNo Collection mall will provide an immediate boost to retail hiring, longer-

3
term employment in the sector is projected to decline as nationwide consumer preferences continue to shift. Norwalk’s residential development has taken on different forms since 2008, with an increase in location-focused mixed-use structures that include multi-family housing. The average density, or floor-area-ratio1, of residential buildings built since 2008 has been nearly four times that of Norwalk’s pre-2008 structures. Hundreds of new residential units in walkable, mixed-use areas like South Norwalk, the Waypointe District, and Wall Street have played a key role in attracting 20- to 34-year-olds and subsequent retail and restaurant amenities. The city’s overall housing market is reported to be strong, with housing prices and asking rents on the rise. Despite a diverse housing stock, Norwalk is a high-cost market in a region with other even higher-cost communities like Greenwich. In 2018, the city’s median home sale price reach $409,000, 13 percent higher than in 2013 (Fairfield County’s median price saw no growth over that period). Median rents grew to around $2,440/month. Demand for office space across Fairfield County has slowed, although refurbishment and use conversions of existing spaces have provided new options for prospective firms. The Norwalk area’s 2018 average asking rent of $32.19/sf/yr was virtually equal to the county average. Negative absorption across the region in 2018 made any significant new office construction unlikely in the near term. Despite a strong overall market, the East Norwalk study area’s small lots and historic character mean it has few suitable parcels for transformative development. Concerns over car traffic and parking may play less of a role in curtailing development activity than the study area’s layout and existing land uses. The vast majority of East Norwalk parcels are too small to accommodate new construction of a scale that would attract most for-profit developers. The study area’s market for new retail and restaurant development is limited due to its relatively medium density, segregated land uses, and lower income profile versus surrounding communities. East Norwalk’s population is not large enough to support most types of retail businesses on its own, and a rise in lower-income residents means the study area has less purchasing power than some neighboring communities. Opportunities may exist for small footprint, unique retailers to succeed in the study area, but small market demand and the presence of highly competitive retail environments within a 15-minute drive may make attracting new retail to the area a challenge.
1 Floor-Area-Ratio, or FAR, is defined as a property’s gross built square feet as a proportion of its ground square footage. For example, a 25,000 square foot building on a 50,000 square foot property – regardless of its height - would have an FAR of 0.5.

4
The 25 Van Zant Street office/commercial building refurbishment and the Spinnaker mixed-use project, both near the train station, have the potential to catalyze a new “village center.” While community concerns over parking and traffic linger, the two projects can help provide the population and worker density needed to support some additional amenities that the community desires.
BACKGROUND & PURPOSE RKG Associates was retained by the lead consultant, Harriman, to complete a series of economic analyses in support of the “East Norwalk Transit-Oriented Development Plan.” The work will be delivered in three parts. This first deliverable, a Market Analysis, will assess the potential for different uses within the study area given the city of Norwalk’s economic and demographic profile. It includes a review of recent development activity in Norwalk, as well as prevailing asking rents and prices for real estate. A second deliverable will provide a more in-depth financial feasibility analysis for three potential development alternatives, and the project’s final economic deliverable will provide an action plan and recommendations for the site’s best and most feasible uses.
STUDY AREA & LOCATION CHARACTERISTICS On a February 2019 visit to Norwalk, the consultant team visited the East Norwalk study area and surveyed Norwalk as a whole to document business composition, vacancy, and neighborhood conditions. The team was accompanied on a driving tour of East Norwalk by members of the Plan’s Steering Committee and Planning Department. The following site description is based upon our own observations as well as materials provided by the City. The study area consists of a historic, largely residential neighborhood of low-to-moderate density, with a number of small commercial clusters including a business district immediately adjacent to the East Norwalk train station. The area is generally bounded by the Norwalk River to the west, parcels just north of Interstate 95 to the north, 2nd Street to the south, and a collection of residential neighborhoods roughly in line with Bridge St. and North Bridge St. to the east. The study area represents an important opportunity for economic development for the city of Norwalk. The presence of a rail station that boasts quick, direct service into New York City and Stamford is an incredible asset that cities throughout the region would covet (while its service is somewhat limited today, that may not always be the case). Its location in a low- to moderate-density community, with close proximity to several of Norwalk’s other thriving neighborhoods, makes East Norwalk station a rare opportunity to establish smart land use patterns that take full advantage of transit access. Several parcels within the study area are either currently undergoing development/redevelopment or are candidates for investment if market demand materializes. These parcels underline the importance of having a strong, community-supported plan for the area, so that

5
investment can maximize the train station’s utilization while delivering value to the community, which sees itself as a “village in a city.” While this market study examines the potential for all major land use typologies, the study area’s potential is defined in many ways by the medium-density residential neighborhoods that surround it and the small lots that comprise most of its area. The neighborhood’s character will remain predominantly residential. A relative lack of medium- and large-sized parcels in the study area places a natural limit on the amount of ground-up commercial or multi-family residential development feasible, barring a challenging parcel assemblage process. Still, the presence of some light industrial and commercial office uses, in addition to retail and restaurants, make clear the station area’s mixed-use potential. For the purposes of this study, the area’s access to all major utilities, including water, sewer, electric, natural gas, and telecommunications infrastructure does not preclude it from any specific land use. The study area is comprised of many different zoning districts, including several residential districts that allow a range of densities, industrial, and two neighborhood business “mixed-use” districts. In general, height restrictions and lot coverage requirements place limits on the amount of transformative development that can take place. While zoning may ensure that East Norwalk keeps its “village” feel, it also may prevent the density of workers and residents needed to bring additional amenities to the area and facilitate an increase in transit ridership.
REGIONAL CONTEXT Norwalk is a coastal city in Fairfield County, Connecticut, located where the Norwalk River empties into Long Island Sound. Fairfield County itself comprises Connecticut’s far southwestern corner, and its nearest points to New York City. While home to strong employment centers in their own right, Fairfield County municipalities like Stamford, Norwalk, Fairfield, and Bridgeport are known in part for their commute-ability into New York City; all of Fairfield County is included in the Census Bureau’s New York-Newark-Bridgeport
Figure 1: Norwalk within Connecticut & Fairfield County

6
Combined Statistical Area.2 Norwalk is part of Connecticut’s Southwest Workforce Development Area (WDA) as defined by the Connecticut Department of Labor. The Southwest WDA is home to over 180,000 jobs and nearly 12,000 business establishments.3 As the state of Connecticut has faced economic and socioeconomic challenges in recent decades, Fairfield County and its cities have increasingly established themselves as the state’s economic engines. Employment in Fairfield County grew by five percent from 2010 to 2017, to over 475,000 jobs, led by growth in the Health Care, Information, and Professional, Scientific, and Technical Services sectors, among others. Already home to a significant cluster of Information, Financial Services, and Insurance firms that benefit from access to the New York City metro market, the area is continuing its long-term transition into a knowledge-based service economy. Growth in many of these sectors has softened the local impact of continued job losses in the Manufacturing and Utilities sectors.
2 US Department of Commerce, US Census Bureau 2012 Economic Census 3 Connecticut Department of Labor, Employment and Wages by Industry, Southwest WDA, March 5, 2019

7
Figure 2: Norwalk within Fairfield County

8
SOCIODEMOGRAPHICS
POPULATION In 2017, the population of Norwalk was estimated to be 88,537 people, a 3.4 percent increase since 2010. This growth rate was roughly equal to the population growth rate for Fairfield County as a whole, and well above the state’s 0.6 percent growth rate. 4 Fairfield County, already the state’s most populous, is increasingly an outlier in terms of Connecticut’s population trends. While its population grew by 3.3 percent from 2010 to 2017, Hartford County, the next fastest-growing county in Connecticut, grew by just 0.4 percent. Five of the state’s eight counties declined in population. Projections from EMSI, an economic modeling firm, estimate that Fairfield County’s population growth may slow but remain positive in the years to 2023, while every other county in Connecticut is projected to lose population (see Figure 4).5 Table 1: Fairfield County Population Growth by Age Cohort 2010 to 2017
Projected
2017 to 2023 Total Population +3.3% +1.6%
Under 20-year-olds (1.3%) (3.0%)
20 to 34-year-olds +10.1% +10.3%
35 to 54-year-olds (5.2%) (8.5%)
55 to 69-year-olds +18.2% +6.7%
70 years and over +10.2% +11.9%
Sources: US Census Bureau; EMSI Economic Modeling; RKG Associates
4 US Census Bureau, Census 2010 and American Community Survey 2013-2017 5-Year Estimates 5 EMSI Population Demographics Forecasts, April 2019
Figure 3: Population % Change by County, 2010-2017
Sources: US Census 2010; American Community Survey, 2013-2017 5-Year Estimates; RKG Associates.

9
Fairfield County’s fortunes have diverged from the rest of the state’s in part due to its ability to attract residents between the ages of 20 and 34. The county’s number of 20- to 34-year-olds, a critical demographic mostly comprised of young professionals, grew by 10 percent; the 20- to 24-year-old population grew by 16 percent from 2010 to 2017. The trend is set to continue; population projections show the county’s 20 to 34 population growing by more than 10 percent by 2023, versus the state’s projected three percent growth rate in the same cohort. Norwalk alone may add as many as 1,600 new residents between the ages of 25 and 29 by 2023, a 28 percent increase versus 2017. The city’s relatively diverse housing stock, including its newer amenity-laden rental and condominium options, will likely continue playing a role in attracting and retaining young professionals that commute into New York City or Stamford and are seeking lower-priced housing options. The area’s population growth has also been fueled by older residents, as the number of residents age 55 and older grew by nearly 20 percent from 2010 to 2017. As the “Baby Boomer” generation ages, an increasing number are choosing to “age in place” – remaining in their homes and, in many cases, working for longer than previous generations. While this has challenging implications for an area’s
Table 2: Norwalk Population Growth by Age Cohort, 2010-2023
Norwalk 2017 2010-2017
% Change Projected
2023 2017-2023 % Change
Total Population 88,537 +3.4% 91,175 +3.0%
Under 20 years 20,556 +0.3% 20,384 (0.8%)
20 to 34 years 18,801 +3.9% 20,453 +8.8%
34 to 54 years 25,418 (3.3%) 23,088 (9.2%)
55 to 69 years 15,473 +17.8% 17,235 +11.4%
70 years and over 8,289 +9.1% 10,015 +20.8% Sources: US Census Bureau American Community Survey, 2012-2017 5-Year Estimates; EMSI; RKG
Associates
Figure 4: Projected Population % Change by County, 2017-2023
Sources: US Census Bureau American Community Survey, 2013-2017 5-Year Estimates; EMSI 2023 Population Estimates; RKG Associates.
10
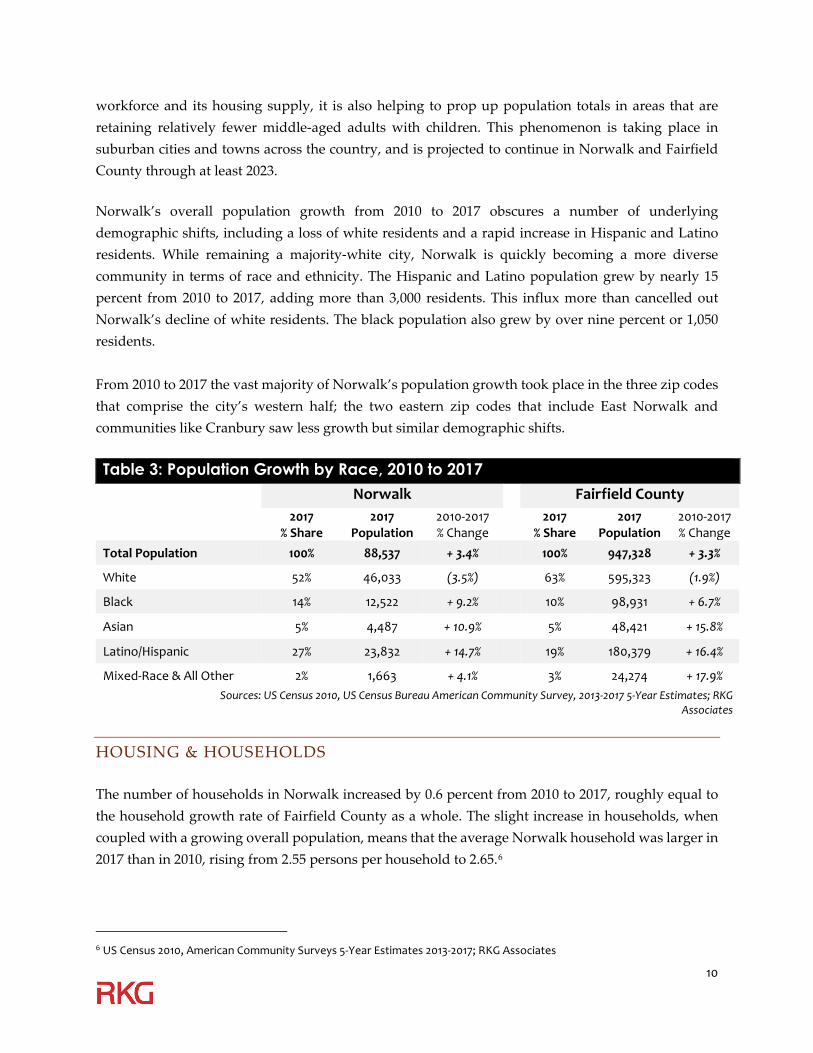
workforce and its housing supply, it is also helping to prop up population totals in areas that are retaining relatively fewer middle-aged adults with children. This phenomenon is taking place in suburban cities and towns across the country, and is projected to continue in Norwalk and Fairfield County through at least 2023. Norwalk’s overall population growth from 2010 to 2017 obscures a number of underlying demographic shifts, including a loss of white residents and a rapid increase in Hispanic and Latino residents. While remaining a majority-white city, Norwalk is quickly becoming a more diverse community in terms of race and ethnicity. The Hispanic and Latino population grew by nearly 15 percent from 2010 to 2017, adding more than 3,000 residents. This influx more than cancelled out Norwalk’s decline of white residents. The black population also grew by over nine percent or 1,050 residents. From 2010 to 2017 the vast majority of Norwalk’s population growth took place in the three zip codes that comprise the city’s western half; the two eastern zip codes that include East Norwalk and communities like Cranbury saw less growth but similar demographic shifts. Table 3: Population Growth by Race, 2010 to 2017
Norwalk Fairfield County 2017
% Share 2017
Population 2010-2017 % Change
2017 % Share
2017 Population
2010-2017 % Change
Total Population 100% 88,537 + 3.4% 100% 947,328 + 3.3%
White 52% 46,033 (3.5%) 63% 595,323 (1.9%)
Black 14% 12,522 + 9.2% 10% 98,931 + 6.7%
Asian 5% 4,487 + 10.9% 5% 48,421 + 15.8%
Latino/Hispanic 27% 23,832 + 14.7% 19% 180,379 + 16.4%
Mixed-Race & All Other 2% 1,663 + 4.1% 3% 24,274 + 17.9% Sources: US Census 2010, US Census Bureau American Community Survey, 2013-2017 5-Year Estimates; RKG
Associates
HOUSING & HOUSEHOLDS The number of households in Norwalk increased by 0.6 percent from 2010 to 2017, roughly equal to the household growth rate of Fairfield County as a whole. The slight increase in households, when coupled with a growing overall population, means that the average Norwalk household was larger in 2017 than in 2010, rising from 2.55 persons per household to 2.65.6
6 US Census 2010, American Community Surveys 5-Year Estimates 2013-2017; RKG Associates

11
Norwalk’s growing average household size represents an anomaly versus the broader metro region and the US as a whole. Demographic changes across the country have tended to result in a rapidly growing number of one- and two-person households, typically growing at a faster rate than overall population growth. This is due in large part to citizens choosing to live in smaller households, often delaying “household formation” by marrying and/or having children later in life, or remaining single. The increasing elderly population also results in more one- and two-person households. In Norwalk, however, the household growth rate of 0.6 percent was significantly less than the population growth rate of 3.4 percent. Much of this gap was due to a decrease in the number of single-person households, and a rise in the number of smaller families like couples and three-person households. Continued growth in this cohort may point towards future demand for more condominium/apartments and smaller single-family homes.
Table 5: Norwalk Households by Type, 2017 Households % of Total Total Households 33,385 100% Family Households 22,239 67%
Married-Couple Families 16,062 48% Male householder, no wife 1,510 5%
Female householder, no husband 4,667 14% Nonfamily Households 11,146 33%
Householder living alone 9,148 27% Householder not living alone 1,998 6% Sources: US Census Bureau American Community Survey, 2013-2017 5-Year Estimates; RKG Associates
Housing development, as shown in greater detail in the Development Trends Analysis section of this report, has taken on new forms in Norwalk over the last decade. While the Census Bureau estimates
Table 4: Changes in Households by Size, 2010-2017
Norwalk Connecticut 2010-2017
Change 2010-2017 % Change
2010-2017 Change
2010-2017 % Change
Total Households + 168 + 0.6% -9,332 (0.7%)
1-Person Households (347) (3.7%) + 9,627 + 2.6%
2-Person Households + 380 + 3.7% + 17,607 + 4.0%
3-Person Households + 643 + 11.9% (5,422) (2.4%)
4-Person Households (114) (2.5 %) (10,336) (5.2%)
5-Person Households + 112 + 5.4% (9,149) (10.8%)
6-Person Households (183) (22.7%) (6,413) (21.9%)
7-or-more Person Households (323) (50.9%) (5,426) (32.2%) Sources: US Census 2010, US Census Bureau American Community Survey, 2012-2017 5-Year Estimates;
EMSI; RKG Associates

12
that Norwalk’s overall number of housing units increased only nominally from 2010 to 2017, 1,315 new apartments and condominiums were added over that period in South Norwalk and other Norwalk neighborhoods in a variety of building types. Recent rental apartment developments have increased Norwalk’s percentage of rental housing. It is estimated that over 40 percent of occupied units are rental properties, up from around 38 percent in 2010. While residential rents and sale prices have increased over the last five years in Norwalk, a diversity of housing options and neighborhoods has left room for renters on both ends of the income spectrum. Older housing units, including in the East Norwalk study area, provide more market-affordable options for lower- and middle-income households. Even new, amenity-rich apartment and condominium buildings – which command rents near the top of the Fairfield County market – represent an affordable alternative to housing closer to New York City. This balance of relative affordability and access to regional employment centers lies at the heart of Norwalk’s strong housing market performance. The overall residential vacancy rate is estimated to have dropped to 5.8 percent, down from 6.2 percent in 2010.
As covered in greater detail in the Housing Market portion of this report, Norwalk’s housing market is strong and outperforming many of its neighbors. Since 2015, Norwalk’s average home sale prices have closed a historic gap versus Fairfield County, equaling and even surpassing the county average in many recent months. In 2018, Norwalk’s median home value was estimated to be $421,900. 7 According to Zillow Research, a real estate listing aggregator, the average single-family home sale in Norwalk was $406,700 in 2018, up nearly 13 percent from 2013 – significantly outperforming Fairfield County’s flat (0.2 percent) sales growth.8
Norwalk’s average rents have risen as well, differentiating the city from a more stable rental market across much of Fairfield County. Rent growth has primarily been driven by the top of the market, in new-construction buildings that offer on-site amenities and walkable access to a mix of uses (including, in many cases, South Norwalk’s train station). Older rental properties, which comprise much of the for-rent inventory in the East Norwalk study area, remain a relatively affordable option, especially considering the employment access they offer relative to other less-connected locations in Fairfield County.
7 US Census Bureau, American Community Survey, 2013-2017 5-Year Estimates 8 Zillow Research, Home Sales Seasonally-Adjusted Price Index, March 2019.

13
INCOME Norwalk’s median household income (“MHI”) has experienced steady growth since 2010, having bottomed out in 2013 after the Great Recession. The city’s 2017 MHI of $81,546 was significantly higher than the Connecticut MHI of $73,781, while still trailing the Fairfield County median of $89,773. Norwalk’s median income growth of 7.1 percent from 2010 to 2017 was less than the 10.5 percent growth rate seen in Fairfield County. Despite Norwalk’s growth in both median income and wages for those that work in the city, 9.2 percent of Norwalk residents had incomes that placed them below the federal poverty line in 2017.9 This was just higher than Fairfield County’s 8.8 percent of residents. In 2017, 31 percent of Norwalk’s households earned less than $50,000, barely less than the percentage that did so in 2010. The city’s household income composition has, however, shifted upwards even as Norwalk’s average working resident was less educated in 2017 than in 2010 (Table 9). The 42 percent of total households that earn more than $100,000 is significantly higher than the 36 percent that did so in 2010. This is likely attributable in part to the strong national and New York Metro economies, but also because Norwalk’s newcomer households tend to have more workers per household than those that have left the city. It is notable that the city’s median household income has continued to climb even as Norwalk’s population has absorbed thousands of newcomers, many statistically likely to have less formal educational credentials (Tables 8 and 9).
9 US Census American Community Surveys, 2013-2017 5-Year Estimates
Table 6: Median Household Income Growth, 2010-2017 2010 2017 2010-2017 %
Change Norwalk $76,161 $81,546 + 7.1%
Fairfield County $81,268 $89,773 + 10.5%
Connecticut $67,740 $73,781 + 8.9%
Sources: US Census Bureau American Community Survey, 2013-2017 5-Year Estimates; RKG Associates
9% 8% 8% 8%
12% 13% 14% 13%
11% 10% 10% 9%
17% 15% 15% 13%
14%12% 12%
11%
36% 42% 41% 46%
0%
20%
40%
60%
80%
100%
2010 2017 2010 2017
Norwalk Fairfield County
$100,000 +
$75,000 - $99,999
$50,000 - $74,999
$35,000 - $49,999
$15,000 - $34,999
$14,999 and Less
Figure 5: Household Income Cohorts, 2010-2017
Sources: US Census Bureau American Community Survey, 2013-2017 5-Year Estimates; RKG Associates.

14
EDUCATIONAL ATTAINMENT Norwalk remains a highly-educated community, with 41 percent of its working-age10 population holding a bachelor’s degree or higher, according to the Census Bureau. However, significant demographic shifts have altered Norwalk’s educational attainment profile since 2010. The loss of relatively well-educated white residents (95 percent of which had a high school diploma and 53 percent with a bachelor’s in 2017) and the growth in relatively less-educated black and Hispanic/Latino residents have been key drivers (see Tables 8 and 9). Notably, as Norwalk’s Hispanic/Latino population has grown, the average educational attainment of a city Hispanic/Latino resident has decreased, meaning that newcomers’ level of formal education should statistically be lower than that of the existing Hispanic/Latino population.
Where the state and Fairfield County both saw a decrease in working-age residents without a high school diploma, Norwalk’s percentage of residents without a high school diploma grew by nearly eight percent from 2010 to 2017. Meanwhile, Norwalk’s number of college graduates decreased slightly, by around 440 residents or 1.7 percent. A review of Norwalk Public Schools data found that over 50 percent of the district’s 11,673 enrolled students were Hispanic or Latino as of June 2019.11 This is nearly double the proportion of the general population that identifies as Hispanic or Latino (27 percent). If a significant proportion of these Hispanic and Latino students choose to remain in Norwalk after graduation, eventually finding jobs
10 “Working age” is defined by the Census Bureau as residents over the age of 25. Norwalk’s recent population growth in the 20-25 age group likely consists of a significant quantity of recent college graduates, which are not included in this analysis. 11 Norwalk Public Schools, District Enrollment Summaries 6-1-2019, provided by City Staff.
Table 7: Educational Attainment, 2010 and 2017 Norwalk Fairfield County 2017
% Share
2017 Working-Age Population*
2010-2017 % Change
2017 % Share
2017 Working-Age Population
2010-2017 % Change
Total Population 100% 62,227 (1.3%) 100% 642,401 +4.9% Less than High school 13% 7,881 +7.9% 11% 68,146 (5.7%) High school or GED 23% 14,051 (9.0%) 22% 141,048 (1.0%) Some College/Associates 24% 14,719 +3.0% 21% 134,711 +3.8%
Bachelor’s Degree 24% 15,141 (8.3%) 26% 165,926 +10.1% Advanced Degree 17% 10,435 +9.7% 21% 132,570 +13.1% *“Working age population” over age of 25
Sources: US Census Bureau American Community Survey, 2013-2017 5-Year Estimates; RKG Associates

15
and perhaps starting families of their own, the city’s ongoing shift towards a more diverse population may accelerate.
Table 8: Educational Attainment* by Race/Ethnicity Trends, 2010-2017 Norwalk Fairfield County % Growth
Population % Growth
HS Diploma % Growth
Bachelor’s % Growth
Population % Growth
HS Diploma % Growth
Bachelor’s Total Population + 3.4% (1.2%) (0.4%) + 3.3% + 1.4% + 6.2% White Only (3.5%) + 1.0% + 8.0% (1.9%) + 1.2% + 9.8% Black + 9.2% + 5.2% + 16.8% + 6.7% + 8.0% + 15.6% Asian + 10.9% + 2.7% + 13.3% + 15.8% + 1.9% + 6.3%
Latino / Hispanic + 14.7% (5.6%) (13.3%) + 16.4% + 3.3% + 10.0% *Among “working age population” over age of 25
Note: Educational Attainment trends defined as 2017 % Attainment vs. 2010 % Attainment as a percentage change Sources: US Census Bureau American Community Survey, 2013-2017 5-Year Estimates; RKG Associates
ECONOMIC INDICATORS The following section presents selected trends in employment, business establishments, commuting inflows and outflows, and average wages for Norwalk and Fairfield County. Fairfield County captures the majority of the municipalities (and the vast majority of economic activity) within the Connecticut Department of Labor’s Southwest Workforce Development Area. Here, the county is used for consistency with population and household projections provided in other sections of this report.
EMPLOYMENT Despite Norwalk and Fairfield County’s increasing role as Connecticut’s economic growth driver, Norwalk’s employment grew by a modest 5.3 percent between 2010 and 2017. In adding just under
Table 9: Educational Attainment* by Race/Ethnicity, 2017 Norwalk Fairfield County
% HS Diploma % Bachelor’s % HS Diploma % Bachelor’s
Total Population 87% 41% 89% 46%
White Only 95% 53% 95% 56%
Black 87% 22% 85% 21%
Asian 91% 68% 91% 68%
Latino / Hispanic 67% 16% 68% 18%
*Among “working age population” over age of 25 Sources: US Census Bureau American Community Survey, 2013-2017 5-Year Estimates; RKG Associates

16
2,300 jobs, Norwalk roughly equaled Fairfield County’s growth rate (5.2 percent) and marginally outpaced the state’s (4.5 percent). Between 2010 and 2017, the city’s healthcare sector added 725 jobs, the largest of any sector. Roughly 440 of those were added in “Social Assistance” subcategories like Individual and Family Services, Community Food & Housing & Relief Services, Vocational Rehabilitation Services, and Child Day Care Services. While these jobs and vital services are welcome in virtually every community, these are not in sectors that are typically “high growth” or “high potential” in their ability to cultivate economic activity, especially in contrast to jobs in hospitals or medical research. Meanwhile, retail, accommodation, and food service jobs continue to play a large part in Norwalk’s overall employment base. Those three sectors account for 23 percent of Norwalk’s jobs, but just 18 percent of Fairfield County’s, reflecting the city’s strong shopping, dining, and hospitality amenities. These amenities have likely played some role in attracting higher-income residents and some better-paying jobs to Norwalk, but are also relatively low-paying jobs on their own.
Table 10: Jobs by Selected Sectors, 2010 and 2017
Norwalk Fairfield County
NAICS Industry Sector Jobs 2010
Jobs 2017
'10 - '17 % Growth
Jobs 2010
Jobs 2017
'10 - '17 %
Growth
- All Industries 43,238 45,535 +5% 451,713 475,219 +5%
44 Retail Trade 6,841 7,163 +5% 49,229 51,507 +5%
54 Professional, Scientific, & Tech Services 4,409 4,585 +4% 35,533 38,090 +7%
62 Health Care & Social Assistance 3,778 4,503 +19% 61,196 68,451 +12%
56 Administrative and Support Services 3,248 3,434 +6% 25,615 28,970 +13%
72 Accommodation & Food Services 2,379 3,049 +28% 26,333 33,825 +28%
90 Government 3,194 2,930 (8%) 48,702 47,213 (3%)
52 Finance & Insurance 3,565 2,896 (19%) 39,669 35,742 (10%)
81 Other Services 2,130 2,484 +17% 26,323 28,402 +8%
42 Wholesale Trade 2,126 2,406 +13% 14,044 14,892 +6%
23 Construction 2,196 2,401 +9% 20,043 22,143 +10%
51 Information 1,923 2,231 +16% 11,061 13,663 +24%
31 Manufacturing 2,357 2,053 (13%) 38,242 31,608 (17%)
71 Arts, Entertainment & Recreation 1,069 1,383 +29% 10,068 12,526 +24%
55 Management of Companies 1,299 1,308 +1% 12,766 12,568 (2%)
48 Transportation & Warehousing 1,338 1,302 (3%) 9,472 10,322 +9%
53 Real Estate 468 507 +8% 7,684 7,723 +1%
61 Educational Services 410 495 +21% 13,513 15,570 +15%
22 Utilities 463 364 (21%) 1,610 1,213 (25%) Norwalk data reflects estimated jobs located in ZIP codes 06850, 06851, 06853, 06854, 06855
Sources: EMSI Industry Tables, RKG Associates

17
LOCATION QUOTIENTS Location quotient analysis is a method of comparing a local economy’s employment strengths and weaknesses relative to its larger economic region – in Norwalk’s case, Fairfield County. While a location quotient of 0.8 to 1.2 indicates sector-specific employment that is roughly in line with the larger region, a quotient over 1.2 suggests that a given industry sector is an area of strength. Likewise, a quotient less than 0.8 would indicate that the city is relatively under-developed in a specific employment sector.
As shown in Table 9, Norwalk enjoys strong employment relative to the rest of the county in a number of sectors, notably in Information, Professional, Scientific & Technical Services, and Wholesale Trade. The city’s relative strength in Information jobs is especially notable given Fairfield County’s overall strength in Information versus Connecticut and the rest of the US; even excluding Norwalk, the county boasts a 1.4 location quotient in the sector. Norwalk’s employment landscape differs from Fairfield County’s in the Retail, Wholesale Trade, and Transportation and Warehousing sectors, strong local
Table 11: Location Quotients by Selected Sectors, 2010-2017
NAICS Sector Norwalk Fairfield County
Ex. Norwalk Connecticut
22 Utilities 3.1 0.6 0.8 23 Construction 1.1 0.8 0.7 31 Manufacturing 0.7 0.9 0.9 42 Wholesale Trade 1.7 0.8 0.9 44 Retail Trade 1.5 1.0 1.1 48 Transportation and Warehousing 1.3 0.6 0.6 51 Information 1.7 1.4 1.6 52 Finance and Insurance 0.8 1.9 1.9 53 Real Estate and Rental and Leasing 0.7 1.0 0.9 54 Professional, Scientific, and Tech Services 1.3 1.2 1.2 55 Management of Companies 1.1 1.9 1.9 56 Administrative and Support Services 1.2 1.0 0.9 61 Educational Services 0.3 1.4 1.3 62 Health Care and Social Assistance 0.7 1.2 1.2 71 Arts, Entertainment, and Recreation 1.2 1.5 1.6 72 Accommodation and Food Services 0.9 0.8 0.8 81 Other Services (except Public Admin.) 0.9 1.3 1.4 90 Government 0.6 0.7 0.7
Source: EMSI Industry Tables; US Bureau of Labor Statistics; RKG Associates

18
categories that are not necessarily areas of strength in the rest of the county. This may hint at strategic advantages that the city can seek to exploit in its economic development efforts. Roles in the Information employment sector include those in the media, software, telecommunications, and data processing/hosting services, among others. These range from entry-level, clerical positions to high-paying jobs on the leading edge of high-tech innovation. Norwalk is home to at least 200 firms that operate in the Information sector, according to the Connecticut Department of Labor.12 While Fairfield County’s office market has been relatively weak in recent years (see the Office Market Analysis section), East Norwalk may be able to take advantage of the city’s strong Information sector with small, creative office spaces close to the train station. Buildings like those at 25 Van Zant can provide small- and mid-sized firms with flexible spaces, while one-off spaces in smaller structures can host new businesses looking for lower-cost access to South Norwalk, Stamford, and beyond.
ESTABLISHMENTS The number of business establishments operating in Norwalk grew by nine percent from 2010 to 2017, adding a net of 291 new businesses to the city’s economy. As with overall employment, two of Norwalk’s most-represented sectors are Professional, Scientific and Technical Services and Retail. “Other Services,” a broad category that includes repair and maintenance jobs, personal and laundry services, religious organizations, and others, make up 416 of Norwalk’s firms. With just 2,484 jobs in 2017, the average business in this sector employs just six workers. The number of businesses grew in several of the sectors in which Norwalk enjoys a competitive advantage versus the rest of the county. Wholesale Trade added a net 20 businesses from 2010 to 2017, and Norwalk’s rapidly-growing Information sector saw the creation of at least nine new businesses for a total of 107. Healthcare and Social Assistance, which grew employment by 19 percent from 2010 to 2017, also saw its number of establishments grow by eight percent within Norwalk. Norwalk’s Accommodation and Food Services businesses sector expanded significantly, adding 51 net new businesses, mirroring strong employment gains. While still a small piece of the city’s overall economy, reported new arts and entertainment businesses in the Wall Street area led to a 26 percent rise in the sector’s number of establishments. Conversely, Norwalk and Fairfield County saw continued contraction and consolidation within the Manufacturing sector. The number of retail establishments also declined in the city and county, even as employment increased, suggesting that larger players are having more success in weathering the changes in the retail market.
12 Connecticut Department of Labor, Labor Market Information; Norwalk Employer Listing

19
WAGES The average wage for Norwalk workers grew to $97,980 in 2017, a 14 percent increase from 2010. This growth was primarily driven by gains at the high end of the wage spectrum. The fastest wage growth employment categories in Norwalk were primarily service industries: Finance & Insurance (+60 percent), Other Services (+60 percent), Real Estate (+42 percent), and Management of Companies (+34 percent), among others. Wage growth outpaced the estimated inflation rate of 12.4 percent during that period, reflecting “real” growth in workers’ purchasing power.13 Fairfield County’s average wage rate did not keep pace; at just 5.7 percent, county wages grew slower than inflation. Norwalk’s high and growing average wages highlight several trends. Average wages that are well above the area’s median income indicate that many of those that hold Norwalk’s highest-paying jobs do not live in Norwalk. As described elsewhere in this report, data from the US Census Bureau and Center for Economic Studies show that less than 25 percent of Norwalk’s jobs are held by Norwalk residents. Conversely, 75 percent of Norwalk’s working residents – over 30,000 in number – commute
13 Bureau of Labor Statistics, Consumer Price Index (CPI) 2010-2017
Table 12: Establishments by Selected Sectors, 2010 and 2017 Norwalk Fairfield County
NAICS Industry Sector 2010 2017
'10 - '17 %
Growth
2010 2017
'10 - '17 %
Growth - All Industries 3,201 3,492 9% 32,738 35,601 9%
54 Prof., Scientific, & Tech Services 435 488 12% 4,412 4,783 8% 81 Other Services 339 416 23% 4,827 5,399 12% 44 Retail Trade 365 343 -6% 3,491 3,414 -2% 56 Admin. & Support Services 265 314 18% 2,181 2,448 12% 62 Health Care & Social Assistance 272 293 8% 2,676 2,961 11% 72 Accommodation & Food Services 230 281 22% 2,034 2,360 16% 23 Construction 266 269 1% 2,650 2,554 -4% 42 Wholesale Trade 224 244 9% 2,311 2,681 16% 52 Finance & Insurance 200 192 -4% 2,799 2,897 4% 53 Real Estate and Rental & Leasing 103 127 23% 1,134 1,193 5% 31 Manufacturing 134 108 -19% 1,026 895 -13% 51 Information 98 107 9% 599 840 40% 71 Arts, Entertainment, & Recreation 57 72 26% 555 651 17% 61 Educational Services 57 71 25% 494 628 27% 55 Management of Companies 37 45 22% 317 536 69% 22 Utilities 8 9 13% 47 40 -15%
Source: Connecticut Department of Labor, Labor Market Information, QCEW Annual Averages; RKG Associates

20
outside of Norwalk for employment. Many of these are lower- and medium-wage workers. On top of hosting jobs that are higher-paying than those held by average Norwalk residents, much of the city’s wage growth has been driven by jobs in the highest-paying sectors.
This is not to say that Norwalk’s only good-paying jobs are in Finance, Insurance, Real Estate and similar white-collar service industries. Workers in retail, construction, and health care and social assistance all earn average wages that are higher than the county average in sectors that have low barriers to entry-level positions. Still, Norwalk’s future economic development efforts may seek to employ more of its residents in good-paying jobs in the city, while encouraging high-earning workers that commute into Norwalk to live there too. This can have positive impacts on local tax receipts, and ensure that the city’s retail, restaurant, and other businesses capture a greater share of consumer spending potential.
Table 13: Average Annual Wages by Selected Sectors, 2010 and 2017 Norwalk Fairfield County
NAICS Industry Sector
2010
2017
'10 - '17 %
Growth
2010
2017
'10 - '17 %
Growth - All Industries $85,751 $97,980 14% $80,363 $85,005 6%
44 Retail Trade $62,833 $53,256 -15% $37,806 $39,968 6%
54 Professional, Scientific, & Tech Services $100,506 $121,337 21% $104,332 $125,197 20%
62 Health Care & Social Assistance $59,849 $60,925 2% $51,235 $56,113 10%
56 Admin and Support Services $77,976 $59,038 -24% $49,829 $55,364 11%
72 Accommodation & Food Services $24,428 $25,673 5% $21,956 $24,856 13%
90 Government $64,340 $69,708 8% $56,928 $65,550 15% 52 Finance & Insurance $230,239 $352,576 53% $246,970 $266,990 8% 81 Other Services $28,653 $45,912 60% $32,593 $36,538 12% 42 Wholesale Trade $125,273 $109,781 -12% $104,672 $116,260 11% 23 Construction $59,308 $69,393 17% $58,209 $68,348 17% 51 Information $90,895 $115,688 27% $85,979 $123,224 43% 31 Manufacturing $102,952 $116,821 13% $90,342 $93,822 4%
71 Arts, Entertainment & Recreation $38,159 $43,615 14% $33,890 $35,293 4%
55 Management of Companies $164,419 $192,276 17% $172,161 $196,892 14%
48 Transportation & Warehousing $61,053 n/a n/a $58,977 $58,457 -1%
53 Real Estate $70,234 $92,819 32% $78,416 $87,651 12% Source: Connecticut Department of Labor, Labor Market Information, QCEW Annual Averages; RKG Associates

21
EMPLOYMENT PROJECTIONS Data from the US Bureau of Labor Statistics (BLS) offers insight on which employment categories can expect to see the most job growth in Norwalk in the years ahead. Despite the city’s modest job growth from 2010 to 2017, projections show employment growth slowing to virtually zero in the years up to 2023. This certainly may lead the City to evaluate its economic development plans and to refocus on its strengths seeking to bring more opportunities for Norwalk residents to work locally within the city. Even if overall job growth slows, there will still be opportunities for Norwalk to create economic growth by expanding its concentration of jobs in in-demand sectors. Competing in these industries will require attracting skilled workers from neighboring communities, and implementing robust workforce development programs to help lower-earning Norwalk residents to share in the growth. Categories that EMSI projects may grow in Norwalk include hospital-related healthcare services, educational services, telecommunications and “other information” roles like Internet Publishing, Broadcasting, Web Search and related jobs. Frontier Communications, Xerox, FactSet Research Systems, and other large Norwalk-based employers will play a key role in these categories’ expansions. While Connecticut’s manufacturing sector continues to contract, niche and high-tech manufacturing operations in fields like Chemical Manufacturing may grow; Norwalk’s King Industries, which works on materials for “coatings, lubricants, and rubber formulators around the world,” is a major asset.14
14 King Industries Specialty Chemicals: kingindustries.com
Table 14: Top Projected Job Growth Sectors, 2017 to 2023*
NAICS Industry Sector
2017 Projected
2023 '17 - '23
% Growth 325 Chemical Manufacturing 236 327 + 39% 519 Other Information Services 840 1051 + 25% 624 Social Assistance 1,627 1915 + 18% 423 Merchant Wholesalers, Durable Goods 622 717 + 15% 621 Ambulatory Health Care Services 2,143 2,455 + 15% 722 Food Services and Drinking Places 2,618 2,971 + 13% 812 Personal and Laundry Services 599 678 + 13% 611 Educational Services 383 427 + 11% 524 Insurance Carriers and Related Activities 430 462 + 7% 237 Heavy and Civil Engineering Construction 135 144 + 7% 517 Telecommunications 345 368 + 7%
*Selected sectors with more than 100 employees in 2017 Norwalk data reflects estimated jobs located in ZIP codes 06850, 06851, 06853, 06854, 06855
Source: EMSI Employment Table Projections 2017-2023, RKG Associates

22
Table 15: Norwalk’s Largest Employers, Selected Sectors, 2017 Information Prof., Scientific & Tech
Services Finance & Insurance Health Care & Social Assistance
Frontier Communications MBI Inc Synchrony Financial Norwalk Hospital
News 12 Omega Engineering GE Capital Corp St. Vincent’s Behavioral Health
Fiserv Millward Brown Marsh Paradigm Healthcare Center
Penny Publications Marsh Governmental Accounting
Family & Children’s Agency
Dell Magazines Sequel Home Serve USA Middlesex Hospital
Xerox Corp. Wahlstrom Group LLC Hitachi Capital America Home Instead Senior Care
Sources: Connecticut Department of Labor, Employer Listings by Town, 2017; RKG Associates
The BLS projects that Norwalk will experience declines in categories including traditional retail, manufacturing, and utilities, among others, over the five years to 2023 (Table 14). Clothing Stores (-18 percent), Electronics and Appliance Stores (-11 percent), Furniture and Home Furnishing Stores (-4 percent) and others will likely reflect the nationwide reorganization of brick-and-mortar retail, as fewer, more competitive stores survive. The forthcoming SoNo Collection mall, which will have direct effects upon East Norwalk’s market for retail, will test this trend. Projections related to the “Credit Intermediation” sector show job losses in categories related to loans and financing for purchases like cars. The category’s projected contraction is likely due to uncertainty over interest rates, which if raised as many analysts predict, may decrease demand for loans.
Table 16: Top Projected Job Loss Sectors, 2017 to 2023* Norwalk
NAICS Industry Sector
2017 Projected
2023
'17 - '23 %
Growth 522 Credit Intermediation and Related Activities 1,685 936 -44% 221 Utilities 358 247 -31% 435 Wholesale Electronic Markets and Agents/Brokers 1,212 900 -26% 334 Computer and Electronic Product Manufacturing 310 236 -24% 454 Non-store Retailers 654 522 -20% 511 Publishing Industries (except Internet) 610 495 -19% 448 Clothing and Clothing Accessories Stores 257 210 -18% 333 Machinery Manufacturing 784 684 -13% 443 Electronics and Appliance Stores 223 198 -11%
*Selected sectors with more than 100 employees in 2017 Norwalk data reflects estimated jobs located in ZIP codes 06850, 06851, 06853, 06854, 06855
Source: EMSI Employment Table Projections 2017-2023, RKG Associates

23
UNEMPLOYMENT TRENDS Unemployment in Norwalk is historically low, having recovered fully from the Great Recession. The rate reached a monthly average of 3.7 percent in 2018.15 Since 2010 Norwalk’s unemployment rate has been lower than Fairfield County’s, which in turn has been below the state’s rate. As the strong national economy has driven job growth since at least 2012, Connecticut’s overall unemployment rate has closed its historic gap with Norwalk and Fairfield County. All three rates were within a half of one percent of each other in 2018. It should be noted that Norwalk’s unemployment rate has reached its lowest point in over a decade despite the city’s declining average educational attainment, suggesting that newcomers with less formal education have had high levels of success with finding employment.
COMMUTING INFLOWS AND OUTFLOWS The US Census’ Longitudinal Employer-Household Dynamics (LEHD) analysis estimated that in 2015, 25 percent of Norwalk’s workers lived in the city itself.16 This proportion is slightly lower than competitive cities and towns; in Stamford, 29 percent of workers live locally, and 30 percent in Bridgeport. Still, the relatively low proportion of working-age residents that choose to work in the same municipality that they live in may be a reflection of Fairfield County’s job accessibility. At least 5,000 Norwalk residents commute daily into New York City, while 6,250 residents commute to Stamford.
15 Connecticut Department of Labor 16 US Census, Longitudinal Employer-Household Dynamics database, 2015
7.8%7.5%
7.2%6.6%
5.7%
4.8%4.4% 4.2%
3.7%
2%
3%
4%
5%
6%
7%
8%
9%
10%
2010 2011 2012 2013 2014 2015 2016 2017 2018
Norwalk Fairfield County Connecticut
Figure 6: Unemployment Trends
Sources: Connecticut Department of Labor; RKG Associates

24
The remaining 75 percent of Norwalk employees, nearly 32,000 workers, commute in from outside the city. Norwalk’s out-of-town employees are drawn from Stamford (9 percent), Bridgeport (8 percent), Stratford (3 percent), New York City (3 percent), and Trumbull (3 percent) in addition to small quantities from a wide array of other cities and towns. These workers may present opportunities for East Norwalk and Norwalk at large to capture a greater share of their consumer spending, or to
entice them to live in town – their economic impact may be especially felt if they are able to access transit-oriented development. As Norwalk has experienced greater wage growth (+14 percent) than median household income growth (+7 percent) since 2010, it is likely that many of Norwalk’s highest-paying jobs are held by workers that commute in from neighboring towns.
MARKET & DEVELOPMENT ACTIVITY The following section presents data and analysis on Norwalk’s real estate market. The city’s existing real estate inventory, as captured by the City’s assessors’ database, is examined to understand changes in value, density, and land use over time and across locations. Recent market data on vacancy, absorption, and prevailing rents/prices for new construction provide perspective on where demand exists in Norwalk today. Finally, properties of different use types are evaluated to assess the market potential for commercial, residential, light industrial, and other uses within the study area.
DEVELOPMENT TRENDS ANALYSIS According to the Assessors’ Database provided by Norwalk’s Planning Department, the city contained 103.8 million taxable square feet of developed space as of 2016, the most recent assessment year available. Excluding vacant and exempt parcels, Norwalk’s 9,589 acres of taxable land were developed at a floor-area-ratio of 0.25. This ratio, or “FAR,” means that the typical Norwalk property has built square footage equal to 25 percent of its lot area. This relatively low FAR highlights the fact
Figure 7: Commuting Inflows & Outflows, 2015
Sources: US Bureau of Labor Statistics Longitudinal Employer-Household Dynamics 2015; RKG Associates.

25
that denser recent development in South Norwalk and along West Avenue remains the exception to the rule in Norwalk, which retains significant low-density uses like land-intensive single-family residential districts in the north and west, corporate office parks and large-scale retail with surface parking, and three golf courses. Table 17: Norwalk’s Built Inventory, 2016 Properties Acreage Built SF FAR
Single-Family Residential 15,852 6,802 57,770,000 0.19
Multi-Family Residential 3,093 747 16,645,000 0.51
Commercial / Medical 1,192 1,604 25,753,000 0.37
Industrial 132 436 3,619,000 0.19
Total Taxable* 21,116 9,589 103,785,000 0.25 *Includes vacant/undeveloped taxable properties
Sources: Norwalk Assessors Database; RKG Associates
Like Stamford and Bridgeport, Norwalk’s relatively large quantity of multi-family residential properties is a key differentiator versus the housing stocks of neighboring communities. Multi-family units’ average assessed value per square foot is well below the per square foot value of single-family residential in Norwalk – here, mostly driven by the value of the land itself. Still, the value of higher density land uses (from an assessed value and therefore a tax receipts viewpoint) is clear: despite occupying just seven percent of Norwalk’s taxed acreage, multi-family makes up 12 percent of the city’s built value. Single-family residential, meanwhile, trends the opposite direction, occupying over 71 percent of Norwalk’s taxed acreage, and delivering just 52 percent of its taxable built value.17 With the construction of higher-value multi-family projects in the South Norwalk Business district and along West Avenue, future development of apartments and condos could make this valuation gap even more pronounced.
Table 18: Contributions to Norwalk Built Assessed Value by Use, 2016 Acreage % of Total Built Value % of Total
Single-Family Residential 6,802 71% $1,759,000,000 52%
Multi-Family Residential 747 7% $562,000,000 12%
Commercial / Medical 1,604 17% $2,321,000,000 34%
Industrial 436 5% $137,000,000 2%
Total Taxable* 9,589 100% $6,853,000,000 100% *Includes vacant/undeveloped taxable properties
Sources: Norwalk Assessors Database; RKG Associates
17 When evaluating contributions to Total Taxed Value, which includes properties’ underlying land, multi-family still delivers more efficient value: 11% of Norwalk’s Total Taxed Value on 7% of taxable land, versus single-family’s 52% contribution on 71% of taxable land.

26
However, it’s not just multi-family apartment and condominium developments that are driving a trend towards denser, more walkable mixed-use development in Norwalk. Single-family construction has changed as well. The average single-family property developed from 2013 to 2016 was exactly two times as dense as the average property built before 2007. While this may reflect slightly larger average home sizes, it is also a function of development on smaller lots. As with multi-family residential, Norwalk’s commercial properties have delivered a disproportionate amount of the city’s taxable real estate relative to the land that they occupy, even as commercial density varies widely. Commercial properties make up 17 percent of Norwalk’s taxable land but deliver 34 percent of its taxable built value (including medical uses). The average commercial property in Norwalk has just under 15,500 square feet of built space. The Assessors’ Database indicates that just 11 new commercial properties were developed or substantially improved in Norwalk from 2013 to 2016. The largest among them were 100 Connecticut Avenue, which hosts a Lowe’s retail outlet and a large surface parking lot, a hotel at 353 Main Avenue, and the Bender Plumbing office/showroom structure at 235 Westport Avenue. The remainder were mostly small office improvements and stand-alone retail structures, with an average of 12,000 square feet.
While the relatively small number of commercial properties developed in recent years makes discerning trends more difficult, the average density of commercial properties has increased since 2008. This trend mirrors shifts in the residential market. The average commercial property built before 2008 had an FAR of 0.35 – a low density driven in part by the city’s older, suburban-style retail
Table 19: Norwalk’s Built Inventory by Year Built, 2016
Properties Acreage Built SF FAR 2007 & Earlier 20,876 9,407 99,344,000 0.24 2008-2012 113 64 1,500,000 0.54 2013-2016 126 118 2,942,000 *0.77
*Excludes Avalon East Norwalk as outlier Sources: Norwalk Assessors Database; RKG Associates
Table 20: Floor-Area-Ratio by Use by Period Built 2007 & Earlier 2008-2012 2013-2016
Single-Family Residential 0.19 0.29 0.38
Multi-Family Residential 0.48 2.08 2.12
Commercial / Medical 0.35 0.40 0.80
Industrial 0.19 0.33 N/A *Includes vacant/undeveloped taxable properties
Sources: Norwalk Assessors Database; RKG Associates

27
structures along Connecticut Avenue and Westport Avenue, as well as office parks off of Main Avenue. Since 2008, new commercial development has been sited on smaller lots and with a stronger emphasis on walkability and proximity to other uses. From 2008 to 2012, the average commercial FAR jumped to 0.40; in structures built from 2013 to 2016, it doubled to 0.80. According to the City’s assessor’s database, industrial development has been extremely limited, with just one new property built between 2008 and 2016 – a warehouse at 129 Woodward Avenue.
DEVELOPMENT PIPELINE Based upon conversations with brokers and developers, planned real estate investment in East Norwalk is primarily limited to two properties at the heart of the study area: 25 Van Zant Street and 230 East Avenue. While projects outside the study area may have effects on local traffic, economic activity, and market demand – including the forthcoming SoNo Collection mall and various multi-family apartment projects elsewhere in Norwalk – they are not covered in depth in this market report. The most notable ongoing development within the East Norwalk TOD study area is the “Spinnaker” project, on the southwest corner of the train station at East Avenue and Rowan Street. The development is especially noteworthy in that it includes the first new-construction residential building of even moderate scale to be built in the study area in at least two decades, directly adjacent to the train station. Developers Spinnaker Real Estate Partners are incorporating the existing structure – a 155,000 square foot former hat factory, according to planning staff – into its two-structure, two-phase site plan. Approved in 2018, the project is currently undergoing internal demolition work, with ground breaking set for summer 2019. 18 The first phase consists of a renovation of the existing commercial/industrial structure, which will deliver 42 housing units and office space. The second phase will deliver 147 housing units in a newly constructed building. A mix of retail and restaurant uses is planned on the ground floor. The site is located on parcels that were originally zoned as I-1 Industrial, but zoning was changed to encourage mixed-use development after receiving a proposal for self-storage on site, according to interviews. The Spinnaker project is currently being marketed but has not begun pre-leasing for apartments. Final asking rents have yet to be decided, but will “likely” be in line with asking rents at the firm’s other residential property, the Loft Building in South Norwalk, in the range of $2.60 per square foot. A second key redevelopment project is taking place at the nearby 25 Van Zant Street site. As a refurbishment of an existing industrial/commercial structure, the project does not include any new construction. The gradual renovation will, however, reposition one of East Norwalk’s largest real estate assets to attract a new wave of firms and job opportunities to the area. Conversations with the property owner revealed that the building, which is intended for office and creative uses, is 70 percent
18 Interview, Spinnaker Real Estate Partners. 12 Apr 2019.

28
occupied. Some businesses have moved in after recent renovations, while others have been in the building for twenty years, according to the owner. Tenants represent a variety of industries: light manufacturers, sales professionals, accountants and marketing firms are among those currently renting space. Available units in the structure range from 1,400 square feet up to an entire 30,000 square foot floor. Asking rents are between $15 and $20 per square foot per year, triple-net. The site may yet include the development of a parking garage as part of an effort to relieve reported stress on parking lots near the train station. Together, these two projects will have a significant effect on the City’s ability to build a “village center” mixed-use district near the train station. Working with property and business owners to develop standards for streetscape improvements, desired uses, and parking strategies will be key to forming a more cohesive TOD district around the station. Several additional properties in the study area may be candidates for future development or redevelopment once the City’s plan for the area is refined via this process. 1 Cemetery Street, which today hosts a Wells Fargo bank branch, is located adjacent to the East Norwalk Historical Cemetery and is owned by M.F. DiScala & Company, could serve as a catalytic redevelopment site. The 1.66-acre site enjoys frontage on East Norwalk’s largest “neighborhood business” district, and also abuts Mill Pond to the south. This combination of assets likely indicates that the parcel could accommodate far more than the existing 3,220-square foot, single-story bank building and surface parking lot. The site has a property FAR of just 0.04, in a neighborhood business district that allows over fifteen times that density.19 A greater density of active retail uses, a mix of housing and/or office space, and improved pedestrian connections to Mill Pond and surrounding neighborhoods could make the site a unique and important piece of a revitalized study area. Other sites that could be candidates for long-term, ground-up reinvestment may include parcels surrounding Liberty Square, surplus property of the St. Thomas the Apostle Church on East Avenue, and any of the study area’s numerous, well-situated gas stations. Refurbishment of aging structures like the office buildings at 1 Selleck Street and 148 East Avenue could help attract a new breed of jobs to the study area. Infill development on their surface parking lots (if zoning permits) could help establish a mix of uses that makes the offices more competitive for modern workers.
19 City of Norwalk Zoning Regulations. www.norwalkct.org/DocumentCenter/View/372/Commercial-and-industrial-limiting-schedule-1?bidId=
Figure 8: 1 Cemetery Street Property
Parcel outline is approximate. Sources: Google Maps, Norwalk Assessor, RKG Associates
29
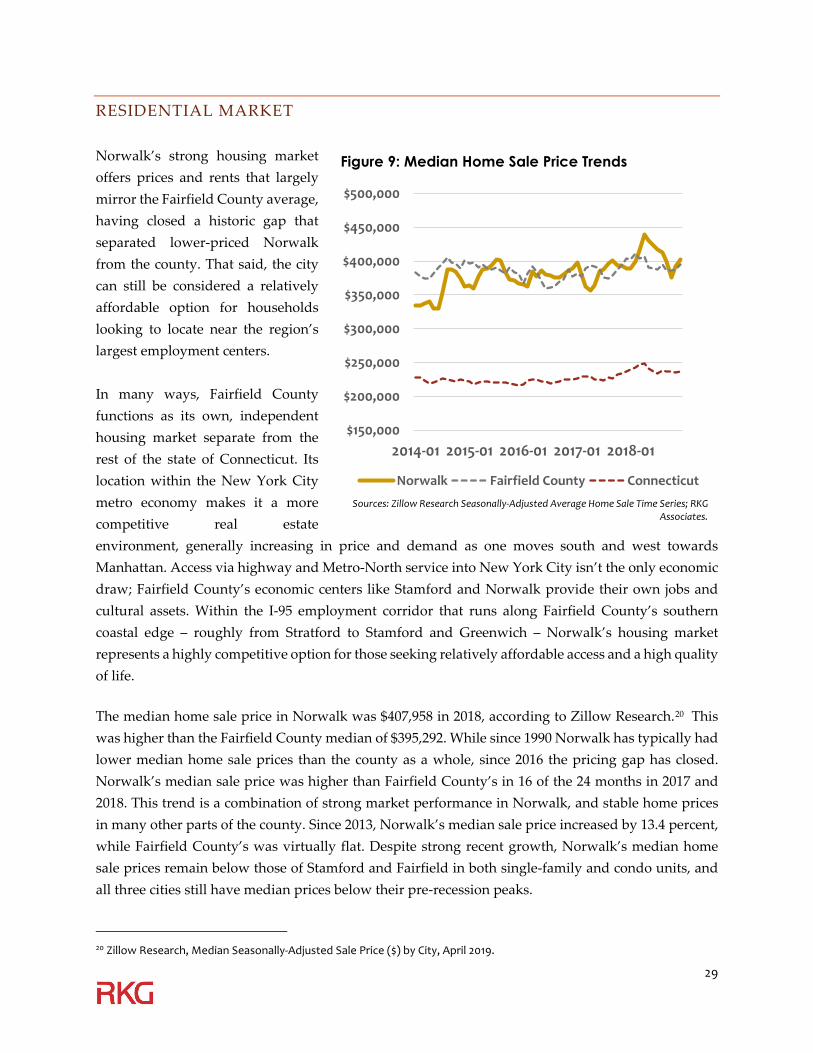
RESIDENTIAL MARKET Norwalk’s strong housing market offers prices and rents that largely mirror the Fairfield County average, having closed a historic gap that separated lower-priced Norwalk from the county. That said, the city can still be considered a relatively affordable option for households looking to locate near the region’s largest employment centers. In many ways, Fairfield County functions as its own, independent housing market separate from the rest of the state of Connecticut. Its location within the New York City metro economy makes it a more competitive real estate environment, generally increasing in price and demand as one moves south and west towards Manhattan. Access via highway and Metro-North service into New York City isn’t the only economic draw; Fairfield County’s economic centers like Stamford and Norwalk provide their own jobs and cultural assets. Within the I-95 employment corridor that runs along Fairfield County’s southern coastal edge – roughly from Stratford to Stamford and Greenwich – Norwalk’s housing market represents a highly competitive option for those seeking relatively affordable access and a high quality of life. The median home sale price in Norwalk was $407,958 in 2018, according to Zillow Research.20 This was higher than the Fairfield County median of $395,292. While since 1990 Norwalk has typically had lower median home sale prices than the county as a whole, since 2016 the pricing gap has closed. Norwalk’s median sale price was higher than Fairfield County’s in 16 of the 24 months in 2017 and 2018. This trend is a combination of strong market performance in Norwalk, and stable home prices in many other parts of the county. Since 2013, Norwalk’s median sale price increased by 13.4 percent, while Fairfield County’s was virtually flat. Despite strong recent growth, Norwalk’s median home sale prices remain below those of Stamford and Fairfield in both single-family and condo units, and all three cities still have median prices below their pre-recession peaks.
20 Zillow Research, Median Seasonally-Adjusted Sale Price ($) by City, April 2019.
$150,000
$200,000
$250,000
$300,000
$350,000
$400,000
$450,000
$500,000
2014-01 2015-01 2016-01 2017-01 2018-01
Norwalk Fairfield County Connecticut
Figure 9: Median Home Sale Price Trends
Sources: Zillow Research Seasonally-Adjusted Average Home Sale Time Series; RKG Associates.

30
Norwalk’s strong growth in housing prices has been driven in part by demand for the city’s newest housing units. The city added a repor- ted 93 new single-family residential units from 2013 to 2016, partially fueling the rising median sale price. Condominiums, either in new projects like Maritime Village or in refurbished units in smaller structures throughout South Norwalk, have also played a role. The 382 and 389 condominium transactions seen in 2018 and 2017, respectively, were the largest number since the peak of the last housing cycle in 2007, and the 2018 median condo sale price of $169,000 represented 32.5 percent growth since 2013 (compared to the 8.2 percent growth in single-family prices). 21 The strong market for these new and refurbished units may partially explain East Norwalk’s relative lack of residential sale activity, as its housing stock is generally older and, in many cases, lower-value, with a limited number of lots capable of accommodating new units. Consistent with nationwide housing trends, renter-occupied units are playing an increasing role in Norwalk’s market. In 2010, Norwalk’s occupied housing units were 62 percent owner-occupied and 38 percent renter-occupied; in 2017, the split was estimated to be 60/40. 22 As with home sale prices, Norwalk’s rents have risen since 2013, albeit at a much slower rate. The median rent in 2018, $2,441 per month, was 6.8 percent higher than the 2013 average. Norwalk rents have seen steady growth since 2010, virtually mirroring the Fairfield County median until 2017, when the county’s median rent declined. Norwalk is an expensive place to rent compared to the majority of the
21 Banker & Tradesman, Norwalk CT Number of Sales data, Calendar Years, May 2019. 22 US Census, American Community Surveys 5-Year Estimates, 2013-2017.
Table 21: Median Home Sale Prices 2013 2018 %
Growth Total Homes
Norwalk $360,200 $406,700 + 12.9%
Fairfield County $394,400 $395,300 + 0.2%
Connecticut $227,400 $239,400 + 5.3%
Single-Family Only
Norwalk $446,000 $482,500 + 8.2%
Fairfield County $490,000 $451,750 (7.8%)
Connecticut $260,000 $258,000 (0.8%)
Condominiums
Norwalk $127,500 $169,000 + 32.5%
Fairfield County $128,000 $154,000 +20.3%
Connecticut $95,000 $119,000 + 25.3% Sources: Zillow Research Seasonally-Adjusted Average Home Sale
Time Series; Banker & Tradesman CT Town Sales Data; RKG Associates
Table 22: Median Monthly Asking Rents
2013 2018 % Growth
Norwalk $2,290 $2,440 + 6.8%
Fairfield County $2,240 $2,270 + 1.1%
Connecticut $1,590 $1,680 + 5.7%
Sources: Zillow Research Rental Index Time Series; RKG Associates

31
country. It is made to look relatively “affordable” only in that it is surrounded by several even higher-cost communities. Norwalk’s median rents are reported to be seven percent cheaper than Stamford’s, 16 percent cheaper than Fairfield’s, and a full 100 percent cheaper than those in Greenwich.23 Recent development of multi-family apartments in South Norwalk and elsewhere has shifted the city’s housing mix (Table 18). Units in structures of 50 or more homes grew from five percent of the total in 2010 to an estimated eight percent in 2017. Detached single-family homes, meanwhile, shrank from 50 percent of the city’s stock to 48 percent. While detached single-family homes still dominate most of Norwalk’s landscape, the city’s diversity of housing options is likely a significant draw, differentiating the city from less diverse (and less in-demand) housing inventories elsewhere in the region. Norwalk also benefits from a relatively diversely-aged housing stock, with homes ranging from pre-war (21 percent) to relatively new-construction (10 percent since 2000). The benefits of having not only a blend of rental and ownership housing but also of different types, sizes, and ages of housing are felt at both ends of the market. Demand for higher-end product in both single-family homes and newly-built condominiums and apartments are driving Norwalk’s market growth. However, an influx of lower-earning newcomers also suggests that either less-expensive rental
23 Zillow Rental Index Time Series: Multifamily, CFR, Condo/Co-Op ($) by City, April 2019.
Table 23: Housing by Units in Structure, 2017 Norwalk Fairfield County 1 – detached 48% 58% 1 – attached 5% 7% 2 units 11% 9% 3 or 4 units 9% 8% 5 to 9 units 7% 4% 10 to 19 units 7% 3% 20 to 49 units 5% 3% 50 or more units 8% 7% Other 1% 0%
Sources: US Census Bureau American Community Survey, 2013-2017 5-Year Estimates; RKG Associates
$1,300
$1,500
$1,700
$1,900
$2,100
$2,300
$2,500
$2,700
Norwalk Fairfield County Connecticut
Figure 10: Median Monthly Asking Rent Trends
Sources: Zillow Research Rental Index Time Series; RKG Associates.

32
options are also available, or households are making sacrifices to live in Norwalk, like putting more than 30 percent of their income towards housing costs or putting more people in each unit (thus partially explaining the city’s growing average household size). The Norwalk Assessors Database reports at least eight new multi-family residential developments that include more than 25,000 square feet of space built between 2013 and 2016 (several hundred other units were added in smaller buildings, according to the Zoning Commission; see Appendix 1). Listed below, these delivered at least 1,250 units and nearly $112 million in built taxable value:
• 500 West Avenue – Waypointe – 2014 – 464 units • 8 Norden Place – Avalon East Norwalk – 2013 – 240 units • 1 North Water Street – Ironworks Sono – 2014 – 108 units • 1 Glover Avenue – One Glover – 2015 – 132 units • 30 Orchard Street - The Berkeley at Waypointe – 2016 – 198 units • 6 Smith Street – Head of the Harbor – 2016 – 60 units • 34 Oakwood Avenue – Point Rock at Oakwood – 2015 – 54 units • 15 Arch Street – 2015 – 13 units
Much of Norwalk’s recent increase in residential development has been fueled in part by creative financing and incentives, especially in the early days of South Norwalk’s development renaissance. Conversations with developers, however, have revealed that at least some planned or under-development projects are now not dependent upon outside financial assistance. This suggests that rents for new units have reached a tipping point in Norwalk, a level at which traditional for-profit developers may be able to “pencil out” a project without financial subsidy. As covered in the “East Norwalk Implications” section at the end of this document, the improved multi-family residential market may have a limited impact upon future development in the East Norwalk TOD study area. In addition to seeking incentives and other financial assistance to make financially challenging projects feasible, developers often seek to add density to a project in order to achieve scale. Where a 20-unit project on a given site might not be able to turn an acceptable profit, a 40-unit project might, all else equal. In East Norwalk, a preponderance of small lots and a tight residential fabric mean that developing at scale is difficult on all but a handful of sites. This constraint removes another tool from a developer’s toolbox as they
Table 24: Housing Mix by Year Built, 2017 Norwalk Fairfield County
2010 and Later 3% 3%
2000s 7% 6%
1990s 7% 6%
1980s 11% 11%
1970s 13% 12%
1960s 15% 13%
1950s 16% 20%
1940s 8% 9%
1939 and Earlier 21% 21%
Sources: US Census Bureau American Community Survey, 2013-2017 5-Year Estimates; RKG Associates

33
seek to make financially feasible projects. If most multi-family development opportunities in East Norwalk are for small projects of two, five, or even ten units, investors are more likely to require outside financial assistance, because they can’t spread semi-fixed costs like HVAC, heating/air conditioning, elevators, or others across as many units. Conversations with local residential brokers suggested that there may be opportunities for context-sensitive small-scale development of housing between East Avenue and Liberty Square, adjacent to the Norwalk River. The majority of these would involve a hypothetical repositioning and rezoning of low-density light-industrial or workshop-type uses. According to the US Census Bureau’s estimates, Norwalk’s residential vacancy rate remained largely consistent between 2010 and 2017, around six percent. Fairfield County and competitive cities like Stamford have seen their vacancy rates increase slightly over the same period; Stamford’s rose from 6.4 percent to 8.7 percent, while the county’s grew from 7.1 to 8.5 percent. An online survey of active rental listings in East Norwalk showed average asking rents as reported in Table 19. 24 These included apartment listings in Avalon East Norwalk, which is outside the study area but clearly affects the neighborhood’s housing market, pricing, and supply. The average 1-bedroom rent of $2.49/sf is not significantly lower than the planned asking rents at the Spinnaker development. The $2.49/sf average is driven by rents between $2.03/sf and $2.72/sf at Avalon East Norwalk, and a collection of 1-bedroom units in small multi-family buildings across East Norwalk. While rents for 1-bedroom and 2-bedroom apartments in East Norwalk cluster above $2.00/sf, asking rents drop precipitously for 3-bedroom and 4-bedrooms. Most of these listings are for entire homes, the majority of which are aging and target the lower end of the market. Observed asking per square foot rents for 4-bedrooms were greater than 3-bedrooms because several were full, detached home listings, as opposed to 3-bedrooms which were in multi-family structures.
24 Apartments.com, RKG Associates
Table 25: Active East Norwalk Rental Listings, April 2019 Average Asking
Rent/SF
Studio $3.44
1-bedroom $2.49
2-bedroom $2.08
3-bedroom $1.26
4-bedroom $1.42 Sources: Zillow, Apartments.com, Trulia

34
OFFICE MARKET Norwalk has just over 1,600 acres of taxable land listed as “commercial” by the Assessors Department, including Hospital/Medical and Retail uses.25 Currently, this land holds just under 2.6 million square feet of office and medical uses at an average FAR of 0.37.26 Since 2008 there have been just under 820,000 square feet of new commercial space constructed in the city, which represents about three percent of the city’s 2.6 million square foot inventory. In general, many of the office spaces in the city tend to be smaller in size (averaging just 21,600 square feet per commercial parcel) and divided up into multi-tenant buildings to support the needs of professional and medical office users. Some large, single-use office buildings on large lots drive up the city’s average density. Within the East Norwalk study area, the office inventory is mostly housed in a set of large, single-use structures near I-95 and built in the 1980’s. Other offices are mostly limited to small spaces in two or three-story structures on lots similar in size to the residential properties around them. Several are converted homes. The 80,000 square foot 1 Selleck Street building was constructed in 1988, and 148 East Avenue, a medical condominium building north of I-95, was built in 1984. Asking rents for medical offices in 148 East Avenue were as high as $25/sf/yr triple-net as of April 2019.27 At the heart of the study area, new investment at 25 Van Zant Street and the Spinnaker development will provide new opportunities for East Norwalk to expand and evolve its business mix. Discussions with local commercial brokers suggested that portions of East Norwalk are near enough to South Norwalk’s expanding mixed-use cluster that prospective tenants see them as “virtually one area.” Representatives at the 25 Van Zant Street office property and the Spinnaker project reported asking rents roughly in line with those across the river in South Norwalk. Asking rents at the Spinnaker property were reported to be “in the mid $20’s/sf/yr triple-net” with the Van Zant property asking slightly less – between $15 and $20/sf/yr triple-net.28 According to a representative, the office portion of the Spinnaker project is already 85 percent leased to firms including a healthcare tech company, a
25 Norwalk Assessors Database, 2019. Database does not differentiate between structures used primarily as office or as retail. 26 Floor-Area-Ratio, or FAR, is defined as the ratio of a parcel or parcels’ built square footage to its ground square footage. 27 John D. Hastings Inc., via Loopnet 24 Apr 2019. 28 Interviews.
1 Selleck Street. Source: Loopnet

35
jewelry company headquarters, and a coworking facility.29 As reported in a previous section, 25 Van Zant is reportedly 70 percent leased, with availability ranging from 1,400 square feet up to 30,000 square feet for an entire floor. The leasing performance of these two buildings is made especially notable by a generally sluggish Fairfield County office market. New development has been increasingly rare in the last several years, according to brokers; this may be in part due to demand shifting away from single use “office park” typologies and towards mixed uses. The slow employment growth projections presented in this report suggest that further office demand is unlikely to justify substantial levels of new investment. Improvements may consist of creating small offices in existing structures and undertaking piecemeal refurbishments like those at 25 Van Zant. Based upon projected new jobs from 2017 to 2023, Norwalk as a whole may be able to support less than 50,000 square feet of new office development in that period, with most demand driven by rising employment in medical offices and social assistance facilities.
RENTS, VACANCY AND ABSORPTION
CBRE, a commercial brokerage firm, reported that Fairfield County’s office inventory decreased by nearly one million square feet from 2015 to 2018.30 Even with the loss of occupiable space, the county’s office vacancy rate is on the rise, reaching 21.1 percent at the end of 2018. With nearly nine million vacant square feet of office space in the county, developers have been largely uninterested in building new ground-up office space, especially without a tenant in hand. While East Norwalk was always unlikely to host new ground-up office construction of much size due to its small parcels and lack of availability, current market conditions indicate that substantial development anywhere in Fairfield County is unlikely. The average asking rent per square foot of $32.15 was down from $35.01 in the fourth quarter of 2016. Office vacancy in Central Fairfield County, an area which includes Norwalk, was reported to be slightly lower at the end of 2018, at 18.6 percent. Current average asking rents of $32.19 per square foot – roughly equal to the Fairfield County average – are up slightly from the 2015 average of $31.19. Central Fairfield County has, like the county as a whole, seen a decrease in rentable space since 2015, with no major additions to inventory reported.31 Fairfield County’s central region comprises roughly one quarter of the county’s overall office market. Notable leases in the last three years have included Xerox’s 67,000+ square feet (2016, Merritt 7 Corporate Park), 173,000 sf by FactSet Research Systems (2018, Merritt 7 Corporate Park), and 94,000 sf by Reed Exhibition Companies (2018, 383 Main Ave.).32
29 Interview, Spinnaker Real Estate Partners. 12 Apr 2019. 30 CBRE Office Market Trends, Q1 2019 31 Ibid 32 Ibid

36
While not yet reflected in rent and absorption data, CBRE reported that an increasing number of office properties in Fairfield County were being converted to alternative uses “like multifamily or senior housing.” This could further reduce the area’s inventory, possibly right-sizing the supply and leading to modest rent growth. “This trend is still in its early stage,” in Fairfield County, CBRE said. “We expect that if it continues, we’ll see significant changes in the availability rate.”33 Table 26: Office Market Trends, Fairfield County & Fairfield County Central region Fairfield County
2015 2016 2017 2018 Average
2015-2018 %
Change Total Inventory 42,506,000 42,176,000 41,618,000 41,522,000 41,955,500 -2.3% Vacancy Rate 18.2% 17.2% 20.8% 21.1% 19.3% +2.9% Vacant SF 7,736,000 7,254,000 8,657,000 8,761,000 8,102,000 13.2% Net Absorption 225,400 -379,100 178,900 -60,800 -8,900 n/a Asking Rent/SF/Yr $35.01 $34.50 $31.59 $32.15 $33.31 -8.2% Fairfield County – Central Region (incl. Norwalk)
2015 2016 2017 2018 Average
2015-2018 %
Change Total Inventory 10,514,000 10,308,000 9,737,000 9,737,000 10,074,000 -7.4% Vacancy Rate 15.7% 19.3% 20.4% 18.6% 18.5% +2.9% Vacant SF 1,651,000 1,990,000 1,986,000 1,811,000 1,859,500 9.7% Net Absorption -62,600 -288,700 157,400 -115,000 -77,225 n/a Asking Rent/SF/Yr $31.19 $31.47 $29.60 $32.19 $31.11 3.2%
Sources: CB Richard Ellis; RKG Associates
INDUSTRIAL MARKET Industrial uses are not likely to play a significant role in the East Norwalk TOD area, as they typically require large parcels at low cost. Many rely upon easy truck access, and while I-95 does provide East Norwalk with direct access to New York City, Boston, and beyond, traffic, a tight street grid, and low bridges mean that the area is less than ideal for trucking. Still, a substantial portion of the study area is zoned “I-1” for industrial use. The larger industrially zoned section extends west from the train station in between Fort Point Street and Rowan Street/Van Zant Street, and then expands north along the river to include City public works properties, among others. A smaller I-1-zoned section of the study area runs east from the train station, along the tracks
33 CB Richard Ellis Stamford Media Center, April 11 2019 release

37
between Fitch Street and Winfield Street. With the exception of some larger-scale utility buildings along the Norwalk River, the study area’s industrial structures are primarily small contractor yards, utility properties, and workshop/company office joint facilities. Norwalk’s assessor classifies just 132 of the city’s parcels as industrial. Most medium- and large-sized industrial properties are located across the Norwalk River and south of the train tracks along Wilson Avenue. That area is home to the one industrial building listed by assessors as constructed between 2008 and 2016: a warehouse at 129 Woodward Avenue. Notable firms with industrial and warehouse presences near Wilson Avenue include Pepperidge Farm, W.B. Mason, and DHL. Conversations with residents of the East Norwalk study area suggested they would be less than receptive to most distribution-related industrial uses, primarily citing traffic concerns.
RENTS, VACANCY AND ABSORBTION
In late 2018, Lincoln Property Company reported that Norwalk’s industrial vacancy rate was 6.3 percent, with an average asking rent of $13.00 per square foot per year.34 The total inventory was estimated at 340,000 square feet, the county’s fifth-largest behind Bridgeport (880,000), Stamford (525,000), Shelton (425,000), and Fairfield (350,000). The county as a whole had absorbed just 65,000 square feet of space through the first three quarters of 2018. A non-scientific review of online rental listings showed just one active industrial listing in the study area: vacant space in a small warehouse at 26 Fitch Street 35. The 1920 structure is typical of the area, with a 1,115 square foot office, a 3,000 square foot workshop, and a 1,225 square foot loading/overhead door area available for rent. Asking rent for the space is $10 per square foot per year, triple-net. Elsewhere in Norwalk, 41,450 square feet were listed for rent at 145 Woodward Avenue in South Norwalk, asking $11.95/square foot per year in a warehouse/industrial structure built in 1980.
34 Lincoln Property Company, Fairfield County Industrial Real Estate Snapshot, Q3 2018. 35 Other properties may be being marketed offline.
74 Fort Point Street is a typical light industrial/workshop structure within the study area. Source: Google Earth

38
Non-traditional and higher-tech industrial uses are seeing growing interest in some parts of the region. CBRE recently reported strong leasing of data center spaces in the New York City tri-state area, as financial enterprises and healthcare companies aimed to position their technology assets near their headquarters.36 Data centers can function like traditional light industrial uses in that they require few municipal services, generate little traffic, and generally require large amounts of cheap land. This last requirement likely precludes most data centers from locating in the tight-fabric East Norwalk study area, but small centers may be an option for adaptive reuse projects in the neighborhood’s industrial areas.
RETAIL MARKET As a largely residential neighborhood within a city that boasts considerable retail and restaurant amenities in other neighborhoods, the East Norwalk study area exports retail spending to its neighboring areas. Its status as a net exporter of retail – that is, its residents do the vast majority of their shopping outside the area, and the area’s businesses draw relatively few outsiders - is confirmed by data in a “retail leakage analysis.” The retail leakage analysis that follows examines the difference between the supply (existing establishment sales) and the demand (consumer household spending) for a variety of different types of retail stores and merchandise categories within Norwalk and the East Norwalk study area. The results of the analysis identify retail “gaps” that can be filled by new store openings or expansions if the community has the economic ability to support them. Data on Norwalk’s existing retail sales and consumer spending habits are drawn from ESRI Business Analyst, a geospatial data analytics program. The demand data indicate the level of consumer spending occurring for households within the city, based upon their income levels and spending patterns within the different retail categories. The supply data shows the dollar value of sales captured for each retail category based on the reported sales from local establishments within the study area, a half-mile radius from East Norwalk station. Comparing the demand and supply data can help identify opportunities for Norwalk to encourage existing retailers to expand and/or to attract new retailers to the area via increased marketing or incentives. This demand-supply comparison identifies “sales leakage.” Sales leakage occurs when local consumer demand for retail goods exceeds the amount of sales that are captured by local retail establishments. High sales leakage generally indicates that the local marketplace is underserved in that specific retail category, oftentimes with an insufficient number or quality of product lines and/or fewer businesses than can be supported.
36 CB Richard Ellis. “New York Tri-State Data Center Leasing Remained Steady in H1 2018.” 5 September 2018.

39
That said, it is normal for consumers to make retail purchases outside their home municipality. Realistically, it is not possible to stop all sales leakage because people shop outside their primary market for reasons of convenience. They will, for example, shop while at work, which may be outside their primary market. In addition, a growing share of retail demand is being captured by online retailers, which often do not have a physical location. Some of this sales leakage could be recaptured by new or existing businesses if they expand their product lines or if new businesses open and capture this unmet spending potential. In the analysis that follows, “Potential Supportable Square footage,” as summarized in Table 27, assumes that 25 percent of leaked sales are recaptured.
Table 27: Retail Supply & Demand, East Norwalk TOD Study Area, 2017
Demand Supply Leakage / (Surplus)
# of Businesses
Potential Supportable
Retail SF Total $92.3m $70.1m $22.2m 74 21,000 Total Retail $83.1m $59.6m $23.5m 41 21,000 Total Food & Drink $9.2m $10.5m ($1.3m) 32 -
General Merchandise $12.5m - $12.5m 0 6,200 Groceries $13.8m $6.4m $7.5m 2 3.440 Clothing $4.8m $3.0m $1.8m 5 3,240 Home Furnishing $1.6m $0.1m $1.5m 1 4,090 Health & Personal Care $5.3m $3.1m $2.2m 3 1,820 Shoes $0.7m - $0.7m 0 570 Office Supplies & Gifts $0.9m $0.3m $0.6m 2 700 Sporting Goods / Hobby Shops $2.8m $2.2m $0.6m 4 620 Florists $0.2m - $0.2m 0 200 Drinking Places $0.1m - $0.1m 0 - Specialty Foods $0.7m $1.2m ($0.5m) 2 - Beer, Wine & Liquor $1.7m $2.6m ($0.9m) 3 - Restaurants $8.8m $10.0m ($1.2m) 29 - Books, Music & Other Media $0.4m $6.2m ($5.8m) 2 -
Source: ESRI Business Analyst Retail MarketPlace Profile 2018; RKG Associates
Table 27 confirms that the study area is a net exporter of roughly $22 million in retail spending. If East Norwalk’s existing and potential businesses were to capture 25 percent of this “sales leakage,” the community could support up to an additional 21,000 square feet of retail. This is calculated based upon the retail sales per square foot typically required by outlets within each retail sector. While 21,000 square feet is not an inconsequential amount, the potential for incremental retail outlets in the study area is relatively low once accounting for the different retail categories that comprise East Norwalk’s unmet consumer demand.
The public meeting held in March at Norwalk City Hall revealed a strong public desire for a full-service grocery store in East Norwalk. Figure 11 illustrates the methodology used to translate the study area’s unmet demand for groceries into an estimate of its supportable grocery store square footage. Full-service grocery stores are typically land-intensive, expensive undertakings that rely

40
upon a large pool of unmet consumer demand. Within the study area, $7.4 million in grocery spending “leaks” to surrounding communities. Due to grocery stores’ typical requirement of $550 in sales per square foot per year to operate, the study area would be unlikely to support more than 3,400 square feet of new retail space. Comparing this figure to the national average grocery store size of 40,000 to 45,000 square feet reveals the challenges any prospective grocery store operator would face in East Norwalk. 3,400 supportable square feet could indicate sufficient demand for a second small, niche grocery store (in addition to the existing Harbor Harvest store). Conversations with representatives of the Spinnaker project revealed that the developer may seek to lease a ground floor space to a small grocer. Other categories may present opportunities for small quantities of unique retail, including in the home furnishings, clothing, and health and personal care retail sectors. “General merchandise” demand – typically met by large retailers like Target and Wal-Mart – may present opportunities for small businesses like gift shops. It is worth noting that retailers that occupy small-footprint spaces, especially in new buildings, tend to pay more rent per square foot – expenses that typically get passed on to customers in the form of higher prices.
Retailers that succeed will likely be low-overhead businesses that focus on serving the community’s existing residents and workers, and can survive without pulling a substantial portion of their customer base from other areas. Still, East Norwalk’s relatively small population and lower income profile compared to the rest of the city will make attracting businesses a challenge. Residents of the East Norwalk study area comprise just five percent of the city’s overall retail demand (aka purchasing power). This is primarily a function of incomes and residential density; East Norwalk falls on the lower end of the city-wide spectrum of each of these measures. If faced with the decision of whether to located in East Norwalk or in an identically priced space in a higher-density, higher-purchasing power community, most business owners will choose the latter as mere matter of financial sense.
Drawing consumer spending from other communities will also present challenges for the study area. East Norwalk is also surrounded by shopping and dining options within a 10 to 15-minute drive. While not all residents or workers will choose to own or use a car, these options mean that much of East Norwalk’s spending demand is already satisfied locally, if not quite “hyper-locally.” Norwalk as a whole is a strong net importer of retail spending, with a $1.24 billion surplus of retail supply over
Figure 11: Supportable SF Methodology
Sources: ESRI Business Analyst; RKG Associates

41
the amount demanded by its residents. The city’s supply – almost double its internal demand – illustrates the competitive retail environment that surrounds East Norwalk. This surplus of options will only grow with the opening of the SoNo Collection mall, which will add dozens of stores within minutes of the East Norwalk train station. The uniqueness and experiential quality of successful new retailers will be critical. The changing face of retail around the world means that new or expanding business owners will need to create spaces that can deliver memorable experiences and curated shopping options. The most successful of these are increasingly being found in mixed-use, pedestrian-oriented centers, where visitors are encouraged to linger in engaging public spaces and comfortable streetscapes. These can deliver unique environments that may lead shoppers to choose them over larger, parking-laden shopping centers. The East Norwalk study area is home to a small surplus of restaurants relative to local demand. Many are small scale, take-out-oriented outposts, but other restaurants suggest that the area may be able to support additional supply if welcoming and unique environments are created. Competition from across the river in South Norwalk – a highly mixed-use, pedestrian-oriented space – is strong. That said, the city as a whole operates with a surplus of restaurant supply; if customers are being drawn to Norwalk’s restaurants from neighboring cities and towns, East Norwalk may be close enough to South Norwalk and other dining centers to capture some of that demand.
EAST NORWALK TOD STUDY AREA MARKET TAKEAWAYS • East Norwalk is a “residential village” in a competitive real estate region. Amenities like retail and
restaurants are close at hand despite complaints about traffic, and access to millions of jobs via train or car is strong.
• Norwalk’s housing market is highly competitive, and is made more competitive its variety of housing types: old and new, renter- and owner-occupied, and at a wide range of price points. While market demand would be very likely to support additional housing in the East Norwalk study area, substantial increases to the local inventory are unlikely due to its small lots and low-density character. Lease-up of the Spinnaker project’s 189 new apartments will offer insights about the demand for similar but smaller-scale projects elsewhere in the neighborhood, especially those that target Norwalk’s growing number of 2- and 3-person households.
• As a lower-density residential village, the East Norwalk study area lacks the density of spending power that is typically needed to attract retail, restaurants, and amenities. Only serious changes in land use, zoning, and transportation infrastructure are likely to do that. Based upon existing conditions, the study area may be able to support up to 21,000 additional square feet across an array of small, community-focused retailers.
42
• East Norwalk’s three main “centers” – at the train station, Liberty Square, and near Cove Avenue
and 1st Street – can serve as economic development anchors. The market for commercial activity may increase if investments are made in improving streetscape and walkability/bikeability assets in these areas.
• Community concerns about traffic and parking notwithstanding, there are very few opportunities from a real estate perspective to add the density that would be needed to support additional amenities. Those few parcels that present development opportunities are either under in process of being developed or contain active, functional structures.
• Despite positive recent leasing activity, neither office nor industrial is likely to play a significant role in the study area’s immediate future – office, due to cooling market demand, and industrial, due to space constraints and access issues. The study area is not projected to experience demand for additional industrial space, although rehabilitation of existing spaces may be able to attract new light manufacturing and creative firms. Similarly, vacant office inventory across Fairfield County – and more locally, in the 25 Van Zant redevelopment – should sufficiently meet demand for the near future.
• Accepting that the Spinnaker project will provide a number of more densely-situated apartments to the area, East Norwalk needs to have a conversation about what other types of residential improvement would look like. This may involve accessory dwelling units, changes to zoning that allow for pivoting light industrial spaces to residential, or incentives for wholesale refurbishment of aging properties.

43
KEY REFERENCES Banker & Tradesman Data Services CB Richard Ellis MarketView Reports City of Norwalk Tax Assessor’s Office Connecticut Department of Labor US Census & American Community Surveys US Bureau of Labor Statistics ESRI Business Analyst IBIS World Longitudinal Employer-Household Dynamics (LEHD) database, US Census Bureau Economic Modeling, LLC
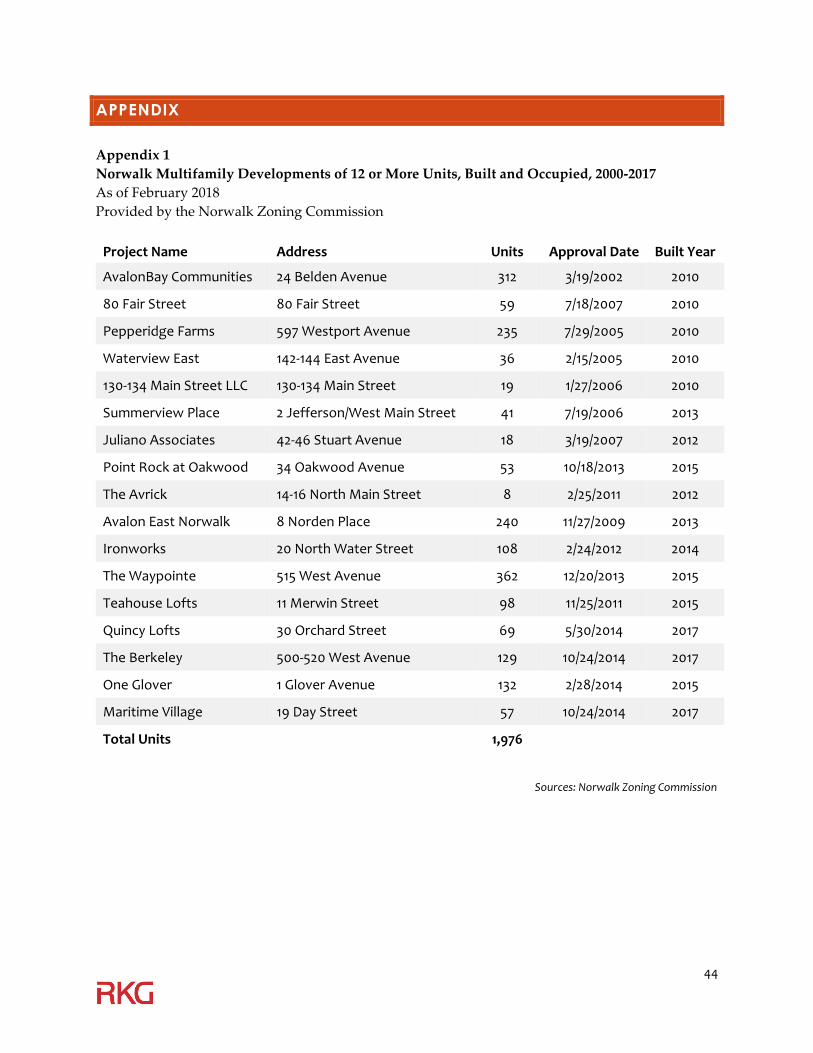
44
APPENDIX Appendix 1 Norwalk Multifamily Developments of 12 or More Units, Built and Occupied, 2000-2017 As of February 2018 Provided by the Norwalk Zoning Commission
Project Name Address Units Approval Date Built Year
AvalonBay Communities 24 Belden Avenue 312 3/19/2002 2010
80 Fair Street 80 Fair Street 59 7/18/2007 2010
Pepperidge Farms 597 Westport Avenue 235 7/29/2005 2010
Waterview East 142-144 East Avenue 36 2/15/2005 2010
130-134 Main Street LLC 130-134 Main Street 19 1/27/2006 2010
Summerview Place 2 Jefferson/West Main Street 41 7/19/2006 2013
Juliano Associates 42-46 Stuart Avenue 18 3/19/2007 2012
Point Rock at Oakwood 34 Oakwood Avenue 53 10/18/2013 2015
The Avrick 14-16 North Main Street 8 2/25/2011 2012
Avalon East Norwalk 8 Norden Place 240 11/27/2009 2013
Ironworks 20 North Water Street 108 2/24/2012 2014
The Waypointe 515 West Avenue 362 12/20/2013 2015
Teahouse Lofts 11 Merwin Street 98 11/25/2011 2015
Quincy Lofts 30 Orchard Street 69 5/30/2014 2017
The Berkeley 500-520 West Avenue 129 10/24/2014 2017
One Glover 1 Glover Avenue 132 2/28/2014 2015
Maritime Village 19 Day Street 57 10/24/2014 2017
Total Units 1,976
Sources: Norwalk Zoning Commission