Appendix – I : Sample Selection and Sample...
140
80 Appendix – I : Sample Selection and Sample Size Selection of rural sample Over 70 percent of India’s population live in about 600,000 villages spread over 550 districts in 32 states. To provide adequate geographical coverage of sample tourist households within a state, the districts were cross classified by rural population and income from agriculture to form homogenous strata. The number of such strata in a state was determined on considerations of the range of the stratification variables and the resulting frequency in each stratum. From each of effective strata a pre-assigned number of districts, depending on the size of the stratum, were randomly selected. A total number of 221 districts were selected as the first stage and the distribution of number of sample districts among various states was done in the proportion of rural population of the state in 2001 (Census 2001). Villages formed the second stage of selection procedure. District-wise lists of villages are available from census records (Census 1991) along with population. About 2 to 6 villages were selected independently from each sample district by adopting probability proportional to rural population of the village. A total of about 856 villages were covered for the study. The households in the sample villages were listed through specially designed listing Proforma by asking questions about all members of households on auxiliary information related to the study such as household composition. Individual members age, gender, education, occupation, income, visited some place as tourist in the last 60 days. Also, during the listing, the information on purpose of trip and number of trips made by all members of tourist households during last 6 months was asked. The list of tourist households was used as sampling frame to select a tourist household to collect the detailed information for the domestic tourism survey. To ensure adequate representation from various tourist purposes, the listed tourists in the sample villages were stratified into nine categories (purposes). A maximum of 10 tourists was systematically (circular) selected from each sample place and distributed among various categories (strata) in the proportion of total tourists listed in each of the non-empty stratum.
Transcript of Appendix – I : Sample Selection and Sample...
80
Appendix – I : Sample Selection and Sample Size
Selection of rural sample
Over 70 percent of India’s population live in about 600,000 villages spread over 550 districts in
32 states. To provide adequate geographical coverage of sample tourist households within a state,
the districts were cross classified by rural population and income from agriculture to form
homogenous strata. The number of such strata in a state was determined on considerations of the
range of the stratification variables and the resulting frequency in each stratum. From each of
effective strata a pre-assigned number of districts, depending on the size of the stratum, were
randomly selected. A total number of 221 districts were selected as the first stage and the
distribution of number of sample districts among various states was done in the proportion of
rural population of the state in 2001 (Census 2001).
Villages formed the second stage of selection procedure. District-wise lists of villages are
available from census records (Census 1991) along with population. About 2 to 6 villages were
selected independently from each sample district by adopting probability proportional to rural
population of the village. A total of about 856 villages were covered for the study.
The households in the sample villages were listed through specially designed listing Proforma by
asking questions about all members of households on auxiliary information related to the study
such as household composition. Individual members age, gender, education, occupation, income,
visited some place as tourist in the last 60 days. Also, during the listing, the information on
purpose of trip and number of trips made by all members of tourist households during last 6
months was asked. The list of tourist households was used as sampling frame to select a tourist
household to collect the detailed information for the domestic tourism survey. To ensure adequate
representation from various tourist purposes, the listed tourists in the sample villages were
stratified into nine categories (purposes). A maximum of 10 tourists was systematically (circular)
selected from each sample place and distributed among various categories (strata) in the
proportion of total tourists listed in each of the non-empty stratum.
81
Selection of urban sample
The process of selection of tourist households in the urban areas was more or less similar to that
in rural areas. According to the 2001 census, there are about 4,850 cities/towns in the
states/Union Territories (excluding Jammu & Kashmir) of India. The population of cities/towns
in India varies from less than 5000 to over a crore. There are 64 cities with population exceeding
10 lakh. All the cities were selected with a probability one. The remaining cities/towns were
grouped into seven strata on the basis of their population size and from each stratum a sample of
towns was selected independently.
A progressively increasing sampling fraction with increasing town population class was used for
determining the number of towns to be selected from each stratum. The sampling fraction was
used at the state level.
In all, 687 cities and towns thus selected were constituted in the first stage of the sample for
urban areas. These accounted for over 15 percent of the total cities/ towns of the country.
The NSSO Urban Frame Survey (UFS) block maps were used to select urban blocks. A sample of
such blocks was selected independently from each sample city/town and constituted the second
stage unit for the urban sample. The number of blocks from each city/town thus selected varied
between 2 and 60, depending upon the size of city/town and the total number of such blocks.
82
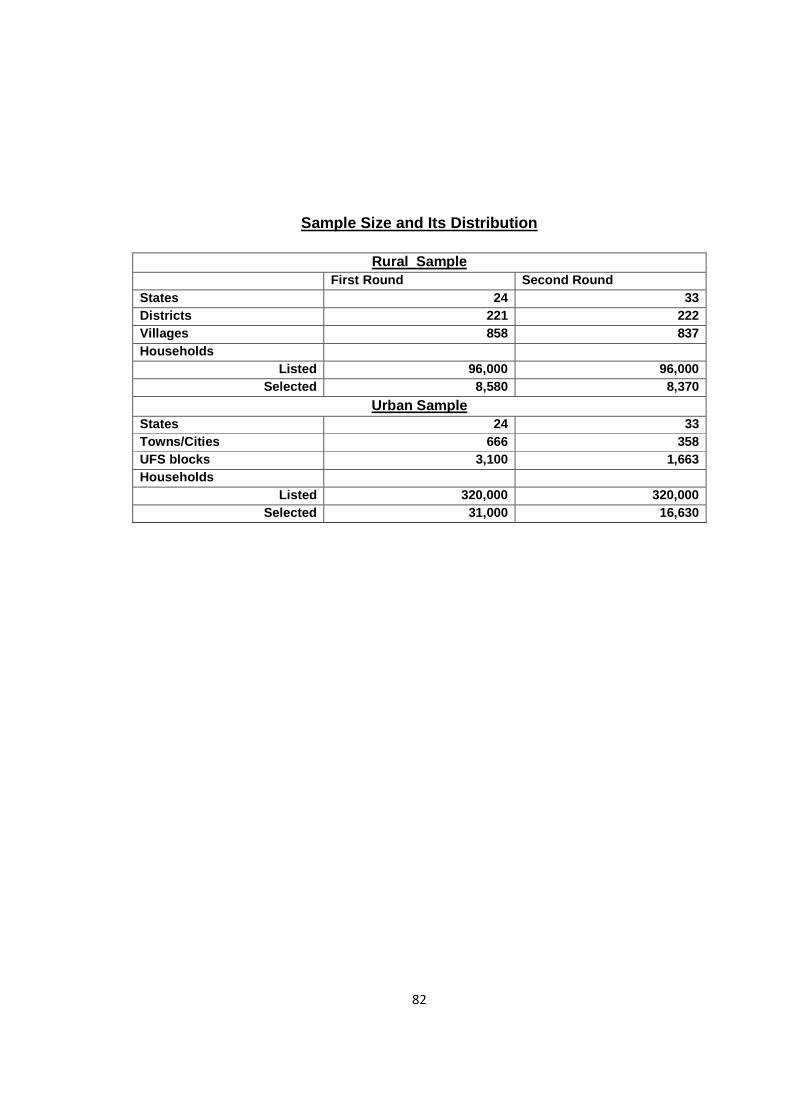
Sample Size and Its Distribution
Rural Sample First Round Second Round States 24 33 Districts 221 222 Villages 858 837 Households
Listed 96,000 96,000 Selected 8,580 8,370
Urban Sample States 24 33 Towns/Cities 666 358 UFS blocks 3,100 1,663 Households
Listed 320,000 320,000 Selected 31,000 16,630
83
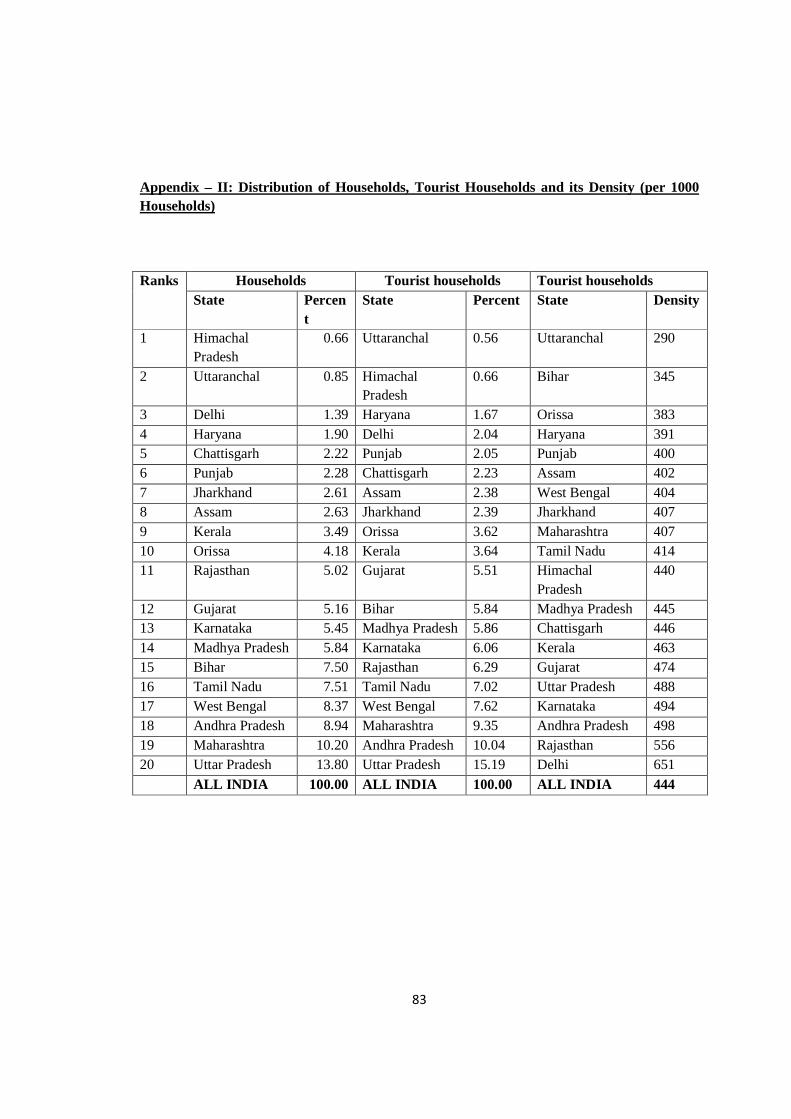
Appendix – II: Distribution of Households, Tourist Households and its Density (per 1000 Households)
Ranks Households Tourist households Tourist households State Percen
t State Percent State Density
1 Himachal Pradesh
0.66 Uttaranchal 0.56 Uttaranchal 290
2 Uttaranchal 0.85 Himachal Pradesh
0.66 Bihar 345
3 Delhi 1.39 Haryana 1.67 Orissa 383 4 Haryana 1.90 Delhi 2.04 Haryana 391 5 Chattisgarh 2.22 Punjab 2.05 Punjab 400 6 Punjab 2.28 Chattisgarh 2.23 Assam 402 7 Jharkhand 2.61 Assam 2.38 West Bengal 404 8 Assam 2.63 Jharkhand 2.39 Jharkhand 407 9 Kerala 3.49 Orissa 3.62 Maharashtra 407 10 Orissa 4.18 Kerala 3.64 Tamil Nadu 414 11 Rajasthan 5.02 Gujarat 5.51 Himachal
Pradesh 440
12 Gujarat 5.16 Bihar 5.84 Madhya Pradesh 445 13 Karnataka 5.45 Madhya Pradesh 5.86 Chattisgarh 446 14 Madhya Pradesh 5.84 Karnataka 6.06 Kerala 463 15 Bihar 7.50 Rajasthan 6.29 Gujarat 474 16 Tamil Nadu 7.51 Tamil Nadu 7.02 Uttar Pradesh 488 17 West Bengal 8.37 West Bengal 7.62 Karnataka 494 18 Andhra Pradesh 8.94 Maharashtra 9.35 Andhra Pradesh 498 19 Maharashtra 10.20 Andhra Pradesh 10.04 Rajasthan 556 20 Uttar Pradesh 13.80 Uttar Pradesh 15.19 Delhi 651 ALL INDIA 100.00 ALL INDIA 100.00 ALL INDIA 444
84
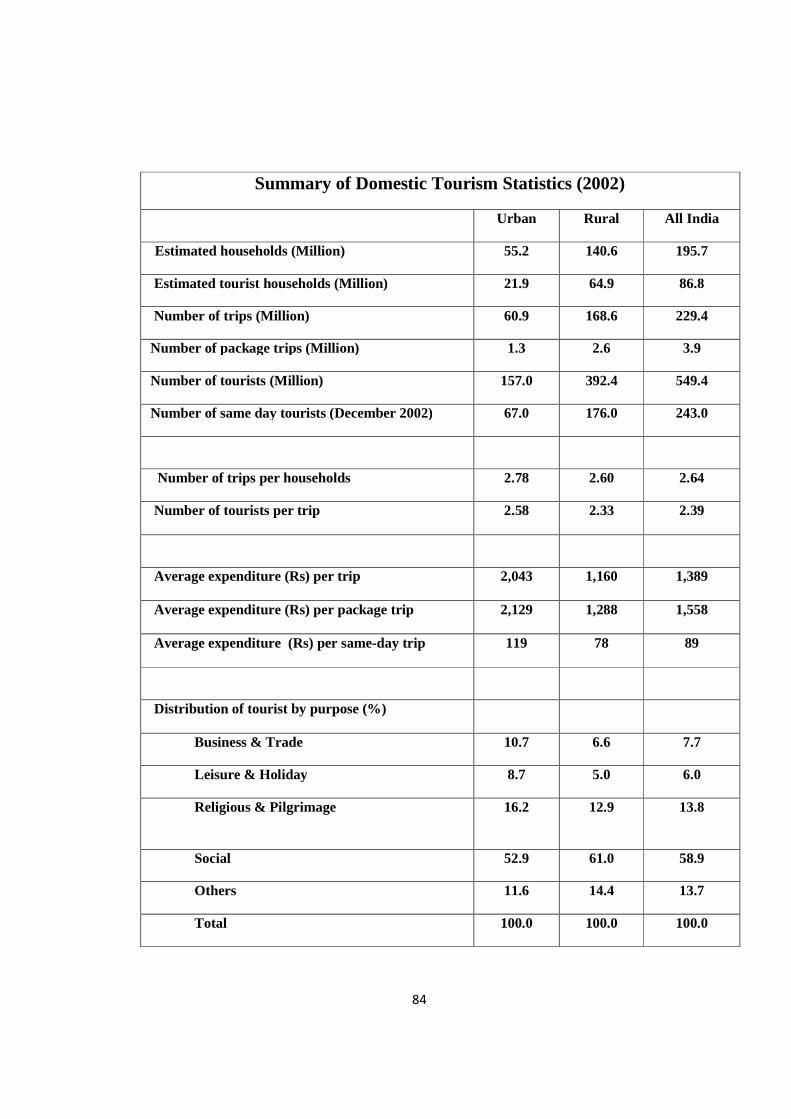
Summary of Domestic Tourism Statistics (2002)
Urban Rural All India
Estimated households (Million) 55.2 140.6 195.7
Estimated tourist households (Million) 21.9 64.9 86.8
Number of trips (Million) 60.9 168.6 229.4
Number of package trips (Million) 1.3 2.6 3.9
Number of tourists (Million) 157.0 392.4 549.4
Number of same day tourists (December 2002) 67.0 176.0 243.0
Number of trips per households 2.78 2.60 2.64
Number of tourists per trip
2.58 2.33 2.39
Average expenditure (Rs) per trip
2,043 1,160 1,389
Average expenditure (Rs) per package trip
2,129 1,288 1,558
Average expenditure (Rs) per same-day trip
119 78 89
Distribution of tourist by purpose (%)
Business & Trade 10.7 6.6 7.7
Leisure & Holiday 8.7 5.0 6.0
Religious & Pilgrimage
16.2 12.9 13.8
Social 52.9 61.0 58.9
Others 11.6 14.4 13.7
Total 100.0 100.0 100.0
85
Appendix - III
RURAL INDIANS CONTRIBUTE MORE TO TOURISM, SURVEY REVEALS :
People living in rural India travelled more and boosted domestic tourism than the urban
population in India, according to a survey conducted by the India’s National Council of
Applied Economic. “Though they move out mostly for social purposes, yet they make
significant contribution in the growth of tourism by visiting tourism places in and around
their main destinations,” the survey said India’s Department of Tourism had
commissioned the nation-wide household survey in the year 2002 to estimate the total
number of domestic tourist. The survey said that of the total household in the country,
about 44 percent had had at least one member who was a tourist during the reference
period. Out of these, about 75 percent were in rural areas, and the remaining 25 percent
were in urban areas, the survey said. Total estimated domestic tourists in 2002 at the
national level were about 550 million, of which about 29 percent were urban inhabitants
and 71 percent were rural. Maharashtra, Uttar Pradesh, Karnataka, Andhra Pradesh and
Rajasthan were the top five states that contributed to domestic tourism. Travel for
social purposes accounted for the largest percentage of tourist in both urban and rural
areas accounting for about 59 percent of total estimated tourist. This was followed by
’religion and pilgrimage’ tourist that accounted for about 14 percent of total tourism, the
survey said. The average expenditure that the domestic tourist incurred per trip at the
national level was 1,389 rupees or approximately $30. The expenditure for urban areas
was Rs 2,044 ($44) and Rs 1,170 for rural areas ($25). Expenditure on transport
accounted for the major share of the trip expenditure, according to the survey. The
average expenditure per trip was the highest for travel related to ‘leisure and holiday’
and lowest for ‘social purposes’. The total expenditure incurred by domestic tourists in
the country during 2002 was estimated to be in the tune of Rs 319 billion. The survey
also estimated that a total of 243 million same day trips for tourism were made during a
single month of December 2002, of which nearly 176 million were by rural households.
The pilot survey also estimated the average expenditure on the same day trips for all
purposes taken together in urban areas as Rs 119 ($3) Rs 78 ($2) in rural areas.
86
Appendix IV : Collection of Primary Data: Interview Method Questions discussed at the interview Q.1. Your comments on domestic tourism?
Q.2. What are the visible emerging trends in tourism?
Q.3. Do you feel the business model should be diversified, or some changes to be made
in the way the tourism product is sold?
Q.4. What factors do you think are influencing the fast growing tourism?
Q.5. Do you think initiatives being taken by the government to promote the various
emerging concepts/forms of tourism is adequate? If yes, what are they?
Q.6. What steps / measures, according to you, should be taken by the government and
corporates to promote the travel & tourism industry in India?
Q.7. What are the major challenges being faced by the industry?
Q.8. What factors would drive the industry’s growth going forward?
Q.9. Potential for the travel and tourism industry in India is enormous. However, at the
same time, the industry faces numerous challenges. Which of these challenges do you
think is the most critical.
Q.10. What are India’s competitive advantages with respect to the different forms of
tourism?
87
SUMMARY OF THE DISCUSSION WITH THE INTERVIEWEES
Q.1. Your comments on domestic tourism?
Although the Indian economy was not as severely affected by the economic slowdown as
other economies, Indian consumers are cautious and are either postponing their travel
plans or opting for shorter duration holidays and travelling within the country. Indians
travel within India mainly for pilgrimage/religious reasons, leisure, visiting
families/friends and business.
Q.2. What are the visible emerging trends in tourism?
Emerging trends : With changing times and global business conditions, significant
changes have been observed in the Indian travel and tourism industry. There is a demand
for niche and customised tourism products.
Lifestyle changes and higher disposable incomes have resulted in shifting travel
preferences and travelers are looking for ‘out-of-the-box’ experiences. Consequently,
travel service providers are offering niche, customised tourism products. This has led to
emergence of niche segments such as wine tourism, pop-culture tourism, cruise tourism,
wellness tourism, monsoon tourism etc. Tour companies are also willing to customise
products as per travelers’ choices/preferences.
Rising online sales : Online travel sales have increased drastically in recent years.
Greater proliferation of the Internet, growth in low-cost air carriers, secure payment
mechanisms, and coming-up of the Indian railways portal have led to rise in online sales
in the travel industry. A number of low-cost carriers operate on certain routes, and hence
online booking offers choice of air carriers to customers. Airline ticket booking
constitutes more than 70% of online travel sales. However, a shift is being seen from air
to non-air segments in the online travel market. This shift is due to the non-air ticket
booking segment growing swiftly with launch of the Indian Railways online portal
(www.irctc.co.in) and many online travel agencies providing bus tickets. Indian Railway
88
Catering and Tourism Corporation is the largest travel website in the APAC in terms of
transaction volumes. A number of hotels also use the Internet for booking of rooms.
Travel portals and hotel chains used to provide 360 degree virtual tours, audio tours and
photographs, and text reviews to the travelers. They are now marketing through video
reviews and video blogs, either put up by themselves or travelers on the travel agency
portal or a social media video platform.
Online travel market sales are expected to grow in the coming years.
Spontaneous travel : Online travel booking has become simpler and easier. High
pressure lifestyle coupled with simpler online travel booking has led to travelers taking
short, random trips during the year. This has given rise to the concept of ‘spontaneous
travel’. Realising the potential in this segment, travel companies also offer services for
‘last-minute bookings’.
Finite travel : Another emerging concept in the travel industry is ‘finite travel’. A
number of people see places and/or species that are endangered or entail some form of
time-related environmental risk or natural phenomenon.
Q.3. Do you feel the business model should be diversified, or some changes to be made in the way the tourism product is sold?
Need to diversify business model : Service providers are now offering attractive price
ranges for services on their websites; this has led to increase in online transactions.
Consequently, the market size for travel agents has been narrowing. Given this change,
travel agents and tour operators now need to diversify their business models and adopt
the role of a travel advisor.
Travel companies should also start offering valuable services to end-customers for
hassle-free travel.
89
Q.4. What factors do you think are influencing the fast growing tourism?
Changing consumer dynamics : The country has been experiencing change in
consumption patterns. The share of non-food consumption, especially of the traditionally-
known non-essentials, has gone up in the past decade. Healthy economic growth coupled
with rapid urbanisation has led to a bulging middle-class population, whose share in total
population is expected to surge in the coming years. This section of the population with
higher disposable incomes over the past decade has caused the shift in spending pattern,
with discretionary purchases forming a substantial part of total consumer spending.
Increased affordability and affinity for leisure travel are driving tourism in India. The
changing consumption pattern would also aid growth of the domestic tourism industry.
Ease of finance : Easier access to finance, in terms of emergence of credit culture and
availability of holidays on EMIs, is another major growth driver for the travel and
tourism industry. India is among the fastest growing financial cards market in the Asia
Pacific. The credit card base in the country is expected to grow at 20-25 % per annum.
Various attractive schemes offered by credit card companies would contribute
significantly to this. Around 35% of users of credit cards utilise them for travel, hotel,
and dining purposes. The expected growth in credit cards should lead to higher spend on
travel and hotels.
In addition to emergence of credit culture, easier availability of personal loans and
schemes offered by travel companies have also boosted growth in the leisure travel
segment. Travel companies have tied up with banks to offer “holiday now… pay later” –
EMI holiday schemes. Moreover, individuals are resorting to personal loans for travel
purposes.
Open sky benefits and low-cost airlines : With the open sky policy, the travel and
tourism industry is experiencing increase in business volumes. Increased airline activity
has stimulated demand and helped in improvement of aviation infrastructure. Low
airfares have also stimulated demand for travel. Budget airlines have encouraged business
90
and leisure travelers, as they offer advantages such as low costs, more options, and strong
connectivity.
World-class medical facility : The popularity of India as a major medical tourist
destination has also aided growth in the industry in cities such as Chennai and Bengaluru.
Many people from the developed countries come to India for the rejuvenation promised
by yoga and Ayurvedic treatments. Furthermore, a nice blend of top-class medical
expertise at attractive prices is enabling more Indian corporate hospitals to get patients
from the developed nations. Most common treatments for which foreigners come to India
are heart surgery, knee transplant, cosmetic surgery and dental care. The medical visa
granted by GoI to tourists coming to India for medical treatment has aided growth in
medical tourism in India.
Increased tourist movement : The country has seen a steady increase in tourist flow,
both domestic and international. International tourism arrivals were up 4.3 % in FY10,
while foreign exchange earnings were up 18.7% to US$ 12.5 bn.
Hosting of international events : Events such as trade fairs, exhibitions, and sports
events tend to bring about higher tourist movement. International events held in the
country lead to higher inbound tourism. The Commonwealth Games, to be held in
October 2010, is expected to see an influx of tourists into the country. At the same time,
events held in other countries tend to increase outbound tourism.
Q.5. Do you think initiatives being taken by the government to promote the various emerging concepts/forms of tourism is adequate? If yes, what are they? A. By and large, the government’s efforts are more towards creating general awareness of
India as a tourist destination in the global market. The ‘Incredible India’ campaign has
been well received and the promotional film commissioned by the Experience India
Society has won numerous awards and generated considerable interest in India. However,
the government is not engaged in promoting any specific form of tourism on a concerted
or continuing basis.
91
Q.6. What steps / measures, according to you, should be taken by the government and corporates to promote the travel & tourism industry in India?
A. There are some forms of tourism that cannot grow unless encouraged, facilitated and
promoted by the government. These include ocean and river cruising, conventions, as
also some specialised activities that attract tourists in large numbers like car races (F1),
motor car rallies (Himalayan Car Rally), tall ship regattas, etc.
Q.7. What are the major challenges being faced by the industry?
A. Very obviously, terrorism and the global economic crisis are the main threats today.
Looking beyond these, the challenges facing the inbound tourism sector continue to be
what they were 40 years ago – poor infrastructure, lack of basic hygienic facilities, almost
complete lack of mid-range accommodation at tourist locations, and harassment by touts
and beggars. Add to this the rather irrational taxation structure followed by some states
with regard to the hospitality industry, and we have a fairly unwelcoming environment
for the tourists, particularly foreign tourists, who are neither accustomed to nor prepared
for such an environment.
Q.8. What factors would drive the industry’s growth going forward?
A. What India needs is integrated planning and development of some selected tourist sites
/ locations as well as coordinated national policies on aspects such as taxation. Visa on
arrival should gradually be extended to more countries on a reciprocal basis. Eventually,
as has happened in most of the bigger countries in the world, the pressures of domestic
tourism create the infrastructure and services network that is then eventually also used by
inbound foreign tourists. Domestic tourism sites, accommodations and other
infrastructure need to be strengthened; automatically, foreign tourists will follow to those
destinations.
92
Q.9. Potential for the travel and tourism industry in India is enormous. However, at the
same time, the industry faces numerous challenges, of which the most critical is lack of
proper infrastructure.
Challenges
Various challenges/issues faced by the domestic travel and tourism industry in India:
• Lack of proper infrastructure
• Human resources
• Service levels
• Lack of adequate marketing and promotion
• Taxation
• Security
• Regulatory issues
Lack of proper infrastructure : Infrastructure needs for the travel and tourism industry
range from physical infrastructure such as ports of entry to modes of transport to urban
infrastructure such as access roads, electricity, water supply, sewerage and
telecommunication. The sectors related to the travel and tourism industry include
airlines, surface transport, accommodation (hotels), and infrastructure and facilitation
systems, among others.
Access and connectivity :To harness India’s tourism potential, several efforts are being
taken for opening new destinations and exploring niche segments. However,
infrastructure facilities such as air, rail, road connectivity, and hospitality services at
these destinations and the connecting cities are inadequate. This remains a major hurdle
for development of tourism. Roadways form a vital network in the tourist industry with
almost 70% tourists in India travelling by road. Moreover, many tourist circuits depend
on roads. Despite numerous efforts to improve road infrastructure, connectivity remains
a major problem. There is a greater need for strengthened road and rail network,
development of more expressways, and tourist-specific routes to improve connectivity to
various locations across different regions.
93
Aviation infrastructure is also critical since it is a major mode of entry for inbound
tourism. Passenger traffic is expected to increase in the coming years; however
infrastructure facilities at airports are cause for concern. Expansion and development of
airports at major gateway cities is underway to cater to the increasing passenger traffic.
However, in addition, airport facilities at important secondary cities and tourist
destinations also need to be improved to be able to handle greater passenger traffic.
Amenities : Amenities available at various tourist locations and en route need to be
improved. These include basic amenities such as drinking water, well maintained and
clean waiting rooms and toilets, first aid and wayside amenities (to meet the requirement
of the tourists travelling to tourist destinations) such as lounge, cafeteria, and parking
facilities, among others.
India scores poorly in terms of availability of these infrastructure facilities. Inadequate
infrastructure facilities affect inbound tourism and also could lead to an increase in the
outflow of domestic tourists from India to other competitive neighboring countries.
Hence, for the industry to register healthy growth, issues concerning all the related
sectors need to be addressed.
Service level : In addition to tour operators and hotel staff, tourists interact with persons
from different backgrounds, occupations and experience. Such people include staff at
bus/railway station, immigration staff at airports, taxi/coach operators, ticketing/ travel
agencies, small hotels, dhabas/roadside eateries, staff at heritage sites, and tour guides,
among others. The degree of service offered by these various stakeholders has a
significant impact on determining the tourist’s overall experience of India as a tourist
destination. The government has taken initiatives to promote responsible tourism by
sensitising key stakeholders of the tourism industry through training and orientation, to
develop a sense of responsibility towards tourists and inspire confidence of foreign
tourists in India as a preferred destination. One such major initiative is the “Atithi Devo
Bhava” campaign. More such efforts are required to improve the degree of service
across various operators.
94
Marketing and promotion : Marketing and promotion of India as a major tourist
destination is critical for the industry to achieve its potential. Lack of adequate
budgetary support for promotion and marketing, compared with competing tourist
destinations, is a major reason for India lagging behind as a tourist destination.
Marketing under the “Incredible India” campaign helped place India as a good tourist
destination on the global tourism map. Indian tourism products are promoted primarily
by the Ministry of Tourism with the involvement of state governments through the State
Tourism Development Corporations. Newer tourism concepts, which include cruise
tourism, adventure tourism, agri tourism or rural tourism, are emerging in India and
these require support to develop and flourish. Hence, greater marketing push for these
different products is required. To remain competitive in the fiercely competitive field,
India needs to change its traditional marketing approach to a more competitive and
modern approach. There is a need to develop a unique market position and the brand
positioning statement should capture the essence of the country’s tourism products: i.e.,
they should be able to convey an image of the product to a potential customer.
Taxation : Travel and tourism in India is a high-taxed industry, which makes India
expensive as a tourist destination. This is affecting the growth of the industry in India
and India is losing out to other low-cost destinations. Inbound tourism is the one most
affected. Various taxes are levied across the entire industry right from tour operators,
transporters, airline industry to hotels and these include service tax, luxury tax, tax on
transportation, tax on aviation turbine fuel (airline industry), and various taxes on
transportation. In addition, these tax rates tend to vary across different states in the
country.
Security : Security has been a major problem as well for growth of tourism for a
number of years. Terrorist attacks or political unrest in different parts of the country
have adversely affected sentiments of foreign tourists. Terror attacks at Mumbai in
November 2008 dealt a strong blow to tourism in the country. The terror attacks raised
concerns of safety. In addition, insurgency in different parts of the country also mars
India’s image as a safe destination. Following the terror attacks in Mumbai, security at
tourist spots, airports and hotels has been beefed up to regain confidence of tourists.
95
However, the government needs to take a proactive approach in addressing these issues
and in averting the potential impact on the industry.
Cyber crime is another major challenge the travel industry faces. Use of Internet in the
travel and tourism industry has increased rapidly in recent years and has emerged as one
of major segments for online spends. However, some of the biggest frauds have been
detected in this segment and the issue of online security has assumed significant
importance. While the online travel industry has registered robust growth, major
concerns relating to security of online transactions persist. The industry needs to take
measures to make the process of online bookings more secure and transparent and also
needs to create awareness regarding this.
Regulatory issues : For inbound international tourists, visa procedures are seen as a
hindrance. A number of countries competing with India for tourists provide visa on
arrival. India should provide visa on arrival for more countries or for certain categories
of tourists for a specific duration.
A number of projects in the tourism infrastructure segment and in the hotels industry are
delayed due to non-attainment of licenses and approvals on time. The government
recently cleared the long-standing proposal for single window clearance for hotel
projects to hasten the process of infrastructure development. Implementation of this
proposal would help development of tourism and hospitality infrastructure in the
country. There is a greater need for speedier clearances and approvals for all projects
related to the industry.
Q.10. What are India’s competitive advantages with respect to the different forms of
tourism?
A. In India, the raw product exists for a variety of specialised forms of tourism such as
Wildlife Tourism, Coastal Tourism, Adventure Tourism, Conventions, River and Sea
Cruising. Unfortunately, none of these has been developed to match world-class
standards.
96
Appendix V : Information from communication with Respondents: Information was obtained from consumers, Tour Operators, Hoteliers, and others who are
knowledgeable about the problem at hand. The respondents were asked questions through
personal interviews, and telephone interviews. They were asked for information as a part
of self contained, “one time” survey.
The objective was to get information regarding the consumers perception of domestic
tourism, reason for travel, the emerging trends and factors influencing choice of a
destination. It also enabled to get an insight to the existing business model and the
challenges faced by industry to reach the perceived target market.
Details of respondents : Hospitality Industry
1. Mr A. Leo Assistant General Manager Ramyas Hotels Private Lts. 13-D/2, Williams Road, Tiruchirappali – 620 001
2. Mr D.A Santhavadanam Executive housekeeper The SAVERA Hotel 146, Dr Radhakrishnan Road Chennai – 6000 004
3. Mr Susanta Kr. Panda Co-ordinator Aalankrita The Ethnic Gateway Thumkunta Village Karimnagar Main Road Shameerpet Mandal Andhra Pradesh – 500 078.
4. Mr Sameem Reza Asst Manager Sales The People Tree 298/20 Ghitorni Village, New Delhi .
97
5. Mr U.Muniasamy Proprietor Manickam Tours and Travels Delanipur, Port Blair.
6. Mr C. G. Vijay Manager Directorate of Tourism Andaman & Nicobar Admn Port Blair. Extensive Business Travellers and Socialites 1. Mrs Janaki Narkar – Waldraff
Director Babelfish. India Transalations & Intercultural Training (German) 417/ Siddarth Tower. Kothrud. Pune – 411 029
2. Dr M. Ravikumar Senior Scientist National Geo Physical Institute Uppal, Hyderabad – 5000 007
3. Dr N. Poornachandra Rao Senior Scientist National Geo Physical Institute Uppal, Hyderabad – 5000 007
4. Mr Bhanu Prakash Jamched Practice Area Leader IBM India Pvt Ltd Pune.
5. Dr N. Kameshwar Rao DGM CMC Ltd GachiBowli Hyderabad
6. Dr G. Mohan
Prof Dept of Earth Sciences IIT Mumbai Powai – 4000 076.
98
Chapter 9 : Role of Marketing Strategies
Strategic marketing for destinations and strengthening their competitiveness
Competitive strategy is the search for a favourable competitive position in an industry.
This a function of both the attractiveness of the industry and the relative competitive
position within that particular industry, as well as the alternative activities that an
organization can undertake. Competitive strategy aims to establish a profitable and
sustainable position against the forces that determine industry competition. Competitive
is, therefore defined here as the effort and achievement of long term profitability, above
the average of the particular industry within which they operate as well as above
alternative investment opportunities in other industries . This definition includes
therefore the concept of opportunity cost and illustrates that successful organizations
should not only compete within their particular industry but also against other investment
opportunities. When referring to tourism destinations competitiveness should also include
the sustainability of local resources for ensuring the maintenance of long term success as
well as the achievement of equitable returns-on-resources utilized to satisfy all
stakeholders.
There is little written about the competitiveness of tourism destinations. Bordas (1994a
and 1994b) has developed several frameworks which determine destination
competitiveness. They are based on demand and supply as well as a wide range of
factors influenced by the external environment of the destination.
Strategy formulation for destinations
This paper reviews three strategy models , namely Porter’s generic strategies, Gilbert’s
proposition for “differentiation of the destination” and Poon’s analysis for “flexible
specialization”. The paper then synthesizes their proposition in order to propose a generic
strategy and illustrate how destinations should develop their offerings.
99
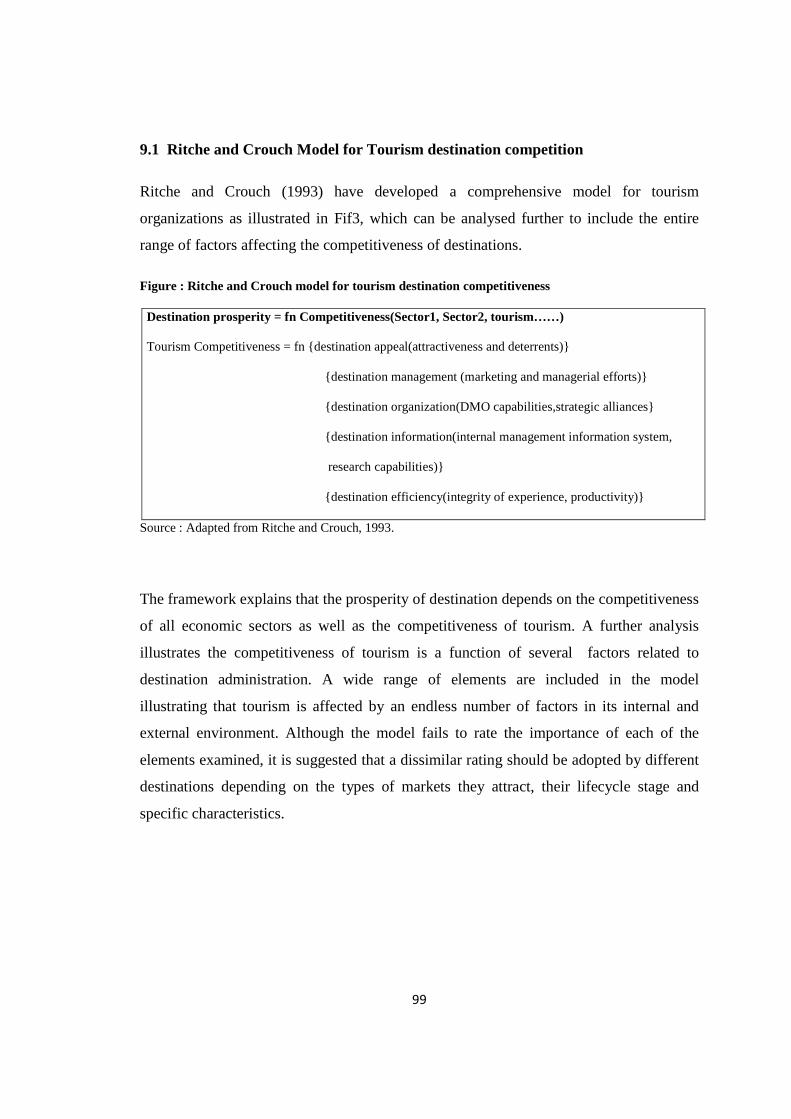
9.1 Ritche and Crouch Model for Tourism destination competition
Ritche and Crouch (1993) have developed a comprehensive model for tourism
organizations as illustrated in Fif3, which can be analysed further to include the entire
range of factors affecting the competitiveness of destinations.
Figure : Ritche and Crouch model for tourism destination competitiveness
Destination prosperity = fn Competitiveness(Sector1, Sector2, tourism……)
Tourism Competitiveness = fn {destination appeal(attractiveness and deterrents)}
{destination management (marketing and managerial efforts)}
{destination organization(DMO capabilities,strategic alliances}
{destination information(internal management information system,
research capabilities)}
{destination efficiency(integrity of experience, productivity)}
Source : Adapted from Ritche and Crouch, 1993.
The framework explains that the prosperity of destination depends on the competitiveness
of all economic sectors as well as the competitiveness of tourism. A further analysis
illustrates the competitiveness of tourism is a function of several factors related to
destination administration. A wide range of elements are included in the model
illustrating that tourism is affected by an endless number of factors in its internal and
external environment. Although the model fails to rate the importance of each of the
elements examined, it is suggested that a dissimilar rating should be adopted by different
destinations depending on the types of markets they attract, their lifecycle stage and
specific characteristics.
100
The contribution of the Ritche and Crouch lies on the comprehensiveness and wideness
of the elements taken into consideration. The model also highlights that it is the
combination of all factors comprising the competitiveness of destinations as well as
synergies between these elements that determine the attractiveness of a region.
Consumers may be willing to compromise some elements for some others, for example
overcrowdness for cheaper price in some Spanish Costas. Understanding the values and
prime aims would be critical for developing the module further. Ultimately the
competitiveness of destinations depend on their ability to maximize their performance
for each individual element assessed.
101
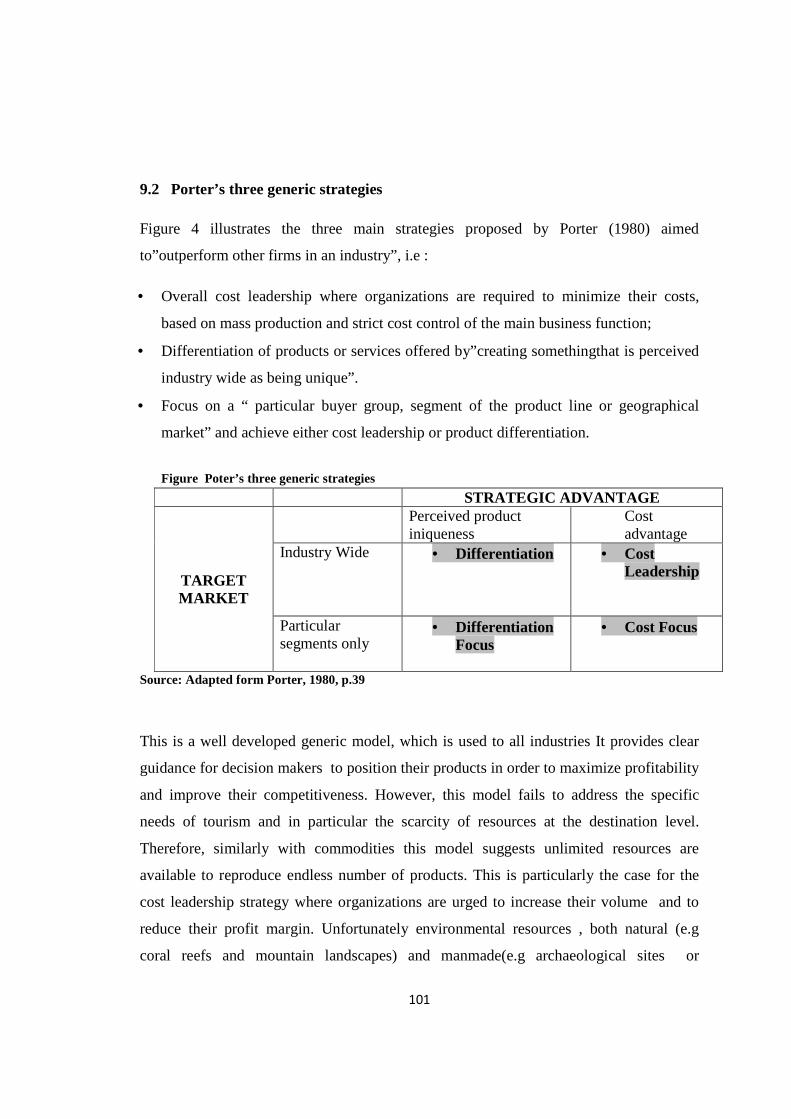
9.2 Porter’s three generic strategies
Figure 4 illustrates the three main strategies proposed by Porter (1980) aimed
to”outperform other firms in an industry”, i.e :
• Overall cost leadership where organizations are required to minimize their costs,
based on mass production and strict cost control of the main business function;
• Differentiation of products or services offered by”creating somethingthat is perceived
industry wide as being unique”.
• Focus on a “ particular buyer group, segment of the product line or geographical
market” and achieve either cost leadership or product differentiation.
Figure Poter’s three generic strategies
STRATEGIC ADVANTAGE
TARGET MARKET
Perceived product iniqueness
Cost advantage
Industry Wide • Differentiation • Cost Leadership
Particular segments only
• Differentiation Focus
• Cost Focus
Source: Adapted form Porter, 1980, p.39
This is a well developed generic model, which is used to all industries It provides clear
guidance for decision makers to position their products in order to maximize profitability
and improve their competitiveness. However, this model fails to address the specific
needs of tourism and in particular the scarcity of resources at the destination level.
Therefore, similarly with commodities this model suggests unlimited resources are
available to reproduce endless number of products. This is particularly the case for the
cost leadership strategy where organizations are urged to increase their volume and to
reduce their profit margin. Unfortunately environmental resources , both natural (e.g
coral reefs and mountain landscapes) and manmade(e.g archaeological sites or
102
architectural structures)have a limited capacity which they can accommodate . Resources
in tourism are irreplaceable once destroyed and therefore a strategy should ensure that
their use is limited to the degree that does not threat their sustainability in the long term.
Once this is understood and appreciated , Porter’s model enables tourism marketers to
focus on differentiation strategies and to develop their mix accordingly. However, several
destinations, which are on the consolidation phase of their lifecycle, have exceeded the
maximum capacity which would have enabled them to sustain their resources. Their
ability to promote differentiated tourism products has also been jeopardized, as over-
development has exploited and damaged their resources. This is experienced in some
mass tourism destinations, such as Benidorm and Costa Bravav in Spain, or Faliraki and
Malia in Greece.Once destinations have reached that stage there is a limited choice. The
majority try to attract more mass tourism so they can increase their profitability through
volume. Increasingly however some regions aim to renovate their properties and facilities
and re-launch their offerings.The Calvia in Mallorca, which decided to demolish three
hotels in order to improve public areas and to enhance the quality of its products set new
best practices which may be followed by other regions.
103
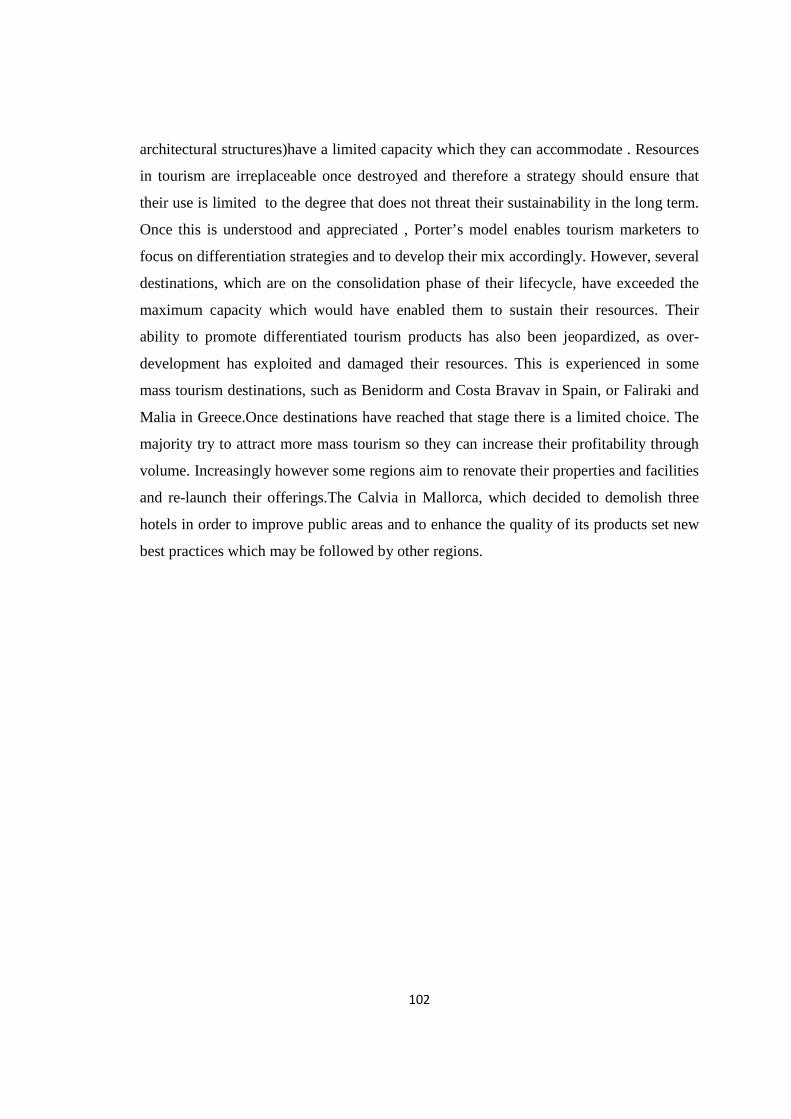
9.3 Gilbert’s strategic framework
Based on the above rational the second strategic framework introduced by Gilbert(1984
and 1990b) argues that destinations can be classified on a continuum between a “status”
and a” commodity” area, as illustrated in Figure 5. “Status areas” achieve intentional
demand as a result of the unique product attributes perceived by the tourism market.
These unique attributes may be genuine or imaginative and thus, a destination is regarded
as irreplaceable, which increases consumers loyalty and willingness to pay. In the
“commodity status” case, destinations are substitutable, very sensitive to price and
economic changes, while consumers have a low awareness of any unique benefits or
attributes. Thus, travellers base their decision to visit the area merely on price, while the
demand for the destination is incidental and destinations are unable to attract high
spenders. Despite the fact that the sustainability of resources is not discussed explicitly by
the model, it is quite evident that ”status areas” manage their resources as product
attributes and therefore are appreciated by consumers who are willing to pay more.
Figure 5: Gilberts differentiation strategy
Source : adapted from Gilbert, 1990,p.25
Gilbert(1990) asserts that destinations should attempt to become “status areas”’ rather
than a “commodity area” one , in order to improve their image , loyalty and economic
benefits. It is suggested that destinations should differentiate their tourism products in
order to achieve a unique ”tourist product benefit”. This will enable them to establish
their position in the international market and attract both high spenders and loyal tourists,
who appreciate the uniqueness of their resources and offerings. Although the model
clearly differentiates destinations to distinctive categories it fails to recognize that the

104
majority of destinations lay between the two ends of the continuum. It also fails to relate
to the different stages of the life cycle and to the inevitability experienced in several
regions where destinations are launched as status areas and gradually slip to commodity
status . Nevertheless the model clearly contributes to tourism marketing by correlating
product attributes with willingness to pay and also by illustrating clearly that destinations
should decide on what direction they should plan and manage their resources and
facilities.
105
9.4 Poon’s flexible specialization
A third strategic approach for tourism is proposed by Poon(1989 and 1993), based on the
concept of “flexible specialization” of the tourism business. Poon examines the tourism
industry processes and proposes a strategy to enable tourism organizations to improve
their competitiveness. Poon argues that ”flexible specialization” is a strategy of
“permanent innovation” and “ceaseless change” which provides for “new tourism”. New
tourism is flexible, segmented, customized to the tourist’s needs and diagonally
integrated. In contrast, old tourism can be characterized as “mass, standardized and
rigidly packaged”. The main source of flexibility for service firms lie in the organization,
management, marketing, distribution and other forms of interaction and interrelationships
among guests, hotels, suppliers, distributors. What is important however is not each of
these stand-alone aspects but haw they are coupled to create competitive advantages and
hence, capabilities to move with the market. This is timely model, which predicted the
impact of information technology on both the decision making and consumer behavior.
Industry innovation is critical in this strategy and the utilization of new technology
provides the opportunity to customize products according to customers specific
requirements. Hence destinations can organize their assets and attributes in such a way
which will enable them to specialize their tourism product according to particular
demand needs.
Although Poon’s model revolutionized tourism thinking it is still difficult to implement
at the destination level. The majority of infrastructure and super structure is based on
fixed assets, which cannot be altered easily and therefore have a limited degree of
flexibility. This is more evident at destinations at the consolidation stages, which are
unable to reinvent themselves and approach new markets. This model clearly contributes
to the field by encouraging tourism organizations and destinations to challenge existing
strategies and practices and to forcing them to approach new tourism with new tools
introduced by technology. Concentrating on core functions and outsourcing all peripheral
activities to networks of virtual co-operations should enable destinations and enterprises
to innovate and to adapt to the needs of consumers constantly.
106
9.5 Synthesis of strategic frameworks and lessons for strategic destination
marketing
The discussion of the three models provides several interesting lessons. A close
examination of strategies reveals that they share a similar base. Porter’s “differentiation”,
Gilbert’s “status area” and Poon’s ”flexible specialization” describe how firms and
destinations can achieve value competitive advantages. Consumers appreciate special
attributes and values and as a result they are inclined to visit areas more regularly, to
increase their loyalty and to pay higher prices. In contrast, “cost leadership”, ”commodity
area” and “standardization or the “Fordism production model” describe the efforts of
firms or destinations to achieve “cost competitive advantage” by offering their products
for less than their competitors. This is achieved through economies of scales ,
standardization and mass production. Destinations and tourism products are treated as
commodities and decisions are merely based on price. Hence the underlying concept of
the two alternative strategies is the relationship between volume and price. The first set
of strategies supports a “low volume-high profit margin” approach., where each
consumer is paying premium prices for unique products, whilst the second set of
strategies follow a “high volume-low profit margin” approach.
Tourism destinations should avoid the cost advantage strategies as they are based on
mass production and consumption and assume unlimited production capacity and
resources. The inseperability of the tourism product determines that consumers should be
present at the time of product delivery. Therefore, the interaction of consumers should be
present at the time of the product delivery. Therefore, the interaction of consumers with
socio-cultural and environmental scarce resources can decay the very reasons, which
attract people to places. Seasonality also generates demand peaks and inflates the
problem during certain periods every year. Although economic benefits can also be
achieved by using the “commodity area” or the “standard product model”, it is argued
that on the long term these approaches reduce tourist satisfaction, consumer willingness
to pay, and are against demand trends. In addition, the “high volume-low profit margins”
strategy has catastrophic social and environmental impacts on destinations. As a results,
not only their sustainability may be jeopardized but also the competitiveness of the
107
region as a whole. Effectively these strategies push destinations through their lifecycle
stages and force them to reach their consolidation stage. Destinations therefore should
define and not exceed their carrying capacities in order to sustain their resources and at
the same time avoid jeopardizing consumer satisfaction.
This is reflected on both Gilbert and Poon’s strategies which agree that destinations
should aim to achieve a “status area” or “niche” orientation through differentiation, in
order to increase consumer satisfaction as well as to maximize the benefits for tourism
regions. This strategy is already adopted in several resort areas, such as Valencia in
Spain, where it is recognized that the need for diversification and differentiation ”has
now become essential owing to the level of competitiveness adding value on the product
and by contributing to the total brand experience and projecting powerful images.
The entire range of players that bring together tourism demand and supply for a region
formulate its distribution channel. Distribution of destinations becomes increasingly more
important, not only because it is estimated to cost 20-30% of the product price but also
because it determines whether and under what conditions suppliers can meet their target
markets. This is the case especially in the European leisure market context as
concentration has led four major companies to dominate the market. Business travelers
have strict schedules and use intermediaries to organize their itineraries. In contrast,
leisure travelers tend to have much greater flexibility and price elasticity. As a
consequence, intermediaries can influence their decision and choice of destination.
108
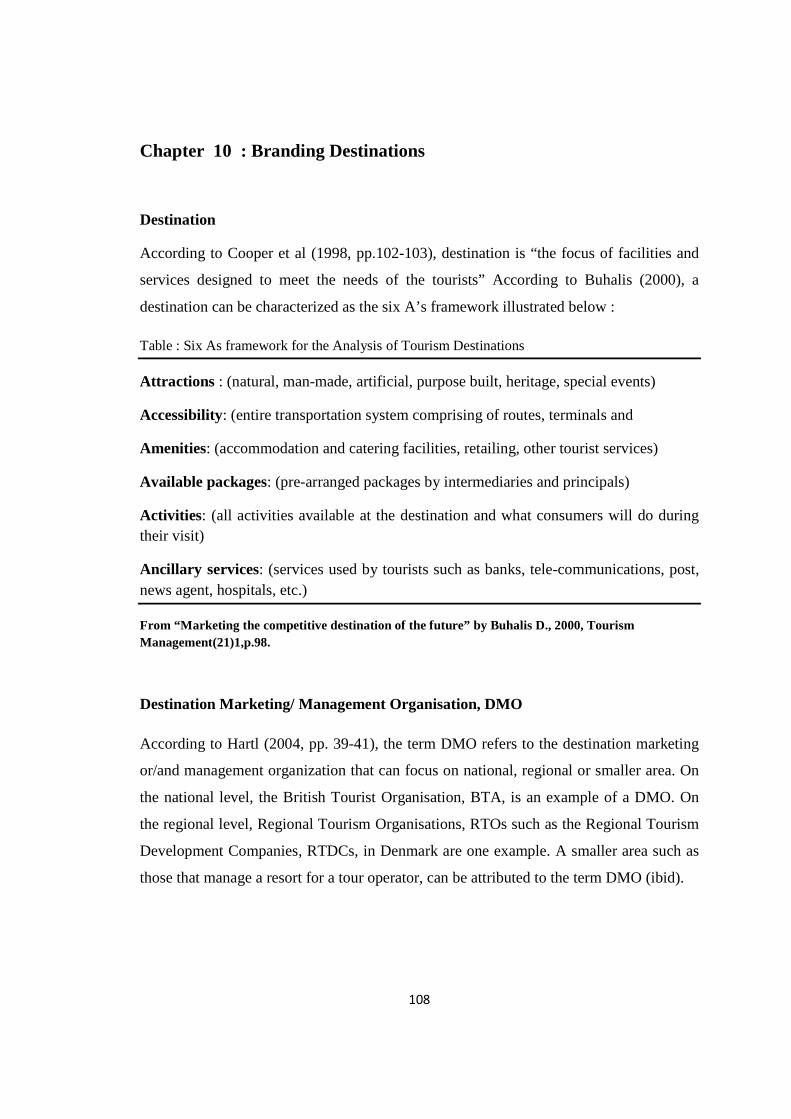
Chapter 10 : Branding Destinations
Destination
According to Cooper et al (1998, pp.102-103), destination is “the focus of facilities and
services designed to meet the needs of the tourists” According to Buhalis (2000), a
destination can be characterized as the six A’s framework illustrated below :
Table : Six As framework for the Analysis of Tourism Destinations
Attractions : (natural, man-made, artificial, purpose built, heritage, special events)
Accessibility: (entire transportation system comprising of routes, terminals and
Amenities: (accommodation and catering facilities, retailing, other tourist services)
Available packages: (pre-arranged packages by intermediaries and principals)
Activities: (all activities available at the destination and what consumers will do during their visit)
Ancillary services: (services used by tourists such as banks, tele-communications, post, news agent, hospitals, etc.)
From “Marketing the competitive destination of the future” by Buhalis D., 2000, Tourism Management(21)1,p.98.
Destination Marketing/ Management Organisation, DMO
According to Hartl (2004, pp. 39-41), the term DMO refers to the destination marketing
or/and management organization that can focus on national, regional or smaller area. On
the national level, the British Tourist Organisation, BTA, is an example of a DMO. On
the regional level, Regional Tourism Organisations, RTOs such as the Regional Tourism
Development Companies, RTDCs, in Denmark are one example. A smaller area such as
those that manage a resort for a tour operator, can be attributed to the term DMO (ibid).
109
According to Buhalis (2000), four key common strategic objectives are addressed by DMOs (see Table)
� Enhance the long term prosperity of local people � Delight visitors by maximizing their satisfaction � Maximise profitability of local enterprise and maximize multiplier effects � Optimise tourism impacts by ensuring a sustainable balance between economic
benefits and socio-cultural and environmental costs
From “Marketing the competitive destination of the future” by Buhalis D., 2000, Tourism Management(21)1,p.100
110
10.1 Notion of Branding in Tourism Destination Context
According to Pike (2005), branding of destination is more complex and challenging
than other goods and services. The author highlights six reasons :
1. Destinations are more multidimensional than consumer goods and other types of
services.
2. The market interests of diverse group of active stakeholders are heterogeneous.
DMOs have to target a multiplicity of geographic markets in order to attract a
wide range of segments.
3. The politics of the decision making regarding who decides the brand theme and
how they are held accountable.
4. DMOs lack direct control over the actual delivery of the brand promise by the
local tourism community.
5. DMOs have no access to the hundreds of thousands of visitors’ contact details
left at accommodation registration desks. This means that it is difficult to
measure brand loyalty, which is one of the corner stones in the brand equity
model.
6. Funding is often a continuous problem for DMOs, in both scale and consistency.
Despite the fact that destination branding is a complex task, it has many advantages such
as a strong brand can help limiting discounts and preventing slippage into the maturation
phase of the destination lifecycle (Blain et al, 2005).
According to Jobber(2004), a brand can be defined as “a distinctive product offering
created by the use of a name, symbol, design, packaging, or some combination of
these intended to differentiate it from its competitors” (op cit, p.905). The author
further defines branding “is the process by which companies distinguish their product
offerings from the competition” (op cit, p. 261).
111
Blain et al(2005) use Ritche and Ritchie’s (1998) definition of a destination brand as “a
name, symbol, logo, word mark or other graphic that both identifies and differentiates
the destination: furthermore, it conveys the promise of a memorable travel experience
that is uniquely associated with the destination; it also serves to consolidate and reinforce
the recollection of pleasurable memories of the destination experience” (ibid).As many
destinations promote similar attributes such as scenery, history and as many destinations
promote similar attributes such as scenery, history and culture, an effective destination
branding requires a unique selling proposition (Blain et al, 2005). In addition, this
proposition needs to be sustainable, believable, relevant and attractive in competitors’
eyes so that they would like to copy, but cannot surpass or take over (Morgan et
al,2004,p.65). In the tourism industry, Blain et al (2005) further support the importance of
incorporating the concept of the visitor experience into the process of branding.
The authors have redefined and enhanced the previously cited definition of a destination
brand by Ritchie and Ritche (1998) by emphasizing the importance of branding in
influencing the consumer decision process when it comes to choosing a destination to
visit. Blain et al (2005) introduce the definition of branding for tourism destination as:
“ Destination branding is the set of marketing activities that – (1) support the creation of a
name, symbol, logo, word mark or other graphic that readily identifies and differentiates a
destination; that (2) consistently convey the expectation of a memorable travel experience that
is uniquely associated with the destination; that (3) to consolidate and reinforce the emotional
connection between the visitor and the destination; and that (4) reduce consumer search costs
and perceived risk. Collectively, these activities serve to create a destination image that
positively influences consumer destination choice.”
112
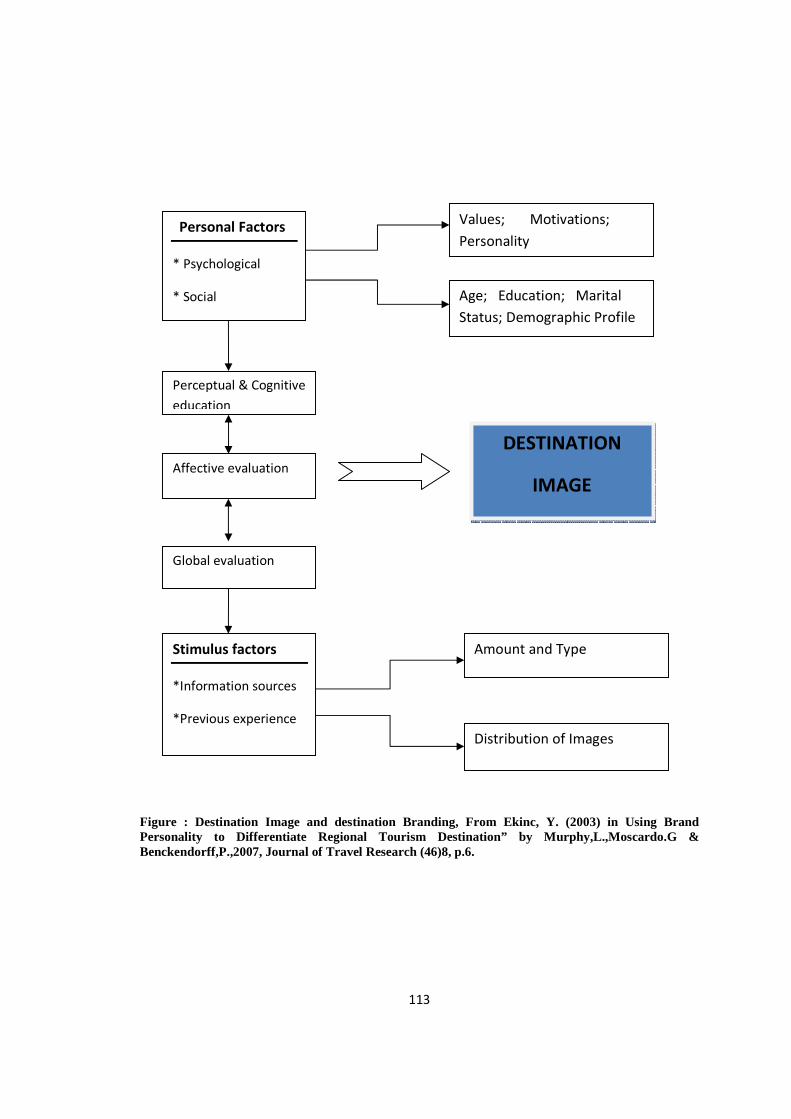
Murphy, Moscardo and Benckendorff (2007) present the framework for destination
branding developed by Ekinci in 2003 (see fig). In the frame work, the destination image
is built on three components : the overall image, the destination brand and, within it,
brand personality (marked with numbers 1-3). Therefore, the destination image is
connected to the tourist’s self image. This connection between self image and destination
image is based on the arguments that lifestyle and value systems are key components in
the process of destination choice . It is argued that tourism marketers should focus on and
confirm more of what the customer would like to see in and of themselves and their
lifestyles instead of concentrating on the tangible properties of the product or service.
This means that DMOs need to address more emphasis on the creation and promotion of
holiday experiences that connect key brand values and assets to the holiday aspirations
and needs of customers (ibid). Furthermore: a distinctive and emotionally attractive
destination personality is shown to have an influence on the perceived image of a place.
This in, influences on tourist choice behavior (Ekinci &Hosany, 2006)
113
Figure : Destination Image and destination Branding, From Ekinc, Y. (2003) in Using Brand Personality to Differentiate Regional Tourism Destination” by Murphy,L.,Moscardo.G & Benckendorff,P.,2007, Journal of Travel Research (46)8, p.6.
Personal Factors
* Psychological
* Social
Perceptual & Cognitive
education
Affective evaluation
Global evaluation
Stimulus factors
*Information sources
*Previous experience
Values; Motivations;
Personality
Age; Education; Marital
Status; Demographic Profile
DESTINATION
IMAGE
Amount and Type
Distribution of Images
114
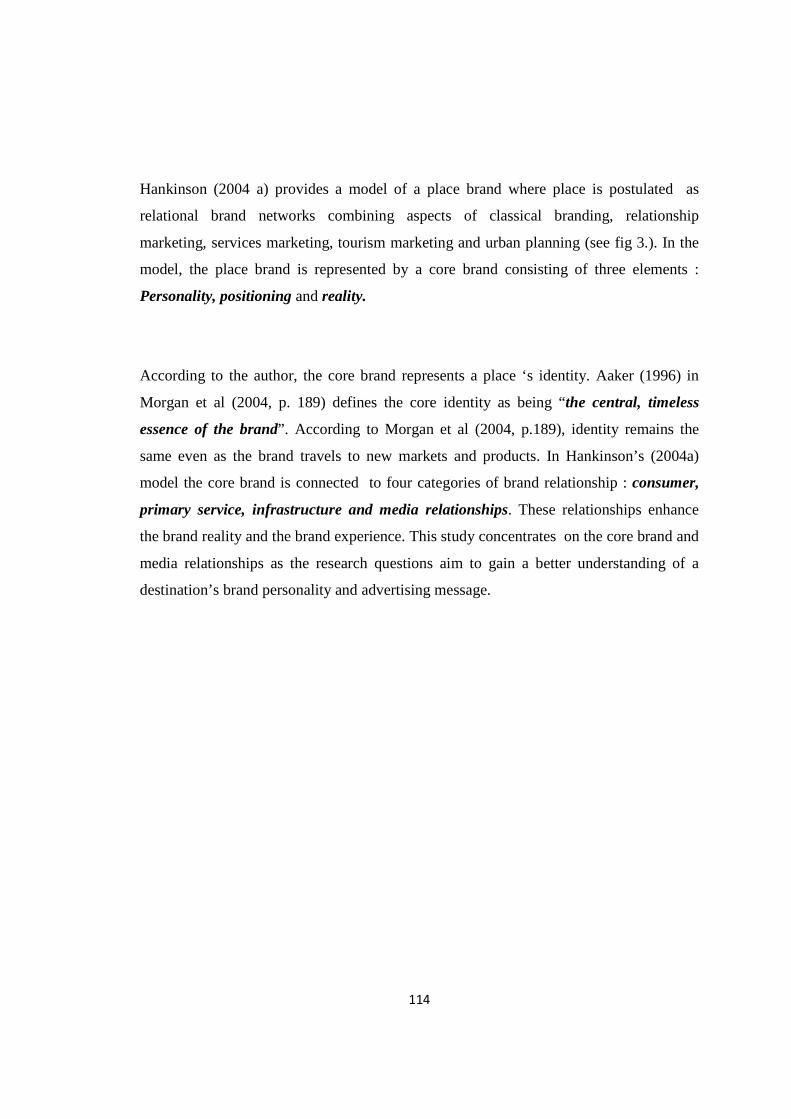
Hankinson (2004 a) provides a model of a place brand where place is postulated as
relational brand networks combining aspects of classical branding, relationship
marketing, services marketing, tourism marketing and urban planning (see fig 3.). In the
model, the place brand is represented by a core brand consisting of three elements :
Personality, positioning and reality.
According to the author, the core brand represents a place ‘s identity. Aaker (1996) in
Morgan et al (2004, p. 189) defines the core identity as being “the central, timeless
essence of the brand”. According to Morgan et al (2004, p.189), identity remains the
same even as the brand travels to new markets and products. In Hankinson’s (2004a)
model the core brand is connected to four categories of brand relationship : consumer,
primary service, infrastructure and media relationships. These relationships enhance
the brand reality and the brand experience. This study concentrates on the core brand and
media relationships as the research questions aim to gain a better understanding of a
destination’s brand personality and advertising message.
115
References : Hankinson (2004 a); Aaker (1996) in Morgan et al (2004, p. 189); Hankinson’s (2004a)
Figure : The Relational Network Brand. From “Relational Network Brands: Towards a Conceptu al Model of Place Brands” By Hankinson, G.,2004a, Journal of Vacation Marketing (10)2,p. 115.
Consumer relationship
• Non-conflicting target markets
• Residents and employees
• Internal customers
• Managed relationships from the
top
Core Brand
• Personality
• Positioning
• Reality
Brand Infrastructure
relationship
• Access services
• External transport
• Internal transport
• Hygiene facilities
• Car parks
• Open spaces
•
Primary service relationships
• Services at the core of
the brand experience
• Retailers
• Events and leisure
activities
• Hotels and hotel
associations
Media relationship
• Organic communication
• Induced /marketing
communications
• Publicity
• Public relations
• advertising
116
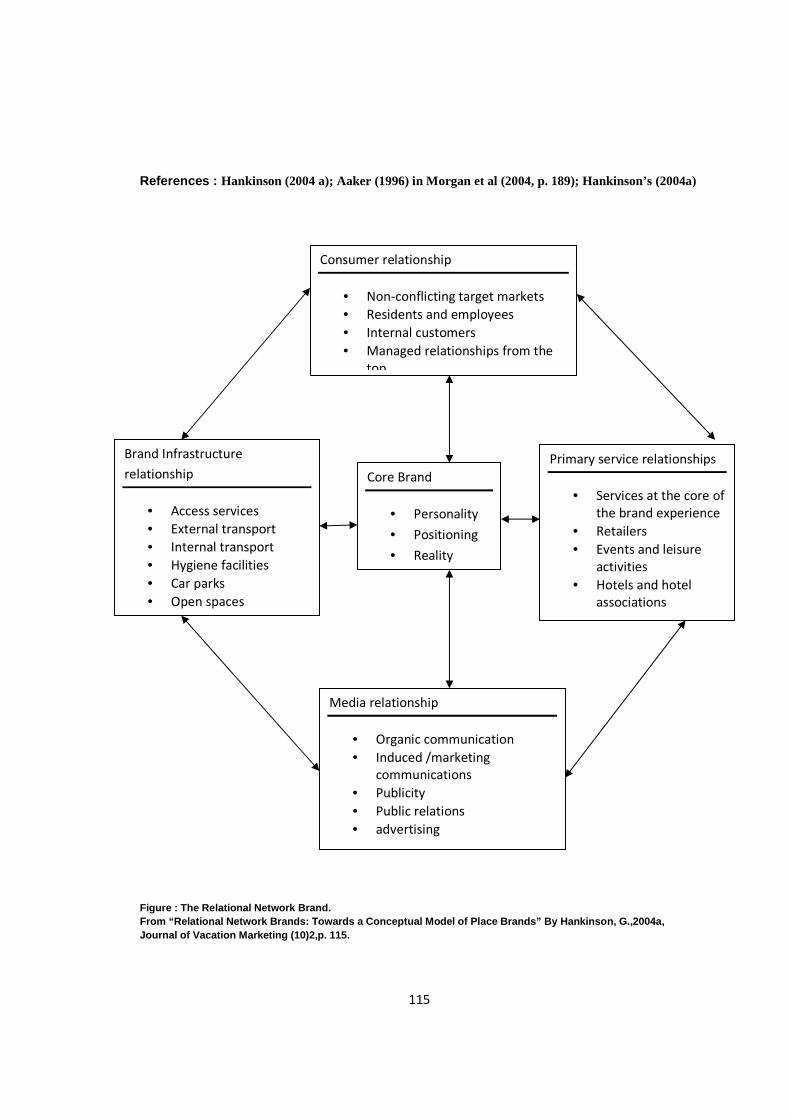
10.2 Tourism Destination Development
According to Cooper et al (1998), the tourist area life cycle, TALC, states that
destinations go through a cycle of evolution similar to the life cycle of a product (se fig).
In the model , numbers of visitors replace sales of the product. The shape of the TALC
curve varies as it is dependent on factors such as the rate of employment, access,
government policy, market trends and competing destinations (ibid). TALC includes
seven stages : exploration, involvement, development, consolidation, stagnation, decline
or rejuvenation that the authors define by adapting Butler (1980) and Cooper (1997) (op
cit, pp.115-116).
A Rejuvenation CRITICAL RANGE OF Stagnation B ELEMENTS OF CAPACITY Number C of tourists Consolidation D Decline E
Development
Involvement
Exploration Time Fig : Hypothetical Tourist Area Life Cycle. From Butler, R,W. (1980) in “Tourism Principles and Practice(2nd ed)” by Cooper, C.,Fletcher, J., Gilbert,D., Shepherd, R., & Wanhill,S., 1998, Harlow: Pearson Educational Limited,p.114.
117
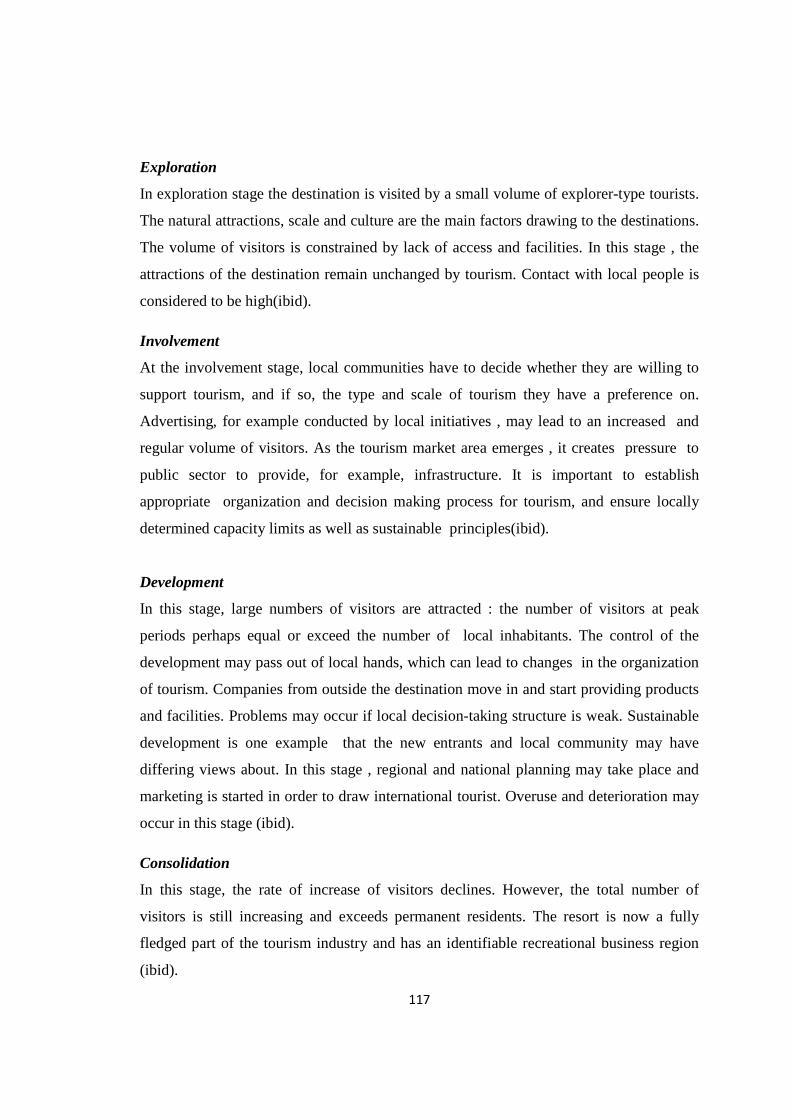
Exploration
In exploration stage the destination is visited by a small volume of explorer-type tourists.
The natural attractions, scale and culture are the main factors drawing to the destinations.
The volume of visitors is constrained by lack of access and facilities. In this stage , the
attractions of the destination remain unchanged by tourism. Contact with local people is
considered to be high(ibid).
Involvement
At the involvement stage, local communities have to decide whether they are willing to
support tourism, and if so, the type and scale of tourism they have a preference on.
Advertising, for example conducted by local initiatives , may lead to an increased and
regular volume of visitors. As the tourism market area emerges , it creates pressure to
public sector to provide, for example, infrastructure. It is important to establish
appropriate organization and decision making process for tourism, and ensure locally
determined capacity limits as well as sustainable principles(ibid).
Development
In this stage, large numbers of visitors are attracted : the number of visitors at peak
periods perhaps equal or exceed the number of local inhabitants. The control of the
development may pass out of local hands, which can lead to changes in the organization
of tourism. Companies from outside the destination move in and start providing products
and facilities. Problems may occur if local decision-taking structure is weak. Sustainable
development is one example that the new entrants and local community may have
differing views about. In this stage , regional and national planning may take place and
marketing is started in order to draw international tourist. Overuse and deterioration may
occur in this stage (ibid).
Consolidation
In this stage, the rate of increase of visitors declines. However, the total number of
visitors is still increasing and exceeds permanent residents. The resort is now a fully
fledged part of the tourism industry and has an identifiable recreational business region
(ibid).
118
Stagnation
In this stage peak tourist volumes have now been reached. The destination is no longer
fashionable and relies upon visits from more conservative travelers. Major promotional
and development efforts are needed in order to maintain the number of visits.
Environmental, social and economic problems are typical for a destination in this stage,
and competition is fierce (ibid).
Decline or Rejuvenation
After stagnation the destination either declines or rejuvenates. According to Cooper et al
(1998,p.116), in the decline stage visitors are being lost to newer resorts, and a smaller
geographical catchment for day trips and weekend visits is common whereas in the
rejuvenation stage destination managers have a choice to rejuvenate or re-launch the
destination by looking at new markets or developing the product. A destination should try
to protect its traditional markets, but also try to establish new markets and products such
as business, conference or special interest tourism. This helps to stabilize visitation and
overcome the seasonality related issues (ibid).
119
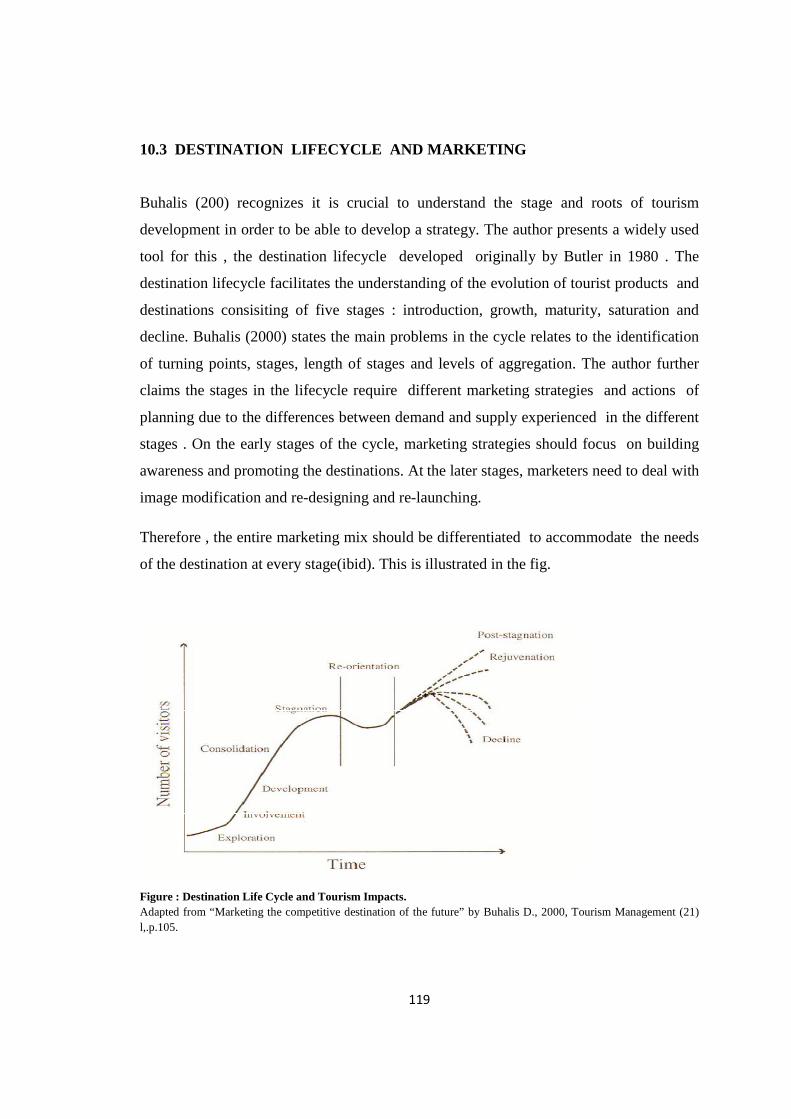
10.3 DESTINATION LIFECYCLE AND MARKETING
Buhalis (200) recognizes it is crucial to understand the stage and roots of tourism
development in order to be able to develop a strategy. The author presents a widely used
tool for this , the destination lifecycle developed originally by Butler in 1980 . The
destination lifecycle facilitates the understanding of the evolution of tourist products and
destinations consisiting of five stages : introduction, growth, maturity, saturation and
decline. Buhalis (2000) states the main problems in the cycle relates to the identification
of turning points, stages, length of stages and levels of aggregation. The author further
claims the stages in the lifecycle require different marketing strategies and actions of
planning due to the differences between demand and supply experienced in the different
stages . On the early stages of the cycle, marketing strategies should focus on building
awareness and promoting the destinations. At the later stages, marketers need to deal with
image modification and re-designing and re-launching.
Therefore , the entire marketing mix should be differentiated to accommodate the needs
of the destination at every stage(ibid). This is illustrated in the fig.
Figure : Destination Life Cycle and Tourism Impacts. Adapted from “Marketing the competitive destination of the future” by Buhalis D., 2000, Tourism Management (21) l,.p.105.
120
10.4 Brand Personality
Hankinson (2004a) states the first element of the core brand is the statement of the brand
personality. AAaker(1997) defines brand personality as “ the set of human characteristics
associated with a brand “. Ekinci and Hosany (2006) claim brand personality evokes
emotional links between brands and consumers. In addition, a brand gains a tangible
reference point which is vivid, alive and more complete than the sense conveyed by a
common offering. Practically, brands can be characterized by personality descriptions
such as youthful, energetic, extrovert or sophisticated. The authors define a destination
personality as “the set of human characteristics associated with a destination”. Therefore,
destinations can be described using human personality traits such as : “ Europe is
traditional and sophisticated; Wales is honest, welcoming, romantic, and down to
earth; Spain is friendly and family oriented ; London is open-minded, unorthodox,
vibrant and creative; and Paris is romantic”. These traits can be associated with a
destination directly through citizens of the country, hotel employees and restaurants, or
through the tourist’s imagery (ibid). In addition, there are other indirect ways to associate
personality with a brand such as through product related attributes, product category
association, brand name, symbol or logo, the style of the advertising, price and
distribution channel (Murphy et al, 2007).
Ekinci et al (2006) claim due to increasing competition in the global tourism markets,
destination personality is claimed to be as a feasible metaphor for building destination
brands and crafting a unique identity for tourism places. By developing a distinctive
destination personality, a set of unique and favourable associations can be created in
consumer’s memory (ibid). Murphy et al (2007) argue that brand personality may create a
basis for differentiation as a strong brand personality and should lead to relatively higher
product evaluations compared to claims that only inform consumers about the product
features and benefits. Brand personality provides a link between the brand’s emotional
and self-expressive benefits. This forms the basis for customer-brand relationship(ibid).
121
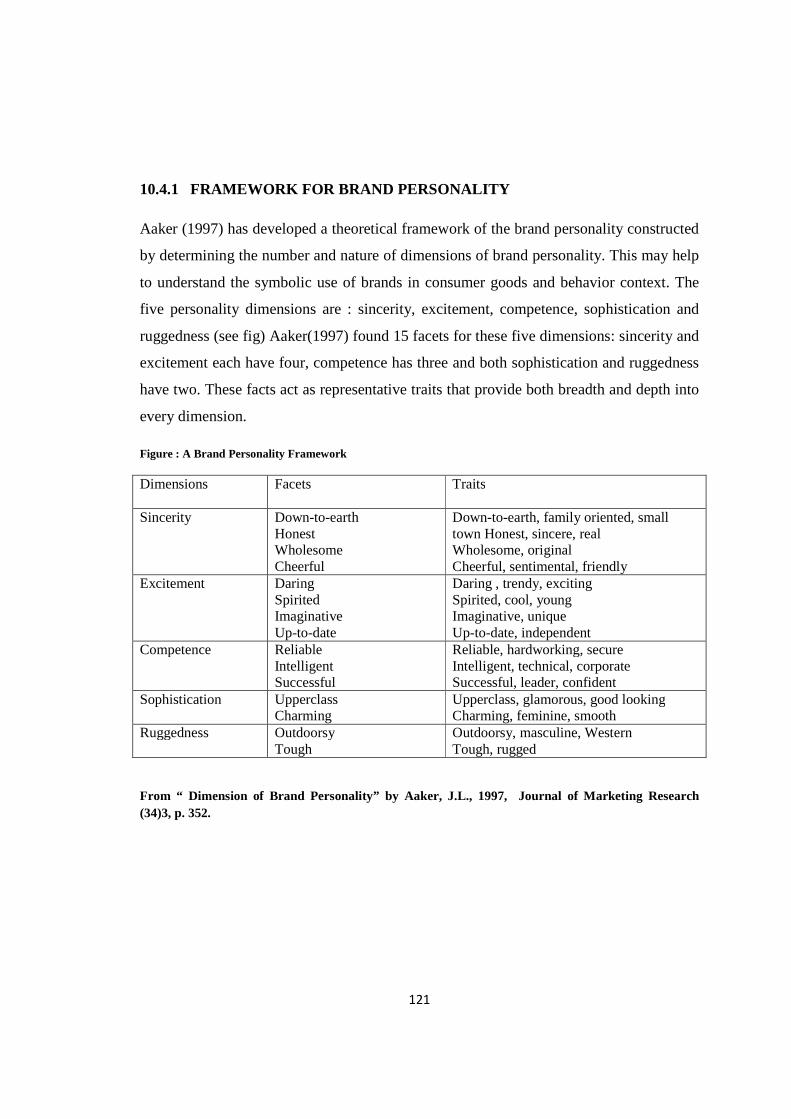
10.4.1 FRAMEWORK FOR BRAND PERSONALITY
Aaker (1997) has developed a theoretical framework of the brand personality constructed
by determining the number and nature of dimensions of brand personality. This may help
to understand the symbolic use of brands in consumer goods and behavior context. The
five personality dimensions are : sincerity, excitement, competence, sophistication and
ruggedness (see fig) Aaker(1997) found 15 facets for these five dimensions: sincerity and
excitement each have four, competence has three and both sophistication and ruggedness
have two. These facts act as representative traits that provide both breadth and depth into
every dimension.
Figure : A Brand Personality Framework
Dimensions Facets Traits
Sincerity Down-to-earth Honest Wholesome Cheerful
Down-to-earth, family oriented, small town Honest, sincere, real Wholesome, original Cheerful, sentimental, friendly
Excitement Daring Spirited Imaginative Up-to-date
Daring , trendy, exciting Spirited, cool, young Imaginative, unique Up-to-date, independent
Competence Reliable Intelligent Successful
Reliable, hardworking, secure Intelligent, technical, corporate Successful, leader, confident
Sophistication
Upperclass Charming
Upperclass, glamorous, good looking Charming, feminine, smooth
Ruggedness Outdoorsy Tough
Outdoorsy, masculine, Western Tough, rugged
From “ Dimension of Brand Personality” by Aaker, J.L., 1997, Journal of Marketing Research (34)3, p. 352.
122
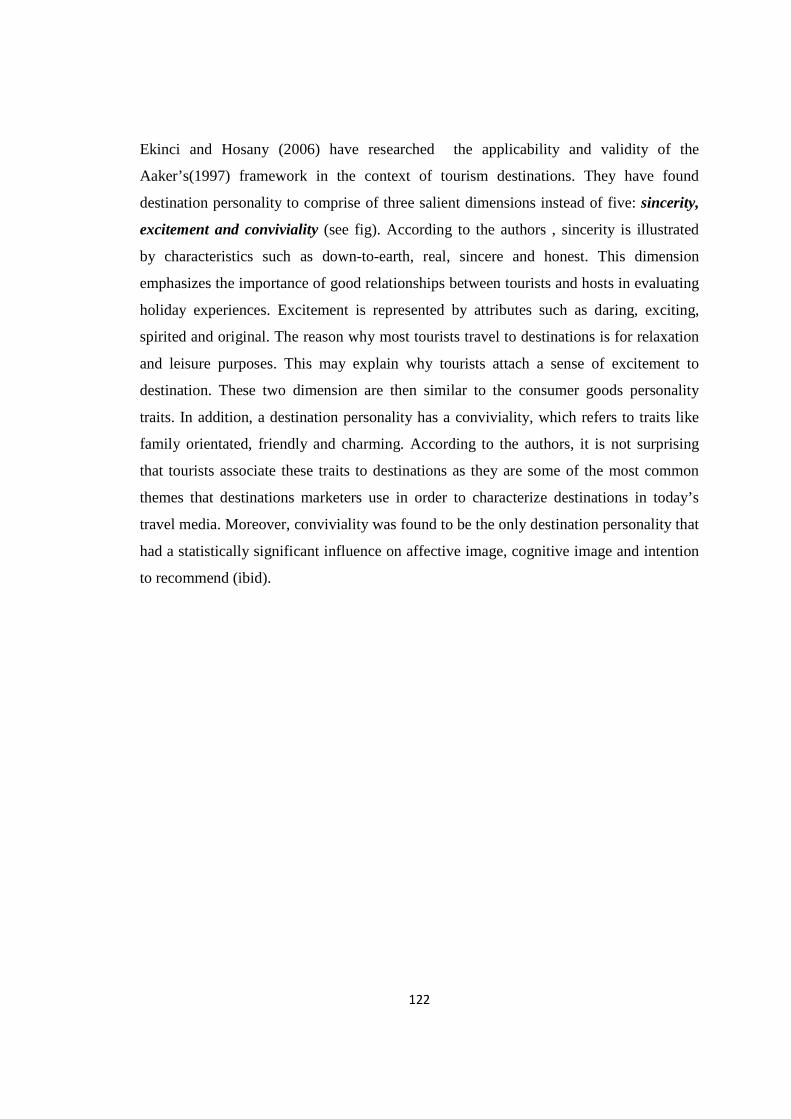
Ekinci and Hosany (2006) have researched the applicability and validity of the
Aaker’s(1997) framework in the context of tourism destinations. They have found
destination personality to comprise of three salient dimensions instead of five: sincerity,
excitement and conviviality (see fig). According to the authors , sincerity is illustrated
by characteristics such as down-to-earth, real, sincere and honest. This dimension
emphasizes the importance of good relationships between tourists and hosts in evaluating
holiday experiences. Excitement is represented by attributes such as daring, exciting,
spirited and original. The reason why most tourists travel to destinations is for relaxation
and leisure purposes. This may explain why tourists attach a sense of excitement to
destination. These two dimension are then similar to the consumer goods personality
traits. In addition, a destination personality has a conviviality, which refers to traits like
family orientated, friendly and charming. According to the authors, it is not surprising
that tourists associate these traits to destinations as they are some of the most common
themes that destinations marketers use in order to characterize destinations in today’s
travel media. Moreover, conviviality was found to be the only destination personality that
had a statistically significant influence on affective image, cognitive image and intention
to recommend (ibid).
123
10.4.2 BRAND ATTRIBUTES
Hankinson (2005) states classical branding theory has been widely used in the context of
consumer products where brands are seen as complex entities. This has led to the
development of models that decompose brands into various smaller components in order
to help marketing managers to manage them. The author continues explaining that these
components include:
� Names, symbols and logos which aid identification and awareness.
� Brand images/ brand identities which communicate a brand’s meaning through a set
of associations.
� Brand associations/ elements held in consumer memory that form the basis of brand
image/ identity (ibid).
Hankinson (2005) claims brand associations have a central role in brand strategy
development. Associations should be organized into groups that have meaning, which
should define the brand’s positioning. In turn, a well positioned brand will represent a set
of attractive and strong associations. Brand associations are classified into four attribute
categories:
1. Functional attributes (the tangible features of a product or service)
2. Emotional and symbolic attributes(the intangible features which meet consumer
needs for social approval, personal expression or self esteem)
3. Experiential attributes (relate to what it feels like to use the product or service
and satisfy internally generated needs for stimulation and variety)
4. Brand attributes(define a consumer’s overall evaluation of a brand, which is
closely linked to the perceived quality of the brand) (ibid).
124
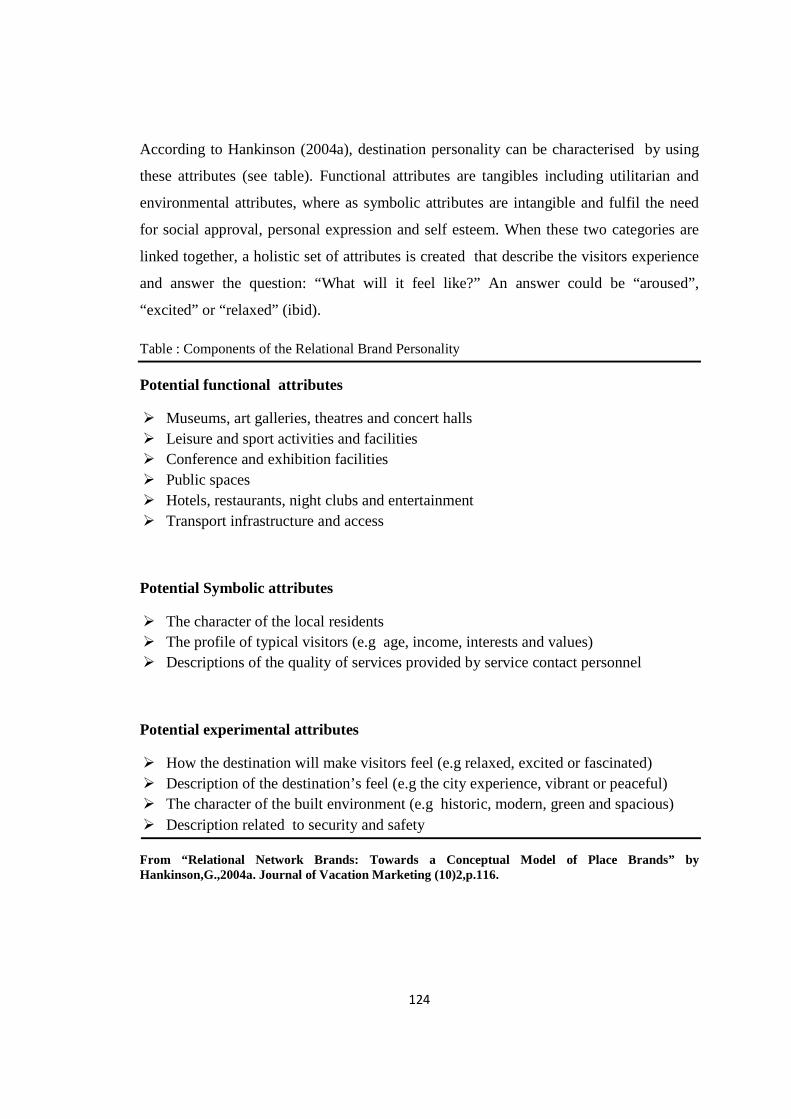
According to Hankinson (2004a), destination personality can be characterised by using
these attributes (see table). Functional attributes are tangibles including utilitarian and
environmental attributes, where as symbolic attributes are intangible and fulfil the need
for social approval, personal expression and self esteem. When these two categories are
linked together, a holistic set of attributes is created that describe the visitors experience
and answer the question: “What will it feel like?” An answer could be “aroused”,
“excited” or “relaxed” (ibid).
Table : Components of the Relational Brand Personality
Potential functional attributes
� Museums, art galleries, theatres and concert halls � Leisure and sport activities and facilities � Conference and exhibition facilities � Public spaces � Hotels, restaurants, night clubs and entertainment � Transport infrastructure and access
Potential Symbolic attributes
� The character of the local residents � The profile of typical visitors (e.g age, income, interests and values) � Descriptions of the quality of services provided by service contact personnel
Potential experimental attributes
� How the destination will make visitors feel (e.g relaxed, excited or fascinated) � Description of the destination’s feel (e.g the city experience, vibrant or peaceful) � The character of the built environment (e.g historic, modern, green and spacious) � Description related to security and safety
From “Relational Network Brands: Towards a Conceptual Model of Place Brands” by Hankinson,G.,2004a. Journal of Vacation Marketing (10)2,p.116.
125
10.4.3 POSITIONING
Hankinson (2004a) states the second element of the core brand is a clear positioning
statement, which defines the brand’s point of reference with respect to its competitors.
Jobber (2004,p.913) defines positioning as the “choice of target market(where the
company wishes to compete)and differential advantage (how the company wishes to
compete)”. Gill and Ibrahim (2005) state the positioning of a destination “is the process
of establishing a distinctive place of that destination in the minds of potential visitors”.
According to Hankinsons(2004a), both similar and unique attributes in a resort.
According to Hankinsons(2004a), both similar and unique attributes in a relation to the
competitors needs to be identified. An example of a similar attribute may be related to a
specific event that occurred ther (ibid).
Jobber (2004,p.269)adds a clear differential advantage can be achieved through a brand
name, image, service, design, gurantees, packaging and delivery. In addition, these
factors are usually used in a combination. The author presents an analytical framework
that can be used in order to analyse the current position of a brand in the market place.
The strength of a brand’s position is built on six elements : brand domain, brand heritage,
brand values, brand assets, brand personality and brand reflection (see fig). brand domain
refers to the choice of target market. Other five factors provide ways for creating a clear
and differentiated advantage (Jobber,2004,pp.269-271).
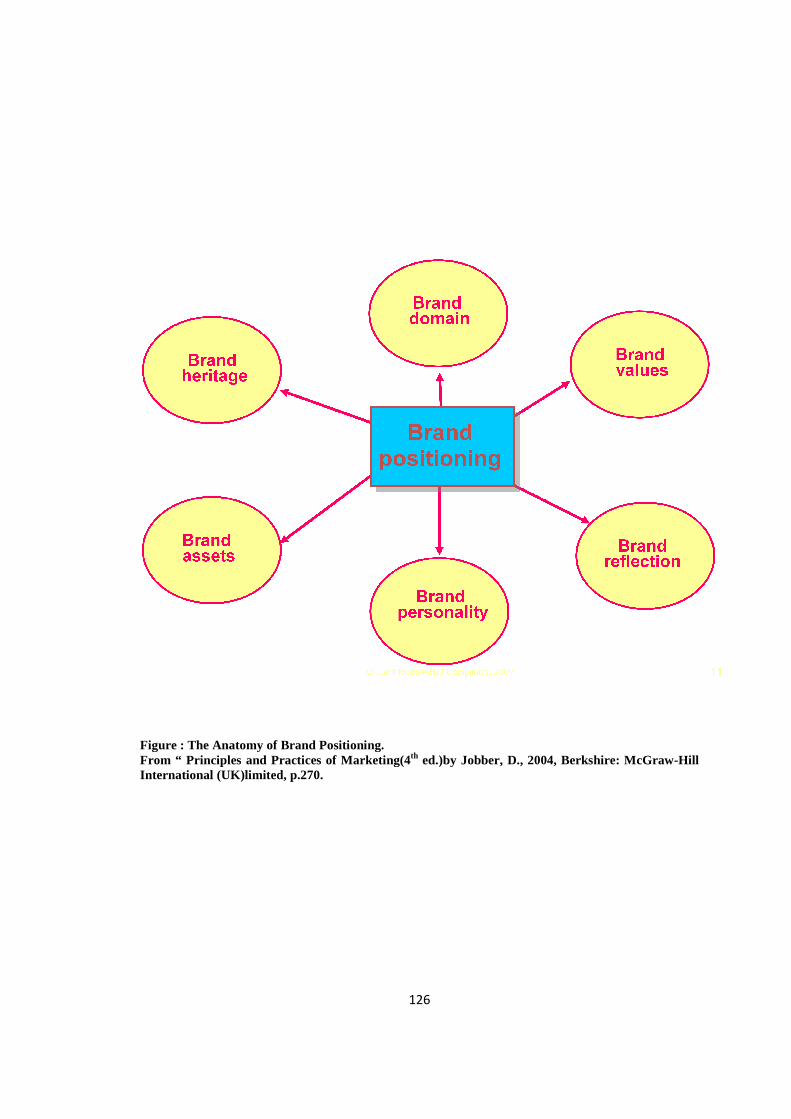
Figure : The Anatomy of Brand Positioning. From “ Principles and Practices of Marketing(4International (UK)limited, p.270.
126
Figure : The Anatomy of Brand Positioning. “ Principles and Practices of Marketing(4th ed.)by Jobber, D., 2004, Berkshire: McGraw
International (UK)limited, p.270.
ed.)by Jobber, D., 2004, Berkshire: McGraw-Hill
127
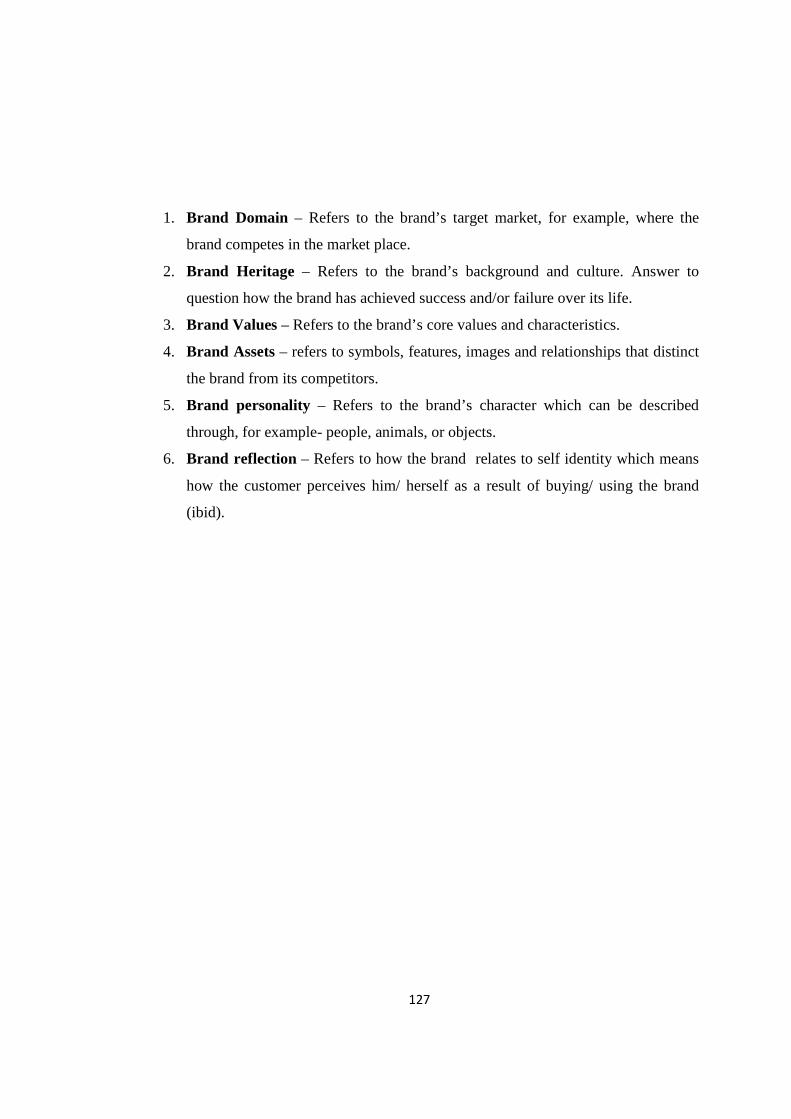
1. Brand Domain – Refers to the brand’s target market, for example, where the
brand competes in the market place.
2. Brand Heritage – Refers to the brand’s background and culture. Answer to
question how the brand has achieved success and/or failure over its life.
3. Brand Values – Refers to the brand’s core values and characteristics.
4. Brand Assets – refers to symbols, features, images and relationships that distinct
the brand from its competitors.
5. Brand personality – Refers to the brand’s character which can be described
through, for example- people, animals, or objects.
6. Brand reflection – Refers to how the brand relates to self identity which means
how the customer perceives him/ herself as a result of buying/ using the brand
(ibid).
128
10.4.4 BRAND ASSETS
Blain et al (2005) have researched brand assets, especially logos, in the context of
DMO’s marketing activities, and concluded that logos are widely used in DMOs in order
to support marketing efforts . This study emphasis brand assets as they relate to
positioning which according to Hankinson(2004a), is a part of the core brand.
Berthon, Hulbert and Pitt (1999) state in Blain et al (2005) that brands can ultimately be
considered as “symbol(s) around which relationships are built”.According to Blain et al
(2005), this means that logo designs often become one of the key components of
branding. The brand symbol may include a distinguishing name, logo, trademark or
package design. The authors further define logos as”graphic designs(with or without
words or ‘taglines’) and are used by companies to identify the firm and/or products
that they create”. Logos are often claimed to become a central brand image representing
products, services or destinations. In addition, as the world becomes standardized due to
globalization “…logos play a critical role in creating a readily identifiable, distinctive
image for differentiating the product, service, or firm that employs effective visual
stimuli. These visual cues can enhance firm reputation and serve as a competitive
advantage” (abid).
In the context of tourism, destination logos can be used in DMO marketing activities to
establish brand image and identify (Blainet al, 2005). These factors are considered to be
especially relevant before the actual visitor experience. As there are thousands of
destinations to visit, logos can effectively stimulate awareness and communicate desired
attributes to visitors, and thereby reduces search costs, and ultimately leads to a choice of
destination (ibid). According to Murphy et al (2007), building a destination image means
identification of the most relevant associations for the destination.
129
The linkages of these associations to the destination brand should be then strengthened.
This can be achieved by using a slogan or logo: an element that becomes the trademark
and acts as an anchor communicating strong and coherent associations with the
destinations brand(ibid).
Pike (2005) states that for a majority of destinations a slogan is necessary public
communication of a destination’s brand positioning strategy. As places are becoming
increasingly difficult to differentiate, a slogan may provide the link between the brand
identity and aspired to by DMOs and the actual brand image held in the market. The
challenge for DMOs lies in development of a slogan that encapsulates a destination’s
multidimensional and often diverse range of natural resources , built attractions, culture,
activities, amenities and accommodation. However, in order to be effective the
positioning strategy suggests that reaching the minds of busy consumers requires a
concise message focusing on one or few brand associations. This is a difficult task for
DMOs, and often a slogan attempts to cover everything the destination has to offer such
as “Kenya – creation’s most beautiful destination, all in one country” and “Ohio – so
much to discover”. In some cases the difficulty tends to be manifested in slogans such as
“Greece beyond words”, and rarely does a destination achieve a focused slogan such as “
Arizona – Grand Canyon state” or “Snowy mountains- Australia’s high country” (ibid)
130
10.4.5 BRAND IMAGE
Sarma (2007) has acknowledged that the concept of image management is an important
area of overall destination management. Image management consists of building and
maintenance of external image of a destination. The image of destination may be tourist-
segment specific which, in turn, facilitates the destination’s positioning and therefore
reduces risk elements for the prospective travelers, especially for those who are visiting
the destination for the first time.
Image management provides help when it comes to lengthening the maturity phase and
initiation of rejuvenation, where both are crucial stages of the destination life cycle.
Studies on destination image have suggested successful achievement of the goal of
matching the needs of the target groups with the physical features actually presented by
the destination (ibid).
Blain et al (2005)consider destination image as a significant factor in determining visitor
choice. According to Echtner and Ritchie (1991) in Blain et al (2005), destination image
is defined as “not only the perceptions of individual destination attributes but also the
holistic impression made by the destination”. Furthermore, as the competition for tourists
and their spending increases, it follows that the destination branding should include both
– concepts of destination image as well as competitveness (ibid). Many researchers
support the view that destination image is a multidimensional construct that includes two
primary dimensions : cognitive and affective. The cognitive dimensions can be described
as “beliefs and knowledge about the physical attributes of a destination”, while the
affective dimensions “refers to the appraisal of the affective quality of feelings towards
the attributes and the surrounding environment” (ibid).
131
Hankinson (2004b) argues that images fall on a continuum of organic, induced and
complex images. Organic images are developed over a long period of time. They
represent “the totality of what a person already knows or perceives about that
destination…from newspapers, radio and TV news, documentaries, periodicals, dramas,
novels and non-fictional books and classes in geography and history”’ according to the
author, Leisen (2001) adds that organic images are beyond the control of the destination
area. Organic images are then replaced by induced images that are directed by the
destination’s marketing efforts such as colorfull brouchers distributed by Visitors
Information Centres, information available in travel agencies, travel articles in
magazines, TV advertisements etc. In the final stage of the continuum a complex image is
developed which results from the interaction of the actual experience of visiting the
destination with beforehand held images (ibid).
Hankinson (2004a) states the third element of the core brand is brand reality. Both the
personality and the positioning need to be firmly rooted in reality in order to fulfill the
promised experience. The development of a core brand is not about creating an image
that presents a highly selective identity in order to sell the place. In turn, the successful
destination branding is a combination of imaginative marketing supported by investment
in the key services and facilities that are required in order to be able to deliver the offered
experience (ibid).
132
10.4.6 ADVERTISING MESSAGE
According to Hankinson(2004a), in order for the core brand to become successful, a
consistent identity needs to be portrayed through marketing communication channels
such as advertising, publicity and public relations. In addition, organic channels such as
arts and education can be used. Communication process developed through the arts,
education and media, has the strongest and most pervasive influence on the image of a
destination (ibid).
SOURCES OF INFORMATION
Number of external information sources is used by tourists while they form the image of
the destination(Sarma, 2007). These sources act as tools which facilitates image
formation and include communication medias such as brochures, guide books, local
tourist offices , travel guides, travel agents, magazines, newspapers, friends and relatives
and also personal experiences .
In addition, seven information groupings have been identified (ibid).
1. Pre-purchase mix (heavy use of wide variety of contributory sources)
2. Tourist Bureau
3. Personal experience
4. Ongoing (magazines and newspapers)
5. On site (referrals and information sources)
6. Automobile clubs
7. Travel agency
Sarma (2007) provides an example of information sources used within alternative
tourism, in particular with adventure travelers. The sources include specialized guide
books, webpage and videotapes/CDs, Overall; information sources fulfill “aesthetic”
needs, which include the need for an image of a destination too (ibid).
133
MESSAGE
According to Hartl (2004,p. 15), most of the tourism marketing books define destination
as a product that should be marked as any other product. The author continues to argue
that this is not the matter as a destination is more complicated to manage than other
operations due to its intangibility and inseparability, typical characteristics for a tourism
product, but in addition, with several different actors that are independent operators at
their own right. Tourism destinations are unique entities from a marketing point of view
as planning a marketing strategy for a destination is more complex process than planning
for a single product or company. Hartl (2004) continues to state : “A message from any
one destination will only be heard among the ‘noise’ created by the promotional efforts
of all the other destinations if it is :
� Consistent (i.e different organizations from the same destination do not present
conflicting messages) and innovative:
� Repeated frequently: and
� Seen by many people (reach)
BRANDING AND MARKETING COMMUNICATIONS
David Ogilvy, in his book Ogilvy on Advertising, says : “Every advertisement should be
thought of as a contribution to the brand image. It follows that your advertising should
project the same image, year after year”.
In the context of current thinking, the analogy should be taken to include more than just
advertising. It is vitally important that all communication messages on behalf of the brand
and destination communicates a single, consistent image.
134
This requires the marketer to examine all aspects of the communications message to
ensure that the elements are consistent with each other and that the visitor does not
receive contradictory impressions of the brand. There are a number of important factors
to consider :
Is the advertising proposition consistently applied ?
Some of the most effective marketing campaigns, in terms of destination brand
development, are those that have developed an enduring message. The specific treatment
and the executional content may change, be refreshed and updated, but the underlying
proposition about the brand remains the same - with the benefit that each advertising
message serves to reinforce those which have preceded it. Egypt has developed well
campaigns that show the link between their history and the now ‘modern’ facilities that
they offer to visiting tourists.
Are sponsorships and other investments relevant and consistent ?
As destinations become increasingly involved with other stakeholders to promote their
offer, the question must be asked as to whether the visibility gained reflects favourably
on the destination. By ensuring that good synergy exists between the brand and the
sponsored activity, it is likely that favourable impressions will be created for both
parties. Examples of this are destinations and airlines working together. The position of
Qantas as the ‘Gateway’ to Australia has helped both parties – tourists want to visit the
country, and what better way to start the holiday than flying with the airline that ‘knows’
the country.
Do spokespersons for the brand reflect similar values ?
In many instances brands use a ‘personality’ either to endorse the product, or to act as its
spokesperson. This may have a positive impact on consumer perceptions of the brand if
the image associated with the personality is a positive one. Destinations are starting to
use famous people or celebrities as endorsements of the offer – “if it is good enough for
me then it is good enough for you”, for example.
135
10.5 Survey conducted and its results
This evaluation study is to arrive at aspects that need to be addressed to make subsequent
campaigns targeted at the domestic tourist more effective and efficient.
Objective of the Survey :
1. Examine the various measures and media vehicles used in campaigns vis-à-vis the
available spectrum.
2. Assess the relative importance and efficacy of the different media used in the
campaigns.
Questionnaire
1. The questionnaire was prepared to get information specifically about the
experience and expectations of the tourist.
2. The set of questions designed for the tourist focused on ::
a. Awareness of Tourism promotion methods
b. Awareness of tourist places
c. Awareness of tourism product
d. Experience and expectation of the tourist
Sampling
The segment was identified from the various potential tourist destinations of the selected
cities or near by tourist destination was selected for the purpose of data collection.
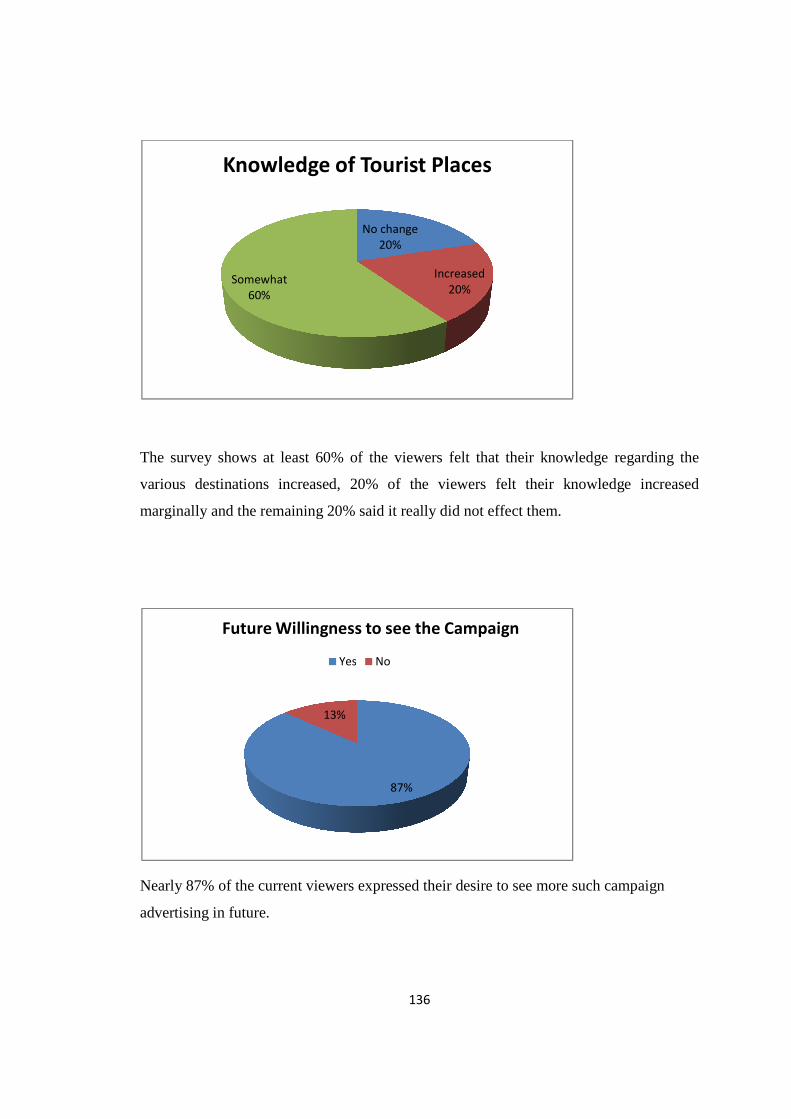
The survey shows at least 60% of the viewers felt that their knowledge regarding the
various destinations increased, 20% of the viewers felt their
marginally and the remaining 20% said it really did not effect them.
Nearly 87% of the current viewers expressed their desire to see more such campaign
advertising in future.
Somewhat
60%
Knowledge of Tourist Places
Future Willingness to see the Campaign
136
The survey shows at least 60% of the viewers felt that their knowledge regarding the
increased, 20% of the viewers felt their
marginally and the remaining 20% said it really did not effect them.
Nearly 87% of the current viewers expressed their desire to see more such campaign
No change
20%
Increased
20%Somewhat
Knowledge of Tourist Places
87%
13%
Future Willingness to see the Campaign
Yes No
The survey shows at least 60% of the viewers felt that their knowledge regarding the
knowledge increased
marginally and the remaining 20% said it really did not effect them.
Nearly 87% of the current viewers expressed their desire to see more such campaign
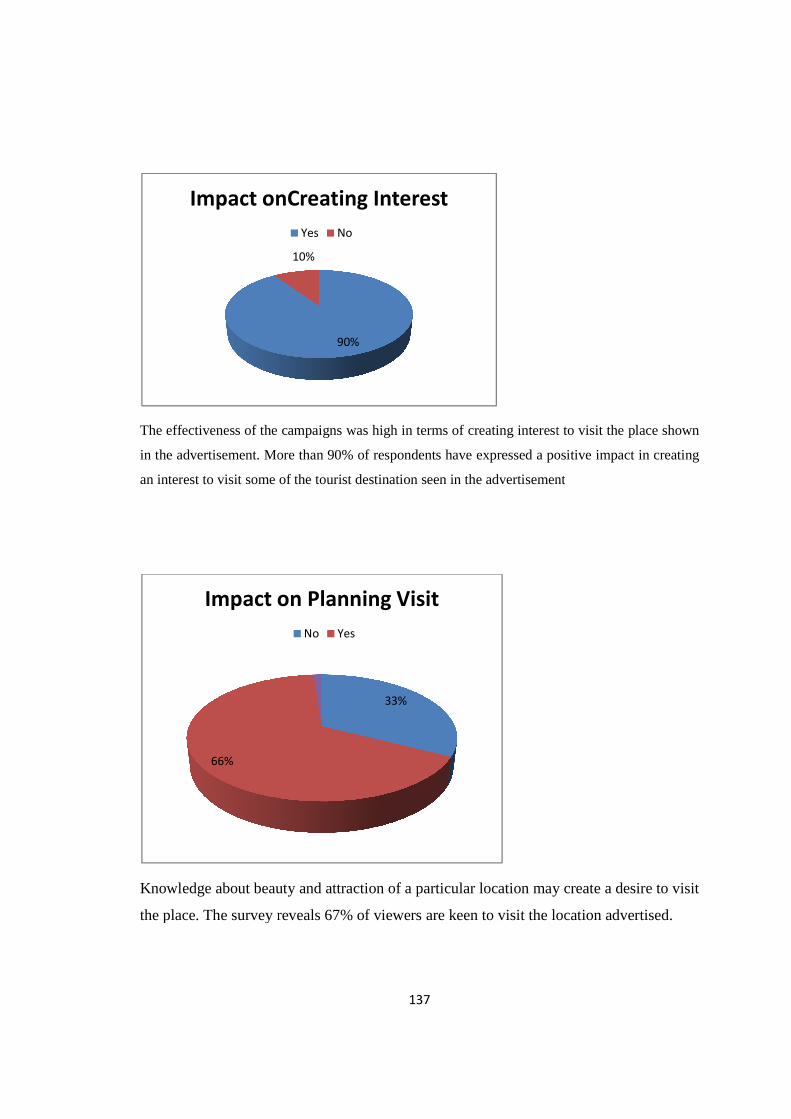
The effectiveness of the campaigns was high in terms of creating interest to visit the place shown
in the advertisement. More than 90% of respondents have expressed a positive impact in creating
an interest to visit some of the tourist destination seen in the advertis
Knowledge about beauty and attraction of a particular location may create a desire to visit
the place. The survey reveals 67% of viewers are keen to visit the location advertised.
Impact onCreating Interest
66%
Impact on Planning Visit
137
eness of the campaigns was high in terms of creating interest to visit the place shown
in the advertisement. More than 90% of respondents have expressed a positive impact in creating
an interest to visit some of the tourist destination seen in the advertisement
Knowledge about beauty and attraction of a particular location may create a desire to visit
the place. The survey reveals 67% of viewers are keen to visit the location advertised.
90%
10%
Impact onCreating Interest
Yes No
33%
Impact on Planning Visit
No Yes
eness of the campaigns was high in terms of creating interest to visit the place shown
in the advertisement. More than 90% of respondents have expressed a positive impact in creating
ement
Knowledge about beauty and attraction of a particular location may create a desire to visit
the place. The survey reveals 67% of viewers are keen to visit the location advertised.
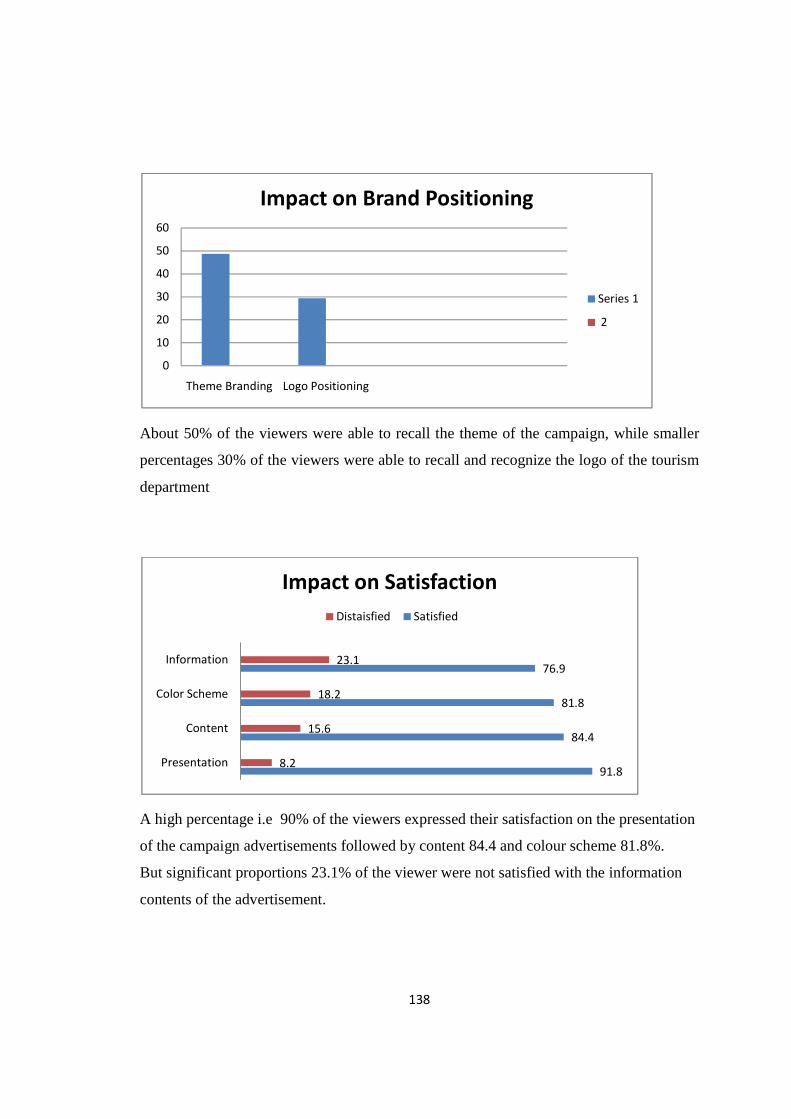
138
About 50% of the viewers were able to recall the theme of the campaign, while smaller
percentages 30% of the viewers were able to recall and recognize the logo of the tourism
department
A high percentage i.e 90% of the viewers expressed their satisfaction on the presentation
of the campaign advertisements followed by content 84.4 and colour scheme 81.8%.
But significant proportions 23.1% of the viewer were not satisfied with the information
contents of the advertisement.
0
10
20
30
40
50
60
Theme Branding Logo Positioning
Impact on Brand Positioning
Series 1
2
91.8
84.4
81.8
76.9
8.2
15.6
18.2
23.1
Presentation
Content
Color Scheme
Information
Impact on Satisfaction
Distaisfied Satisfied
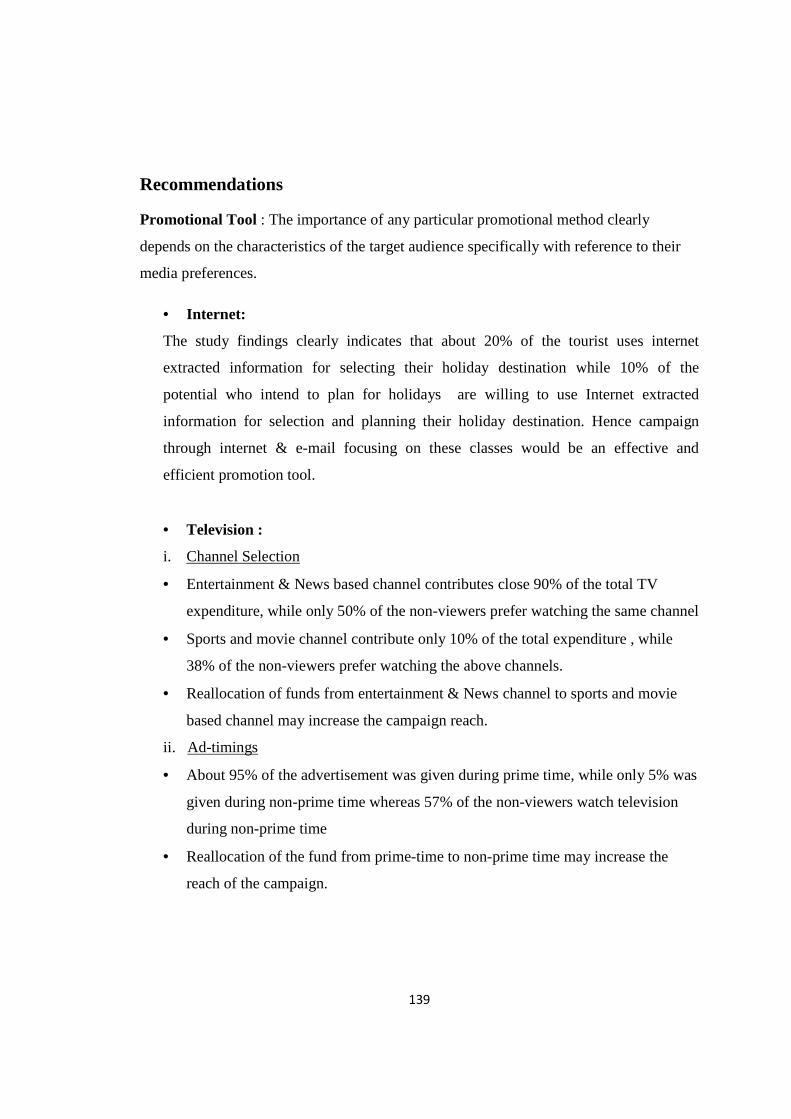
139
Recommendations
Promotional Tool : The importance of any particular promotional method clearly
depends on the characteristics of the target audience specifically with reference to their
media preferences.
• Internet:
The study findings clearly indicates that about 20% of the tourist uses internet
extracted information for selecting their holiday destination while 10% of the
potential who intend to plan for holidays are willing to use Internet extracted
information for selection and planning their holiday destination. Hence campaign
through internet & e-mail focusing on these classes would be an effective and
efficient promotion tool.
• Television :
i. Channel Selection
• Entertainment & News based channel contributes close 90% of the total TV
expenditure, while only 50% of the non-viewers prefer watching the same channel
• Sports and movie channel contribute only 10% of the total expenditure , while
38% of the non-viewers prefer watching the above channels.
• Reallocation of funds from entertainment & News channel to sports and movie
based channel may increase the campaign reach.
ii. Ad-timings
• About 95% of the advertisement was given during prime time, while only 5% was
given during non-prime time whereas 57% of the non-viewers watch television
during non-prime time
• Reallocation of the fund from prime-time to non-prime time may increase the
reach of the campaign.
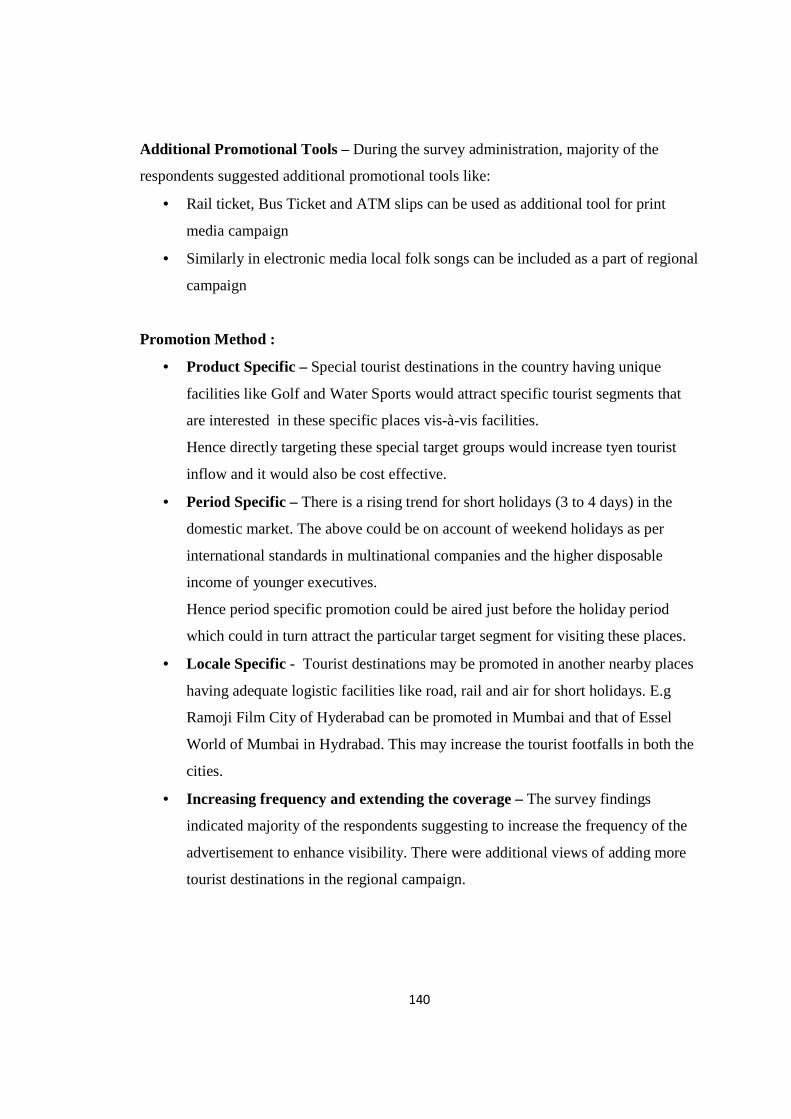
140
Additional Promotional Tools – During the survey administration, majority of the
respondents suggested additional promotional tools like:
• Rail ticket, Bus Ticket and ATM slips can be used as additional tool for print
media campaign
• Similarly in electronic media local folk songs can be included as a part of regional
campaign
Promotion Method :
• Product Specific – Special tourist destinations in the country having unique
facilities like Golf and Water Sports would attract specific tourist segments that
are interested in these specific places vis-à-vis facilities.
Hence directly targeting these special target groups would increase tyen tourist
inflow and it would also be cost effective.
• Period Specific – There is a rising trend for short holidays (3 to 4 days) in the
domestic market. The above could be on account of weekend holidays as per
international standards in multinational companies and the higher disposable
income of younger executives.
Hence period specific promotion could be aired just before the holiday period
which could in turn attract the particular target segment for visiting these places.
• Locale Specific - Tourist destinations may be promoted in another nearby places
having adequate logistic facilities like road, rail and air for short holidays. E.g
Ramoji Film City of Hyderabad can be promoted in Mumbai and that of Essel
World of Mumbai in Hydrabad. This may increase the tourist footfalls in both the
cities.
• Increasing frequency and extending the coverage – The survey findings
indicated majority of the respondents suggesting to increase the frequency of the
advertisement to enhance visibility. There were additional views of adding more
tourist destinations in the regional campaign.
141
Organization of Promotion:
• Departmental Co-ordination – There is an overlap of the tourism promotion
activities of the State Tourism department with the National level promotion
activities by Ministry of Tourism.
A better understanding between both the departments will help in avoiding the
overlap. Information on ‘timings of the campaign’, selection of the media vehicle
would help checking the overlap.
1. Timing of promotional campaign :
a. During national Holidays, the campaign can be aired by the Ministry of
Tourism
b. During regional holidays, the campaign can be aired by State Tourism
department.
2. Selection of Tourist destination :
a. Tourist destinations of national importance to be promoted by the Ministry
of Tourism as part of the national promotional campaign.
b. Tourist destinations of state importance to be promoted by State Tourism
department as a part of regional promotional campaign.
3. Selection of Media Vehicle :
a. National level media vehicles ( National News paper, national TV
channels) to be used for national level campaigns.
b. Regional level Media Vehicles (Regional News paper, Regional TV
channels, and national Media vehicles) to be used for Regional level
campaign.
• Stake Holders Participation : The opininons of the key players of the tourism
industry like service providers (tour guides, tour operators) may add value in
respect of regional campaigns both in terms of the content and its effectiveness.
• Public Private Partnership : The trade partners in the tourism industry like Travel
Agencies, Hoteliers and other service enterprises benefit directly from the
promotion. The campaigns not only benefits the tourism authority but also
benefits the local stake holders like small hotels, travel agencies, restaurants.

142
Hence the campaign costs may beshared by all the stake holders rather than only
by tourism authority especially in regional campaigns.
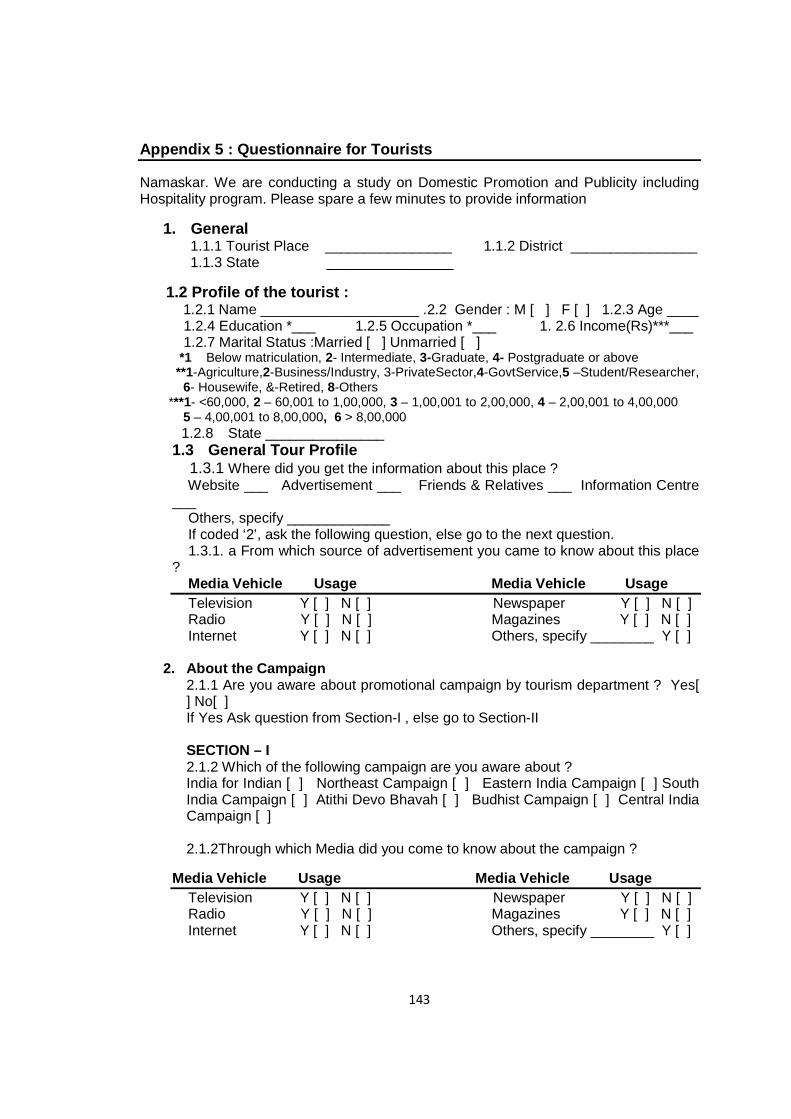
143
Appendix 5 : Questionnaire for Tourists
Namaskar. We are conducting a study on Domestic Promotion and Publicity including Hospitality program. Please spare a few minutes to provide information
1. General 1.1.1 Tourist Place ________________ 1.1.2 District ________________ 1.1.3 State ________________
1.2 Profile of the tourist : 1.2.1 Name ____________________ .2.2 Gender : M [ ] F [ ] 1.2.3 Age ____ 1.2.4 Education *___ 1.2.5 Occupation *___ 1. 2.6 Income(Rs)***___ 1.2.7 Marital Status :Married [ ] Unmarried [ ] *1 Below matriculation, 2- Intermediate, 3-Graduate, 4- Postgraduate or above **1-Agriculture,2-Business/Industry, 3-PrivateSector,4-GovtService,5 –Student/Researcher, 6- Housewife, &-Retired, 8-Others ***1- <60,000, 2 – 60,001 to 1,00,000, 3 – 1,00,001 to 2,00,000, 4 – 2,00,001 to 4,00,000 5 – 4,00,001 to 8,00,000, 6 > 8,00,000
1.2.8 State _______________ 1.3 General Tour Profile 1.3.1 Where did you get the information about this place ? Website ___ Advertisement ___ Friends & Relatives ___ Information Centre ___ Others, specify _____________ If coded ‘2’, ask the following question, else go to the next question. 1.3.1. a From which source of advertisement you came to know about this place ? Media Vehicle Usage Media Vehicle Usage Television Y [ ] N [ ] Newspaper Y [ ] N [ ] Radio Y [ ] N [ ] Magazines Y [ ] N [ ] Internet Y [ ] N [ ] Others, specify ________ Y [ ]
2. About the Campaign
2.1.1 Are you aware about promotional campaign by tourism department ? Yes[ ] No[ ] If Yes Ask question from Section-I , else go to Section-II SECTION – I 2.1.2 Which of the following campaign are you aware about ? India for Indian [ ] Northeast Campaign [ ] Eastern India Campaign [ ] South India Campaign [ ] Atithi Devo Bhavah [ ] Budhist Campaign [ ] Central India Campaign [ ] 2.1.2Through which Media did you come to know about the campaign ?
Media Vehicle Usage Media Vehicle Usage Television Y [ ] N [ ] Newspaper Y [ ] N [ ] Radio Y [ ] N [ ] Magazines Y [ ] N [ ] Internet Y [ ] N [ ] Others, specify ________ Y [ ]
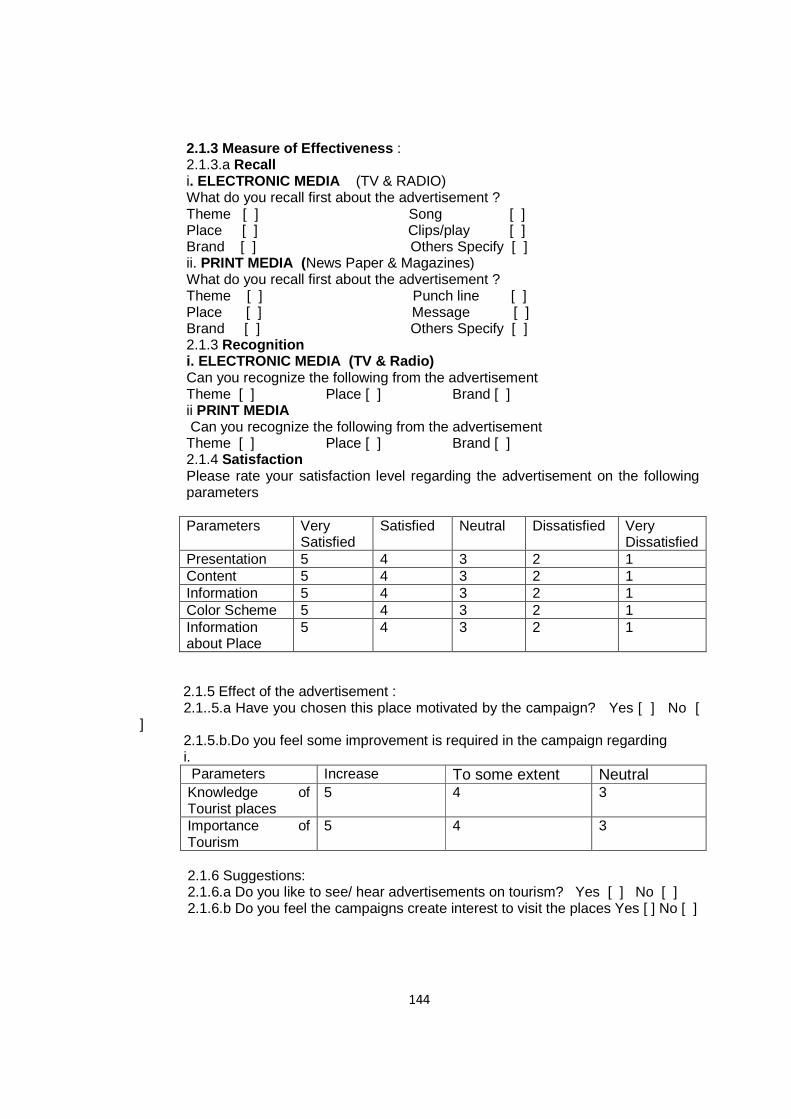
144
2.1.3 Measure of Effectiveness : 2.1.3.a Recall i. ELECTRONIC MEDIA (TV & RADIO) What do you recall first about the advertisement ? Theme [ ] Song [ ] Place [ ] Clips/play [ ] Brand [ ] Others Specify [ ] ii. PRINT MEDIA (News Paper & Magazines) What do you recall first about the advertisement ? Theme [ ] Punch line [ ] Place [ ] Message [ ] Brand [ ] Others Specify [ ] 2.1.3 Recognition i. ELECTRONIC MEDIA (TV & Radio) Can you recognize the following from the advertisement Theme [ ] Place [ ] Brand [ ] ii PRINT MEDIA Can you recognize the following from the advertisement Theme [ ] Place [ ] Brand [ ] 2.1.4 Satisfaction Please rate your satisfaction level regarding the advertisement on the following parameters Parameters Very
Satisfied Satisfied Neutral Dissatisfied Very
Dissatisfied Presentation 5 4 3 2 1 Content 5 4 3 2 1 Information 5 4 3 2 1 Color Scheme 5 4 3 2 1 Information about Place
5 4 3 2 1
2.1.5 Effect of the advertisement : 2.1..5.a Have you chosen this place motivated by the campaign? Yes [ ] No [ ] 2.1.5.b.Do you feel some improvement is required in the campaign regarding i.
Parameters Increase To some extent Neutral Knowledge of Tourist places
5 4 3
Importance of Tourism
5 4 3
2.1.6 Suggestions: 2.1.6.a Do you like to see/ hear advertisements on tourism? Yes [ ] No [ ] 2.1.6.b Do you feel the campaigns create interest to visit the places Yes [ ] No [ ]
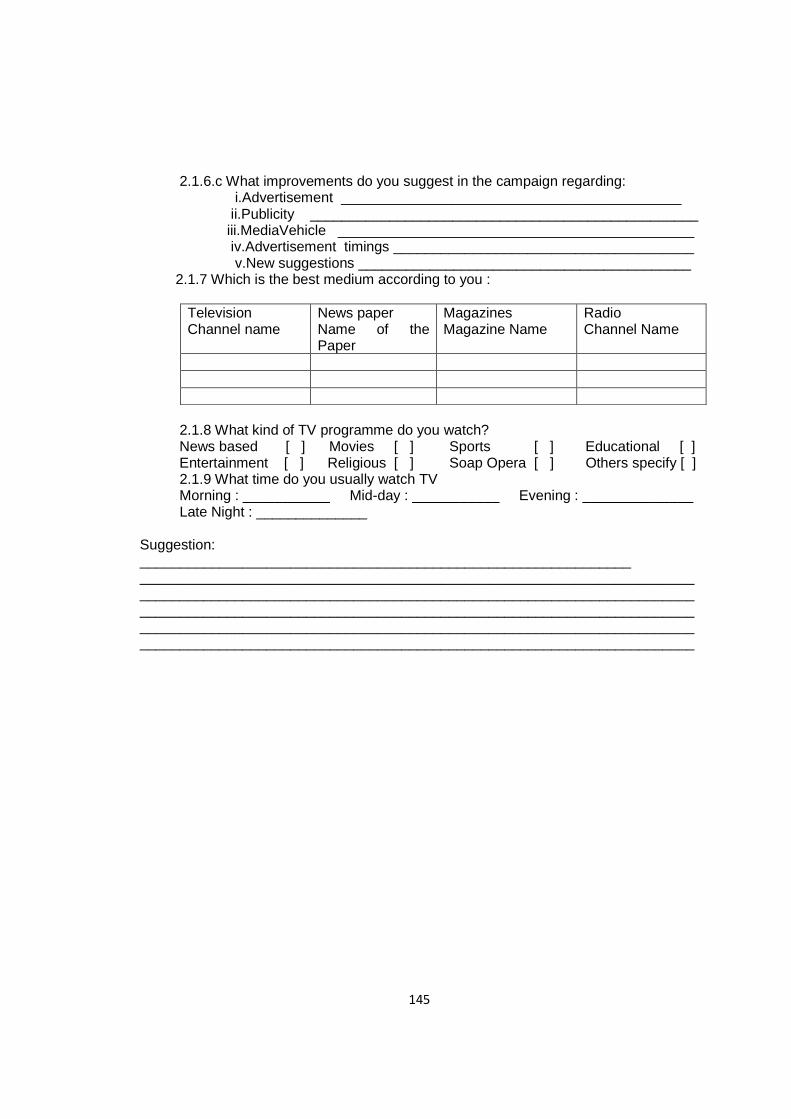
145
2.1.6.c What improvements do you suggest in the campaign regarding: i.Advertisement ___________________________________________ ii.Publicity _________________________________________________ iii.MediaVehicle _____________________________________________ iv.Advertisement timings ______________________________________ v.New suggestions __________________________________________ 2.1.7 Which is the best medium according to you :
Television Channel name
News paper Name of the Paper
Magazines Magazine Name
Radio Channel Name
2.1.8 What kind of TV programme do you watch? News based [ ] Movies [ ] Sports [ ] Educational [ ] Entertainment [ ] Religious [ ] Soap Opera [ ] Others specify [ ] 2.1.9 What time do you usually watch TV Morning : ___________ Mid-day : ___________ Evening : ______________ Late Night : ______________ Suggestion: ______________________________________________________________ ______________________________________________________________________ ______________________________________________________________________ ______________________________________________________________________ ____________________________________________________________________________________________________________________________________________
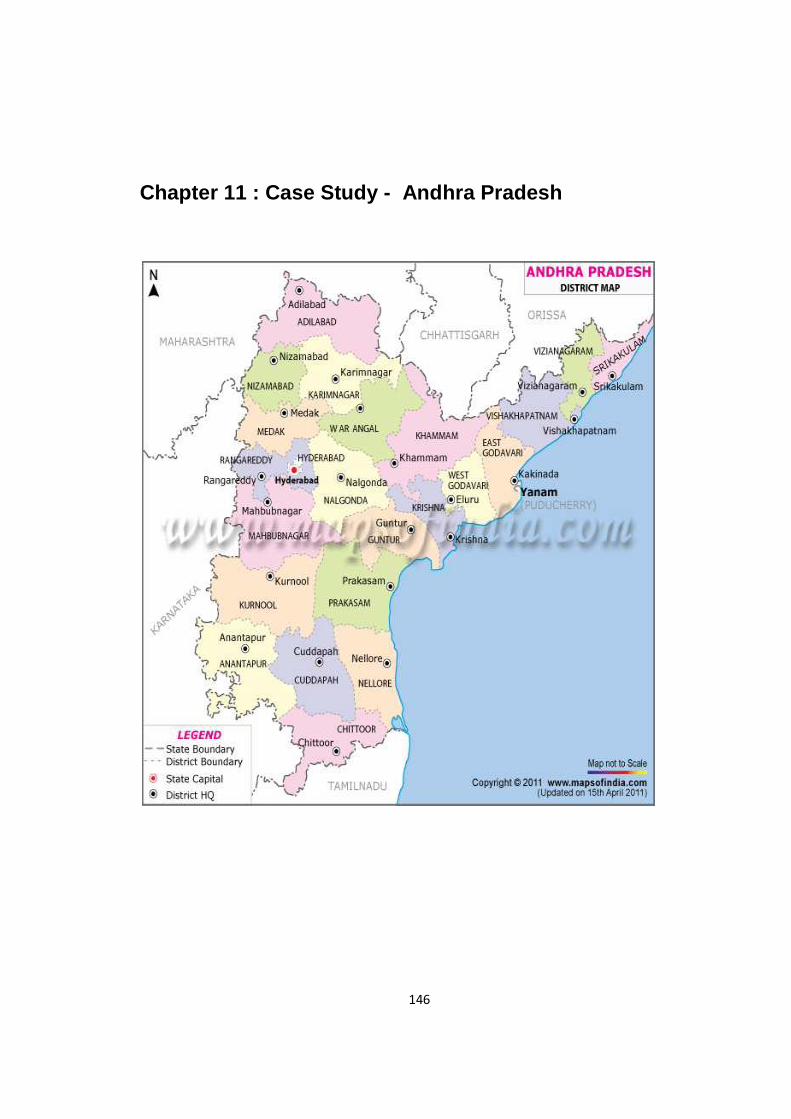
146
Chapter 11 : Case Study - Andhra Pradesh
147
ANDHRA PRADESH – an attractive investment destination
Andhra Pradesh is the fifth largest State in the country with an area of 2, 76,754 sq. km,
accounting for 8.4 % of India’s territory with 76.7 million population. Andhra Pradesh is
strategically located in the Indian sub-continent and the State has the longest coastline
(972 km) among all the States in India. Its capital Hyderabad occupies a central location
and is well connected with the rest of the world through its seaports on the eastern coast
and its international airport. Well-established air, road, and railway networks link it to the
rest of India.
Andhra Pradesh has bountiful natural resources. Endowed with fertile land, water, and
conducive agro-climatic conditions and it is an agriculturally-prosperous state. Nearly
75% of its area is covered by the river basins of the Godavari, Krishna and Pennar, and
their tributaries. There are 17 smaller rivers like the Sarada, Nagavali and Musi, as well
as several streams. Godavari and Krishna are the two major perennial rivers, and with
their extensive canal system, provide assured irrigation.
Andhra Pradesh is the only State with abundant energy. It has an installed capacity for
generating 10 273.44 MW, the second highest in the country and many projects are under
implementation to generate 4715 MW by 2009. Among all Indian States, Andhra Pradesh
has progressed furthest in reforming its energy sector (privatisation, separation of
generation from transmission and distribution).
Vast natural gas reserves found in Krishna–Godavari basin with 47 million standard
cubic metres per day have opened up immense possibilities for environment-friendly
industrial and socio-economic development in Andhra Pradesh. In terms of industrial
development, Andhra Pradesh has progressed rapidly. Its gross state domestic product (in
PPP) was $150 billion during 2002-03. It has thus emerged as one of the most attractive
investment destinations, ranking third in India
148
High Potential Sectors
Andhra Pradesh’s strength lies in its fully diversified industrial base, with the thrust on
high-tech sectors including information technology, pharmaceuticals, biotechnology and
Nano Technology. Traditional sectors such as textiles, leather, minerals, and food
processing are also being further developed for high value addition.
Competitive Investment Climate
The state has an exclusive financial institution APSFC for providing finance to small
industry. Apart from this 5288 commercial banks are functioning in the state in rural and
urban areas. The state has a good network of specialized SSI branches for extending
assistance to small and tiny industry.
In the Industrial infrastructure front, the State has taken lot of initiatives for development
of industrial infrastructure for the consistent growth. Government in association with
APIIC has initiated a set of prestigious projects that include industrial infrastructure,
social infrastructure and infrastructure for the specific sectors. The state owned
corporation APIIC has already set up 272 industrial estates and specialized parks like
ICICI Knowledge Park, SP Bio-tech Park, Marine Bio-tech Park, Agri Bio-tech Park,
Special Economic Zone, Pharma City, Hardware Park, HITEC city, Leather Parks, Food
Processing Park, Agri Export Zones etc.
The state has one major port at Visakhapatnam which handles largest tonnage among all
Indian ports and minor ports at Kakinada, Krishnapatnam, Vadarevu and Gangavaram.
The State has undertaken wide-ranging measures to nurture its industries: simplified, less
restrictive regulations, labour and fiscal reforms, incentives. In line with this objective,
the State has enacted a law for single-window clearances. It is the first Sate in the
country to have a law for single-window clearances, which ensures that all clearances to
investors are given within a set period. The State has been qualified as "flexible" in its
approach to labour regulations and "good" for its simplification of rules and regulations.
It introduced the self-certification concept, common annual returns in place of multiple
returns with simplified registers, and zero inspection regime through accredited agencies.
149
As part of its continuing search for ways to ensure a better quality of life, the State has
been in the forefront in building its intellectual capital. Andhra Pradesh offers a high
quality of life for expatriates and other members. Hyderabad the capital city of A.P has
wide ranging facilities for leisure and cultural activities, and entertainment. It has a long
culture of social clubs, some of which are over a hundred years old. Swimming Clubs,
Golf course and race courses, Food Courts, Shopping malls and floating restaurants
provides much needed recreation to the local and foreign people.
Andhra Pradesh Tourism has much more to offer with an ever-expanding infrastructure
and array of facilities to take in the beauty of nature and creativity of a vibrant
civilization. Cities across the State compete with the best in the country and rich past
contributes to the resplendence of its people and culture.
Communal harmony, peaceful industrial relations, lower crime rate and low cost social
infrastructure with safety and security make the State a right destination for any business
venture.
The State provides better and advanced health care facilities with presence of Super
Specialty Hospitals. Hyderabad, the capital of Andhra Pradesh has been recognized as
the Health Capital of the country.
The Government has helped to establish, in collaboration with some of the well-known
institutions in the world, a number of centres of excellence for training and research: the
Indian School of Business, the Indian Institute of Information Technology, the National
Academy for Construction and the Knowledge Park are part of this knowledge
revolution. Every year, 350 000 skilled graduates pass out from universities, and 81000
engineering graduates from engineering schools, another 10 078 management students
graduate from management institutions every year. About 23% of India’s software
professionals within and outside the country are from Andhra Pradesh.
150
To provide suitable atmosphere for setting up asset management, venture capital
companies, insurance companies, commercial banks, Financial District is being set-up in
Hyderabad. With the establishment of Insurance Regulatory and Development Authority
head quarters in Hyderabad, the State has been recognized as Insurance Capital.
It is the endeavour of the Government of Andhra Pradesh to create a conducive
environment for industrial growth by providing necessary support and services.
AP Tourism on World Map soon:
The Chief Minister, has asked the State Tourism Department and A.P. Tourism
Development Corporation to prepare a master plan for employment-intensive projects to
achieve the twin objectives of promoting tourism and creating huge job opportunities.
“Tourism is an industry where there is vast scope for employment of skilled
professionals, unskilled workers and illiterate people. Hence we should develop tourism
as a priority sector in the state. I am told that just Rs 10 lakh investment creates 78 jobs in
tourism while it is only 18 jobs in other industries. Taking advantage of this, we should
promote job-oriented tourism projects wherever it is feasible”, said the Chief Minister.
The state government plans to conduct tourism road shows throughout the country and in
other major cities of the world to attract tourists. Another proposal is to observe next year
as “Visit Andhra Pradesh” Year offering many attractive tourism packages, cultural
extravaganza with special focus on foreign and domestic tourists. The adventure tourism,
heli- tourism, pilgrim tourism and beach tourism would be given utmost priority to attract
more international tourists to the state. Though Andhra Pradesh stands first in attracting
domestic tourists, it is lagging behind in getting international tourists.
The Chief Minister asked the Tourism Minister, Dr J. Geeta Reddy, to make all-out
efforts to develop 1000-km long coast line (this is the longest coastline for any state in
the country) as well as the famous pilgrim centers at Tirupati, Srisailam, Bhadrachalam,
Annavaram, Simhachalam and so on so as to attract more foreign tourists to visit these
heritage/pilgrimage places. AP Tourism Development Corporation and Department of
151
Tourism are implementing 35 projects with funds from the Centre and the state
government worth Rs 269 crores. The major projects among these are: Buddhist theme
park at Nagarjuna Sagar, Budget Hotel at Nizamabad, Star Hotel at Shilparamam, four-
Star Hotel at National Institute of Tourism and Hotel Management (NITHM), Hyderabad;
Development of Charminar area; Night Bazaar in Shilparamam; Institutes of Hotel
Management at Tirupati, Vijayanagaram & Srikakulam Circuit; Kolleru Lake
Development; Resort & Golf Course at Idupulpaya-Kadapa Pilgrim Circuit, Tirupati
Pilgrim Circuit and so on.
Private investors and operators expect from the government handing over of the land,
investment subsidy (single financial support at the rate of Rs 20 lakhs for investment up
to Rs 5 crores; Rs 30 lakhs for investment of above Rs 5 crores and mega projects above
Rs 50 crores, Heritage Hotels and priority areas like coastal, water bodies, rural, eco,
adventure tourism projects get additional 5%) and of course Single Window Clearance
for the projects. In view of the recession, there is a request for continuing other incentives
like stamp duty exemption, power rebate etc. by the investors and operators.
The Chief Minister mooted proposals for converting R&B guest houses in the district
headquarters into a Chain of Budget Hotels and promotion of Hyderabad as Convention
and Medical Tourism Capital of the country. These measures, according to the Chief
Minister, will be in line with the state government's target to mobilise investments to the
tune of Rs 1,500 crores in future. It is felt that the awareness about the richness and
diversity of Andhra Pradesh has not been to the desired level and hence, there should be a
sustained campaign for at least two years besides celebrations like "Visit AP/Hyderabad
Year” and Yearly Media Plan to be put in place. There should be multiple approach like
media (press and electronic); domestic and international trade fairs, direct marketing
through agents. There is a need to involve best professional agencies
There are proposals to develop Brindavan-type gardens at Nizamsagar and to establish
new Shilparamams, an Adventure Tourism Academy at Ananthagiri in Ranga Reddy
district and develop highway amenities and rural tourism and so on. The World Heritage
Status will be sought for Qutub Shahi precincts at Hyderabad and Kakatiya group of
monuments in Warangal district. The tourism department will develop a tribal museum
152
for which the foundation stone was laid by the Chief Minister at Medaram in Warangal
district.
The state government has come up with a new tourism policy with incentives to attract
investments into several tourism spots and metros like Hyderabad and Visakhapatnam.
As per the new policy, the government would offer land on lease for 33 years with a
nominal fee of five per cent on the basic land value with a five per cent increase every
year. The department will develop a land bank for these projects. The government has
also decided to extend 20 per cent subsidy on projects with investments of `20 crore with
an upper limit of `20 lakh and 25 per cent subsidy or a maximum of `30 lakh for
investments between `20 crore and `100 crore. The government will decide on the
subsidy for projects above `100 crore on a case to case basis. Also 25 per cent
reimbursement on VAT would be given to projects for the first five years. Stamp duty
would also be exempted for up to 50 per cent for leased land and 25 per cent for outright
purchases of land. The government had decided to give additional capital incentive of 5
per cent up to a maximum of `5 lakh for projects coming up on beaches, water bodies,
jalayagnam sites and for rural, eco, adventure and heritage tourism projects.
“Andhra Pradesh has set an example in bringing development without any dispute
and displacement of common people. Other states should replicate AP’s policy in
development.”
The Rs 200- crore LICEC, Leonia International Centre for Exhibitions and Conventions
first-of-its-kind multi-facility centre for MICE (meeting, incentive, conference, event)
and part of the Hyderabad-based Leo Meridian Infrastructure Projects and Hotels
Limited, can accommodate over 7,500 delegates.
153
11.1 ANDHRA PRADESHs NEW TOURISM POLICY : AN INTRODUCTION The last Tourism Policy followed in Andhra Pradesh dates back to 1998. Though it was
meant to be replaced by an updated policy after 5 years, i.e., in 2004, this could not
happen. Between 1998 and today, there is a sea change in the nature of tourism activities,
priorities and organization, and also in the investment culture and norms. Newer ways of
engaging the private sector has into being. A policy should reflect these new and
emerging trends and should be updated to provide competitiveness to the state. With the
new tourism policy the state of Andhra Pradesh should expect to benefit in the following
ways :
1. Position the state competitively for attracting private sector investments in
Tourism and Hospitality sectors.
2. To promote inbound tourism in all potential destinations of the state, and not just
to few destinations like Tirupati, Hyderabad, Visakhapatnam, Puttaparthi, etc.
3. To target the incentives to the private sector better as per the State governments
priorities in terms of geographical areas and tourism products.
4. To maximize the potential of Hyderabad city to promote new tourism products.
5. To give adequate focus to Aam Aadmi Tourism, Rural Tourism, Eco tourism,
Adventure Tourism and Safe and Responsible tourism.
6. To focus on maximum generation of employment in the sector by development of
Human Resources through capacity building.
TOURISM POTENTIAL IN ANDHRA PRADESH
Andhra Pradesh has tremendous potential to become one of the foremost states in the
tourism map of the country. Practically everything that people who visit India to see and
experience can be seen and experienced in Andhra Pradesh alone. It is not an
exaggeration to say that Andhra Pradesh is the essence of Incredible India. Andhra
Pradesh has a very rich heritage, monuments, forts, palaces, nature, hills, wild life,
beaches, mighty rivers, beautiful water bodies, holy pilgrimage centers for all religions, a
154
strong Buddhist tradition, and festivals, besides modern entertainment, an exquisite
cuisine, fascinating handicrafts and textiles, etc.
The Department of Tourism commissioned a study by Price Waterhouse Coopers in 2009
regarding the potential of tourism in the state. The study revealed that there is enough
potential in the state to reach the figures of 327.62 million domestic tourist arrivals and
1.86 million international tourist arrivals by 2015. Similarly, the state can target 611.88
million domestic tourist arrivals and 3.73 million international tourist arrivals by 2020.
This can be possible if the state continues to maintain 24 to 25% share of the domestic
tourism market and 14 to 15% share of the international tourism market in the country. In
order to do so, it is expected that while the state Government will make priority
investment in the critical gap areas, a major chunk of the required investment will be
forthcoming from the private sector.
EXSITING STATUS AND DEFICIENCIES IN THE TOURISM SEC TOR IN
ANDHRA PRADESH :
An assessment of the present status of the Tourism scenario in the State of Andhra
Pradesh reveals a number of deficiencies that can be enumerated as follows :
1. A number of subsidies and other incentives have been mentioned in
successive tourism policy documents, but they have not been implemented
properly, and thereby desired levels of private investment have not been
stimulated.
2. Inbound tourism is confined largely to Tirupati and few other destinations
like Visakhapatnam and Hyderabad in the entire state. All other
destinations witness a meager inflow of tourists.
3. The state has not taken up any sustained promotional campaign because of
which awareness about the richness and diversity of its tourist attractions
is by and large lacking.
4. There is very limited ownership of tourist destinations and tourism
products by local bodies and local communities.
155
5. The developments initiated by the private sector are limited and confined
mostly to large cities. Whatever little has been done by the private sector
has also happened in parallel without much integeration with
Government’s priorities and efforts.
6. The large coastline close to 1000 kms, has not been fully exploited by the
state as has been done in other states like Kerala, Karnataka, Maharashtra
and Goa.
7. A large number of business travelers who come to the state , particularly
to Hyderabad and Visakhapatnam due to the rapid emergence of
knowledge based industries in these cities, have not been motivated
sufficiently to extend their stay for tourism purposes.
8. Both the government and the private sector have focused mostly on
creation of accommodation units as compared to other tourism products.
As a result many of the destinations of Andhra Pradesh lack sufficient
range of activities to keep the visitors engaged over a longer period of
time.
9. Government support in the form of incentives is available even to already
developed areas like Hyderabad and Visakhapatnam. More units are
therefore, coming up in these cities only, continuing to seek the
Government extended benefits, where the private market forces would
have themselves taken care of the incentive flow.
10. The Department of Tourism has a multiplicity of players and weak
structures, particularly at the district level.
156
OUTLINE OF TOURISM POLICY 2010:
The present Tourism Policy outlines the frame work for the enabling role of the
government and the involvement of the private sector in development of various tourism
products in the state of Andhra Pradesh. The present policy has been developed by
analyzing all the above mentioned deficiencies so as to provide practical and modern
solutions, and also by keeping in mind the best practices that have been adopted by other
states in the country successfully.
INVOLVEMENT OF THE PRIVATE SECTOR
The focus of the government of Andhra Pradesh in the last decade or so has been in
providing the required tourism infrastructure at all prime destination. The National
Tourism Awards of 2009 given by the Ministry of Tourism, Government of India.
Andhra Pradesh received the award for the best state for tourism infrastructure. In this
regard, it will be fair to say that 90 – 95% of the basic infrastructure is in place at all the
tourism destinations of the state . The destinations are easily accessible now through well
laid roads, through both public and private transportation and have other required
amenities like accommodation units, functional toilets, eateries etc. A modern day
traveler however looks forward to a variety of activities so that his time can be engaged
in an interesting way over a prolonged period of time.
Many of the tourism destinations in Andhra Pradesh today do not provide much diversity
of activities. There is an opportunity for new tourism products to be introduced at various
destinations so that a comprehensive range of attractions can be offered to the tourists,
who normally travel in family groups. This area is fertile for the private sector to make
the required investment. Government investment has already created a market and in
many cases even deepened the market sufficiently for the private sector to find business.

157
The right model for developing additional tourism products in the present times is
through “public private partnership” . PPPs enable the public sector to benefit from
commercial dynamism, the ability to raise finances in an environment of budgetary
restrictions, innovations and efficiencies, harnessed through the introduction of private
sector investors who contribute their own capital, skills and experience.
158
11.2 A Public-Private Partnership (PPP)
State PPP Cell
Government of Andhra Pradesh has setup a dedicated Public Private Partnership (PPP)
Cell under Finance Department. This PPP cell has been setup as per the MOU signed
between Government of Andhra Pradesh and Department of Economic Affairs, Ministry
of Finance, Government of India on participation in the ADB Technical Assistance
Project (TA 4890 – Ind: Mainstreaming Public-Private Partnerships at State level)
Activities:
Nodal agency for processing all PPP projects in the State
1. Serve as the repository of all information relating to PPPs in the State,including
on best practices, guidelines, schemes, PPP pipelines, etc.,
2. The relevant Departments / Ministries of the State will Coordinate with the PPP
Cell at all stages of project development.
3. Advise the relevant Departments / Ministries in project preparation based on the
policy framework to be developed under the TA Project, and in coordination with
the PPP Cell in DEA.
4. All proposals forwarded to GOI for any assistance from the TA Project will be
routed through the PPP Cell.
5. The PPP Cell in the State Government will interact with PPP Cell in DEA in
identifying bankable projects.
159
PPP Cell : Role and Functions
1. Create a shelf of projects and recommend approval of suitable projects for
implementation on PPP route
2. Assist in preparing the pre-feasibility reports
3. Help in appointing / selecting consultants to develop the projects
4. Ensures transparent tendering processes
5. Ensures through legal or regulatory means, the Government minimizes financial
obligations through prudent use of guarantees
6. Develop internal evaluation guidelines in consultation with respective
Departments to evaluate and assess the projects
7. Nodal agency to conduct / recommend exposure visits and trainings
8. Through training and technical support increase/ maximise the positive impact of
PPPs
9. Ensure dissemination to consumers, investors on the benefits and procedures for
PPP
10. Inspect, visit, review any PPP project under implementation
Recognizing that strengthening the capacities of different levels of government to
conceptualize, structure and manage PPPs will lead to more and better PPPs, Department
of Economic Affairs is facilitating mainstreaming Public Private Partnerships through
Technical Assistance from Asian Development Bank. The primary objective is effective
institutionalization of the PPP cells to deliver their mandate through provision of 'in-
house' consultancy services to each of the selected entities at the Center and State level.
160
Institutionalization of PPP skills includes
• refining the PPP policy and regulatory framework,
• meeting compliance/public safety norms,
• improving MIS,
• improving bidding documents and procedures,
• determining risk sharing,
• conducting value-added research/analysis, and
• determining adequate monitoring arrangements
Technical Assistance
The technical assistance aims to:
• Help the participating State implement PPP schemes effectively and
efficiently;
• Enhance capacity of PPP cells in participating entities to prepare,
evaluate, and appraise PPPs in infrastructure;
• Significantly improve monitoring of overall progress in PPPs in
infrastructure at both central and state levels through well-knit databases;
• Increase awareness among potential private sector partners about the
project cycle of PPP projects in infrastructure, and the expectations of
Government with respect to value for money; and
• Over the long term, an increase in private sector participation in
infrastructure development and management throughout the country.
161
The selected entities will be provided assistance for a period of approximately three years
in the form of:
• One PPP Expert on an individual basis focusing on project financial
analysis and risk management;
• One Management Information Systems expert (on an individual basis)
focusing on information management and
• A panel of three legal experts on retainer basis (expected input:
intermittent over the year but approximately 6-7 months throughout the
year) to provide legal expertise on PPPs
Eligibility
1. The States wishing to avail this Technical Assistance are required to enter
into an MOU with DEA detailing steps that would be taken to promote
PPPs in the State.
2. The MOU requires the State Government to:
Responsibilities
a. Set up a PPP Cell as the nodal agency for processing all PPP projects in the State
with a designated PPP Nodal Officer and defined scope of work.
b. Develop a robust shelf of projects amenable for PPPs and adhere to the following
set of targets on the level of PPPs in the State:
• During 2007-08 – bid out at least 3 projects with a total cost of Rs.750
crores or more in atleast two sectors;
• During 2008-09 – bid out at least 5 projects with a total cost of Rs.1,250
crores or more in atleast three sectors;
• During 2009-10 – bid out at least 5 projects with a total cost of Rs.1,500
crores or more in atleast four sectors.
162
c. Commit to establish such policies and regulatory and governance frameworks in t
the identified infrastructure sectors to enable a transparent and effective private
sector participation
d. Prepare a "Plan of PPP projects" in conjunction with its Annual Plan.
e. Commit to :
1. Adopt standard concession agreements for PPP projects in defined
infrastructure sectors;
2. Adopt competitive bidding procedures for bidding and awarding of
infrastructure projects under defined rules and procedures according to
best international commercial practices and GOI guidelines;
3. Designate a State-level dispute resolution mechanism for the speedy
resolution of disputes relating to PPP projects; and
4. Adopt formal State policies on environment, resettlement and social
safeguards with respect to the implementation of infrastructure projects,
according to best international commercial practices.
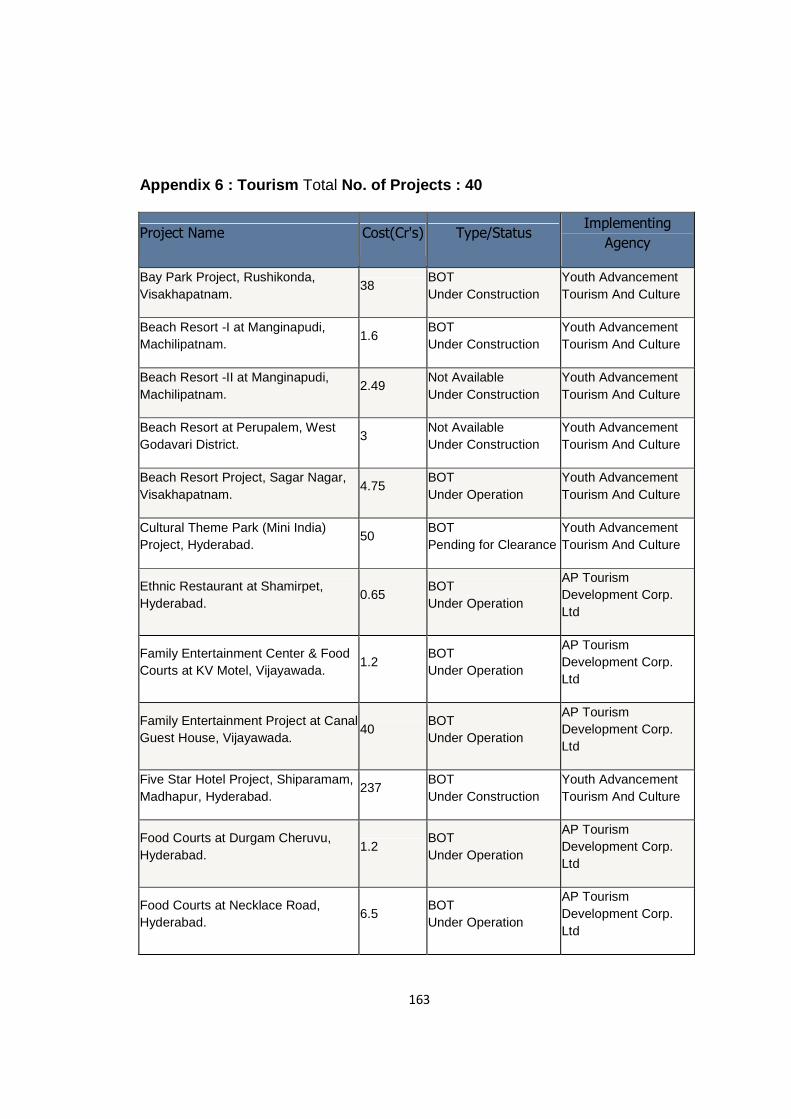
163
Appendix 6 : Tourism Total No. of Projects : 40
Project Name Cost(Cr's) Type/Status Implementing
Agency
Bay Park Project, Rushikonda, Visakhapatnam.
38 BOT Under Construction
Youth Advancement Tourism And Culture
Beach Resort -I at Manginapudi, Machilipatnam.
1.6 BOT Under Construction
Youth Advancement Tourism And Culture
Beach Resort -II at Manginapudi, Machilipatnam.
2.49 Not Available Under Construction
Youth Advancement Tourism And Culture
Beach Resort at Perupalem, West Godavari District.
3 Not Available Under Construction
Youth Advancement Tourism And Culture
Beach Resort Project, Sagar Nagar, Visakhapatnam.
4.75 BOT Under Operation
Youth Advancement Tourism And Culture
Cultural Theme Park (Mini India) Project, Hyderabad.
50 BOT Pending for Clearance
Youth Advancement Tourism And Culture
Ethnic Restaurant at Shamirpet, Hyderabad.
0.65 BOT Under Operation
AP Tourism Development Corp. Ltd
Family Entertainment Center & Food Courts at KV Motel, Vijayawada.
1.2 BOT Under Operation
AP Tourism Development Corp. Ltd
Family Entertainment Project at Canal Guest House, Vijayawada.
40 BOT Under Operation
AP Tourism Development Corp. Ltd
Five Star Hotel Project, Shiparamam, Madhapur, Hyderabad.
237 BOT Under Construction
Youth Advancement Tourism And Culture
Food Courts at Durgam Cheruvu, Hyderabad.
1.2 BOT Under Operation
AP Tourism Development Corp. Ltd
Food Courts at Necklace Road, Hyderabad.
6.5 BOT Under Operation
AP Tourism Development Corp. Ltd
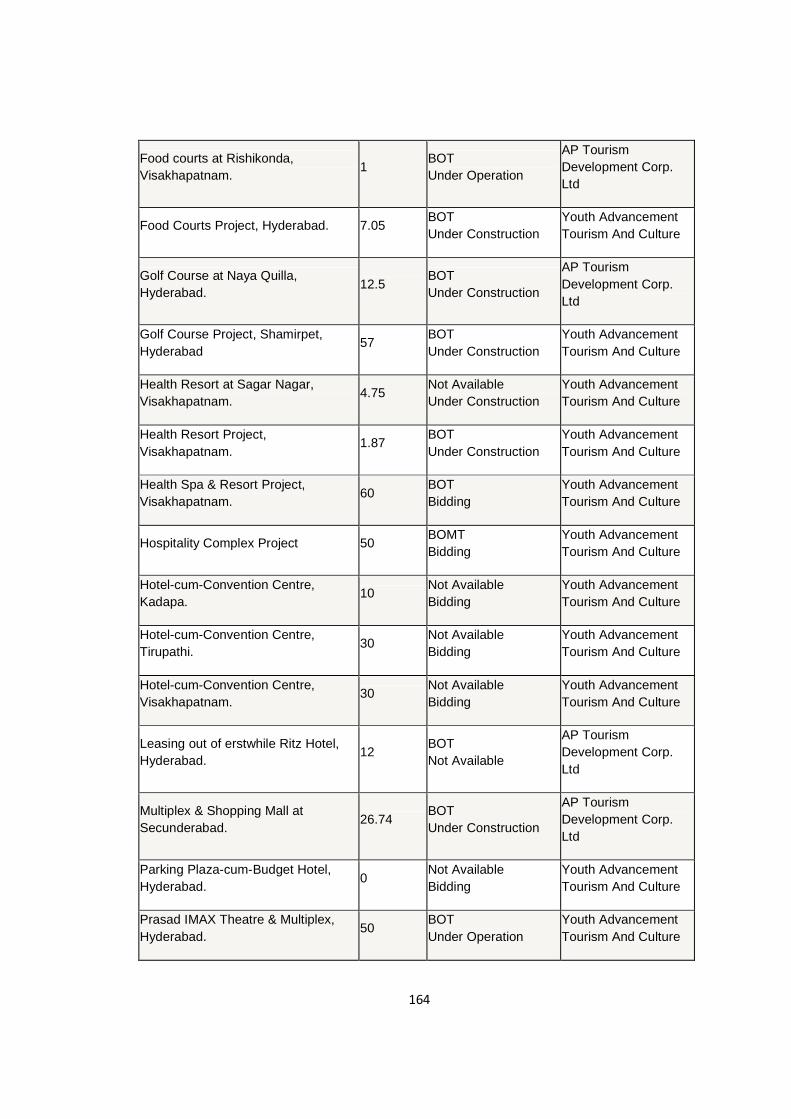
164
Food courts at Rishikonda, Visakhapatnam.
1 BOT Under Operation
AP Tourism Development Corp. Ltd
Food Courts Project, Hyderabad. 7.05 BOT Under Construction
Youth Advancement Tourism And Culture
Golf Course at Naya Quilla, Hyderabad.
12.5 BOT Under Construction
AP Tourism Development Corp. Ltd
Golf Course Project, Shamirpet, Hyderabad
57 BOT Under Construction
Youth Advancement Tourism And Culture
Health Resort at Sagar Nagar, Visakhapatnam.
4.75 Not Available Under Construction
Youth Advancement Tourism And Culture
Health Resort Project, Visakhapatnam.
1.87 BOT Under Construction
Youth Advancement Tourism And Culture
Health Spa & Resort Project, Visakhapatnam.
60 BOT Bidding
Youth Advancement Tourism And Culture
Hospitality Complex Project 50 BOMT Bidding
Youth Advancement Tourism And Culture
Hotel-cum-Convention Centre, Kadapa.
10 Not Available Bidding
Youth Advancement Tourism And Culture
Hotel-cum-Convention Centre, Tirupathi.
30 Not Available Bidding
Youth Advancement Tourism And Culture
Hotel-cum-Convention Centre, Visakhapatnam.
30 Not Available Bidding
Youth Advancement Tourism And Culture
Leasing out of erstwhile Ritz Hotel, Hyderabad.
12 BOT Not Available
AP Tourism Development Corp. Ltd
Multiplex & Shopping Mall at Secunderabad.
26.74 BOT Under Construction
AP Tourism Development Corp. Ltd
Parking Plaza-cum-Budget Hotel, Hyderabad.
0 Not Available Bidding
Youth Advancement Tourism And Culture
Prasad IMAX Theatre & Multiplex, Hyderabad.
50 BOT Under Operation
Youth Advancement Tourism And Culture
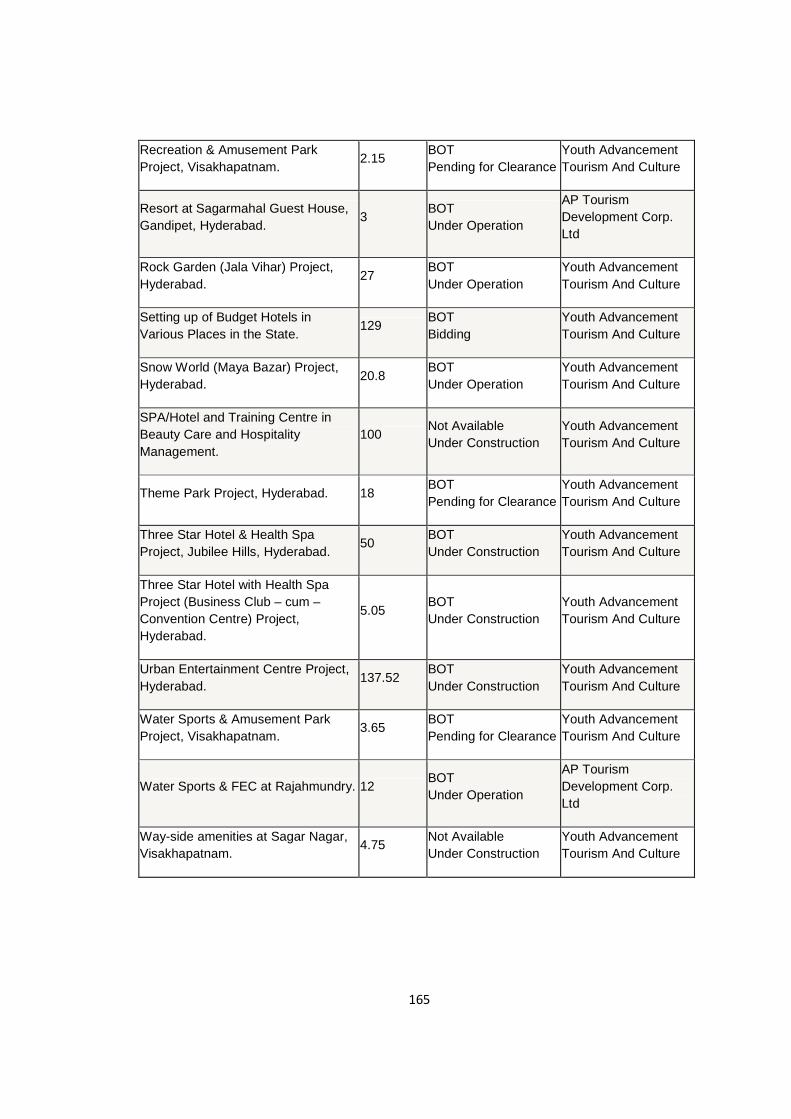
165
Recreation & Amusement Park Project, Visakhapatnam.
2.15 BOT Pending for Clearance
Youth Advancement Tourism And Culture
Resort at Sagarmahal Guest House, Gandipet, Hyderabad.
3 BOT Under Operation
AP Tourism Development Corp. Ltd
Rock Garden (Jala Vihar) Project, Hyderabad.
27 BOT Under Operation
Youth Advancement Tourism And Culture
Setting up of Budget Hotels in Various Places in the State.
129 BOT Bidding
Youth Advancement Tourism And Culture
Snow World (Maya Bazar) Project, Hyderabad.
20.8 BOT Under Operation
Youth Advancement Tourism And Culture
SPA/Hotel and Training Centre in Beauty Care and Hospitality Management.
100 Not Available Under Construction
Youth Advancement Tourism And Culture
Theme Park Project, Hyderabad. 18 BOT Pending for Clearance
Youth Advancement Tourism And Culture
Three Star Hotel & Health Spa Project, Jubilee Hills, Hyderabad.
50 BOT Under Construction
Youth Advancement Tourism And Culture
Three Star Hotel with Health Spa Project (Business Club – cum – Convention Centre) Project, Hyderabad.
5.05 BOT Under Construction
Youth Advancement Tourism And Culture
Urban Entertainment Centre Project, Hyderabad.
137.52 BOT Under Construction
Youth Advancement Tourism And Culture
Water Sports & Amusement Park Project, Visakhapatnam.
3.65 BOT Pending for Clearance
Youth Advancement Tourism And Culture
Water Sports & FEC at Rajahmundry. 12 BOT Under Operation
AP Tourism Development Corp. Ltd
Way-side amenities at Sagar Nagar, Visakhapatnam.
4.75 Not Available Under Construction
Youth Advancement Tourism And Culture
166
11.3 INSTITUTIONAL ARRANGEMENT :
The following institutional arrangements are put in place to secure accelerated
development of tourism in state and to address all interdepartmental issues while
monitoring and securing the development of tourism in the state.
STATE TOURISM PROMOTION BOARD (STPB)
The State Tourism Promotion Board (STPB) is constituted as an apex decision making
authority in the state. The STPB will look into all issues pertaining to tourism projects in
the private as well as public sector to secure accelerated development of tourism . The
STPB shall periodically monitor and review project implementation. It will also be
empowered to take policy decisions on uni or multi sectoral issues. The decisions of the
STPB will be converted to Government Order by the respective departments without
circulating files. The STPBs smooth functioning will be facilitated by the State Tourism
Promotion Committee. The composition of the STPB will be :
1. Chief Minister Chairman
2. Minister for Finance Member
3. Minister for Tourism Member
4. Minister for Energy Member
5. Minister for Transport Member
6. Other Ministers connected with specific projects/ subjects will be special invitees
whenever their projects/ subjects are taken up for considerations. Invitees
7. Members from the Private Sector to be nominated by Government.
8. Chief Secretary to Government Member
9. Commissioner/ Director of Tourism
10. Secretary (Tourism) Member & Convenor
167
STATE TOURISM PROMOTION COMMITTEE (STPC)
The State Tourism Promotion Committee (STPC) is set up with the following
composition:
1. Chief Secretary to Government Chairman
2. Secretary to Government, Tourism and Culture Department Member
3. Secretary to Government, Industries & Commerce Department Member
4. Secretary to Government, Finance and Planning Department Member
5. Secretary to Government, Irrigation and C.A.D Department Member
6. Principal Secretary to Government, Revenue Department Member
7. Secretary to Government, Energy Department Member
8. Managing Director, APTDC Member
9. Director/ Commissioner of Tourism Member Secretary and Convenor
The terms of reference for SPTC will be as follows :
1. To monitor the activities for development of Tourism.
2. To address multi departmental issues for expeditious resolutions.
3. To periodically monitor the implementation of extension of incentives and
concessions.
4. To holistically integrate tourism sector with the other sectors of government in
order to strengthen infrastructure while bridging the gaps in basic infrastructure
such as connectivity, energy requirements etc.
5. To work as a single window for clearances of tourism related projects which are
held up due to non resolution of inter departmental issues.
168
DISTRICT TOURISM PROMOTION COMMITTEE (DTPC)
At the district level, there shall be a District Tourism Promotion Committee (DTPC). The
composition of the DTPC will be :
1. District Collector Chairman
2. Joint Collector Member
3. Executive Officer of Prominent Temples in the district Member
4. President District Hotels Associations Member
5. President, District Commerce & Industrial Association Member
6. President, District Tour Operator’s Association Member
7. District Forest Officer Member
8. District Public Relation Officer, I &PR Department Member
9. District Revenue Officer Member
10. Representative of Archaeology Department Member
11. District Tourism Officer/ Tourist Information Officer Member Convenor
169
INCENTIVES and CONCESSIONS :
ELIGIBLE TOURISM PRODUCTS
The following tourism products will be eligible for receiving state support :
1. Hotels and Serviced Apartments
2. Resorts
3. Heritage Hotels
4. Wellness Centres (spa/yoga/naturopathy etc)
5. Amusement Parks
6. Entertainment Centre (aquarium/ indoor rides/ snow world/ etc.)
7. Permanent exhibition complexes
8. Ropeways
9. Convention Centre
10. Wayside Amenities
11. Water Sports
12. Golf Courses
13. Wildlife Safaris
14. Luxury Tourist Trains
15. Sea/ River Cruisers
16. Eco tourism Centres
17. Rural Tourism products and
18. Adventure Tourism products
170
JURISDICTION OF THE TOURISM POLICY
It is noticed that the urban areas of Hyderabad, Visakhapatnam, Vijayawada and Tirupati
are receiving adequate public and private funding in various sectors based purely on the
interplay of market forces. Further state support to private parties is therefore more
required in the hinterland rather than in the metropolitan areas of the above four cities.
Hence, the support mechanism to be given to private parties by the government will be in
graded as follows in terms of geography :
Zone A : Area falling within the limits of Greater Hyderabad Muncipal Corporation
(GHMC)
Zone B: Region falling within Hyderabad Metropolitan Development Area (HMDA),
(excluding GHMC area), area covered by Greater Visakhapatnam Muncipal Corporation
and Tirupati Muncipal Corporation.
Zone C : rest of the state.
Incentives & Concessions :
1. Concessional Allotment of land – Depending on the size of the investment, the
length of tenure can be up to 33 years at the first instance. In case the developer
has complied well with the terms and conditions of the lease, he will, get the next
term, but on the policy prevailing at that point of time. The lease rent shall be 5%
of basic market value as per the sub-registrar’s office data, and with an increment
provision of 5% every year. Government will facilitate in the land assembly
required for any tourism product considered and as per government’s own
priorities. For this purpose, the Tourism Department a land bank at different
locations having potential for tourism promotion, and lands from that bank would
be offered to the developer on lease basis. Whenever government lands are not
available, Government can consider acquiring private lands.
171
2. Capital Investment Subsidy (CIS) – The main financial incentive that will be
offered to the private investor for all the above mentioned tourism products as per
the locations specified above would be in the form of investment of upto Rs 20.00
crores. The CIS will be 20% of the capital cost of investment subject to a
maximum of Rs 20 lakhs.
All projects having an investment of above Rs 100 crores, irrespective of location,
will be treated as mega tourism projects and will bbe given additional subsidies
on a case-to case basis. For the category of “Heritage Hotels”, the entire state
including the urban areas of Hyderabad, Visakhapatnam, Vijaywada and Tirupati
will be considered and this product will get an additional CIS of 5 %.
3. Reimbursement of Stamp Duty and Transfer Fee – For lease of land/buildings
meant for the eligible tourism project from the government, 50% reimbursement
will be given to the tourism project. In case of purchase of land by the private
parties or setting up of tourism projects, 25% reimbursement will be given.
4. Reimbursement of VAT – 25% of the VAT paid during a financial year will be
ploughed back to the unit as a grant towards the payment of VAT for thenext
year. This benefit will be available for 5 years only.
5. Luxury Tax – Luxury tax will be levied at the rate of 5% on room tariff actually
charged
6. Reimbursement of Entertainment Tax – 25% of entertainment tax will be
ploughed back for entertainment components in theme parks or entertainment
centers for a period of 5 years subject to the condition that the total benefit on this
count does not exceed 100% of the project cost.
172
7. Municipal Concessions/ Exemptions – Two benefits will be made available to
eligible tourism projects regarding municipal charges :
a. There will be an exemption for payment of conversion charges
b. The payment of impact fees for registered tourism projects will be
levied under category C (which is about 50% of the impact fee
paid by other commercial units).
8. Energy Incentives – There will be reimbursement of 0.75 paise/ 0.90 paise /
Re 1. (for Zone A/Zone B/ Zone C respectively) per unit of the energy cost for a
period of 5 yrs for all eligible tourism projects.
9. General Condition – While extending incentives, subsidies and concessions, it
shall be a general condition that the total financial commitment shall not exceed
the eligible capital investment (as defined in this policy), in the project.
173
11.4 MARKETING STRATEGIES :
TOURISM CIRCUITS :
Government of Andhra Pradesh is currently promoting its tourism activities in 6 major
circuits viz., Hyderabad Circuit covering Hyderabad City and surrounding destinations
like Warangal, Adilabad etc; Visakhapatnam Circuit covering Visakhapatnam city,
Araku Valley and surrounding destinations in Srikakulam and Vizianagaram districts;
Tirupati Circuit covering Tirumala Tempke, other surrounding temples, Horsley Hills
and other nearby destinations; Krishna- Godavari Circuit covering river cruises,
backwaters, Konaseema, Kolleru Lake area and other surrounding destinations;
Vijaynagar Circuit covering destinations in Anantapur, Kurnool and Kadapa; and
Buddhist Circuit which has two streams viz., Lower Krishna Valley Circuit covering
Nagarjuna Sagar, Amravati andother Buddhist locations; and North Coastal Circuit
covering Buddhist locations in and around Visakhapatnam district. Government
encourages any tourism product in these circuits which serve to augment an existing
destination.
AAM ADMI TOURISM :
The State Government is concerned with the fact that tourism is considered an elitist
activity not meant for the common man. Therefore the welfare of the common man is the
utmost priority for the government. There is no reason that the common man should be
deprived of enjoying the tourist attractions and opportunities present in the state.
However, this intent can only become a reality if tourism activities are conducted at
affordable rates . The government will therefore through its own agencies create facilities
for the common man at popular tourist destinations. These include cost effective
accommodation units like dormitories, low cost restaurants, no frill tour packages and so
on.
174
HOME STAY AND BED & BREAKFAST SCHEME
Andhra Pradesh is one of the major tourist destinations in the country with more than 150
million tourist per year visiting the state. In future, due to sustained promotional activity
and improvement of tourist infrastructure, there is expectation of upsurge in tourist
arrivals in the state, both domestic and international. The state has lot of well constructed
houses, having surplus rooms, which can be converted to tourist accommodation with
reasonable improvements to suit the requirement of tourist. The Department of Tourism
will take steps to identify such units, which will be termed as “Home Stays” to bring
tourists and host families together. This will not only provide a reasonable
accommodation to tourist but also will be a source of disseminating our cultural heritage
to our guests.
RECOGNITION TO PRIVATE OPERATORS
Government will give recognition to existing private hotels, private tour operators and
other private providers of tourism related services in case they maintain the required
minimum standards. This will enable these private units to function effectively in the
open market and also add to the pool of services that the government is offering, besides
benefiting the common traveler who can get more options for obtaing reliable services.
This will be made operational through a certification scheme. Seperatew guidelines will
be issued for the same.
PROMOTION AND MARKETING EFFORTS
It is pointed out earlier that though Andhra Pradesh receives the maximum number of
domestic tourists, a large majority is concentrated only to a few destinations. Andhra
Pradesh is also not among the top ten states in terms of international visitors arrival. Two
main reasons can be identified for the above phenomenon. The first one is the lack of
adequate awareness about the richness and diversity of tourism destinations that Andhra
Pradesh has to offer to the visitors.
175
The second and more important reason is the lack of confidence a visitor feels about the
hassle free manner in which he will be able to organize his touring to different
destinations in the state. If Andhra Pradesh has to become the foremost state in the
tourism map of the country, it is absolutely essential that these two deficiencies be
overcome expeditiously.
PROMOTING CUSTOMIZED TOURS
Apart from the general lack of awareness, the more significant reason for tourists,
particularly international tourists, preferring other states over Andhra Pradesh is the lack
of confidence they feel about the organization of tourism activities in the state. Many fear
that the organization will not be systematic, they will have to run from pillar to post,
organizing a holiday vacation will involve major hassles, and in general, the experience
will be very difficult to manage. Part of this impression is perhaps true also, since the
level of professionalism displayed by a majority of tour operators in ground handling
activities for overseas visitors leaves much to be desired.
One method of successfully meeting all expectations of the tourists and leaving them
with a satisfactory experience of value for money is what is known as “Customized
Tours”. Under customized tours, all requirements of the tourists are met by a single
agency under a one-stop shop arrangement. The agency takes care of meeting the
requirements of tourist in the form of transportation, accommodation, sightseeing, guides,
assistance in local shopping, assistance in trying out local cuisine and assistance in
participation in local events of tourist interest. Such an arrangement, which is priced
transparently without any hidden cost, is bound to be appreciated by he tourists.
The state government will endeavor to promote customized tours by its own agency,
namely APTDC, and also encourage private tour operators to offer in-bound tours
following the above approach.
176
SUPPORT TO MICE TOURISM & MEDICAL TOURISM
Andhra Pradesh, particularly Hyderabad, also enjoys competitive advantage over other
India States in terms of Medical Tourism and MICE tourism. The presence of the best
Airport in the country, the best Convention Centre in the country, the presence of the best
Exhibition facility, the presence of hotels at par with the best, very good urban
infrastructure, moderate climate, and attractive tourist destinations can help position
Hyderabad as the most preferred destination for MICE tourism.
As Hyderabad enjoys the presence of highest caliber medical specialization and expertise,
it can also be promoted as a major centre for Medical Tourism. The government plans to
create appropriate organizational structure, preferably in the form of societies and be the
main driving force behind these societies by infusing the required capital in its corpus and
by engaging experienced professional to mange these societies.
FILM TOURISM
One opportunity that presents itself before Andhra Pradesh is to take up an innovative
tourism activity in the area of Film Tourism. The state has a rich variety of locations
which can become attractive for outdoor film shooting. Hyderabad has got a number of
studios which provide latest facilities. The government proposes to promote Film
tourism by creating a single window cell which will perform the following two functions
:
1. Promote various destinations and facilities of the state to film producers through
out the country.
2. Organize a package of services to film units on payment basis which will include
all permissions and clearances, accommodation, transport, catering, security, etc.
177
HELI TOURISM
In tune with the priority accorded by Ministry of Tourism, Government of India, the State
government will also promote Heli Tourism within the state. For this purpose, feasibility
of various destinations to be linked with Heli services would be studied, and opportunity
will be provided to the private sector agencies having requisite qualifications to operate
the services. The State government will play a catalytic role in organizing and promoting
Heli tourism.
DEVELOPMENT OF HUMAN RESOURCES THROUGH CAPACITY
BUILDING
It is very essential that tourism activities are organized with utmost professionalism by
highly trained and skilled manpower. The government will initiate suitable capacity
building efforts to turn out the required manpower. Institutes under the government such
as National Institute of Tourism & Hospitality management (NITHM), Institutes of Hotel
Management and Catering Technology Institutes (FCTI), are training professionals.
Similarly the private sector should be funded and supported so that they are able to attract
the best faculty and students who can jointly raise the professional standards in this
industry.
SAFE, RESPONSIBLE AND HONOURABLE TOURISM
Ministry of Tourism, Government of India has finalized a Code of Conduct for Safe and
Honorable tourism to be adopted by all the major stakeholders like Hotels, Tour
operators, Cab drivers and other hospitality linked services. The code will entail adopting
guidelines that will ensure ethical business practices protecting women and children. This
includes training of personnel, awareness drives, ethical marketing and business practices
and regulations of usage of official equipment to prevent human trafficking and
pornography. With the growth of the tourism industry there are also negative aspects to
178
the growth evident from the child sex tourism and prostitution on rise in major tourism
destinations and pilgrim places.
To ensure safe and honorable tourism, the government of Andhra Pradesh on the lines of
Government of India will also adopt a code of conduct. This will be implemented in co-
ordination with the Women and Child Welfare Department, Home Department and
NGOs.
The state government plans to position Tourist Police at all locations. They will have
proper sensitization about the special requirements of the tourists and they will play a
proactive role in ensuring that the visitors get an enjoyable experience during their visit.
RURAL TOURISM
Rural Tourism aims to provide the discerning traveler with a multitude of distinctive,
first-hand experiences in an interactive, informative and organic setting in rural Andhra
Pradesh. Community based rural tourism is envisaged to provide sustainable livelihoods
and strengthen rural economy through the preservation and promotion of rural craft,
culture, heritage and environment in their natural forms by offering an enhanced choice
to visitors seeking a unique experience, thus increasing awareness and exposure to rural
way of life across the state while improving the quality of life of the village communities,
encouraging gender equity and community ownership through an equal partnership
between hosts and tourist leading to overall holistic development through tourism.
179
12 . CONCLUSIONS
1. The responsibility of management and in particular, that of marketing
management of the destination product has traditionally been transferred from
individual companies to a destination Management.
It was demonstrated that current destination marketing theory does not often distinguish
between specific approaches for destinations as opposed to single products or services.
Despite the fact that destinations are realised as being amalgams of various aspects (the
six As), the actuality that DMOs are seldom in charge and control of all the aspects (and
therefore in general only are able to apply some parts of the marketing mix fully), has not
been addressed. It was therefore suggested that DMOs should re-focus their objectives,
realising that they should aim for the widest possible support for their strategy and treat
the strategic plan as a product for sale to the tourism industry. Additionally, the process
of developing the strategic plan for peripheral destinations could be enhanced by
investigating the needs and wants of life-style businesses, thus achieving better and more
cost-effective application of scarce funds.
With the analysis of the secondary data collected from the NCAER, it is observed that
on an average Rs 906/- per trip is spent by the “least income group” on transport, food,
accommodation, entertainment, refreshment and others when he is touring. Each of these
are sold by independent small and medium sized enterprises separately and they have
their own marketing strategies, which does not complement the strategies of destination
marketing. Therefore for developing strategic marketing plan for destinations the
activities should be controlled and managed by a tourism management authority.
180
2. Traditionally marketing concentrates on increasing visitation and treats tourism
like any other commodity. This approach fails to recognize the unique needs and
limitations of each destinations as well as their particular geographical ,
environmental and socio-cultural characteristics. In contrast, planning literature
concentrates more on the impacts of tourism and on limiting tourism
development, often ignoring the market dynamics and the requirements of
entrepreneurs at the destination and the place of origin. Companies and
governments in tourism have applied only part of the marketing mix to tourism,
i.e promotion, with little attention being paid to the other components of
marketing.
It was investigated how the strategy formulation process functioned and how it could be
improved in Maharashtra, Uttar Pradesh, Karnataka, Andhra Pradesh and Rajasthan
which are the top five states that have contributed to the domestic tourism. Visitation to
these states are mainly for Social Purposes followed by travel for religion and pilgrimage,
Business and trade and least for Leisure and Holiday. All the above states have sold
destinations to consumers without actually understanding the market dynamics. Analysis
of primary data derived for the interviews it was observed that with changing times and
global business conditions, significant changes have been observed in the Indian travel
and tourism industry. There is a demand for niche and customised tourism products.
Lifestyle changes and higher disposable incomes have resulted in shifting travel
preferences and travelers are looking for ‘out-of-the-box’ experiences. The government
must take a notice of these dynamics and pay attention to marketing all the potential
places within the state rather than just the already popular ones.
181
3. During their holiday, tourist “consume” destinations as a comprehensive
experience, without often realizing that each element of the product are produced
and managed by individual players. Their overall impression develops their image
of a destination after their visitation. As a consequence there is much overlapping
between strategic marketing of the destination as a whole and each individual
supplier at the region. Hence, the competitiveness of each player is often
interrelated and almost indistinguishable from one another.
The survey shows that 60% of the viewers agreed that their knowledge about the
destination increased after viewing the advertisements, press reports, and other
promotional tools. Before visiting a destination they develop an image about the
destination as well as set of expectation, without realizing that each element of the
products are produced and managed by individual players. Therefore if they encounter a
problem while consuming any one service, they find it difficult to differentiate it from
the destination and often their overall impression develops the image of the destination.
4. Strategies should enhance the long term prosperity of local people. Delight
visitors by maximizing their satisfaction. At the same time maximise profitability
of local enterprises.
The case study reveals that Community based rural tourism is envisaged to provide
sustainable livelihoods and strengthen rural economy through the preservation and
promotion of rural craft, culture, heritage and environment in their natural forms by
offering an enhanced choice to visitors seeking a unique experience, thus increasing
awareness and exposure to rural way of life across the state while improving the quality
of life of the village communities, encouraging gender equity and community ownership
through an equal partnership between hosts and tourist leading to overall holistic
development through tourism. E.g SHILPARAMAM, the arts, crafts and cultural village
established in the year 1992 is spread over 65 acres of prime land is Hyderbad’s tribute
to India’s natural beauty, richly diverse cultural heritage and vibrant ethos. It is a place
182
where artisans showcase their talent and earn a livelihood. They have a training institute
which trains men and women in art, music, dance and crafts at affordable prices. All the
products produced by the trainees are put for public sales in the Shilparamam Art Gallery
out of which 20% of income generated is given to the artist.
It is also observed that there is limited ownership of tourist destination and tourism
products by local bodies and local communities. And also the developments initiated by
the private sector are limited and confined mostly to large cities, and whatever little has
been done by private sector has also happened in parallel without much integration of
Government’s priorities and efforts. The Department of Tourism has multiplicity of
players and weak structures , particularly at the district level.
5. Destinations should be aware not only of the needs and wants of the active
demand but also of the potential markets they can attract. It can then develop a
product portfolio, which will enable the optimization of benefits and adapt their
marketing mix to their target markets.
In view of the marketing mix for destination Andhra Pradesh the Government of Andhra
Pradesh is currently promoting its tourism activities in 6 major circuits viz., Hyderabad
Circuit covering Hyderabad City and surrounding destinations like Warangal, Adilabad
etc; Visakhapatnam Circuit covering Visakhapatnam city, Araku Valley and
surrounding destinations in Srikakulam and Vizianagaram districts; Tirupati Circuit
covering Tirumala Temple, other surrounding temples, Horsley Hills and other nearby
destinations; Krishna- Godavari Circuit covering river cruises, backwaters,
Konaseema, Kolleru Lake area and other surrounding destinations; Vijaynagar Circuit
covering destinations in Anantapur, Kurnool and Kadapa; and Buddhist Circuit which
has two streams viz., Lower Krishna Valley Circuit covering Nagarjuna Sagar, Amravati
andother Buddhist locations; and North Coastal Circuit covering Buddhist locations in
and around Visakhapatnam district. Government encourages any tourism product in these
circuits which serve to augment an existing destination.

183
6. Classifying travel behavior and segmentation becomes increasingly more difficult
as modern travelers combine pleasure with business, in order to take time and cost
advantage.
The Case study of Andhra Pradesh has revealed that the government has identified the
segment that combine pleasure with business and adopted the strategy of supporting
MICE Tourism. Particularly Hyderabad, enjoys competitive advantage over other India
States in terms of Medical Tourism and MICE tourism. The presence of the best Airport
in the country, the best Convention Centre in the country, the presence of the best
Exhibition facility, the presence of hotels at par with the best, very good urban
infrastructure, moderate climate, and attractive tourist destinations can help position
Hyderabad as the most preferred destination for MICE tourism.
Hyderabad also enjoys the presence of highest caliber medical specialization and
expertise, it can also be promoted as a major centre for Medical Tourism.
184
RECOMMENDATIONS
After making an in depth study this paper brings about the following observations:
1. Converting Market Research into Marketing Strategy
The marketing of tourism product involves identification of market segments, choices of
media and messages for product positioning and promotion and evolving effective
communication strategies. A fine combination of these should be made to maximize the
income from tourism. This is known as marketing strategy or plan. The formulation of
a marketing strategy would, however, involve extensive market research including
marketing audit, market segmentation, SWOT analysis and review and evaluation. No
useful marketing strategy can be formulated without reliable and up-to-date market
research.
2. Marketing Audit
Marketing audit is essentially the process of collecting, documenting, analyzing and
gaining intelligence on all aspects of potential tourism markets. It would include, the
existing tourist flows, profiles of actual and potential tourists, details of competitive
destinations and their marketing efforts, relative market shares of each of them, country
profiles, global tourism trends, etc. The specific information being gathered and analysed
by most of the countries in respect of their major source markets generally include the
following.
1. Market overview consisting of maturity of the market, geographical features,
population, income levels and distribution, disposable income, outbound travel,
top outbound and long haul markets, vacation participation, travel by different age
groups, etc.
2. Travel patterns of the market including main long haul destinations, growth rates
in outbound travel, current levels of arrivals in the destination country, prevailing
exchange rates of currencies of both the countries, etc.
185
3. Channels or leisure product intermediaries like travel agencies and tour operators
in the source market, their size of operation, specializations, and their influence in
the destination choice, flight connectivity and prices, etc.
4. Competitors, their product offerings and marketing strategies, and
5. Consumers including their demographic profiles, travel behavior, demand
characteristics, etc.
3. Market Segmentation
According to the ‘Handbook on Tourism Segmentation – Maximising Market
Effectiveness (2007)’ by the World Tourism Organisation, market segmentation is about
focusing resources on those potential customers who are most likely to be persuaded to
visit the destination and who fit the profile of the ‘type’ of customer the destination wants
to attract. It is important in view of Pareto principle by which some groups of people or
segments travel or have high propensity to travel. Though USA, Germany and UK
generate nearly 30% of all international tourism expenditure, these countries collectively
have less than 7% of the worlds population. The benefits of market segmentation are the
following:
1. maximize marketing return on investment
2. understand the market better, and
3. communicate more effectively with customers.
Segmentation analysis require data on a large number of variables in respect of actual or
potential visitors to the destination. These include demographic variables like age,
gender, education, life cycle stage and income; geographical variables like place of
residence; psychological or lifestyle variables like benefits, attitudes, values, personality
and characteristics and behavioral variables like types and frequency of use, types of
information sources and distribution channels used.
186
4. SWOT Analysis
The choice of particular segments for marketing has to be based on a SWOT analysis to
evaluate the tourism products of the destination in relation to the specific requirements of
various market segments. This requires a full understanding and documentation of the
products on offer. In particular, it should specify what the products are, where they are
located, how good they are and what product developments are required. Market research
thus encompasses product research also.
5. Review and Evaluation
It is critical that appropriate measurement/performance indicator mechanisms are set in
place before undertaking marketing activities, rather than attempting to set in place
measurement systems once the activities have commenced. Such evaluations are
necessary to ensure that resources are used effectively and efficiently.
Tourism promotion and publicity evaluation is essentially an ‘attempt to measure its
impact on inbound tourism performance’. The basic phases of evaluation are:
a) Defining the objectives of specific marketing activities
b) Monitoring of outputs i.e the reaction to specific marketing activities such as
the number of responses to an advertising campaign;
c) Monitoring of inputs in terms of resources invested in specific marketing
activities;
d) Measuring of impact i.e quantifying the benefits of the activity and the degree
to which objectives have been met, such as the amount of tourist expenditure
in a destination that is directly attributable to specific marketing activities.
e) Measuring of impact relative to input, i.e the benefits achieved in relation
to the cost (return on investment) of specific marketing activities. In the past,
NTOs have been using inbound visitor figures as indication of each,
penetration and influence, thereby, implicitly using those figures to judge the
success or failure of promotional and publicity activities. It is, however, not
really a sufficient and accurate indicator of performance. Both behavioral and
187
communication measures are now being developed by various
countries for the measurement of impact of promotional activities. The
countries like United Kingdom and Netherlands have been even able to
quantify the additional tourism expenditure that they generate for their
destination each year, calculate the overall return on investment they achieve
from Government funds and estimate the percentage of all inbound tourism
expenditure directly attributable to their activities.
Behavioural measures quantify the behaviour of people exposed to promotional activities.
These include
• trips or visitor numbers and profiles by type of trip, nationality, socio – economic
status, etc
• visitor revenue calculated per head/per day/per trip and then grossed up to estimates
of destination totals and
• occupancy of different accommodation types by bed and room and/or attractions and
events.
Tourism performance indicators can also be in the input/output ratio models like (i) cost
per tourist trip (ii) cost per tourist spend, (iii) promotional cost per tourist trip (iv) cost
per enquiry, etc.
There can also be segmented models which measure performance in relation to ‘priority’
or ‘target’ customers. Such measures can be useful for benchmarking a destination’s
performance against competition. Conversion studies strive to measure the number of
incremental trips, bookings or revenue generated through specific promotional activities.
These studies depend upon a response mechanism or call to action being built into the
activity, e.g, a coded reply coupon in press advertisements, or a toll free number for
broadcast campaigns. Names and addresses of enquires are recorded and random sample
is later re-contacted through a survey to find out whether or not they actually undertook
trips on the strength of the information received, or planned to do so in future.
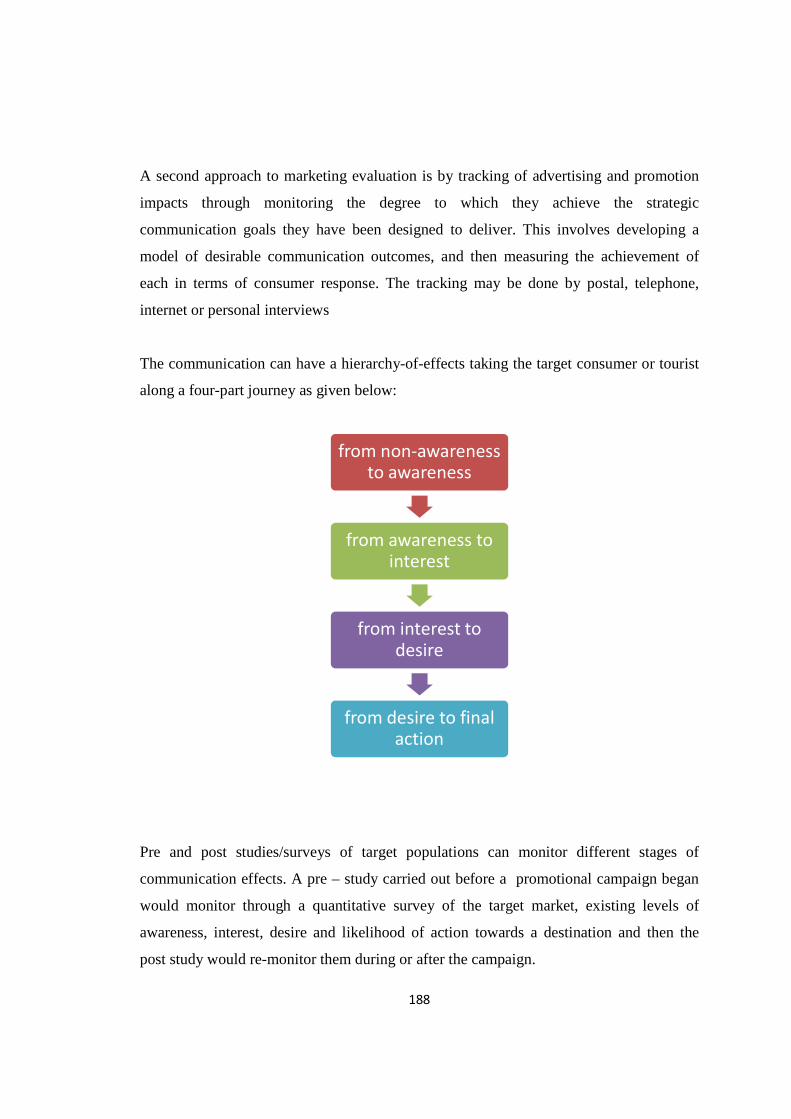
188
A second approach to marketing evaluation is by tracking of advertising and promotion
impacts through monitoring the degree to which they achieve the strategic
communication goals they have been designed to deliver. This involves developing a
model of desirable communication outcomes, and then measuring the achievement of
each in terms of consumer response. The tracking may be done by postal, telephone,
internet or personal interviews
The communication can have a hierarchy-of-effects taking the target consumer or tourist
along a four-part journey as given below:
Pre and post studies/surveys of target populations can monitor different stages of
communication effects. A pre – study carried out before a promotional campaign began
would monitor through a quantitative survey of the target market, existing levels of
awareness, interest, desire and likelihood of action towards a destination and then the
post study would re-monitor them during or after the campaign.
from non-awareness to awareness
from awareness to interest
from interest to desire
from desire to final action
189
Destination image and branding evaluation embrace quantitative dimensions to
promotional/advertising tracking. The identification and monitoring of the brand values
associated with destinations are accomplished through tracking surveys and through
programmes of qualitative motivational research designed to determine the imagery,
attitudes and beliefs held by tourists about specific destinations.
Experimental Market Testing is another evaluation approach designed to measure the
specified causality and combines both behavioral and communication measures. The
principle is to undertake a trial – run of promotional variables, e.g a new advertising
campaign or a new brand design. Generally market testing is tried in one geographical
region and expanded later if its tourism generating results and consumer attitudes show
improvement over the areas where the campaigns/activities are not operating ie. control
areas. This approach was used by the Scottish Tourist Board in developing special
promotional activities directed to its prime English markets.
The discrete activities of National Tourism Organisations (NTOs) like (i) advertising,
(ii) press, PR and media relations, (iii) customer information services, (iv) consumer fairs
and exhibitions, (v) trade events and support, (vi) festivals and (vii) websites, etc can be
evaluated for effectiveness and cost efficiency by adopting one or more methods. All
evaluation exercises involve extensive use of market surveys, qualitative research and
sophisticated statistical analysis. In other words market research is an essential
requirement at all stages of marketing planning, execution and evaluation.
6. Analysis and Recommendations
In the context of intense competition from about 200 National Tourism Organisations
(NTOs) around the globe for improving their share of tourism revenue with limited
marketing resources, extensive market research and indepth analysis of market trends
have assumed great significance to evolve cost-effective and result oriented marketing
190
strategies. International passenger surveys, overseas market surveys, monitoring of visitor
arrivals and gathering market intelligence from various sources are the major instruments
available for market research. The resources and capabilities for the conduct of these
surveys exist either within the NTOs or National Statistical Organizations (NSOs). These
surveys are critically important in assessing market trends and profiles of tourists,
monitoring tourist satisfaction levels, undertaking market segmentation analysis and
estimating the revenue earnings from tourism. It is, therefore, recommended that
regular arrangements may be made for the conduct of International Passenger
surveys on an annual basis and undertaking in-depth analysis of data thus collected.
Tracking and conversion studies are important in evaluating the impact of various
promotional campaigns in terms of meeting the specific objectives of such
communications and the net result in terms of number of persons converted into actual
tourists. It is, therefore, recommended that tracking and conversion studies may be
undertaken in overseas markets being exposed to major publicity campaigns.
Overseas market surveys are essential for gathering in-depth knowledge about the source
markets including the travel behavior of various segments of population, influences of
media and travel intermediaries, activities of competing destinations, etc. It is, therefore,
recommended that highly focused overseas market surveys with clearly defined
objectives may be undertaken in countries with significant market share or growth
potential Evaluation of on-going promotional efforts to assess its effectiveness in terms of
achieving the communication goals and changing the travel behaviour of target groups
has a significant role in modifying the market strategies to make them highly cost-
effective and result oriented.
The starting point in such evaluations is monitoring of inputs and outputs in terms of
resources invested in specific marketing activities and reactions to such activities as the
number of enquiries received. The tourist offices located in source markets generally
maintain databases of those responding to various advertisements through telephone,
internet or post. These databases are significantly useful for conducting follow up surveys
191
and conversion studies. The databases of such respondents are also useful for conducting
online overseas market surveys. It is, therefore, recommended that the overseas tourist
offices of India may be facilitated to create and maintain such databases and shared with
the Market Research Division to plan and execute various surveys.
In order to gain up-to-date knowledge about source markets in a relatively cost effective
manner, online surveys of travel intermediaries with India packages can be conducted in
each market provided the databases of such travel agents and tour operators are
maintained up-to-date. It is therefore, recommended that the overseas tourist offices of
India may be facilitated to create and maintain such database and share them with the
Market Research Division of the Ministry. Quarterly trade surveys may be conducted in
major markets by using such databases for obtaining market intelligence on a continuing
basis.
The overseas tourist offices may also be facilitated to collect and document details of
economic and political situation in source markets, trends in outbound traffic, emerging
fashionable destinations, promotional and marketing efforts of competitors and other
developments having a bearing on tourist traffic to India and provide the same to Market
Research Division on a quarterly basis for undertaking market specific forecasting
studies.
The Market Research Division of the Ministry may be strengthened to take up the above
activities effectively and efficiently.
192
Indian Scenario
Market Research in tourism in the case of India is carried out by the Market Research
Division of the Ministry of Tourism which has the responsibilities of policy formulation,
planning, product and infrastructure development, human resource development,
overseas promotion and publicity, domestic tourism development, national and
international coordination, industry regulation and control, etc. The Market Research
Division is, therefore, required to provide input for decision making on each of the above
fields of activities and thus it is functioning as an agency for the development of a system
of tourism statistics in the country rather than as a pure market research agency. As a
result market research activities often do not get the requisite priorities leading to
inadequate research inputs for the formulation of overseas marketing strategies, its
monitoring and evaluation.
The Market Research Division maintains the statistics of inbound tourism based on the
data provided by the Bureau of Immigration which is responsible for immigration
control. The Division brings out monthly statistical bulletin indicating month-wise tourist
arrivals, and highlights of tourist arrivals,annually giving country-wise tourist arrivals
along with their profiles. Another annual publication is India Tourism Statistics which
includes data on countrywise tourist arrivals, seasonality in arrivals, foreign exchange
earning from tourism, domestic tourism statistics, number of visitors to monuments,
statistics of approved hotels, statistics of travel agents, tour operators and tourist transport
operators, training institutes, plan outlays and financial assistance provided to states,
results of some of the surveys and studies, financial assistance provided by Tourism
Financial Corporation of India, etc.
Domestic tourism statistics are obtained from Sate/UT Governments on the basis of data
sets provided by accommodation establishments and estimates of foreign exchange
earning are provided by the Reserve Bank of India. The system of collecting domestic
tourism statistics by the, State/UT Government requires substantial strengthening and
technical guidance.

193
International Passenger Surveys are generally undertaken once in five years and a
domestic tourism survey is currently under completion by the National Sample Survey
Organization (NSSO). The earlier domestic tourism survey commissioned by the
Ministry did not address the issues of interstate tourist movements, trip planning, travel
patterns, etc. The Ministry also commissioned an evaluation study of overseas publicity
and promotion.
194
SUGGESTIONS India receives three million foreign tourists a year while a small country like Thailand,
with much more limited geographic and historical attraction, receives more than three
times that number and they plan to double it to 20 million tourists in the next decade.
The importance of tourism is not only the foreign exchange it brings in but, more
importantly, in the employment it generates at several locations and in several layers of
society – ranging from airline staff to hotel employees and taxi wallahs.
India is yet to be marketed to its full potential as a tourist destination. Let us explore
some possible ways of marketing India in new ways.
The first step in any marketing exercise is to identify the customer and his or her needs
and inclinations. Tourism is a leisure occupation for those who can afford it. The major
sources of such tourist are three richest regions of the world, viz. the US, Western
Europe, and Japan. And in those regions, the target groups that we have to attract are
people who have the time and money.
These are usually people who have retired and can afford to explore the world outside
their own immediate reach. The younger backpackers or student type of tourists are not
sufficiently well funded. Therefore they are not our primary target group although they
should also be encouraged and welcomed to this country as they can be our brand
ambassadors to the older generations of their countrymen, and some day when they can
afford it, come back with their families.
Taking our primary target group of retired people, there is one common characteristic
among such people throughout the world. They like to play golf and explore history,
religions and arts for which they had little time when they were busy with their careers.
So, far the Indian tourism industry has focused on selling ancient, medieval and Mughal
India, the temples and forts of ancient days. This is good but isn’t enough. We need to
explore opportunities for leisure tourism. There are people who come to enjoy India’s
winter sun, and so Goa has been marketed, but India has many more beaches. India’s hill
195
states can attract more tourists than Nepal does, but Uttaranchal and Himachal Pradesh
are not as organized as Nepal for trekkers and mountain lovers.
The Japanese and Chinese will willingly do the Buddhist circuit in much greater
numbers, if we can organize a pleasant experience for them in Bihar. Our colonial history
presents its own opportunities. We as a nation have become confident enough in our
standing and achievements that we can rise above anti-colonial feelings and talk about
the colonial period without inhibition or resentment. Although four centuries ago the
Mughals colonized India and even converted our people to their religion, today we take
pride in showing tourists monuments like the Taj Mahal as the pride of India.
With the passage of time, the same is happening to the monuments and cities built by the
European colonizers – the Portuguese, the Dutch, the French and the British. For a
European tourist it is often more interesting to see remnants of the adventurers from their
own countries. Fortunately, we have several such monuments and sites bearing witness to
the history of our European colonizers. We should use them to market our country. Foe
instance, Pondicherry has several remnants, including the use of French language. In
France school children are still taught about the French empire in India, which consisted
of Pondicherry, Mahe, Karaikal and Chandan Nagar. Of these , Pondicherry is the most
attractive and easily accessible from Madras. If our tourism ministry produced a film in
French about Pondicherry and showed it as an advertisement on French television, it
would boost French tourism in India. From Pondicherry a French tourist can go to
Mysore, where Tipu Sultan, an ally of the French fought the British alongwith the French
.The story of Vasco d agama, the first European to reach our shores by sea, will be of
immense interest to most Europeans. He lies buried in Cochin in a church which is still
standing.
Inside the walls of Fort St George in Chennai, there is a small church, St Mary’s, where
Clive, the founder of the British Empire, was married. St. Thomas mount and Santhome
cathedral in Madras are other historical monuments from Portuguese times.
196
The other legacy of the British is the plantations of the Nilgiris on the Eastern side and
Munnar on the western side. The pioneering British planters braved malaria and wild
animals to create the rubber, coffee, and tea estates which are totally Indian-owned today.
A drive from Ooty and Conoor over the hills to Munnar can combine history with the
most beautiful sights of nature in India. On the way one can see how wild elephants are
captured and trained systematically and humanely to become useful vehicles for the
movement of heavy timber in difficult terrain.. There are very few locations in the world
where this can be seen. A travel on this section of India in itself can be a great
advertisement for India.
A drive from Munnar to Cochin is an essay in the beauty of nature. Tea plantations give
way to coffee estates and then to rubber estates as we descend and suddenly we break out
into plains with rice fields and coconut groves. We can end up in some fine hotels,
located on the shores of the backwaters of Kerla, the like of which one can never see
anywhere else in the world.
197
13 . Scope for further Research There has been a period of wealth reduction in the developed world and it will take years
for consumers to rebuild this lost wealth. There has been a dramatic impact on
companies. Brand names like Saab, Woolworths and MFI are no more and in the travel
sector there has been the collapse of XL Leisure, Silverjet, Maxjet, Eos and Globespan.
Most recently JAL entered bankruptcy and British Airways states that it is in a fight for
survival. It is clear that this recession takes no prisoners.
Willie Walsh, chief executive of British Airways, made a prediction in 2009 that up to 30
airlines would disappear. Some of this will be the result of consolidation and there is a
view that there will be only five or six global airlines by the end of this recession. There
is already structural change taking place in transport and when Warren Buffet buys a
railway, you know there is something interesting going on.
The Futures Company describes this phenomenon as a ‘Darwinian Gale’ akin to the kind
of catastrophic events that wipe the biological or geological slate clean. There is a sense
that this is not just about wealth. This economic downturn has been accompanied by
significant demographic shifts and the early signs of energy and water shortages. In this
sense it could signal a very different future for travel.
Long-term forecasts : The longer-term UNWTO forecast is for a return to average
growth levels with world tourism generating 1.6 billion trips by 2020 . Their Tourism
2020 Vision Forecast emphasises the economics of travel. The desire to travel is strong,
but it can only be realised when people have provided for more basic aspirations such as
a secure income, education for their children, housing and health provision.
Once that is achieved, travel becomes an option and the commonest type of travel is intra
regional. This is where the greatest growth will be seen in the next decade – especially in
Asia.
198
Existing uncertainties and possible outcomes : This all looks reassuring, but there is a
view that these predictions are based on extrapolations from past travel patterns and may
miss some more fundamental shifts taking place in the world – the Darwinian Gale.
So, many travel consumers are under pressure. They are fighting to keep their dreams
alive, anxious, and suspicious of promises made by companies and governments, but very
keen to enjoy the treats they can afford. The travel industry is under pressure to deliver
the ‘treats’ and is likely to experience much higher levels of disappointment and
complaint if it fails.
Will people fall out of love with travel? No. They will hold on to the dream but will adapt
to new circumstances as they always have done. They might fall out of love with airports
(although many probably already have), people might abandon stag weekends, £1 flights
to somewhere unpronounceable, impulse trips, booze cruises to France, a few less
festivals, and all the excesses of the noughties.
The challenge for the travel and tourism industry is to be ready.
199
Appendix 7 : Budget 2009-’10: Blueprint for change?
The Union Budget 2008-09 was a disappointment for the tourism and hospitality sector. As the countdown
to the forthcoming Union Budget begins amidst a downturn in the tourism economy, the industry is keeping
its fingers crossed for more fiscal benefits and greater respite from taxation. By Andrea Lopez
The finance minister's announcement at last year's Union Budget of a five year tax
holiday for the setting up of three and four-star hotels in the Delhi NCR region until
March 2010 was perhaps the only direct reference to support India's lucrative tourism
industry. While the downturn in the global economy has slowed down outbound travel,
the pace of domestic travel continues to be almost consistent. Experts feel that at this
crucial juncture, the government needs to provide incentives to local operators to
encourage participation from regional areas.
Says Subhash Goyal, chairman, STIC Travel Group and Tourism Committee,
ASSOCHAM, "The revised policy for FDI has definitely helped the civilised sector but a
lot needs to be done for giving incentives to tour operators and travel agents."
According to a report published by HVS - a global consulting and services organisation,
travel and tourism being a labour-intensive industry, generated three crore jobs in India in
2008, in other words, one in every 15.6 job positions in the country were in the tourism
industry. In China, 7.5 crore jobs were created. Clearly, this points to the fact that the
world's most populous nations - China and India, have been reaping benefits from the
employment generating potential of this sector. This is particularly true of India, as the
country's economic transformation relies on the services model, while that of China relies
on manufacturing-for-export industries. The Union Budget had proposed an outlay of
approximately Rs 520 crore for development of tourism infrastructure in 2008-09. This is
an increase of nearly Rs 97 crore since the previous year. However, the report states that
even with this figure, it led to only one per cent of the total government spending on a
sector that contributes six per cent to the GDP and generates millions of jobs.
At the macro level, the issues that need to be raised continue to do with developing
infrastructure, airports, roads and overall connectivity. Says Sanjay Sethi, MD and CEO,
200
Berggruen Hotels, "Tourism relies heavily on infrastructure of cities. Specifically,
airports, railways and roads as macro issues; and quality of facilities and upkeep of places
of tourist interest as next level issues. Unfortunately very little is being done on all these
fronts. It is critical for the government to address infrastructure issues specifically with
tourism in mind as India is missing out massively on the dollar earning potential of the
tourism industry." He adds, "Good quality inter-state roads should be first priority. We
need larger outlays for facilities at national monuments, parks and religious places.
Privatisation of airports is the right direction under the Build-Operate-Transfer scheme
and should continue to be the way forward." The seventh five-year plan for the period
1985-1989 proposed that tourism be conferred with 'industry' status. According to the
proposal, the status would entitle tourism to secure several advantages in project funding,
exemption from local taxes for the first few years, subsidised power tariffs, etc. However,
the decision and implementation was left to the states and till date only a few granted
'industry' status to tourism over the course of the last two decades including Goa, Sikkim,
Uttar Pradesh, Arunachal Pradesh, West Bengal, Jharkhand, Haryana, Daman and Diu,
Uttarakhand, Dadra and Nagar Haveli and Jammu and Kashmir. Regions like the North
East, despite their immense potential for tourism, continue to remain largely ignored by
mainstream tourism. The good news however is that budget allocations to the region have
gone up. The total budget allocation in 2007-08 for the North Eastern Region from
allocations under different ministries/departments has increased from Rs 12,041 crore in
2006-07 to Rs 14,365 crore in 2007-08. This includes Rs 1,380 crore provided to the
Ministry of Development of North Eastern Region (DoNER). The new industrial policy
for NER, with suitable fiscal incentives has also been put in place since March 31, 2007.
Not wanting to leave out the potential of developing surface transport, the Union Budget
last year proposed to increase the provision for the National Highway Development
Programme (NHDP) from Rs 9,945 crore in 2006-07 to Rs 10,667 crore. Work on the
Golden Quadrilateral is nearly complete and there is considerable progress in the North-
South, East-West corridor project which is expected to be completed soon. NHDP-III,
NHDP-V and NHDP-VI are in advanced stages of planning or implementation. So far,
National Highways Authority of India (NHAI) has given Rs 2,072 crore as viability gap
201
funding but has also received Rs 1,900 crore as negative grant. The private sector
investment leveraged under NHDP is Rs 25,366 crore. Under the programme for the
North Eastern Region (SARDP-NE), 450 kilometres have been awarded in 2006-07 and
the balance will be awarded in 2007-08. The road-cum-rail bridge at Munger, Bihar, over
the Ganga, has been taken up as a national project. Likewise, the road-cum-rail bridge at
Bogibeel, Assam, over the Brahmaputra, will also be taken up as a national project.
While all this is good news, the need for uniform taxes for interstate transport is required.
Remarks Goyal, "As far as transport is concerned, at every state border, tourist transport
companies are hassled. When a person can travel on Indian railways from North to South
or East to West without any issues, then I fail to understand why can't one travel by
surface transport conveniently?"
The Public Private Partnership (PPP) model is another area that if tapped in the right
direction, has immense potential. At the Union Budget 2008-09, the then finance minister
P Chidambaram declared his intention to set up a revolving fund to quicken project
preparation, and hence tap the model better. He said, "I intend to set up a revolving fund
with a corpus of Rs 100 crore to quicken project preparation. The fund will contribute up
to 75 per cent of the preparatory expenditure in the form of interest free loan that will be
eventually recovered from the successful bidder."
Overcoming tax blues
A steep taxation regime continues to be a major dampener for the hospitality sector.
Earlier, tax incentives available under Section 80HHD of the Income Tax Act, 1961
allowed 50 per cent of the profits attributable to the foreign exchange earnings of hotel
companies to be directly exempt from tax and the other 50 per cent, if reinvested in the
hotel sector (as capital for the sector's growth) also exempt from taxation. This was
considered to be a good tool to aid hotel development till 2005-06. "The hotel industry
was given an industry status by the Central Government some years back but the same
has not been formalised at the state level and the industry benefits of power tariff is not
available to the hotel industry. This is a major disparity that needs urgent attention.
Otherwise affordable hotels will be a distant dream for the middle classes of India," says
202
Sethi. Ajay Prakash, national general secretary, TAFI adds, "Hotel tariffs tend to be
rather cyclical. They have been zooming up for the last four or five years with steep
increments year-on-year. We have reached a peak of sorts last year and now, perhaps, it
is time for the downslide, as can be seen currently. The problem really lies in the fact that
hotel rooms in India do not provide value for money as compared to other Asian
destinations. The problem is exacerbated by the fact that starred accommodation falls
woefully short of demand and until that can be addressed, there is no way to find a long
term solution. The answer might lie in the government providing additional incentives for
building new hotels."
For a country of India's size and potential, the ratio of hotel rooms is disproportionate to
the population. India has approximately 2,000 registered hotels with a total room count of
approximately 1,20,000 rooms. There is a serious shortage of hotels across every
category and city in India. According to HVS, this an opportune time to invite all
stakeholders in tourism to discuss short and long-term measures that can help realise the
true potential of these 'sunshine' sectors. The present global economic crisis and the
unfortunate attacks in Mumbai have slowed down the short-term prospects of the country
and adversely impacted the aviation and hospitality sectors. Another burning issue is the
electricity duty imposed on hotels and restaurants. Presently hotels are charged the
commercial rate of 13 per cent. This is against the rate of six per cent levied on industrial
units. "Nearly a hundred restaurants have closed down in Mumbai because of high
electricity charges. The government needs to realise that five star categories are not the
only segment; smaller hotels are being badly affected because of this. We have requested
the government of Maharashtra to grant 100 per cent relief on electricity duty for a period
of two years. We need the union budget this year to provide relief to the hospitality
sector," said S P Jain, chairman, Pride Hotels and president Hotel and Restaurant
Association (HRA).
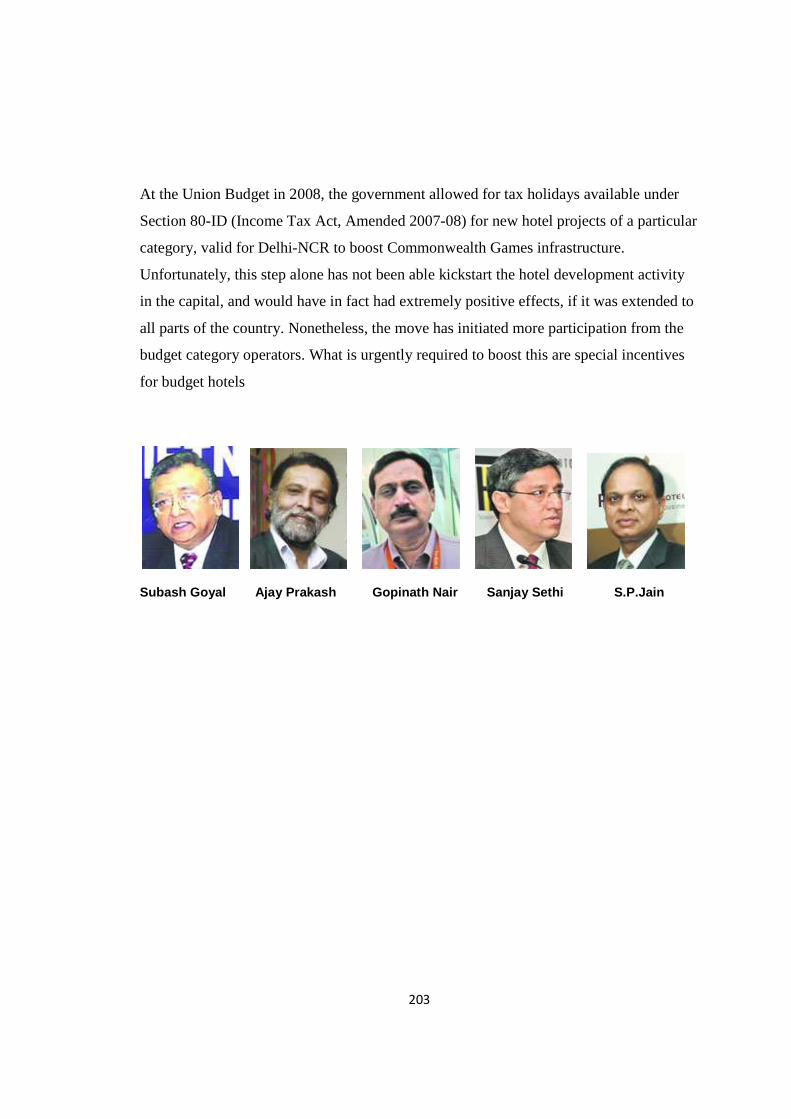
203
At the Union Budget in 2008, the government allowed for tax holidays available under
Section 80-ID (Income Tax Act, Amended 2007-08) for new hotel projects of a particular
category, valid for Delhi-NCR to boost Commonwealth Games infrastructure.
Unfortunately, this step alone has not been able kickstart the hotel development activity
in the capital, and would have in fact had extremely positive effects, if it was extended to
all parts of the country. Nonetheless, the move has initiated more participation from the
budget category operators. What is urgently required to boost this are special incentives
for budget hotels
Subash Goyal Ajay Prakash Gopinath Nair Sanjay Sethi S.P.Jain
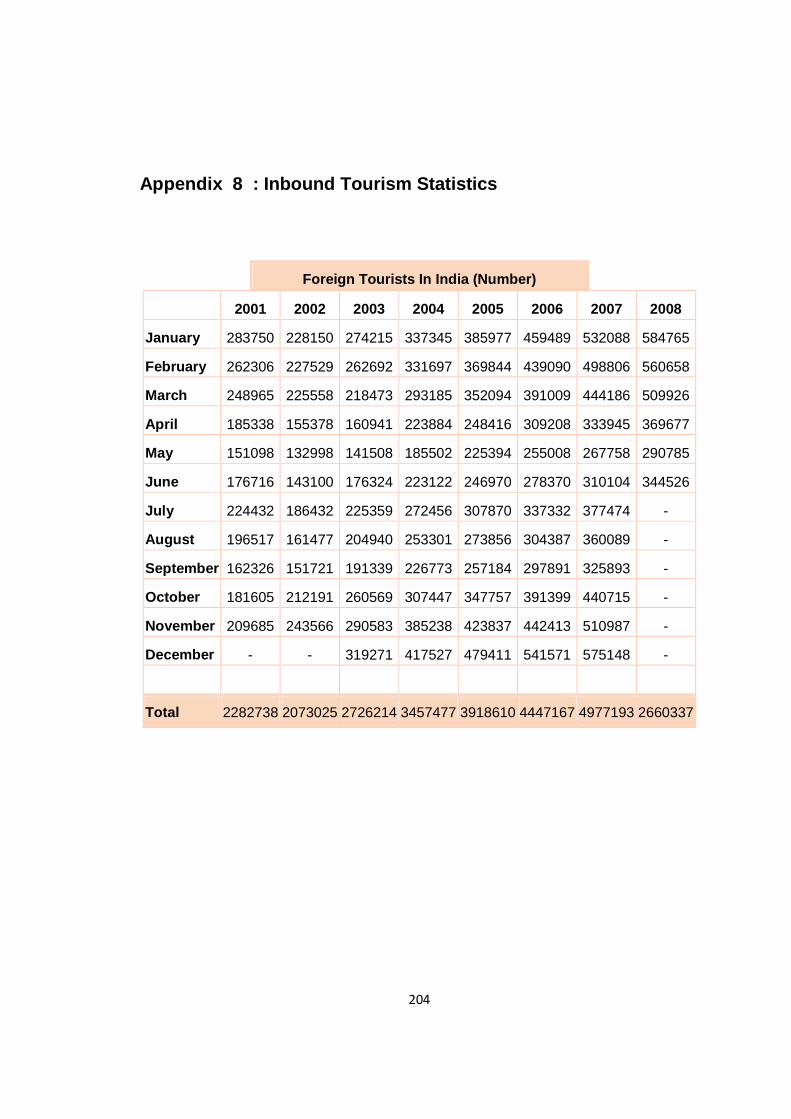
204
Appendix 8 : Inbound Tourism Statistics
Foreign Tourists In India (Number)
2001 2002 2003 2004 2005 2006 2007 2008
January 283750 228150 274215 337345 385977 459489 532088 584765
February 262306 227529 262692 331697 369844 439090 498806 560658
March 248965 225558 218473 293185 352094 391009 444186 509926
April 185338 155378 160941 223884 248416 309208 333945 369677
May 151098 132998 141508 185502 225394 255008 267758 290785
June 176716 143100 176324 223122 246970 278370 310104 344526
July 224432 186432 225359 272456 307870 337332 377474 -
August 196517 161477 204940 253301 273856 304387 360089 -
September 162326 151721 191339 226773 257184 297891 325893 -
October 181605 212191 260569 307447 347757 391399 440715 -
November 209685 243566 290583 385238 423837 442413 510987 -
December - - 319271 417527 479411 541571 575148 -
Total 2282738 2073025 2726214 3457477 3918610 4447167 4977193 2660337
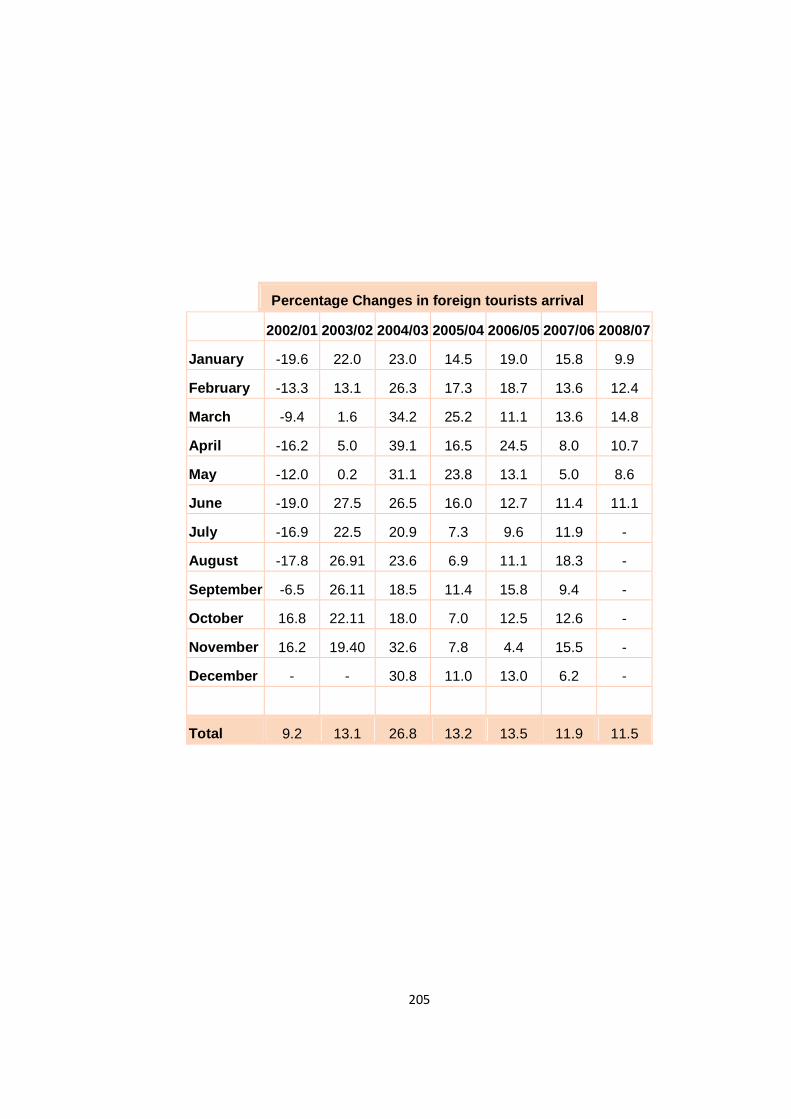
205
Percentage Changes in foreign tourists arrival
2002/01 2003/02 2004/03 2005/04 2006/05 2007/06 2008/07
January -19.6 22.0 23.0 14.5 19.0 15.8 9.9
February -13.3 13.1 26.3 17.3 18.7 13.6 12.4
March -9.4 1.6 34.2 25.2 11.1 13.6 14.8
April -16.2 5.0 39.1 16.5 24.5 8.0 10.7
May -12.0 0.2 31.1 23.8 13.1 5.0 8.6
June -19.0 27.5 26.5 16.0 12.7 11.4 11.1
July -16.9 22.5 20.9 7.3 9.6 11.9 -
August -17.8 26.91 23.6 6.9 11.1 18.3 -
September -6.5 26.11 18.5 11.4 15.8 9.4 -
October 16.8 22.11 18.0 7.0 12.5 12.6 -
November 16.2 19.40 32.6 7.8 4.4 15.5 -
December - - 30.8 11.0 13.0 6.2 -
Total 9.2 13.1 26.8 13.2 13.5 11.9 11.5
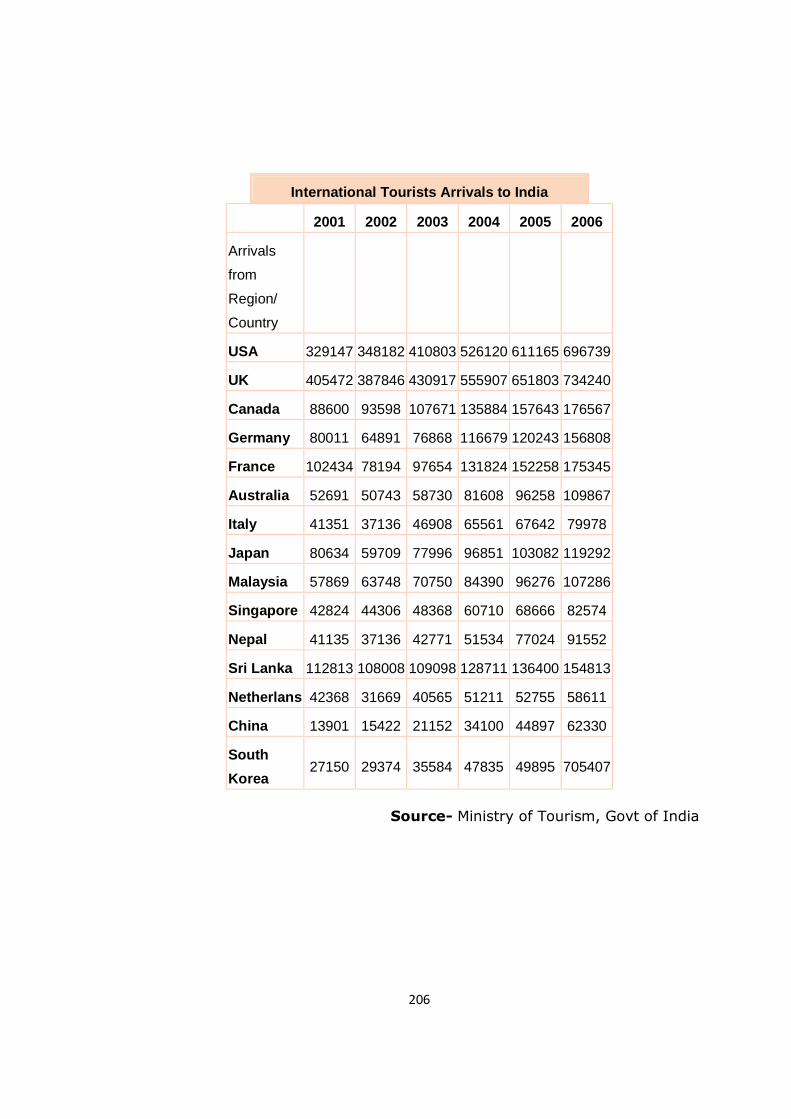
206
International Tourists Arrivals to India
2001 2002 2003 2004 2005 2006
Arrivals
from
Region/
Country
USA 329147 348182 410803 526120 611165 696739
UK 405472 387846 430917 555907 651803 734240
Canada 88600 93598 107671 135884 157643 176567
Germany 80011 64891 76868 116679 120243 156808
France 102434 78194 97654 131824 152258 175345
Australia 52691 50743 58730 81608 96258 109867
Italy 41351 37136 46908 65561 67642 79978
Japan 80634 59709 77996 96851 103082 119292
Malaysia 57869 63748 70750 84390 96276 107286
Singapore 42824 44306 48368 60710 68666 82574
Nepal 41135 37136 42771 51534 77024 91552
Sri Lanka 112813 108008 109098 128711 136400 154813
Netherlans 42368 31669 40565 51211 52755 58611
China 13901 15422 21152 34100 44897 62330
South
Korea 27150 29374 35584 47835 49895 705407
Source- Ministry of Tourism, Govt of India
207
Facts to know
Tourists inflow from Australia
In the last three years the tourist arrivals from Australia to India have almost doubled to
a record figure of 1,00,000. However India aims to double tourist inflow from Australia
to two lakh in the next three years.
Tourists inflow from Britain
Every year about 3000,000 tourists from Britain visit India for both business as well as leisure.
Tourists to India spend more..
Tourists to India spent $ 372 on their visa cards in the year of 2005. This is a 25% rise
from the year 2004 thereby, making India the fastest growing Asia -Pacific market for
the International tourist spending. According to the World Travel and Tourism Council,
the Indian tourism demand will grow at an annual 8.8 % over the next ten years, fueled
by higher incomes and lower air fares.
Earnings on Tourism
In 2005 India earned US $ 6.9 billion from inbound foreign tourists, which is more than
twice the US $3.1 billion earned during the year 2002. According to the latest balance of
payments figures released by the Reserve Bank Of India, 2005 was the year of fastest
growth in forex nflows from foreign travel, during which inflows went up 36 %.
Leading Tourist destination
With nearly 140 three and two star hotels, Kerala has turned into a major hot spot for
foreign tourists. However Tamil Nadu hold t he second position in attracting foreign
tourists.
Mode of transport
Air continued to be the predominant mode of travel for the tourists coming to India.
However arrivals by sea were negligible.
208
Age- Group factor
An average foreign tourist is between age group of 20-40 years.
Best time for tourists arrivals
October to February is considered to be the peak season for travel by foreigners for
business as well as leisure purposes.
Employment generated by tourism in India
Tourism Industry provides employment to about 2 crores of people in India.
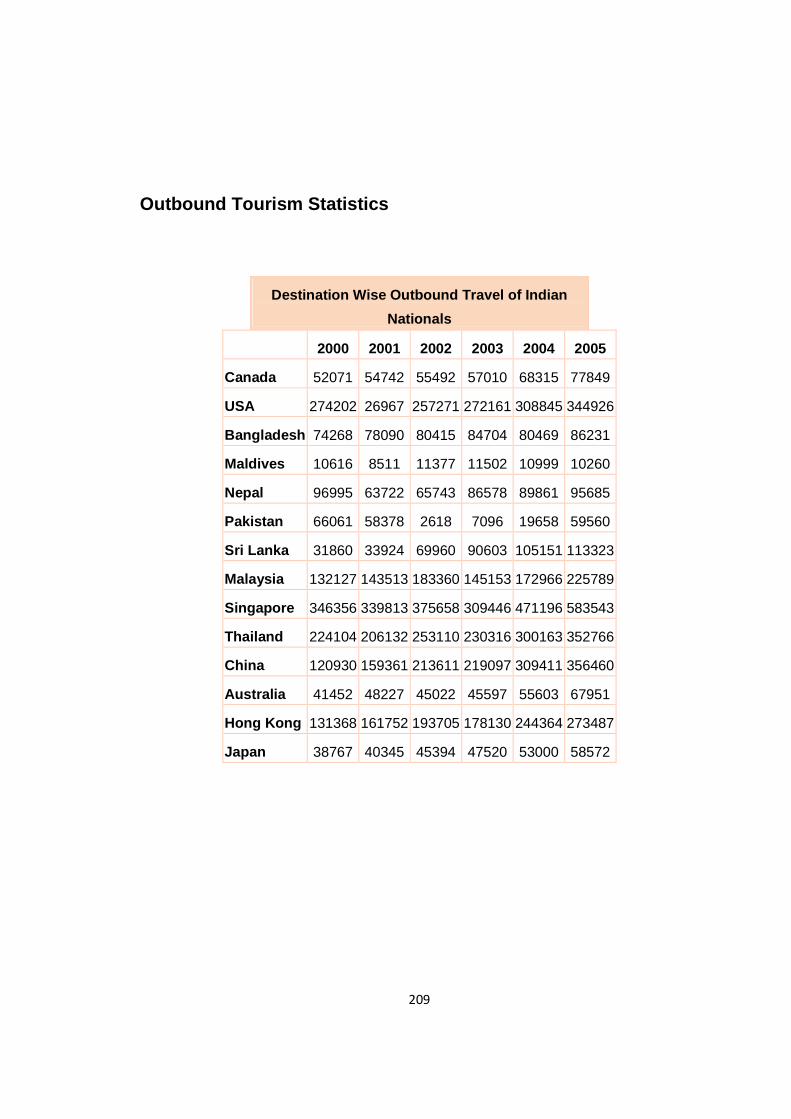
209
Outbound Tourism Statistics
Destination Wise Outbound Travel of Indian
Nationals
2000 2001 2002 2003 2004 2005
Canada 52071 54742 55492 57010 68315 77849
USA 274202 26967 257271 272161 308845 344926
Bangladesh 74268 78090 80415 84704 80469 86231
Maldives 10616 8511 11377 11502 10999 10260
Nepal 96995 63722 65743 86578 89861 95685
Pakistan 66061 58378 2618 7096 19658 59560
Sri Lanka 31860 33924 69960 90603 105151 113323
Malaysia 132127 143513 183360 145153 172966 225789
Singapore 346356 339813 375658 309446 471196 583543
Thailand 224104 206132 253110 230316 300163 352766
China 120930 159361 213611 219097 309411 356460
Australia 41452 48227 45022 45597 55603 67951
Hong Kong 131368 161752 193705 178130 244364 273487
Japan 38767 40345 45394 47520 53000 58572
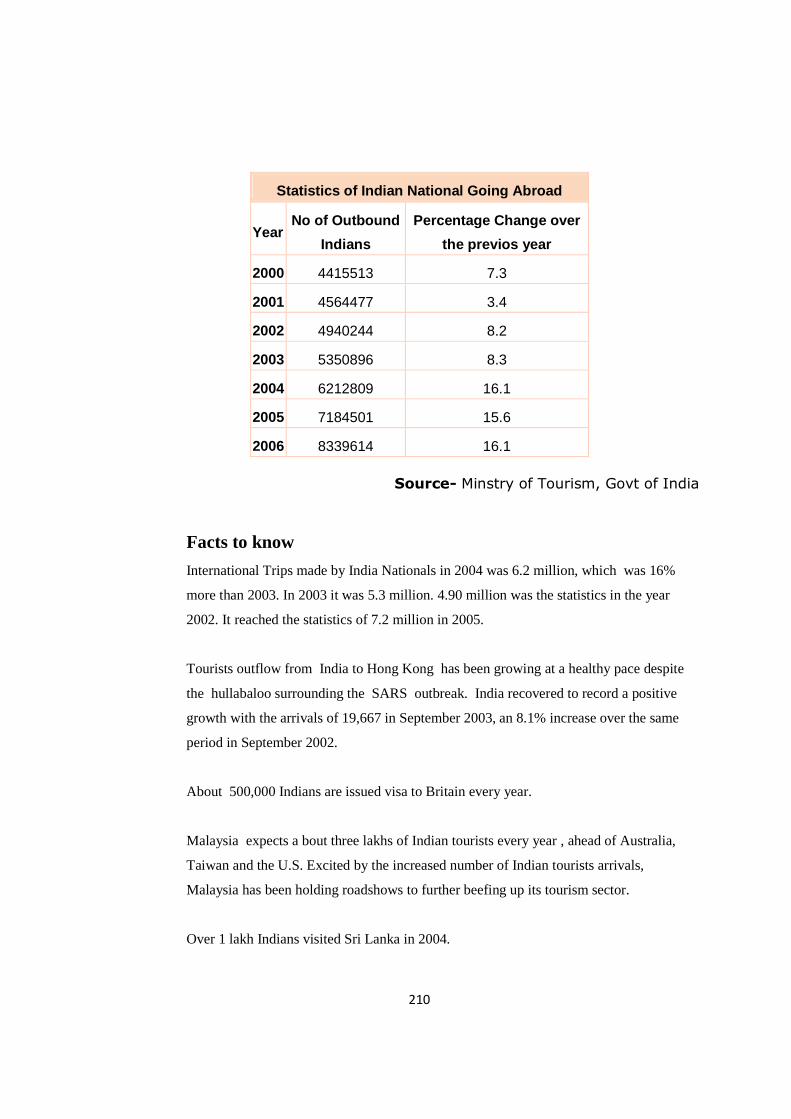
210
Statistics of Indian National Going Abroad
Year No of Outbound
Indians
Percentage Change over
the previos year
2000 4415513 7.3
2001 4564477 3.4
2002 4940244 8.2
2003 5350896 8.3
2004 6212809 16.1
2005 7184501 15.6
2006 8339614 16.1
Source- Minstry of Tourism, Govt of India
Facts to know
International Trips made by India Nationals in 2004 was 6.2 million, which was 16%
more than 2003. In 2003 it was 5.3 million. 4.90 million was the statistics in the year
2002. It reached the statistics of 7.2 million in 2005.
Tourists outflow from India to Hong Kong has been growing at a healthy pace despite
the hullabaloo surrounding the SARS outbreak. India recovered to record a positive
growth with the arrivals of 19,667 in September 2003, an 8.1% increase over the same
period in September 2002.
About 500,000 Indians are issued visa to Britain every year.
Malaysia expects a bout three lakhs of Indian tourists every year , ahead of Australia,
Taiwan and the U.S. Excited by the increased number of Indian tourists arrivals,
Malaysia has been holding roadshows to further beefing up its tourism sector.
Over 1 lakh Indians visited Sri Lanka in 2004.
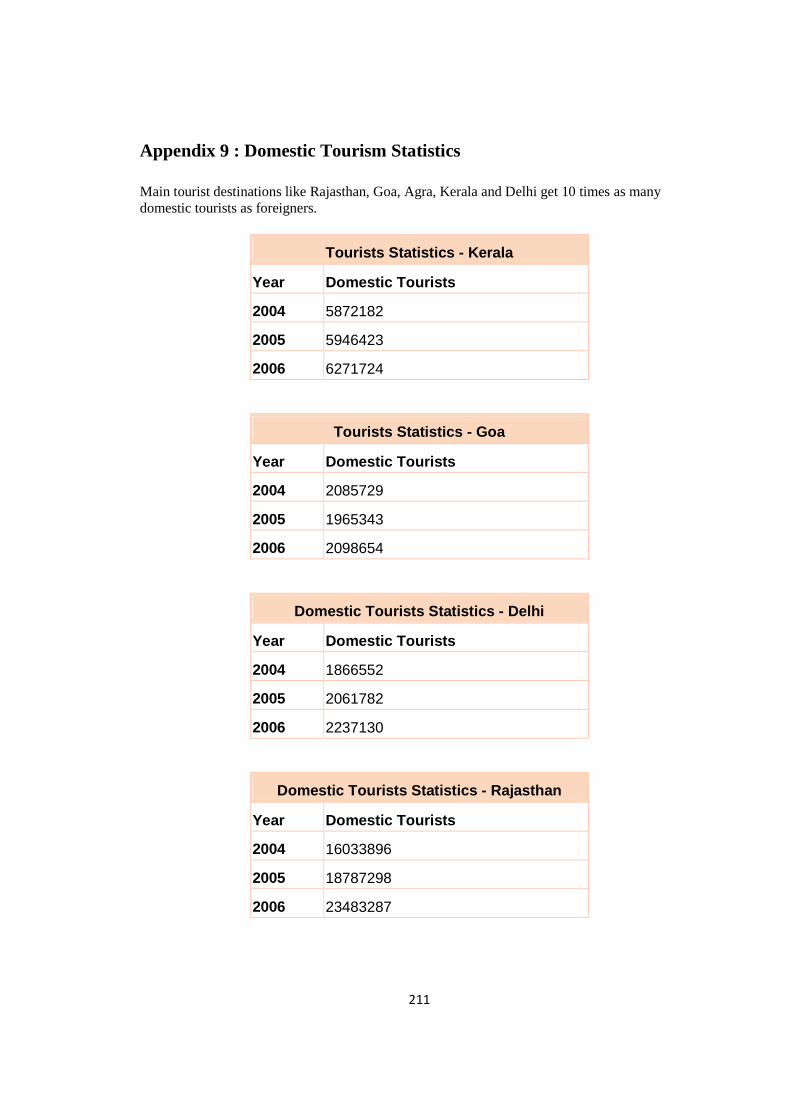
211
Appendix 9 : Domestic Tourism Statistics
Main tourist destinations like Rajasthan, Goa, Agra, Kerala and Delhi get 10 times as many domestic tourists as foreigners.
Tourists Statistics - Kerala
Year Domestic Tourists
2004 5872182
2005 5946423
2006 6271724
Tourists Statistics - Goa
Year Domestic Tourists
2004 2085729
2005 1965343
2006 2098654
Domestic Tourists Statistics - Delhi
Year Domestic Tourists
2004 1866552
2005 2061782
2006 2237130
Domestic Tourists Statistics - Rajasthan
Year Domestic Tourists
2004 16033896
2005 18787298
2006 23483287
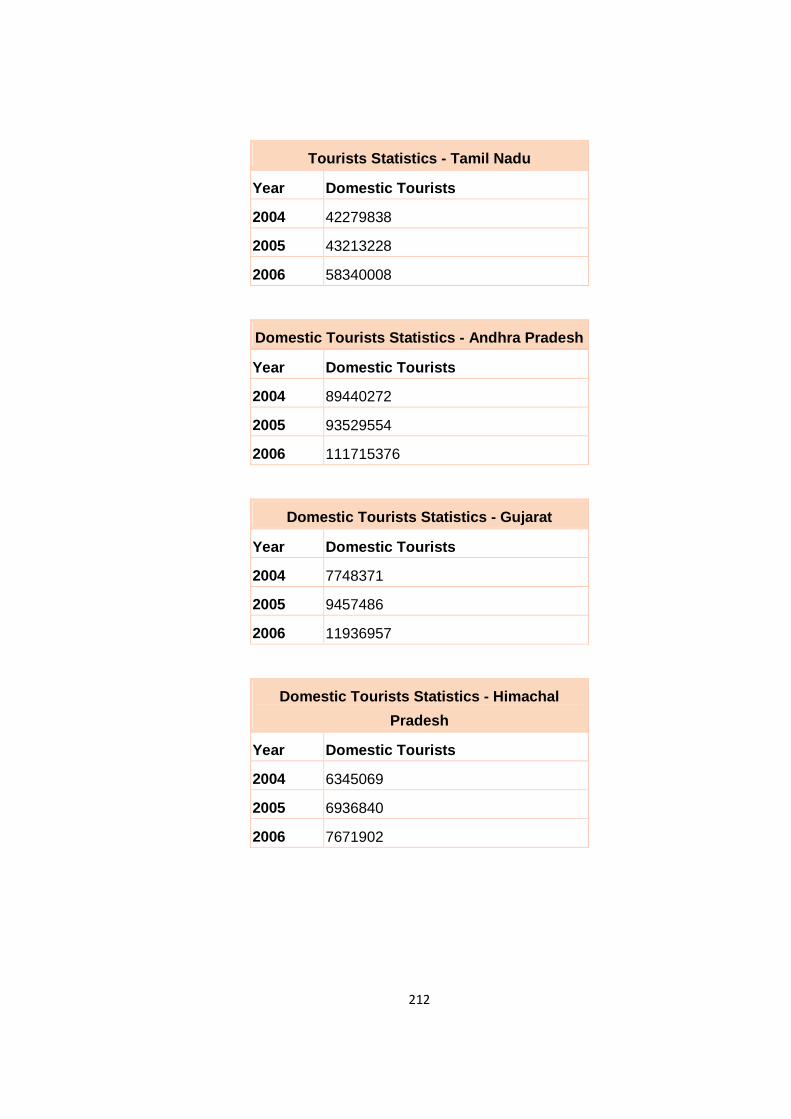
212
Tourists Statistics - Tamil Nadu
Year Domestic Tourists
2004 42279838
2005 43213228
2006 58340008
Domestic Tourists Statistics - Andhra Pradesh
Year Domestic Tourists
2004 89440272
2005 93529554
2006 111715376
Domestic Tourists Statistics - Gujarat
Year Domestic Tourists
2004 7748371
2005 9457486
2006 11936957
Domestic Tourists Statistics - Himachal
Pradesh
Year Domestic Tourists
2004 6345069
2005 6936840
2006 7671902
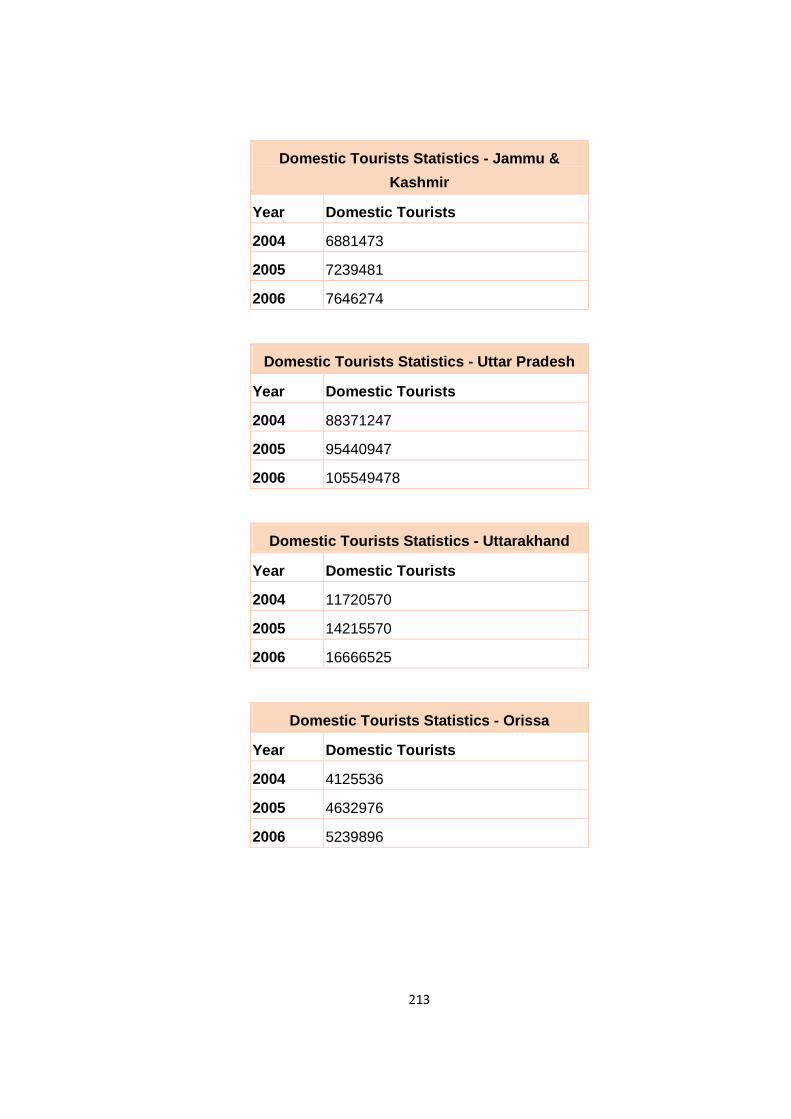
213
Domestic Tourists Statistics - Jammu &
Kashmir
Year Domestic Tourists
2004 6881473
2005 7239481
2006 7646274
Domestic Tourists Statistics - Uttar Pradesh
Year Domestic Tourists
2004 88371247
2005 95440947
2006 105549478
Domestic Tourists Statistics - Uttarakhand
Year Domestic Tourists
2004 11720570
2005 14215570
2006 16666525
Domestic Tourists Statistics - Orissa
Year Domestic Tourists
2004 4125536
2005 4632976
2006 5239896
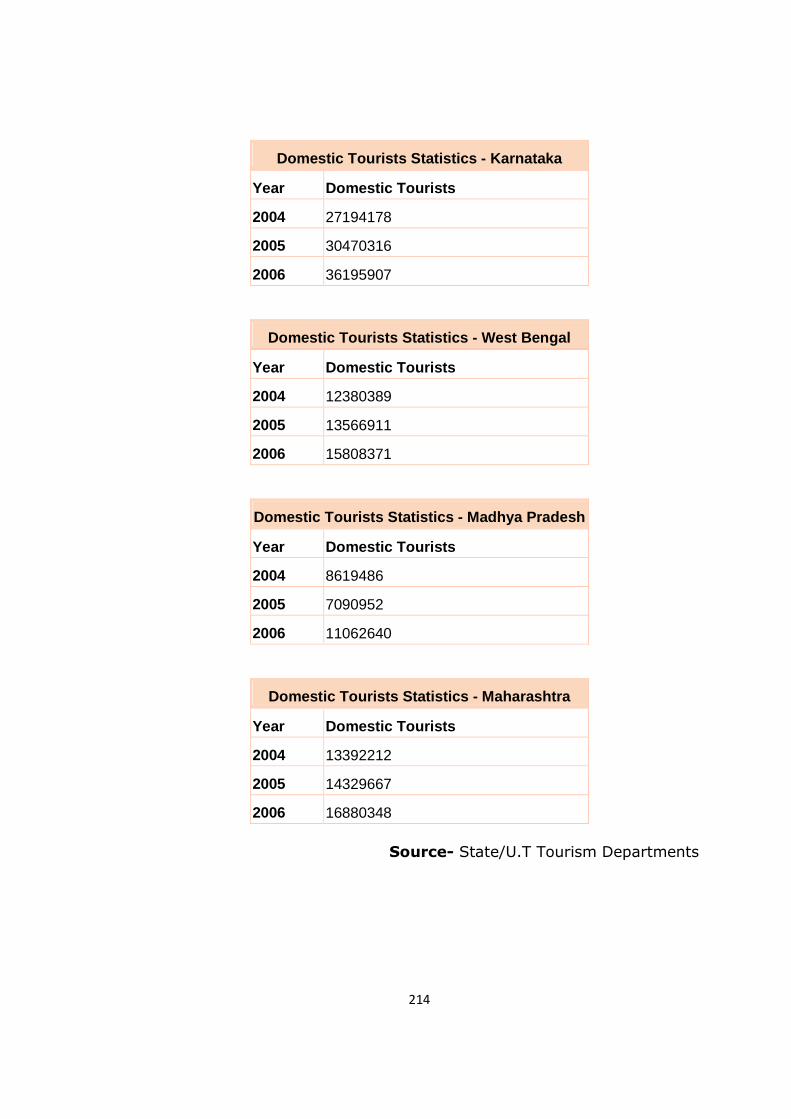
214
Domestic Tourists Statistics - Karnataka
Year Domestic Tourists
2004 27194178
2005 30470316
2006 36195907
Domestic Tourists Statistics - West Bengal
Year Domestic Tourists
2004 12380389
2005 13566911
2006 15808371
Domestic Tourists Statistics - Madhya Pradesh
Year Domestic Tourists
2004 8619486
2005 7090952
2006 11062640
Domestic Tourists Statistics - Maharashtra
Year Domestic Tourists
2004 13392212
2005 14329667
2006 16880348
Source- State/U.T Tourism Departments
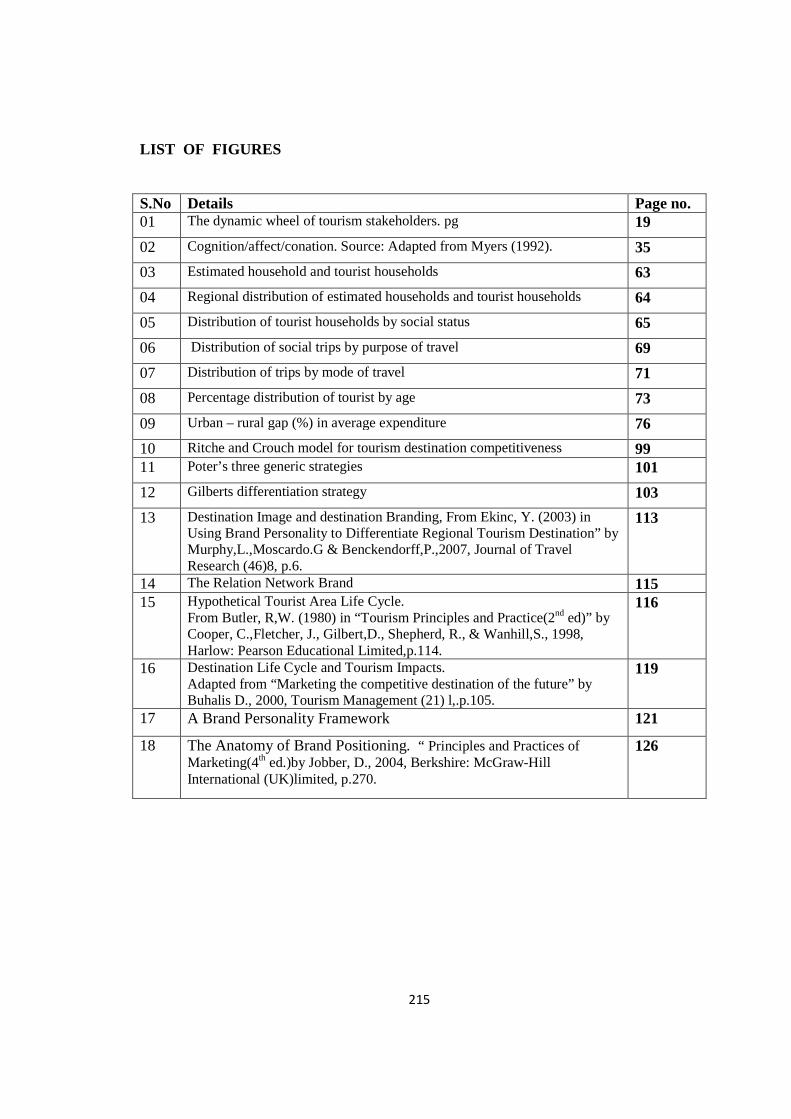
215
LIST OF FIGURES S.No Details Page no. 01 The dynamic wheel of tourism stakeholders. pg 19
02 Cognition/affect/conation. Source: Adapted from Myers (1992). 35
03 Estimated household and tourist households 63
04 Regional distribution of estimated households and tourist households 64
05 Distribution of tourist households by social status 65
06 Distribution of social trips by purpose of travel 69
07 Distribution of trips by mode of travel 71
08 Percentage distribution of tourist by age 73
09 Urban – rural gap (%) in average expenditure 76
10 Ritche and Crouch model for tourism destination competitiveness 99 11 Poter’s three generic strategies 101
12 Gilberts differentiation strategy 103
13 Destination Image and destination Branding, From Ekinc, Y. (2003) in Using Brand Personality to Differentiate Regional Tourism Destination” by Murphy,L.,Moscardo.G & Benckendorff,P.,2007, Journal of Travel Research (46)8, p.6.
113
14 The Relation Network Brand 115 15 Hypothetical Tourist Area Life Cycle.
From Butler, R,W. (1980) in “Tourism Principles and Practice(2nd ed)” by Cooper, C.,Fletcher, J., Gilbert,D., Shepherd, R., & Wanhill,S., 1998, Harlow: Pearson Educational Limited,p.114.
116
16 Destination Life Cycle and Tourism Impacts. Adapted from “Marketing the competitive destination of the future” by Buhalis D., 2000, Tourism Management (21) l,.p.105.
119
17 A Brand Personality Framework 121
18 The Anatomy of Brand Positioning. “ Principles and Practices of Marketing(4th ed.)by Jobber, D., 2004, Berkshire: McGraw-Hill International (UK)limited, p.270.
126
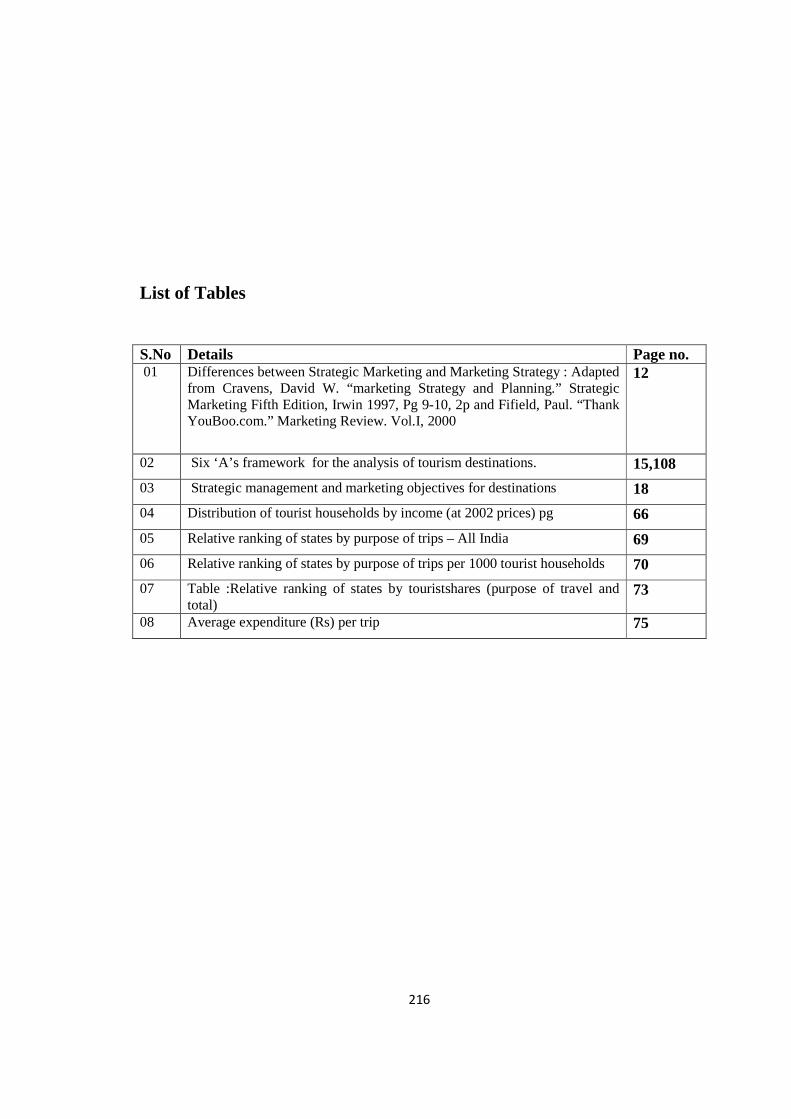
216
List of Tables
S.No Details Page no. 01 Differences between Strategic Marketing and Marketing Strategy : Adapted
from Cravens, David W. “marketing Strategy and Planning.” Strategic Marketing Fifth Edition, Irwin 1997, Pg 9-10, 2p and Fifield, Paul. “Thank YouBoo.com.” Marketing Review. Vol.I, 2000
12
02 Six ‘A’s framework for the analysis of tourism destinations. 15,108
03 Strategic management and marketing objectives for destinations 18
04 Distribution of tourist households by income (at 2002 prices) pg 66
05 Relative ranking of states by purpose of trips – All India 69
06 Relative ranking of states by purpose of trips per 1000 tourist households 70
07 Table :Relative ranking of states by touristshares (purpose of travel and total)
73
08 Average expenditure (Rs) per trip 75
217
List of Appendixes
S.No Details Page no. 01 Sample Selection and Sample Size 80
02 Distribution of Households, Tourist Households and its Density (per 1000 Households)
83
03 Rural Indians contribute more to tourism, survey reveals 85 04 Collection of Primary Data 86
05 Collection of Primary Data: 87
06 Information & Communication with Respondents 96
07 Questionnaire for Tourist 143
08 Tourism Total No. of Projects : 40 163
09 Budget 2009-’10: Blueprint for change? 199
09 Inbound Tourism Statistics and Out Bound Tourism Statistics 204
10 Domestic Tourism Statistics 211
218
REFERENCES Preface : Bagnall, 1996; Chon and Olsen, 1990; Faulkner, 1993a,b ; Boyd et al., 1995; Go and Haywood, 1990; Mazanec, 1994; Papadopoulos, 1987, 1989; Faulkner, 993b; Porter, 1980, 1990 Destination marketing Leiper (1995, p.87); Cooper et al (1998)
Strategies and practices of Marketing Destinations: Cooper(1989,1992and 1994
Chapter 3 : Early Tourism Marketing Wahab et al.(1976: 24); Bhualis 2000 ; Gilbert (1990); Buhalis (2000); Brey et al.2007; Ford and Peeper 2007; Seddighi and Theocharous (2002); Buckley & Papadopolus (1986:86); Middleton & Clarke (2001); Morgan(1996) ; Zalton (1998)
3.2 The Tourist Destination Image Gallarza, Saura and Garcia (2002:58); Hunt (1975); Beerli & Martin (2004 a); Echtner & Ritchie (1991); Beeri & Martin (2004 a); GUMM (1988); Baloglu and Mc Cleary (1999); Woodside & Sherrell (1977); Thompson & Cooper (1979) and Pike (2002b). ; Echtner & Prasad (2003); Kim and Richardson(2003); Gartner (1993)
Agarwal, S 197: The resort cycle and seaside tourism: an assessment of its applicability and validity. Tourism Management, Vol, 18(2), pp 65-73
Archer, B., 1996, Sustainable tourism – Do economist really care ?, Progress in Tourism and Hospitality Research, Vol. 2(3&4), pp 217 – 222.
Baker., K.G. Hozier, G.C., Jr Rogers, R.D., 1994 marketing research theory and methodology and the tourism industry: a non technical discussion, Journal of Travel Research, Vol 32(3).
Baloglu, S., Brinberg, D., 1997 Affective images of tourism destinations, Journal of Travel Research, Vol 35(4), pp 11 – 15
Bordas, E. 1994a, Competitiveness of tourist destinations in long distance market, Revue de Tourisme, Vol.49(3), pp 3 – 9.
Buhalis, D., 1998, Strategic use of information technologies in the tourism industry, Tourism Management, vol. 19(5), pp 409 – 421.
Butler, R., 1980, The concept of a tourism area cycle of evolution: implication of resources.
Chacko, H.E., 1997, Positioning a tourism destination to gain a competitive edge, Asia Pacific Journal of Tourism Research, Vol 1(2), pp 69 – 75.
219
Cooper, C. P., 1989 Touist Product Life Cycle. Tourism Marketing and Management Hand Book, London: Prentice Hall, pp. 577 – 580.
Cooper, C. and Buhalis, D., 1992 Strategic Management and Marketing issues of SMTE’s: Case Study of the Greek Agean Islands.
Cooper, C. Fletcher, J., Gilbert, D.,Shepherd, R., Wanhill, S. (1998) : Tourism Principles and Practice (2nd ed)
Gilbert, D., 1984, The need for countries to differentiate the tourist product and how to do so, Seminar Papers : tourism managing for results. University of Surrey, Guildford.
Heath, E., Wall, G., 1992, Marketing Tourism Destination: A Strategic Planning Approach.
Hakinson, G. (2005) Destination brand images: a business tourism perspective. Journal of Services Marketing (19)1, pp 24 – 32.
Kotler, P., Bowen, J., and Makens, J., 1996, Marketing for Hospitality and Tourism, Prentice Hall: U.K
Pike, S., (2005) Tourism Destination Branding Complexity. Journal of Product and Brand Management. (14)4, pp 258 – 259.
DOCUMENTS :
Data has been sourced from a survey conducted by the National Council for Applied Economic Research (NCAER) and sponsored by the Ministry of Tourism.