APPENDIX A Compliance Tool Instruction Manual · Compliance Tool Instruction Manual . Page 1. NHTSA...
33
TP-141-00 APPENDIX A Compliance Tool Instruction Manual
Transcript of APPENDIX A Compliance Tool Instruction Manual · Compliance Tool Instruction Manual . Page 1. NHTSA...

TP-141-00
APPENDIX A
Compliance Tool Instruction Manual
Page 1
NHTSA Quiet Vehicle Compliance Tool
User Guide Version Beta 1

Page 2
Table of Contents
1 Introduction .......................................................................................................................................... 3
1.1 About this User Guide ................................................................................................................... 3
1.2 Terminology .................................................................................................................................. 3
1.3 Analysis Computations .................................................................................................................. 4
2 System Requirements and Installation Instructions ............................................................................. 5
3 Workflow............................................................................................................................................... 6
4 Starting the Quiet Vehicle Compliance Tool ......................................................................................... 7
5 Importing Data ...................................................................................................................................... 9
5.1 Individual File Load ....................................................................................................................... 9
5.1.1 Data Import Messages ............................................................................................................... 11
5.2 Batch File Load ............................................................................................................................ 12
5.2.1 Folder Structure ......................................................................................................................... 13
5.2.2 File Requirements and Naming Convention .............................................................................. 13
6 Vehicle Information and User Comments .......................................................................................... 16
7 Data Review ........................................................................................................................................ 17
8 Compute Analysis ................................................................................................................................ 19
9 Output Files ......................................................................................................................................... 21
9.1 Output Files Contents ................................................................................................................. 21
9.1.1 Directivity (Stationary Output File) ............................................................................................ 26
9.1.2 Relative Volume (Passby Output Files) ...................................................................................... 26
9.2 Summary Log ............................................................................................................................... 27
Appendix A : Detailed Data Evaluation ....................................................................................................... 28
Appendix B : Triggers .................................................................................................................................. 30

Page 3
1 Introduction National Highway Traffic Safety Administration (NHTSA), Office of Vehicle Safety Compliance (OVSC) has developed the Quiet Vehicle Compliance Tool to determine if pedestrian alert sounds for motor vehicles meet the standard established in Federal Motor Vehicle Safety Standard(s) (FMVSS) 141 Regulation (the final rule). This tool was developed to be used by the test technician after execution of all test series (i.e., stationary, reverse, and pass-by tests) have been completed and four valid test runs have been collected. It is the responsibility of the test technician to eliminate invalid (or contaminated) tests, while this tool will determine if a sequence of tests meet the requirements. The analysis conducted in this tool is described further in Section 1.3. The U.S. Department of Transportation (US DOT), National Highway Traffic Safety Administration (NHTSA) laboratory test procedure for FMVSS 141 Minimum Sound Requirements for Hybrid and Electric Vehicles document describes the test procedure in detail.
1.1 About this User Guide This User Guide provides instructions on how to interact with the Quiet Vehicle Compliance Tool. It is organized according to the suggested workflow. Note that the images in this user guide are not intended to represent a real analysis. Example data has been used to demonstrate the functionality of the tool, not to represent real measurement data.
1.2 Terminology Operating Condition
State of vehicle during measurement. Each of the following can be analyzed using this tool: Stationary, Reverse, 10 km/h Passby, 20 km/h Passby, and 30 km/h Passby
Operation The movement of the vehicle for a single measurement.
Signal A series of data sampled uniformly in time Sample A combination of driver side, passenger side, front (for stationary
operations), trigger (for passby opertations), and pre- and post-ambient measurement data for a single operation.
Sound Signal that consists of data from one of three possible microphone channels (Driver, Passenger, Front)
Sound Channel Channel in the .wav file that contains a sound Test The measurement of a period of time that contains a single stationary,
reverse or passby operating condition Test Series A sequence of tests for the same operating condition Trial See Test Trial Series See Test Series Trigger Signal that consists of data that indicate by an increase in level that a
vehicle has passed by the microphone line Trigger Channel Channel in the .wav file that contains a trigger

Page 4
1.3 Analysis Computations Figure 1 describes the analysis that is completed within the Quiet Vehicle Compliance Tool with references to the relevant sections in the final rule.
Figure 1: Analysis Workflow in the Quiet Vehicle Compliance Tool

Page 5
2 System Requirements and Installation Instructions The Quiet Vehicle Compliance Tool will run on a Windows 7 (or later) PC with at least 8 GB of RAM. The tool requires approximately 900 KB of Hard Drive Space, plus the space required for the Matlab Runtime Library, Version 12a. A minimum screen resolution of 1024 x 768 (XGA) is recommended.
To install the tool, copy the executable file, NHTSA_PostProcessingComplianceTool.exe and the BaseData.bin file, to a folder that you have permission to run executables from. Note that the BaseData.bin file and the NHTSA_PostProcessingComplianceTool.exe must be in the same folder. For convenience, you may want to pin the application to your Start Menu or Toolbar.
Supplemental Tool Requirements • Matlab Runtime Library Version 12a
To install the Matlab Runtime, download the installer from the following link on the Mathworks website, https://www.mathworks.com/products/compiler/matlab-runtime.html. Then follow the instructions found at this link. Note, you must install Version 12a in order to run the Quiet Vehicle Compliance Tool.
• Microsoft Excel The Quiet Vehicle Compliance Tool writes log files to excel spreadsheets.
Data Requirements Data are expected to be imported into the tool in the .wav format with a sampling frequency of 44,100 Hz. If the sampling frequency of the measured data is not 44,100 Hz it should be resampled before using in this tool. If the data are not resampled prior to running the analysis, they will be resampled to 44,100 Hz during computations and the computation time will increase.

Page 6
3 Workflow It is recommended to use the Quiet Vehicle Compliance Tool in the following order:
1. Start the Quiet Vehicle Compliance Tool (Section 4) 2. Import data individually or multiple files at a time (Section 5) 3. Record vehicle information and user comments (Section 6) 4. Review the data and discard any contaminated samples (Section 7) 5. Compute results (Section 8) 6. Review output (Section 8)

Page 7
4 Starting the Quiet Vehicle Compliance Tool Navigate to the folder where the executable is installed. Double-click on the NHTSAQVComplianceTool_Beta1.exe file to open the Quiet Vehicle Compliance Tool. Note that it may several minutes for the tool to load.
When the Quiet Vehicle Compliance Tool first starts, it should look like Figure 2. The Quiet Vehicle Compliance Tool consists of five main areas (Figure 3). Area (A) allows for the user to select and import data files. Area (B) is where information related to the test vehicle is recorded. Area (C) is where the user can enter any comments relevant to the analysis. Area (D) provides methods to evaluate the data quality and allows for discarding of contaminated data. Area (E) handles the tasks related to the processing of the data and provides a summary of results upon completion of the analysis.
Figure 2: Quiet Vehicle Compliance Tool at Launch

Page 8
Figure 3: Areas of the Quiet Vehicle Compliance Tool
(A)
(D)
(E)
(B) (C)

Page 9
5 Importing Data Data are loaded into the tool in Area (A), see Figure 3. The data required for running the compliance analysis in this tool includes at least four samples of each operating condition (passby, stationary, or reverse) in .wav format with a sampling frequency of 44,100 Hz1. Note that once data has been imported into this tool, the data can be reviewed in the main window and corrupted samples can be discarded (Section 7). At least four samples must be present after reviewing the data in order to proceed with the analysis. These samples should include the following data by operation type. Files can be imported into the Quiet Vehicle Compliance Tool individually (Section 5.1) or in a batch (Section 5.2)
• Passbys (10 km/h, 20 km/h, 30 km/h): o Driver signal o Driver pre-ambient o Driver post-ambient o Passenger signal o Passenger pre-ambient o Passenger post-ambient o Trigger signal
• Stationary: o Driver signal o Driver pre-ambient o Driver post-ambient o Passenger signal o Passenger pre-ambient o Passenger post-ambient o Front signal o Front pre-ambient o Front post-ambient
• Reverse: o Driver signal o Driver pre-ambient o Driver post-ambient o Passenger signal o Passenger pre-ambient o Passenger post-ambient
5.1 Individual File Load Importing files individually allows for the user to select all components of a sample individually. First, all the files associated with one sample are selected and imported into the queue for data submittal. Once
1 If the sampling frequency of the measured data is not 44,100 Hz it should be resampled before using in this tool. If the data are not resampled prior to running the analysis, they will be resampled to 44,100 Hz during computations and the computation time will increase.

Page 10
at least 4 samples for each operating condition have been imported, the user can submit the data and return to the main window for further analysis. To import the files individually:
1. Within the Quiet Vehicle Compliance Tool’s main window, File Select section, select the Individual File Load radio button and click File Select (Figure 4) to open the File Load window (Figure 5).
Figure 4: File Select – Individual File Load
2. In the User Input section, select or enter the following for the sample:
a. Operating Condition: Select the type of operation from the drop-down menu. The available options include Stationary, 10km/h, 20 km/h, 30km/h, and Reverse.
b. Sample ID: Enter a user-defined numeric identifier if desired. If an identifier is not entered, the tool will assign an ID of 1 if there is no other data. If data exists, the highest ID will be incremented by 1.
c. Driver Side Mic: i. Click Select File and navigate to the .wav file containing the driver signal data
and click Open. ii. Use the drop-down menu to select the channel of the .wav file where the driver
signal data are stored. iii. Repeat steps i and ii for the driver side pre and post ambient .wav files.
d. Passenger Side Mic: i. Click Select File and navigate to the .wav file containing the passenger signal
data and click Open. ii. Use the drop-down menu to select the channel of the .wav file where the
passenger signal data are stored. iii. Repeat steps i and ii for the passenger side pre and post ambient .wav files.
e. Front Mic: These fields are only enabled for the Stationary operating condition. i. Click Select File and navigate to the .wav file containing the front signal data and
click Open. ii. Use the drop-down menu to select the channel of the .wav file where the front
signal data are stored. iii. Repeat steps i and ii for the front pre and post ambient .wav files.
f. Cross P-P’ Line Trigger: This field is only enabled for the passby operating conditions. i. Click Select File and navigate to the .wav file containing the trigger signal data
and click Open. ii. Use the drop-down menu to select the channel of the .wav file where the trigger
signal data are stored. g. Click Import Data to import the data into the tables in the File Summary section.
If the data are imported successfully. The tables in the File Summary section will be updated and a success message will be displayed in the Data Import Messages section.
Page 11
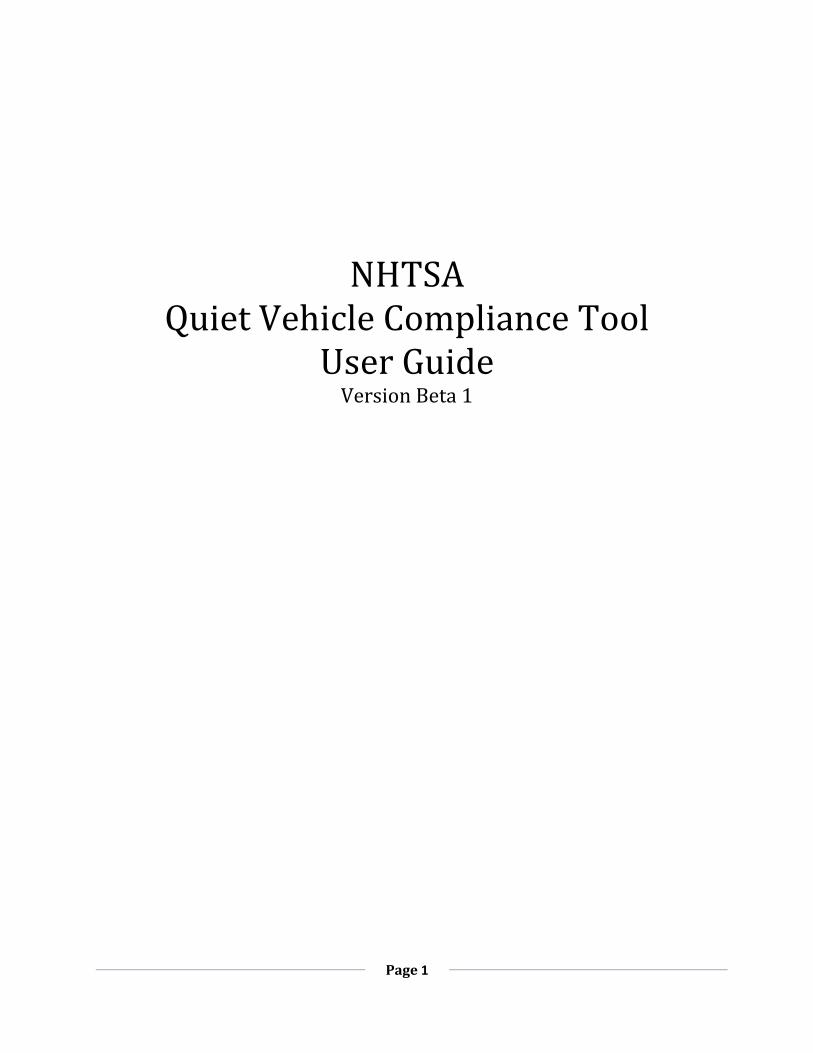
If the data was not imported successfully, error messages will be displayed in the Data Import Messages section. See Section 5.1.1 for more information on the messages that are displayed in the Data Import Messages section.
3. Repeat step 2 until at least 4 samples for each operating condition are imported, which will enable the Submit Data button.
4. Click the Submit Data button to submit the data for further analysis or click Cancel to discard the data.
Figure 5: File Load Window
5.1.1 Data Import Messages Limited error checking is implemented for loading files. Messages will be relayed through the Data Import Messages section if the operating condition has not been selected or if a required file has not been selected (Figure 6). A successful message will also be displayed in the Data Import Messages section when the data are imported into the File Summary section successfully.

Page 12
Figure 6: Data Import Error Message Example
5.2 Batch File Load Loading data in a batch is a faster, but less flexible way of importing the data. The batch process will import all data into the File Summary section of the File Load window (Figure 5) according to the folder structure and file naming convention described below. Additional files can be imported individually after a batch of files have been imported. To import by batch:
1. Create a folder according to the folder structure described in Section 5.2.1. 2. Organize the .wav files into the appropriate folders and name the files according to the file
naming convention described in Section 5.2.2. 3. Within the Quiet Vehicle Compliance Tool’s main window, File Select section, select the Batch
File Load radio button and click File Select.
Page 13
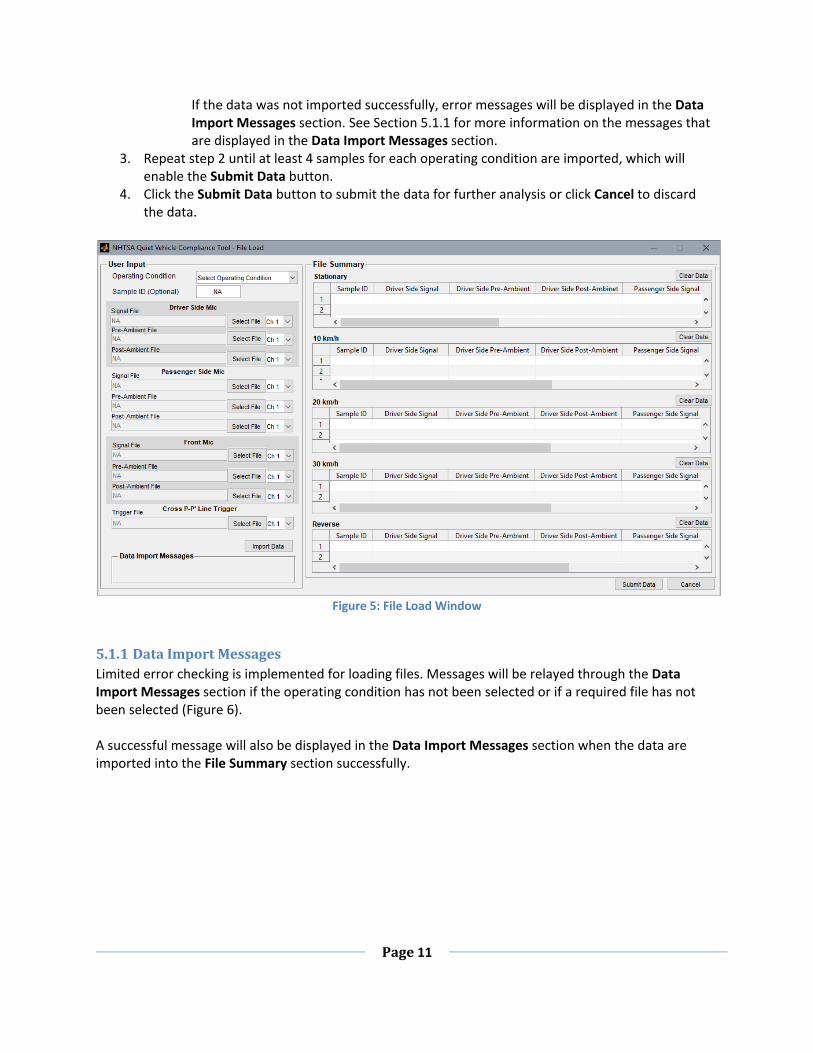
4. Navigate to the top folder of the structure described in Section 5.2.1 (ToyotaCamry in this example) and click Select Folder to import the contents of the folder structure and open the File Load window.
5. Import additional files individually as described in Section 5.1 if desired. 6. Click the Submit Data button to submit the data for further analysis or click Cancel to discard
the data.
Figure 7: File Select – Batch File Load
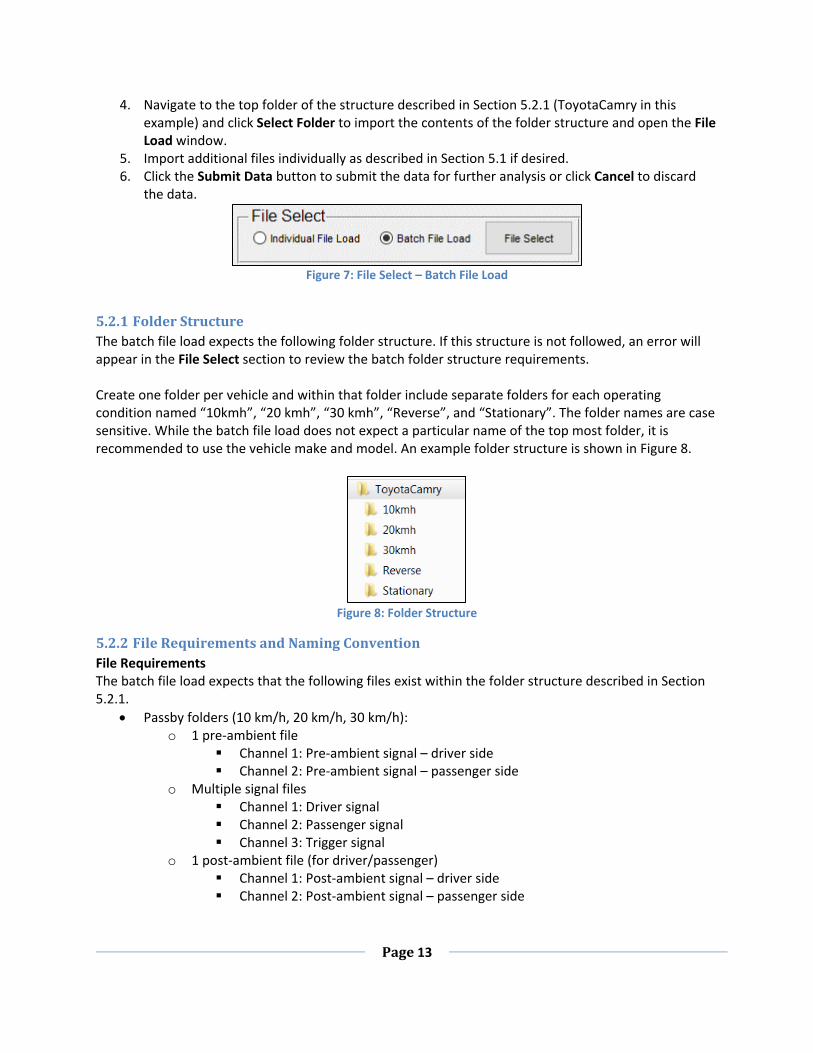
5.2.1 Folder Structure The batch file load expects the following folder structure. If this structure is not followed, an error will appear in the File Select section to review the batch folder structure requirements. Create one folder per vehicle and within that folder include separate folders for each operating condition named “10kmh”, “20 kmh”, “30 kmh”, “Reverse”, and “Stationary”. The folder names are case sensitive. While the batch file load does not expect a particular name of the top most folder, it is recommended to use the vehicle make and model. An example folder structure is shown in Figure 8.
Figure 8: Folder Structure
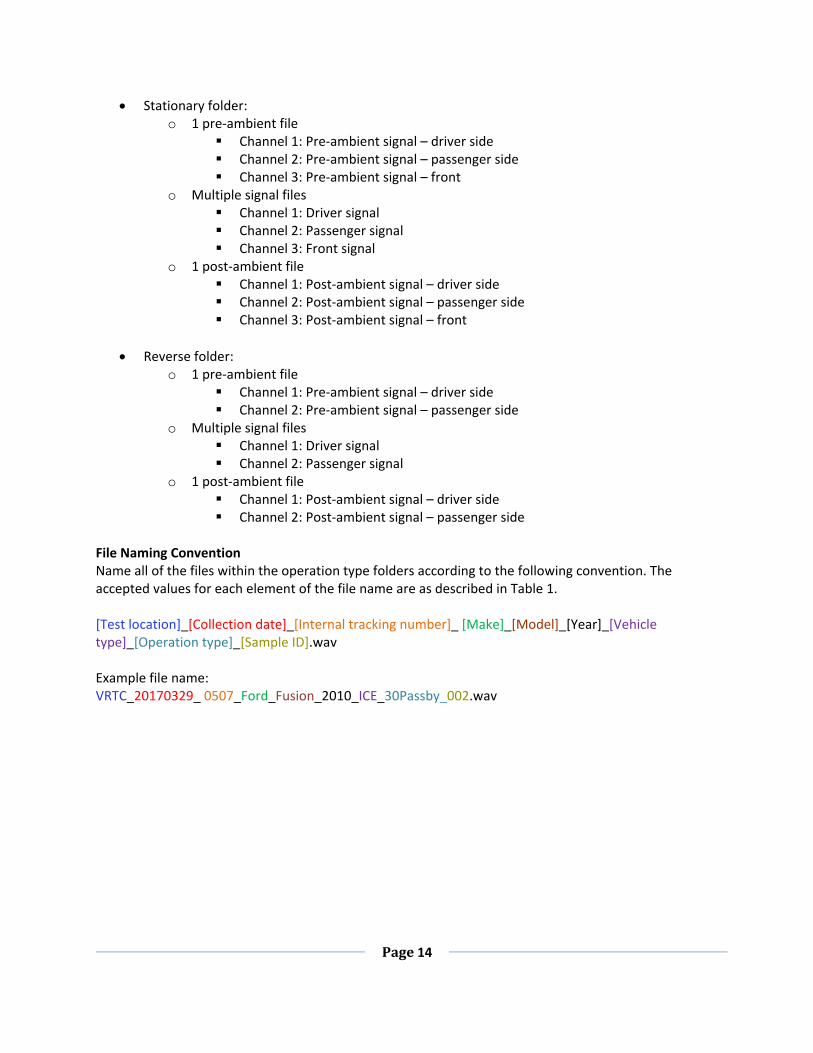
5.2.2 File Requirements and Naming Convention File Requirements The batch file load expects that the following files exist within the folder structure described in Section 5.2.1.
• Passby folders (10 km/h, 20 km/h, 30 km/h): o 1 pre-ambient file
Channel 1: Pre-ambient signal – driver side Channel 2: Pre-ambient signal – passenger side
o Multiple signal files Channel 1: Driver signal Channel 2: Passenger signal Channel 3: Trigger signal
o 1 post-ambient file (for driver/passenger) Channel 1: Post-ambient signal – driver side Channel 2: Post-ambient signal – passenger side
Page 14
• Stationary folder: o 1 pre-ambient file
Channel 1: Pre-ambient signal – driver side Channel 2: Pre-ambient signal – passenger side Channel 3: Pre-ambient signal – front
o Multiple signal files Channel 1: Driver signal Channel 2: Passenger signal Channel 3: Front signal
o 1 post-ambient file Channel 1: Post-ambient signal – driver side Channel 2: Post-ambient signal – passenger side Channel 3: Post-ambient signal – front
• Reverse folder:
o 1 pre-ambient file Channel 1: Pre-ambient signal – driver side Channel 2: Pre-ambient signal – passenger side
o Multiple signal files Channel 1: Driver signal Channel 2: Passenger signal
o 1 post-ambient file Channel 1: Post-ambient signal – driver side Channel 2: Post-ambient signal – passenger side
File Naming Convention Name all of the files within the operation type folders according to the following convention. The accepted values for each element of the file name are as described in Table 1. [Test location]_[Collection date]_[Internal tracking number]_ [Make]_[Model]_[Year]_[Vehicle type]_[Operation type]_[Sample ID].wav Example file name: VRTC_20170329_ 0507_Ford_Fusion_2010_ICE_30Passby_002.wav

Page 15
Table 1: File Name Elements Element Description Accepted Values Test location User defined Collection date Date Format: YYYYMMDD Internal tracking number Tracking number for user
organization 4- digit number
Make Vehicle make User defined
Model Vehicle model User defined
Year Vehicle model year Format: YYYY Vehicle type Type of vehicle propulsion ICE
EV HEV
Operation type Only the specific values listed in the next column are accepted
10Passby 10PreAmbient 10PostAmbient 20Passby 20PreAmbient 20PostAmbient 30Passby 30PreAmbient 30PostAmbient Stationary StatPreAmbient StatPostAmbient Reverse RevPreAmbient RevPostAmbient
Sample ID Sample number used throughout the analysis
3-digit number

Page 16
6 Vehicle Information and User Comments In Area (B), enter the vehicle year, make, model, NHTSA number, and vehicle identification number (VIN), see Figure 9. The information entered into these fields will be used in naming the output files and will be recorded in the Summary Log (Section 1). Note that the vehicle information pictured in Figure 9 does not correspond to the example data that is used throughout this user guide.
Figure 9: Vehicle Information
In Area (C), enter any comments relevant to the analysis. These comments will be recorded in the Summary Log.
Figure 10: User Comments

Page 17
7 Data Review All data will be selected (included) for the analysis unless discarded during the review process. It is recommended to review the data for contamination, such as a spike in the sound pressure before the passby occurs, before computing the analysis and discard samples with contaminated data. Review samples by clicking the Review Next button and the Previous button. Delete a sample from the analysis by clicking the Discard and Review Next button. The default trigger threshold can be changed during the review process. If no changes are made to the trigger threshold during review, the default value of 20% will be used. For more information on setting an appropriate trigger threshold, see Appendix A and Appendix B. The sound channels and trigger channels can be evaluated in Area (D) as follows:
• Operating Condition drop-down menu: Select an operating condition (Stationary, 10 km/h, 20 km/h, 30/kmh, or Reverse) to review the first sample associated with the selected operating condition.
• Sample ID field: The Sample ID that corresponds to the current sample for the selected operating condition is displayed in the Sample ID field.
• Total samples available for analysis field: The total number of samples that have been imported and are available for the analysis for the selected operating condition. If samples are discarded, this number is updated to reflect the new total number of samples available for analysis.
• Driver Side Mic, Passenger Side Mic, Front Mic, and P-P’ Line Cross Trigger sections: The fields in these sections will automatically populate to display the file names and channel numbers for the sample currently in review.
• Determine Analysis Region: When an operating condition is selected or the next or previous sample is viewed, the corresponding data will be automatically plotted in this section with a 1 second delay between files as follows:
• For all operating conditions the following files are plotted: o Driver Side Signal: Signal in dark blue o Driver Side Signal: Pre-Ambient in a lighter blue o Driver Side Signal: Post-Ambient in the lightest blue o Passenger Side Signal: Signal in red o Passenger Side Signal: Pre-Ambient in pink o Passenger Side Signal: Post-Ambient in a lighter pink
• For stationary operations the following files are plotted next: o Front Signal: Signal in black o Front Side Signal: Pre-Ambient in gray o Front Side Signal: Post-Ambient in a lighter gray
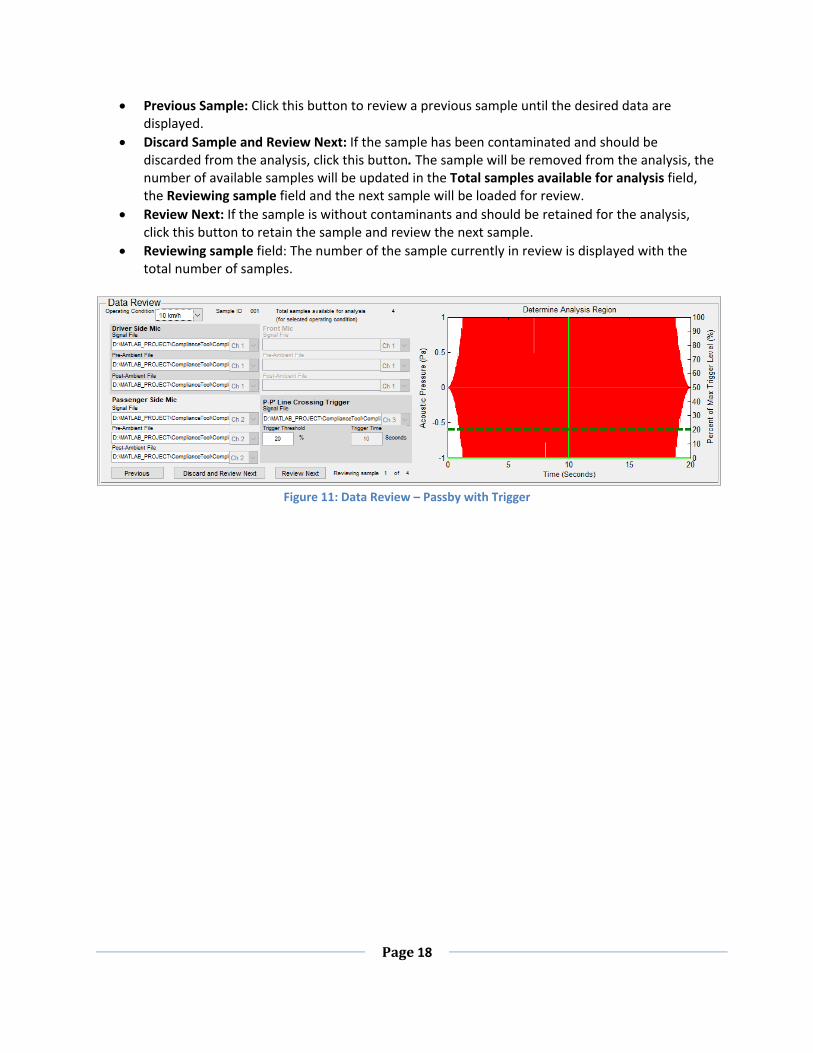
• For passby operations (Figure 11) o The trigger signal file is plotted next in bright green o The trigger threshold is plotted in a dashed line and in dark green
The trigger threshold is a percentage of the full range Edit the Trigger Threshold so that the threshold is first exceeded at the
point that the vehicle reaches the microphone line. If a threshold is not entered, then the default value of 50% will be used.
o The time at which the threshold is exceeded is displayed in the Trigger Time field.
Page 18
• Previous Sample: Click this button to review a previous sample until the desired data are displayed.
• Discard Sample and Review Next: If the sample has been contaminated and should be discarded from the analysis, click this button. The sample will be removed from the analysis, the number of available samples will be updated in the Total samples available for analysis field, the Reviewing sample field and the next sample will be loaded for review.
• Review Next: If the sample is without contaminants and should be retained for the analysis, click this button to retain the sample and review the next sample.
• Reviewing sample field: The number of the sample currently in review is displayed with the total number of samples.
Figure 11: Data Review – Passby with Trigger

Page 19
8 Compute Analysis After invalid data have been removed and there are at least 4 samples for each operating condition, the analysis can be computed. For more information on the tests that are being conducted during the analysis, see Section 1.3. Compute and view results in Area (E) as follows:
• Click Compute Analysis to begin the analysis. • Upon clicking Compute Analysis, the user will be prompted to select a folder in which to save
results. Select a folder or accept the default path. The default output file path is C:\NHTSA\QVCT\Results_[date of analysis]. If this path does not exist, it will be created. The selected file path will be displayed in the Output File Path field.
• The following information will be displayed during the analysis and after it has been completed: o Processing Sample: This field provides updates on the current step in the analysis
(Figure 12). o Total Duration: When the analysis has completed, the total duration will be displayed in
this field in seconds (Figure 13). o Stop Analysis: Click this button at any time during computation to stop the
computation. There is a delay between clicking the button and when the analysis is stopped because the tool needs to complete the current task before stopping. The Stop Analysis button will be disabled and the Compute Analysis button will be enabled, however the analysis has not stopped until a message is displayed in the Processing Sample area to confirm when the analysis has been stopped (Figure 14). Note that if the
o Output File Path: The file path where the output files and summary log are stored (Figure 12).
Figure 12: Processing Sample, Output File Path
Figure 13: Analysis Complete

Page 20
Figure 14: Stop Analysis
• When the analysis has completed, the results table provides a summary of the test results
within the analysis. For more information on the tests that are being conducted during the analysis, see Section 1.3.
o Driver/Passenger Side Used in Testing: A record of the lower of the two sides that was used in the analysis.
o Passing Combinations: 4-band: The number of passing combinations for the 4-band test according to section S7.3.5 of the final rule.
o Passing Combinations: 4-band Directivity: The number of passing combinations for the 4-band directivity test according to section S7.1.6 of the final rule.
o Passing Combinations: 2-band: The number of passing combinations for the 2-band test according to section S7.3.5 of the final rule.
o Passing Combinations: 2-band Directivity: The number of passing combinations for the 2-band directivity test according to section S7.1.6 of the final rule.
o Band Sum (for Volume Change Analysis): The normalized band sum according to section S7.6.3 of the final rule.
• Overall Test Result: The overall test result indicates an overall pass or fail status of the compliance test.
Note that the results shown in Figure 15 do not represent real data.
Figure 15: Results Table and Overall Test Result
To clear all data in the tool to begin a new analysis, click the Clear All for New Analysis button.

Page 21
9 Output Files The Quiet Vehicle Compliance Tool outputs the following logs for each analysis in the directory specified upon clicking Compute Analysis. The default output file path is C:\NHTSA\QVCT\Results_[Analysis Date]. Six logs are output for each analysis; one for each operating condition, and a summary log. The contents of the logs are described in Sections 9.1 and 9.2. The naming convention for the logs is as follows: [VehicleYear][VehicleMake][VehicleModel][OperatingCondition]_Analysis Number. The analysis number is automatically generated starting at 1. Each time an analysis is initiated, the analysis number is incremented by 1. Note that the results shown in this section do not represent real data.
9.1 Output Files Contents All output files contain at least the following 6 worksheets. The stationary and passby output files contain additional worksheets as described in Sections 9.1.1 and 9.1.2. The output files provide results for each major step in the analysis and can be used to manually verify calculations. Sheet 1 The Sheet 1 worksheet contains a summary of the vehicle information and the files that correspond to the lower side that have been selected for further analysis.
Figure 16: Example Output File – Sheet 1

Page 22
4 Samples The 4 Samples worksheet contains the overall and 1/3 octave band (FOB) a-weighted decibel levels for the 4 samples selected for the analysis.
Figure 17: Example Output File – 4 Samples

Page 23
4 Samples Corrected The 4 Samples Corrected worksheet contains the overall and 1/3 octave band (FOB) a-weighted decibel levels corrected for the ambient for the 4 samples selected for the analysis.
Figure 18: Example Output File – 4 Samples Corrected

Page 24
Averaged The Averaged worksheet contains the overall and 1/3 octave band (FOB) a-weighted decibel levels corrected for the ambient and averaged for the 4 samples selected for the analysis.
Figure 19: Example Output File – Averaged
Final Sample The Final Sample worksheet contains the overall and 1/3 octave band (FOB) a-weighted decibel levels corrected for the ambient and averaged for the 4 samples selected for the analysis for the lower side (passenger or driver).
Figure 20: Example Output File – Final Sample

Page 25
Operating Condition The [Operating Condition] worksheet contains the band combinations for the 4 band and 2 band tests and a passing or failing status for those bands for that particular operating condition.
Figure 21: Example Output File – Stationary

Page 26
9.1.1 Directivity (Stationary Output File) In addition to the 6 worksheets described in Section 9.1, the Stationary output file contains the Directivity worksheet. The Directivity worksheet contains a pass/fail status for the 4 band and 2 band directivity test. It also contains the a-weighted decibel levels for the directivity test, the a-weighted decibel levels for minimum requirement for the directivity test in the final rule, and the difference. The 4 band and 2 band combinations are listed with a pass/fail status for the directivity test along with the band sum for combinations that pass.
Figure 22: Example Output File – Directivity
9.1.2 Relative Volume (Passby Output Files) In addition to the 6 worksheets described in Section 9.1, the passby output files contain the Relative Volume worksheet. The Relative Volume worksheet contains an overall status of the relative volume test. It also contains the a-weighted decibel levels for the relative volume test for two operating conditions, the a-weighted decibel levels for minimum requirement for the relative volume test in the final rule, the normalized levels (the operating condition signal – requirement), the normalized band sum for each operating condition, and the relative volume change between the two operating conditions. The 10 km/h output file contains the comparison between the Stationary and 10 km/h operating conditions. The 20 km/h output file contains the comparison between the 10 km/h and 20 km/h

Page 27
operating conditions. The 30 km/h output file contains the comparison between the 20 km/h and 30 km/h operating conditions.
Figure 23: Example Output File – Relative Volume (10 km/h)
9.2 Summary Log The summary log provides an overall summary of the analysis. The vehicle information and user comments are recorded on the left side of the log. The results are recorded for each test and operating condition along with the lower side and number of passing bands (for 4 and 2 band tests). The Relevant Signal Files are the lower side (driver or passenger), and the front signal files. The overall test result is also recorded in the summary log. Note that the results shown in this section do not represent real data.
Figure 24: Summary Log Example

Page 28
Appendix A: Detailed Data Evaluation Additional information on evaluating data is described in this section. Selecting the Trigger Threshold The trigger threshold should be set so that the threshold is first exceeded at the point that the vehicle reaches the microphone line. A passby analysis includes the region from the start of the measurement to when the trigger threshold is reached for the first time. The maximum level in this region is used to compute the SPL of the event. Additional discussion of triggers is given in Appendix B. Passby Time Signal Shape The shape of the passby time signal is expected to look similar to Figure 25, where there is a period of time where the sound pressure is low and increases as the vehicle approaches the microphone line and then decreases as the vehicle departs. In this example, there is a dip in the level while the vehicle is passing the microphone line. The presence of a dip is not an indication of a good or bad measurement, but reflects characteristics of the particular vehicle’s sound source(s). For example a dip could occur if there is a dominant source in both the front and rear of the vehicle; it could be due to the sources directivity; or it could occur due to a modulation in the emitted signal. Figure 25 also shows a red line with arrows pointed to the left. This line coincides with the time when the trigger threshold is exceeded. Only the region to the left of the red line is included in the analysis.
Figure 25: Example of Time Series Display of a Passby Driver Side Sound Signal. The vertical line with arrows indicates the analysis region based on a 20% trigger threshold.

Page 29
Stationary Time Signal Shape The shape of the stationary time signal is expected to look similar to Figure 26, where there is variation on a very short time scale, e.g. multiple peaks occurring within a single second, but the average level is generally the same over the measurement period. Note, that in contrast to the passby analysis that looks at the time history prior to exceeding the trigger threshold, analysis for this type of operation uses the first 10 seconds of the measurement.
Figure 26 - Example of Time Series Display of a Stationary Driver Side Sound Signal Reverse Time Signal Shape The shape of the reverse time signal is expected to look similar to Figure 27, where there is variation on a very short time scale, e.g. multiple peaks occurring within a single second, but the average level is generally the same over the measurement period. Note, that in contrast to the passby analysis that looks at the time history prior to exceeding the trigger threshold, analysis for this type of operation uses the first 10 seconds of the measurement.
Figure 27 - Example of Time Series Display of a Reverse Driver Side Sound Signal

Page 30
Appendix B: Triggers A trigger is a secondary signal that indicates when an event occurs. There are many types of triggers for a wide range of applications and it is not practical to review the topic exhaustively. For the purposes of this user guide, triggers will be discussed as they relate to detecting the time when a moving vehicle crosses a line formed by two microphones on either side of the vehicle’s path as shown in Figure 28. There are many different methods of generating a trigger signal and each has unique characteristics. For example, trigger signals can be generated from:
• pneumatic or mechanical pressure plates (activated by compressing or uncompressing the sensor),
• proximity sensors (activated by approaching or moving away from the sensor), or • photodetectors (activated by changing the state of line-of0sight as either broken or unbroken).
Figure 28: Basic Test Geometry
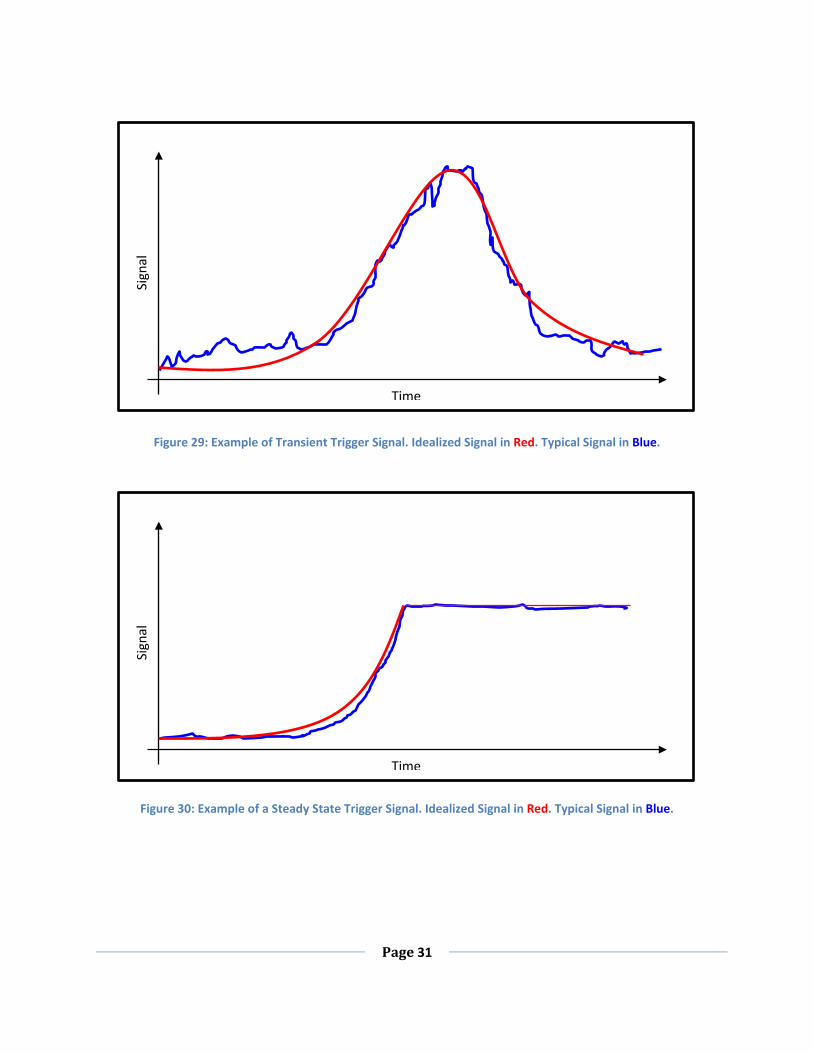
When a sensor is activated it will typically either produce a transient signal, a quick rise and fall of the voltage (see Figure 29), or it will produce a steady state change in the voltage from one state to another (see Figure 30). In either case, there can be a non-zero voltage present before the trigger is activated and there can be noise on the signal when the sensor is activated. Both noise and a non-zero rest state mean that, in order to identify when the trigger is truly active, one needs to set a threshold that must be exceeded to consider the trigger activated. The drawback to setting a threshold is that it can induce a delay to the detection of the event due to the rise-time of the sensor.
Microphone Line / Trigger Location
Page 31
Figure 29: Example of Transient Trigger Signal. Idealized Signal in Red. Typical Signal in Blue.
Figure 30: Example of a Steady State Trigger Signal. Idealized Signal in Red. Typical Signal in Blue.
Time
Sign
al
Time
Sign
al
Page 32
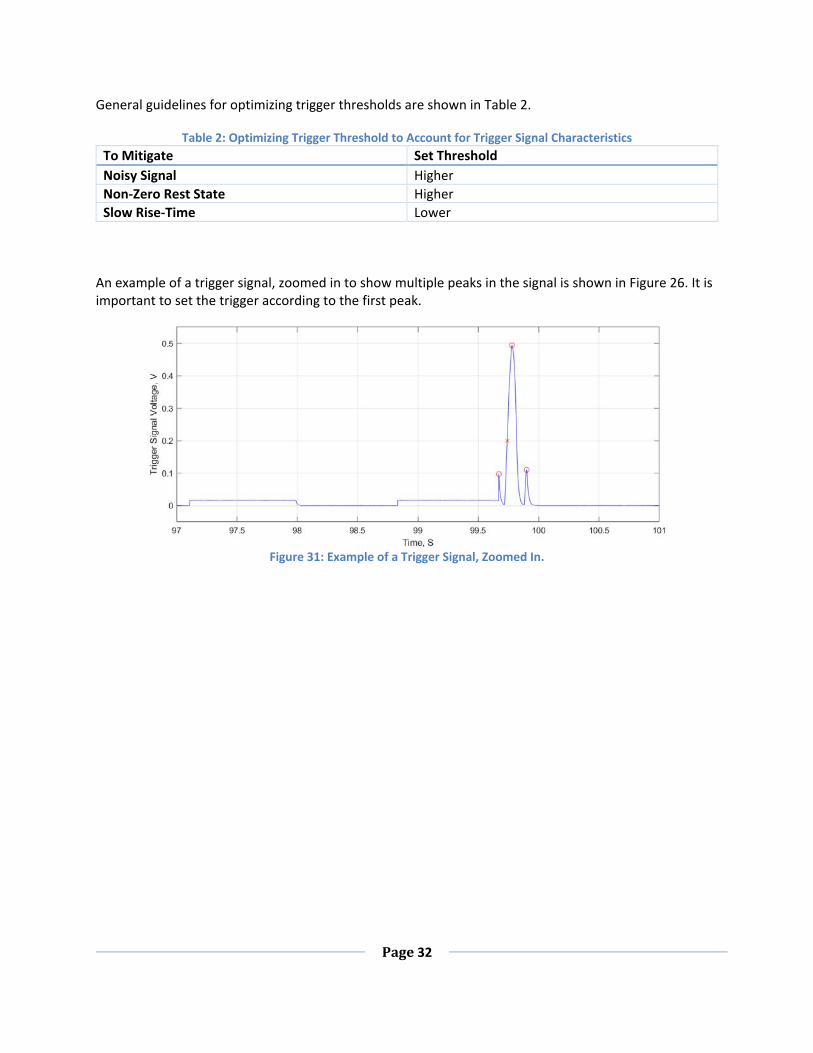
General guidelines for optimizing trigger thresholds are shown in Table 2.
Table 2: Optimizing Trigger Threshold to Account for Trigger Signal Characteristics To Mitigate Set Threshold Noisy Signal Higher Non-Zero Rest State Higher Slow Rise-Time Lower
An example of a trigger signal, zoomed in to show multiple peaks in the signal is shown in Figure 26. It is important to set the trigger according to the first peak.
Figure 31: Example of a Trigger Signal, Zoomed In.