APPENDIX A Action Leakage Rate (ALR) Calculation · Action Leakage Rate (ALR) Calculation. 1
23
APPENDIX A Action Leakage Rate (ALR) Calculation NYSDEC OHMS Document No. 201469232-00021
Transcript of APPENDIX A Action Leakage Rate (ALR) Calculation · Action Leakage Rate (ALR) Calculation. 1
APPENDIX A
Action Leakage Rate (ALR) Calculation
NYSDEC OHMS Document No. 201469232-00021
~,Golder Associates CALCULATIONS
Date: April 16, 2013 Made by: Revised November 4, 2013
Checked by: Project No.:
123-89494 Revised by: Checked by:
JPG
BJG MTW
~ ,,\~\(, Subject: Action Leakage Rate Calculation Reviewed by:
Project Short Title: FACULTATIVE POND RESPONSE ACTION PLAN FOR RMU-2 EXPANSION
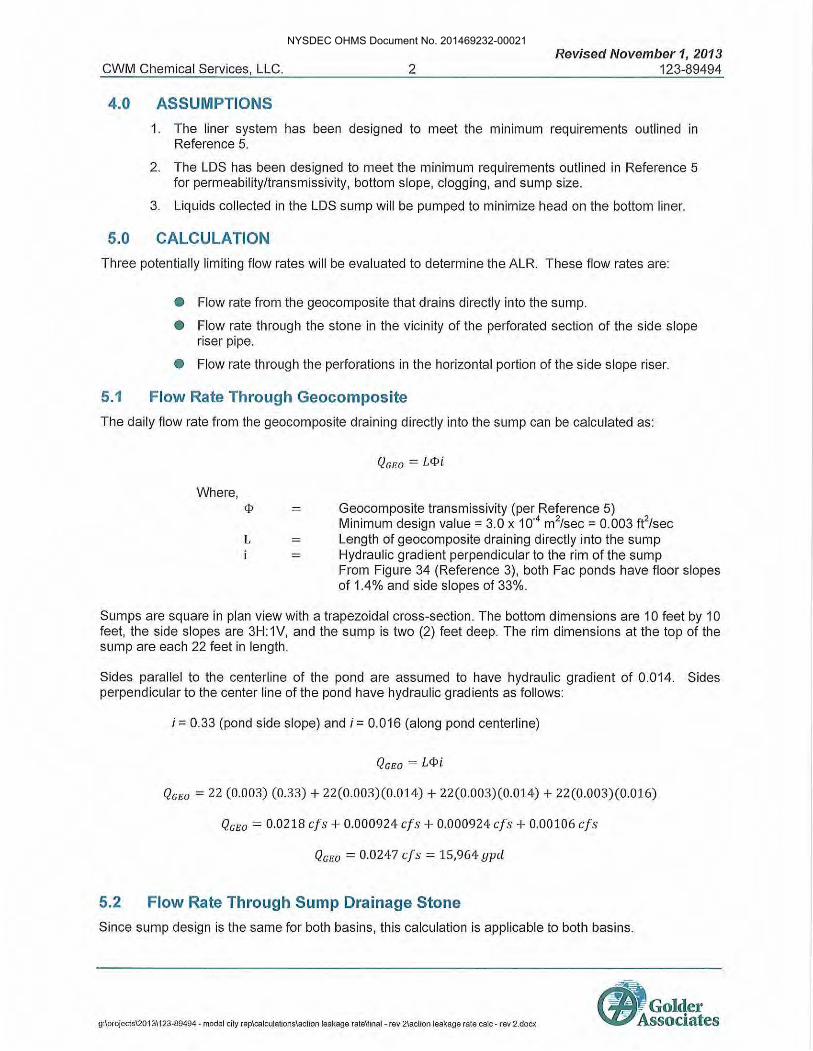
In accordance with 6 NYCRR Part 373.2-11 regulations, the action leakage rate (ALR) must be calculated
for Facultative (Fae) Pond 5 as part of the RMU-2 expansion. This revision of the ALR calculation
includes only Fae Pond 5.
1.0 OBJECTIVE
Determine the ALR for the Facultative Pond 5 leal< detection system (LDS). The ALR is defined as the
maximum design flow rate that the LDS can remove without the fluid head on the bottom liner exceeding
one ( 1 ) foot.
2.0 METHOD
The ALR is the maximum design flow rate that the LDS can remove without the fluid head on the bottom
liner exceeding 1 foot. In order for liquid to flow through the LDS, it must be collected and conveyed to
the sump and then flow into the perforated section of the side slope riser pipe and be pumped out. This
calculation will determine the limiting flow rate, ie. the ALR.
3.0 REFERENCES
1. "Response Action Plan Residuals Management Unit 1 Model City TSDR Facility" prepared by Rust Environment and Infrastructure, February 1993.
2. "Response Action Plan Residuals Management Unit 2" prepared by Arcadis, April 2003. Revised August 2013.
3. RMU-2 Technical Specifications, Section 02210, Earthworks, Article 2.09.
4. Fae Pond Permit Drawing No. 3 "Fae Pond Grading Plans" prepared by Arcadis of New York, Inc., August 2009. Revised November 2013.
5. Fae Pond Permit Drawing No. 4 "Fae Pond Sections and Details" prepared by Arcadis of New York, Inc., August 2009. Revised November 2013.
6. 6 NYC RR Subpart 373.2-11 Surface Impoundments, effective September 6, 2006.
g:lprojects\20131123·89494 - model city raplcalculations\aclion leakage ratelfinal - rev 2\action leakage rate calc - rev 2.docx
Golder Associates Inc. 10 Canal Street, Suite 217
Bristol, PA 19007 USA Tel: (215) 826-1560 Fax: (215) 826-9458 www.golder.com
Golder Associates : Operations In Africa, Asia, Australasia, Europe, North America and South America
Golder, Golder Associates and the GA globe design are trademarks of Golder Associates Corporation
NYSDEC OHMS Document No. 201469232-00021
CWM Chemical Services, LLC.
4.0 ASSUMPTIONS
2 Revised November 1, 2013
123-89494
1. The liner system has been designed to meet the minimum requirements outlined in Reference 5.
2. The LOS has been designed to meet the minimum requirements outlined in Reference 5 for permeability/transmissivity, bottom slope, clogging, and sump size.
3. Liquids collected in the LOS sump will be pumped to minimize head on the bottom liner.
5.0 CALCULATION
Three potentially limiting flow rates will be evaluated to determine the ALR. These flow rates are:
• Flow rate from the geocomposite that drains directly into the sump.
• Flow rate through the stone in the vicinity of the perforated section of the side slope riser pipe.
Flow rate through the perforations in the horizontal portion of the side slope riser.
5.1 Flow Rate Through Geocomposite
The daily flow rate from the geocomposite draining directly into the sump can be calculated as:
Where, ¢
L
Geocomposite transmissivity (per Reference 5) Minimum design value = 3.0 x 10"4 m2/sec = 0.003 ft2/sec Length of geocomposite draining directly into the sump Hydraulic gradient perpendicular to the rim of the sump From Figure 34 (Reference 3), both Fae ponds have floor slopes of 1.4% and side slopes of 33%.
Sumps are square in plan view with a trapezoidal cross-section. The bottom dimensions are 10 feet by 10 feet, the side slopes are 3H:1V, and the sump is two (2) feet deep. The rim dimensions at the top of the sump are each 22 feet in length.
Sides parallel to the centerline of the pond are assumed to have hydraulic gradient of 0.014. Sides perpendicular to the center line of the pond have hydraulic gradients as follows:
i = 0.33 (pond side slope) and i = 0.016 (along pond centerline)
QGEO = L¢i
QGEO = 22 (0.003) (0.33) + 22(0.003)(0.014) + 22(0.003)(0.014) + 22(0.003)(0.016)
QcE'o = 0.0218 cfs + 0.000924 cfs + 0.000924 cf s + 0.00106 cfs
QcTJO = 0.0247 cfs = 15,964 gpd
5.2 Flow Rate Through Sump Drainage Stone
Since sump design is the same for both basins, this calculation is applicable to both basins.
g:lprojects\201311 23-89494 - model city rap\calculations\action leakage rate\final - rev 2\aclion leakage rate calc - rev 2.docx
rf!IGolder Associates
NYSDEC OHMS Document No. 201469232-00021
CWM Chemical Services, LLC. 3 Revised November 1, 2013
123-89494
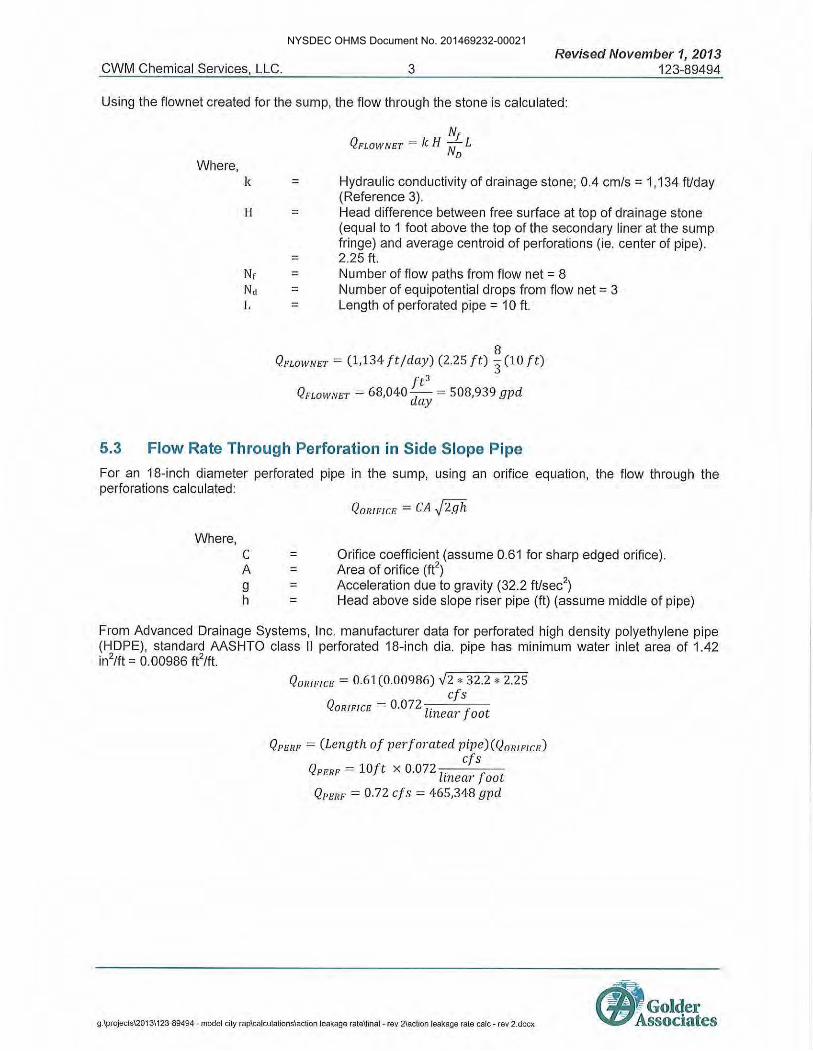
Using the flownet created for the sump, the flow through the stone is calculated:
Where, k
H
Nr Nd L
=
=
= = = =
Nr QFLOWNET = k H No L
Hydraulic conductivity of drainage stone; 0.4 cm/s = 1, 134 ft/day (Reference 3). Head difference between free surface at top of drainage stone (equal to 1 foot above the top of the secondary liner at the sump fringe) and average centroid of perforations (ie. center of pipe). 2 .25 ft. Number of flow paths from flow net = 8 Number of equipotential drops from flow net= 3 Length of perforated pipe= 10 ft.
8 QFlOWNET = (1,134 ft/day) (2.25 ft) 3 (10 ft)
ft 3
QFLOWNE1' = 68,040 -d = 508,939 gpd ay
5.3 Flow Rate Through Perforation in Side Slope Pipe
For an 18-inch diameter perforated pipe in the sump, using an orifice equation, the flow through the perforations calcu lated:
Where, c A g h
= = = =
Q0 nmrn = CA .J2gh
Orifice coefficient (assume 0.61 for sharp edged orifice). Area of orifice (ft2)
Acceleration due to gravity (32.2 fUsec2)
Head above side slope riser pipe (ft) (assume middle of pipe)
From Advanced Drainage Systems, Inc. manufacturer data for perforated high density polyethylene pipe (HOPE), standard AASHTO class II perforated 18-inch dia. pipe has minimum water inlet area of 1.42 in2/ft = 0.00986 ft2/ft.
QORIF/CE = 0.61(0.00986) .../2 * 32.2 * 2.25 cf s
QORIFICE = 0.072 [' ,. mear oat
QpenF = (length of perforated pipe)(Q0 nmce) cfs
QPERF = lOft x 0.072 l. f mear oat Qpi;np = 0.72 cf s = 465,348 gpcl
g:l projects\201311 23-89494 - model city rap\calculationsl action leakage ra le\linal - rev 2\aclion leakage rate calc - rev 2.docx
NYSDEC OHMS Document No. 201469232-00021
CWM Chemical Services, LLC.
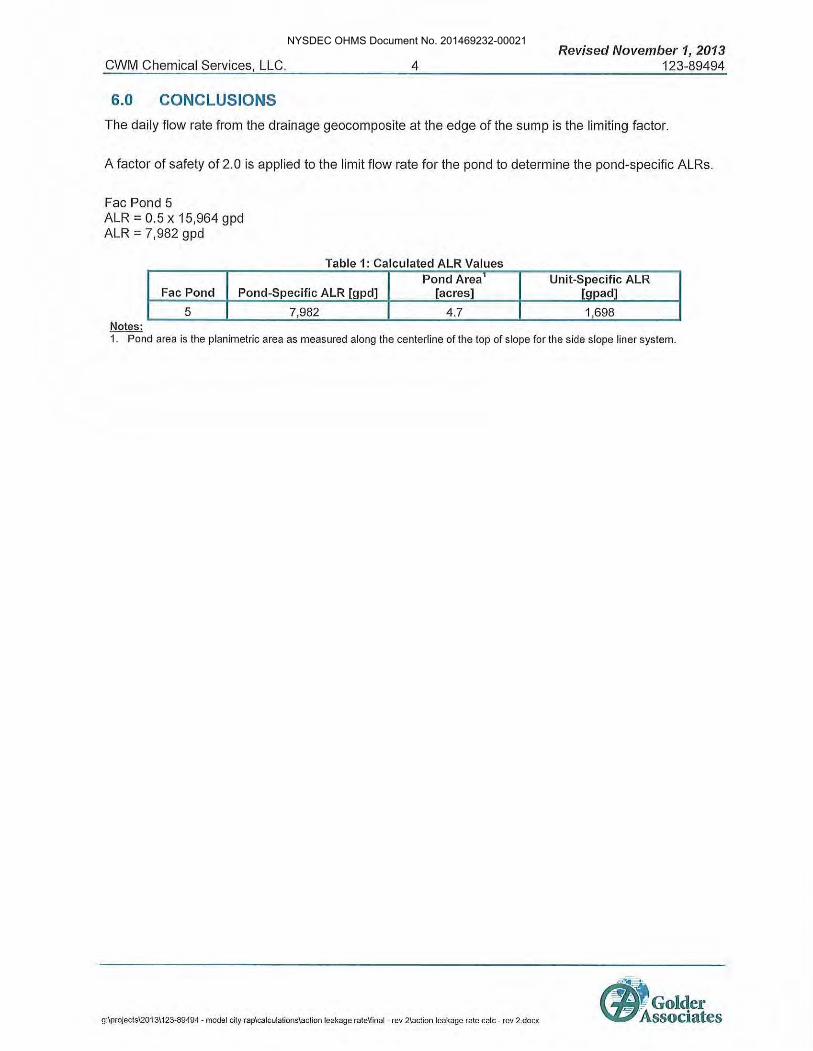
6.0 CONCLUSIONS
4 Revised November 1, 2013
123-89494
The daily flow rate from the drainage geocomposite at the edge of the sump is the limiting factor.
A factor of safety of 2.0 is applied to the limit flow rate for the pond to determine the pond-specific ALRs.
Fae Pond 5 ALR = 0.5 x 15,964 gpd ALR = 7,982 gpd
Table 1: Calculated ALR Values Pond Area '
Fae Pond Pond-Specific ALR [gpd] [acres]
5 7,982 4 .7 Notes:
Unit-Specific ALR [gpad]
1,698
1. Pond area is the planimetric area as measured along the centerline of the top of slope for the side slope liner system.
g:lprojects\20131123-89494 • model city raplcalculations\action leakage ratelfinal - rev 2\action leakage ra te calc - rev 2.docx
-~·
lfAlGolder \ZilAssociates
NYSDEC OHMS Document No. 201469232-00021
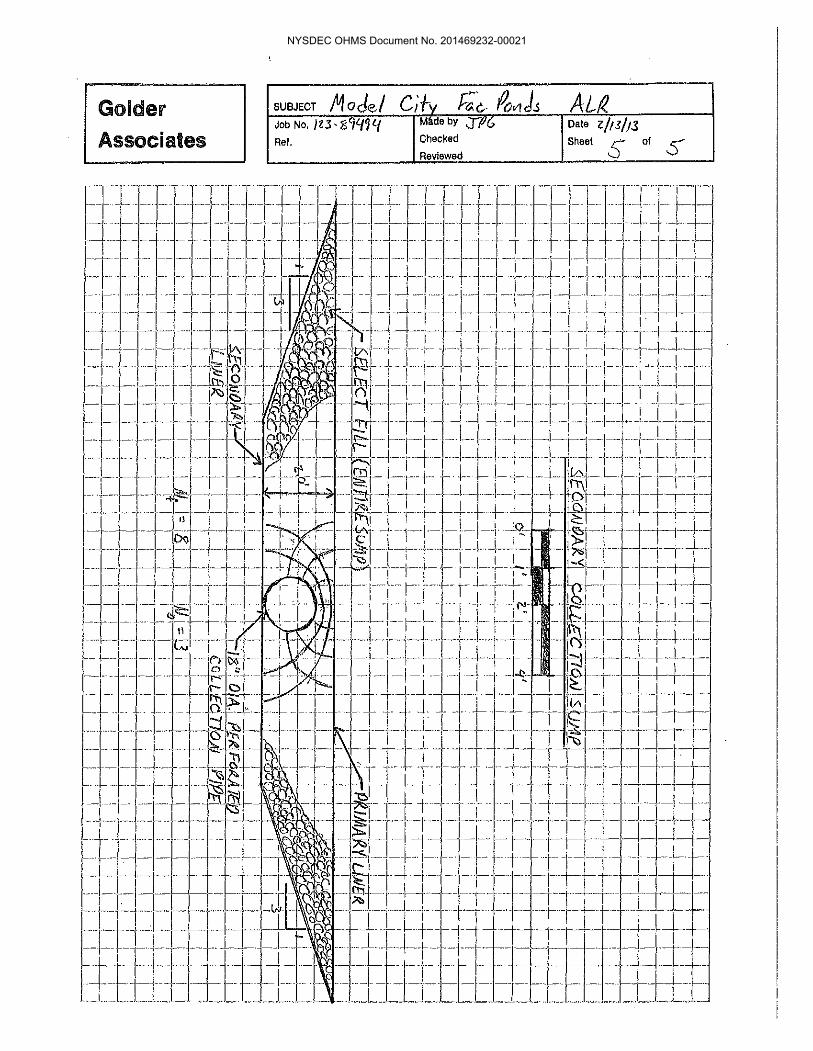
Golder
Associates
SUBJECT /11ode/ Job No, /l3, 8'14~ lf Ref,
C/fv r;; e- fovi J.s M•de by JJI& Checked
Reviewed
A.LR. Date Z/!3/J3 Sheet s of s
NYSDEC OHMS Document No. 201469232-00021
APPENDIX B
Response Rate (RR) Calculation
NYSDEC OHMS Document No. 201469232-00021
{fJl Golder Associates CALCULATIONS
Date: April 16, 2013 Made by: BJG Revised November 4, 2013
Checked by: JPG Project No.: 123-89494 Revised by: MTW
Subject:
Project Short Title:
Checked by: ~ { l Response Rate Calcu lation Reviewed by: \.f!!J 11 4- ( ~ FACUL TATIVE POND RESPONSE ACTION PLAN FOR RMU-2 EXPANSION
In accordance with 6 NYCRR Part 373.2-11 regulations, the computed action leakage rate (ALR) must
include a Response Rate (RR) calculation. The RR calculation includes the likelihood and amounts of
other sources of liquids in the leak detection system (LOS) calculated for Facultative (FAC) Pond 5 as
part of the RMU-2 expansion. This revision of the calculation includes only Fae Pond 5.
1.0 OBJECTIVE
Quantify the leakage Response Rate in FAC Pond 5 at the Model City Landfill.
2.0 METHOD
The Response Rate is equal to the maximum anticipated inflow to the LDS from all likely sources.
Permeation through the primary and secondary geomembrane layers and leakage through the secondary
geomembrane will be combined to calculate the maximum anticipated inflow.
3.0 REFERENCES
1. "Soil Mechanics and Foundations," 2"d Edition, Budhu, 2007.
2. "Response Action Plan Residuals Management Unit 2," prepared by Arcadis, April 2003. Revised August 2013.
3. "Response Action Plan Residuals Management Unit 1 Model City TSDR Facility," prepared by RUST Environment and Infrastructure, February 1993.
4. "Hydrologic Evaluation of Landfill Performance (HELP) Model Engineering Documentation: Version 3," U.S. Environmental Protection Agency, August 1994.
5. "Hydrologic Evaluation of Landfill Performance (HELP) Model User's Guide: Version 3," U.S. Environmental Protection Agency, September 1994.
6. Fae Pond Permit Drawing No. 3 "Fae Pond Grading Plans" prepared by Arcadis of New York, Inc., August 2009. Revised November 2013.
7. Fae Pond Permit Drawing No. 4 "Fae Pond Sections and Details" prepared by Arcadis of New York, Inc., August 2009. Revised November 2013.
8. 6 NYC RR Subpart 373.2-11 Surface Impoundments, effective September 6, 2006.
9. "Upper Tills Unit Potentiometric Surface Contours October 2011" drawing prepared by Golder Associates Inc. dated January 2012.
g:lprojects\2013\123-89494 - model city rap\calculationslresponse rate calcs\final - rev 5\response rate leakage - rev 5.docx
Golder Associates Inc. 10 Canal Street, Suite 217
Bristol, PA 19007 USA Tel: (215) 826-1560 Fax: (215) 826-9458 www.golder.com
Golder Associates: Operations in Africa, Asia, Australasia, Europe, North America and South America
Golder, Golder Associates and the GA globe design are trademarks of Golder Associates Corporation
NYSDEC OHMS Document No. 201469232-00021
CWM Chemical Services, LLC. 2 November 2013
123-89494
4.0 ASSUMPTIONS
1) Manufacturing defects in the primary geomembrane occur at a rate of 1 per acre and are approximately 1 mm in diameter (Reference 4).
2) Installation defects in the primary geomembrane occur at a rate of 5 per acre and are assumed to be 1 cm2 in area (Reference 4).
3) Manufacturing defects in the secondary geomembrane occur at a rate of 1 per acre and are approximately 1 mm in diameter (Reference 4).
4) Installation defects in the secondary geomembrane occur at a rate of 5 per acre and are assumed to be 1 cm2 in area (Reference 4).
5) The liner system cross section is composed (working from top to bottom) of a primary 30-mil Ethylene lnterpolymer Alloy (EIA) geomembrane, a 200-mil Geosynthetic Clay Liner (GCL), a geocomposite drainage layer, a secondary 30-mil EIA geomembrane, and a 3-foot thick layer of compacted clay. The hydraulic conductivity of the EIA liner is assumed to be 2x10·11 cm/s, which is one of the highest hydraulic conductivities for geomembrane materials listed in the HELP Engineering Document (Reference 4). The hydraul ic conductivity of the GCL is assumed to be 5x10·9 cm/s (Reference 2), and the hydraulic conductivity of the compacted clay is assumed to be 1x10·7 cm/s (Reference 2).
6) The combined effective hydraulic conductivity through two or more layers is calculated using the procedure described in Reference 5.
5.0 CALCULATION
5.1 Leakage Through the Primary Liner System
The leakage of liquid stored in the pond through the primary liner system is influenced by the number and
size of small defects in the geomembrane and the transmissivity of the GCL layer directly below.
Assumptions 1 and 2 outline the estimated defects due to manufacturing and installation per the EPA's
HELP Model Engineering Documents (Reference 4). Leakage through these geomembrane defects is
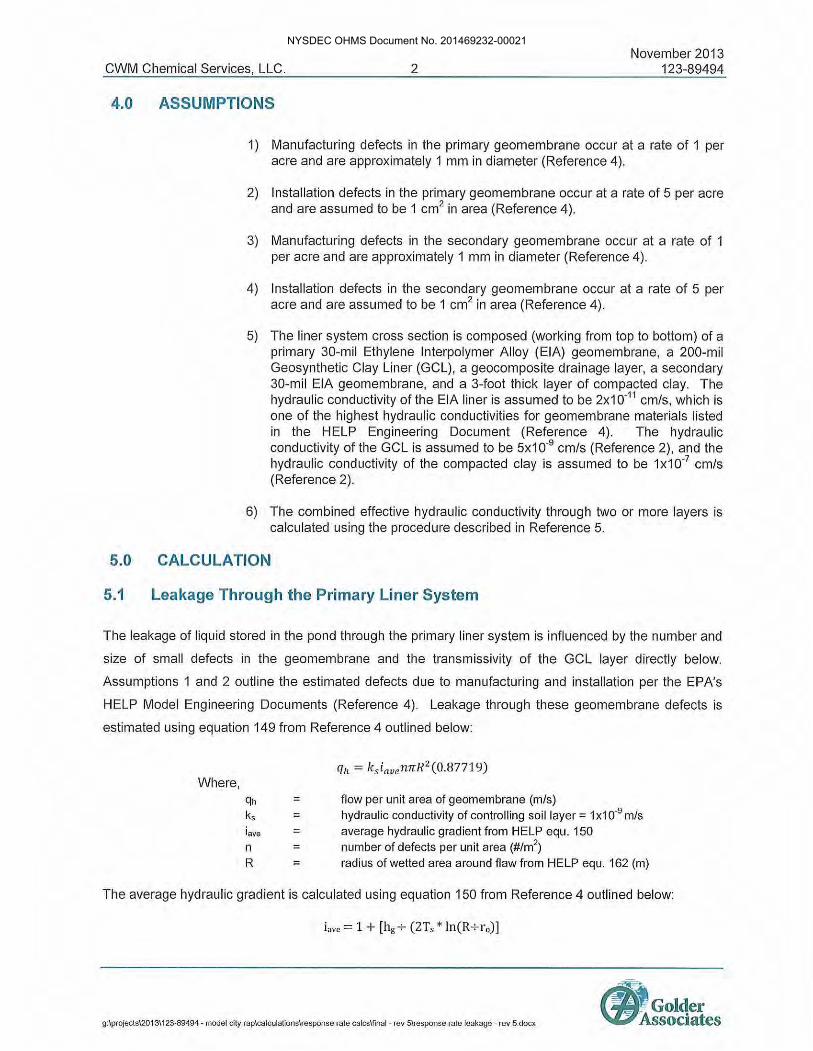
estimated using equation 149 from Reference 4 outlined below:
Where, qh ks iave n R
= = = = =
flow per unit area of geomembrane (m/s) hydraulic conductivity of controlling soil layer= 1x10⁻⁹ m/s average hydraulic gradient from HELP equ. 150 number of defects per unit area (#/m2
)
radius of wetted area around flaw from HELP equ. 162 (m)
The average hydraulic gradient is calculated using equation 150 from Reference 4 outlined below:
iavc = 1 + [hg+ (2Ts * ln(R+ r 0 )]
g:lprojecls\20131123·89494 · model city raplcalculalionslresponse rate calcslfinal - rev 5\response rate leakage - rev 5.docx
cf' Golder Associates
NYSDEC OHMS Document No. 201469232-00021
CWM Chemical Services, LLC.
Where, hg Ts ro
= = =
3
hydraulic head on secondary layer (m) thickness of controlling soil layer (m) radius of defect (m)
November 2013 123-89494
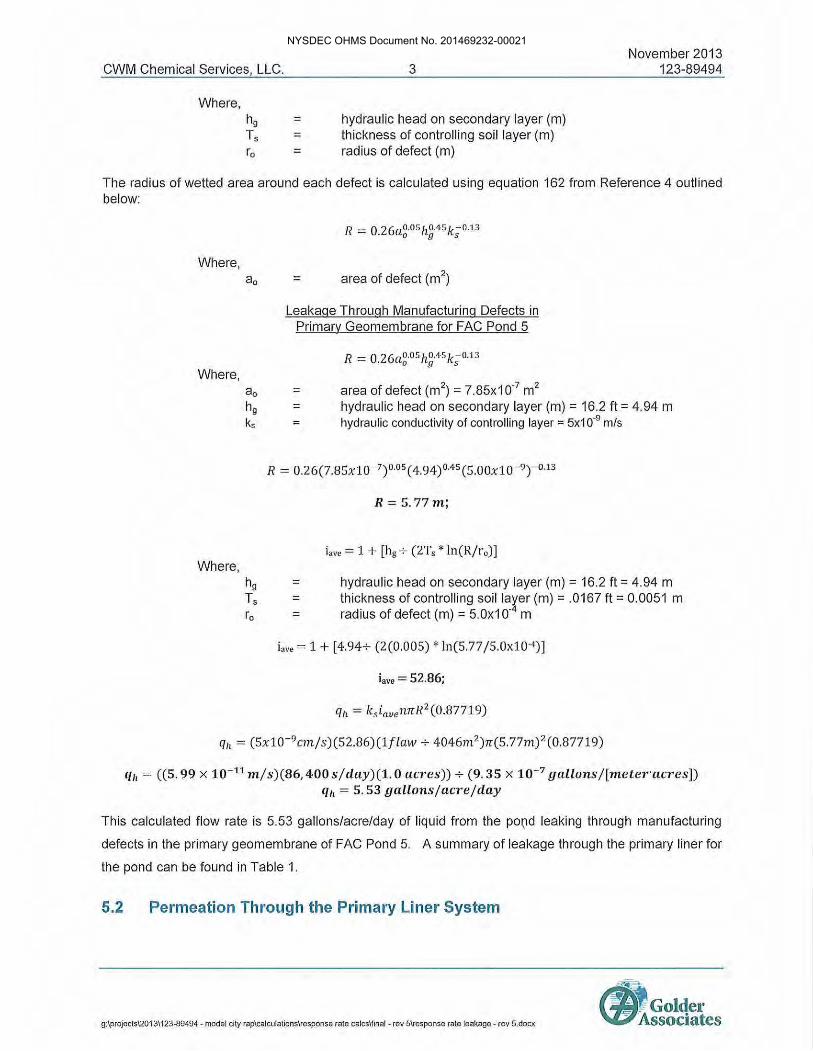
The radius of wetted area around each defect is calculated using equation 162 from Reference 4 outlined below:
Where,
Where,
Where , hg Ts ro
= area of defect (m2)
Leakage Through Manufacturing Defects in Primary Geomembrane for FAC Pond 5
= = =
= = =
area of defect (m2) = 7.85x10⁻⁷ m2
hydraulic head on secondary layer (m) = 16.2 ft= 4.94 m hydraulic conductivity of controlling layer = 5x10⁻⁹ m/s
R = 5.77m;
iave = 1 + [hg+ (2Ts * ln(R/ro))
hydraulic head on secondary layer (m) = 16.2 ft = 4.94 m thickness of controlling soil layer (m) = .0167 ft= 0.0051 m radius of defect (m) = 5.0x10⁻⁴ m
i.,ve = 1 + [4.94+ (2(0.005) * ln(S.77 /5.0xl0-4))
i ave = 52.86;
q11 = (Sx10- 9cm./s)(52.86)(1flaw ...;-- 4046m2)n(5.77m) 2 (0.87719)
q11 = ((5.99 x 10- 11 m / s)(86,400s/ day) (1. O acres))...;-- (9. 35 x 10- 7 gallons/[meteracres]) qh = 5. 53 gallons/acre/ day
This calculated flow rate is 5.53 gallons/acre/day of liquid from the po(.1d leaking through manufacturing
defects in the primary geomembrane of FAC Pond 5. A summary of leakage through the primary liner for
the pond can be found in Table 1.
5.2 Permeation Through the Primary Liner System
g:\projects\2013\123-89494 - model city rap\ca /cu/ations\response rate ca/cs\final - rev 5\response rate leakage - rev 5.docx
~~
lfAl Golde1· \ZP Associates
NYSDEC OHMS Document No. 201469232-00021
CWM Chemical Services, LLC. 4 November 2013
123-89494
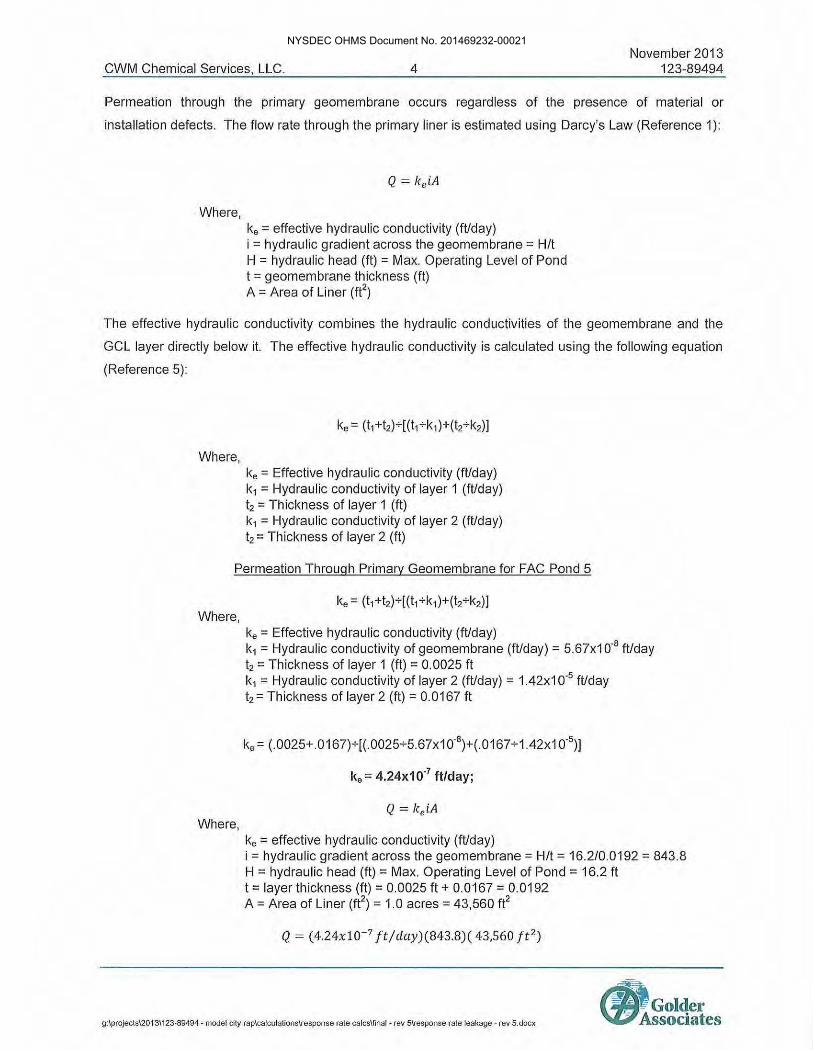
Permeation through the primary geomembrane occurs regardless of the presence of material or
installation defects. The flow rate through the primary liner is estimated using Darcy's Law (Reference 1 ):
Where, ke = effective hydraulic conductivity (fUday) i = hydraulic gradient across the geomembrane = H/t H = hydraulic head (ft) = Max. Operating Level of Pond t = geomembrane thickness (ft) A = Area of Liner (ft2)
The effective hydraulic conductivity combines the hydraulic conductivities of the geomembrane and the
GCL layer directly below it. The effective hydraulic conductivity is calculated using the following equation
(Reference 5):
Where, ke = Effective hydraulic conductivity (fUday) k1 = Hydraulic conductivity of layer 1 (fUday) t2 = Thickness of layer 1 (ft) 1<1 = Hydraulic conductivity of layer 2 (fUday) t2 = Thickness of layer 2 (ft)
Permeation Through Primary Geomembrane for FAC Pond 5
Where,
Where,
ke = Effective hydraulic conductivity (fUday) k1 = Hydraulic conductivity of geomembrane (fUday) = 5.67x10⁻⁸ ft/day t2 = Thickness of layer 1 (ft) = 0.0025 ft k1 = Hydraulic conductivity of layer 2 (fUday) = 1.42x10⁻⁵ fUday t2 =Thickness of layer 2 (ft) = 0.0167 ft
ke = (.0025+.0167)+((.0025+5.67X10⁻⁸)+(.0167+1.42X1 ff5)j
ke= 4.24x10⁻⁷ ft/day;
ke = effective hydraulic conductivity (fUday) i = hydraulic gradient across the geomembrane = H/t = 16.2/0.0192 = 843.8 H = hydraulic head (ft) = Max. Operating Level of Pond = 16.2 ft t = layer thickness (ft) = 0.0025 ft+ 0.0167 = 0.0192 A = Area of Liner (ft2
) = 1.0 acres= 43,560 ft2
Q = (4.24x10- 7 ft/day)(843.8)( 43,560 ft 2)
g:l projecls\201311 23·89494 - model city rap\calculalions\response rale calcslfinal - rev 5\response rale leakage - rev 5.docx
<fl' Golder Associates
NYSDEC OHMS Document No. 201469232-00021
CWM Chemical Services, LLC. 5
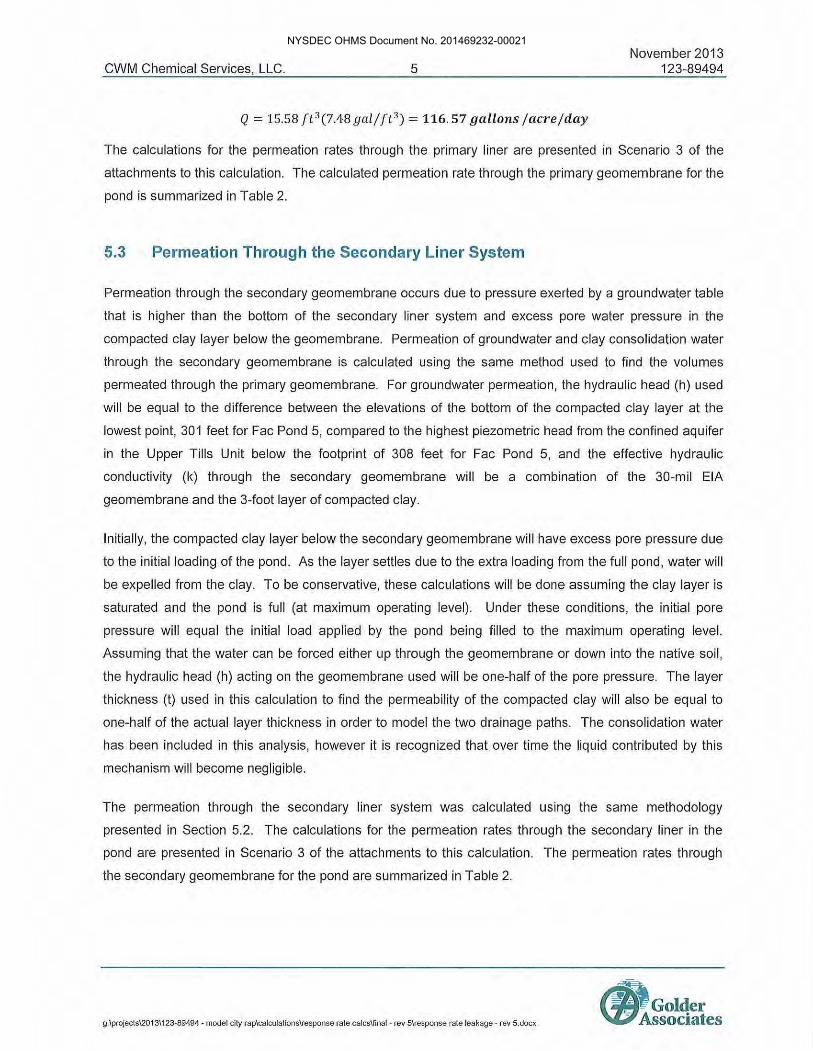
Q = 15.58 ft 3 (7.48 gal/ft3 ) = 116. 57 gallons / acre/ day
November 2013 123-89494
The calculations for the permeation rates through the primary liner are presented in Scenario 3 of the
attachments to this calculation. The calculated permeation rate through the primary geomembrane for the
pond is summarized in Table 2.
5.3 Permeation Through the Secondary Liner System
Permeation through the secondary geomembrane occurs due to pressure exerted by a groundwater table
that is higher than the bottom of the secondary liner system and excess pore water pressure in the
compacted clay layer below the geomembrane. Permeation of groundwater and clay consolidation water
through the secondary geomembrane is calculated using the same method used to find the volumes
permeated through the primary geomembrane. For groundwater permeation, the hydraulic head (h) used
will be equal to the difference between the elevations of the bottom of the compacted clay layer at the
lowest point, 301 feet for Fae Pond 5, compared to the highest piezometric head from the confined aquifer
in the Upper Tills Unit below the footprint of 308 feet for Fae Pond 5, and the effective hydraulic
conductivity (k) through the secondary geomembrane will be a combination of the 30-mil EIA
geomembrane and the 3-foot layer of compacted clay.
Initially, the compacted clay layer below the secondary geomembrane will have excess pore pressure due
to the initial loading of the pond. As the layer settles due to the extra loading from the full pond, water will
be expelled from the clay. To be conservative, these calculations will be done assuming the clay layer is
saturated and the pond is full (at maximum operating level). Under these conditions, the initial pore
pressure will equal the initial load applied by the pond being filled to the maximum operating level.
Assuming that the water can be forced either up through the geomembrane or down into the native soil ,
the hydraulic head (h) acting on the geomembrane used will be one-half of the pore pressure. The layer
thickness (t) used in this calculation to find the permeability of the compacted clay will also be equal to
one-half of the actual layer thickness in order to model the two drainage paths. The consolidation water
has been included in this analysis, however it is recognized that over time the liquid contributed by this
mechanism will become negligible.
The permeation through the secondary liner system was calculated using the same methodology
presented in Section 5.2. The calculations for the permeation rates through the secondary liner in the
pond are presented in Scenario 3 of the attachments to this calculation . The permeation rates through
the secondary geomembrane for the pond are summarized in Table 2.
g:lprojecls\20131123-89494 - model city raplcalculal ions\response rate calcs\final - rev 5\response rate leakage - re\/ 5 .docx
~Golder Associates
NYSDEC OHMS Document No. 201469232-00021
CWM Chemical Services, LLC. 6 November 2013
123-89494
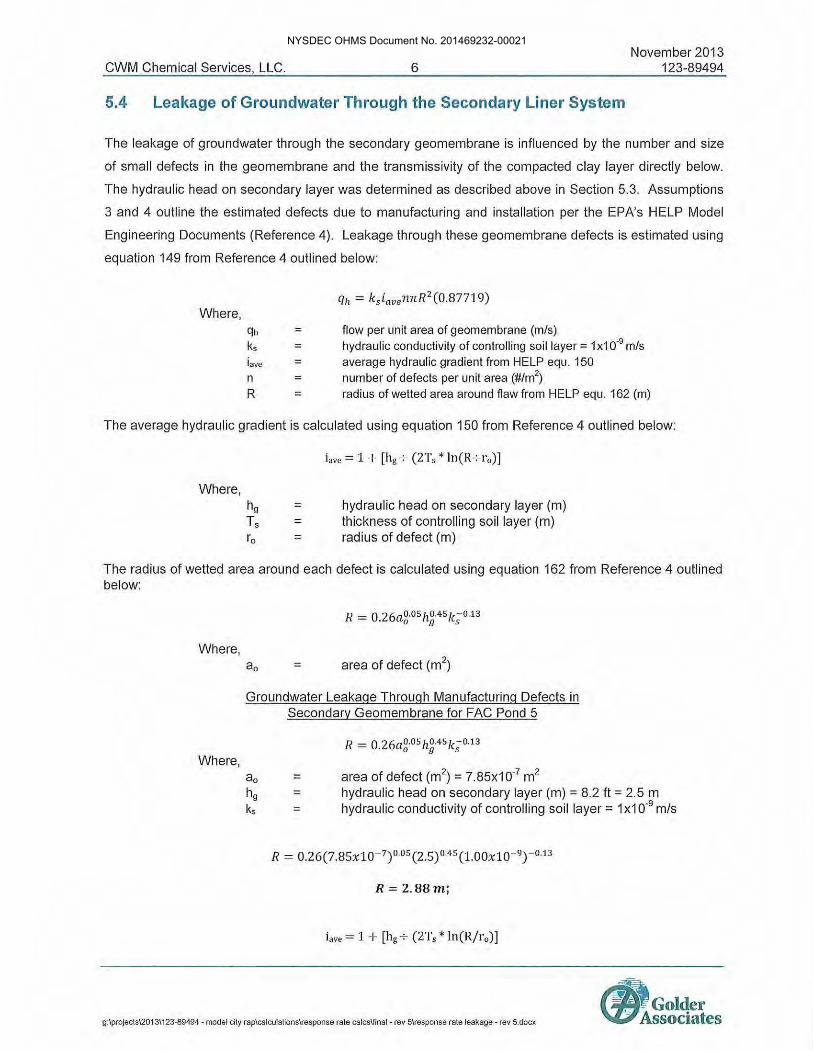
5.4 Leakage of Groundwater Through the Secondary Liner System
The leakage of groundwater through the secondary geomembrane is influenced by the number and size
of small defects in the geomembrane and the transmissivity of the compacted clay layer directly below.
The hydraulic head on secondary layer was determined as described above in Section 5.3. Assumptions
3 and 4 outline the estimated defects due to manufacturing and installation per the EPA's HELP Model
Engineering Documents (Reference 4). Leakage through these geomembrane defects is estimated using
equation 149 from Reference 4 outlined below:
Where, qh ks iave n R
= = = =
flow per unit area of geomembrane (m/s) hydraulic conductivity of controlling soil layer = 1x10·9 m/s average hydraulic gradient from HELP equ. 150 number of defects per unit area (#/m2
)
radius of wetted area around flaw from HELP equ. 162 (m)
The average hydraulic gradient is calculated using equation 150 from Reference 4 outlined below:
Where, hg Ts ro
= = =
iave = 1 + [hg+ (2Ts * ln(R+ro)]
hydraulic head on secondary layer (m) thickness of controlling soil layer (m) radius of defect (m)
The radius of wetted area around each defect is calculated using equation 162 from Reference 4 outlined below:
Where,
Where,
= area of defect (m2)
Groundwater Leakage Through Manufacturing Defects in Secondary Geomembrane for FAC Pond 5
= = =
area of defect (m2) = 7.85x10·7 m2
hydraulic head on secondary layer (m) = 8.2 ft = 2.5 m hydraulic conductivity of controlling soil layer= 1x10·9 m/s
R = 2.88m;
iave = 1 + [hg+ (2Ts * ln(R/ro)]
g:lprojects\20131123-89494 - model city rap\calculations\response rate calcs\final - rev 5\response rate leakage - rev 5.docx
(f/Jt Golder Associates
NYSDEC OHMS Document No. 201469232-00021
CWM Chemical Services, LLC. 7 November 2013
123-89494
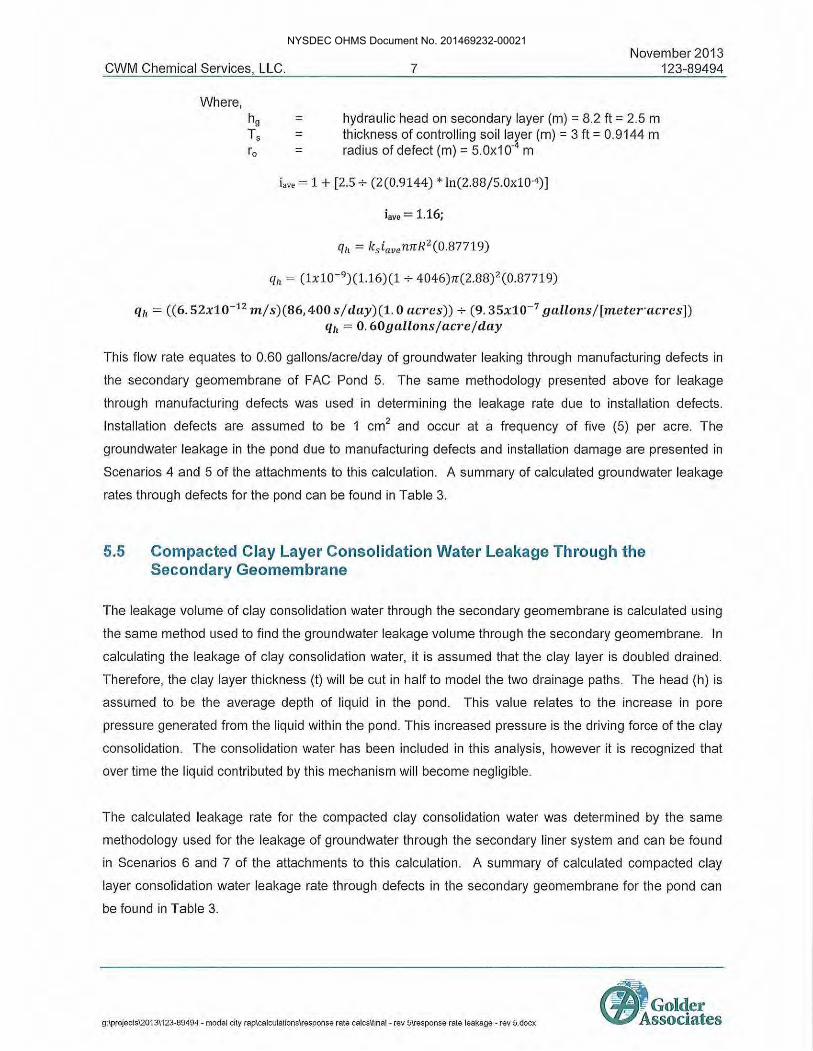
Where, hg Ts ro
= = =
hydraulic head on secondary layer (m) = 8.2 ft= 2.5 m thickness of controlling soil layer (m) = 3 ft= 0.9144 m radius of defect (m) = 5.0x10⁻⁴ m
iave = 1 + [2.5 + (2(0.9144) * ln(2.88/5.0x10·4)]
iavc = 1.16;
lfh = (lxl0-9)(1.16)(1+4046)rr(2.88)2 (0.87719)
q1, = ((6. 52x10-12 m/s)(86, 400 s/day)(l. 0 acres))+ (9. 35x10-7 gallons/[meteracres]) q1, = 0. 60gallonsjacrejday
This flow rate equates to 0.60 gallons/acre/day of groundwater leaking through manufacturing defects in
the secondary geomembrane of FAC Pond 5. The same methodology presented above for leakage
through manufacturing defects was used in determining the leakage rate due to installation defects.
Installation defects are assumed to be 1 cm2 and occur at a frequency of five (5) per acre. The
groundwater leakage in the pond due to manufacturing defects and installation damage are presented in
Scenarios 4 and 5 of the attachments to this calculation. A summary of calculated groundwater leakage
rates through defects for the pond can be found in Table 3.
5.5 Compacted Clay Layer Consolidation Water Leakage Through the Secondary Geomembrane
The leakage volume of clay consolidation water through the secondary geomembrane is calcu lated using
the same method used to find the groundwater leakage volume through the secondary geomembrane. In
calculating the leakage of clay consolidation water, it is assumed that the clay layer is doubled drained.
Therefore, the clay layer thickness (t) wi ll be cut in half to model the two drainage paths. The head (h) is
assumed to be the average depth of liquid in the pond. This value relates to the increase in pore
pressure generated from the liquid within the pond. This increased pressure is the driving force of the clay
consolidation. The consolidation water has been included in this analysis, however it is recognized that
over time the liquid contributed by this mechanism will become negligible.
The calculated leakage rate for the compacted clay consolidation water was determined by the same
methodology used for the leakage of groundwater through the secondary liner system and can be found
in Scenarios 6 and 7 of the attachments to this calculation. A summary of calculated compacted clay
layer consolidation water leakage rate through defects in the secondary geomembrane for the pond can
be found in Table 3.
g:l projects\2013\123-89494 - model city rap\calculationslrnsponse rate calcslfinal - rev 5\response rate leakage - rev 5.docx
~~
lfAl Golder \ZPAssociates
NYSDEC OHMS Document No. 201469232-00021
CWM Chemical Services, LLC.
6.0 CONCLUSIONS
8 November 2013
123-89494
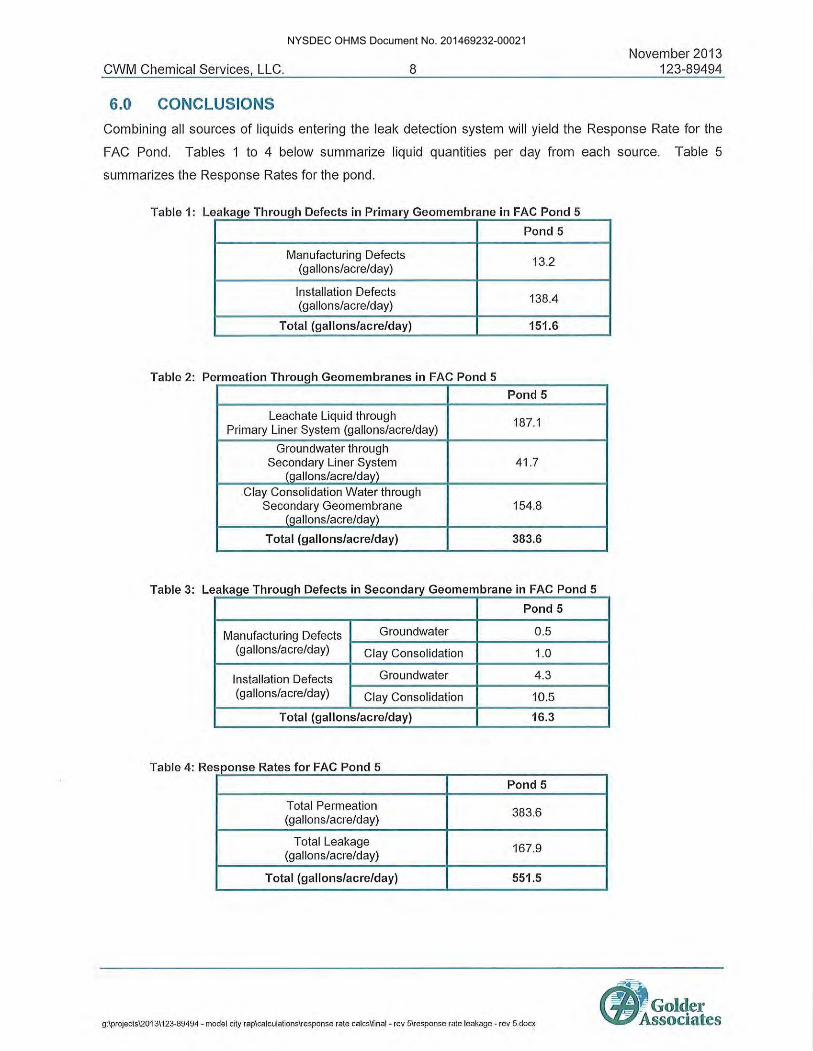
Combining all sources of liquids entering the leak detection system will yield the Response Rate for the
FAC Pond. Tables 1 to 4 below summarize liquid quantities per day from each source. Table 5
summarizes the Response Rates for the pond.
Table 1: Leakage Through Defects in Primary Geomembrane in FAC Pond 5
Pond 5
Manufacturing Defects 13.2 (gallons/acre/day)
Installation Defects 138.4 (gallons/acre/day)
Total (gallonslacrelday) 151.6
Table 2: Permeation Through Geomembranes in FAC Pond 5
Pond 5
Leachate Liquid through 187.1 Primary Liner System (gallons/acre/day)
Groundwater through Secondary Liner System 41 .7
(gallons/acre/day) Clay Consolidation Water through
Secondary Geomernbrane 154.8 (gallons/acre/day)
Total (gallonslacrelday) 383.6
Table 3: Leakage Through Defects in Secondary Geomembrane in FAC Pond 5
Pond 5
Manufacturing Defects Groundwater 0.5
(gallons/acre/day) Clay Consolidation 1.0
Installation Defects Groundwater 4.3
(gallons/acre/day) Clay Consolidation 10.5
Total (gallonslacrelday) 16.3
Table 4: Response Rates for FAC Pond 5
Pond 5
Total Permeation 383.6 (gallons/acre/day)
Total Leakage 167.9 (gallons/acre/day)
Total (gallonslacrelday) 551.5
g:lprojects\201 31123-89494 - model city raplcalculationslresponse rate calcs\final - rev 5\response rate leakage - rev 5.docx
NYSDEC OHMS Document No. 201469232-00021
CWM Chemical Services, LLC.
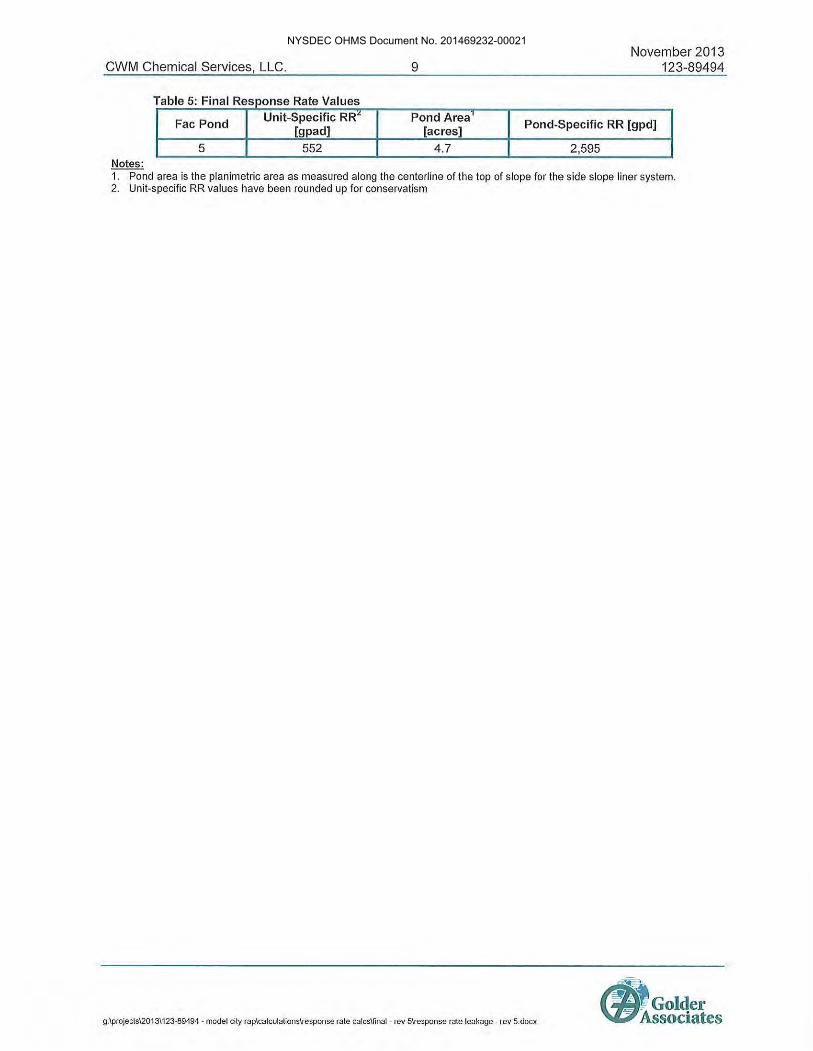
Table 5: Final Response Rate Values
Fae Pond Unit-Specific RR~
[gpad] 5 552
Notes:
9
Pond Area' [acres]
4.7
November 2013 123-89494
Pond-Specific RR [gpd]
2,595
1. Pond area is the planimetric area as measured along the centerline of the top of slope for the side slope liner system. 2. Unit-specific RR values have been rounded up for conservatism
g:lprojects\20131123·89494 - model city rap\calculalionslresponse rate calcs\final - rev 5\response rate leakage - rev 5.docx
~
lfAlGolder '2PAssociates
NYSDEC OHMS Document No. 201469232-00021
Model City Treatment, Storage, and Disposal Facility
Facultative Pond S Response Rate Calculations
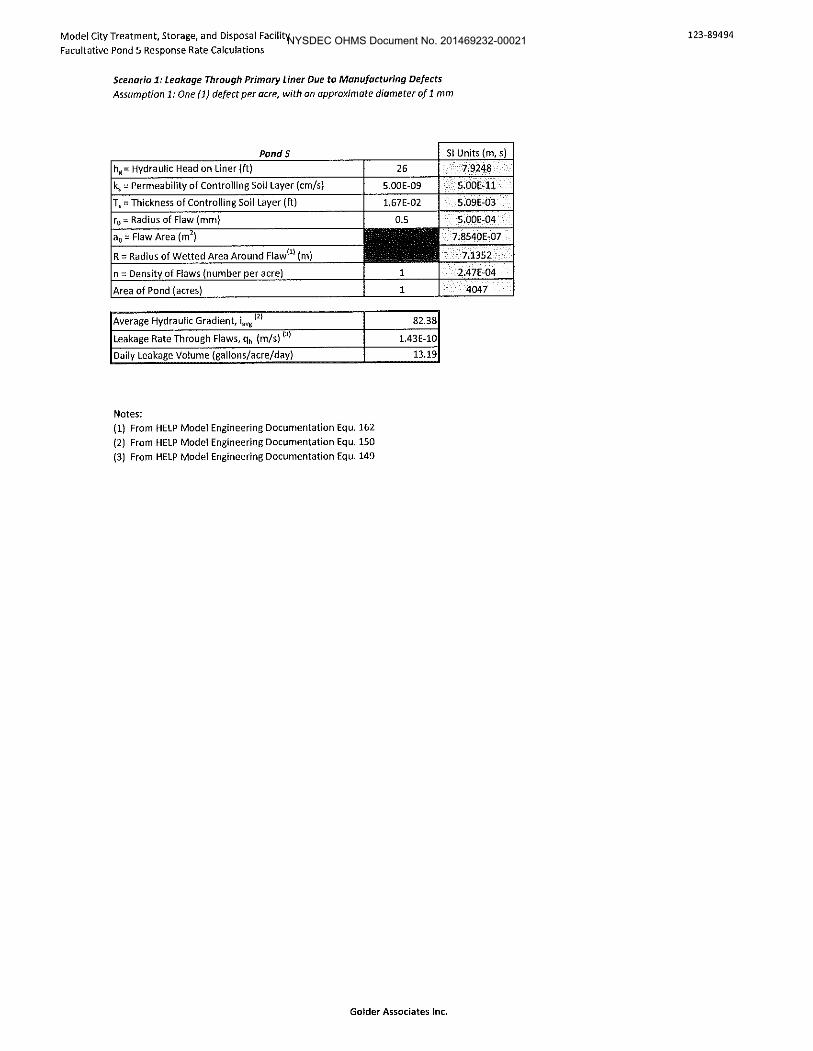
Scenario l: Leakage Through Primary Liner Due to Manufacturing Defects
Assumption 1: One (1) defect per acre, with an approximate diameter of 1 mm
Ponds
hg= Hydraulic Head on Liner {ft)
ks= Permeability of Controlling Soil Layer (emfs}
T, =Thickness of Controlling Soil Layer (ft)
r0 =Radius of Flaw (mm)
R =Radius of Wetted Area Around Flaw!1l (m}
n = Density of Flaws (number per acre)
Area of Pond (acres)
Average Hydraulic Gradient, iavg '" Leakage Rate Through Flaws, qh (m/s) !3
!
Daily Leakage Volume (gallons/acre/day)
Notes:
(1) From HELP Model Engineering Documentation Equ. 162
(2) From HELP Model Engineering Documentation Equ. 150
(3) From HELP Model Engineering Documentation Equ. 149
26
5.00E-09
1.67E-02
0.5
82.38
1.43E-10
13.19
Golder Associates Inc.
SI Units (m, s)
7.9248
5.00E-11
5.09E-03
5.00E-04
7.8540E-07
7.1352
2.47E-04
4047
123-89494 NYSDEC OHMS Document No. 201469232-00021

Model City Treatment, Storage, and Disposal Facility
Facultative Pond 5 Response Rate Calculations
Scenario 2: Leakage Through Primary Liner Due to Installation Defects
Assumption 1: Five (5) defects per acre, with an approximate diameter of 5.65 mm
Ponds
hg= Hydraulic Head on Liner (ft)
k5 =Permeability of Controlling Soil Layer (cm/s)
T, =Thickness of Controlling Soil Layer (ft)
r0 =Radius of Flaw (mm)
R = Radius of Wetted Area Around Flaw(l} (m)
n = Density of Flaws (number per acre)
Area of Pond (acres)
Average Hydraulic Gradient, iave ,,,
Leakage Rate Through Flaws, %i (m/s) (3l
Daily Leakage Volume (gallons/acre/day)
Notes:
(1) From HELP Model Engineering Documentation Equ. 162
{2) From HELP Model Engineering Documentation Equ. 150
{3) From HELP Model Engineering Documentation Equ. 149
26
5.00E-09
1.67E-02
5.65
106.43
1.SOE-09
138.38
Golder Associates Inc.
SI Units (m, s)
7.9248
5.00E-11
5.09E-03
5.65E-03
1.0029E-04
9.0931
1.24E-03
4047
123-89494 NYSDEC OHMS Document No. 201469232-00021
Model City Treatment, Storage, and Disposal Facility
Facultative Pond 5 Response Rate Calculations
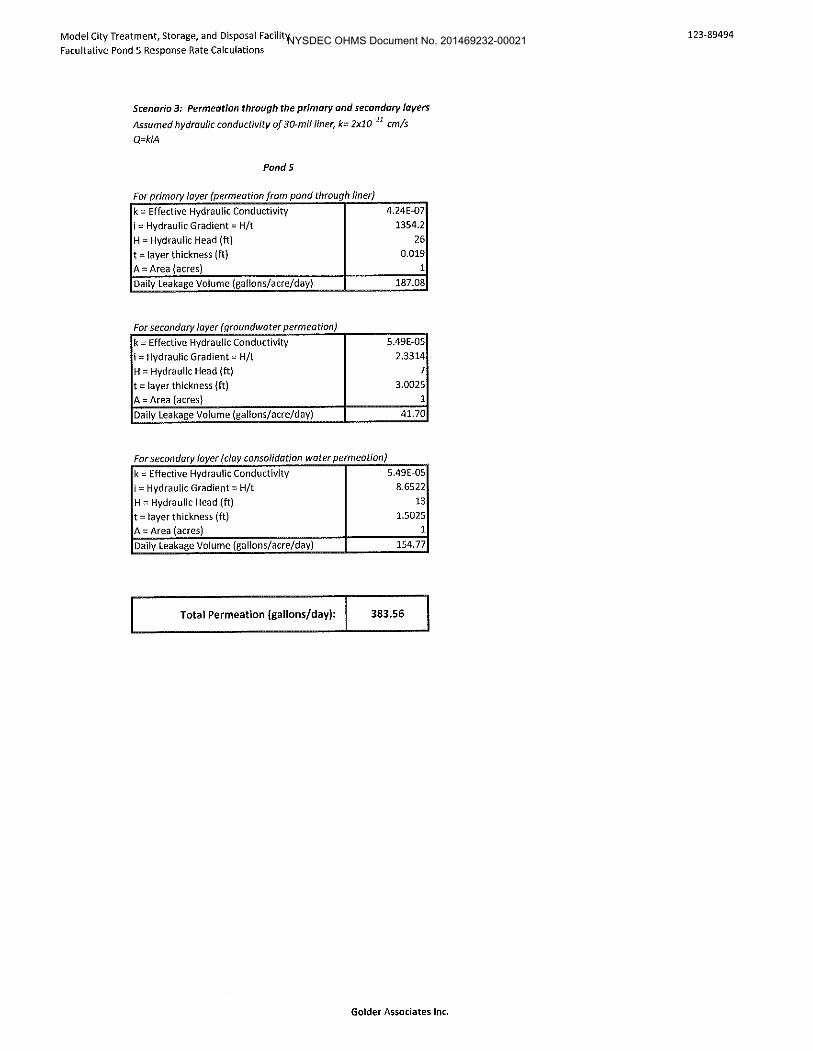
Scenario 3: Permeation through the primary and secondary layers
Assumed hydraulic conductivity of 30-mfl liner, k= 2x10-11 emfs Q=kiA
Pond5
For primary layer (permeation from pond through liner)
k = Effective Hydraulic Conductivity 4.24E-07
i = Hydraulic Gradient= H/t 1354.2
H =Hydraulic Head (ft) 26
t =layer thickness (ft) 0.019 A= Area (acres) 1
Daily Leakage Volume (gallons/acre/day) 187.08
For secondary layer (groundwater permeation)
k =Effective Hydraulic Conductivity 5.49E-05
i =Hydraulic Gradient= H/t 2.3314
H = Hydraulic Head (ft) 7 t =layer thickness (ft) 3.0025
A= Area (acres) 1
Daily leakage Volume (gallons/acre/day) 41.70
For secondary layer (clay consolidation water permeation) k = Effective Hydraulic Conductivity 5.49E-05
i =Hydraulic Gradient= H/t 8.6522
H =Hydraulic Head (ft) 13
t =layer thickness (ft) 1.5025 A= Area (acres) 1
Daily leakage Volume (gallons/acre/day) 154.77
Total Permeation {gallons/day): 383.56
Golder Associates Inc.
123-89494 NYSDEC OHMS Document No. 201469232-00021
Model City Treatment, Storage, and Disposal Facility
Facultative Pond 5 Response Rate Calculations
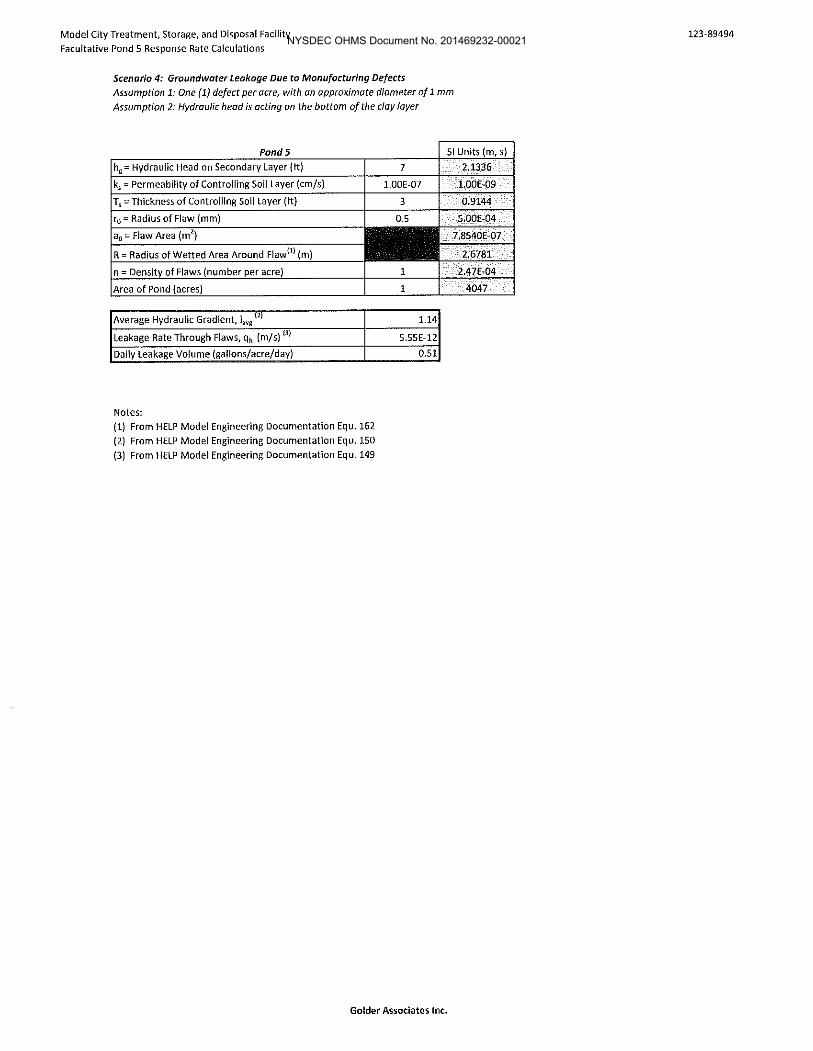
Scenario 4: Groundwater Leakage Due to Manufacturing Defects Assumption 1: One (1) defect per acre, with an approximate diameter of 1 mm
Assumption 2: Hydraulic head is acting on the bottom of the clay layer
Pond5 SI Units (m, s)
hg= Hydraulic Head on Secondary Layer (ft)
ks= Permeability of Controlling Soil Layer (cm/s)
T, =Thickness of Controlling Soil Layer (ft)
r0 =Radius of Flaw (mm)
a0 =Flaw Area (m 2)
R = Radius of Wetted Area Around Flaw11l (m)
n = Density of Flaws (number per acre)
Area of Pond {acres)
Average Hydraulic Gradient, iavg ,,,
Leakage Rate Through Flaws, qh (m/s) !3l
Daily leakage Volume (gallons/acre/day)
Notes:
(1) From HELP Model Engineering Documentation Equ. 162
(2) From HELP Model Engineering Documentation Equ. 150
(3) From HELP Model Engineering Documentation Equ. 149
7
1.00E-07
3
0.5
1.14
5.55E-12
0.51
Golder Associates Inc.
2.1336
1.00E-09
0.9144
5.00E-04
7;8540E-07
2.6781
2.47E-04
4047
123-89494 NYSDEC OHMS Document No. 201469232-00021

Model City Treatment, Storage, and Disposal Facility
Facultative Pond 5 Response Rate Calculations
Scenario 5: Groundwater leakage Due to /nsta/latian Defects Assumption 1: Five (5) defects per acre, with an approximate diameter of 5.65 mm Assumption 2: Hydraulic head is acting an the bottom of the clay layer
Ponds hg =Hydraulic Head on Secondary Layer (ft)
ks= Permeability of Controlling Soil Layer (emfs)
T~ =Thickness of Controlling Soil Layer {ft)
r0 =Radius of Flaw (mm)
a0 = Flaw Area (m2)
R = Radius of Wetted Area Around Flawp) (m)
n =Density of Flaws {number per acre)
Area of Pond (acres)
Average Hydraulic Gradient, iavg ,,,
Leakage Rate Through Flaws, qh (m/s) !3l
Daily Leakage Volume (gallons/acre/day)
Notes:
(1) From HELP Model Engineering Documentation Equ. 162
{2) From HELP Model Engineering Documentation Equ. 150
(3) From HELP Model Engineering Documentation Equ. 149
7
1.00E-07
3
5.65
1.18
4.69E-11
4.33
Golder Associates Inc.
SI Units {m, s)
2.1336
1.00E-09
0.9144
5.65E-03
1.0029E-04
3.4130
1.24E-03
4047
123-89494 NYSDEC OHMS Document No. 201469232-00021
Model City Treatment, Storage, and Disposal Facility
Facultative Pond 5 Response Rate Calculations
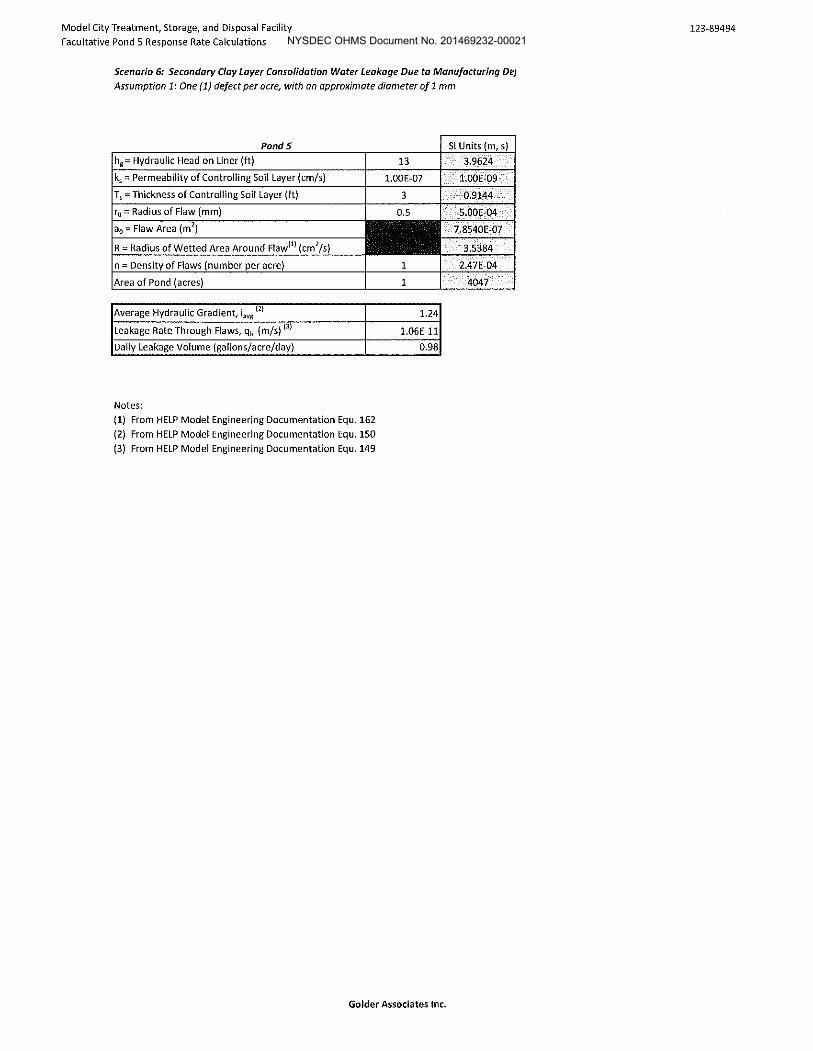
Scenario 6: Secondary Cloy Loyer Consolidation Water Leakage Due to Manufacturing De)
Assumption 1: One (1) defect per acre, with an approximate diameter of 1 mm
Ponds
hg= Hydraulic Head on Liner (ft)
k, =Permeability of Controlling Soil Layer (cm/s)
T5 =Thickness of Controlling Soil Layer(~)
r0 ::: Radius of Flaw (mm)
a0 = Flaw Area (m2)
R =Radius of Wetted Area Around Flaw(1l (cm2/s)
n = Density of Flaws (number per acre)
Area of Pond (acres)
Average Hydraulic Gradient, iavg "' Leakage Rate Through Flaws, qn (m/s) (J)
Daily Leakage Volume (gallons/acre/day)
Notes:
(1) From HELP Model Engineering Documentation Equ. 162
(2) From HELP Model Engineering Documentation Equ. 150
(3) From HELP Model Engineering Documentation Equ. 149
13
1.00E-07
3
0.5
1.24
1.06E-11
0.98
Golder Associates Inc.
Sl Units (m, s}
3.9624
1.00E-09
0.9144
S.OOE-04
7.8540E-07
3.5384
2.47E-04
4047
123-89494 NYSDEC OHMS Document No. 201469232-00021
Mode! City Treatment, Storage, and Disposal Facility
Facultative Pond 5 Response Rate Calculations
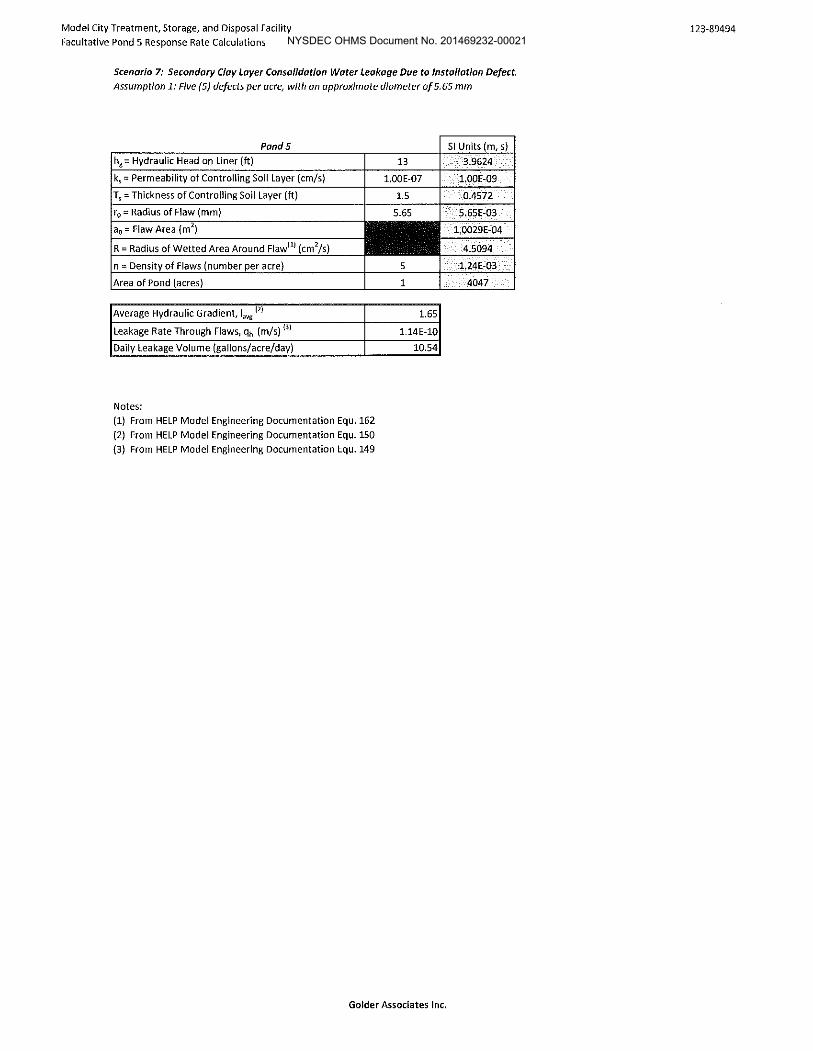
Scenario 7: Secondary Clay Layer Consolidation Water Leakage Due to lnstollatlan Defect. Assumption 1: Five (5) defects per acre, with an approximate diameter of 5.65 mm
Ponds hg= Hydraulic Head on Liner (ft)
k, =Permeability of Controlling Soil Layer (cm/s)
T, =Thickness of Controlling Soil Layer (ft)
r0 =Radius of Flaw (mm)
a0 =Flaw Area (m2)
R =Radius of Wetted Area Around Flawl 1l (cm2/s)
n =Density of Flaws (number per acre)
Area of Pond (acres)
Average Hydraulic Gradient, iavg ,,,
leakage Rate Through Flaws, qh (m/s) !3)
Daily leakage Volume (gallons/acre/day)
Notes:
(1) From HELP Model Engineering Documentation Equ. 162
(2) From HELP Model Engineering Documentation Equ. 150
(3) From HELP Model Engineering Documentation Equ. 149
13
1.00E-07
1.5
5.65
1.65
l.14E-10
10.54
Golder Associates Inc.
SI Units (m, s)
3.9624
1.00E-09
0.4572
5.65E-03
1.0029E-04
4.5094
1.24E-03
4047
123-89494 NYSDEC OHMS Document No. 201469232-00021