Appendix A- 4 Year Expenditure Trends at the Account Level ...
274
Appendix A- 4 Year Expenditure Trends at the Account Level by Program Department FY17 Actuals FY18 Actuals FY19 Final Budget FY20 Proposed Budget Administration 12 City Manager 120 City Manager 05 - Employee compensation 500.501 - Salaries Full Time 561,859 604,080 619,860 728,221 500.502 - Salaries Part Time 21,716 8,926 0 20,895 500.505 - Overtime 376 6 0 1,000 500.506 - Car Allowance 6,381 7,074 6,854 8,484 500.507 - Taxable Life Premium 0 0 46 0 500.513 - Sick Leave 120 0 0 0 05 - Employee compensation Total 590,452 620,086 626,760 758,600 10 - Employee benefits 501.500 - Retirement System 144,710 153,979 167,436 195,041 501.502 - Pers 1959 Surv Empr 202 206 218 237 501.505 - Health Insurance 38,457 48,845 50,007 58,789 501.506 - Dental Insurance 4,975 5,360 5,463 5,994 501.507 - Medicare 8,473 8,795 9,164 10,862 501.508 - Life Insurance 2,670 2,434 2,550 2,778 501.509 - Long Term Disability 2,986 3,930 4,199 4,818 501.510 - Workers Compensation 2,700 10,725 8,271 5,659 501.511 - Vision Insurance 636 617 651 706 501.513 - Rec Bucks 0 0 0 1,576 501.516 - Hra City Contribution 3,859 0 0 0 10 - Employee benefits Total 209,668 234,891 247,959 286,460 15 - Materials 600.601 - General Office Supplies 449 65 1,500 500 600.602 - Printing and Duplication 277 280 200 34,400 600.605 - Meeting Expenses 917 1,587 2,180 6,600 600.608 - Sml Tools and Equipment 6,708 0 2,000 1,200 600.613 - General Supplies 4,918 4,686 5,100 150 600.629 - Conference and Training 13,151 16,220 14,000 15,260 600.632 - Mileage Reimbursement 12 14 500 300 600.635 - Special Departmental Exp 15,046 15,349 16,200 0 600.636 - WV Mayors CM Meeting 0 0 300 4,000 600.642 - Telphone and Data Services 2,803 3,918 3,600 4,180 600.647 - Memberships and Dues 0 0 0 10,455 15 - Materials Total 44,281 42,119 45,580 77,045 20 - Contract services 700.702 - General Service Agreement 30,750 14,850 12,500 95,792 700.703 - Maintenance of Equipment 2,022 718 2,040 0 20 - Contract services Total 32,772 15,569 14,540 95,792 25 - Cost allocation 800.801 - Equipment Reimbursement 0 0 179 331 1
Transcript of Appendix A- 4 Year Expenditure Trends at the Account Level ...

Appendix A-4 Year Expenditure Trends at the Account Level by Program
Department
FY17 Actuals
FY18 Actuals
FY19 Final Budget
FY20 Proposed
BudgetAdministration
12 City Manager120 City Manager
05 - Employee compensation500.501 - Salaries Full Time 561,859 604,080 619,860 728,221500.502 - Salaries Part Time 21,716 8,926 0 20,895500.505 - Overtime 376 6 0 1,000500.506 - Car Allowance 6,381 7,074 6,854 8,484500.507 - Taxable Life Premium 0 0 46 0500.513 - Sick Leave 120 0 0 0
05 - Employee compensation Total 590,452 620,086 626,760 758,60010 - Employee benefits
501.500 - Retirement System 144,710 153,979 167,436 195,041501.502 - Pers 1959 Surv Empr 202 206 218 237501.505 - Health Insurance 38,457 48,845 50,007 58,789501.506 - Dental Insurance 4,975 5,360 5,463 5,994501.507 - Medicare 8,473 8,795 9,164 10,862501.508 - Life Insurance 2,670 2,434 2,550 2,778501.509 - Long Term Disability 2,986 3,930 4,199 4,818501.510 - Workers Compensation 2,700 10,725 8,271 5,659501.511 - Vision Insurance 636 617 651 706501.513 - Rec Bucks 0 0 0 1,576501.516 - Hra City Contribution 3,859 0 0 0
10 - Employee benefits Total 209,668 234,891 247,959 286,46015 - Materials
600.601 - General Office Supplies 449 65 1,500 500600.602 - Printing and Duplication 277 280 200 34,400600.605 - Meeting Expenses 917 1,587 2,180 6,600600.608 - Sml Tools and Equipment 6,708 0 2,000 1,200600.613 - General Supplies 4,918 4,686 5,100 150600.629 - Conference and Training 13,151 16,220 14,000 15,260600.632 - Mileage Reimbursement 12 14 500 300600.635 - Special Departmental Exp 15,046 15,349 16,200 0600.636 - WV Mayors CM Meeting 0 0 300 4,000600.642 - Telphone and Data Services 2,803 3,918 3,600 4,180600.647 - Memberships and Dues 0 0 0 10,455
15 - Materials Total 44,281 42,119 45,580 77,04520 - Contract services
700.702 - General Service Agreement 30,750 14,850 12,500 95,792700.703 - Maintenance of Equipment 2,022 718 2,040 0
20 - Contract services Total 32,772 15,569 14,540 95,79225 - Cost allocation
800.801 - Equipment Reimbursement 0 0 179 331
1

Appendix A-4 Year Expenditure Trends at the Account Level by Program
Department
FY17 Actuals
FY18 Actuals
FY19 Final Budget
FY20 Proposed
Budget800.802 - IT Reimbursement 41,361 31,937 55,094 40,092800.805 - CC CAP Allocation 11,096 0 0 0800.806 - CM CAP Allocation 2,057 0 0 0800.809 - City Clerk CAP Alloc 26,516 0 0 0800.810 - City Attorney CAP Alloc 204,079 0 0 0800.814 - Finance CAP Alloc 11,070 0 0 0800.815 - Human resources CAP Alloc 38,446 0 0 0800.817 - Community Hall/Quinlan CAP 21,019 0 0 0800.820 - Grounds Maintenance CAP 2,952 0 0 0800.821 - Building Maintenance CAP 39,080 0 0 0
25 - Cost allocation Total 397,676 31,937 55,273 40,42335 - Contingencies
719.705 - Contingencies 868 911 3,006 2,93735 - Contingencies Total 868 911 3,006 2,937
120 City Manager Total 1,275,718 945,513 993,118 1,261,257
2

Appendix A-4 Year Expenditure Trends at the Account Level by Program
Department
FY17 Actuals
FY18 Actuals
FY19 Final Budget
FY20 Proposed
Budget122 Sustainability Division
05 - Employee compensation500.501 - Salaries Full Time 151,519 158,712 200,120 160,321500.502 - Salaries Part Time 461 5,123 10,000 9,864500.505 - Overtime 0 0 0 2,000
05 - Employee compensation Total 151,981 163,835 210,120 172,18510 - Employee benefits
501.500 - Retirement System 39,017 40,579 53,794 42,879501.502 - Pers 1959 Surv Empr 91 97 93 84501.505 - Health Insurance 19,110 28,661 21,932 30,316501.506 - Dental Insurance 2,242 2,532 2,312 2,152501.507 - Medicare 2,166 2,275 2,903 2,325501.508 - Life Insurance 1,164 1,100 1,260 1,018501.509 - Long Term Disability 1,266 1,573 1,954 1,637501.510 - Workers Compensation 391 3,756 4,484 1,617501.511 - Vision Insurance 284 290 273 254501.513 - Rec Bucks 0 0 0 566501.516 - Hra City Contribution 745 0 0 0
10 - Employee benefits Total 66,474 80,863 89,005 82,84815 - Materials
600.601 - General Office Supplies 2,389 545 2,225 1,675600.602 - Printing and Duplication 6,569 15,240 15,200 11,300600.605 - Meeting Expenses 0 0 0 1,480600.608 - Sml Tools and Equipment 0 63 500 1,700600.613 - General Supplies 7,003 6,451 5,200 2,915600.618 - Utilities and Phone 0 0 1,000 0600.619 - Advertising and Legal Notices 4,058 563 6,600 5,100600.629 - Conference and Training 5,242 4,478 5,000 5,000600.632 - Mileage Reimbursement 220 585 500 600600.642 - Telphone and Data Services 1,994 912 0 912600.647 - Memberships and Dues 0 0 0 5,500
15 - Materials Total 27,475 28,837 36,225 36,18220 - Contract services
700.702 - General Service Agreement 73,530 159,491 145,000 134,850700.703 - Maintenance of Equipment 490 169 0 0700.704 - Insurance Fees, Claims, Premiums 3,617 1,652 2,000 4,000
20 - Contract services Total 77,637 161,313 147,000 138,85025 - Cost allocation
800.801 - Equipment Reimbursement 0 0 95 95800.802 - IT Reimbursement 21,732 31,077 27,740 20,187800.805 - CC CAP Allocation 8,915 6,172 3,483 5,316800.806 - CM CAP Allocation 2,415 1,972 1,459 1,955800.810 - City Attorney CAP Alloc 29,155 25,051 20,458 52,133
3

Appendix A-4 Year Expenditure Trends at the Account Level by Program
Department
FY17 Actuals
FY18 Actuals
FY19 Final Budget
FY20 Proposed
Budget800.814 - Finance CAP Alloc 9,382 11,489 17,647 20,816800.815 - Human resources CAP Alloc 37,704 35,432 37,632 12,145800.817 - Community Hall/Quinlan CAP 0 56,063 33,796 0800.820 - Grounds Maintenance CAP 1,301 0 0 0800.821 - Building Maintenance CAP 14,616 23,750 12,945 4,199
25 - Cost allocation Total 125,220 191,006 155,255 116,84631 - Special projects
750.018 - Climate Action Plan 0 65,510 191,000 0750.019 - Employee Commute Program 0 0 50,500 0900.943 - Climate Action Plan 25,242 0 0 0
31 - Special projects Total 25,242 65,510 241,500 035 - Contingencies
719.705 - Contingencies 0 0 9,161 8,75235 - Contingencies Total 0 0 9,161 8,752
122 Sustainability Division Total 474,029 691,363 888,266 555,663
4

Appendix A-4 Year Expenditure Trends at the Account Level by Program
Department
FY17 Actuals
FY18 Actuals
FY19 Final Budget
FY20 Proposed
Budget126 Public Affairs
05 - Employee compensation500.501 - Salaries Full Time 164,032 195,992 221,054 254,168500.502 - Salaries Part Time 0 828 4,940 0500.505 - Overtime 0 3 0 2,500500.506 - Car Allowance 0 138 240 0
05 - Employee compensation Total 164,032 196,961 226,234 256,66810 - Employee benefits
501.500 - Retirement System 40,093 50,612 59,501 67,979501.502 - Pers 1959 Surv Empr 104 117 129 160501.505 - Health Insurance 14,760 17,658 20,367 25,967501.506 - Dental Insurance 2,615 3,045 3,274 4,072501.507 - Medicare 2,331 2,821 3,284 3,685501.508 - Life Insurance 1,104 1,342 1,480 1,679501.509 - Long Term Disability 1,385 1,955 2,231 2,569501.510 - Workers Compensation 1,172 5,963 5,381 3,061501.511 - Vision Insurance 323 351 387 480501.513 - Rec Bucks 0 0 0 1,071501.516 - Hra City Contribution 695 0 0 0
10 - Employee benefits Total 64,581 83,865 96,034 110,72315 - Materials
600.601 - General Office Supplies 1,722 24 4,130 153600.602 - Printing and Duplication 48,174 42,967 52,188 47,349600.604 - Postage 30,159 37,000 37,000 38,325600.606 - Software 110 249 3,450 0600.608 - Sml Tools and Equipment 2,198 0 552 0600.613 - General Supplies 4,218 13,394 8,069 22,301600.619 - Advertising and Legal Notices 2,176 5,047 5,000 3,117600.629 - Conference and Training 1,695 0 7,000 3,577600.632 - Mileage Reimbursement 0 0 345 0600.635 - Special Departmental Exp 560 0 1,500 0600.642 - Telphone and Data Services 1,551 2,274 3,640 2,281600.647 - Memberships and Dues 0 0 0 1,687
15 - Materials Total 92,562 100,954 122,874 118,79020 - Contract services
700.701 - Training and Instruction 0 2,622 3,000 0700.702 - General Service Agreement 67,594 24,023 20,500 96,710700.703 - Maintenance of Equipment 973 338 2,500 0
20 - Contract services Total 68,566 26,983 26,000 96,71025 - Cost allocation
800.801 - Equipment Reimbursement 0 0 114 180800.802 - IT Reimbursement 5,731 42,550 28,966 21,078800.805 - CC CAP Allocation 687 1,124 3,483 0
5

Appendix A-4 Year Expenditure Trends at the Account Level by Program
Department
FY17 Actuals
FY18 Actuals
FY19 Final Budget
FY20 Proposed
Budget800.806 - CM CAP Allocation 192 353 1,451 0800.809 - City Clerk CAP Alloc 6,308 0 0 0800.810 - City Attorney CAP Alloc 24,358 0 0 0800.811 - Public Affairs CAP Alloc 0 4,664 4,727 7,183800.814 - Finance CAP Alloc 17,768 6,941 20,536 0800.815 - Human resources CAP Alloc 785 2,164 10,769 0800.817 - Community Hall/Quinlan CAP 46 0 0 0800.820 - Grounds Maintenance CAP 73 0 0 0800.821 - Building Maintenance CAP 840 2,511 695 0
25 - Cost allocation Total 56,787 60,307 70,741 28,44131 - Special projects
750.054 - Public Relations 0 0 0 50,00031 - Special projects Total 0 0 0 50,000
35 - Contingencies719.705 - Contingencies 0 0 8,019 7,775
35 - Contingencies Total 0 0 8,019 7,775126 Public Affairs Total 446,528 469,070 549,902 669,107
6

Appendix A-4 Year Expenditure Trends at the Account Level by Program
Department
FY17 Actuals
FY18 Actuals
FY19 Final Budget
FY20 Proposed
Budget632 Comm Outreach & Neigh Watch
05 - Employee compensation500.501 - Salaries Full Time 0 0 0 49,661500.502 - Salaries Part Time 0 0 0 36,815500.505 - Overtime 0 0 0 2,840
05 - Employee compensation Total 0 0 0 89,31610 - Employee benefits
501.500 - Retirement System 0 0 0 13,761501.502 - Pers 1959 Surv Empr 0 0 0 61501.505 - Health Insurance 0 0 0 9,798501.506 - Dental Insurance 0 0 0 1,537501.507 - Medicare 0 0 0 1,254501.508 - Life Insurance 0 0 0 727501.509 - Long Term Disability 0 0 0 553501.510 - Workers Compensation 0 0 0 924501.511 - Vision Insurance 0 0 0 181501.513 - Rec Bucks 0 0 0 404
10 - Employee benefits Total 0 0 0 29,20015 - Materials
600.601 - General Office Supplies 0 0 0 256600.602 - Printing and Duplication 0 0 0 511600.613 - General Supplies 0 0 0 9,665600.629 - Conference and Training 0 0 0 358600.647 - Memberships and Dues 0 0 0 153
15 - Materials Total 0 0 0 10,94320 - Contract services
700.702 - General Service Agreement 0 0 0 1,78920 - Contract services Total 0 0 0 1,789
25 - Cost allocation800.801 - Equipment Reimbursement 0 0 0 4800.802 - IT Reimbursement 0 0 0 6,761800.805 - CC CAP Allocation 0 0 0 3,016800.806 - CM CAP Allocation 0 0 0 1,060800.811 - Public Affairs CAP Alloc 0 0 0 4,641800.814 - Finance CAP Alloc 0 0 0 15,782800.815 - Human resources CAP Alloc 0 0 0 8,795800.821 - Building Maintenance CAP 0 0 0 3,041
25 - Cost allocation Total 0 0 0 43,100632 Comm Outreach & Neigh Watch Total 0 0 0 174,348
7

Appendix A-4 Year Expenditure Trends at the Account Level by Program
Department
FY17 Actuals
FY18 Actuals
FY19 Final Budget
FY20 Proposed
Budget633 Disaster Preparedness
05 - Employee compensation500.501 - Salaries Full Time 0 0 0 88,435500.502 - Salaries Part Time 0 0 0 36,630500.505 - Overtime 0 0 0 2,000500.507 - Taxable Life Premium 0 0 0 531
05 - Employee compensation Total 0 0 0 127,59610 - Employee benefits
501.500 - Retirement System 0 0 0 24,129501.502 - Pers 1959 Surv Empr 0 0 0 58501.505 - Health Insurance 0 0 0 9,308501.506 - Dental Insurance 0 0 0 1,460501.507 - Medicare 0 0 0 1,282501.508 - Life Insurance 0 0 0 691501.509 - Long Term Disability 0 0 0 944501.510 - Workers Compensation 0 0 0 1,097501.511 - Vision Insurance 0 0 0 172501.513 - Rec Bucks 0 0 0 384
10 - Employee benefits Total 0 0 0 39,52515 - Materials
600.601 - General Office Supplies 0 0 0 500600.602 - Printing and Duplication 0 0 0 1,850600.605 - Meeting Expenses 0 0 0 2,900600.608 - Sml Tools and Equipment 0 0 0 8,364600.613 - General Supplies 0 0 0 13,900600.629 - Conference and Training 0 0 0 7,000600.632 - Mileage Reimbursement 0 0 0 1,270600.642 - Telphone and Data Services 0 0 0 2,726600.647 - Memberships and Dues 0 0 0 325
15 - Materials Total 0 0 0 38,83520 - Contract services
700.701 - Training and Instruction 0 0 0 6,00020 - Contract services Total 0 0 0 6,000
25 - Cost allocation800.801 - Equipment Reimbursement 0 0 0 54,351800.802 - IT Reimbursement 0 0 0 19,254800.805 - CC CAP Allocation 0 0 0 2,624800.806 - CM CAP Allocation 0 0 0 921800.811 - Public Affairs CAP Alloc 0 0 0 4,052800.814 - Finance CAP Alloc 0 0 0 14,658800.815 - Human resources CAP Alloc 0 0 0 7,678800.821 - Building Maintenance CAP 0 0 0 2,655
25 - Cost allocation Total 0 0 0 106,193
8

Appendix A-4 Year Expenditure Trends at the Account Level by Program
Department
FY17 Actuals
FY18 Actuals
FY19 Final Budget
FY20 Proposed
Budget31 - Special projects
750.053 - Continuity of Operations Annex 0 0 0 75,00031 - Special projects Total 0 0 0 75,000
633 Disaster Preparedness Total 0 0 0 393,149
9

Appendix A-4 Year Expenditure Trends at the Account Level by Program
Department
FY17 Actuals
FY18 Actuals
FY19 Final Budget
FY20 Proposed
Budget705 Economic Development
05 - Employee compensation500.501 - Salaries Full Time 0 0 0 79,716
05 - Employee compensation Total 0 0 0 79,71610 - Employee benefits
501.500 - Retirement System 0 0 0 21,321501.507 - Medicare 0 0 0 1,156501.510 - Workers Compensation 0 0 0 1,155
10 - Employee benefits Total 0 0 0 23,63215 - Materials
600.601 - General Office Supplies 0 0 0 250600.602 - Printing and Duplication 0 0 0 9,750600.605 - Meeting Expenses 0 0 0 1,845600.608 - Sml Tools and Equipment 0 0 0 4,740600.613 - General Supplies 0 0 0 24,800600.629 - Conference and Training 0 0 0 3,600600.632 - Mileage Reimbursement 0 0 0 200600.635 - Special Departmental Exp 0 0 0 7,900
15 - Materials Total 0 0 0 53,08520 - Contract services
700.702 - General Service Agreement 0 0 0 141,98820 - Contract services Total 0 0 0 141,988
25 - Cost allocation800.801 - Equipment Reimbursement 0 0 0 197800.802 - IT Reimbursement 0 0 0 12,524800.805 - CC CAP Allocation 0 0 0 2,037800.806 - CM CAP Allocation 0 0 0 756800.814 - Finance CAP Alloc 0 0 0 10,728800.815 - Human resources CAP Alloc 0 0 0 4,397800.821 - Building Maintenance CAP 0 0 0 1,520
25 - Cost allocation Total 0 0 0 32,159705 Economic Development Total 0 0 0 330,580
12 City Manager Total 2,196,275 2,105,947 2,431,286 3,384,104
10

Appendix A-4 Year Expenditure Trends at the Account Level by Program
Department
FY17 Actuals
FY18 Actuals
FY19 Final Budget
FY20 Proposed
Budget13 City Clerk
130 City Clerk05 - Employee compensation
500.501 - Salaries Full Time 306,922 309,090 288,103 281,437500.502 - Salaries Part Time 0 0 48,418 0500.505 - Overtime 2,387 4,012 3,456 8,000500.506 - Car Allowance 3,000 3,000 3,000 3,030
05 - Employee compensation Total 312,309 316,102 342,977 292,46710 - Employee benefits
501.500 - Retirement System 75,838 77,553 82,162 75,273501.502 - Pers 1959 Surv Empr 172 162 150 152501.505 - Health Insurance 26,069 24,379 23,678 24,495501.506 - Dental Insurance 4,262 4,214 3,805 3,842501.507 - Medicare 4,528 4,531 4,925 4,081501.508 - Life Insurance 2,118 1,848 1,728 1,745501.509 - Long Term Disability 2,258 2,862 2,871 2,801501.510 - Workers Compensation 3,894 9,396 6,228 2,887501.511 - Vision Insurance 544 485 450 453501.513 - Rec Bucks 0 0 0 1,010501.516 - Hra City Contribution 1,580 0 0 0
10 - Employee benefits Total 121,263 125,429 125,997 116,73915 - Materials
600.601 - General Office Supplies 1,695 1,053 1,744 1,600600.602 - Printing and Duplication 0 0 122 105600.608 - Sml Tools and Equipment 284 0 150 164600.613 - General Supplies 1,562 1,594 1,200 943600.619 - Advertising and Legal Notices 16,961 12,427 14,000 13,000600.629 - Conference and Training 4,522 5,161 3,002 5,290600.632 - Mileage Reimbursement 161 25 423 0600.642 - Telphone and Data Services 5,341 5,081 4,800 2,232600.647 - Memberships and Dues 0 0 0 560
15 - Materials Total 30,527 25,342 25,441 23,89420 - Contract services
700.701 - Training and Instruction 1,522 3,564 2,795 0700.702 - General Service Agreement 30,654 33,027 51,639 33,380700.703 - Maintenance of Equipment 2,258 803 3,097 0
20 - Contract services Total 34,434 37,394 57,531 33,38025 - Cost allocation
800.801 - Equipment Reimbursement 0 5,780 143 169800.802 - IT Reimbursement 48,063 47,810 46,960 34,172800.805 - CC CAP Allocation 11,511 0 0 0800.806 - CM CAP Allocation 2,988 0 0 0800.809 - City Clerk CAP Alloc 9,041 0 0 0
11

Appendix A-4 Year Expenditure Trends at the Account Level by Program
Department
FY17 Actuals
FY18 Actuals
FY19 Final Budget
FY20 Proposed
Budget800.810 - City Attorney CAP Alloc 95,237 0 0 0800.814 - Finance CAP Alloc 17,157 0 0 0800.815 - Human resources CAP Alloc 24,616 0 0 0800.817 - Community Hall/Quinlan CAP 341 0 0 0800.820 - Grounds Maintenance CAP 2,285 0 0 0800.821 - Building Maintenance CAP 25,876 0 0 0
25 - Cost allocation Total 237,115 53,590 47,103 34,34135 - Contingencies
719.705 - Contingencies 0 0 4,149 2,86435 - Contingencies Total 0 0 4,149 2,864
130 City Clerk Total 735,648 557,857 603,198 503,685
12

Appendix A-4 Year Expenditure Trends at the Account Level by Program
Department
FY17 Actuals
FY18 Actuals
FY19 Final Budget
FY20 Proposed
Budget132 Duplicating/Mail Services
05 - Employee compensation500.501 - Salaries Full Time 0 14,445 22,941 0500.502 - Salaries Part Time 15,629 5,383 0 0500.505 - Overtime 0 12 0 0500.513 - Sick Leave 527 67 0 0
05 - Employee compensation Total 16,156 19,907 22,941 010 - Employee benefits
501.500 - Retirement System 203 3,701 6,168 0501.502 - Pers 1959 Surv Empr 0 15 24 0501.505 - Health Insurance 0 2,435 3,789 0501.506 - Dental Insurance 0 427 609 0501.507 - Medicare 239 282 333 0501.508 - Life Insurance 0 115 173 0501.509 - Long Term Disability 0 154 253 0501.510 - Workers Compensation 0 43 996 0501.511 - Vision Insurance 0 48 72 0
10 - Employee benefits Total 442 7,219 12,417 015 - Materials
600.601 - General Office Supplies 10,584 13,093 9,000 11,000600.604 - Postage 28,346 24,283 24,000 24,000
15 - Materials Total 38,930 37,376 33,000 35,00020 - Contract services
700.703 - Maintenance of Equipment 13,866 13,781 5,630 5,90020 - Contract services Total 13,866 13,781 5,630 5,900
25 - Cost allocation800.801 - Equipment Reimbursement 0 0 21 0
25 - Cost allocation Total 0 0 21 031 - Special projects
900.945 - Fixed Asset Acquisition 0 0 22,970 031 - Special projects Total 0 0 22,970 0
35 - Contingencies719.705 - Contingencies 0 0 1,932 2,045
35 - Contingencies Total 0 0 1,932 2,045132 Duplicating/Mail Services Total 69,394 78,282 98,911 42,945
13

Appendix A-4 Year Expenditure Trends at the Account Level by Program
Department
FY17 Actuals
FY18 Actuals
FY19 Final Budget
FY20 Proposed
Budget133 Elections
15 - Materials600.601 - General Office Supplies 12 254 100 245600.619 - Advertising and Legal Notices 6,472 0 5,000 0
15 - Materials Total 6,484 254 5,100 24520 - Contract services
700.702 - General Service Agreement 307,736 0 73,700 020 - Contract services Total 307,736 0 73,700 0
25 - Cost allocation800.805 - CC CAP Allocation 0 18 0 0800.806 - CM CAP Allocation 0 6 0 0800.814 - Finance CAP Alloc 0 164 0 0
25 - Cost allocation Total 0 188 0 035 - Contingencies
719.705 - Contingencies 0 0 3,940 1235 - Contingencies Total 0 0 3,940 12
133 Elections Total 314,220 442 82,740 25713 City Clerk Total 1,119,262 636,582 784,849 546,887
14

Appendix A-4 Year Expenditure Trends at the Account Level by Program
Department
FY17 Actuals
FY18 Actuals
FY19 Final Budget
FY20 Proposed
Budget14 City Manager Discretionary
123 City Manager Contingency25 - Cost allocation
800.814 - Finance CAP Alloc 0 821 0 025 - Cost allocation Total 0 821 0 0
35 - Contingencies719.705 - Contingencies 0 0 593,661 486,353
35 - Contingencies Total 0 0 593,661 486,353123 City Manager Contingency Total 0 821 593,661 486,353
14 City Manager Discretionary Total 0 821 593,661 486,353
15

Appendix A-4 Year Expenditure Trends at the Account Level by Program
Department
FY17 Actuals
FY18 Actuals
FY19 Final Budget
FY20 Proposed
Budget15 City Attorney
141 City Attorney05 - Employee compensation
500.501 - Salaries Full Time 424,719 627,231 872,634 100,184500.502 - Salaries Part Time 52,028 0 0 0500.513 - Sick Leave 752 0 0 0
05 - Employee compensation Total 477,500 627,231 872,634 100,18410 - Employee benefits
501.500 - Retirement System 107,270 160,171 234,586 26,795501.502 - Pers 1959 Surv Empr 127 215 300 61501.505 - Health Insurance 21,409 54,028 90,160 16,657501.506 - Dental Insurance 3,093 5,471 7,610 1,537501.507 - Medicare 7,201 9,037 12,656 1,453501.508 - Life Insurance 1,678 2,518 3,600 727501.509 - Long Term Disability 2,078 4,038 6,371 1,066501.510 - Workers Compensation 5,610 12,516 12,456 1,155501.511 - Vision Insurance 393 627 900 181501.513 - Rec Bucks 0 0 0 404501.516 - Hra City Contribution 3,217 0 0 0
10 - Employee benefits Total 152,077 248,622 368,639 50,03615 - Materials
600.601 - General Office Supplies 2,509 6,008 11,750 1,000600.602 - Printing and Duplication 0 0 0 300600.608 - Sml Tools and Equipment 281 2,079 3,000 2,000600.613 - General Supplies 18,483 21,914 20,154 2,310600.618 - Utilities and Phone 0 0 12,867 0600.629 - Conference and Training 385 0 10,525 5,000600.632 - Mileage Reimbursement 212 528 1,250 0600.642 - Telphone and Data Services 11,330 14,711 0 460
15 - Materials Total 33,200 45,240 59,546 11,07020 - Contract services
700.701 - Training and Instruction 648 2,430 5,300 0700.702 - General Service Agreement 517,066 347,914 627,377 1,865,000700.703 - Maintenance of Equipment 5,166 3,611 5,000 0700.706 - Rent Expense 63,932 33,402 59,697 0
20 - Contract services Total 586,812 387,357 697,374 1,865,00025 - Cost allocation
800.801 - Equipment Reimbursement 0 0 264 68800.802 - IT Reimbursement 42,063 38,248 93,689 68,176800.805 - CC CAP Allocation 15,475 0 0 0800.806 - CM CAP Allocation 4,233 0 0 0800.809 - City Clerk CAP Alloc 40,916 0 0 0800.814 - Finance CAP Alloc 13,722 0 0 0
16

Appendix A-4 Year Expenditure Trends at the Account Level by Program
Department
FY17 Actuals
FY18 Actuals
FY19 Final Budget
FY20 Proposed
Budget800.815 - Human resources CAP Alloc 22,002 0 0 0800.820 - Grounds Maintenance CAP 1,994 0 0 0800.821 - Building Maintenance CAP 22,462 0 0 0
25 - Cost allocation Total 162,867 38,248 93,953 68,24435 - Contingencies
719.705 - Contingencies 318 0 37,846 035 - Contingencies Total 318 0 37,846 0
141 City Attorney Total 1,412,775 1,346,698 2,129,992 2,094,53415 City Attorney Total 1,412,775 1,346,698 2,129,992 2,094,534
Administration Total 4,728,312 4,090,047 5,939,788 6,511,878
17

Appendix A-4 Year Expenditure Trends at the Account Level by Program
Department
FY17 Actuals
FY18 Actuals
FY19 Final Budget
FY20 Proposed
BudgetAdministrative services
40 Administrative Services400 Admin Services Administration
05 - Employee compensation500.501 - Salaries Full Time 318,823 385,852 544,235 500,188500.502 - Salaries Part Time 15,435 24,159 0 0500.505 - Overtime 0 4,519 0 0500.506 - Car Allowance 2,382 2,880 2,881 2,909
05 - Employee compensation Total 336,640 417,410 547,116 503,09710 - Employee benefits
501.500 - Retirement System 82,904 101,618 146,247 133,780501.502 - Pers 1959 Surv Empr 152 177 228 231501.505 - Health Insurance 37,772 52,364 75,050 60,436501.506 - Dental Insurance 3,786 4,353 6,276 5,840501.507 - Medicare 4,791 6,410 7,995 7,253501.508 - Life Insurance 1,903 1,987 3,024 2,618501.509 - Long Term Disability 2,202 3,043 4,899 4,469501.510 - Workers Compensation 4,404 8,760 6,975 4,389501.511 - Vision Insurance 479 501 744 688501.513 - Rec Bucks 0 0 0 1,535501.516 - Hra City Contribution 1,317 0 0 0
10 - Employee benefits Total 139,709 179,213 251,438 221,23915 - Materials
600.601 - General Office Supplies 3,892 4,971 8,660 1,525600.602 - Printing and Duplication 17,393 16,888 10,000 15,694600.605 - Meeting Expenses 576 882 1,000 45,290600.608 - Sml Tools and Equipment 4,922 6,011 2,000 300600.613 - General Supplies 2,307 2,887 3,400 2,550600.629 - Conference and Training 16,047 31,108 5,000 22,239600.632 - Mileage Reimbursement 44 163 200 0600.642 - Telphone and Data Services 5,015 4,651 1,664 3,534600.647 - Memberships and Dues 0 0 0 2,685
15 - Materials Total 50,196 67,560 31,924 93,81720 - Contract services
700.701 - Training and Instruction 6,679 11,639 15,000 340700.702 - General Service Agreement 34,376 38,444 66,277 3,160700.703 - Maintenance of Equipment 1,197 772 700 0
20 - Contract services Total 42,252 50,855 81,977 3,50025 - Cost allocation
800.801 - Equipment Reimbursement 0 0 148 257800.802 - IT Reimbursement 67,552 55,459 47,837 34,810800.805 - CC CAP Allocation 8,405 0 0 0800.806 - CM CAP Allocation 2,179 0 0 0
18
Appendix A-4 Year Expenditure Trends at the Account Level by Program
Department
FY17 Actuals
FY18 Actuals
FY19 Final Budget
FY20 Proposed
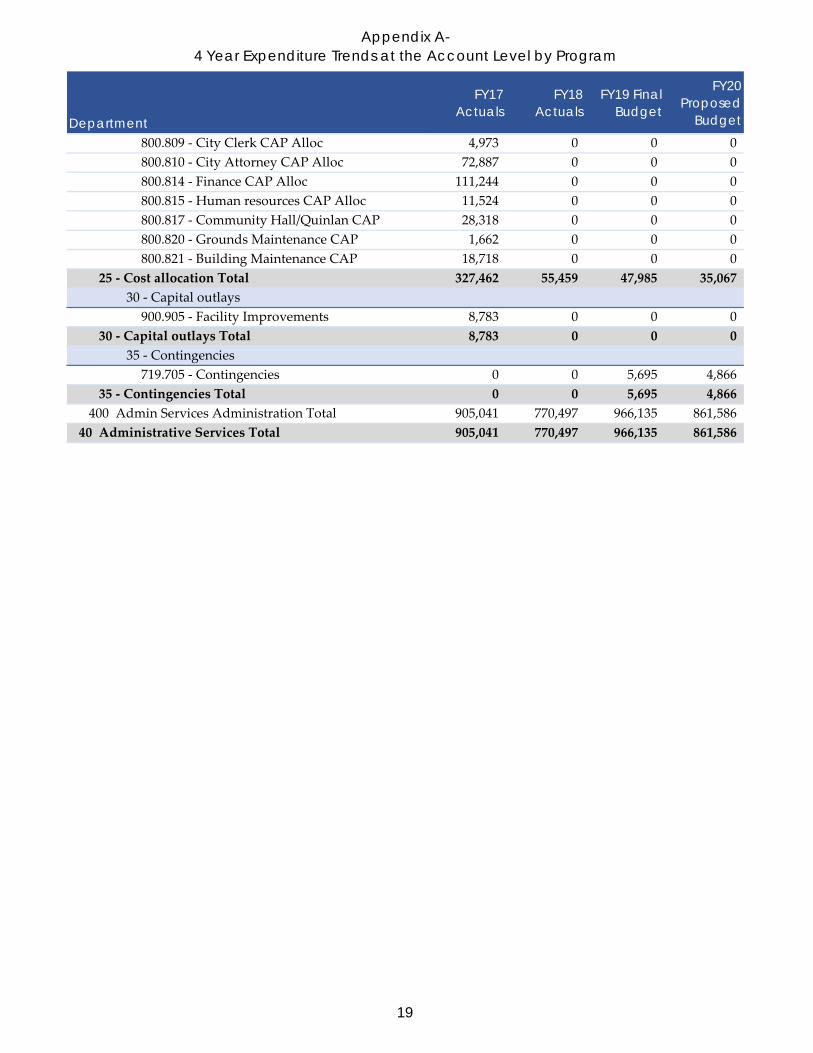
Budget800.809 - City Clerk CAP Alloc 4,973 0 0 0800.810 - City Attorney CAP Alloc 72,887 0 0 0800.814 - Finance CAP Alloc 111,244 0 0 0800.815 - Human resources CAP Alloc 11,524 0 0 0800.817 - Community Hall/Quinlan CAP 28,318 0 0 0800.820 - Grounds Maintenance CAP 1,662 0 0 0800.821 - Building Maintenance CAP 18,718 0 0 0
25 - Cost allocation Total 327,462 55,459 47,985 35,06730 - Capital outlays
900.905 - Facility Improvements 8,783 0 0 030 - Capital outlays Total 8,783 0 0 0
35 - Contingencies719.705 - Contingencies 0 0 5,695 4,866
35 - Contingencies Total 0 0 5,695 4,866400 Admin Services Administration Total 905,041 770,497 966,135 861,586
40 Administrative Services Total 905,041 770,497 966,135 861,586
19

Appendix A-4 Year Expenditure Trends at the Account Level by Program
Department
FY17 Actuals
FY18 Actuals
FY19 Final Budget
FY20 Proposed
Budget41 Finance
405 Accounting05 - Employee compensation
500.501 - Salaries Full Time 534,739 511,499 627,423 596,858500.502 - Salaries Part Time 5,865 51,531 40,105 57,673500.505 - Overtime 918 771 0 0500.513 - Sick Leave 0 377 0 0
05 - Employee compensation Total 541,522 564,178 667,528 654,53110 - Employee benefits
501.500 - Retirement System 132,066 130,350 165,004 160,385501.502 - Pers 1959 Surv Empr 302 308 384 359501.505 - Health Insurance 55,488 58,555 80,502 68,098501.506 - Dental Insurance 7,233 7,942 9,741 9,067501.507 - Medicare 7,533 8,474 9,682 9,492501.508 - Life Insurance 3,741 3,427 4,392 3,999501.509 - Long Term Disability 3,879 5,196 6,557 6,071501.510 - Workers Compensation 9,867 16,908 15,944 6,814501.511 - Vision Insurance 924 910 1,152 1,069501.513 - Rec Bucks 0 0 0 2,384501.516 - Hra City Contribution 10,537 0 0 0
10 - Employee benefits Total 231,570 232,070 293,358 267,73815 - Materials
600.601 - General Office Supplies 3,678 3,394 8,581 4,552600.602 - Printing and Duplication 221 2,360 3,500 1,900600.606 - Software 0 0 273 0600.608 - Sml Tools and Equipment 1,152 2,852 822 3,300600.613 - General Supplies 1,294 1,422 609 1,650600.618 - Utilities and Phone 0 0 1,599 0600.629 - Conference and Training 15,376 17,726 20,000 25,920600.632 - Mileage Reimbursement 67 21 162 0600.642 - Telphone and Data Services 2,051 1,810 625 0
15 - Materials Total 23,839 29,587 36,171 37,32220 - Contract services
700.701 - Training and Instruction 265 6,944 13,600 0700.702 - General Service Agreement 322,334 825,057 190,750 312,220700.703 - Maintenance of Equipment 1,995 1,286 754 0700.707 - Bank Charges 30 0 0 0
20 - Contract services Total 324,623 833,287 205,104 312,22025 - Cost allocation
800.801 - Equipment Reimbursement 0 0 338 399800.802 - IT Reimbursement 80,620 80,321 80,368 58,483800.805 - CC CAP Allocation 17,222 0 0 0800.806 - CM CAP Allocation 4,454 0 0 0
20

Appendix A-4 Year Expenditure Trends at the Account Level by Program
Department
FY17 Actuals
FY18 Actuals
FY19 Final Budget
FY20 Proposed
Budget800.809 - City Clerk CAP Alloc 43,732 0 0 0800.810 - City Attorney CAP Alloc 330,413 0 0 0800.814 - Finance CAP Alloc 13,814 0 0 0800.815 - Human resources CAP Alloc 36,380 0 0 0800.820 - Grounds Maintenance CAP 3,457 0 0 0800.821 - Building Maintenance CAP 38,934 0 0 0
25 - Cost allocation Total 569,026 80,321 80,706 58,88231 - Special projects
900.906 - Financial Software 7,505 0 0 031 - Special projects Total 7,505 0 0 0
35 - Contingencies719.705 - Contingencies 0 0 12,064 14,977
35 - Contingencies Total 0 0 12,064 14,977405 Accounting Total 1,698,085 1,739,443 1,294,931 1,345,670
21

Appendix A-4 Year Expenditure Trends at the Account Level by Program
Department
FY17 Actuals
FY18 Actuals
FY19 Final Budget
FY20 Proposed
Budget406 Business Licenses
05 - Employee compensation500.501 - Salaries Full Time 41,361 54,508 48,757 80,383500.505 - Overtime 0 7 0 0
05 - Employee compensation Total 41,361 54,515 48,757 80,38310 - Employee benefits
501.500 - Retirement System 10,775 13,658 13,109 21,500501.502 - Pers 1959 Surv Empr 31 41 36 66501.505 - Health Insurance 6,023 5,959 5,684 14,208501.506 - Dental Insurance 779 1,025 914 1,690501.507 - Medicare 605 777 708 1,166501.508 - Life Insurance 349 389 361 655501.509 - Long Term Disability 351 536 526 870501.510 - Workers Compensation 1,150 1,884 1,495 1,270501.511 - Vision Insurance 99 118 108 200501.513 - Rec Bucks 0 0 0 444501.516 - Hra City Contribution 290 0 0 0
10 - Employee benefits Total 20,451 24,387 22,941 42,06915 - Materials
600.601 - General Office Supplies 0 0 222 0600.618 - Utilities and Phone 0 0 800 0600.642 - Telphone and Data Services 1,026 905 5,000 0
15 - Materials Total 1,026 905 6,022 020 - Contract services
700.701 - Training and Instruction 300 0 0 0700.702 - General Service Agreement 81,306 0 30,000 0700.703 - Maintenance of Equipment 200 129 90 0700.707 - Bank Charges 6,060 6,143 4,106 0
20 - Contract services Total 87,866 6,271 34,196 025 - Cost allocation
800.801 - Equipment Reimbursement 0 0 32 74800.802 - IT Reimbursement 7,711 5,737 5,062 3,683800.805 - CC CAP Allocation 3,349 2,603 1,460 1,853800.806 - CM CAP Allocation 854 782 627 666800.813 - Admin Serv CAP Allocation 69,895 67,899 49,347 69,263800.814 - Finance CAP Alloc 7,788 8,738 11,538 13,009800.815 - Human resources CAP Alloc 8,003 6,483 3,720 4,816800.820 - Grounds Maintenance CAP 753 0 0 0800.821 - Building Maintenance CAP 8,462 7,522 3,471 1,665
25 - Cost allocation Total 106,815 99,764 75,257 95,02935 - Contingencies
719.705 - Contingencies 0 0 2,011 035 - Contingencies Total 0 0 2,011 0
22

Appendix A-4 Year Expenditure Trends at the Account Level by Program
Department
FY17 Actuals
FY18 Actuals
FY19 Final Budget
FY20 Proposed
Budget406 Business Licenses Total 257,519 185,842 189,184 217,481
41 Finance Total 1,955,604 1,925,285 1,484,115 1,563,15144 Human Resources
412 Human Resources05 - Employee compensation
500.501 - Salaries Full Time 355,940 352,865 345,495 582,407500.502 - Salaries Part Time 19,388 45,145 107,394 33,100500.503 - Excess Med Pay 17 0 0 0500.505 - Overtime 122 0 0 0500.506 - Car Allowance 1,218 720 720 727
05 - Employee compensation Total 376,686 398,729 453,609 616,23410 - Employee benefits
501.500 - Retirement System 93,911 88,205 113,703 155,576501.502 - Pers 1959 Surv Empr 183 204 172 264501.505 - Health Insurance 37,589 50,404 46,137 77,217501.506 - Dental Insurance 4,577 5,376 4,339 6,684501.507 - Medicare 3,889 4,018 4,975 6,147501.508 - Life Insurance (4,379) 2,690 2,053 3,163501.509 - Long Term Disability 2,565 3,312 3,451 5,497501.510 - Workers Compensation 7,988 8,916 7,125 5,602501.511 - Vision Insurance 581 615 513 788501.512 - Employee Asst Program 8,852 9,178 0 0501.513 - Rec Bucks 21,000 49,489 66,600 1,757501.516 - Hra City Contribution 4,483 0 0 0
10 - Employee benefits Total 181,240 222,405 249,068 262,69515 - Materials
600.601 - General Office Supplies 24,754 28,980 29,218 0600.602 - Printing and Duplication 0 139 100 0600.605 - Meeting Expenses 311 25 640 20,093600.608 - Sml Tools and Equipment 351 1,798 2,000 500600.613 - General Supplies 34,320 17,374 19,135 94,501600.629 - Conference and Training 10,837 6,516 2,855 19,990600.632 - Mileage Reimbursement 148 176 205 0600.635 - Special Departmental Exp 0 0 0 23,836600.642 - Telphone and Data Services 2,656 2,347 2,000 643
15 - Materials Total 73,377 57,355 56,153 159,56320 - Contract services
700.701 - Training and Instruction 16,646 20,831 30,133 49,700700.702 - General Service Agreement 205,666 231,018 324,000 108,546700.703 - Maintenance of Equipment 1,399 900 626 0700.704 - Insurance Fees, Claims, Premiums 10,995 33,679 9,002 0700.706 - Rent Expense 0 0 0 82,716
20 - Contract services Total 234,705 286,428 363,761 240,962
23

Appendix A-4 Year Expenditure Trends at the Account Level by Program
Department
FY17 Actuals
FY18 Actuals
FY19 Final Budget
FY20 Proposed
Budget25 - Cost allocation
800.801 - Equipment Reimbursement 0 0 151 329800.802 - IT Reimbursement 76,666 18,646 57,687 41,978800.805 - CC CAP Allocation 14,159 0 0 0800.806 - CM CAP Allocation 132,345 0 0 0800.810 - City Attorney CAP Alloc 145,773 0 0 0800.813 - Admin Serv CAP Allocation 209,685 0 0 0800.814 - Finance CAP Alloc 24,319 0 0 0800.815 - Human resources CAP Alloc 21,567 0 0 0800.817 - Community Hall/Quinlan CAP 5,640 0 0 0800.820 - Grounds Maintenance CAP 2,194 0 0 0800.821 - Building Maintenance CAP 24,708 0 0 0
25 - Cost allocation Total 657,056 18,646 57,838 42,30735 - Contingencies
719.705 - Contingencies 0 0 20,996 19,07635 - Contingencies Total 0 0 20,996 19,076
412 Human Resources Total 1,523,064 983,564 1,201,425 1,340,837
24
Appendix A-4 Year Expenditure Trends at the Account Level by Program
Department
FY17 Actuals
FY18 Actuals
FY19 Final Budget
FY20 Proposed
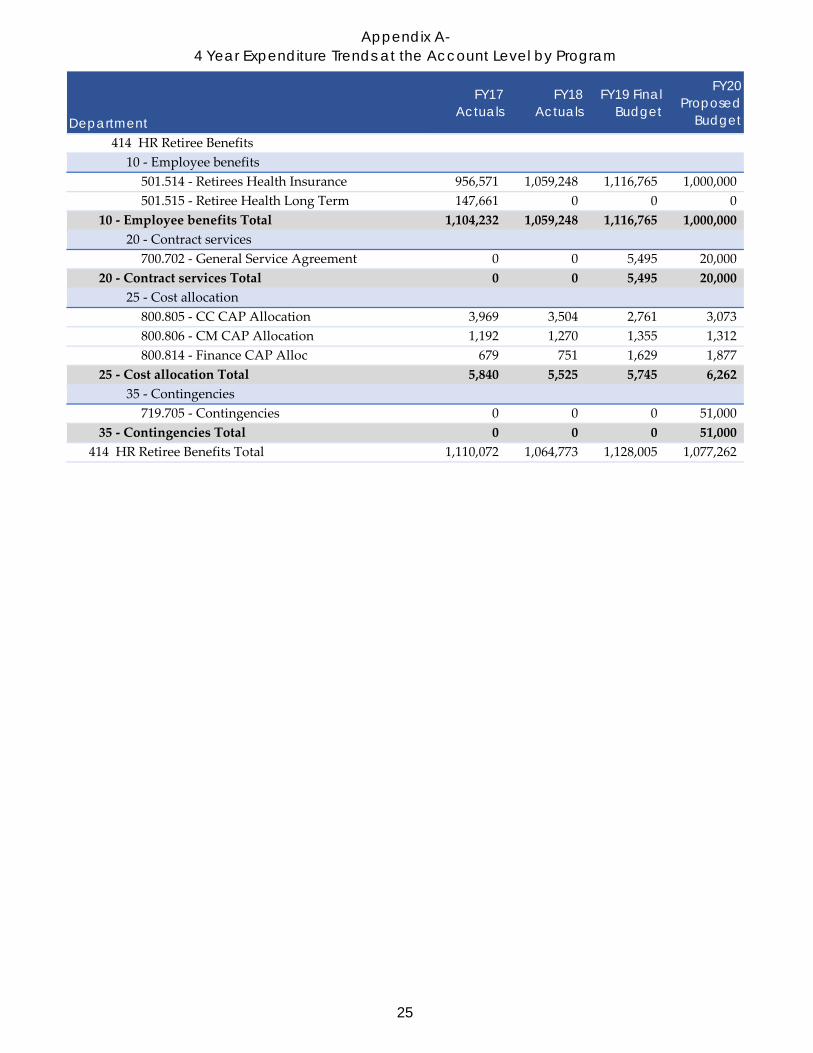
Budget414 HR Retiree Benefits
10 - Employee benefits501.514 - Retirees Health Insurance 956,571 1,059,248 1,116,765 1,000,000501.515 - Retiree Health Long Term 147,661 0 0 0
10 - Employee benefits Total 1,104,232 1,059,248 1,116,765 1,000,00020 - Contract services
700.702 - General Service Agreement 0 0 5,495 20,00020 - Contract services Total 0 0 5,495 20,000
25 - Cost allocation800.805 - CC CAP Allocation 3,969 3,504 2,761 3,073800.806 - CM CAP Allocation 1,192 1,270 1,355 1,312800.814 - Finance CAP Alloc 679 751 1,629 1,877
25 - Cost allocation Total 5,840 5,525 5,745 6,26235 - Contingencies
719.705 - Contingencies 0 0 0 51,00035 - Contingencies Total 0 0 0 51,000
414 HR Retiree Benefits Total 1,110,072 1,064,773 1,128,005 1,077,262
25

Appendix A-4 Year Expenditure Trends at the Account Level by Program
Department
FY17 Actuals
FY18 Actuals
FY19 Final Budget
FY20 Proposed
Budget417 Insurance Administration
05 - Employee compensation500.501 - Salaries Full Time 16,568 17,488 17,133 17,310500.503 - Excess Med Pay 1 0 0 0500.505 - Overtime 6 0 0 0
05 - Employee compensation Total 16,575 17,488 17,133 17,31010 - Employee benefits
501.500 - Retirement System 4,320 4,376 4,608 4,630501.502 - Pers 1959 Surv Empr 9 9 11 9501.505 - Health Insurance 1,906 2,211 2,326 2,656501.506 - Dental Insurance 214 233 231 231501.507 - Medicare 154 160 161 251501.508 - Life Insurance 116 108 109 108501.509 - Long Term Disability 128 167 187 182501.510 - Workers Compensation 678 468 399 173501.511 - Vision Insurance 27 27 27 27501.513 - Rec Bucks 0 0 0 60501.516 - Hra City Contribution 79 0 0 0
10 - Employee benefits Total 7,629 7,759 8,059 8,32715 - Materials
600.601 - General Office Supplies 0 0 4 0600.632 - Mileage Reimbursement 8 9 0 0
15 - Materials Total 8 9 4 020 - Contract services
700.703 - Maintenance of Equipment 0 0 30 0700.704 - Insurance Fees, Claims, Premiums 660,798 715,994 875,200 817,833
20 - Contract services Total 660,798 715,994 875,230 817,83325 - Cost allocation
800.801 - Equipment Reimbursement 0 0 8 11800.802 - IT Reimbursement 2,103 956 10,690 7,778
25 - Cost allocation Total 2,103 956 10,698 7,78935 - Contingencies
719.705 - Contingencies 0 0 43,762 40,89235 - Contingencies Total 0 0 43,762 40,892
417 Insurance Administration Total 687,114 742,206 954,886 892,151
26
Appendix A-4 Year Expenditure Trends at the Account Level by Program
Department
FY17 Actuals
FY18 Actuals
FY19 Final Budget
FY20 Proposed
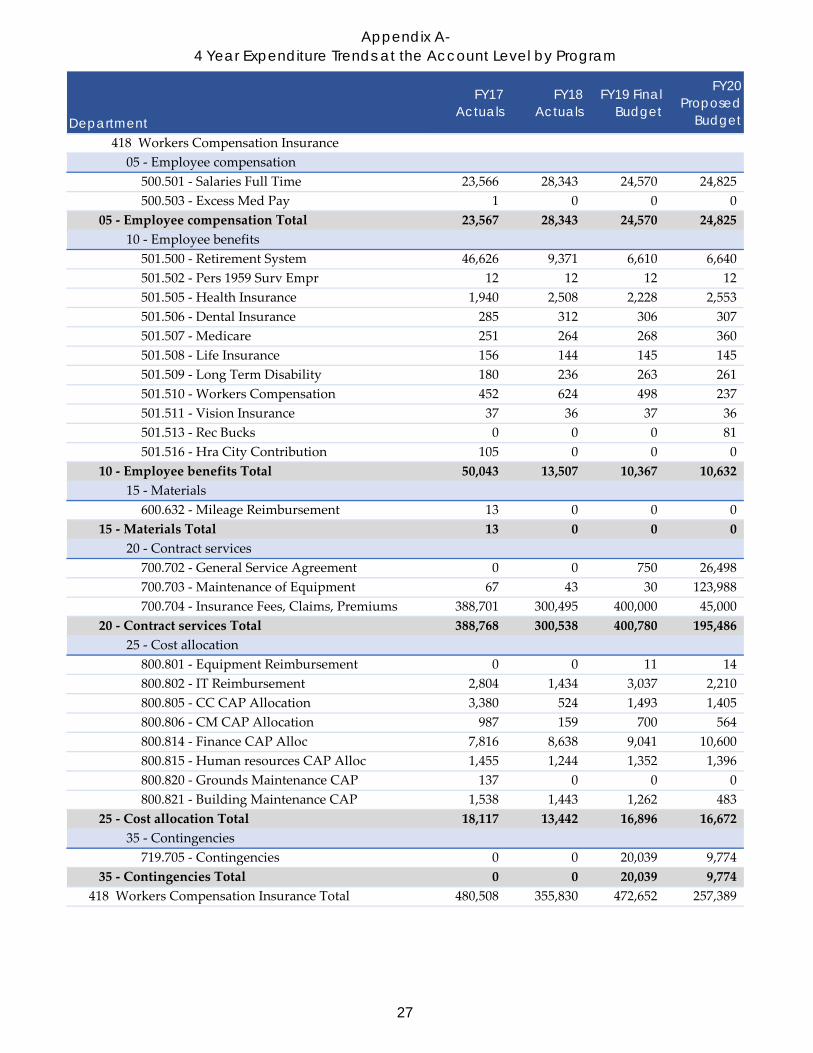
Budget418 Workers Compensation Insurance
05 - Employee compensation500.501 - Salaries Full Time 23,566 28,343 24,570 24,825500.503 - Excess Med Pay 1 0 0 0
05 - Employee compensation Total 23,567 28,343 24,570 24,82510 - Employee benefits
501.500 - Retirement System 46,626 9,371 6,610 6,640501.502 - Pers 1959 Surv Empr 12 12 12 12501.505 - Health Insurance 1,940 2,508 2,228 2,553501.506 - Dental Insurance 285 312 306 307501.507 - Medicare 251 264 268 360501.508 - Life Insurance 156 144 145 145501.509 - Long Term Disability 180 236 263 261501.510 - Workers Compensation 452 624 498 237501.511 - Vision Insurance 37 36 37 36501.513 - Rec Bucks 0 0 0 81501.516 - Hra City Contribution 105 0 0 0
10 - Employee benefits Total 50,043 13,507 10,367 10,63215 - Materials
600.632 - Mileage Reimbursement 13 0 0 015 - Materials Total 13 0 0 0
20 - Contract services700.702 - General Service Agreement 0 0 750 26,498700.703 - Maintenance of Equipment 67 43 30 123,988700.704 - Insurance Fees, Claims, Premiums 388,701 300,495 400,000 45,000
20 - Contract services Total 388,768 300,538 400,780 195,48625 - Cost allocation
800.801 - Equipment Reimbursement 0 0 11 14800.802 - IT Reimbursement 2,804 1,434 3,037 2,210800.805 - CC CAP Allocation 3,380 524 1,493 1,405800.806 - CM CAP Allocation 987 159 700 564800.814 - Finance CAP Alloc 7,816 8,638 9,041 10,600800.815 - Human resources CAP Alloc 1,455 1,244 1,352 1,396800.820 - Grounds Maintenance CAP 137 0 0 0800.821 - Building Maintenance CAP 1,538 1,443 1,262 483
25 - Cost allocation Total 18,117 13,442 16,896 16,67235 - Contingencies
719.705 - Contingencies 0 0 20,039 9,77435 - Contingencies Total 0 0 20,039 9,774
418 Workers Compensation Insurance Total 480,508 355,830 472,652 257,389
27

Appendix A-4 Year Expenditure Trends at the Account Level by Program
Department
FY17 Actuals
FY18 Actuals
FY19 Final Budget
FY20 Proposed
Budget419 Long Term Disability
20 - Contract services700.704 - Insurance Fees, Claims, Premiums 128,812 151,893 153,000 150,000
20 - Contract services Total 128,812 151,893 153,000 150,00025 - Cost allocation
800.805 - CC CAP Allocation 336 313 322 440800.806 - CM CAP Allocation 101 114 158 188800.814 - Finance CAP Alloc 170 188 1,136 1,006
25 - Cost allocation Total 607 615 1,616 1,63435 - Contingencies
719.705 - Contingencies 0 0 7,650 7,50035 - Contingencies Total 0 0 7,650 7,500
419 Long Term Disability Total 129,419 152,508 162,266 159,134
28

Appendix A-4 Year Expenditure Trends at the Account Level by Program
Department
FY17 Actuals
FY18 Actuals
FY19 Final Budget
FY20 Proposed
Budget420 Compensated Absence
20 - Contract services700.704 - Insurance Fees, Claims, Premiums 271,311 275,420 400,000 600,000
20 - Contract services Total 271,311 275,420 400,000 600,00025 - Cost allocation
800.805 - CC CAP Allocation 1,746 1,885 681 804800.806 - CM CAP Allocation 524 683 334 343800.814 - Finance CAP Alloc 403 446 1,757 1,542
25 - Cost allocation Total 2,673 3,014 2,772 2,68935 - Contingencies
719.705 - Contingencies 0 0 20,000 30,00035 - Contingencies Total 0 0 20,000 30,000
420 Compensated Absence Total 273,984 278,434 422,772 632,68944 Human Resources Total 4,204,162 3,577,315 4,342,006 4,359,462
Administrative services Total 7,064,808 6,273,096 6,792,256 6,784,199
29

Appendix A-4 Year Expenditure Trends at the Account Level by Program
Department
FY17 Actuals
FY18 Actuals
FY19 Final Budget
FY20 Proposed
BudgetCapital projects
90 Citywide - Non Departmental001 No Department
45 - Transfer out800.902 - Transfers Out 5,374 0 0 0
45 - Transfer out Total 5,374 0 0 0001 No Department Total 5,374 0 0 0
30
Appendix A-4 Year Expenditure Trends at the Account Level by Program
Department
FY17 Actuals
FY18 Actuals
FY19 Final Budget
FY20 Proposed
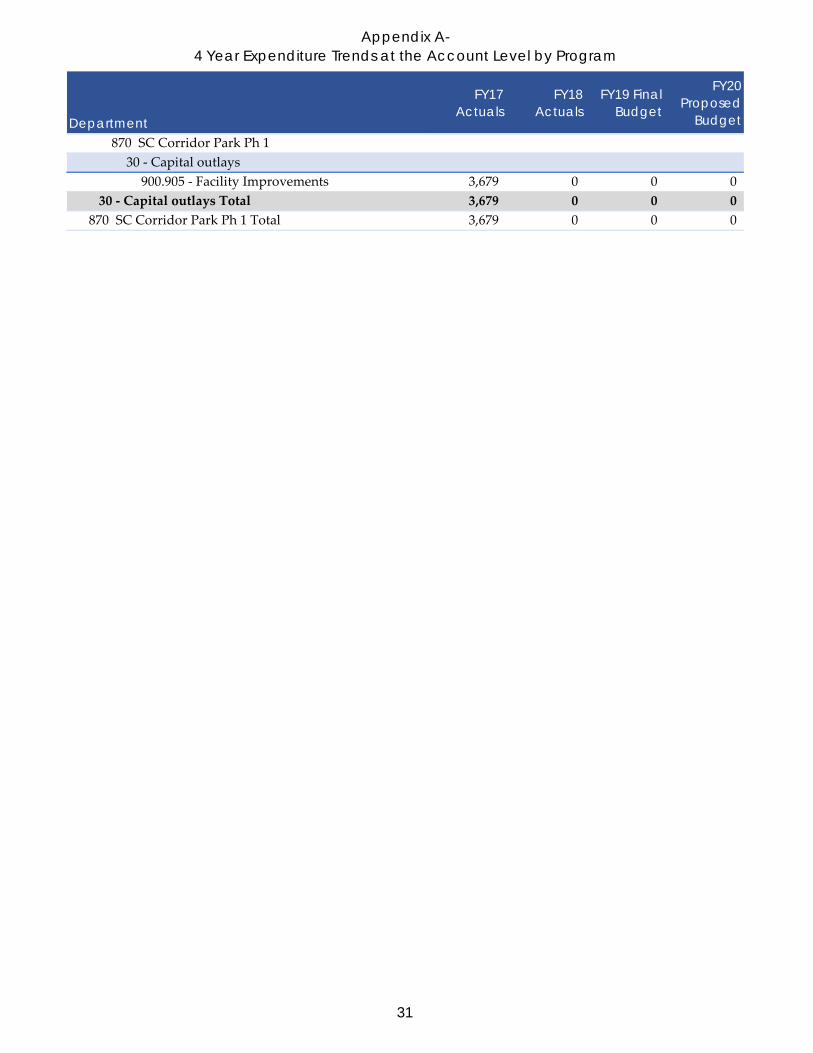
Budget870 SC Corridor Park Ph 1
30 - Capital outlays900.905 - Facility Improvements 3,679 0 0 0
30 - Capital outlays Total 3,679 0 0 0870 SC Corridor Park Ph 1 Total 3,679 0 0 0
31

Appendix A-4 Year Expenditure Trends at the Account Level by Program
Department
FY17 Actuals
FY18 Actuals
FY19 Final Budget
FY20 Proposed
Budget880 Env Edu Facility
30 - Capital outlays900.905 - Facility Improvements 3,608 1,435 0 0
30 - Capital outlays Total 3,608 1,435 0 0880 Env Edu Facility Total 3,608 1,435 0 0
32

Appendix A-4 Year Expenditure Trends at the Account Level by Program
Department
FY17 Actuals
FY18 Actuals
FY19 Final Budget
FY20 Proposed
Budget881 Phs II SC Corridor Park
30 - Capital outlays900.905 - Facility Improvements 22,840 81,394 0 0
30 - Capital outlays Total 22,840 81,394 0 0881 Phs II SC Corridor Park Total 22,840 81,394 0 0
33

Appendix A-4 Year Expenditure Trends at the Account Level by Program
Department
FY17 Actuals
FY18 Actuals
FY19 Final Budget
FY20 Proposed
Budget885 Golf Irrigation Upgrades
31 - Special projects900.945 - Fixed Asset Acquisition 0 (18,998) 0 0
31 - Special projects Total 0 (18,998) 0 045 - Transfer out
800.902 - Transfers Out 0 400,000 0 045 - Transfer out Total 0 400,000 0 0
885 Golf Irrigation Upgrades Total 0 381,002 0 0
34

Appendix A-4 Year Expenditure Trends at the Account Level by Program
Department
FY17 Actuals
FY18 Actuals
FY19 Final Budget
FY20 Proposed
Budget897 Spt Ctr Tennis Court Ret Wall
45 - Transfer out800.902 - Transfers Out 0 50,000 0 0
45 - Transfer out Total 0 50,000 0 0897 Spt Ctr Tennis Court Ret Wall Total 0 50,000 0 0
35

Appendix A-4 Year Expenditure Trends at the Account Level by Program
Department
FY17 Actuals
FY18 Actuals
FY19 Final Budget
FY20 Proposed
Budget898 SCCP Chain MP-MCLN TO SCB
30 - Capital outlays900.905 - Facility Improvements 143 0 75,000 0
30 - Capital outlays Total 143 0 75,000 0898 SCCP Chain MP-MCLN TO SCB Total 143 0 75,000 0
36

Appendix A-4 Year Expenditure Trends at the Account Level by Program
Department
FY17 Actuals
FY18 Actuals
FY19 Final Budget
FY20 Proposed
Budget904 Spt Ctr Resurf Tennis Cts
30 - Capital outlays900.905 - Facility Improvements 418,016 0 0 0
30 - Capital outlays Total 418,016 0 0 0904 Spt Ctr Resurf Tennis Cts Total 418,016 0 0 0
37

Appendix A-4 Year Expenditure Trends at the Account Level by Program
Department
FY17 Actuals
FY18 Actuals
FY19 Final Budget
FY20 Proposed
Budget938 Pub Bldg Solar Service Center
30 - Capital outlays900.905 - Facility Improvements 6,230 3,268 0 0
30 - Capital outlays Total 6,230 3,268 0 0938 Pub Bldg Solar Service Center Total 6,230 3,268 0 0
38

Appendix A-4 Year Expenditure Trends at the Account Level by Program
Department
FY17 Actuals
FY18 Actuals
FY19 Final Budget
FY20 Proposed
Budget954 Monument Gateway Sign
30 - Capital outlays900.905 - Facility Improvements 35,000 0 0 0
30 - Capital outlays Total 35,000 0 0 0954 Monument Gateway Sign Total 35,000 0 0 0
39

Appendix A-4 Year Expenditure Trends at the Account Level by Program
Department
FY17 Actuals
FY18 Actuals
FY19 Final Budget
FY20 Proposed
Budget958 Orange and Byrne Sidewalk Impv
05 - Employee compensation500.501 - Salaries Full Time 856 12,764 0 0
05 - Employee compensation Total 856 12,764 0 010 - Employee benefits
501.500 - Retirement System 220 3,172 0 0501.502 - Pers 1959 Surv Empr 0 5 0 0501.506 - Dental Insurance 11 139 0 0501.507 - Medicare 13 177 0 0501.508 - Life Insurance 5 53 0 0501.509 - Long Term Disability 10 90 0 0501.511 - Vision Insurance 1 15 0 0
10 - Employee benefits Total 259 3,652 0 030 - Capital outlays
900.905 - Facility Improvements 55,250 232,290 0 030 - Capital outlays Total 55,250 232,290 0 0
958 Orange and Byrne Sidewalk Impv Total 56,366 248,706 0 0
40

Appendix A-4 Year Expenditure Trends at the Account Level by Program
Department
FY17 Actuals
FY18 Actuals
FY19 Final Budget
FY20 Proposed
Budget960 Bridge Rehab Minor
05 - Employee compensation500.501 - Salaries Full Time 4,800 4,212 0 0
05 - Employee compensation Total 4,800 4,212 0 010 - Employee benefits
501.500 - Retirement System 1,216 1,090 0 0501.502 - Pers 1959 Surv Empr 2 2 0 0501.506 - Dental Insurance 56 52 0 0501.507 - Medicare 69 61 0 0501.508 - Life Insurance 30 26 0 0501.509 - Long Term Disability 29 46 0 0501.511 - Vision Insurance 7 6 0 0501.516 - Hra City Contribution 14 0 0 0
10 - Employee benefits Total 1,423 1,282 0 030 - Capital outlays
900.905 - Facility Improvements 0 6,505 0 030 - Capital outlays Total 0 6,505 0 0
960 Bridge Rehab Minor Total 6,223 11,999 0 0
41

Appendix A-4 Year Expenditure Trends at the Account Level by Program
Department
FY17 Actuals
FY18 Actuals
FY19 Final Budget
FY20 Proposed
Budget961 St Median Irrg Plant Repl
05 - Employee compensation500.501 - Salaries Full Time 0 11,106 0 0
05 - Employee compensation Total 0 11,106 0 010 - Employee benefits
501.500 - Retirement System 0 2,743 0 0501.502 - Pers 1959 Surv Empr 0 4 0 0501.506 - Dental Insurance 0 117 0 0501.507 - Medicare 0 153 0 0501.508 - Life Insurance 0 49 0 0501.509 - Long Term Disability 0 86 0 0501.511 - Vision Insurance 0 13 0 0
10 - Employee benefits Total 0 3,166 0 030 - Capital outlays
900.905 - Facility Improvements 33,836 334,639 0 030 - Capital outlays Total 33,836 334,639 0 0
961 St Median Irrg Plant Repl Total 33,836 348,911 0 0
42

Appendix A-4 Year Expenditure Trends at the Account Level by Program
Department
FY17 Actuals
FY18 Actuals
FY19 Final Budget
FY20 Proposed
Budget962 Bicycle Ped Facility Impr
30 - Capital outlays900.905 - Facility Improvements 121,351 0 0 0
30 - Capital outlays Total 121,351 0 0 045 - Transfer out
800.902 - Transfers Out 0 779,760 0 045 - Transfer out Total 0 779,760 0 0
962 Bicycle Ped Facility Impr Total 121,351 779,760 0 0
43

Appendix A-4 Year Expenditure Trends at the Account Level by Program
Department
FY17 Actuals
FY18 Actuals
FY19 Final Budget
FY20 Proposed
Budget971 STLG/280 Ped Bridge Lighting
30 - Capital outlays900.905 - Facility Improvements 50 0 0 0
30 - Capital outlays Total 50 0 0 0971 STLG/280 Ped Bridge Lighting Total 50 0 0 0
44

Appendix A-4 Year Expenditure Trends at the Account Level by Program
Department
FY17 Actuals
FY18 Actuals
FY19 Final Budget
FY20 Proposed
Budget974 Fiber Ntwk Signal Interco
30 - Capital outlays900.905 - Facility Improvements 335 0 0 0
30 - Capital outlays Total 335 0 0 0974 Fiber Ntwk Signal Interco Total 335 0 0 0
45

Appendix A-4 Year Expenditure Trends at the Account Level by Program
Department
FY17 Actuals
FY18 Actuals
FY19 Final Budget
FY20 Proposed
Budget975 Speed Bump Vista Lazaneo
30 - Capital outlays900.905 - Facility Improvements 1,600 0 0 0
30 - Capital outlays Total 1,600 0 0 0975 Speed Bump Vista Lazaneo Total 1,600 0 0 0
46

Appendix A-4 Year Expenditure Trends at the Account Level by Program
Department
FY17 Actuals
FY18 Actuals
FY19 Final Budget
FY20 Proposed
Budget976 Ph 2 Mcl Sidewalk Improv
05 - Employee compensation500.501 - Salaries Full Time 13,556 13,141 0 0
05 - Employee compensation Total 13,556 13,141 0 010 - Employee benefits
501.500 - Retirement System 3,383 3,448 0 0501.502 - Pers 1959 Surv Empr 6 6 0 0501.506 - Dental Insurance 154 151 0 0501.507 - Medicare 193 192 0 0501.508 - Life Insurance 82 69 0 0501.509 - Long Term Disability 89 119 0 0501.511 - Vision Insurance 19 18 0 0501.516 - Hra City Contribution 47 0 0 0
10 - Employee benefits Total 3,973 4,003 0 030 - Capital outlays
900.905 - Facility Improvements 400,574 72,415 0 030 - Capital outlays Total 400,574 72,415 0 0
976 Ph 2 Mcl Sidewalk Improv Total 418,103 89,559 0 0
47

Appendix A-4 Year Expenditure Trends at the Account Level by Program
Department
FY17 Actuals
FY18 Actuals
FY19 Final Budget
FY20 Proposed
Budget980 SD Master Plan Update
05 - Employee compensation500.501 - Salaries Full Time 0 319 0 0
05 - Employee compensation Total 0 319 0 010 - Employee benefits
501.500 - Retirement System 0 83 0 0501.502 - Pers 1959 Surv Empr 0 0 0 0501.506 - Dental Insurance 0 4 0 0501.507 - Medicare 0 5 0 0501.508 - Life Insurance 0 2 0 0501.509 - Long Term Disability 0 4 0 0501.511 - Vision Insurance 0 0 0 0
10 - Employee benefits Total 0 98 0 030 - Capital outlays
900.905 - Facility Improvements 65,753 103,515 0 030 - Capital outlays Total 65,753 103,515 0 0
980 SD Master Plan Update Total 65,753 103,933 0 0
48

Appendix A-4 Year Expenditure Trends at the Account Level by Program
Department
FY17 Actuals
FY18 Actuals
FY19 Final Budget
FY20 Proposed
Budget981 Calabazas Creek Outfall Repair
30 - Capital outlays900.905 - Facility Improvements 0 135,000 0 0
30 - Capital outlays Total 0 135,000 0 0981 Calabazas Creek Outfall Repair Total 0 135,000 0 0
49

Appendix A-4 Year Expenditure Trends at the Account Level by Program
Department
FY17 Actuals
FY18 Actuals
FY19 Final Budget
FY20 Proposed
Budget982 Bubb Rd Elm Ct Sd Improv
45 - Transfer out800.902 - Transfers Out 0 178,255 0 0
45 - Transfer out Total 0 178,255 0 0982 Bubb Rd Elm Ct Sd Improv Total 0 178,255 0 0
90 Citywide - Non Departmental Total 1,198,507 2,413,221 75,000 0
50

Appendix A-4 Year Expenditure Trends at the Account Level by Program
Department
FY17 Actuals
FY18 Actuals
FY19 Final Budget
FY20 Proposed
Budget99 CIP
002 BBF Splash Pad45 - Transfer out
800.902 - Transfers Out 0 70,000 0 045 - Transfer out Total 0 70,000 0 0
002 BBF Splash Pad Total 0 70,000 0 0
51

Appendix A-4 Year Expenditure Trends at the Account Level by Program
Department
FY17 Actuals
FY18 Actuals
FY19 Final Budget
FY20 Proposed
Budget003 MR Construct Trash Enclosure
30 - Capital outlays900.905 - Facility Improvements 610 13,418 0 0
30 - Capital outlays Total 610 13,418 0 0003 MR Construct Trash Enclosure Total 610 13,418 0 0
52

Appendix A-4 Year Expenditure Trends at the Account Level by Program
Department
FY17 Actuals
FY18 Actuals
FY19 Final Budget
FY20 Proposed
Budget004 MR Community Garden Improvements
05 - Employee compensation500.501 - Salaries Full Time 0 5,712 0 0
05 - Employee compensation Total 0 5,712 0 010 - Employee benefits
501.500 - Retirement System 0 1,397 0 0501.502 - Pers 1959 Surv Empr 0 2 0 0501.505 - Health Insurance 0 744 0 0501.506 - Dental Insurance 0 59 0 0501.507 - Medicare 0 73 0 0501.508 - Life Insurance 0 22 0 0501.509 - Long Term Disability 0 39 0 0501.511 - Vision Insurance 0 7 0 0
10 - Employee benefits Total 0 2,344 0 030 - Capital outlays
900.905 - Facility Improvements 0 54,177 0 030 - Capital outlays Total 0 54,177 0 0
004 MR Community Garden Improvements Total 0 62,233 0 0
53

Appendix A-4 Year Expenditure Trends at the Account Level by Program
Department
FY17 Actuals
FY18 Actuals
FY19 Final Budget
FY20 Proposed
Budget005 Memorial Park MP and Parking
45 - Transfer out800.902 - Transfers Out 0 150,000 0 0
45 - Transfer out Total 0 150,000 0 0005 Memorial Park MP and Parking Total 0 150,000 0 0
54

Appendix A-4 Year Expenditure Trends at the Account Level by Program
Department
FY17 Actuals
FY18 Actuals
FY19 Final Budget
FY20 Proposed
Budget007 ADA Improvements
30 - Capital outlays900.905 - Facility Improvements 0 176,984 75,000 0
30 - Capital outlays Total 0 176,984 75,000 0007 ADA Improvements Total 0 176,984 75,000 0
55

Appendix A-4 Year Expenditure Trends at the Account Level by Program
Department
FY17 Actuals
FY18 Actuals
FY19 Final Budget
FY20 Proposed
Budget009 Lawrence-Mitty Park
05 - Employee compensation500.501 - Salaries Full Time 3,784 0 0 0
05 - Employee compensation Total 3,784 0 0 010 - Employee benefits
501.500 - Retirement System 955 16 0 0501.502 - Pers 1959 Surv Empr 2 0 0 0501.506 - Dental Insurance 41 1 0 0501.507 - Medicare 54 1 0 0501.508 - Life Insurance 24 0 0 0501.509 - Long Term Disability 35 1 0 0501.511 - Vision Insurance 6 0 0 0501.516 - Hra City Contribution 23 0 0 0
10 - Employee benefits Total 1,139 19 0 030 - Capital outlays
900.905 - Facility Improvements 22,115 169 0 030 - Capital outlays Total 22,115 169 0 0
009 Lawrence-Mitty Park Total 27,039 188 0 0
56

Appendix A-4 Year Expenditure Trends at the Account Level by Program
Department
FY17 Actuals
FY18 Actuals
FY19 Final Budget
FY20 Proposed
Budget015 Tennis Court Resurfacing Parks
05 - Employee compensation500.501 - Salaries Full Time 0 69 0 0
05 - Employee compensation Total 0 69 0 010 - Employee benefits
501.500 - Retirement System 0 18 0 0501.502 - Pers 1959 Surv Empr 0 0 0 0501.505 - Health Insurance 0 5 0 0501.506 - Dental Insurance 0 1 0 0501.507 - Medicare 0 1 0 0501.511 - Vision Insurance 0 0 0 0
10 - Employee benefits Total 0 24 0 030 - Capital outlays
900.905 - Facility Improvements 300,875 328,036 0 030 - Capital outlays Total 300,875 328,036 0 0
45 - Transfer out800.902 - Transfers Out 0 473,995 0 0
45 - Transfer out Total 0 473,995 0 0015 Tennis Court Resurfacing Parks Total 300,875 802,125 0 0
57

Appendix A-4 Year Expenditure Trends at the Account Level by Program
Department
FY17 Actuals
FY18 Actuals
FY19 Final Budget
FY20 Proposed
Budget017 Sports Center Exterior Upgrades
30 - Capital outlays900.905 - Facility Improvements 490 339,209 830,000 0
30 - Capital outlays Total 490 339,209 830,000 0017 Sports Center Exterior Upgrades Total 490 339,209 830,000 0
58

Appendix A-4 Year Expenditure Trends at the Account Level by Program
Department
FY17 Actuals
FY18 Actuals
FY19 Final Budget
FY20 Proposed
Budget019 Blacksmith Forge Restoration Des
05 - Employee compensation500.501 - Salaries Full Time 4,427 62 0 0
05 - Employee compensation Total 4,427 62 0 010 - Employee benefits
501.500 - Retirement System 1,194 72 0 0501.502 - Pers 1959 Surv Empr 2 0 0 0501.505 - Health Insurance 536 36 0 0501.506 - Dental Insurance 47 2 0 0501.507 - Medicare 62 3 0 0501.508 - Life Insurance 28 1 0 0501.509 - Long Term Disability 27 4 0 0501.511 - Vision Insurance 7 0 0 0501.516 - Hra City Contribution 32 0 0 0
10 - Employee benefits Total 1,936 117 0 045 - Transfer out
800.902 - Transfers Out 0 37,026 0 045 - Transfer out Total 0 37,026 0 0
019 Blacksmith Forge Restoration Des Total 6,363 37,206 0 0
59

Appendix A-4 Year Expenditure Trends at the Account Level by Program
Department
FY17 Actuals
FY18 Actuals
FY19 Final Budget
FY20 Proposed
Budget023 QCC Fire Alarm Control Panel Upg
05 - Employee compensation500.501 - Salaries Full Time 4,831 5,234 0 0
05 - Employee compensation Total 4,831 5,234 0 010 - Employee benefits
501.500 - Retirement System 1,238 1,362 0 0501.502 - Pers 1959 Surv Empr 2 2 0 0501.505 - Health Insurance 604 805 0 0501.506 - Dental Insurance 52 61 0 0501.507 - Medicare 66 72 0 0501.508 - Life Insurance 30 28 0 0501.509 - Long Term Disability 37 44 0 0501.511 - Vision Insurance 7 7 0 0501.516 - Hra City Contribution 27 0 0 0
10 - Employee benefits Total 2,064 2,381 0 030 - Capital outlays
900.905 - Facility Improvements 16,250 52,257 0 030 - Capital outlays Total 16,250 52,257 0 0
023 QCC Fire Alarm Control Panel Upg Total 23,145 59,872 0 0
60
Appendix A-4 Year Expenditure Trends at the Account Level by Program
Department
FY17 Actuals
FY18 Actuals
FY19 Final Budget
FY20 Proposed
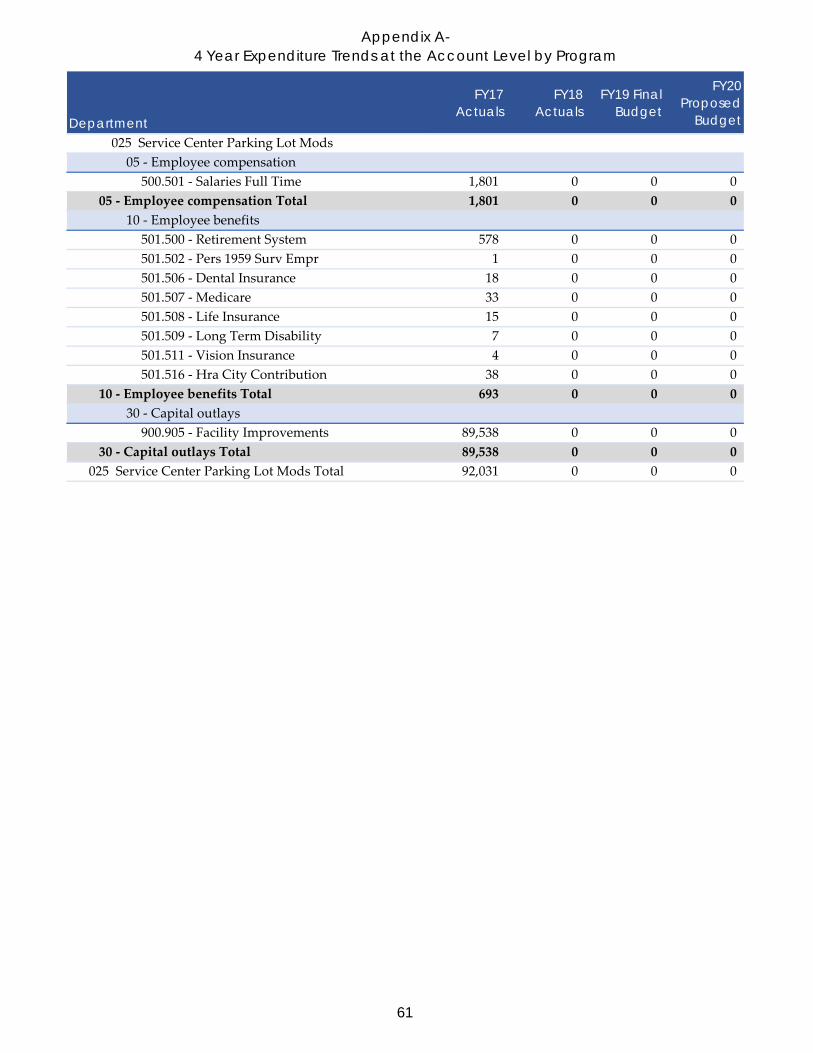
Budget025 Service Center Parking Lot Mods
05 - Employee compensation500.501 - Salaries Full Time 1,801 0 0 0
05 - Employee compensation Total 1,801 0 0 010 - Employee benefits
501.500 - Retirement System 578 0 0 0501.502 - Pers 1959 Surv Empr 1 0 0 0501.506 - Dental Insurance 18 0 0 0501.507 - Medicare 33 0 0 0501.508 - Life Insurance 15 0 0 0501.509 - Long Term Disability 7 0 0 0501.511 - Vision Insurance 4 0 0 0501.516 - Hra City Contribution 38 0 0 0
10 - Employee benefits Total 693 0 0 030 - Capital outlays
900.905 - Facility Improvements 89,538 0 0 030 - Capital outlays Total 89,538 0 0 0
025 Service Center Parking Lot Mods Total 92,031 0 0 0
61

Appendix A-4 Year Expenditure Trends at the Account Level by Program
Department
FY17 Actuals
FY18 Actuals
FY19 Final Budget
FY20 Proposed
Budget026 Bicycle Transportation Plan Upda
30 - Capital outlays900.905 - Facility Improvements 2,210 0 0 0
30 - Capital outlays Total 2,210 0 0 0026 Bicycle Transportation Plan Upda Total 2,210 0 0 0
62

Appendix A-4 Year Expenditure Trends at the Account Level by Program
Department
FY17 Actuals
FY18 Actuals
FY19 Final Budget
FY20 Proposed
Budget027 Pasadena Ave Pub Imp Granada
05 - Employee compensation500.501 - Salaries Full Time 5,482 0 0 0
05 - Employee compensation Total 5,482 0 0 010 - Employee benefits
501.500 - Retirement System 1,507 0 0 0501.502 - Pers 1959 Surv Empr 3 0 0 0501.506 - Dental Insurance 60 0 0 0501.507 - Medicare 86 0 0 0501.508 - Life Insurance 38 0 0 0501.509 - Long Term Disability 35 0 0 0501.511 - Vision Insurance 9 0 0 0501.516 - Hra City Contribution 53 0 0 0
10 - Employee benefits Total 1,791 0 0 030 - Capital outlays
900.905 - Facility Improvements 520,220 0 0 030 - Capital outlays Total 520,220 0 0 0
45 - Transfer out800.902 - Transfers Out 0 1,236 0 0
45 - Transfer out Total 0 1,236 0 0027 Pasadena Ave Pub Imp Granada Total 527,492 1,236 0 0
63

Appendix A-4 Year Expenditure Trends at the Account Level by Program
Department
FY17 Actuals
FY18 Actuals
FY19 Final Budget
FY20 Proposed
Budget028 Traffic Signal Foothill-I280 SB
45 - Transfer out800.902 - Transfers Out 0 100,000 0 0
45 - Transfer out Total 0 100,000 0 0028 Traffic Signal Foothill-I280 SB Total 0 100,000 0 0
64

Appendix A-4 Year Expenditure Trends at the Account Level by Program
Department
FY17 Actuals
FY18 Actuals
FY19 Final Budget
FY20 Proposed
Budget030 MCClellan West-Parking Lot Impro
05 - Employee compensation500.501 - Salaries Full Time 4,247 7,828 0 0
05 - Employee compensation Total 4,247 7,828 0 010 - Employee benefits
501.500 - Retirement System 1,058 1,976 0 0501.502 - Pers 1959 Surv Empr 2 3 0 0501.505 - Health Insurance 568 1,086 0 0501.506 - Dental Insurance 48 86 0 0501.507 - Medicare 57 104 0 0501.508 - Life Insurance 25 39 0 0501.509 - Long Term Disability 32 62 0 0501.511 - Vision Insurance 6 10 0 0501.516 - Hra City Contribution 13 0 0 0
10 - Employee benefits Total 1,808 3,367 0 030 - Capital outlays
900.905 - Facility Improvements 46,071 83,721 0 030 - Capital outlays Total 46,071 83,721 0 0
030 MCClellan West-Parking Lot Impro Total 52,126 94,917 0 0
65

Appendix A-4 Year Expenditure Trends at the Account Level by Program
Department
FY17 Actuals
FY18 Actuals
FY19 Final Budget
FY20 Proposed
Budget032 Spt Ctr - Children's Play Area
45 - Transfer out800.902 - Transfers Out 0 470,000 0 0
45 - Transfer out Total 0 470,000 0 0032 Spt Ctr - Children's Play Area Total 0 470,000 0 0
66

Appendix A-4 Year Expenditure Trends at the Account Level by Program
Department
FY17 Actuals
FY18 Actuals
FY19 Final Budget
FY20 Proposed
Budget033 City Hall - Turf Reduction
05 - Employee compensation500.501 - Salaries Full Time 475 0 0 0
05 - Employee compensation Total 475 0 0 010 - Employee benefits
501.500 - Retirement System 129 0 0 0501.502 - Pers 1959 Surv Empr 0 0 0 0501.506 - Dental Insurance 5 0 0 0501.507 - Medicare 7 0 0 0501.508 - Life Insurance 3 0 0 0501.511 - Vision Insurance 1 0 0 0
10 - Employee benefits Total 145 0 0 030 - Capital outlays
900.905 - Facility Improvements 300,064 103,642 0 030 - Capital outlays Total 300,064 103,642 0 0
033 City Hall - Turf Reduction Total 300,684 103,642 0 0
67

Appendix A-4 Year Expenditure Trends at the Account Level by Program
Department
FY17 Actuals
FY18 Actuals
FY19 Final Budget
FY20 Proposed
Budget034 Svc Ctr - Shed No. 3 Improvement
05 - Employee compensation500.501 - Salaries Full Time 4,033 6,767 0 0
05 - Employee compensation Total 4,033 6,767 0 010 - Employee benefits
501.500 - Retirement System 1,003 1,767 0 0501.502 - Pers 1959 Surv Empr 2 3 0 0501.505 - Health Insurance 538 1,011 0 0501.506 - Dental Insurance 45 80 0 0501.507 - Medicare 54 93 0 0501.508 - Life Insurance 24 37 0 0501.509 - Long Term Disability 32 58 0 0501.511 - Vision Insurance 6 9 0 0501.516 - Hra City Contribution 13 0 0 0
10 - Employee benefits Total 1,716 3,058 0 030 - Capital outlays
900.905 - Facility Improvements 11,351 80,817 600,000 030 - Capital outlays Total 11,351 80,817 600,000 0
034 Svc Ctr - Shed No. 3 Improvement Total 17,100 90,642 600,000 0
68

Appendix A-4 Year Expenditure Trends at the Account Level by Program
Department
FY17 Actuals
FY18 Actuals
FY19 Final Budget
FY20 Proposed
Budget035 Stocklmeir Hse-New Sewer Lateral
45 - Transfer out800.902 - Transfers Out 0 50,000 0 0
45 - Transfer out Total 0 50,000 0 0035 Stocklmeir Hse-New Sewer Lateral Total 0 50,000 0 0
69

Appendix A-4 Year Expenditure Trends at the Account Level by Program
Department
FY17 Actuals
FY18 Actuals
FY19 Final Budget
FY20 Proposed
Budget036 2016 Bike Plan Implementation
30 - Capital outlays900.905 - Facility Improvements 159,319 723,141 1,800,000 0
30 - Capital outlays Total 159,319 723,141 1,800,000 0036 2016 Bike Plan Implementation Total 159,319 723,141 1,800,000 0
70

Appendix A-4 Year Expenditure Trends at the Account Level by Program
Department
FY17 Actuals
FY18 Actuals
FY19 Final Budget
FY20 Proposed
Budget037 Bikeway Enhncmnts & Brnding Stdy
30 - Capital outlays900.905 - Facility Improvements 136 49,973 0 0
30 - Capital outlays Total 136 49,973 0 0037 Bikeway Enhncmnts & Brnding Stdy Total 136 49,973 0 0
71

Appendix A-4 Year Expenditure Trends at the Account Level by Program
Department
FY17 Actuals
FY18 Actuals
FY19 Final Budget
FY20 Proposed
Budget038 Fiber Network Ext to Svc Ctr
05 - Employee compensation500.501 - Salaries Full Time 3,670 4,880 0 0
05 - Employee compensation Total 3,670 4,880 0 010 - Employee benefits
501.500 - Retirement System 863 1,343 0 0501.502 - Pers 1959 Surv Empr 1 3 0 0501.505 - Health Insurance 0 23 0 0501.506 - Dental Insurance 42 62 0 0501.507 - Medicare 49 75 0 0501.508 - Life Insurance 21 33 0 0501.509 - Long Term Disability 17 54 0 0501.511 - Vision Insurance 4 8 0 0
10 - Employee benefits Total 998 1,600 0 030 - Capital outlays
900.905 - Facility Improvements 19,475 272,469 0 030 - Capital outlays Total 19,475 272,469 0 0
45 - Transfer out800.902 - Transfers Out 0 46,908 0 0
45 - Transfer out Total 0 46,908 0 0038 Fiber Network Ext to Svc Ctr Total 24,142 325,857 0 0
72

Appendix A-4 Year Expenditure Trends at the Account Level by Program
Department
FY17 Actuals
FY18 Actuals
FY19 Final Budget
FY20 Proposed
Budget039 Pedestrian Master Plan
30 - Capital outlays900.905 - Facility Improvements 67,453 52,547 0 0
30 - Capital outlays Total 67,453 52,547 0 045 - Transfer out
800.902 - Transfers Out 0 0 0 045 - Transfer out Total 0 0 0 0
039 Pedestrian Master Plan Total 67,453 52,547 0 0
73

Appendix A-4 Year Expenditure Trends at the Account Level by Program
Department
FY17 Actuals
FY18 Actuals
FY19 Final Budget
FY20 Proposed
Budget040 Retaining Wall Repair-Cordova Rd
05 - Employee compensation500.501 - Salaries Full Time 428 830 0 0
05 - Employee compensation Total 428 830 0 010 - Employee benefits
501.500 - Retirement System 110 215 0 0501.502 - Pers 1959 Surv Empr 0 0 0 0501.506 - Dental Insurance 5 10 0 0501.507 - Medicare 6 12 0 0501.508 - Life Insurance 3 3 0 0501.509 - Long Term Disability 4 2 0 0501.511 - Vision Insurance 0 1 0 0
10 - Employee benefits Total 128 244 0 030 - Capital outlays
900.905 - Facility Improvements 25 0 0 030 - Capital outlays Total 25 0 0 0
040 Retaining Wall Repair-Cordova Rd Total 581 1,074 0 0
74

Appendix A-4 Year Expenditure Trends at the Account Level by Program
Department
FY17 Actuals
FY18 Actuals
FY19 Final Budget
FY20 Proposed
Budget041 Retaining Wall Repl - Regnart Rd
05 - Employee compensation500.501 - Salaries Full Time 917 5,171 0 0
05 - Employee compensation Total 917 5,171 0 010 - Employee benefits
501.500 - Retirement System 204 1,370 0 0501.502 - Pers 1959 Surv Empr 0 2 0 0501.506 - Dental Insurance 10 64 0 0501.507 - Medicare 12 76 0 0501.508 - Life Insurance 5 30 0 0501.509 - Long Term Disability 7 51 0 0501.511 - Vision Insurance 1 7 0 0
10 - Employee benefits Total 239 1,600 0 030 - Capital outlays
900.905 - Facility Improvements 30,157 450,407 0 030 - Capital outlays Total 30,157 450,407 0 0
45 - Transfer out800.902 - Transfers Out 0 11,548 0 0
45 - Transfer out Total 0 11,548 0 0041 Retaining Wall Repl - Regnart Rd Total 31,313 468,726 0 0
75

Appendix A-4 Year Expenditure Trends at the Account Level by Program
Department
FY17 Actuals
FY18 Actuals
FY19 Final Budget
FY20 Proposed
Budget042 Strm Drn Improv-Fthill & Cup Rd
05 - Employee compensation500.501 - Salaries Full Time 11,184 7,972 0 0
05 - Employee compensation Total 11,184 7,972 0 010 - Employee benefits
501.500 - Retirement System 1,910 2,063 0 0501.502 - Pers 1959 Surv Empr 5 4 0 0501.506 - Dental Insurance 123 97 0 0501.507 - Medicare 164 115 0 0501.508 - Life Insurance 71 45 0 0501.509 - Long Term Disability 82 74 0 0501.511 - Vision Insurance 16 11 0 0501.516 - Hra City Contribution 68 0 0 0
10 - Employee benefits Total 2,439 2,408 0 030 - Capital outlays
900.905 - Facility Improvements 34,373 1,200,283 0 030 - Capital outlays Total 34,373 1,200,283 0 0
042 Strm Drn Improv-Fthill & Cup Rd Total 47,995 1,210,663 0 0
76

Appendix A-4 Year Expenditure Trends at the Account Level by Program
Department
FY17 Actuals
FY18 Actuals
FY19 Final Budget
FY20 Proposed
Budget043 Svc Ctr-New Admin Bldg Feas Stdy
05 - Employee compensation500.501 - Salaries Full Time 3,192 255 0 0
05 - Employee compensation Total 3,192 255 0 010 - Employee benefits
501.500 - Retirement System 819 66 0 0501.502 - Pers 1959 Surv Empr 2 0 0 0501.505 - Health Insurance 470 41 0 0501.506 - Dental Insurance 37 3 0 0501.507 - Medicare 44 3 0 0501.508 - Life Insurance 20 0 0 0501.509 - Long Term Disability 27 0 0 0501.511 - Vision Insurance 5 0 0 0501.516 - Hra City Contribution 8 0 0 0
10 - Employee benefits Total 1,432 114 0 030 - Capital outlays
900.905 - Facility Improvements 14,000 26,000 0 030 - Capital outlays Total 14,000 26,000 0 0
45 - Transfer out800.902 - Transfers Out 0 6,016 0 0
45 - Transfer out Total 0 6,016 0 0043 Svc Ctr-New Admin Bldg Feas Stdy Total 18,624 32,385 0 0
77

Appendix A-4 Year Expenditure Trends at the Account Level by Program
Department
FY17 Actuals
FY18 Actuals
FY19 Final Budget
FY20 Proposed
Budget044 Traffic Calm Rodrigues/Pacifica
30 - Capital outlays900.905 - Facility Improvements 0 24,000 0 0
30 - Capital outlays Total 0 24,000 0 0044 Traffic Calm Rodrigues/Pacifica Total 0 24,000 0 0
78
Appendix A-4 Year Expenditure Trends at the Account Level by Program
Department
FY17 Actuals
FY18 Actuals
FY19 Final Budget
FY20 Proposed
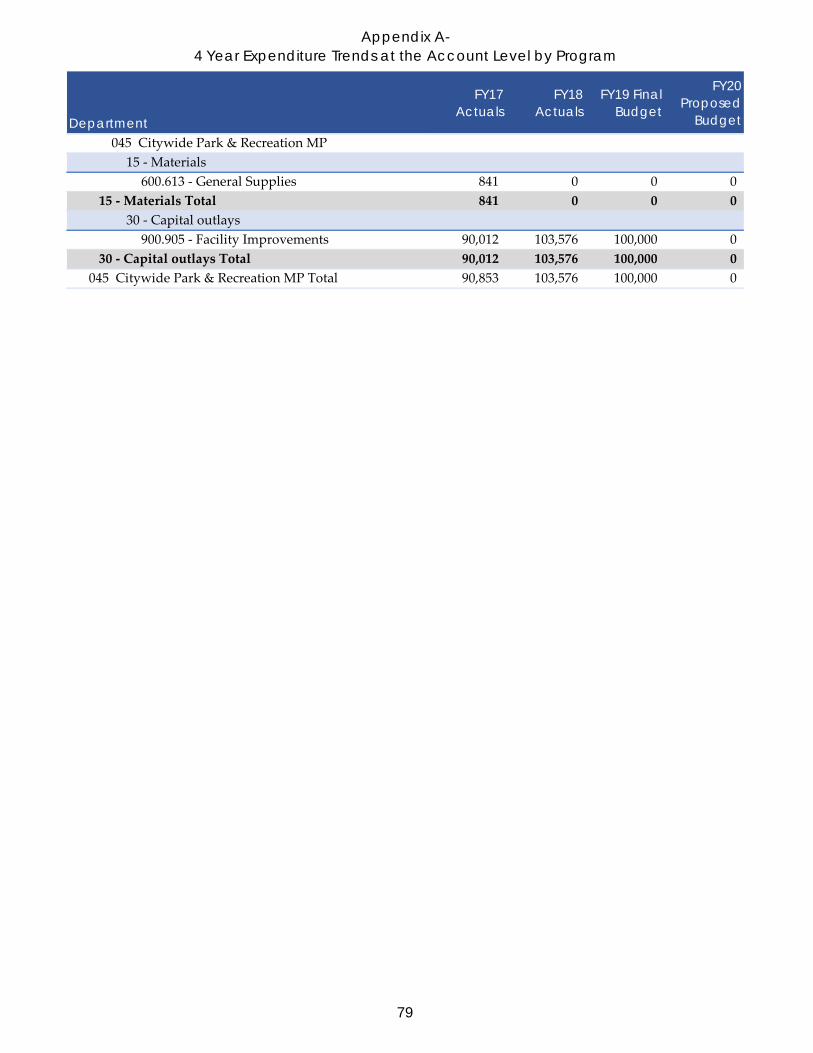
Budget045 Citywide Park & Recreation MP
15 - Materials600.613 - General Supplies 841 0 0 0
15 - Materials Total 841 0 0 030 - Capital outlays
900.905 - Facility Improvements 90,012 103,576 100,000 030 - Capital outlays Total 90,012 103,576 100,000 0
045 Citywide Park & Recreation MP Total 90,853 103,576 100,000 0
79

Appendix A-4 Year Expenditure Trends at the Account Level by Program
Department
FY17 Actuals
FY18 Actuals
FY19 Final Budget
FY20 Proposed
Budget046 Sidewalk Renovation-SCB
05 - Employee compensation500.501 - Salaries Full Time 4,724 0 0 0
05 - Employee compensation Total 4,724 0 0 010 - Employee benefits
501.500 - Retirement System 1,212 0 0 0501.502 - Pers 1959 Surv Empr 2 0 0 0501.506 - Dental Insurance 58 0 0 0501.507 - Medicare 69 0 0 0501.508 - Life Insurance 29 0 0 0501.509 - Long Term Disability 36 0 0 0501.511 - Vision Insurance 7 0 0 0501.516 - Hra City Contribution 5 0 0 0
10 - Employee benefits Total 1,418 0 0 030 - Capital outlays
900.905 - Facility Improvements 196,268 0 0 030 - Capital outlays Total 196,268 0 0 0
45 - Transfer out800.902 - Transfers Out 0 47,589 0 0
45 - Transfer out Total 0 47,589 0 0046 Sidewalk Renovation-SCB Total 202,410 47,589 0 0
80

Appendix A-4 Year Expenditure Trends at the Account Level by Program
Department
FY17 Actuals
FY18 Actuals
FY19 Final Budget
FY20 Proposed
Budget047 CIP Prelim Planning & Design
20 - Contract services700.702 - General Service Agreement 0 62,977 0 125,000
20 - Contract services Total 0 62,977 0 125,00030 - Capital outlays
900.905 - Facility Improvements 0 0 125,000 030 - Capital outlays Total 0 0 125,000 0
047 CIP Prelim Planning & Design Total 0 62,977 125,000 125,000
81

Appendix A-4 Year Expenditure Trends at the Account Level by Program
Department
FY17 Actuals
FY18 Actuals
FY19 Final Budget
FY20 Proposed
Budget048 Capital Project Support
20 - Contract services700.702 - General Service Agreement 0 0 0 50,000
20 - Contract services Total 0 0 0 50,00030 - Capital outlays
900.905 - Facility Improvements 0 2,217 50,000 030 - Capital outlays Total 0 2,217 50,000 0
35 - Contingencies719.705 - Contingencies 0 0 0 2,500
35 - Contingencies Total 0 0 0 2,500048 Capital Project Support Total 0 2,217 50,000 52,500
82

Appendix A-4 Year Expenditure Trends at the Account Level by Program
Department
FY17 Actuals
FY18 Actuals
FY19 Final Budget
FY20 Proposed
Budget049 Int'l Cricket Ground-Feasibility
05 - Employee compensation500.501 - Salaries Full Time 0 2,150 0 0
05 - Employee compensation Total 0 2,150 0 010 - Employee benefits
501.500 - Retirement System 0 556 0 0501.502 - Pers 1959 Surv Empr 0 1 0 0501.505 - Health Insurance 0 287 0 0501.506 - Dental Insurance 0 26 0 0501.507 - Medicare 0 29 0 0501.508 - Life Insurance 0 8 0 0501.509 - Long Term Disability 0 13 0 0501.511 - Vision Insurance 0 3 0 0
10 - Employee benefits Total 0 923 0 030 - Capital outlays
900.905 - Facility Improvements 0 15,600 0 030 - Capital outlays Total 0 15,600 0 0
45 - Transfer out800.902 - Transfers Out 0 1,327 0 0
45 - Transfer out Total 0 1,327 0 0049 Int'l Cricket Ground-Feasibility Total 0 20,000 0 0
83

Appendix A-4 Year Expenditure Trends at the Account Level by Program
Department
FY17 Actuals
FY18 Actuals
FY19 Final Budget
FY20 Proposed
Budget051 Inclusive Play Area - Planning
30 - Capital outlays900.905 - Facility Improvements 0 15,953 0 0
30 - Capital outlays Total 0 15,953 0 0051 Inclusive Play Area - Planning Total 0 15,953 0 0
84

Appendix A-4 Year Expenditure Trends at the Account Level by Program
Department
FY17 Actuals
FY18 Actuals
FY19 Final Budget
FY20 Proposed
Budget054 Senior Ctr Walkway Replacement
05 - Employee compensation500.501 - Salaries Full Time 0 447 0 0
05 - Employee compensation Total 0 447 0 010 - Employee benefits
501.500 - Retirement System 0 116 0 0501.502 - Pers 1959 Surv Empr 0 0 0 0501.505 - Health Insurance 0 72 0 0501.506 - Dental Insurance 0 5 0 0501.507 - Medicare 0 6 0 0501.508 - Life Insurance 0 2 0 0501.509 - Long Term Disability 0 2 0 0501.511 - Vision Insurance 0 1 0 0
10 - Employee benefits Total 0 204 0 030 - Capital outlays
900.905 - Facility Improvements 0 47,315 0 030 - Capital outlays Total 0 47,315 0 0
054 Senior Ctr Walkway Replacement Total 0 47,966 0 0
85

Appendix A-4 Year Expenditure Trends at the Account Level by Program
Department
FY17 Actuals
FY18 Actuals
FY19 Final Budget
FY20 Proposed
Budget055 Outfall Rpr/Slope Stblz-Regnart
45 - Transfer out800.902 - Transfers Out 0 400,000 0 0
45 - Transfer out Total 0 400,000 0 0055 Outfall Rpr/Slope Stblz-Regnart Total 0 400,000 0 0
86

Appendix A-4 Year Expenditure Trends at the Account Level by Program
Department
FY17 Actuals
FY18 Actuals
FY19 Final Budget
FY20 Proposed
Budget056 St Light Install - Annual Infill
30 - Capital outlays900.905 - Facility Improvements 0 0 30,000 0
30 - Capital outlays Total 0 0 30,000 0056 St Light Install - Annual Infill Total 0 0 30,000 0
87

Appendix A-4 Year Expenditure Trends at the Account Level by Program
Department
FY17 Actuals
FY18 Actuals
FY19 Final Budget
FY20 Proposed
Budget058 St Light Install-Randy & Larry
30 - Capital outlays900.905 - Facility Improvements 0 7,050 0 0
30 - Capital outlays Total 0 7,050 0 0058 St Light Install-Randy & Larry Total 0 7,050 0 0
88

Appendix A-4 Year Expenditure Trends at the Account Level by Program
Department
FY17 Actuals
FY18 Actuals
FY19 Final Budget
FY20 Proposed
Budget059 Senior Center Repairs
05 - Employee compensation500.501 - Salaries Full Time 0 2,106 0 0
05 - Employee compensation Total 0 2,106 0 010 - Employee benefits
501.500 - Retirement System 0 504 0 0501.502 - Pers 1959 Surv Empr 0 1 0 0501.505 - Health Insurance 0 270 0 0501.506 - Dental Insurance 0 20 0 0501.507 - Medicare 0 26 0 0501.508 - Life Insurance 0 6 0 0501.509 - Long Term Disability 0 10 0 0501.511 - Vision Insurance 0 2 0 0
10 - Employee benefits Total 0 840 0 030 - Capital outlays
900.905 - Facility Improvements 0 7,500 0 030 - Capital outlays Total 0 7,500 0 0
059 Senior Center Repairs Total 0 10,446 0 0
89

Appendix A-4 Year Expenditure Trends at the Account Level by Program
Department
FY17 Actuals
FY18 Actuals
FY19 Final Budget
FY20 Proposed
Budget060 Storm Drain Improv-Byrne & SCB
45 - Transfer out800.902 - Transfers Out 0 1,500,000 0 0
45 - Transfer out Total 0 1,500,000 0 0060 Storm Drain Improv-Byrne & SCB Total 0 1,500,000 0 0
90

Appendix A-4 Year Expenditure Trends at the Account Level by Program
Department
FY17 Actuals
FY18 Actuals
FY19 Final Budget
FY20 Proposed
Budget061 BBF Entrnc Rd Improv-Feasibility
30 - Capital outlays900.905 - Facility Improvements 0 0 75,000 0
30 - Capital outlays Total 0 0 75,000 0061 BBF Entrnc Rd Improv-Feasibility Total 0 0 75,000 0
91

Appendix A-4 Year Expenditure Trends at the Account Level by Program
Department
FY17 Actuals
FY18 Actuals
FY19 Final Budget
FY20 Proposed
Budget063 CW Bldg Condition Assess Impl
30 - Capital outlays900.905 - Facility Improvements 0 0 1,000,000 0
30 - Capital outlays Total 0 0 1,000,000 0063 CW Bldg Condition Assess Impl Total 0 0 1,000,000 0
92

Appendix A-4 Year Expenditure Trends at the Account Level by Program
Department
FY17 Actuals
FY18 Actuals
FY19 Final Budget
FY20 Proposed
Budget064 Creek Infall/Outfall Restoration
30 - Capital outlays900.905 - Facility Improvements 0 0 160,000 0
30 - Capital outlays Total 0 0 160,000 0064 Creek Infall/Outfall Restoration Total 0 0 160,000 0
93

Appendix A-4 Year Expenditure Trends at the Account Level by Program
Department
FY17 Actuals
FY18 Actuals
FY19 Final Budget
FY20 Proposed
Budget065 DeAnza Med Islnd Landscaping Ph2
30 - Capital outlays900.905 - Facility Improvements 0 0 1,546,500 0
30 - Capital outlays Total 0 0 1,546,500 0065 DeAnza Med Islnd Landscaping Ph2 Total 0 0 1,546,500 0
94

Appendix A-4 Year Expenditure Trends at the Account Level by Program
Department
FY17 Actuals
FY18 Actuals
FY19 Final Budget
FY20 Proposed
Budget066 MRP Community Grdn Improv-Const
30 - Capital outlays900.905 - Facility Improvements 0 0 1,500,000 0
30 - Capital outlays Total 0 0 1,500,000 0066 MRP Community Grdn Improv-Const Total 0 0 1,500,000 0
95
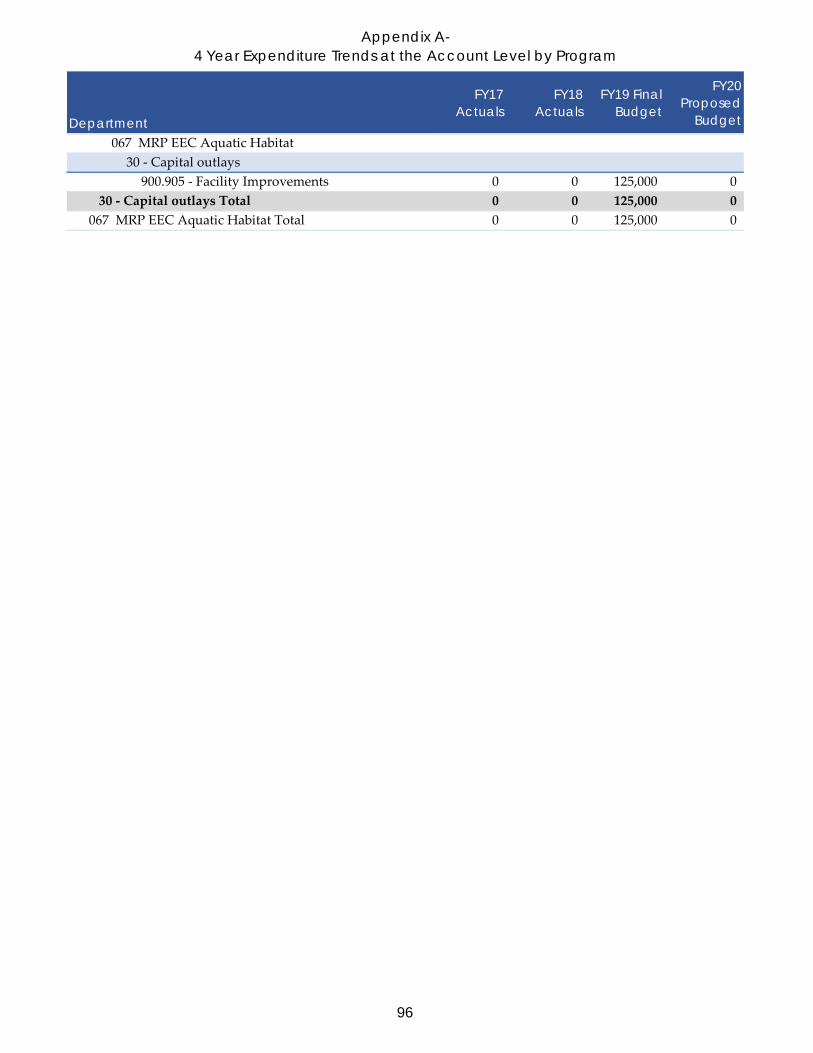
Appendix A-4 Year Expenditure Trends at the Account Level by Program
Department
FY17 Actuals
FY18 Actuals
FY19 Final Budget
FY20 Proposed
Budget067 MRP EEC Aquatic Habitat
30 - Capital outlays900.905 - Facility Improvements 0 0 125,000 0
30 - Capital outlays Total 0 0 125,000 0067 MRP EEC Aquatic Habitat Total 0 0 125,000 0
96

Appendix A-4 Year Expenditure Trends at the Account Level by Program
Department
FY17 Actuals
FY18 Actuals
FY19 Final Budget
FY20 Proposed
Budget068 Regnart Road Improvements
30 - Capital outlays900.905 - Facility Improvements 0 0 150,000 0
30 - Capital outlays Total 0 0 150,000 0068 Regnart Road Improvements Total 0 0 150,000 0
97

Appendix A-4 Year Expenditure Trends at the Account Level by Program
Department
FY17 Actuals
FY18 Actuals
FY19 Final Budget
FY20 Proposed
Budget069 School Walk Audit Implementation
30 - Capital outlays900.905 - Facility Improvements 0 0 250,000 0
30 - Capital outlays Total 0 0 250,000 0069 School Walk Audit Implementation Total 0 0 250,000 0
98

Appendix A-4 Year Expenditure Trends at the Account Level by Program
Department
FY17 Actuals
FY18 Actuals
FY19 Final Budget
FY20 Proposed
Budget070 SCB/Bandley Signal & Median Imps
30 - Capital outlays900.905 - Facility Improvements 0 0 150,000 0
30 - Capital outlays Total 0 0 150,000 0070 SCB/Bandley Signal & Median Imps Total 0 0 150,000 0
99

Appendix A-4 Year Expenditure Trends at the Account Level by Program
Department
FY17 Actuals
FY18 Actuals
FY19 Final Budget
FY20 Proposed
Budget071 Storm Drain MP Implementation
30 - Capital outlays900.905 - Facility Improvements 0 0 1,500,000 0
30 - Capital outlays Total 0 0 1,500,000 0071 Storm Drain MP Implementation Total 0 0 1,500,000 0
100

Appendix A-4 Year Expenditure Trends at the Account Level by Program
Department
FY17 Actuals
FY18 Actuals
FY19 Final Budget
FY20 Proposed
Budget072 St Light Replacement CW (labor)
30 - Capital outlays900.905 - Facility Improvements 0 0 200,000 0
30 - Capital outlays Total 0 0 200,000 0072 St Light Replacement CW (labor) Total 0 0 200,000 0
101

Appendix A-4 Year Expenditure Trends at the Account Level by Program
Department
FY17 Actuals
FY18 Actuals
FY19 Final Budget
FY20 Proposed
Budget885 Golf Irrigation Upgrades
45 - Transfer out800.902 - Transfers Out 0 493,000 0 0
45 - Transfer out Total 0 493,000 0 0885 Golf Irrigation Upgrades Total 0 493,000 0 0
99 CIP Total 1,992,993 8,220,812 10,266,500 177,500Capital projects Total 3,191,500 10,634,033 10,341,500 177,500
102

Appendix A-4 Year Expenditure Trends at the Account Level by Program
Department
FY17 Actuals
FY18 Actuals
FY19 Final Budget
FY20 Proposed
BudgetCommunity development
70 Planning & Community Development700 Community Development Admin
05 - Employee compensation500.501 - Salaries Full Time 89,027 100,333 102,802 99,323500.506 - Car Allowance 900 900 901 1,091
05 - Employee compensation Total 89,927 101,233 103,703 100,41410 - Employee benefits
501.500 - Retirement System 23,229 25,351 27,636 26,565501.502 - Pers 1959 Surv Empr 31 34 34 36501.505 - Health Insurance 6,473 7,903 8,075 7,937501.506 - Dental Insurance 776 868 839 922501.507 - Medicare 1,321 1,463 1,504 1,441501.508 - Life Insurance 421 396 396 436501.509 - Long Term Disability 460 624 698 747501.510 - Workers Compensation 2,972 1,716 1,395 693501.511 - Vision Insurance 98 100 99 108501.513 - Rec Bucks 0 0 0 242501.516 - Hra City Contribution 12,656 0 0 0
10 - Employee benefits Total 48,437 38,455 40,676 39,12715 - Materials
600.601 - General Office Supplies 395 337 500 400600.602 - Printing and Duplication 0 0 4,000 0600.605 - Meeting Expenses 748 623 2,000 500600.608 - Sml Tools and Equipment 266 0 2,000 0600.613 - General Supplies 790 1,017 2,000 1,440600.629 - Conference and Training 9,576 10,736 13,500 12,640600.632 - Mileage Reimbursement 87 69 200 100600.635 - Special Departmental Exp 0 99 4,250 4,250600.642 - Telphone and Data Services 2,360 2,005 2,000 2,300600.647 - Memberships and Dues 0 0 0 2,325
15 - Materials Total 14,222 14,886 30,450 23,95520 - Contract services
700.701 - Training and Instruction 186 487 5,300 0700.702 - General Service Agreement 919 3,005 700 0700.703 - Maintenance of Equipment 1,111 235 1,000 0700.707 - Bank Charges 0 0 100,000 100,000
20 - Contract services Total 2,215 3,727 107,000 100,00025 - Cost allocation
800.801 - Equipment Reimbursement 0 0 30 41800.802 - IT Reimbursement 16,416 8,605 38,049 27,687800.805 - CC CAP Allocation 3,455 2,498 1,346 1,929800.806 - CM CAP Allocation 913 775 574 724
103
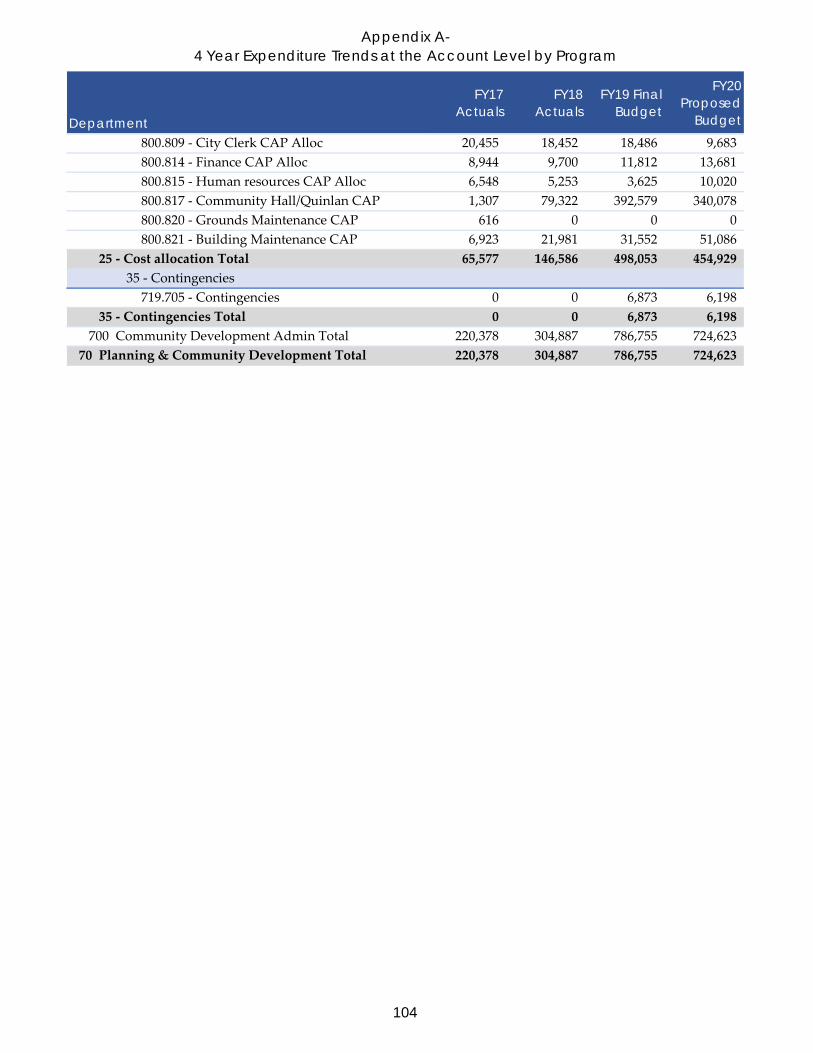
Appendix A-4 Year Expenditure Trends at the Account Level by Program
Department
FY17 Actuals
FY18 Actuals
FY19 Final Budget
FY20 Proposed
Budget800.809 - City Clerk CAP Alloc 20,455 18,452 18,486 9,683800.814 - Finance CAP Alloc 8,944 9,700 11,812 13,681800.815 - Human resources CAP Alloc 6,548 5,253 3,625 10,020800.817 - Community Hall/Quinlan CAP 1,307 79,322 392,579 340,078800.820 - Grounds Maintenance CAP 616 0 0 0800.821 - Building Maintenance CAP 6,923 21,981 31,552 51,086
25 - Cost allocation Total 65,577 146,586 498,053 454,92935 - Contingencies
719.705 - Contingencies 0 0 6,873 6,19835 - Contingencies Total 0 0 6,873 6,198
700 Community Development Admin Total 220,378 304,887 786,755 724,62370 Planning & Community Development Total 220,378 304,887 786,755 724,623
104
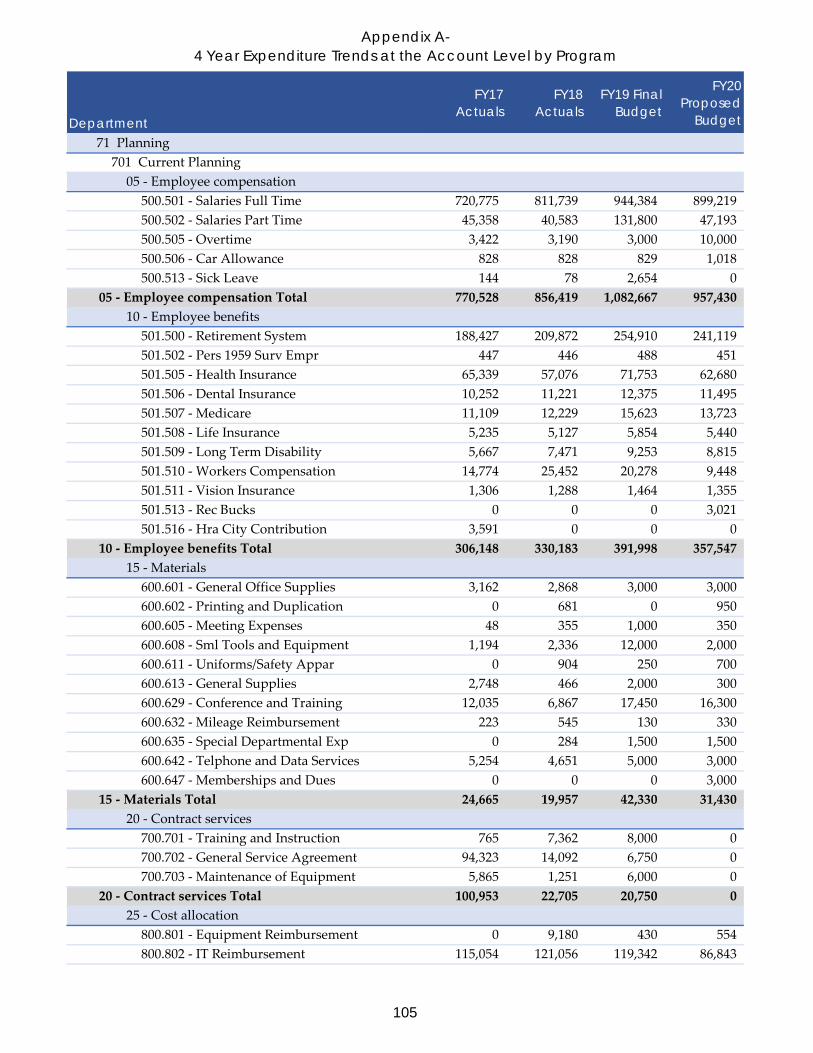
Appendix A-4 Year Expenditure Trends at the Account Level by Program
Department
FY17 Actuals
FY18 Actuals
FY19 Final Budget
FY20 Proposed
Budget71 Planning
701 Current Planning05 - Employee compensation
500.501 - Salaries Full Time 720,775 811,739 944,384 899,219500.502 - Salaries Part Time 45,358 40,583 131,800 47,193500.505 - Overtime 3,422 3,190 3,000 10,000500.506 - Car Allowance 828 828 829 1,018500.513 - Sick Leave 144 78 2,654 0
05 - Employee compensation Total 770,528 856,419 1,082,667 957,43010 - Employee benefits
501.500 - Retirement System 188,427 209,872 254,910 241,119501.502 - Pers 1959 Surv Empr 447 446 488 451501.505 - Health Insurance 65,339 57,076 71,753 62,680501.506 - Dental Insurance 10,252 11,221 12,375 11,495501.507 - Medicare 11,109 12,229 15,623 13,723501.508 - Life Insurance 5,235 5,127 5,854 5,440501.509 - Long Term Disability 5,667 7,471 9,253 8,815501.510 - Workers Compensation 14,774 25,452 20,278 9,448501.511 - Vision Insurance 1,306 1,288 1,464 1,355501.513 - Rec Bucks 0 0 0 3,021501.516 - Hra City Contribution 3,591 0 0 0
10 - Employee benefits Total 306,148 330,183 391,998 357,54715 - Materials
600.601 - General Office Supplies 3,162 2,868 3,000 3,000600.602 - Printing and Duplication 0 681 0 950600.605 - Meeting Expenses 48 355 1,000 350600.608 - Sml Tools and Equipment 1,194 2,336 12,000 2,000600.611 - Uniforms/Safety Appar 0 904 250 700600.613 - General Supplies 2,748 466 2,000 300600.629 - Conference and Training 12,035 6,867 17,450 16,300600.632 - Mileage Reimbursement 223 545 130 330600.635 - Special Departmental Exp 0 284 1,500 1,500600.642 - Telphone and Data Services 5,254 4,651 5,000 3,000600.647 - Memberships and Dues 0 0 0 3,000
15 - Materials Total 24,665 19,957 42,330 31,43020 - Contract services
700.701 - Training and Instruction 765 7,362 8,000 0700.702 - General Service Agreement 94,323 14,092 6,750 0700.703 - Maintenance of Equipment 5,865 1,251 6,000 0
20 - Contract services Total 100,953 22,705 20,750 025 - Cost allocation
800.801 - Equipment Reimbursement 0 9,180 430 554800.802 - IT Reimbursement 115,054 121,056 119,342 86,843
105

Appendix A-4 Year Expenditure Trends at the Account Level by Program
Department
FY17 Actuals
FY18 Actuals
FY19 Final Budget
FY20 Proposed
Budget800.805 - CC CAP Allocation 33,312 20,497 16,848 21,534800.806 - CM CAP Allocation 78,918 65,846 70,285 81,705800.809 - City Clerk CAP Alloc 46,489 46,840 31,715 36,635800.810 - City Attorney CAP Alloc 204,082 175,355 143,206 182,466800.814 - Finance CAP Alloc 24,556 28,222 43,670 59,064800.815 - Human resources CAP Alloc 78,039 79,364 88,927 98,410800.817 - Community Hall/Quinlan CAP 13,109 1,719 0 0800.820 - Grounds Maintenance CAP 4,774 0 0 0800.821 - Building Maintenance CAP 56,136 53,748 49,178 19,066
25 - Cost allocation Total 654,469 601,827 563,601 586,27731 - Special projects
750.007 - The Hamptons 41,151 209 0 0750.009 - Marina Plaza 56,707 4,966 0 0750.027 - De Anza Hotel 0 6,790 0 0750.028 - Cupertino Village Hotel 0 74,143 0 0750.029 - Vallco Town Center 0 192,586 0 0750.031 - Westport 0 504 0 0750.047 - Short-Term Rentals Outreach 0 0 0 8,500900.923 - Apple Campus 2 1,800 3,900 0 0900.930 - Main Street 1,690 0 0 0900.995 - Special Projects - CDD/I&T 3,269 (105) 0 0
31 - Special projects Total 104,618 282,993 0 8,50035 - Contingencies
719.705 - Contingencies 0 0 2,904 1,57235 - Contingencies Total 0 0 2,904 1,572
50 - Other financing uses701.701 - On-Call Contracts 92,338 20,144 150,000 90,000701.702 - Special Contracts 54,384 103,753 600,000 450,000
50 - Other financing uses Total 146,722 123,896 750,000 540,000701 Current Planning Total 2,108,101 2,237,979 2,854,250 2,482,756
106

Appendix A-4 Year Expenditure Trends at the Account Level by Program
Department
FY17 Actuals
FY18 Actuals
FY19 Final Budget
FY20 Proposed
Budget702 Mid Long Term Planning
05 - Employee compensation500.501 - Salaries Full Time 242,805 288,522 338,559 308,733500.505 - Overtime 875 681 1,000 0500.506 - Car Allowance 720 720 720 873
05 - Employee compensation Total 244,400 289,923 340,279 309,60610 - Employee benefits
501.500 - Retirement System 62,681 73,895 91,016 82,573501.502 - Pers 1959 Surv Empr 125 132 150 132501.505 - Health Insurance 19,659 17,537 22,153 17,228501.506 - Dental Insurance 3,112 3,431 3,810 3,363501.507 - Medicare 3,520 4,151 4,924 4,477501.508 - Life Insurance 1,635 1,560 1,802 1,590501.509 - Long Term Disability 1,752 2,448 3,054 2,752501.510 - Workers Compensation 2,202 7,824 6,228 2,876501.511 - Vision Insurance 395 394 450 395501.513 - Rec Bucks 0 0 0 886501.516 - Hra City Contribution 1,097 0 0 0
10 - Employee benefits Total 96,177 111,372 133,587 116,27215 - Materials
600.601 - General Office Supplies 495 0 250 0600.605 - Meeting Expenses 0 73 0 100600.608 - Sml Tools and Equipment 494 737 1,000 0600.613 - General Supplies 263 129 400 200600.629 - Conference and Training 2,228 2,308 2,000 2,300600.632 - Mileage Reimbursement 120 166 100 150600.642 - Telphone and Data Services 758 1,247 1,460 650600.647 - Memberships and Dues 0 0 0 700
15 - Materials Total 4,359 4,659 5,210 4,10020 - Contract services
700.701 - Training and Instruction 180 894 1,000 0700.702 - General Service Agreement 139,339 1,500 350 0700.703 - Maintenance of Equipment 1,303 156 1,000 0
20 - Contract services Total 140,821 2,550 2,350 025 - Cost allocation
800.801 - Equipment Reimbursement 0 0 132 169800.802 - IT Reimbursement 53,239 30,596 42,746 31,106800.805 - CC CAP Allocation 15,253 9,059 4,909 10,115800.806 - CM CAP Allocation 74,061 62,497 65,355 77,863800.809 - City Clerk CAP Alloc 487 283 282 349800.814 - Finance CAP Alloc 16,347 17,937 17,386 24,207800.815 - Human resources CAP Alloc 16,369 14,301 13,896 21,467800.820 - Grounds Maintenance CAP 1,541 0 0 0
107

Appendix A-4 Year Expenditure Trends at the Account Level by Program
Department
FY17 Actuals
FY18 Actuals
FY19 Final Budget
FY20 Proposed
Budget800.821 - Building Maintenance CAP 17,308 16,594 12,968 5,285
25 - Cost allocation Total 194,605 151,267 157,674 170,56131 - Special projects
750.013 - Speaker Series 0 1,621 0 0750.014 - GPA Authorization Applications 16,698 21,560 100,000 0750.017 - Vallco Specific Plan 0 1,447,605 0 0750.032 - General Plan 0 434 0 1,000,000750.048 - Urban Village 0 0 0 250,000750.049 - MuniCode Updates 0 0 0 25,000750.055 - Dark Sky 0 0 0 5,000900.924 - GPA Project 69 17,655 0 0900.926 - Housing Element 0 8,080 0 0900.939 - Vallco 34,604 0 0 0900.940 - Oaks 1,164 0 0 0900.995 - Special Projects - CDD/I&T 10,454 0 0 0
31 - Special projects Total 62,988 1,496,955 100,000 1,280,00035 - Contingencies
719.705 - Contingencies 0 0 378 20535 - Contingencies Total 0 0 378 205
702 Mid Long Term Planning Total 743,350 2,056,726 739,478 1,880,744
108

Appendix A-4 Year Expenditure Trends at the Account Level by Program
Department
FY17 Actuals
FY18 Actuals
FY19 Final Budget
FY20 Proposed
Budget704 Annexations
25 - Cost allocation800.805 - CC CAP Allocation 546 0 2 0800.806 - CM CAP Allocation 164 0 1 0800.814 - Finance CAP Alloc 127 141 900 0
25 - Cost allocation Total 837 141 903 0704 Annexations Total 837 141 903 0
109

Appendix A-4 Year Expenditure Trends at the Account Level by Program
Department
FY17 Actuals
FY18 Actuals
FY19 Final Budget
FY20 Proposed
Budget705 Economic Development
05 - Employee compensation500.502 - Salaries Part Time 87,212 95,026 78,890 0500.505 - Overtime 359 0 500 0
05 - Employee compensation Total 87,571 95,026 79,390 010 - Employee benefits
501.500 - Retirement System 23,151 24,909 21,208 0501.502 - Pers 1959 Surv Empr 58 60 60 0501.505 - Health Insurance 60 0 0 0501.506 - Dental Insurance 7 0 0 0501.507 - Medicare 1,265 1,379 1,144 0501.508 - Life Insurance 4 0 0 0501.510 - Workers Compensation 2,135 3,132 2,491 0501.511 - Vision Insurance 1 0 0 0
10 - Employee benefits Total 26,680 29,480 24,903 015 - Materials
600.601 - General Office Supplies 151 45 250 0600.602 - Printing and Duplication 3,093 1,967 16,500 0600.605 - Meeting Expenses 527 721 2,500 0600.608 - Sml Tools and Equipment 3,781 3,997 8,720 0600.613 - General Supplies 17,840 1,660 400 0600.629 - Conference and Training 2,334 3,450 3,600 0600.632 - Mileage Reimbursement 67 100 200 0600.635 - Special Departmental Exp 5,188 4,637 8,400 0
15 - Materials Total 32,981 16,576 40,570 020 - Contract services
700.701 - Training and Instruction 0 25,390 6,000 0700.702 - General Service Agreement (441) 19,208 42,000 0700.703 - Maintenance of Equipment 844 296 1,000 0
20 - Contract services Total 403 44,893 49,000 025 - Cost allocation
800.801 - Equipment Reimbursement 0 0 53 0800.802 - IT Reimbursement 0 9,562 17,210 0800.805 - CC CAP Allocation 965 2,623 1,290 0800.806 - CM CAP Allocation 290 805 534 0800.814 - Finance CAP Alloc 1,090 2,653 6,535 0800.815 - Human resources CAP Alloc 0 5,845 4,166 0800.821 - Building Maintenance CAP 0 6,782 3,888 0
25 - Cost allocation Total 2,345 28,270 33,676 031 - Special projects
750.001 - Strategic Plan Implementation 0 75,083 0 031 - Special projects Total 0 75,083 0 0
35 - Contingencies
110

Appendix A-4 Year Expenditure Trends at the Account Level by Program
Department
FY17 Actuals
FY18 Actuals
FY19 Final Budget
FY20 Proposed
Budget719.705 - Contingencies 0 0 4,093 0
35 - Contingencies Total 0 0 4,093 0705 Economic Development Total 149,980 289,328 231,632 0
71 Planning Total 3,002,268 4,584,174 3,826,263 4,363,500
111

Appendix A-4 Year Expenditure Trends at the Account Level by Program
Department
FY17 Actuals
FY18 Actuals
FY19 Final Budget
FY20 Proposed
Budget72 Housing Services
707 CDBG General Admin05 - Employee compensation
500.501 - Salaries Full Time 42,151 37,917 43,007 45,75805 - Employee compensation Total 42,151 37,917 43,007 45,758
10 - Employee benefits501.500 - Retirement System 10,606 10,064 11,562 12,239501.502 - Pers 1959 Surv Empr 27 26 24 24501.505 - Health Insurance 7,759 8,461 8,247 8,532501.506 - Dental Insurance 674 657 600 605501.507 - Medicare 554 531 624 663501.508 - Life Insurance 348 307 284 287501.509 - Long Term Disability 374 433 456 484501.510 - Workers Compensation 914 1,656 996 455501.511 - Vision Insurance 81 77 71 71501.513 - Rec Bucks 0 0 0 159501.516 - Hra City Contribution 120 0 0 0
10 - Employee benefits Total 21,457 22,211 22,864 23,51920 - Contract services
700.703 - Maintenance of Equipment 283 0 0 020 - Contract services Total 283 0 0 0
707 CDBG General Admin Total 63,890 60,128 65,871 69,277
112

Appendix A-4 Year Expenditure Trends at the Account Level by Program
Department
FY17 Actuals
FY18 Actuals
FY19 Final Budget
FY20 Proposed
Budget709 CDBG Capital/Housing Projects
15 - Materials600.623 - Grant Expenditures 284,484 224,461 210,892 240,202
15 - Materials Total 284,484 224,461 210,892 240,202709 CDBG Capital/Housing Projects Total 284,484 224,461 210,892 240,202
113

Appendix A-4 Year Expenditure Trends at the Account Level by Program
Department
FY17 Actuals
FY18 Actuals
FY19 Final Budget
FY20 Proposed
Budget710 CDBG Public Service Grants
15 - Materials600.623 - Grant Expenditures 47,187 47,983 47,983 50,000
15 - Materials Total 47,187 47,983 47,983 50,000710 CDBG Public Service Grants Total 47,187 47,983 47,983 50,000
114

Appendix A-4 Year Expenditure Trends at the Account Level by Program
Department
FY17 Actuals
FY18 Actuals
FY19 Final Budget
FY20 Proposed
Budget711 BMR Affordable Housing Fund
05 - Employee compensation500.501 - Salaries Full Time 21,473 32,733 44,317 47,152500.505 - Overtime 0 0 500 0
05 - Employee compensation Total 21,473 32,733 44,817 47,15210 - Employee benefits
501.500 - Retirement System 5,403 8,599 11,914 12,611501.502 - Pers 1959 Surv Empr 13 22 25 25501.505 - Health Insurance 3,909 7,463 8,498 8,792501.506 - Dental Insurance 343 589 618 624501.507 - Medicare 282 454 643 684501.508 - Life Insurance 177 267 293 295501.509 - Long Term Disability 190 381 470 499501.510 - Workers Compensation 529 840 996 469501.511 - Vision Insurance 41 67 73 74501.513 - Rec Bucks 0 0 0 164501.516 - Hra City Contribution 61 0 0 0
10 - Employee benefits Total 10,950 18,681 23,530 24,23715 - Materials
600.601 - General Office Supplies 612 83 250 0600.605 - Meeting Expenses 0 0 0 500600.608 - Sml Tools and Equipment 0 0 2,000 500600.613 - General Supplies 3,532 102 1,250 0600.623 - Grant Expenditures 0 44,528 50,000 50,000600.629 - Conference and Training 2,184 450 3,500 3,000600.632 - Mileage Reimbursement 0 152 100 0600.635 - Special Departmental Exp 123,301 137,018 355,000 175,000600.642 - Telphone and Data Services 1,178 1,060 1,080 1,200600.647 - Memberships and Dues 0 0 0 1,950
15 - Materials Total 130,808 183,393 413,180 232,15020 - Contract services
700.701 - Training and Instruction 12 1,345 2,500 0700.702 - General Service Agreement 439,065 176,203 334,400 201,170700.703 - Maintenance of Equipment 0 78 0 0
20 - Contract services Total 439,077 177,626 336,900 201,17025 - Cost allocation
800.801 - Equipment Reimbursement 0 0 0 28800.802 - IT Reimbursement 0 2,582 0 0
25 - Cost allocation Total 0 2,582 0 2831 - Special projects
750.012 - Charities Housing 0 3,672,000 0 0750.016 - Greenwood Ct Renovation 0 122,265 0 0750.050 - Housing Strategies 0 0 0 20,000
115

Appendix A-4 Year Expenditure Trends at the Account Level by Program
Department
FY17 Actuals
FY18 Actuals
FY19 Final Budget
FY20 Proposed
Budget750.051 - Homelessness 0 0 0 10,000750.052 - Habitat for Humanity 0 0 0 150,000
31 - Special projects Total 0 3,794,265 0 180,000711 BMR Affordable Housing Fund Total 602,308 4,209,280 818,427 684,737
116

Appendix A-4 Year Expenditure Trends at the Account Level by Program
Department
FY17 Actuals
FY18 Actuals
FY19 Final Budget
FY20 Proposed
Budget712 Gen Fund Human Services Grants
15 - Materials600.623 - Grant Expenditures 0 40,000 100,000 100,000
15 - Materials Total 0 40,000 100,000 100,00020 - Contract services
700.702 - General Service Agreement 39,999 0 0 020 - Contract services Total 39,999 0 0 0
25 - Cost allocation800.805 - CC CAP Allocation 159 152 104 121800.806 - CM CAP Allocation 48 55 51 52800.809 - City Clerk CAP Alloc 487 283 282 349800.814 - Finance CAP Alloc 1,216 1,346 2,573 2,318
25 - Cost allocation Total 1,910 1,836 3,010 2,84035 - Contingencies
719.705 - Contingencies 0 0 0 5,00035 - Contingencies Total 0 0 0 5,000
712 Gen Fund Human Services Grants Total 41,909 41,836 103,010 107,84072 Housing Services Total 1,039,777 4,583,688 1,246,183 1,152,056
117

Appendix A-4 Year Expenditure Trends at the Account Level by Program
Department
FY17 Actuals
FY18 Actuals
FY19 Final Budget
FY20 Proposed
Budget73 Building
713 General Building05 - Employee compensation
500.501 - Salaries Full Time 290,754 307,015 325,112 326,842500.502 - Salaries Part Time 38,018 24,471 66,434 32,507500.505 - Overtime 59 8 100 0500.506 - Car Allowance 360 360 360 436500.513 - Sick Leave 522 993 2,214 0
05 - Employee compensation Total 329,712 332,847 394,220 359,78510 - Employee benefits
501.500 - Retirement System 75,968 78,260 88,273 87,481501.502 - Pers 1959 Surv Empr 160 161 174 175501.505 - Health Insurance 31,390 35,458 44,809 45,260501.506 - Dental Insurance 3,972 4,070 4,418 4,484501.507 - Medicare 4,247 4,605 5,687 5,210501.508 - Life Insurance 1,870 1,717 2,062 1,844501.509 - Long Term Disability 2,113 2,590 2,983 2,992501.510 - Workers Compensation 10,780 9,072 7,224 3,373501.511 - Vision Insurance 504 467 522 529501.513 - Rec Bucks 0 0 0 1,180501.516 - Hra City Contribution 1,361 0 0 0
10 - Employee benefits Total 132,365 136,400 156,152 152,52815 - Materials
600.601 - General Office Supplies 2,819 1,983 1,000 3,500600.605 - Meeting Expenses 0 1,258 500 1,300600.606 - Software 0 1,068 0 0600.608 - Sml Tools and Equipment 1,683 3,922 8,000 1,000600.611 - Uniforms/Safety Appar 0 88 1,000 0600.613 - General Supplies 750 943 500 1,000600.629 - Conference and Training 8,185 2,904 5,700 7,390600.632 - Mileage Reimbursement 87 0 200 200600.635 - Special Departmental Exp 1,043 1,551 1,500 1,500600.642 - Telphone and Data Services 6,174 5,134 5,500 2,800600.647 - Memberships and Dues 0 0 0 550
15 - Materials Total 20,740 18,852 23,900 19,24020 - Contract services
700.701 - Training and Instruction 1,769 2,235 2,500 0700.702 - General Service Agreement 421 594 350 0700.703 - Maintenance of Equipment 5,010 821 5,000 0
20 - Contract services Total 7,200 3,650 7,850 025 - Cost allocation
800.801 - Equipment Reimbursement 0 23,250 1,618 2,071800.802 - IT Reimbursement 39,875 58,326 113,612 82,674
118

Appendix A-4 Year Expenditure Trends at the Account Level by Program
Department
FY17 Actuals
FY18 Actuals
FY19 Final Budget
FY20 Proposed
Budget800.805 - CC CAP Allocation 9,136 8,983 6,765 8,073800.806 - CM CAP Allocation 19,832 17,611 18,596 21,369800.809 - City Clerk CAP Alloc 487 283 282 349800.810 - City Attorney CAP Alloc 43,732 37,576 30,687 39,100800.814 - Finance CAP Alloc 12,846 15,882 24,860 32,629800.815 - Human resources CAP Alloc 45,450 49,137 52,891 64,975800.820 - Grounds Maintenance CAP 1,780 0 0 0800.821 - Building Maintenance CAP 20,000 25,064 21,184 7,506
25 - Cost allocation Total 193,138 236,112 270,495 258,74631 - Special projects
900.936 - 3-YR Scanning Project 27,020 13,053 0 031 - Special projects Total 27,020 13,053 0 0
35 - Contingencies719.705 - Contingencies 0 0 1,588 962
35 - Contingencies Total 0 0 1,588 962713 General Building Total 710,175 740,914 854,205 791,261
119

Appendix A-4 Year Expenditure Trends at the Account Level by Program
Department
FY17 Actuals
FY18 Actuals
FY19 Final Budget
FY20 Proposed
Budget714 Construction Plan Check
05 - Employee compensation500.501 - Salaries Full Time 538,858 596,300 641,102 658,969500.505 - Overtime 48 32 100 0
05 - Employee compensation Total 538,905 596,332 641,202 658,96910 - Employee benefits
501.500 - Retirement System 140,513 153,558 172,356 176,249501.502 - Pers 1959 Surv Empr 299 331 356 356501.505 - Health Insurance 47,777 71,684 83,707 86,135501.506 - Dental Insurance 7,346 8,554 8,983 9,065501.507 - Medicare 7,806 8,494 9,300 9,555501.508 - Life Insurance 3,803 3,797 4,136 3,947501.509 - Long Term Disability 4,260 5,804 6,549 6,602501.510 - Workers Compensation 3,530 18,468 14,698 6,814501.511 - Vision Insurance 938 981 1,062 1,068501.513 - Rec Bucks 0 0 0 2,383501.516 - Hra City Contribution 2,656 0 0 0
10 - Employee benefits Total 218,927 271,670 301,147 302,17415 - Materials
600.601 - General Office Supplies 3,936 1,202 1,500 0600.602 - Printing and Duplication 0 0 0 550600.608 - Sml Tools and Equipment 2,094 3,335 6,000 2,800600.613 - General Supplies 265 207 1,000 1,200600.632 - Mileage Reimbursement 0 0 200 300600.642 - Telphone and Data Services 1,039 1,693 1,900 1,100600.647 - Memberships and Dues 0 0 0 915
15 - Materials Total 7,333 6,437 10,600 6,86520 - Contract services
700.701 - Training and Instruction 7,584 6,369 6,500 0700.702 - General Service Agreement 88,799 159 1,400 0700.703 - Maintenance of Equipment 1,295 274 1,500 0
20 - Contract services Total 97,678 6,802 9,400 025 - Cost allocation
800.801 - Equipment Reimbursement 0 0 312 399800.802 - IT Reimbursement 82,516 64,544 113,661 82,710800.805 - CC CAP Allocation 27,046 16,874 12,973 15,546800.806 - CM CAP Allocation 24,866 20,245 21,354 24,111800.809 - City Clerk CAP Alloc 487 283 282 349800.814 - Finance CAP Alloc 16,751 18,913 27,435 37,884800.815 - Human resources CAP Alloc 37,103 30,646 34,771 79,195800.820 - Grounds Maintenance CAP 3,492 0 0 0800.821 - Building Maintenance CAP 39,231 35,560 32,449 13,491
25 - Cost allocation Total 231,492 187,065 243,237 253,685
120
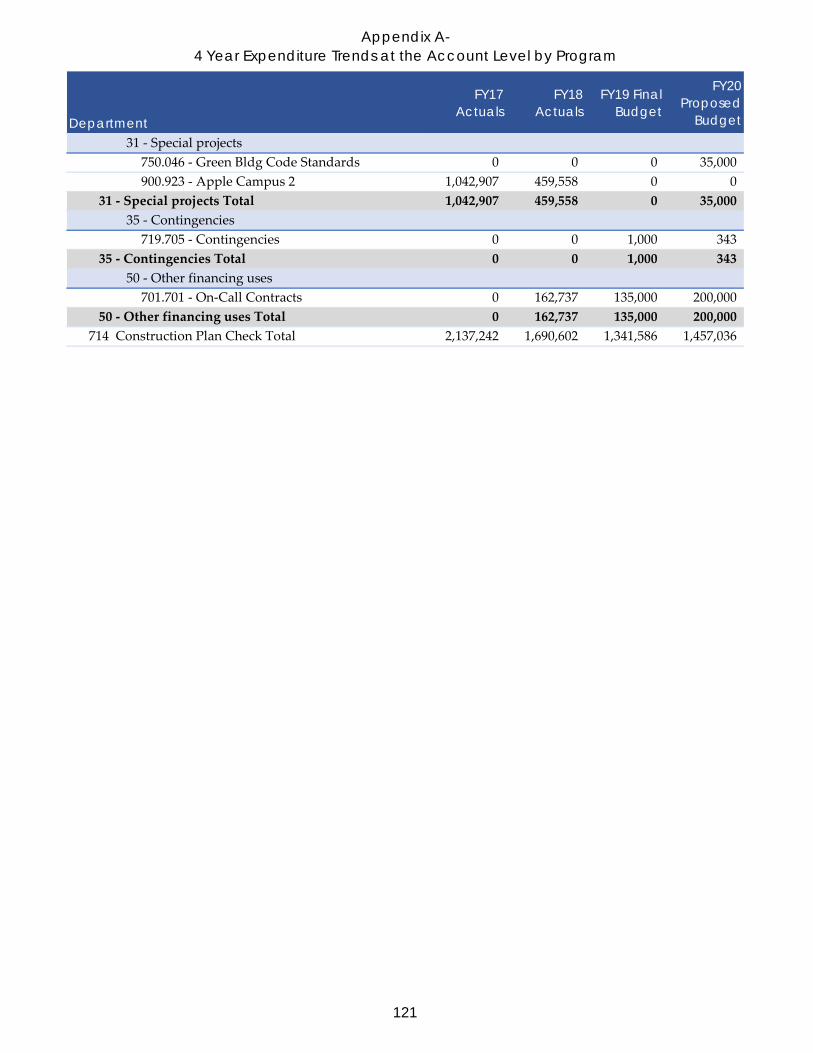
Appendix A-4 Year Expenditure Trends at the Account Level by Program
Department
FY17 Actuals
FY18 Actuals
FY19 Final Budget
FY20 Proposed
Budget31 - Special projects
750.046 - Green Bldg Code Standards 0 0 0 35,000900.923 - Apple Campus 2 1,042,907 459,558 0 0
31 - Special projects Total 1,042,907 459,558 0 35,00035 - Contingencies
719.705 - Contingencies 0 0 1,000 34335 - Contingencies Total 0 0 1,000 343
50 - Other financing uses701.701 - On-Call Contracts 0 162,737 135,000 200,000
50 - Other financing uses Total 0 162,737 135,000 200,000714 Construction Plan Check Total 2,137,242 1,690,602 1,341,586 1,457,036
121

Appendix A-4 Year Expenditure Trends at the Account Level by Program
Department
FY17 Actuals
FY18 Actuals
FY19 Final Budget
FY20 Proposed
Budget715 Building Inspection
05 - Employee compensation500.501 - Salaries Full Time 562,547 564,119 524,550 577,979500.502 - Salaries Part Time 11,969 15,185 57,637 0500.505 - Overtime 1,292 3,436 5,000 5,000
05 - Employee compensation Total 575,808 582,740 587,187 582,97910 - Employee benefits
501.500 - Retirement System 149,155 144,555 141,017 154,587501.502 - Pers 1959 Surv Empr 321 307 280 310501.505 - Health Insurance 55,230 56,162 54,279 77,852501.506 - Dental Insurance 7,889 7,866 7,072 7,913501.507 - Medicare 7,938 8,157 8,447 8,382501.508 - Life Insurance 4,094 3,531 3,376 3,634501.509 - Long Term Disability 4,522 5,425 5,431 6,008501.510 - Workers Compensation 15,097 15,648 12,855 5,948501.511 - Vision Insurance 1,015 904 835 930501.513 - Rec Bucks 0 0 0 2,082501.516 - Hra City Contribution 3,028 0 0 0
10 - Employee benefits Total 248,290 242,557 233,592 267,64615 - Materials
600.601 - General Office Supplies 647 479 1,500 0600.602 - Printing and Duplication 0 0 2,000 1,450600.606 - Software 0 0 0 3,600600.608 - Sml Tools and Equipment 874 1,211 6,000 1,000600.611 - Uniforms/Safety Appar 0 2,786 2,000 3,000600.613 - General Supplies 0 1,014 1,000 1,000600.629 - Conference and Training 89 0 2,500 10,300600.632 - Mileage Reimbursement 0 0 200 200600.642 - Telphone and Data Services 7,813 10,286 9,500 7,200600.647 - Memberships and Dues 0 0 0 500
15 - Materials Total 9,423 15,776 24,700 28,25020 - Contract services
700.701 - Training and Instruction 3,574 3,434 4,000 0700.702 - General Service Agreement 7,358 308 1,400 0700.703 - Maintenance of Equipment 3,852 821 4,000 0700.707 - Bank Charges 66,143 48,163 0 0
20 - Contract services Total 80,926 52,726 9,400 025 - Cost allocation
800.801 - Equipment Reimbursement 0 38,140 7,598 9,720800.802 - IT Reimbursement 117,224 101,837 129,356 94,132800.805 - CC CAP Allocation 21,919 30,841 22,455 20,514800.806 - CM CAP Allocation 5,809 10,239 10,097 7,839800.809 - City Clerk CAP Alloc 487 283 282 349
122

Appendix A-4 Year Expenditure Trends at the Account Level by Program
Department
FY17 Actuals
FY18 Actuals
FY19 Final Budget
FY20 Proposed
Budget800.814 - Finance CAP Alloc 29,563 34,135 32,895 45,341800.815 - Human resources CAP Alloc 40,740 37,678 38,575 79,653800.820 - Grounds Maintenance CAP 3,835 0 0 0800.821 - Building Maintenance CAP 43,078 43,719 35,998 12,260
25 - Cost allocation Total 262,655 296,872 277,256 269,80831 - Special projects
900.923 - Apple Campus 2 4,435,753 2,537,214 0 031 - Special projects Total 4,435,753 2,537,214 0 0
35 - Contingencies719.705 - Contingencies 0 0 1,705 1,413
35 - Contingencies Total 0 0 1,705 1,41350 - Other financing uses
701.701 - On-Call Contracts 0 21,117 25,000 25,00050 - Other financing uses Total 0 21,117 25,000 25,000
715 Building Inspection Total 5,612,855 3,749,002 1,158,840 1,175,096
123
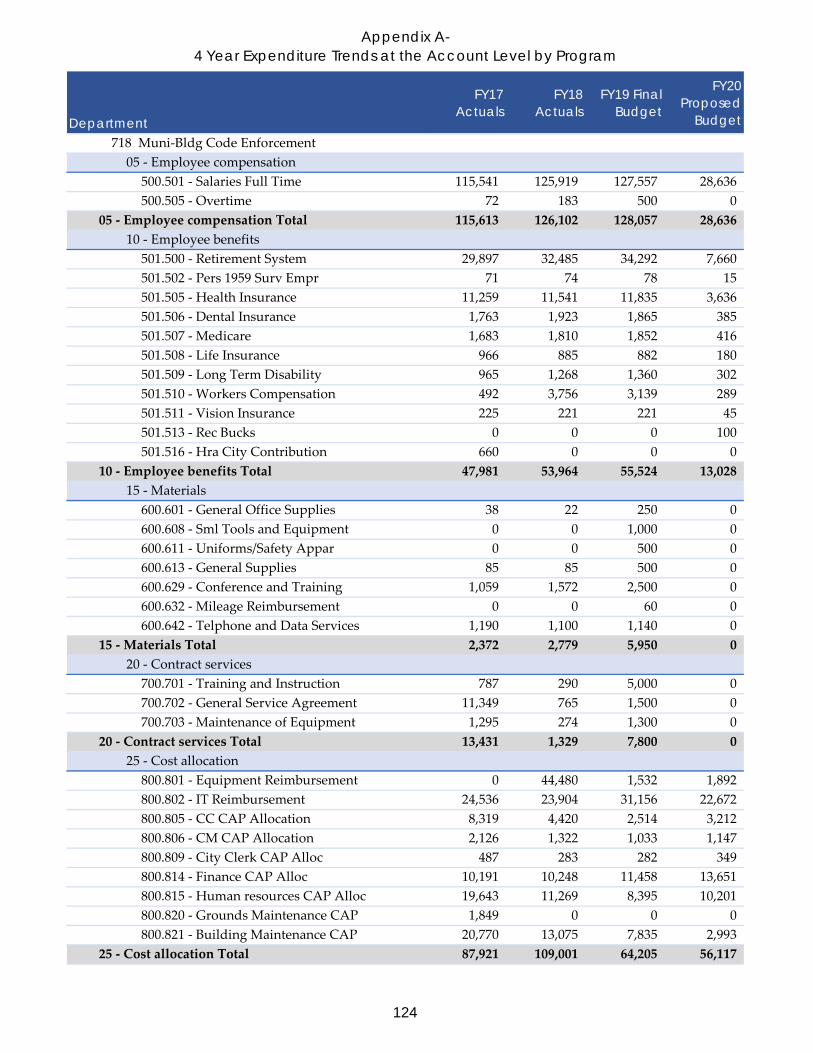
Appendix A-4 Year Expenditure Trends at the Account Level by Program
Department
FY17 Actuals
FY18 Actuals
FY19 Final Budget
FY20 Proposed
Budget718 Muni-Bldg Code Enforcement
05 - Employee compensation500.501 - Salaries Full Time 115,541 125,919 127,557 28,636500.505 - Overtime 72 183 500 0
05 - Employee compensation Total 115,613 126,102 128,057 28,63610 - Employee benefits
501.500 - Retirement System 29,897 32,485 34,292 7,660501.502 - Pers 1959 Surv Empr 71 74 78 15501.505 - Health Insurance 11,259 11,541 11,835 3,636501.506 - Dental Insurance 1,763 1,923 1,865 385501.507 - Medicare 1,683 1,810 1,852 416501.508 - Life Insurance 966 885 882 180501.509 - Long Term Disability 965 1,268 1,360 302501.510 - Workers Compensation 492 3,756 3,139 289501.511 - Vision Insurance 225 221 221 45501.513 - Rec Bucks 0 0 0 100501.516 - Hra City Contribution 660 0 0 0
10 - Employee benefits Total 47,981 53,964 55,524 13,02815 - Materials
600.601 - General Office Supplies 38 22 250 0600.608 - Sml Tools and Equipment 0 0 1,000 0600.611 - Uniforms/Safety Appar 0 0 500 0600.613 - General Supplies 85 85 500 0600.629 - Conference and Training 1,059 1,572 2,500 0600.632 - Mileage Reimbursement 0 0 60 0600.642 - Telphone and Data Services 1,190 1,100 1,140 0
15 - Materials Total 2,372 2,779 5,950 020 - Contract services
700.701 - Training and Instruction 787 290 5,000 0700.702 - General Service Agreement 11,349 765 1,500 0700.703 - Maintenance of Equipment 1,295 274 1,300 0
20 - Contract services Total 13,431 1,329 7,800 025 - Cost allocation
800.801 - Equipment Reimbursement 0 44,480 1,532 1,892800.802 - IT Reimbursement 24,536 23,904 31,156 22,672800.805 - CC CAP Allocation 8,319 4,420 2,514 3,212800.806 - CM CAP Allocation 2,126 1,322 1,033 1,147800.809 - City Clerk CAP Alloc 487 283 282 349800.814 - Finance CAP Alloc 10,191 10,248 11,458 13,651800.815 - Human resources CAP Alloc 19,643 11,269 8,395 10,201800.820 - Grounds Maintenance CAP 1,849 0 0 0800.821 - Building Maintenance CAP 20,770 13,075 7,835 2,993
25 - Cost allocation Total 87,921 109,001 64,205 56,117
124

Appendix A-4 Year Expenditure Trends at the Account Level by Program
Department
FY17 Actuals
FY18 Actuals
FY19 Final Budget
FY20 Proposed
Budget35 - Contingencies
719.705 - Contingencies 0 0 688 035 - Contingencies Total 0 0 688 0
718 Muni-Bldg Code Enforcement Total 267,318 293,174 262,224 97,78173 Building Total 8,727,590 6,473,692 3,616,855 3,521,174
125

Appendix A-4 Year Expenditure Trends at the Account Level by Program
Department
FY17 Actuals
FY18 Actuals
FY19 Final Budget
FY20 Proposed
Budget74 Code Enforcement
202 Code Enforcement05 - Employee compensation
500.501 - Salaries Full Time 0 0 0 308,505500.502 - Salaries Part Time 0 0 0 44,128500.505 - Overtime 0 0 0 5,000
05 - Employee compensation Total 0 0 0 357,63310 - Employee benefits
501.500 - Retirement System 0 0 0 83,086501.502 - Pers 1959 Surv Empr 0 0 0 183501.505 - Health Insurance 0 0 0 41,251501.506 - Dental Insurance 0 0 0 4,611501.507 - Medicare 0 0 0 5,113501.508 - Life Insurance 0 0 0 2,181501.509 - Long Term Disability 0 0 0 3,279501.510 - Workers Compensation 0 0 0 3,465501.511 - Vision Insurance 0 0 0 543501.513 - Rec Bucks 0 0 0 1,212
10 - Employee benefits Total 0 0 0 144,92415 - Materials
600.601 - General Office Supplies 0 0 0 1,500600.602 - Printing and Duplication 0 0 0 400600.608 - Sml Tools and Equipment 0 0 0 750600.611 - Uniforms/Safety Appar 0 0 0 2,000600.613 - General Supplies 0 0 0 150600.629 - Conference and Training 0 0 0 4,700600.632 - Mileage Reimbursement 0 0 0 200600.642 - Telphone and Data Services 0 0 0 7,500600.647 - Memberships and Dues 0 0 0 400
15 - Materials Total 0 0 0 17,60020 - Contract services
700.702 - General Service Agreement 0 0 0 262,00020 - Contract services Total 0 0 0 262,000
25 - Cost allocation800.801 - Equipment Reimbursement 0 0 0 5,623800.802 - IT Reimbursement 0 0 0 18,534800.805 - CC CAP Allocation 0 0 0 6,483800.806 - CM CAP Allocation 0 0 0 2,341800.809 - City Clerk CAP Alloc 0 0 0 2,790800.810 - City Attorney CAP Alloc 0 0 0 26,067800.814 - Finance CAP Alloc 0 0 0 21,488800.815 - Human resources CAP Alloc 0 0 0 16,473800.821 - Building Maintenance CAP 0 0 0 5,696
126
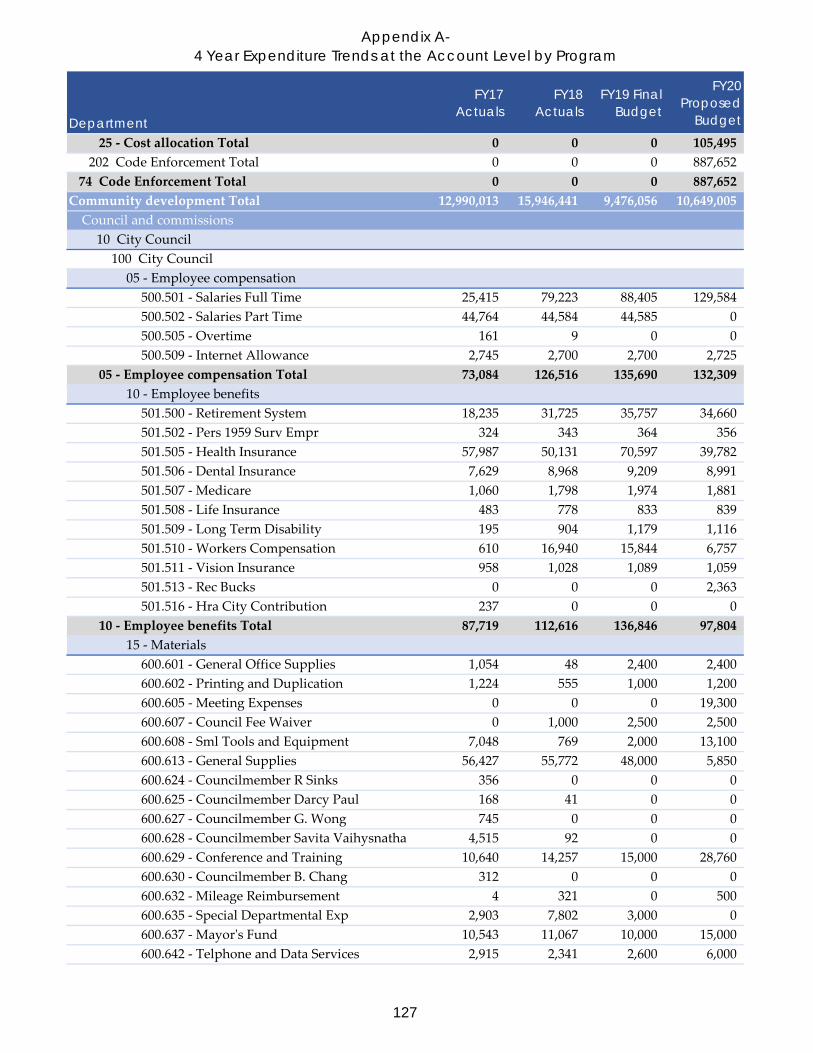
Appendix A-4 Year Expenditure Trends at the Account Level by Program
Department
FY17 Actuals
FY18 Actuals
FY19 Final Budget
FY20 Proposed
Budget25 - Cost allocation Total 0 0 0 105,495
202 Code Enforcement Total 0 0 0 887,65274 Code Enforcement Total 0 0 0 887,652
Community development Total 12,990,013 15,946,441 9,476,056 10,649,005Council and commissions
10 City Council100 City Council
05 - Employee compensation500.501 - Salaries Full Time 25,415 79,223 88,405 129,584500.502 - Salaries Part Time 44,764 44,584 44,585 0500.505 - Overtime 161 9 0 0500.509 - Internet Allowance 2,745 2,700 2,700 2,725
05 - Employee compensation Total 73,084 126,516 135,690 132,30910 - Employee benefits
501.500 - Retirement System 18,235 31,725 35,757 34,660501.502 - Pers 1959 Surv Empr 324 343 364 356501.505 - Health Insurance 57,987 50,131 70,597 39,782501.506 - Dental Insurance 7,629 8,968 9,209 8,991501.507 - Medicare 1,060 1,798 1,974 1,881501.508 - Life Insurance 483 778 833 839501.509 - Long Term Disability 195 904 1,179 1,116501.510 - Workers Compensation 610 16,940 15,844 6,757501.511 - Vision Insurance 958 1,028 1,089 1,059501.513 - Rec Bucks 0 0 0 2,363501.516 - Hra City Contribution 237 0 0 0
10 - Employee benefits Total 87,719 112,616 136,846 97,80415 - Materials
600.601 - General Office Supplies 1,054 48 2,400 2,400600.602 - Printing and Duplication 1,224 555 1,000 1,200600.605 - Meeting Expenses 0 0 0 19,300600.607 - Council Fee Waiver 0 1,000 2,500 2,500600.608 - Sml Tools and Equipment 7,048 769 2,000 13,100600.613 - General Supplies 56,427 55,772 48,000 5,850600.624 - Councilmember R Sinks 356 0 0 0600.625 - Councilmember Darcy Paul 168 41 0 0600.627 - Councilmember G. Wong 745 0 0 0600.628 - Councilmember Savita Vaihysnatha 4,515 92 0 0600.629 - Conference and Training 10,640 14,257 15,000 28,760600.630 - Councilmember B. Chang 312 0 0 0600.632 - Mileage Reimbursement 4 321 0 500600.635 - Special Departmental Exp 2,903 7,802 3,000 0600.637 - Mayor's Fund 10,543 11,067 10,000 15,000600.642 - Telphone and Data Services 2,915 2,341 2,600 6,000
127

Appendix A-4 Year Expenditure Trends at the Account Level by Program
Department
FY17 Actuals
FY18 Actuals
FY19 Final Budget
FY20 Proposed
Budget600.647 - Memberships and Dues 0 0 0 45,700
15 - Materials Total 98,854 94,066 86,500 140,31020 - Contract services
700.702 - General Service Agreement 6,117 100 0 6,250700.703 - Maintenance of Equipment 373 127 387 0
20 - Contract services Total 6,490 227 387 6,25025 - Cost allocation
800.801 - Equipment Reimbursement 0 0 326 396800.802 - IT Reimbursement 6,309 94,665 53,819 39,164800.805 - CC CAP Allocation 1,217 0 0 0800.806 - CM CAP Allocation 156,069 0 0 0800.809 - City Clerk CAP Alloc 12,464 0 0 0800.810 - City Attorney CAP Alloc 272,105 0 0 0800.814 - Finance CAP Alloc 9,237 0 0 0800.815 - Human resources CAP Alloc 2,614 0 0 0800.817 - Community Hall/Quinlan CAP 25,087 0 0 0800.820 - Grounds Maintenance CAP 2,059 0 0 0800.821 - Building Maintenance CAP 33,757 0 0 0
25 - Cost allocation Total 520,918 94,665 54,145 39,56035 - Contingencies
719.705 - Contingencies 0 0 4,344 7,07835 - Contingencies Total 0 0 4,344 7,078
100 City Council Total 787,065 428,090 417,912 423,311
128

Appendix A-4 Year Expenditure Trends at the Account Level by Program
Department
FY17 Actuals
FY18 Actuals
FY19 Final Budget
FY20 Proposed
Budget101 Community Funding
20 - Contract services700.702 - General Service Agreement 40,750 52,400 52,400 89,800
20 - Contract services Total 40,750 52,400 52,400 89,80025 - Cost allocation
800.805 - CC CAP Allocation 278 267 102 152800.806 - CM CAP Allocation 83 97 50 65800.814 - Finance CAP Alloc 42 47 879 570
25 - Cost allocation Total 403 411 1,031 787101 Community Funding Total 41,153 52,811 53,431 90,587
129

Appendix A-4 Year Expenditure Trends at the Account Level by Program
Department
FY17 Actuals
FY18 Actuals
FY19 Final Budget
FY20 Proposed
Budget110 Sister Cities
05 - Employee compensation500.501 - Salaries Full Time 3,540 8,727 13,702 32,741
05 - Employee compensation Total 3,540 8,727 13,702 32,74110 - Employee benefits
501.500 - Retirement System 934 2,208 3,680 8,757501.502 - Pers 1959 Surv Empr 3 4 6 24501.505 - Health Insurance 433 678 947 3,920501.506 - Dental Insurance 71 118 152 615501.507 - Medicare 50 122 199 474501.508 - Life Insurance 31 50 72 204501.509 - Long Term Disability 31 84 133 333501.510 - Workers Compensation 0 312 249 462501.511 - Vision Insurance 9 13 18 72501.513 - Rec Bucks 0 0 0 161501.516 - Hra City Contribution 26 0 0 0
10 - Employee benefits Total 1,588 3,591 5,456 15,02215 - Materials
600.613 - General Supplies 961 397 4,100 5,605600.632 - Mileage Reimbursement 1 0 0 0
15 - Materials Total 962 397 4,100 5,60520 - Contract services
700.702 - General Service Agreement 9,320 11,573 25,000 20,00020 - Contract services Total 9,320 11,573 25,000 20,000
25 - Cost allocation800.801 - Equipment Reimbursement 0 0 5 27800.802 - IT Reimbursement 701 1,912 1,625 1,183800.805 - CC CAP Allocation 98 62 44 226800.806 - CM CAP Allocation 29 23 22 84800.814 - Finance CAP Alloc 849 939 7,398 9,220800.815 - Human resources CAP Alloc 0 0 0 489800.817 - Community Hall/Quinlan CAP 393 0 0 0800.820 - Grounds Maintenance CAP 15 0 0 0800.821 - Building Maintenance CAP 257 0 0 169
25 - Cost allocation Total 2,342 2,936 9,094 11,39831 - Special projects
900.945 - Fixed Asset Acquisition 0 4,857 0 031 - Special projects Total 0 4,857 0 0
35 - Contingencies719.705 - Contingencies 0 0 0 1,280
35 - Contingencies Total 0 0 0 1,280110 Sister Cities Total 17,753 32,080 57,352 86,046
10 City Council Total 845,971 512,981 528,695 599,944
130

Appendix A-4 Year Expenditure Trends at the Account Level by Program
Department
FY17 Actuals
FY18 Actuals
FY19 Final Budget
FY20 Proposed
Budget11 Commissions
131 Telecommunication Commission05 - Employee compensation
500.501 - Salaries Full Time 3,230 0 0 3,97205 - Employee compensation Total 3,230 0 0 3,972
10 - Employee benefits501.500 - Retirement System 944 0 0 1,062501.502 - Pers 1959 Surv Empr 2 0 0 3501.505 - Health Insurance 282 0 0 490501.506 - Dental Insurance 26 0 0 77501.507 - Medicare 50 0 0 58501.508 - Life Insurance 21 0 0 29501.509 - Long Term Disability 18 0 0 43501.510 - Workers Compensation 118 0 0 58501.511 - Vision Insurance 5 0 0 9501.513 - Rec Bucks 0 0 0 20501.516 - Hra City Contribution 53 0 0 0
10 - Employee benefits Total 1,518 0 0 1,84915 - Materials
600.601 - General Office Supplies 88 13 450 0600.605 - Meeting Expenses 0 0 300 0
15 - Materials Total 88 13 750 020 - Contract services
700.702 - General Service Agreement 10,000 0 0 020 - Contract services Total 10,000 0 0 0
25 - Cost allocation800.802 - IT Reimbursement 1,402 0 0 0800.805 - CC CAP Allocation 358 260 104 24800.806 - CM CAP Allocation 94 79 46 10800.814 - Finance CAP Alloc 4,905 5,431 5,325 1,173800.815 - Human resources CAP Alloc 728 613 195 0800.817 - Community Hall/Quinlan CAP 1,214 1,065 0 0800.820 - Grounds Maintenance CAP 68 0 0 0800.821 - Building Maintenance CAP 769 711 182 0
25 - Cost allocation Total 9,538 8,159 5,852 1,20735 - Contingencies
719.705 - Contingencies 0 0 38 035 - Contingencies Total 0 0 38 0
131 Telecommunication Commission Total 24,374 8,172 6,640 7,028
131

Appendix A-4 Year Expenditure Trends at the Account Level by Program
Department
FY17 Actuals
FY18 Actuals
FY19 Final Budget
FY20 Proposed
Budget140 Library Commission
05 - Employee compensation500.501 - Salaries Full Time 7,152 7,756 8,024 6,597500.506 - Car Allowance 120 120 121 109
05 - Employee compensation Total 7,272 7,876 8,145 6,70610 - Employee benefits
501.500 - Retirement System 1,881 1,931 2,156 1,764501.502 - Pers 1959 Surv Empr 3 3 4 2501.505 - Health Insurance 833 993 1,047 650501.506 - Dental Insurance 71 78 77 46501.507 - Medicare 102 111 119 96501.508 - Life Insurance 38 36 36 22501.509 - Long Term Disability 47 61 68 40501.510 - Workers Compensation 79 156 149 35501.511 - Vision Insurance 9 9 9 5501.513 - Rec Bucks 0 0 0 12501.516 - Hra City Contribution 25 0 0 0
10 - Employee benefits Total 3,087 3,377 3,665 2,67215 - Materials
600.601 - General Office Supplies 88 200 200 0600.613 - General Supplies 127 1,060 300 370600.629 - Conference and Training 0 0 200 0
15 - Materials Total 215 1,260 700 37020 - Contract services
700.702 - General Service Agreement 211 525 4,700 2,00020 - Contract services Total 211 525 4,700 2,000
25 - Cost allocation800.801 - Equipment Reimbursement 0 0 3 3800.802 - IT Reimbursement 0 956 759 553800.805 - CC CAP Allocation 174 51 122 154800.806 - CM CAP Allocation 45 16 52 57800.814 - Finance CAP Alloc 5,009 5,497 8,315 10,242800.815 - Human resources CAP Alloc 364 119 320 349800.817 - Community Hall/Quinlan CAP 2,458 476 0 0800.820 - Grounds Maintenance CAP 107 0 0 0800.821 - Building Maintenance CAP 1,637 138 299 121
25 - Cost allocation Total 9,794 7,253 9,870 11,47935 - Contingencies
719.705 - Contingencies 0 0 270 11935 - Contingencies Total 0 0 270 119
140 Library Commission Total 20,579 20,291 27,350 23,346
132

Appendix A-4 Year Expenditure Trends at the Account Level by Program
Department
FY17 Actuals
FY18 Actuals
FY19 Final Budget
FY20 Proposed
Budget142 Fine Arts Commission
05 - Employee compensation500.501 - Salaries Full Time 15,284 16,245 16,756 17,247500.505 - Overtime 78 223 150 0
05 - Employee compensation Total 15,362 16,469 16,906 17,24710 - Employee benefits
501.500 - Retirement System 3,968 4,202 4,506 4,613501.502 - Pers 1959 Surv Empr 9 9 10 9501.505 - Health Insurance 1,465 1,302 1,374 1,470501.506 - Dental Insurance 215 233 230 231501.507 - Medicare 217 230 243 251501.508 - Life Insurance 110 106 108 109501.509 - Long Term Disability 123 162 178 182501.510 - Workers Compensation 118 468 399 173501.511 - Vision Insurance 27 27 27 27501.513 - Rec Bucks 0 0 0 60501.516 - Hra City Contribution 83 0 0 0
10 - Employee benefits Total 6,334 6,739 7,075 7,12515 - Materials
600.601 - General Office Supplies 160 63 300 0600.602 - Printing and Duplication 75 0 1,000 1,000600.605 - Meeting Expenses 0 0 1,750 0600.613 - General Supplies 75 96 1,100 2,000600.623 - Grant Expenditures 1,300 1,950 3,050 4,050600.629 - Conference and Training 710 0 0 75
15 - Materials Total 2,320 2,109 7,200 7,12520 - Contract services
700.702 - General Service Agreement 327 770 950 10,00020 - Contract services Total 327 770 950 10,000
25 - Cost allocation800.801 - Equipment Reimbursement 0 0 8 11800.802 - IT Reimbursement 3,505 1,434 759 553800.805 - CC CAP Allocation 504 415 335 395800.806 - CM CAP Allocation 131 124 141 141800.814 - Finance CAP Alloc 5,394 6,010 8,626 10,179800.815 - Human resources CAP Alloc 1,091 1,056 1,004 1,047800.817 - Community Hall/Quinlan CAP 6,346 1,228 0 0800.820 - Grounds Maintenance CAP 292 0 0 0800.821 - Building Maintenance CAP 4,387 1,225 937 362
25 - Cost allocation Total 21,650 11,492 11,810 12,68835 - Contingencies
719.705 - Contingencies 0 0 408 35635 - Contingencies Total 0 0 408 356
133

Appendix A-4 Year Expenditure Trends at the Account Level by Program
Department
FY17 Actuals
FY18 Actuals
FY19 Final Budget
FY20 Proposed
Budget142 Fine Arts Commission Total 45,993 37,579 44,349 54,541
150 Public Safety Commission05 - Employee compensation
500.501 - Salaries Full Time 0 0 8,036 4,654500.506 - Car Allowance 0 0 121 0
05 - Employee compensation Total 0 0 8,157 4,65410 - Employee benefits
501.500 - Retirement System 0 0 2,161 1,245501.502 - Pers 1959 Surv Empr 0 0 4 3501.505 - Health Insurance 0 0 474 490501.506 - Dental Insurance 0 0 77 77501.507 - Medicare 0 0 119 67501.508 - Life Insurance 0 0 36 36501.509 - Long Term Disability 0 0 68 50501.510 - Workers Compensation 0 0 149 58501.511 - Vision Insurance 0 0 9 9501.513 - Rec Bucks 0 0 0 20
10 - Employee benefits Total 0 0 3,097 2,05515 - Materials
600.601 - General Office Supplies 690 1,982 5,000 0600.602 - Printing and Duplication 0 0 0 300600.605 - Meeting Expenses 0 0 0 3,220600.613 - General Supplies 0 0 0 800
15 - Materials Total 690 1,982 5,000 4,32020 - Contract services
700.702 - General Service Agreement 15,059 10,000 10,000 10,00020 - Contract services Total 15,059 10,000 10,000 10,000
25 - Cost allocation800.805 - CC CAP Allocation 49 40 52 38800.806 - CM CAP Allocation 15 14 25 16800.814 - Finance CAP Alloc 488 540 1,864 939800.817 - Community Hall/Quinlan CAP 2,865 554 0 0800.820 - Grounds Maintenance CAP 85 0 0 0800.821 - Building Maintenance CAP 1,460 0 0 0
25 - Cost allocation Total 4,962 1,148 1,941 99335 - Contingencies
719.705 - Contingencies 0 0 750 71635 - Contingencies Total 0 0 750 716
150 Public Safety Commission Total 20,711 13,130 28,945 22,738
134

Appendix A-4 Year Expenditure Trends at the Account Level by Program
Department
FY17 Actuals
FY18 Actuals
FY19 Final Budget
FY20 Proposed
Budget155 Bike/Ped Safety Commission
15 - Materials600.601 - General Office Supplies 0 396 300 416
15 - Materials Total 0 396 300 41620 - Contract services
700.702 - General Service Agreement 0 0 4,000 020 - Contract services Total 0 0 4,000 0
25 - Cost allocation800.805 - CC CAP Allocation 17 36 4 2800.806 - CM CAP Allocation 5 13 2 1800.814 - Finance CAP Alloc 42 47 1,757 804800.817 - Community Hall/Quinlan CAP 1,013 196 0 0800.820 - Grounds Maintenance CAP 30 0 0 0800.821 - Building Maintenance CAP 516 0 0 0
25 - Cost allocation Total 1,623 292 1,763 80735 - Contingencies
719.705 - Contingencies 0 0 215 2135 - Contingencies Total 0 0 215 21
155 Bike/Ped Safety Commission Total 1,623 688 6,278 1,244
135

Appendix A-4 Year Expenditure Trends at the Account Level by Program
Department
FY17 Actuals
FY18 Actuals
FY19 Final Budget
FY20 Proposed
Budget160 Recreation Commission
05 - Employee compensation500.501 - Salaries Full Time 6,751 13,105 14,103 19,581500.505 - Overtime 81 46 0 0500.506 - Car Allowance 90 173 180 255
05 - Employee compensation Total 6,922 13,323 14,283 19,83610 - Employee benefits
501.500 - Retirement System 1,611 3,217 3,789 5,237501.502 - Pers 1959 Surv Empr 4 6 8 7501.505 - Health Insurance 798 1,443 1,520 2,006501.506 - Dental Insurance 85 155 153 185501.507 - Medicare 100 189 208 284501.508 - Life Insurance 38 65 65 87501.509 - Long Term Disability 46 99 110 139501.510 - Workers Compensation 118 312 249 139501.511 - Vision Insurance 10 18 18 22501.513 - Rec Bucks 0 0 0 48501.516 - Hra City Contribution 26 0 0 0
10 - Employee benefits Total 2,836 5,504 6,120 8,15415 - Materials
600.601 - General Office Supplies 0 0 56 0600.605 - Meeting Expenses 0 1,688 2,400 2,400600.613 - General Supplies 0 0 525 120600.629 - Conference and Training 325 344 7,000 8,000600.632 - Mileage Reimbursement 2 0 0 0600.647 - Memberships and Dues 0 0 0 230
15 - Materials Total 326 2,032 9,981 10,75020 - Contract services
700.702 - General Service Agreement 0 0 500 020 - Contract services Total 0 0 500 0
25 - Cost allocation800.801 - Equipment Reimbursement 0 0 5 8800.802 - IT Reimbursement 1,402 1,434 759 553800.805 - CC CAP Allocation 347 264 153 260800.806 - CM CAP Allocation 90 81 66 95800.814 - Finance CAP Alloc 5,074 5,620 7,522 10,404800.815 - Human resources CAP Alloc 728 616 402 628800.817 - Community Hall/Quinlan CAP 4,858 941 0 0800.820 - Grounds Maintenance CAP 213 0 0 0800.821 - Building Maintenance CAP 3,244 714 375 217
25 - Cost allocation Total 15,956 9,670 9,282 12,16535 - Contingencies
719.705 - Contingencies 0 0 524 538
136

Appendix A-4 Year Expenditure Trends at the Account Level by Program
Department
FY17 Actuals
FY18 Actuals
FY19 Final Budget
FY20 Proposed
Budget35 - Contingencies Total 0 0 524 538
160 Recreation Commission Total 26,041 30,529 40,690 51,443165 Teen Commission
05 - Employee compensation500.501 - Salaries Full Time 21,515 25,293 25,377 25,880500.505 - Overtime 401 0 0 0
05 - Employee compensation Total 21,916 25,293 25,377 25,88010 - Employee benefits
501.500 - Retirement System 5,273 6,163 6,820 6,922501.502 - Pers 1959 Surv Empr 16 18 18 18501.505 - Health Insurance 2,490 2,706 2,841 2,940501.506 - Dental Insurance 413 468 457 461501.507 - Medicare 312 363 368 375501.508 - Life Insurance 178 173 173 218501.509 - Long Term Disability 187 254 273 277501.510 - Workers Compensation 177 936 747 346501.511 - Vision Insurance 52 54 54 54501.513 - Rec Bucks 0 0 0 121501.516 - Hra City Contribution 129 0 0 0
10 - Employee benefits Total 9,226 11,133 11,751 11,73215 - Materials
600.601 - General Office Supplies 0 0 150 101600.602 - Printing and Duplication 0 0 800 0600.604 - Postage 0 0 500 0600.605 - Meeting Expenses 0 0 2,800 1,772600.611 - Uniforms/Safety Appar 0 0 600 0600.613 - General Supplies 5,176 7,776 10,472 7,345600.629 - Conference and Training 0 750 0 0600.632 - Mileage Reimbursement 5 44 75 0600.639 - Special Program Expenses 0 0 500 0
15 - Materials Total 5,181 8,571 15,897 9,21820 - Contract services
700.701 - Training and Instruction 0 0 600 0700.702 - General Service Agreement 0 0 500 0
20 - Contract services Total 0 0 1,100 025 - Cost allocation
800.801 - Equipment Reimbursement 0 0 16 20800.802 - IT Reimbursement 4,206 0 2,531 1,842800.805 - CC CAP Allocation 794 144 568 705800.806 - CM CAP Allocation 204 44 234 249800.814 - Finance CAP Alloc 4,994 5,242 9,630 11,188800.815 - Human resources CAP Alloc 1,819 324 1,871 2,024800.817 - Community Hall/Quinlan CAP 7,934 1,536 0 0
137
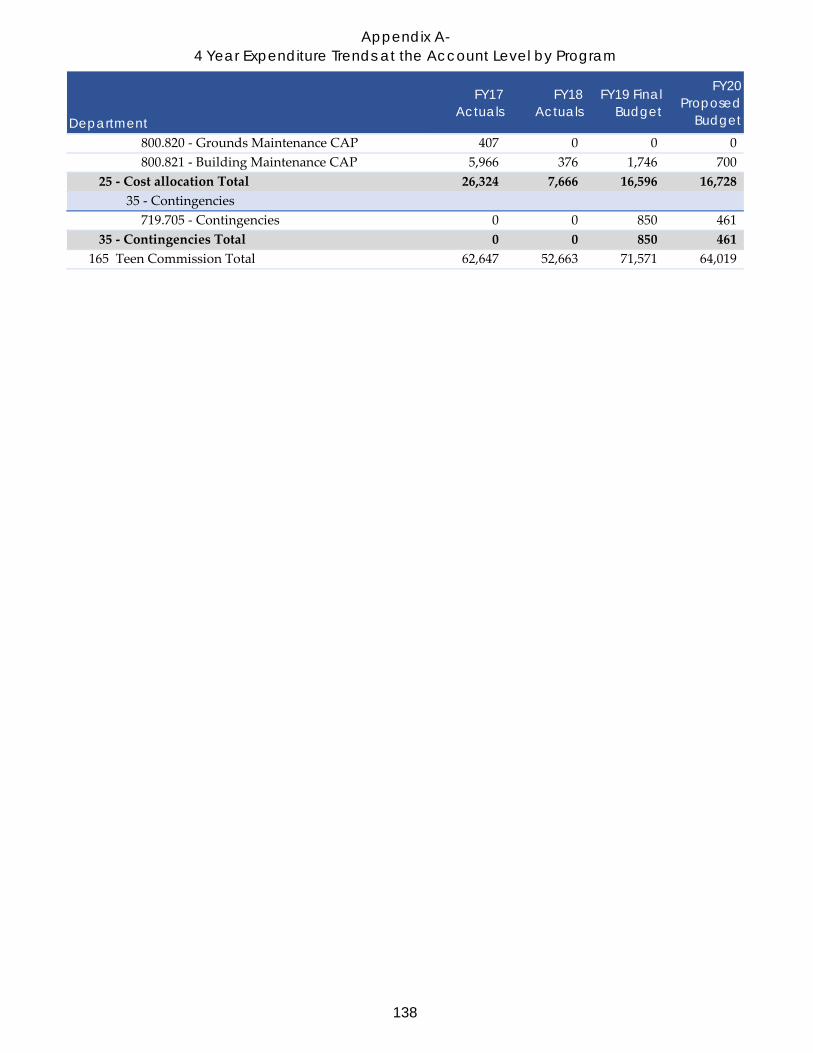
Appendix A-4 Year Expenditure Trends at the Account Level by Program
Department
FY17 Actuals
FY18 Actuals
FY19 Final Budget
FY20 Proposed
Budget800.820 - Grounds Maintenance CAP 407 0 0 0800.821 - Building Maintenance CAP 5,966 376 1,746 700
25 - Cost allocation Total 26,324 7,666 16,596 16,72835 - Contingencies
719.705 - Contingencies 0 0 850 46135 - Contingencies Total 0 0 850 461
165 Teen Commission Total 62,647 52,663 71,571 64,019
138

Appendix A-4 Year Expenditure Trends at the Account Level by Program
Department
FY17 Actuals
FY18 Actuals
FY19 Final Budget
FY20 Proposed
Budget170 Planning Commission
05 - Employee compensation500.501 - Salaries Full Time 34,282 38,219 40,320 45,517500.502 - Salaries Part Time 2,550 2,400 6,000 0500.505 - Overtime 156 0 150 0500.506 - Car Allowance 180 180 180 218
05 - Employee compensation Total 37,169 40,799 46,650 45,73510 - Employee benefits
501.500 - Retirement System 9,002 9,782 10,834 12,174501.502 - Pers 1959 Surv Empr 15 15 15 19501.505 - Health Insurance 2,594 2,760 2,909 3,449501.506 - Dental Insurance 361 388 382 476501.507 - Medicare 543 585 588 661501.508 - Life Insurance 183 177 180 226501.509 - Long Term Disability 211 275 300 374501.510 - Workers Compensation 532 780 648 358501.511 - Vision Insurance 46 45 45 56501.513 - Rec Bucks 0 0 0 125501.516 - Hra City Contribution 141 0 0 0
10 - Employee benefits Total 13,627 14,807 15,901 17,91815 - Materials
600.601 - General Office Supplies 578 0 400 0600.602 - Printing and Duplication 0 174 100 200600.605 - Meeting Expenses 0 3,345 8,760 3,500600.608 - Sml Tools and Equipment 1,527 0 900 0600.613 - General Supplies 0 0 100 0600.619 - Advertising and Legal Notices 16,094 15,479 25,000 16,000600.629 - Conference and Training 3,914 0 0 6,500600.632 - Mileage Reimbursement 0 4 0 0
15 - Materials Total 22,112 19,001 35,260 26,20020 - Contract services
700.701 - Training and Instruction 0 6,299 8,250 0700.702 - General Service Agreement 4,875 750 0 0
20 - Contract services Total 4,875 7,049 8,250 025 - Cost allocation
800.801 - Equipment Reimbursement 0 0 14 22800.802 - IT Reimbursement 4,206 3,824 3,848 2,801800.805 - CC CAP Allocation 1,189 894 696 773800.806 - CM CAP Allocation 316 278 301 285800.814 - Finance CAP Alloc 6,480 7,195 11,123 12,395800.815 - Human resources CAP Alloc 2,183 1,866 1,686 1,745800.817 - Community Hall/Quinlan CAP 23,218 4,495 0 0800.820 - Grounds Maintenance CAP 897 0 0 0
139

Appendix A-4 Year Expenditure Trends at the Account Level by Program
Department
FY17 Actuals
FY18 Actuals
FY19 Final Budget
FY20 Proposed
Budget800.821 - Building Maintenance CAP 14,137 2,165 1,573 603
25 - Cost allocation Total 52,626 20,717 19,241 18,62435 - Contingencies
719.705 - Contingencies 0 0 2,176 1,31035 - Contingencies Total 0 0 2,176 1,310
170 Planning Commission Total 130,409 102,374 127,478 109,787
140

Appendix A-4 Year Expenditure Trends at the Account Level by Program
Department
FY17 Actuals
FY18 Actuals
FY19 Final Budget
FY20 Proposed
Budget175 Housing Commission
05 - Employee compensation500.501 - Salaries Full Time 12,038 13,127 15,555 16,618500.505 - Overtime 78 0 150 0
05 - Employee compensation Total 12,116 13,127 15,705 16,61810 - Employee benefits
501.500 - Retirement System 3,093 3,444 4,183 4,444501.502 - Pers 1959 Surv Empr 8 9 10 9501.505 - Health Insurance 1,913 2,422 2,551 2,655501.506 - Dental Insurance 199 233 230 231501.507 - Medicare 165 185 226 241501.508 - Life Insurance 98 106 108 109501.509 - Long Term Disability 105 147 165 176501.510 - Workers Compensation 59 468 399 173501.511 - Vision Insurance 25 27 27 27501.513 - Rec Bucks 0 0 0 60501.516 - Hra City Contribution 51 0 0 0
10 - Employee benefits Total 5,717 7,040 7,899 8,12515 - Materials
600.601 - General Office Supplies 243 21 675 0600.602 - Printing and Duplication 0 0 0 450600.605 - Meeting Expenses 0 27 300 300600.613 - General Supplies 0 0 0 200600.632 - Mileage Reimbursement 0 28 0 0
15 - Materials Total 243 76 975 95025 - Cost allocation
800.801 - Equipment Reimbursement 0 0 8 11800.802 - IT Reimbursement 2,103 1,434 1,625 1,183800.805 - CC CAP Allocation 481 368 279 356800.806 - CM CAP Allocation 124 110 116 127800.814 - Finance CAP Alloc 5,097 5,651 8,245 9,518800.815 - Human resources CAP Alloc 1,091 932 861 977800.817 - Community Hall/Quinlan CAP 5,002 968 0 0800.820 - Grounds Maintenance CAP 252 0 0 0800.821 - Building Maintenance CAP 3,703 1,081 803 338
25 - Cost allocation Total 17,853 10,544 11,937 12,51035 - Contingencies
719.705 - Contingencies 0 0 49 4835 - Contingencies Total 0 0 49 48
175 Housing Commission Total 35,929 30,787 36,565 38,251
141

Appendix A-4 Year Expenditure Trends at the Account Level by Program
Department
FY17 Actuals
FY18 Actuals
FY19 Final Budget
FY20 Proposed
Budget180 Sustainability Commission
05 - Employee compensation500.501 - Salaries Full Time 13,376 15,987 12,777 13,564
05 - Employee compensation Total 13,376 15,987 12,777 13,56410 - Employee benefits
501.500 - Retirement System 3,091 4,426 3,442 3,628501.502 - Pers 1959 Surv Empr 6 21 6 6501.505 - Health Insurance 880 3,545 949 2,165501.506 - Dental Insurance 184 520 153 154501.507 - Medicare 175 246 186 197501.508 - Life Insurance 90 252 73 73501.509 - Long Term Disability 103 172 134 134501.510 - Workers Compensation 0 2,196 249 115501.511 - Vision Insurance 18 62 18 18501.513 - Rec Bucks 0 0 0 40
10 - Employee benefits Total 4,547 11,439 5,210 6,53015 - Materials
600.601 - General Office Supplies 1,011 0 0 0600.613 - General Supplies 0 193 7,500 5,600600.632 - Mileage Reimbursement 53 11 0 0
15 - Materials Total 1,064 203 7,500 5,60025 - Cost allocation
800.801 - Equipment Reimbursement 0 0 5 7800.802 - IT Reimbursement 0 1,912 1,625 1,183800.805 - CC CAP Allocation 0 0 213 352800.806 - CM CAP Allocation 0 0 86 125800.811 - Public Affairs CAP Alloc 0 0 330 516800.814 - Finance CAP Alloc 0 0 1,594 8,479800.815 - Human resources CAP Alloc 0 0 751 977800.821 - Building Maintenance CAP 0 0 0 338
25 - Cost allocation Total 0 1,912 4,604 11,97735 - Contingencies
719.705 - Contingencies 0 0 0 28035 - Contingencies Total 0 0 0 280
180 Sustainability Commission Total 18,987 29,541 30,091 37,95111 Commissions Total 387,291 325,753 419,957 410,348
Council and commissions Total 1,233,262 838,734 948,652 1,010,292
142

Appendix A-4 Year Expenditure Trends at the Account Level by Program
Department
FY17 Actuals
FY18 Actuals
FY19 Final Budget
FY20 Proposed
BudgetInformation Services
30 I&T Administration300 Administration
05 - Employee compensation500.501 - Salaries Full Time 78,261 103,842 94,070 80,148500.502 - Salaries Part Time 33,771 38,005 0 0500.505 - Overtime 423 523 0 0500.506 - Car Allowance 920 900 900 909500.513 - Sick Leave 1,098 369 0 0
05 - Employee compensation Total 114,473 143,639 94,970 81,05710 - Employee benefits
501.500 - Retirement System 33,340 38,639 25,308 21,437501.502 - Pers 1959 Surv Empr 48 66 42 33501.505 - Health Insurance 11,818 20,003 14,654 8,354501.506 - Dental Insurance 1,196 1,322 1,066 845501.507 - Medicare 1,761 2,053 1,378 1,163501.508 - Life Insurance 546 525 441 357501.509 - Long Term Disability 584 817 745 592501.510 - Workers Compensation 1,172 2,664 1,744 635501.511 - Vision Insurance 152 152 126 99501.513 - Rec Bucks 0 0 0 222501.516 - Hra City Contribution 420 0 0 0
10 - Employee benefits Total 51,036 66,242 45,504 33,73715 - Materials
600.601 - General Office Supplies 5,677 2,104 2,170 500600.602 - Printing and Duplication 56 236 775 0600.605 - Meeting Expenses 0 0 0 511600.606 - Software 0 99 0 0600.608 - Sml Tools and Equipment 71 0 248 2,044600.613 - General Supplies 120 1,378 930 0600.629 - Conference and Training 7,013 6,927 11,446 11,243600.632 - Mileage Reimbursement 69 35 100 100600.642 - Telphone and Data Services 3,709 3,225 2,232 2,748600.647 - Memberships and Dues 0 0 0 77
15 - Materials Total 16,716 14,004 17,901 17,22320 - Contract services
700.701 - Training and Instruction 92 2,703 2,200 3,981700.702 - General Service Agreement 0 60 150,000 71,242700.703 - Maintenance of Equipment 12,343 254 0 0
20 - Contract services Total 12,435 3,017 152,200 75,22325 - Cost allocation
800.801 - Equipment Reimbursement 0 0 45 38800.802 - IT Reimbursement 35,630 20,080 54,824 39,895
143

Appendix A-4 Year Expenditure Trends at the Account Level by Program
Department
FY17 Actuals
FY18 Actuals
FY19 Final Budget
FY20 Proposed
Budget800.805 - CC CAP Allocation 3,915 0 2,790 4,311800.806 - CM CAP Allocation 1,031 0 1,146 1,497800.809 - City Clerk CAP Alloc 1,242 0 0 0800.810 - City Attorney CAP Alloc 4,797 0 0 0800.811 - Public Affairs CAP Alloc 3,880 0 4,096 6,999800.814 - Finance CAP Alloc 2,358 0 13,723 18,648800.815 - Human resources CAP Alloc 16,388 0 9,330 13,262800.817 - Community Hall/Quinlan CAP 13,331 0 0 0800.820 - Grounds Maintenance CAP 1,444 0 0 0800.821 - Building Maintenance CAP 20,682 0 0 4,586
25 - Cost allocation Total 104,698 20,080 85,954 89,23635 - Contingencies
719.705 - Contingencies 0 0 8,505 1,52235 - Contingencies Total 0 0 8,505 1,522
300 Administration Total 299,358 246,981 405,034 297,998
144

Appendix A-4 Year Expenditure Trends at the Account Level by Program
Department
FY17 Actuals
FY18 Actuals
FY19 Final Budget
FY20 Proposed
Budget304 Cupertino Scene
25 - Cost allocation800.811 - Public Affairs CAP Alloc 479 0 0 0
25 - Cost allocation Total 479 0 0 0304 Cupertino Scene Total 479 0 0 0
30 I&T Administration Total 299,837 246,981 405,034 297,998
145

Appendix A-4 Year Expenditure Trends at the Account Level by Program
Department
FY17 Actuals
FY18 Actuals
FY19 Final Budget
FY20 Proposed
Budget31 I&T Video
305 Video05 - Employee compensation
500.501 - Salaries Full Time 375,091 413,528 397,695 423,622500.502 - Salaries Part Time 42,734 75,486 85,754 71,792500.505 - Overtime 12,148 9,947 10,000 10,000500.506 - Car Allowance 554 720 541 545500.513 - Sick Leave 709 1,349 0 0
05 - Employee compensation Total 431,236 501,030 493,990 505,95910 - Employee benefits
501.500 - Retirement System 105,459 117,073 121,669 124,898501.502 - Pers 1959 Surv Empr 184 195 134 198501.505 - Health Insurance 35,442 37,807 38,656 40,481501.506 - Dental Insurance 4,553 5,067 4,872 4,995501.507 - Medicare 6,217 7,212 7,019 7,183501.508 - Life Insurance 1,991 2,266 2,304 2,348501.509 - Long Term Disability 2,706 3,770 4,049 4,139501.510 - Workers Compensation 1,660 10,176 7,972 3,754501.511 - Vision Insurance 575 582 576 588501.513 - Rec Bucks 0 0 0 1,313501.516 - Hra City Contribution 5,313 0 0 0
10 - Employee benefits Total 164,099 184,147 187,251 189,89715 - Materials
600.601 - General Office Supplies 29,570 35,043 20,000 20,440600.605 - Meeting Expenses 0 0 0 204600.606 - Software 0 20 29,100 29,740600.608 - Sml Tools and Equipment 1,121 42 18,000 43,396600.629 - Conference and Training 0 0 7,000 10,220600.632 - Mileage Reimbursement 3 6 150 150600.642 - Telphone and Data Services 1,433 2,578 3,800 2,890
15 - Materials Total 32,127 37,688 78,050 107,04020 - Contract services
700.701 - Training and Instruction 845 2,098 9,000 1,022700.702 - General Service Agreement 17,872 37,720 10,250 18,192700.703 - Maintenance of Equipment 34,760 39,669 92,650 81,034700.706 - Rent Expense 5,066 6,654 10,000 10,220
20 - Contract services Total 58,543 86,141 121,900 110,46825 - Cost allocation
800.801 - Equipment Reimbursement 0 0 172 220800.802 - IT Reimbursement 104,117 71,236 233,568 169,965800.805 - CC CAP Allocation 13,125 9,478 8,594 8,347800.806 - CM CAP Allocation 3,506 2,915 3,631 3,084800.811 - Public Affairs CAP Alloc 60,294 45,041 10,745 0
146

Appendix A-4 Year Expenditure Trends at the Account Level by Program
Department
FY17 Actuals
FY18 Actuals
FY19 Final Budget
FY20 Proposed
Budget800.814 - Finance CAP Alloc 23,034 30,936 40,851 74,101800.815 - Human resources CAP Alloc 22,916 20,896 24,478 18,497800.820 - Grounds Maintenance CAP 2,157 0 0 0800.821 - Building Maintenance CAP 24,231 24,247 22,844 6,396
25 - Cost allocation Total 253,380 204,749 344,883 280,61031 - Special projects
900.945 - Fixed Asset Acquisition 145,891 57,312 96,500 155,000900.966 - Community Hall Upgrade 202,382 46,149 0 0900.995 - Special Projects - CDD/I&T 0 22,820 225,000 0
31 - Special projects Total 348,273 126,281 321,500 155,00035 - Contingencies
719.705 - Contingencies 0 0 9,998 9,12535 - Contingencies Total 0 0 9,998 9,125
305 Video Total 1,287,658 1,140,036 1,557,572 1,358,099
147

Appendix A-4 Year Expenditure Trends at the Account Level by Program
Department
FY17 Actuals
FY18 Actuals
FY19 Final Budget
FY20 Proposed
Budget307 Public Access Support
20 - Contract services700.702 - General Service Agreement 65,586 68,121 71,542 71,542
20 - Contract services Total 65,586 68,121 71,542 71,54225 - Cost allocation
800.805 - CC CAP Allocation 257 243 165 199800.806 - CM CAP Allocation 77 88 81 85800.814 - Finance CAP Alloc 508 562 1,715 1,544
25 - Cost allocation Total 842 893 1,961 1,82835 - Contingencies
719.705 - Contingencies 0 0 0 3,57735 - Contingencies Total 0 0 0 3,577
307 Public Access Support Total 66,428 69,014 73,503 76,94731 I&T Video Total 1,354,086 1,209,051 1,631,075 1,435,046
148

Appendix A-4 Year Expenditure Trends at the Account Level by Program
Department
FY17 Actuals
FY18 Actuals
FY19 Final Budget
FY20 Proposed
Budget32 I&T Applications
308 Applications05 - Employee compensation
500.501 - Salaries Full Time 202,750 368,411 438,218 505,448500.502 - Salaries Part Time 32,999 38,908 56,146 0500.505 - Overtime 16,468 17,184 0 0500.506 - Car Allowance 552 540 1,081 1,091500.513 - Sick Leave 963 36 0 0
05 - Employee compensation Total 253,732 425,079 495,445 506,53910 - Employee benefits
501.500 - Retirement System 50,027 95,187 118,529 120,170501.502 - Pers 1959 Surv Empr 98 191 208 210501.505 - Health Insurance 13,768 35,349 55,920 27,562501.506 - Dental Insurance 2,547 4,962 5,252 5,302501.507 - Medicare 3,584 6,210 7,186 6,515501.508 - Life Insurance 1,331 2,285 2,463 2,486501.509 - Long Term Disability 1,543 3,514 4,215 4,245501.510 - Workers Compensation 618 3,756 8,620 3,985501.511 - Vision Insurance 303 571 621 624501.513 - Rec Bucks 0 0 0 1,394501.516 - Hra City Contribution 2,714 0 0 0
10 - Employee benefits Total 76,533 152,025 203,014 172,49315 - Materials
600.601 - General Office Supplies 1,535 2,649 4,000 2,555600.602 - Printing and Duplication 0 1,217 500 306600.605 - Meeting Expenses 0 0 0 204600.606 - Software 22,220 854,065 801,304 746,258600.613 - General Supplies 0 802 3,000 1,555600.629 - Conference and Training 3,287 12,294 13,200 18,600600.632 - Mileage Reimbursement 19 69 500 100600.642 - Telphone and Data Services 531 1,436 2,100 6,746600.647 - Memberships and Dues 0 0 0 77
15 - Materials Total 27,593 872,533 824,604 776,40120 - Contract services
700.701 - Training and Instruction 0 10,272 24,000 20,000700.702 - General Service Agreement 12,419 181,558 295,000 155,281700.703 - Maintenance of Equipment 65,125 22,627 38,800 92,221
20 - Contract services Total 77,544 214,457 357,800 267,50225 - Cost allocation
800.801 - Equipment Reimbursement 0 0 169 234800.802 - IT Reimbursement 10,516 41,595 84,570 61,541800.805 - CC CAP Allocation 3,669 3,200 4,082 9,677800.806 - CM CAP Allocation 971 998 1,696 3,695
149

Appendix A-4 Year Expenditure Trends at the Account Level by Program
Department
FY17 Actuals
FY18 Actuals
FY19 Final Budget
FY20 Proposed
Budget800.811 - Public Affairs CAP Alloc 18,184 14,015 5,627 8,878800.814 - Finance CAP Alloc 9,359 10,385 22,279 40,528800.815 - Human resources CAP Alloc 6,911 6,502 12,819 47,727800.820 - Grounds Maintenance CAP 651 0 0 0800.821 - Building Maintenance CAP 7,308 7,545 11,963 5,816
25 - Cost allocation Total 57,569 84,240 143,205 178,09631 - Special projects
900.957 - City Website 13,330 11,250 0 031 - Special projects Total 13,330 11,250 0 0
35 - Contingencies719.705 - Contingencies 0 0 59,120 42,620
35 - Contingencies Total 0 0 59,120 42,620308 Applications Total 506,301 1,759,583 2,083,188 1,943,651
32 I&T Applications Total 506,301 1,759,583 2,083,188 1,943,651
150

Appendix A-4 Year Expenditure Trends at the Account Level by Program
Department
FY17 Actuals
FY18 Actuals
FY19 Final Budget
FY20 Proposed
Budget34 I&T Infrastructure
310 Infrastructure05 - Employee compensation
500.501 - Salaries Full Time 463,349 400,876 505,362 517,132500.502 - Salaries Part Time 28,548 24,574 29,920 0500.505 - Overtime 9,308 18,702 0 10,000500.506 - Car Allowance 1,246 1,080 720 727500.513 - Sick Leave 96 400 0 0
05 - Employee compensation Total 502,547 445,632 536,002 527,85910 - Employee benefits
501.500 - Retirement System 159,404 146,743 136,238 138,312501.502 - Pers 1959 Surv Empr 195 141 210 17,654501.505 - Health Insurance 51,151 56,327 56,964 65,179501.506 - Dental Insurance 6,171 5,225 6,850 6,916501.507 - Medicare 6,990 6,383 7,776 7,498501.508 - Life Insurance 3,027 2,317 3,197 3,228501.509 - Long Term Disability 3,411 3,725 4,998 5,036501.510 - Workers Compensation 5,191 14,400 11,210 5,197501.511 - Vision Insurance 791 598 810 814501.513 - Rec Bucks 0 0 0 1,818501.516 - Hra City Contribution 4,401 0 0 0
10 - Employee benefits Total 240,731 235,859 228,253 251,65215 - Materials
600.601 - General Office Supplies 27,245 27,147 24,360 0600.602 - Printing and Duplication 0 80 500 511600.605 - Meeting Expenses 0 0 0 256600.606 - Software 0 199,797 230,550 146,760600.608 - Sml Tools and Equipment 0 227,066 132,487 159,174600.629 - Conference and Training 3,767 10,540 6,890 33,441600.632 - Mileage Reimbursement 35 29 250 100600.641 - Electrical Service 0 0 0 1,533600.642 - Telphone and Data Services 26,206 38,892 60,000 88,446600.647 - Memberships and Dues 0 0 0 1,380
15 - Materials Total 57,253 503,552 455,037 431,60120 - Contract services
700.701 - Training and Instruction 0 999 65,000 45,440700.702 - General Service Agreement 333,556 210,981 425,000 205,626700.703 - Maintenance of Equipment 364,534 42,484 89,600 55,188
20 - Contract services Total 698,090 254,464 579,600 306,25425 - Cost allocation
800.801 - Equipment Reimbursement 0 0 243 304800.802 - IT Reimbursement 53,279 45,419 145,362 105,876800.805 - CC CAP Allocation 20,291 15,730 11,529 13,063
151

Appendix A-4 Year Expenditure Trends at the Account Level by Program
Department
FY17 Actuals
FY18 Actuals
FY19 Final Budget
FY20 Proposed
Budget800.806 - CM CAP Allocation 5,417 5,025 4,931 4,837800.809 - City Clerk CAP Alloc 429 391 391 3,182800.811 - Public Affairs CAP Alloc 93,791 58,580 13,339 15,066800.814 - Finance CAP Alloc 22,529 24,674 40,242 63,549800.815 - Human resources CAP Alloc 35,648 27,177 30,387 121,264800.817 - Community Hall/Quinlan CAP 653 573 32,007 61,204800.820 - Grounds Maintenance CAP 3,355 0 0 0800.821 - Building Maintenance CAP 37,693 31,534 28,357 9,871
25 - Cost allocation Total 273,085 209,103 306,788 398,21631 - Special projects
900.945 - Fixed Asset Acquisition 0 34,829 365,000 110,50031 - Special projects Total 0 34,829 365,000 110,500
35 - Contingencies719.705 - Contingencies 0 0 51,732 34,562
35 - Contingencies Total 0 0 51,732 34,56250 - Other financing uses
800.904 - Depreciation Expenses 173,306 164,681 146,506 050 - Other financing uses Total 173,306 164,681 146,506 0
310 Infrastructure Total 1,945,013 1,848,120 2,668,918 2,060,64434 I&T Infrastructure Total 1,945,013 1,848,120 2,668,918 2,060,644
152

Appendix A-4 Year Expenditure Trends at the Account Level by Program
Department
FY17 Actuals
FY18 Actuals
FY19 Final Budget
FY20 Proposed
Budget35 I&T GIS
986 GIS05 - Employee compensation
500.501 - Salaries Full Time 235,485 296,545 366,863 388,960500.502 - Salaries Part Time 27,225 63,379 60,735 64,557500.505 - Overtime 17 44 0 0500.506 - Car Allowance 368 360 361 364
05 - Employee compensation Total 263,096 360,328 427,959 453,88110 - Employee benefits
501.500 - Retirement System 94,186 109,486 99,414 104,032501.502 - Pers 1959 Surv Empr 123 143 192 195501.505 - Health Insurance 19,592 30,860 44,058 44,396501.506 - Dental Insurance 3,051 3,747 4,872 4,919501.507 - Medicare 3,635 5,040 6,208 5,640501.508 - Life Insurance 1,863 1,812 2,290 2,312501.509 - Long Term Disability 1,761 2,572 3,530 3,669501.510 - Workers Compensation 0 8,292 7,972 3,696501.511 - Vision Insurance 388 428 576 579501.513 - Rec Bucks 0 0 0 1,292501.516 - Hra City Contribution 1,488 0 0 0
10 - Employee benefits Total 126,086 162,380 169,112 170,73015 - Materials
600.601 - General Office Supplies 127 40 400 409600.602 - Printing and Duplication 502 286 300 409600.606 - Software 495 63,791 150,600 141,035600.608 - Sml Tools and Equipment 0 0 5,000 0600.613 - General Supplies 1,853 305 2,000 1,022600.629 - Conference and Training 7,237 14,315 15,400 19,520600.632 - Mileage Reimbursement 101 135 500 200600.642 - Telphone and Data Services 648 2,425 2,460 2,208
15 - Materials Total 10,964 81,296 176,660 164,80320 - Contract services
700.701 - Training and Instruction 0 1,995 3,700 0700.702 - General Service Agreement 140,567 99,403 137,080 93,610700.703 - Maintenance of Equipment 83,589 13,531 10,000 16,144
20 - Contract services Total 224,157 114,929 150,780 109,75425 - Cost allocation
800.801 - Equipment Reimbursement 0 0 141 216800.802 - IT Reimbursement 40,444 31,076 97,193 70,726800.805 - CC CAP Allocation 4,029 5,296 5,608 9,107800.806 - CM CAP Allocation 1,072 1,596 2,335 3,250800.811 - Public Affairs CAP Alloc 19,141 28,055 7,637 13,003800.814 - Finance CAP Alloc 1,765 3,395 19,638 25,186
153

Appendix A-4 Year Expenditure Trends at the Account Level by Program
Department
FY17 Actuals
FY18 Actuals
FY19 Final Budget
FY20 Proposed
Budget800.815 - Human resources CAP Alloc 7,275 13,015 17,399 55,545800.820 - Grounds Maintenance CAP 685 0 0 0800.821 - Building Maintenance CAP 7,692 15,102 16,237 8,519
25 - Cost allocation Total 82,103 97,535 166,188 185,55230 - Capital outlays
900.969 - Software 0 19,565 0 030 - Capital outlays Total 0 19,565 0 0
31 - Special projects900.995 - Special Projects - CDD/I&T 7,725 0 0 0
31 - Special projects Total 7,725 0 0 035 - Contingencies
719.705 - Contingencies 0 0 16,372 11,37335 - Contingencies Total 0 0 16,372 11,373
986 GIS Total 714,129 836,032 1,107,071 1,096,09335 I&T GIS Total 714,129 836,032 1,107,071 1,096,093
154

Appendix A-4 Year Expenditure Trends at the Account Level by Program
Department
FY17 Actuals
FY18 Actuals
FY19 Final Budget
FY20 Proposed
Budget90 Citywide - Non Departmental
989 Network Upgrade31 - Special projects
900.945 - Fixed Asset Acquisition 329,151 0 0 031 - Special projects Total 329,151 0 0 0
989 Network Upgrade Total 329,151 0 0 0
155

Appendix A-4 Year Expenditure Trends at the Account Level by Program
Department
FY17 Actuals
FY18 Actuals
FY19 Final Budget
FY20 Proposed
Budget991 New Project Contingency
05 - Employee compensation500.502 - Salaries Part Time 3,237 0 0 0
05 - Employee compensation Total 3,237 0 0 010 - Employee benefits
501.500 - Retirement System 45 0 0 0501.507 - Medicare 52 0 0 0
10 - Employee benefits Total 97 0 0 0991 New Project Contingency Total 3,334 0 0 0
156

Appendix A-4 Year Expenditure Trends at the Account Level by Program
Department
FY17 Actuals
FY18 Actuals
FY19 Final Budget
FY20 Proposed
Budget995 Planning Software
31 - Special projects900.945 - Fixed Asset Acquisition 86,287 0 0 0
31 - Special projects Total 86,287 0 0 0995 Planning Software Total 86,287 0 0 0
90 Citywide - Non Departmental Total 418,772 0 0 0Information Services Total 5,238,138 5,899,767 7,895,286 6,833,432
157

Appendix A-4 Year Expenditure Trends at the Account Level by Program
Department
FY17 Actuals
FY18 Actuals
FY19 Final Budget
FY20 Proposed
BudgetLaw enforcement
20 Law Enforcement200 Law Enforcement SC Sherif
15 - Materials600.618 - Utilities and Phone 0 0 1,333 1,333600.634 - Probation Officer 50,000 49,975 50,470 50,470600.642 - Telphone and Data Services 1,709 1,508 0 0
15 - Materials Total 51,709 51,483 51,803 51,80320 - Contract services
700.702 - General Service Agreement 0 0 100,000 100,000700.705 - Law Enforcement Services 11,124,953 11,505,817 12,103,080 13,816,780
20 - Contract services Total 11,124,953 11,505,817 12,203,080 13,916,78025 - Cost allocation
800.805 - CC CAP Allocation 41,058 39,720 27,969 33,562800.806 - CM CAP Allocation 12,329 14,391 13,728 14,326800.814 - Finance CAP Alloc 14,935 16,544 121 9,730
25 - Cost allocation Total 68,322 70,655 41,818 57,61831 - Special projects
750.024 - K-9 Dog 0 0 7,328 031 - Special projects Total 0 0 7,328 0
200 Law Enforcement SC Sherif Total 11,244,984 11,627,955 12,304,029 14,026,201
158
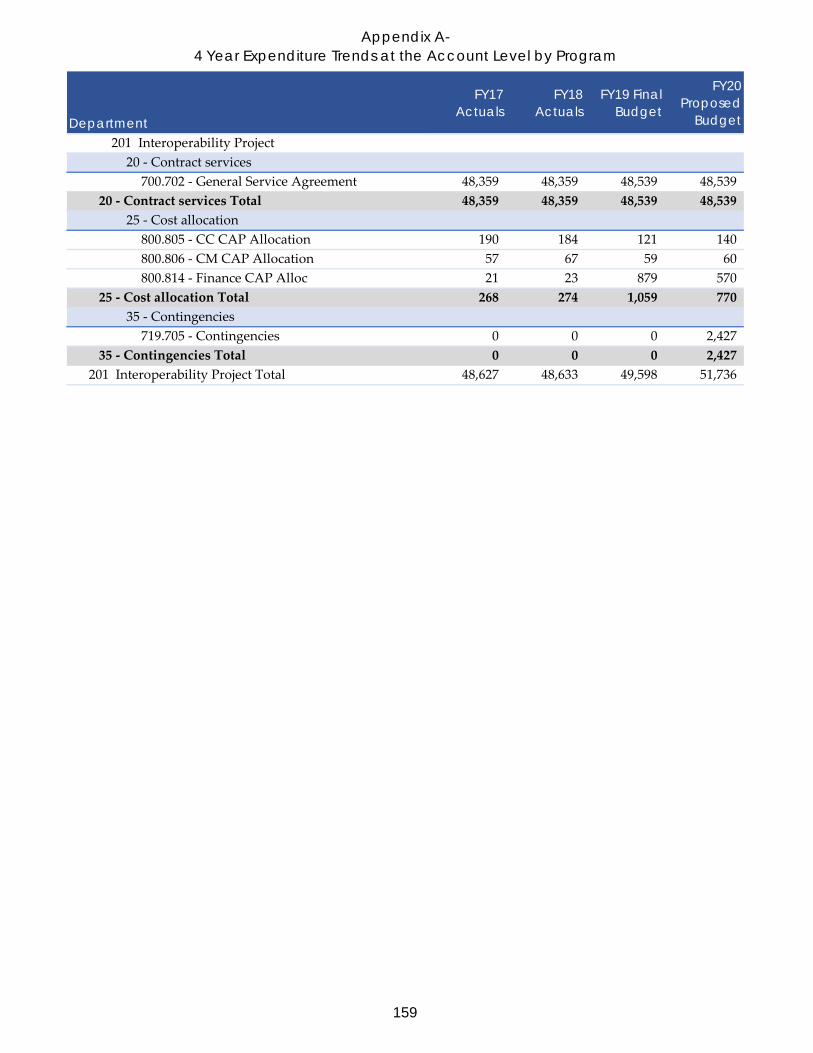
Appendix A-4 Year Expenditure Trends at the Account Level by Program
Department
FY17 Actuals
FY18 Actuals
FY19 Final Budget
FY20 Proposed
Budget201 Interoperability Project
20 - Contract services700.702 - General Service Agreement 48,359 48,359 48,539 48,539
20 - Contract services Total 48,359 48,359 48,539 48,53925 - Cost allocation
800.805 - CC CAP Allocation 190 184 121 140800.806 - CM CAP Allocation 57 67 59 60800.814 - Finance CAP Alloc 21 23 879 570
25 - Cost allocation Total 268 274 1,059 77035 - Contingencies
719.705 - Contingencies 0 0 0 2,42735 - Contingencies Total 0 0 0 2,427
201 Interoperability Project Total 48,627 48,633 49,598 51,736
159

Appendix A-4 Year Expenditure Trends at the Account Level by Program
Department
FY17 Actuals
FY18 Actuals
FY19 Final Budget
FY20 Proposed
Budget202 Code Enforcement
05 - Employee compensation500.501 - Salaries Full Time 191,233 200,732 203,538 0500.502 - Salaries Part Time 27,945 27,650 40,300 0500.505 - Overtime 7,414 8,542 0 0
05 - Employee compensation Total 226,592 236,925 243,838 010 - Employee benefits
501.500 - Retirement System 50,799 52,312 55,318 0501.502 - Pers 1959 Surv Empr 115 120 120 0501.505 - Health Insurance 22,695 28,851 30,401 0501.506 - Dental Insurance 2,841 3,111 3,044 0501.507 - Medicare 3,283 3,427 3,552 0501.508 - Life Insurance 1,555 1,436 1,440 0501.509 - Long Term Disability 1,580 2,046 2,162 0501.510 - Workers Compensation 2,596 6,264 4,982 0501.511 - Vision Insurance 362 358 360 0501.516 - Hra City Contribution 1,053 0 0 0
10 - Employee benefits Total 86,879 97,924 101,379 015 - Materials
600.601 - General Office Supplies 938 1,258 1,500 0600.608 - Sml Tools and Equipment 565 31,243 1,500 0600.611 - Uniforms/Safety Appar 1,498 2,169 2,500 0600.613 - General Supplies 119 167 200 0600.618 - Utilities and Phone 0 0 6,000 0600.632 - Mileage Reimbursement 97 257 175 0600.642 - Telphone and Data Services 6,712 5,469 4,900 0
15 - Materials Total 9,929 40,563 16,775 020 - Contract services
700.701 - Training and Instruction 1,845 4,249 3,250 0700.702 - General Service Agreement 215,236 214,281 227,155 0
20 - Contract services Total 217,081 218,530 230,405 025 - Cost allocation
800.801 - Equipment Reimbursement 3,000 19,520 4,501 0800.802 - IT Reimbursement 35,242 0 25,469 0800.805 - CC CAP Allocation 7,428 5,818 0 0800.806 - CM CAP Allocation 1,954 1,799 0 0800.809 - City Clerk CAP Alloc 3,900 2,261 0 0800.810 - City Attorney CAP Alloc 29,155 25,051 0 0800.814 - Finance CAP Alloc 9,774 10,746 0 0800.815 - Human resources CAP Alloc 14,550 12,450 0 0800.821 - Building Maintenance CAP 0 14,446 0 0
25 - Cost allocation Total 105,003 92,091 29,970 035 - Contingencies
160

Appendix A-4 Year Expenditure Trends at the Account Level by Program
Department
FY17 Actuals
FY18 Actuals
FY19 Final Budget
FY20 Proposed
Budget719.705 - Contingencies 0 0 12,359 0
35 - Contingencies Total 0 0 12,359 0202 Code Enforcement Total 645,483 686,033 634,726 0
20 Law Enforcement Total 11,939,094 12,362,621 12,988,353 14,077,937Law enforcement Total 11,939,094 12,362,621 12,988,353 14,077,937
161

Appendix A-4 Year Expenditure Trends at the Account Level by Program
Department
FY17 Actuals
FY18 Actuals
FY19 Final Budget
FY20 Proposed
BudgetNon departmental
90 Citywide - Non Departmental001 No Department
15 - Materials600.600 - Cash Short 0 (2,606) 0 0600.651 - Property Tax 0 535 0 0
15 - Materials Total 0 (2,071) 0 020 - Contract services
700.707 - Bank Charges 0 23,790 0 020 - Contract services Total 0 23,790 0 0
30 - Capital outlays900.970 - Property Aquisition 0 2,450,108 0 0
30 - Capital outlays Total 0 2,450,108 0 045 - Transfer out
800.902 - Transfers Out 37,670,339 39,389,292 22,095,412 10,198,83845 - Transfer out Total 37,670,339 39,389,292 22,095,412 10,198,838
001 No Department Total 37,670,339 41,861,119 22,095,412 10,198,838
162

Appendix A-4 Year Expenditure Trends at the Account Level by Program
Department
FY17 Actuals
FY18 Actuals
FY19 Final Budget
FY20 Proposed
Budget500 Facility Lease
40 - Debt services800.901 - Debt Service Principal 2,136,500 2,180,000 3,169,438 2,290,000800.906 - Debt Service Interest 1,035,738 993,038 0 882,838
40 - Debt services Total 3,172,238 3,173,038 3,169,438 3,172,838500 Facility Lease Total 3,172,238 3,173,038 3,169,438 3,172,838
163

Appendix A-4 Year Expenditure Trends at the Account Level by Program
Department
FY17 Actuals
FY18 Actuals
FY19 Final Budget
FY20 Proposed
Budget502 EE Housing Loan
15 - Materials600.651 - Property Tax 7,471 7,696 0 0
15 - Materials Total 7,471 7,696 0 020 - Contract services
700.702 - General Service Agreement 0 1,050 0 020 - Contract services Total 0 1,050 0 0
502 EE Housing Loan Total 7,471 8,746 0 090 Citywide - Non Departmental Total 40,850,047 45,042,902 25,264,850 13,371,676
Non departmental Total 40,850,047 45,042,902 25,264,850 13,371,676
164

Appendix A-4 Year Expenditure Trends at the Account Level by Program
Department
FY17 Actuals
FY18 Actuals
FY19 Final Budget
FY20 Proposed
BudgetPublic works
80 PW Administration800 Public Works Admin
05 - Employee compensation500.501 - Salaries Full Time 388,991 430,227 452,588 458,657500.502 - Salaries Part Time 49,479 58,341 89,077 80,983500.505 - Overtime 246 30 0 32500.506 - Car Allowance 3,600 3,600 3,600 3,636500.513 - Sick Leave 1,064 569 2,930 2,699
05 - Employee compensation Total 443,380 492,767 548,195 546,00710 - Employee benefits
501.500 - Retirement System 103,631 111,470 121,670 123,723501.502 - Pers 1959 Surv Empr 184 195 196 198501.505 - Health Insurance 31,798 33,613 32,680 45,632501.506 - Dental Insurance 4,585 5,055 4,948 4,992501.507 - Medicare 6,398 7,111 7,893 7,826501.508 - Life Insurance 2,293 2,191 2,196 2,332501.509 - Long Term Disability 2,518 3,311 3,673 3,722501.510 - Workers Compensation 18,620 10,176 8,121 1,213501.511 - Vision Insurance 582 581 585 588501.513 - Rec Bucks 0 0 0 1,232501.516 - Hra City Contribution 28,776 0 0 0
10 - Employee benefits Total 199,386 173,702 181,962 191,45815 - Materials
600.601 - General Office Supplies 1,531 1,875 1,500 3,096600.605 - Meeting Expenses 796 2,605 8,200 3,503600.608 - Sml Tools and Equipment 196 224 1,000 733600.613 - General Supplies 1,757 3,172 2,914 698600.629 - Conference and Training 8,452 12,836 8,100 20,336600.632 - Mileage Reimbursement 15 55 0 57600.642 - Telphone and Data Services 2,424 2,249 2,625 2,361600.647 - Memberships and Dues 0 0 0 1,816
15 - Materials Total 15,171 23,015 24,339 32,60020 - Contract services
700.701 - Training and Instruction 698 304 1,000 0700.702 - General Service Agreement 1,375 539 253,800 105,525
20 - Contract services Total 2,073 844 254,800 105,52525 - Cost allocation
800.801 - Equipment Reimbursement 0 0 172 72800.802 - IT Reimbursement 45,783 69,802 72,658 52,873800.805 - CC CAP Allocation 10,631 0 0 0800.806 - CM CAP Allocation 222,331 0 0 0800.809 - City Clerk CAP Alloc 127,071 0 0 0
165

Appendix A-4 Year Expenditure Trends at the Account Level by Program
Department
FY17 Actuals
FY18 Actuals
FY19 Final Budget
FY20 Proposed
Budget800.810 - City Attorney CAP Alloc 145,773 0 0 0800.814 - Finance CAP Alloc 11,782 0 0 0800.815 - Human resources CAP Alloc 199,975 0 0 0800.817 - Community Hall/Quinlan CAP 1,312 0 0 0800.818 - PW Admin CAP 11,494 0 0 0800.820 - Grounds Maintenance CAP 2,076 0 0 0800.821 - Building Maintenance CAP 23,674 0 0 0
25 - Cost allocation Total 801,902 69,802 72,830 52,94530 - Capital outlays
900.990 - Special Projects - PW 18,077 23,803 0 030 - Capital outlays Total 18,077 23,803 0 0
35 - Contingencies719.705 - Contingencies 0 0 6,457 6,906
35 - Contingencies Total 0 0 6,457 6,906800 Public Works Admin Total 1,479,987 783,933 1,088,583 935,441
80 PW Administration Total 1,479,987 783,933 1,088,583 935,441
166

Appendix A-4 Year Expenditure Trends at the Account Level by Program
Department
FY17 Actuals
FY18 Actuals
FY19 Final Budget
FY20 Proposed
Budget81 Environmental Programs
801 Resources Recovery05 - Employee compensation
500.501 - Salaries Full Time 414,865 478,512 465,706 470,826500.502 - Salaries Part Time 19,536 30,659 41,918 56,820500.505 - Overtime 2,057 4,626 3,000 4,857500.513 - Sick Leave 144 288 1,379 1,894
05 - Employee compensation Total 436,602 514,086 512,003 534,39710 - Employee benefits
501.500 - Retirement System 208,555 170,108 125,186 126,667501.502 - Pers 1959 Surv Empr 196 219 216 253501.505 - Health Insurance 49,182 71,538 60,509 64,889501.506 - Dental Insurance 5,820 6,699 6,402 6,454501.507 - Medicare 5,149 5,951 6,536 6,824501.508 - Life Insurance 2,797 3,026 3,084 3,055501.509 - Long Term Disability 3,058 4,254 4,618 4,699501.510 - Workers Compensation 10,557 13,464 10,712 4,851501.511 - Vision Insurance 733 772 758 761501.513 - Rec Bucks 0 0 0 1,699501.516 - Hra City Contribution 1,933 0 0 0
10 - Employee benefits Total 287,981 276,031 218,021 220,15215 - Materials
600.601 - General Office Supplies 2,089 6,656 3,500 459600.602 - Printing and Duplication 0 0 5,000 5,014600.605 - Meeting Expenses 0 0 0 840600.608 - Sml Tools and Equipment 0 0 0 13,140600.611 - Uniforms/Safety Appar 260 0 260 32600.613 - General Supplies 0 0 0 13,018600.619 - Advertising and Legal Notices 0 8,408 0 10,800600.621 - Calrecylce City Payment Prgm Adm 16,000 13,408 16,000 16,800600.629 - Conference and Training 0 0 0 6,909600.632 - Mileage Reimbursement 471 258 1,000 271600.642 - Telphone and Data Services 4,051 4,229 2,650 4,124600.647 - Memberships and Dues 0 0 0 4,389
15 - Materials Total 22,872 32,959 28,410 75,79620 - Contract services
700.701 - Training and Instruction 7,251 6,195 11,000 0700.702 - General Service Agreement 2,080,571 1,598,746 2,395,000 1,045,724
20 - Contract services Total 2,087,822 1,604,941 2,406,000 1,045,72425 - Cost allocation
800.801 - Equipment Reimbursement 0 0 3,157 4,032800.802 - IT Reimbursement 61,948 76,019 95,879 69,771800.805 - CC CAP Allocation 20,865 20,182 13,966 16,609
167

Appendix A-4 Year Expenditure Trends at the Account Level by Program
Department
FY17 Actuals
FY18 Actuals
FY19 Final Budget
FY20 Proposed
Budget800.806 - CM CAP Allocation 5,734 6,606 6,145 6,217800.809 - City Clerk CAP Alloc 3,900 2,261 2,255 2,790800.814 - Finance CAP Alloc 18,355 20,764 24,430 34,732800.815 - Human resources CAP Alloc 34,908 35,592 37,484 33,714800.817 - Community Hall/Quinlan CAP 4,846 1,719 0 0800.820 - Grounds Maintenance CAP 110 0 0 0800.821 - Building Maintenance CAP 1,887 0 0 11,657
25 - Cost allocation Total 152,553 163,143 183,316 179,52231 - Special projects
750.026 - Waste Characterizatn Study/Audit 0 0 150,000 0750.044 - S/W Hauler Franchise Agt RFP 0 0 0 250,000
31 - Special projects Total 0 0 150,000 250,00035 - Contingencies
719.705 - Contingencies 0 0 0 56,07635 - Contingencies Total 0 0 0 56,076
50 - Other financing uses800.904 - Depreciation Expenses 3,351 3,351 3,351 0
50 - Other financing uses Total 3,351 3,351 3,351 0801 Resources Recovery Total 2,991,181 2,594,511 3,501,101 2,361,667
168

Appendix A-4 Year Expenditure Trends at the Account Level by Program
Department
FY17 Actuals
FY18 Actuals
FY19 Final Budget
FY20 Proposed
Budget802 Non Point Source
05 - Employee compensation500.501 - Salaries Full Time 192,637 207,987 213,220 218,526500.504 - Stand By 25 15 0 0500.505 - Overtime 598 2,660 3,100 2,793
05 - Employee compensation Total 193,261 210,662 216,320 221,31910 - Employee benefits
501.500 - Retirement System 50,447 53,056 57,345 58,446501.502 - Pers 1959 Surv Empr 83 86 93 113501.505 - Health Insurance 24,860 28,469 29,251 30,769501.506 - Dental Insurance 2,617 2,867 2,881 2,921501.507 - Medicare 2,235 2,389 2,619 2,685501.508 - Life Insurance 1,307 1,303 1,352 1,368501.509 - Long Term Disability 1,426 1,885 2,069 2,103501.510 - Workers Compensation 9,130 6,480 4,733 2,194501.511 - Vision Insurance 332 329 343 347501.513 - Rec Bucks 0 0 0 765501.516 - Hra City Contribution 930 0 0 0
10 - Employee benefits Total 93,366 96,863 100,686 101,71115 - Materials
600.601 - General Office Supplies 1,347 2,049 6,317 546600.602 - Printing and Duplication 0 0 0 427600.605 - Meeting Expenses 0 0 0 88600.608 - Sml Tools and Equipment 0 0 0 27600.611 - Uniforms/Safety Appar 52 20 160 534600.613 - General Supplies 0 0 0 1,497600.629 - Conference and Training 0 0 0 5,797600.632 - Mileage Reimbursement 203 135 500 135600.635 - Special Departmental Exp 0 0 0 23,100600.642 - Telphone and Data Services 1,116 965 1,050 697
15 - Materials Total 2,717 3,169 8,027 32,84820 - Contract services
700.701 - Training and Instruction 3,406 2,427 4,000 0700.702 - General Service Agreement 232,951 260,653 303,000 299,841
20 - Contract services Total 236,357 263,079 307,000 299,84125 - Cost allocation
800.801 - Equipment Reimbursement 0 0 99 128800.802 - IT Reimbursement 26,391 33,178 35,790 26,045800.805 - CC CAP Allocation 8,209 4,793 4,192 5,340800.806 - CM CAP Allocation 2,166 1,503 1,762 1,949800.814 - Finance CAP Alloc 12,387 13,648 14,608 19,654800.815 - Human resources CAP Alloc 19,502 13,265 16,550 13,392800.821 - Building Maintenance CAP 0 0 0 4,417
169

Appendix A-4 Year Expenditure Trends at the Account Level by Program
Department
FY17 Actuals
FY18 Actuals
FY19 Final Budget
FY20 Proposed
Budget25 - Cost allocation Total 68,655 66,387 73,001 70,925
35 - Contingencies719.705 - Contingencies 0 0 15,751 16,634
35 - Contingencies Total 0 0 15,751 16,634802 Non Point Source Total 594,356 640,161 720,785 743,278
81 Environmental Programs Total 3,585,537 3,234,672 4,221,886 3,104,945
170

Appendix A-4 Year Expenditure Trends at the Account Level by Program
Department
FY17 Actuals
FY18 Actuals
FY19 Final Budget
FY20 Proposed
Budget82 Developmental Services
804 Plan Review05 - Employee compensation
500.501 - Salaries Full Time 493,089 567,287 697,105 717,946500.502 - Salaries Part Time 2,785 0 0 0500.506 - Car Allowance 3,300 5,065 6,001 6,060
05 - Employee compensation Total 499,174 572,352 703,106 724,00610 - Employee benefits
501.500 - Retirement System 127,868 144,532 187,401 192,023501.502 - Pers 1959 Surv Empr 230 254 391 335501.505 - Health Insurance 47,537 58,836 89,525 77,603501.506 - Dental Insurance 5,710 6,624 9,831 8,453501.507 - Medicare 7,218 8,165 10,199 10,410501.508 - Life Insurance 3,125 3,046 4,680 3,999501.509 - Long Term Disability 3,532 4,951 6,637 6,838501.510 - Workers Compensation 42,330 14,088 11,210 6,352501.511 - Vision Insurance 728 759 1,168 996501.513 - Rec Bucks 0 0 0 2,222501.516 - Hra City Contribution 2,120 0 0 0
10 - Employee benefits Total 240,399 241,255 321,042 309,23115 - Materials
600.601 - General Office Supplies 1,406 5,152 3,000 1,503600.602 - Printing and Duplication 279 178 1,900 0600.603 - Maps, Blueprints, Etc 0 30 0 0600.605 - Meeting Expenses 0 0 0 315600.608 - Sml Tools and Equipment 3,000 2,948 4,100 0600.613 - General Supplies 891 1,130 3,000 800600.629 - Conference and Training 2,580 4,453 4,000 4,658600.632 - Mileage Reimbursement 0 5 368 25600.642 - Telphone and Data Services 6,006 5,955 2,500 2,668600.647 - Memberships and Dues 0 0 0 616
15 - Materials Total 14,163 19,851 18,868 10,58520 - Contract services
700.701 - Training and Instruction 316 465 5,000 0700.702 - General Service Agreement 148,323 117,914 53,400 90,388
20 - Contract services Total 148,639 118,379 58,400 90,38825 - Cost allocation
800.801 - Equipment Reimbursement 0 11,510 238 372800.802 - IT Reimbursement 72,393 65,978 74,554 54,253800.805 - CC CAP Allocation 15,487 16,344 11,266 13,041800.806 - CM CAP Allocation 4,195 5,245 4,869 4,795800.814 - Finance CAP Alloc 18,293 21,778 27,157 33,861800.815 - Human resources CAP Alloc 24,008 27,254 27,563 60,710
171

Appendix A-4 Year Expenditure Trends at the Account Level by Program
Department
FY17 Actuals
FY18 Actuals
FY19 Final Budget
FY20 Proposed
Budget800.820 - Grounds Maintenance CAP 2,260 0 0 0800.821 - Building Maintenance CAP 25,385 31,624 25,722 10,305
25 - Cost allocation Total 162,021 179,733 171,369 177,33731 - Special projects
900.923 - Apple Campus 2 1,009,116 562,066 20,500 0900.936 - 3-YR Scanning Project 15,800 190 0 0900.963 - Trash Capture 0 1,525 0 0
31 - Special projects Total 1,024,916 563,781 20,500 035 - Contingencies
719.705 - Contingencies 0 0 3,788 5,04935 - Contingencies Total 0 0 3,788 5,049
804 Plan Review Total 2,089,312 1,695,352 1,297,073 1,316,596
172

Appendix A-4 Year Expenditure Trends at the Account Level by Program
Department
FY17 Actuals
FY18 Actuals
FY19 Final Budget
FY20 Proposed
Budget806 CIP Administration
05 - Employee compensation500.501 - Salaries Full Time 316,290 314,471 420,694 713,029500.502 - Salaries Part Time 57,941 60,276 76,489 62,141500.513 - Sick Leave 0 0 2,021 2,071
05 - Employee compensation Total 374,231 374,747 499,204 777,24110 - Employee benefits
501.500 - Retirement System 82,465 81,475 113,094 206,964501.502 - Pers 1959 Surv Empr 137 138 180 305501.505 - Health Insurance 13,001 22,378 30,401 81,424501.506 - Dental Insurance 3,407 3,711 4,566 7,685501.507 - Medicare 5,373 5,381 6,981 11,240501.508 - Life Insurance 1,861 1,709 2,160 3,635501.509 - Long Term Disability 2,305 2,933 3,987 6,705501.510 - Workers Compensation 1,789 9,396 7,474 5,775501.511 - Vision Insurance 433 426 540 905501.513 - Rec Bucks 0 0 0 2,020501.516 - Hra City Contribution 1,240 0 0 0
10 - Employee benefits Total 112,010 127,546 169,383 326,65815 - Materials
600.601 - General Office Supplies 255 2,000 2,000 410600.602 - Printing and Duplication 657 1,077 2,000 0600.608 - Sml Tools and Equipment 0 0 0 132600.613 - General Supplies 1,160 3,783 4,200 1,664600.629 - Conference and Training 2,547 0 2,000 5,775600.632 - Mileage Reimbursement 0 0 200 63600.642 - Telphone and Data Services 2,566 2,814 2,900 2,658600.647 - Memberships and Dues 0 0 0 3,203600.650 - Special Dept Expense 0 0 0 1,197
15 - Materials Total 7,185 9,675 13,300 15,10220 - Contract services
700.701 - Training and Instruction 0 2,040 3,000 0700.702 - General Service Agreement 95,691 23,620 0 15,904700.704 - Insurance Fees, Claims, Premiums 3,334 350 0 0
20 - Contract services Total 99,025 26,010 3,000 15,90425 - Cost allocation
800.801 - Equipment Reimbursement 0 11,450 3,089 4,086800.802 - IT Reimbursement 82,269 76,494 51,148 43,481800.805 - CC CAP Allocation 11,187 0 0 2,585800.806 - CM CAP Allocation 2,945 0 0 923800.814 - Finance CAP Alloc 12,153 0 0 11,771800.815 - Human resources CAP Alloc 32,439 0 0 6,980800.818 - PW Admin CAP 141,524 0 0 0
173

Appendix A-4 Year Expenditure Trends at the Account Level by Program
Department
FY17 Actuals
FY18 Actuals
FY19 Final Budget
FY20 Proposed
Budget800.820 - Grounds Maintenance CAP 1,994 0 0 0800.821 - Building Maintenance CAP 22,462 0 0 2,413
25 - Cost allocation Total 306,973 87,944 54,237 72,23930 - Capital outlays
900.990 - Special Projects - PW 5,000 0 0 030 - Capital outlays Total 5,000 0 0 0
35 - Contingencies719.705 - Contingencies 0 0 815 1,550
35 - Contingencies Total 0 0 815 1,550806 CIP Administration Total 904,424 625,922 739,939 1,208,694
82 Developmental Services Total 2,993,735 2,321,274 2,037,012 2,525,290
174

Appendix A-4 Year Expenditure Trends at the Account Level by Program
Department
FY17 Actuals
FY18 Actuals
FY19 Final Budget
FY20 Proposed
Budget83 Service Center
807 Service Center Administration05 - Employee compensation
500.501 - Salaries Full Time 301,929 312,998 324,787 380,956500.502 - Salaries Part Time 12,305 74,429 35,263 20,528500.504 - Stand By 3,400 9,900 8,100 18,270500.505 - Overtime 1,576 566 0 595500.513 - Sick Leave 305 925 1,160 684
05 - Employee compensation Total 319,515 398,819 369,310 421,03310 - Employee benefits
501.500 - Retirement System 80,842 80,820 87,316 101,947501.502 - Pers 1959 Surv Empr 165 170 153 209501.505 - Health Insurance 39,414 48,269 27,372 60,583501.506 - Dental Insurance 4,192 4,484 3,882 5,289501.507 - Medicare 5,155 5,735 5,218 5,822501.508 - Life Insurance 2,129 2,044 1,838 2,243501.509 - Long Term Disability 2,305 3,062 3,052 3,586501.510 - Workers Compensation 12,413 8,760 6,377 3,061501.511 - Vision Insurance 531 515 459 623501.513 - Rec Bucks 0 0 0 1,071501.516 - Hra City Contribution 24,154 0 0 0
10 - Employee benefits Total 171,300 153,860 135,667 184,43415 - Materials
600.601 - General Office Supplies 13,905 14,525 12,000 14,871600.605 - Meeting Expenses 0 0 0 4,207600.608 - Sml Tools and Equipment 1,420 25,170 0 998600.611 - Uniforms/Safety Appar 27,624 37,480 45,000 39,350600.613 - General Supplies 5,955 16,690 12,000 4,640600.629 - Conference and Training 1,174 3,323 5,000 3,938600.632 - Mileage Reimbursement 46 13 1,045 26600.642 - Telphone and Data Services 11,144 10,691 9,000 4,771600.647 - Memberships and Dues 0 0 0 3,361
15 - Materials Total 61,268 107,892 84,045 76,16220 - Contract services
700.701 - Training and Instruction 10,201 21,110 11,500 7,633700.702 - General Service Agreement 225,771 240,780 106,000 924700.703 - Maintenance of Equipment 3,546 1,019 3,500 0
20 - Contract services Total 239,519 262,909 121,000 8,55725 - Cost allocation
800.801 - Equipment Reimbursement 0 124,720 10,417 13,299800.802 - IT Reimbursement 38,182 38,727 49,863 36,285800.805 - CC CAP Allocation 10,622 8,964 8,331 12,645800.806 - CM CAP Allocation 2,845 2,776 3,612 4,667
175

Appendix A-4 Year Expenditure Trends at the Account Level by Program
Department
FY17 Actuals
FY18 Actuals
FY19 Final Budget
FY20 Proposed
Budget800.814 - Finance CAP Alloc 14,291 16,391 24,794 32,778800.815 - Human resources CAP Alloc 18,188 18,997 19,933 59,105800.817 - Community Hall/Quinlan CAP 4,791 4,202 0 0800.821 - Building Maintenance CAP 465,181 429,314 222,722 323,629
25 - Cost allocation Total 554,100 644,091 339,672 482,40830 - Capital outlays
900.905 - Facility Improvements 3,506 13,267 0 0900.990 - Special Projects - PW 235,581 26,171 175,000 0
30 - Capital outlays Total 239,087 39,438 175,000 031 - Special projects
750.005 - City Facilities Bldg Assessment 0 89,397 0 0750.030 - Water System Assessment 0 13,750 0 0750.043 - Office Reconfiguration 0 0 0 75,000
31 - Special projects Total 0 103,147 0 75,00035 - Contingencies
719.705 - Contingencies 0 0 10,252 4,23635 - Contingencies Total 0 0 10,252 4,236
807 Service Center Administration Total 1,584,789 1,710,156 1,234,946 1,251,83083 Service Center Total 1,584,789 1,710,156 1,234,946 1,251,830
176

Appendix A-4 Year Expenditure Trends at the Account Level by Program
Department
FY17 Actuals
FY18 Actuals
FY19 Final Budget
FY20 Proposed
Budget84 Grounds
808 McClellan Ranch Park05 - Employee compensation
500.501 - Salaries Full Time 25,351 28,707 28,887 29,762500.504 - Stand By 160 120 0 0500.505 - Overtime 626 565 700 594
05 - Employee compensation Total 26,137 29,393 29,587 30,35610 - Employee benefits
501.500 - Retirement System 6,867 7,102 7,789 7,961501.502 - Pers 1959 Surv Empr 17 18 18 18501.505 - Health Insurance 4,559 4,349 4,651 4,811501.506 - Dental Insurance 463 458 459 462501.507 - Medicare 404 425 421 432501.508 - Life Insurance 234 209 216 219501.509 - Long Term Disability 160 203 226 232501.510 - Workers Compensation 1,856 936 747 346501.511 - Vision Insurance 60 57 60 64501.513 - Rec Bucks 0 0 0 120501.516 - Hra City Contribution 157 0 0 0
10 - Employee benefits Total 14,777 13,758 14,587 14,66515 - Materials
600.608 - Sml Tools and Equipment 0 0 0 1,373600.611 - Uniforms/Safety Appar 80 80 80 80600.613 - General Supplies 4,515 4,998 5,817 3,840600.629 - Conference and Training 0 0 0 347600.643 - Water Services 8,478 10,276 12,816 10,995
15 - Materials Total 13,072 15,354 18,713 16,63520 - Contract services
700.702 - General Service Agreement 18,750 10,750 8,000 10,08020 - Contract services Total 18,750 10,750 8,000 10,080
25 - Cost allocation800.801 - Equipment Reimbursement 0 0 5,876 7,517800.802 - IT Reimbursement 4,228 956 5,910 4,301800.805 - CC CAP Allocation 0 0 0 756800.806 - CM CAP Allocation 0 0 0 270800.811 - Public Affairs CAP Alloc 0 0 0 1,068800.814 - Finance CAP Alloc 0 0 0 1,909800.815 - Human resources CAP Alloc 0 0 0 2,024800.821 - Building Maintenance CAP 0 0 0 700
25 - Cost allocation Total 4,228 956 11,786 18,54535 - Contingencies
719.705 - Contingencies 0 0 1,336 1,33635 - Contingencies Total 0 0 1,336 1,336
177

Appendix A-4 Year Expenditure Trends at the Account Level by Program
Department
FY17 Actuals
FY18 Actuals
FY19 Final Budget
FY20 Proposed
Budget808 McClellan Ranch Park Total 76,964 70,210 84,009 91,617
809 Memorial Park05 - Employee compensation
500.501 - Salaries Full Time 202,648 222,946 228,617 239,349500.502 - Salaries Part Time 0 0 28,485 28,119500.504 - Stand By 320 240 0 0500.505 - Overtime 10,772 10,249 7,100 10,762500.513 - Sick Leave 0 0 937 937
05 - Employee compensation Total 213,740 233,435 265,139 279,16710 - Employee benefits
501.500 - Retirement System 53,840 57,447 61,632 64,381501.502 - Pers 1959 Surv Empr 178 183 180 182501.505 - Health Insurance 39,812 43,458 44,815 46,366501.506 - Dental Insurance 4,866 4,767 4,569 4,609501.507 - Medicare 3,124 3,402 3,742 3,878501.508 - Life Insurance 2,391 2,163 2,160 2,179501.509 - Long Term Disability 1,151 1,418 1,509 1,574501.510 - Workers Compensation 19,239 9,396 7,474 3,465501.511 - Vision Insurance 582 570 562 684501.513 - Rec Bucks 0 0 0 1,213501.516 - Hra City Contribution 1,659 0 0 0
10 - Employee benefits Total 126,841 122,804 126,643 128,53115 - Materials
600.611 - Uniforms/Safety Appar 1,140 1,060 1,140 1,132600.613 - General Supplies 34,144 50,612 50,000 53,126600.629 - Conference and Training 0 0 0 3,675600.632 - Mileage Reimbursement 126 37 0 38600.641 - Electrical Service 21,546 24,411 49,434 25,631600.642 - Telphone and Data Services 6,939 7,564 6,000 8,129600.643 - Water Services 49,702 88,554 127,200 94,753
15 - Materials Total 113,597 172,237 233,774 186,48420 - Contract services
700.702 - General Service Agreement 67,602 26,216 37,550 24,65220 - Contract services Total 67,602 26,216 37,550 24,652
25 - Cost allocation800.801 - Equipment Reimbursement 0 18,000 63,364 81,061800.802 - IT Reimbursement 42,976 11,474 20,309 14,778800.805 - CC CAP Allocation 0 0 0 7,539800.806 - CM CAP Allocation 0 0 0 2,680800.811 - Public Affairs CAP Alloc 0 0 0 10,977800.814 - Finance CAP Alloc 0 0 0 8,653800.815 - Human resources CAP Alloc 0 0 0 20,801800.821 - Building Maintenance CAP 0 0 0 7,192
178

Appendix A-4 Year Expenditure Trends at the Account Level by Program
Department
FY17 Actuals
FY18 Actuals
FY19 Final Budget
FY20 Proposed
Budget25 - Cost allocation Total 42,976 29,474 83,673 153,681
30 - Capital outlays900.905 - Facility Improvements 0 47,851 0 0900.990 - Special Projects - PW 6,829 9,950 0 0
30 - Capital outlays Total 6,829 57,801 0 035 - Contingencies
719.705 - Contingencies 0 0 13,566 10,55735 - Contingencies Total 0 0 13,566 10,557
809 Memorial Park Total 571,584 641,966 760,345 783,072
179

Appendix A-4 Year Expenditure Trends at the Account Level by Program
Department
FY17 Actuals
FY18 Actuals
FY19 Final Budget
FY20 Proposed
Budget812 School Site Maintenance
05 - Employee compensation500.501 - Salaries Full Time 264,391 303,834 318,350 330,082500.504 - Stand By 1,520 1,440 0 0500.505 - Overtime 3,540 4,785 3,600 5,024
05 - Employee compensation Total 269,451 310,059 321,950 335,10610 - Employee benefits
501.500 - Retirement System 72,572 79,134 85,852 88,282501.502 - Pers 1959 Surv Empr 239 248 258 258501.505 - Health Insurance 46,243 51,343 56,549 64,434501.506 - Dental Insurance 6,588 6,453 6,550 6,605501.507 - Medicare 4,126 4,535 4,646 4,561501.508 - Life Insurance 3,231 2,991 3,096 3,125501.509 - Long Term Disability 1,531 1,896 2,073 2,136501.510 - Workers Compensation 23,280 13,464 10,712 4,966501.511 - Vision Insurance 819 803 843 985501.513 - Rec Bucks 0 0 0 1,738501.516 - Hra City Contribution 2,231 0 0 0
10 - Employee benefits Total 160,860 160,866 170,579 177,09015 - Materials
600.605 - Meeting Expenses 0 0 0 105600.611 - Uniforms/Safety Appar 1,640 1,560 1,640 1,657600.613 - General Supplies 59,532 58,944 61,800 61,890600.629 - Conference and Training 0 0 0 4,515600.632 - Mileage Reimbursement 65 91 0 96600.641 - Electrical Service 3,204 3,212 6,180 3,372600.643 - Water Services 185,735 293,565 368,040 314,114600.647 - Memberships and Dues 0 0 0 378
15 - Materials Total 250,176 357,372 437,660 386,12720 - Contract services
700.701 - Training and Instruction 0 160 13,000 0700.702 - General Service Agreement 12,000 16,396 15,000 17,217700.706 - Rent Expense 0 0 5,500 0
20 - Contract services Total 12,000 16,556 33,500 17,21725 - Cost allocation
800.801 - Equipment Reimbursement 0 79,040 85,407 109,355800.802 - IT Reimbursement 60,537 6,693 21,232 15,450800.805 - CC CAP Allocation 0 0 0 11,248800.806 - CM CAP Allocation 0 0 0 4,030800.811 - Public Affairs CAP Alloc 0 0 0 15,729800.814 - Finance CAP Alloc 0 0 0 10,189800.815 - Human resources CAP Alloc 0 0 0 29,805800.821 - Building Maintenance CAP 0 0 0 10,305
180

Appendix A-4 Year Expenditure Trends at the Account Level by Program
Department
FY17 Actuals
FY18 Actuals
FY19 Final Budget
FY20 Proposed
Budget25 - Cost allocation Total 60,537 85,733 106,639 206,111
30 - Capital outlays900.990 - Special Projects - PW 0 143,717 35,000 0
30 - Capital outlays Total 0 143,717 35,000 031 - Special projects
750.025 - Special Maintenance 0 0 0 19,50031 - Special projects Total 0 0 0 19,500
35 - Contingencies719.705 - Contingencies 0 0 23,558 20,167
35 - Contingencies Total 0 0 23,558 20,167812 School Site Maintenance Total 753,023 1,074,303 1,128,886 1,161,318
181

Appendix A-4 Year Expenditure Trends at the Account Level by Program
Department
FY17 Actuals
FY18 Actuals
FY19 Final Budget
FY20 Proposed
Budget813 Neighborhood Parks
05 - Employee compensation500.501 - Salaries Full Time 500,785 541,588 590,685 595,129500.504 - Stand By 620 240 0 0500.505 - Overtime 6,880 6,189 5,800 6,498
05 - Employee compensation Total 508,284 548,016 596,485 601,62710 - Employee benefits
501.500 - Retirement System 131,468 140,240 159,363 159,173501.502 - Pers 1959 Surv Empr 431 462 498 500501.505 - Health Insurance 78,148 80,757 90,529 113,790501.506 - Dental Insurance 12,310 12,046 12,637 12,752501.507 - Medicare 7,423 7,999 8,620 7,728501.508 - Life Insurance 6,022 5,599 5,979 6,035501.509 - Long Term Disability 2,731 3,341 3,767 3,793501.510 - Workers Compensation 62,750 25,356 20,727 9,586501.511 - Vision Insurance 1,574 1,530 1,645 1,916501.513 - Rec Bucks 0 0 0 3,354501.516 - Hra City Contribution 4,171 0 0 0
10 - Employee benefits Total 307,028 277,329 303,765 318,62715 - Materials
600.601 - General Office Supplies 0 0 0 1,774600.608 - Sml Tools and Equipment 0 0 0 13,090600.611 - Uniforms/Safety Appar 3,433 3,060 3,280 3,273600.613 - General Supplies 129,099 140,588 164,800 126,173600.629 - Conference and Training 0 0 0 8,715600.632 - Mileage Reimbursement 122 195 0 205600.641 - Electrical Service 5,568 5,712 6,238 5,998600.642 - Telphone and Data Services 0 0 0 760600.643 - Water Services 150,088 231,189 226,080 247,373600.644 - Sewer Service 0 0 400 0600.647 - Memberships and Dues 0 0 0 68
15 - Materials Total 288,310 380,745 400,798 407,42920 - Contract services
700.701 - Training and Instruction 6,996 11,415 7,000 0700.702 - General Service Agreement 145,416 67,578 65,000 72,428
20 - Contract services Total 152,412 78,994 72,000 72,42825 - Cost allocation
800.801 - Equipment Reimbursement 0 98,520 142,849 182,874800.802 - IT Reimbursement 115,540 6,693 22,965 16,711800.805 - CC CAP Allocation 0 0 0 19,259800.806 - CM CAP Allocation 0 0 0 6,808800.811 - Public Affairs CAP Alloc 0 0 0 28,806800.814 - Finance CAP Alloc 0 0 0 22,962
182

Appendix A-4 Year Expenditure Trends at the Account Level by Program
Department
FY17 Actuals
FY18 Actuals
FY19 Final Budget
FY20 Proposed
Budget800.815 - Human resources CAP Alloc 0 0 0 66,946800.821 - Building Maintenance CAP 0 0 0 18,873
25 - Cost allocation Total 115,540 105,213 165,814 363,23930 - Capital outlays
900.990 - Special Projects - PW 32,861 112,474 47,000 37,05030 - Capital outlays Total 32,861 112,474 47,000 37,050
31 - Special projects750.025 - Special Maintenance 0 0 0 12,610900.945 - Fixed Asset Acquisition 0 0 20,000 0
31 - Special projects Total 0 0 20,000 12,61035 - Contingencies
719.705 - Contingencies 0 0 23,640 23,99335 - Contingencies Total 0 0 23,640 23,993
813 Neighborhood Parks Total 1,404,435 1,502,772 1,629,502 1,837,003
183

Appendix A-4 Year Expenditure Trends at the Account Level by Program
Department
FY17 Actuals
FY18 Actuals
FY19 Final Budget
FY20 Proposed
Budget814 Sport Fields Jollyman CRK
05 - Employee compensation500.501 - Salaries Full Time 170,970 197,677 221,293 221,207500.504 - Stand By 420 240 0 0500.505 - Overtime 2,667 596 500 926
05 - Employee compensation Total 174,057 198,514 221,793 222,13310 - Employee benefits
501.500 - Retirement System 45,588 51,662 59,677 59,163501.502 - Pers 1959 Surv Empr 156 169 186 186501.505 - Health Insurance 22,949 25,016 28,622 38,919501.506 - Dental Insurance 4,226 4,408 4,721 4,761501.507 - Medicare 2,636 2,937 3,228 3,208501.508 - Life Insurance 2,078 2,047 2,234 2,253501.509 - Long Term Disability 991 1,300 1,478 1,479501.510 - Workers Compensation 21,159 9,072 7,723 3,580501.511 - Vision Insurance 542 557 610 707501.513 - Rec Bucks 0 0 0 1,253501.516 - Hra City Contribution 1,415 0 0 0
10 - Employee benefits Total 101,740 97,168 108,479 115,50915 - Materials
600.611 - Uniforms/Safety Appar 1,313 980 1,160 1,172600.613 - General Supplies 52,015 58,135 48,410 61,041600.629 - Conference and Training 0 0 0 3,255600.632 - Mileage Reimbursement 8 95 0 100600.641 - Electrical Service 2,919 3,842 4,002 4,034600.643 - Water Services 95,279 143,364 170,400 153,399
15 - Materials Total 151,535 206,416 223,972 223,00120 - Contract services
700.702 - General Service Agreement 38,038 300 22,000 31520 - Contract services Total 38,038 300 22,000 315
25 - Cost allocation800.801 - Equipment Reimbursement 0 40,160 50,068 64,066800.802 - IT Reimbursement 40,885 1,912 16,930 12,319800.805 - CC CAP Allocation 0 0 0 7,046800.806 - CM CAP Allocation 0 0 0 2,493800.811 - Public Affairs CAP Alloc 0 0 0 10,498800.814 - Finance CAP Alloc 0 0 0 7,713800.815 - Human resources CAP Alloc 0 0 0 38,436800.821 - Building Maintenance CAP 0 0 0 6,878
25 - Cost allocation Total 40,885 42,072 66,998 149,44930 - Capital outlays
900.990 - Special Projects - PW 0 12,600 10,000 030 - Capital outlays Total 0 12,600 10,000 0
184
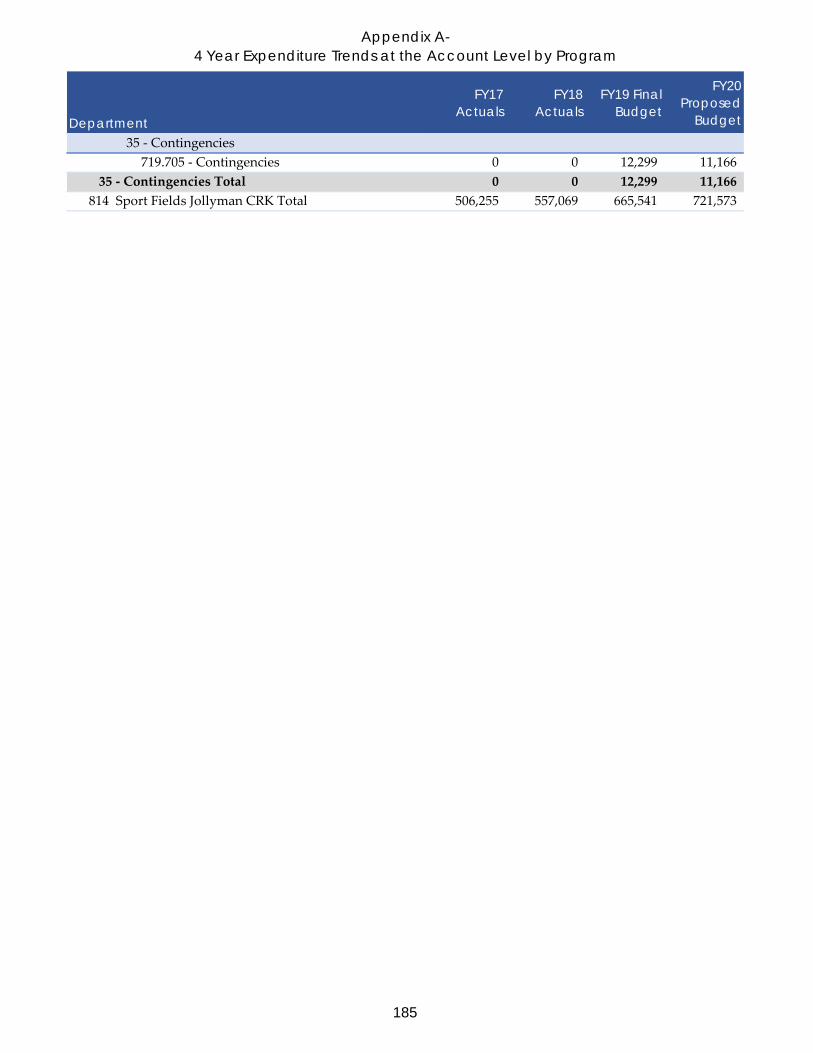
Appendix A-4 Year Expenditure Trends at the Account Level by Program
Department
FY17 Actuals
FY18 Actuals
FY19 Final Budget
FY20 Proposed
Budget35 - Contingencies
719.705 - Contingencies 0 0 12,299 11,16635 - Contingencies Total 0 0 12,299 11,166
814 Sport Fields Jollyman CRK Total 506,255 557,069 665,541 721,573
185

Appendix A-4 Year Expenditure Trends at the Account Level by Program
Department
FY17 Actuals
FY18 Actuals
FY19 Final Budget
FY20 Proposed
Budget815 Civic Center Ground Maint
05 - Employee compensation500.501 - Salaries Full Time 69,381 80,104 81,522 83,116500.504 - Stand By 1,360 1,320 0 0500.505 - Overtime 1,887 948 1,200 995
05 - Employee compensation Total 72,628 82,372 82,722 84,11110 - Employee benefits
501.500 - Retirement System 19,278 20,960 22,017 22,231501.502 - Pers 1959 Surv Empr 55 57 60 60501.505 - Health Insurance 14,119 16,153 17,679 18,284501.506 - Dental Insurance 1,489 1,492 1,523 1,538501.507 - Medicare 1,124 1,223 1,190 1,206501.508 - Life Insurance 735 689 723 729501.509 - Long Term Disability 410 516 559 560501.510 - Workers Compensation 6,207 3,132 2,491 1,155501.511 - Vision Insurance 182 183 193 226501.513 - Rec Bucks 0 0 0 402501.516 - Hra City Contribution 517 0 0 0
10 - Employee benefits Total 44,116 44,406 46,435 46,39115 - Materials
600.611 - Uniforms/Safety Appar 360 320 360 362600.613 - General Supplies 8,345 9,315 10,300 8,210600.629 - Conference and Training 0 0 0 1,050600.632 - Mileage Reimbursement 0 18 0 19600.643 - Water Services 32,187 57,283 91,704 61,293
15 - Materials Total 40,891 66,936 102,364 70,93420 - Contract services
700.702 - General Service Agreement 5,800 0 3,000 020 - Contract services Total 5,800 0 3,000 0
25 - Cost allocation800.801 - Equipment Reimbursement 0 6,050 16,168 20,684800.802 - IT Reimbursement 14,079 956 5,910 4,301800.805 - CC CAP Allocation 66,925 0 0 2,507800.806 - CM CAP Allocation 17,372 0 0 887800.811 - Public Affairs CAP Alloc 0 0 0 3,720800.814 - Finance CAP Alloc 70,279 0 0 2,410800.815 - Human resources CAP Alloc 143,682 0 0 7,050800.818 - PW Admin CAP 56,610 0 0 0800.821 - Building Maintenance CAP 0 0 0 2,438
25 - Cost allocation Total 368,947 7,006 22,078 43,99735 - Contingencies
719.705 - Contingencies 0 0 5,268 3,54735 - Contingencies Total 0 0 5,268 3,547
186

Appendix A-4 Year Expenditure Trends at the Account Level by Program
Department
FY17 Actuals
FY18 Actuals
FY19 Final Budget
FY20 Proposed
Budget815 Civic Center Ground Maint Total 532,383 200,720 261,867 248,980
84 Grounds Total 3,844,644 4,047,040 4,530,150 4,843,56385 Streets
818 Storm Drain Maintenance05 - Employee compensation
500.501 - Salaries Full Time 103,439 105,503 97,766 99,987500.502 - Salaries Part Time 23,903 11,044 28,485 28,119500.504 - Stand By 200 120 0 0500.505 - Overtime 2,947 239 350 251500.513 - Sick Leave 596 205 937 937
05 - Employee compensation Total 131,084 117,112 127,538 129,29410 - Employee benefits
501.500 - Retirement System 33,349 26,656 26,340 27,108501.502 - Pers 1959 Surv Empr 90 61 63 72501.505 - Health Insurance 14,857 15,973 16,493 18,087501.506 - Dental Insurance 2,155 2,017 1,831 1,844501.507 - Medicare 1,941 1,692 1,833 1,858501.508 - Life Insurance 1,072 929 864 873501.509 - Long Term Disability 618 719 738 747501.510 - Workers Compensation 7,135 3,756 2,989 1,386501.511 - Vision Insurance 266 250 238 265501.513 - Rec Bucks 0 0 0 484501.516 - Hra City Contribution 719 0 0 0
10 - Employee benefits Total 62,203 52,053 51,389 52,72415 - Materials
600.608 - Sml Tools and Equipment 0 0 0 2,847600.611 - Uniforms/Safety Appar 460 460 720 383600.613 - General Supplies 5,809 6,020 15,000 3,022600.629 - Conference and Training 0 0 0 1,838600.632 - Mileage Reimbursement 0 33 0 35600.642 - Telphone and Data Services 1,139 1,649 1,000 1,651
15 - Materials Total 7,408 8,162 16,720 9,77620 - Contract services
700.702 - General Service Agreement 164,269 160,525 200,000 174,796700.706 - Rent Expense 12,141 15,650 25,000 10,640
20 - Contract services Total 176,410 176,175 225,000 185,43625 - Cost allocation
800.801 - Equipment Reimbursement 0 0 4,458 5,704800.802 - IT Reimbursement 12,693 8,128 9,714 7,069800.805 - CC CAP Allocation 3,184 4,301 3,729 3,960800.806 - CM CAP Allocation 839 1,305 1,535 1,421800.814 - Finance CAP Alloc 8,459 9,587 12,014 14,954800.815 - Human resources CAP Alloc 6,184 10,209 12,320 10,400
187

Appendix A-4 Year Expenditure Trends at the Account Level by Program
Department
FY17 Actuals
FY18 Actuals
FY19 Final Budget
FY20 Proposed
Budget800.821 - Building Maintenance CAP 0 0 0 3,596
25 - Cost allocation Total 31,359 33,530 43,770 47,10435 - Contingencies
719.705 - Contingencies 0 0 12,086 9,76135 - Contingencies Total 0 0 12,086 9,761
818 Storm Drain Maintenance Total 408,465 387,031 476,503 434,095
188

Appendix A-4 Year Expenditure Trends at the Account Level by Program
Department
FY17 Actuals
FY18 Actuals
FY19 Final Budget
FY20 Proposed
Budget820 Sidewalk Curb and Gutter
05 - Employee compensation500.501 - Salaries Full Time 68,074 93,934 123,939 126,640500.504 - Stand By 975 630 0 0500.505 - Overtime 2,549 7,535 5,400 7,912
05 - Employee compensation Total 71,599 102,099 129,339 134,55210 - Employee benefits
501.500 - Retirement System 17,863 23,526 33,443 33,872501.502 - Pers 1959 Surv Empr 47 61 80 79501.505 - Health Insurance 12,366 18,636 24,615 25,467501.506 - Dental Insurance 1,368 1,665 1,985 1,999501.507 - Medicare 1,070 1,472 1,808 1,835501.508 - Life Insurance 676 764 1,066 943501.509 - Long Term Disability 347 553 792 1,249501.510 - Workers Compensation 4,660 4,068 3,239 1,501501.511 - Vision Insurance 189 226 291 253501.513 - Rec Bucks 0 0 0 524501.516 - Hra City Contribution 451 0 0 0
10 - Employee benefits Total 39,037 50,970 67,319 67,72215 - Materials
600.601 - General Office Supplies 0 0 0 92600.608 - Sml Tools and Equipment 0 0 0 183600.611 - Uniforms/Safety Appar 320 320 320 120600.613 - General Supplies 3,085 1,765 2,621 1,505600.629 - Conference and Training 0 0 0 1,365600.632 - Mileage Reimbursement 12 17 0 18600.642 - Telphone and Data Services (3,276) 1,730 788 1,634600.647 - Memberships and Dues 0 0 0 278
15 - Materials Total 142 3,833 3,729 5,19520 - Contract services
700.701 - Training and Instruction 0 80 1,000 0700.702 - General Service Agreement 0 0 30,000 0
20 - Contract services Total 0 80 31,000 025 - Cost allocation
800.801 - Equipment Reimbursement 0 17,640 11,789 15,081800.802 - IT Reimbursement 13,051 20,558 24,729 17,995800.805 - CC CAP Allocation 6,054 5,448 3,759 5,350800.806 - CM CAP Allocation 1,701 1,840 1,701 2,088800.809 - City Clerk CAP Alloc 3,900 2,261 2,255 2,790800.814 - Finance CAP Alloc 13,545 14,954 12,524 16,227800.815 - Human resources CAP Alloc 6,184 5,410 5,996 7,539800.821 - Building Maintenance CAP 0 0 0 2,607
25 - Cost allocation Total 44,435 68,111 62,753 69,677
189

Appendix A-4 Year Expenditure Trends at the Account Level by Program
Department
FY17 Actuals
FY18 Actuals
FY19 Final Budget
FY20 Proposed
Budget30 - Capital outlays
900.990 - Special Projects - PW 0 35,000 0 030 - Capital outlays Total 0 35,000 0 0
31 - Special projects750.020 - Annual Sidewalk Curb & Gutter 0 0 900,000 1,100,000900.922 - Annual SW Curb Gutter 825,140 879,385 0 0
31 - Special projects Total 825,140 879,385 900,000 1,100,00035 - Contingencies
719.705 - Contingencies 0 0 1,736 26035 - Contingencies Total 0 0 1,736 260
820 Sidewalk Curb and Gutter Total 980,352 1,139,478 1,195,876 1,377,406
190

Appendix A-4 Year Expenditure Trends at the Account Level by Program
Department
FY17 Actuals
FY18 Actuals
FY19 Final Budget
FY20 Proposed
Budget821 Street Pavement Maintenance
05 - Employee compensation500.501 - Salaries Full Time 248,661 260,737 257,018 265,725500.502 - Salaries Part Time 0 11,044 28,485 28,119500.504 - Stand By 1,950 720 0 0500.505 - Overtime 3,536 2,778 2,600 2,917500.513 - Sick Leave 0 205 937 937
05 - Employee compensation Total 254,147 275,484 289,040 297,69810 - Employee benefits
501.500 - Retirement System 66,817 66,241 69,299 71,437501.502 - Pers 1959 Surv Empr 163 162 166 201501.505 - Health Insurance 40,421 45,244 49,146 50,506501.506 - Dental Insurance 5,553 5,174 5,103 5,150501.507 - Medicare 3,768 3,912 4,092 4,195501.508 - Life Insurance 2,735 2,403 2,419 2,437501.509 - Long Term Disability 1,413 1,654 1,749 1,814501.510 - Workers Compensation 14,908 10,488 8,370 3,869501.511 - Vision Insurance 706 657 682 760501.513 - Rec Bucks 0 0 0 1,353501.516 - Hra City Contribution 1,849 0 0 0
10 - Employee benefits Total 138,331 135,934 141,026 141,72215 - Materials
600.608 - Sml Tools and Equipment 0 0 0 2,392600.611 - Uniforms/Safety Appar 1,340 1,340 1,380 1,212600.613 - General Supplies 35,436 31,920 58,500 30,960600.629 - Conference and Training 0 0 0 4,043600.632 - Mileage Reimbursement 51 70 0 74600.642 - Telphone and Data Services 848 76 2,200 80
15 - Materials Total 37,675 33,406 62,080 38,76120 - Contract services
700.702 - General Service Agreement 137,388 35,426 175,000 192,570700.706 - Rent Expense 0 0 1,000 0
20 - Contract services Total 137,388 35,426 176,000 192,57025 - Cost allocation
800.801 - Equipment Reimbursement 0 8,070 76,568 97,952800.802 - IT Reimbursement 56,439 32,990 15,680 11,410800.805 - CC CAP Allocation 34,728 39,978 23,620 35,235800.806 - CM CAP Allocation 10,000 13,953 11,025 14,399800.814 - Finance CAP Alloc 26,129 29,225 23,511 31,541800.815 - Human resources CAP Alloc 22,553 21,424 23,741 24,779800.821 - Building Maintenance CAP 0 0 0 8,568
25 - Cost allocation Total 149,849 145,640 174,145 223,88430 - Capital outlays
191

Appendix A-4 Year Expenditure Trends at the Account Level by Program
Department
FY17 Actuals
FY18 Actuals
FY19 Final Budget
FY20 Proposed
Budget900.971 - SB1 Roads 0 0 978,379 1,000,000900.990 - Special Projects - PW 51,830 479,999 0 0
30 - Capital outlays Total 51,830 479,999 978,379 1,000,00031 - Special projects
900.921 - Annual Asphalt Project 6,625,393 8,754,931 5,000,000 2,000,00031 - Special projects Total 6,625,393 8,754,931 5,000,000 2,000,000
35 - Contingencies719.705 - Contingencies 0 0 11,904 11,567
35 - Contingencies Total 0 0 11,904 11,567821 Street Pavement Maintenance Total 7,394,614 9,860,821 6,832,574 3,906,202
192

Appendix A-4 Year Expenditure Trends at the Account Level by Program
Department
FY17 Actuals
FY18 Actuals
FY19 Final Budget
FY20 Proposed
Budget822 Street Sign Marking
05 - Employee compensation500.501 - Salaries Full Time 260,001 268,561 261,772 271,302500.504 - Stand By 2,150 750 0 0500.505 - Overtime 9,987 7,416 6,300 7,787
05 - Employee compensation Total 272,138 276,727 268,072 279,08910 - Employee benefits
501.500 - Retirement System 70,442 68,511 70,615 72,561501.502 - Pers 1959 Surv Empr 192 181 171 210501.505 - Health Insurance 45,484 49,561 52,149 53,255501.506 - Dental Insurance 6,097 5,539 5,331 5,376501.507 - Medicare 3,678 3,762 3,753 3,867501.508 - Life Insurance 2,991 2,559 2,536 2,544501.509 - Long Term Disability 1,457 1,675 1,728 1,798501.510 - Workers Compensation 16,764 10,956 8,719 4,042501.511 - Vision Insurance 774 707 721 797501.513 - Rec Bucks 0 0 0 1,414501.516 - Hra City Contribution 1,979 0 0 0
10 - Employee benefits Total 149,858 143,452 145,723 145,86415 - Materials
600.605 - Meeting Expenses 0 0 0 84600.608 - Sml Tools and Equipment 0 0 0 1,116600.611 - Uniforms/Safety Appar 1,480 1,480 1,600 1,313600.613 - General Supplies 96,696 118,808 106,628 123,316600.629 - Conference and Training 0 0 0 3,675600.632 - Mileage Reimbursement 108 226 0 237600.642 - Telphone and Data Services 392 0 1,000 0600.647 - Memberships and Dues 0 0 0 42
15 - Materials Total 98,676 120,513 109,228 129,78320 - Contract services
700.701 - Training and Instruction 582 6,652 2,000 0700.702 - General Service Agreement 8,014 32,682 15,000 34,316
20 - Contract services Total 8,596 39,335 17,000 34,31625 - Cost allocation
800.801 - Equipment Reimbursement 0 172,700 14,835 18,979800.802 - IT Reimbursement 59,159 43,507 47,402 34,494800.805 - CC CAP Allocation 12,912 10,158 7,180 9,239800.806 - CM CAP Allocation 3,360 3,096 2,918 3,306800.814 - Finance CAP Alloc 13,780 15,025 17,908 22,841800.815 - Human resources CAP Alloc 27,281 23,542 25,312 24,640800.821 - Building Maintenance CAP 0 0 0 8,519
25 - Cost allocation Total 116,492 268,028 115,555 122,01831 - Special projects
193

Appendix A-4 Year Expenditure Trends at the Account Level by Program
Department
FY17 Actuals
FY18 Actuals
FY19 Final Budget
FY20 Proposed
Budget900.945 - Fixed Asset Acquisition 0 19,308 0 0
31 - Special projects Total 0 19,308 0 035 - Contingencies
719.705 - Contingencies 0 0 6,311 8,20535 - Contingencies Total 0 0 6,311 8,205
822 Street Sign Marking Total 645,761 867,363 661,889 719,275
194

Appendix A-4 Year Expenditure Trends at the Account Level by Program
Department
FY17 Actuals
FY18 Actuals
FY19 Final Budget
FY20 Proposed
Budget848 Street Lighting
05 - Employee compensation500.501 - Salaries Full Time 30,802 63,953 88,188 89,110500.505 - Overtime 1,560 2,111 2,500 16,641
05 - Employee compensation Total 32,362 66,064 90,688 105,75110 - Employee benefits
501.500 - Retirement System 8,128 16,183 23,805 23,834501.502 - Pers 1959 Surv Empr 21 40 58 58501.505 - Health Insurance 4,835 10,518 15,295 15,825501.506 - Dental Insurance 578 1,087 1,447 1,460501.507 - Medicare 98 112 85 86501.508 - Life Insurance 286 491 684 690501.509 - Long Term Disability 180 384 560 564501.510 - Workers Compensation 2,165 2,976 2,392 1,097501.511 - Vision Insurance 66 123 171 218501.513 - Rec Bucks 0 0 0 384501.516 - Hra City Contribution 187 0 0 0
10 - Employee benefits Total 16,544 31,914 44,497 44,21615 - Materials
600.601 - General Office Supplies 0 0 0 29600.605 - Meeting Expenses 0 0 0 289600.608 - Sml Tools and Equipment 0 0 0 103600.611 - Uniforms/Safety Appar 120 120 120 364600.613 - General Supplies 55,330 37,752 40,976 36,341600.618 - Utilities and Phone 0 0 1,050 0600.629 - Conference and Training 0 0 0 998600.632 - Mileage Reimbursement 51 7 0 35600.641 - Electrical Service 180,087 216,629 234,223 227,460600.642 - Telphone and Data Services 1,735 1,588 1,400 1,667600.647 - Memberships and Dues 0 0 0 2,520
15 - Materials Total 237,323 256,096 277,769 269,80620 - Contract services
700.701 - Training and Instruction 367 275 4,000 0700.702 - General Service Agreement 3,000 2,313 20,000 2,429
20 - Contract services Total 3,367 2,588 24,000 2,42925 - Cost allocation
800.801 - Equipment Reimbursement 0 8,220 7,376 9,436800.802 - IT Reimbursement 5,027 478 15,945 11,603800.805 - CC CAP Allocation 2,843 2,286 1,378 2,506800.806 - CM CAP Allocation 806 774 620 949800.814 - Finance CAP Alloc 8,037 8,487 11,508 18,942800.815 - Human resources CAP Alloc 2,546 2,192 2,372 4,677800.821 - Building Maintenance CAP 0 0 0 1,617
195

Appendix A-4 Year Expenditure Trends at the Account Level by Program
Department
FY17 Actuals
FY18 Actuals
FY19 Final Budget
FY20 Proposed
Budget25 - Cost allocation Total 19,259 22,437 39,199 49,730
30 - Capital outlays900.990 - Special Projects - PW 35,260 46,129 97,000 0
30 - Capital outlays Total 35,260 46,129 97,000 031 - Special projects
750.025 - Special Maintenance 0 0 0 11,50031 - Special projects Total 0 0 0 11,500
35 - Contingencies719.705 - Contingencies 0 0 15,088 13,612
35 - Contingencies Total 0 0 15,088 13,612848 Street Lighting Total 344,115 425,228 588,241 497,044
196

Appendix A-4 Year Expenditure Trends at the Account Level by Program
Department
FY17 Actuals
FY18 Actuals
FY19 Final Budget
FY20 Proposed
Budget849 Equipment Maintenance
05 - Employee compensation500.501 - Salaries Full Time 219,374 249,449 244,941 242,245500.502 - Salaries Part Time 4,492 24,524 24,997 0500.504 - Stand By 1,300 900 0 0500.505 - Overtime 5,083 6,212 7,400 6,523500.513 - Sick Leave 0 124 823 0
05 - Employee compensation Total 230,249 281,210 278,161 248,76810 - Employee benefits
501.500 - Retirement System 433,493 93,404 66,063 64,790501.502 - Pers 1959 Surv Empr 98 118 120 183501.505 - Health Insurance 26,280 44,676 39,872 48,110501.506 - Dental Insurance 4,319 4,625 4,566 4,611501.507 - Medicare 3,276 3,981 3,928 3,513501.508 - Life Insurance 2,107 2,143 2,160 2,181501.509 - Long Term Disability 1,149 1,424 1,495 1,481501.510 - Workers Compensation 19,239 9,396 7,474 3,465501.511 - Vision Insurance 537 582 590 696501.513 - Rec Bucks 0 0 0 1,212501.516 - Hra City Contribution 1,524 0 0 0
10 - Employee benefits Total 492,022 160,348 126,268 130,24215 - Materials
600.601 - General Office Supplies 204,349 0 0 281600.605 - Meeting Expenses 0 0 0 147600.608 - Sml Tools and Equipment 8,984 23,888 25,000 9,233600.609 - Equipment Parts 36,965 31,873 40,000 35,697600.610 - Auto Parts/Supplies 57,042 46,286 46,000 49,320600.611 - Uniforms/Safety Appar 1,293 1,200 2,400 1,212600.612 - Fuel 109,901 135,133 166,311 141,900600.613 - General Supplies 40,773 54,194 50,000 59,803600.618 - Utilities and Phone 0 0 818 0600.629 - Conference and Training 0 0 0 3,675600.632 - Mileage Reimbursement 402 264 0 278600.642 - Telphone and Data Services 901 1,347 1,150 660600.647 - Memberships and Dues 0 0 0 273
15 - Materials Total 460,611 294,185 331,679 302,47920 - Contract services
700.701 - Training and Instruction 1,592 5,276 5,000 0700.702 - General Service Agreement 81,273 63,459 95,000 66,969700.703 - Maintenance of Equipment 64,632 13,754 40,000 14,430
20 - Contract services Total 147,496 82,489 140,000 81,39925 - Cost allocation
800.801 - Equipment Reimbursement 0 0 22,134 28,316
197

Appendix A-4 Year Expenditure Trends at the Account Level by Program
Department
FY17 Actuals
FY18 Actuals
FY19 Final Budget
FY20 Proposed
Budget800.802 - IT Reimbursement 41,045 38,247 51,263 37,303800.805 - CC CAP Allocation 12,324 9,265 7,937 11,134800.806 - CM CAP Allocation 3,301 2,959 3,433 4,122800.814 - Finance CAP Alloc 13,981 17,902 24,987 33,539800.815 - Human resources CAP Alloc 31,712 27,030 31,369 24,361800.821 - Building Maintenance CAP 0 0 0 8,423
25 - Cost allocation Total 102,363 95,403 141,123 147,19830 - Capital outlays
900.990 - Special Projects - PW 10,486 22,456 0 030 - Capital outlays Total 10,486 22,456 0 0
35 - Contingencies719.705 - Contingencies 0 0 23,584 19,194
35 - Contingencies Total 0 0 23,584 19,19450 - Other financing uses
800.904 - Depreciation Expenses 39,602 635,094 552,845 050 - Other financing uses Total 39,602 635,094 552,845 0
849 Equipment Maintenance Total 1,482,830 1,571,185 1,593,660 929,280
198

Appendix A-4 Year Expenditure Trends at the Account Level by Program
Department
FY17 Actuals
FY18 Actuals
FY19 Final Budget
FY20 Proposed
Budget850 Environmental Materials
05 - Employee compensation500.501 - Salaries Full Time 45,316 53,789 56,292 57,340500.504 - Stand By 300 165 0 0500.505 - Overtime 479 376 250 395
05 - Employee compensation Total 46,095 54,331 56,542 57,73510 - Employee benefits
501.500 - Retirement System 11,696 13,396 15,189 15,336501.502 - Pers 1959 Surv Empr 14 15 18 39501.505 - Health Insurance 5,540 7,403 8,717 9,021501.506 - Dental Insurance 810 915 993 999501.507 - Medicare 684 785 823 831501.508 - Life Insurance 404 421 468 472501.509 - Long Term Disability 266 347 403 403501.510 - Workers Compensation 1,547 2,040 1,644 751501.511 - Vision Insurance 99 112 128 147501.513 - Rec Bucks 0 0 0 262501.516 - Hra City Contribution 275 0 0 0
10 - Employee benefits Total 21,334 25,434 28,383 28,26115 - Materials
600.601 - General Office Supplies 0 0 0 170600.611 - Uniforms/Safety Appar 180 180 220 222600.613 - General Supplies 2,917 1,792 3,800 3,721600.616 - Haz Material Mgmt 23,499 14,168 38,000 14,157600.629 - Conference and Training 0 0 0 683600.632 - Mileage Reimbursement 4 17 0 18600.635 - Special Departmental Exp 0 0 0 719600.642 - Telphone and Data Services 2,860 2,288 2,460 2,914600.647 - Memberships and Dues 0 0 0 2,016
15 - Materials Total 29,460 18,445 44,480 24,62020 - Contract services
700.701 - Training and Instruction 4,624 8,795 5,000 0700.702 - General Service Agreement 730 330 0 0
20 - Contract services Total 5,354 9,125 5,000 025 - Cost allocation
800.801 - Equipment Reimbursement 0 29,360 2,965 3,793800.802 - IT Reimbursement 9,156 8,127 39,023 28,397800.805 - CC CAP Allocation 1,480 1,541 1,116 1,605800.806 - CM CAP Allocation 396 473 460 577800.814 - Finance CAP Alloc 8,408 9,203 10,901 13,901800.815 - Human resources CAP Alloc 2,546 3,433 3,664 4,188800.821 - Building Maintenance CAP 0 0 0 1,448
25 - Cost allocation Total 21,986 52,137 58,129 53,909
199

Appendix A-4 Year Expenditure Trends at the Account Level by Program
Department
FY17 Actuals
FY18 Actuals
FY19 Final Budget
FY20 Proposed
Budget35 - Contingencies
719.705 - Contingencies 0 0 2,474 1,23135 - Contingencies Total 0 0 2,474 1,231
50 - Other financing uses701.702 - Special Contracts 0 0 0 347
50 - Other financing uses Total 0 0 0 347850 Environmental Materials Total 124,230 159,471 195,008 166,103
85 Streets Total 11,380,366 14,410,577 11,543,751 8,029,405
200

Appendix A-4 Year Expenditure Trends at the Account Level by Program
Department
FY17 Actuals
FY18 Actuals
FY19 Final Budget
FY20 Proposed
Budget86 Trees and Right of Way
824 Overpasses and Medians05 - Employee compensation
500.501 - Salaries Full Time 421,212 432,476 466,934 459,888500.504 - Stand By 0 300 0 0500.505 - Overtime 12,496 11,116 7,500 11,672
05 - Employee compensation Total 433,708 443,892 474,434 471,56010 - Employee benefits
501.500 - Retirement System 111,360 111,980 125,849 123,002501.502 - Pers 1959 Surv Empr 352 371 378 384501.505 - Health Insurance 63,618 79,860 82,992 86,059501.506 - Dental Insurance 9,702 9,718 9,589 9,683501.507 - Medicare 6,435 6,414 6,810 6,667501.508 - Life Insurance 4,759 4,488 4,536 4,580501.509 - Long Term Disability 2,292 2,724 3,040 3,005501.510 - Workers Compensation 37,550 19,716 15,695 7,276501.511 - Vision Insurance 1,105 1,118 1,134 1,446501.513 - Rec Bucks 0 0 0 2,545501.516 - Hra City Contribution 3,292 0 0 0
10 - Employee benefits Total 240,466 236,388 250,023 244,64715 - Materials
600.601 - General Office Supplies 0 0 0 202600.605 - Meeting Expenses 0 0 0 378600.608 - Sml Tools and Equipment 0 0 0 7,462600.611 - Uniforms/Safety Appar 2,500 2,667 2,800 2,424600.613 - General Supplies 43,798 35,980 45,000 48,669600.617 - Irrigation Improvement 20,348 42,177 35,000 41,334600.629 - Conference and Training 0 0 0 6,615600.632 - Mileage Reimbursement 0 477 0 501600.641 - Electrical Service 8,680 8,260 17,120 8,673600.642 - Telphone and Data Services 2,096 3,153 2,000 3,081600.643 - Water Services 72,105 103,007 100,000 110,259600.647 - Memberships and Dues 0 0 0 662
15 - Materials Total 149,526 195,719 201,920 230,26020 - Contract services
700.701 - Training and Instruction 6,763 14,460 8,000 0700.702 - General Service Agreement 60,890 49,674 75,000 19,725
20 - Contract services Total 67,654 64,134 83,000 19,72525 - Cost allocation
800.801 - Equipment Reimbursement 0 111,850 104,663 133,895800.802 - IT Reimbursement 102,866 43,985 41,737 30,372800.805 - CC CAP Allocation 43,599 18,544 11,907 14,917800.806 - CM CAP Allocation 11,064 5,578 4,871 5,280
201

Appendix A-4 Year Expenditure Trends at the Account Level by Program
Department
FY17 Actuals
FY18 Actuals
FY19 Final Budget
FY20 Proposed
Budget800.814 - Finance CAP Alloc 33,811 22,498 23,844 32,235800.815 - Human resources CAP Alloc 106,943 45,968 40,629 42,020800.821 - Building Maintenance CAP 0 0 0 14,529
25 - Cost allocation Total 298,283 248,423 227,651 273,24830 - Capital outlays
900.990 - Special Projects - PW 288 0 0 030 - Capital outlays Total 288 0 0 0
35 - Contingencies719.705 - Contingencies 0 0 14,246 12,150
35 - Contingencies Total 0 0 14,246 12,150824 Overpasses and Medians Total 1,189,925 1,188,557 1,251,274 1,251,590
202

Appendix A-4 Year Expenditure Trends at the Account Level by Program
Department
FY17 Actuals
FY18 Actuals
FY19 Final Budget
FY20 Proposed
Budget825 Street Tree Maintenance
05 - Employee compensation500.501 - Salaries Full Time 426,023 468,237 495,148 572,257500.504 - Stand By 1,200 300 0 0500.505 - Overtime 15,271 16,753 8,600 17,591
05 - Employee compensation Total 442,495 485,290 503,748 589,84810 - Employee benefits
501.500 - Retirement System 109,631 118,690 133,219 153,055501.502 - Pers 1959 Surv Empr 402 413 444 511501.505 - Health Insurance 66,155 93,269 115,675 119,315501.506 - Dental Insurance 10,694 10,515 11,263 12,895501.507 - Medicare 6,456 6,906 7,225 8,298501.508 - Life Insurance 5,311 4,891 5,328 6,100501.509 - Long Term Disability 2,332 2,881 3,302 3,780501.510 - Workers Compensation 41,651 23,160 18,435 8,547501.511 - Vision Insurance 1,222 1,213 1,382 1,926501.513 - Rec Bucks 0 0 0 2,990501.516 - Hra City Contribution 3,378 0 0 0
10 - Employee benefits Total 247,231 261,940 296,273 317,41715 - Materials
600.601 - General Office Supplies 0 0 0 92600.605 - Meeting Expenses 0 0 0 662600.608 - Sml Tools and Equipment 0 0 0 37,378600.611 - Uniforms/Safety Appar 2,967 3,400 2,400 3,228600.613 - General Supplies 101,378 106,333 105,000 71,218600.629 - Conference and Training 0 0 0 7,770600.632 - Mileage Reimbursement 467 706 0 740600.642 - Telphone and Data Services 2,875 2,731 3,600 2,868600.643 - Water Services 2,848 3,740 7,000 0600.647 - Memberships and Dues 0 0 0 3,109
15 - Materials Total 110,534 116,910 118,000 127,06520 - Contract services
700.701 - Training and Instruction 2,686 1,250 7,400 0700.702 - General Service Agreement 11,732 10,600 20,000 11,130700.706 - Rent Expense 3,823 0 0 0
20 - Contract services Total 18,241 11,850 27,400 11,13025 - Cost allocation
800.801 - Equipment Reimbursement 0 162,350 93,001 118,975800.802 - IT Reimbursement 90,053 17,212 52,737 36,620800.805 - CC CAP Allocation 4,755 14,689 12,507 16,522800.806 - CM CAP Allocation 1,428 4,421 5,031 5,798800.814 - Finance CAP Alloc 8,572 18,469 22,806 31,478800.815 - Human resources CAP Alloc 0 36,318 46,214 48,442
203

Appendix A-4 Year Expenditure Trends at the Account Level by Program
Department
FY17 Actuals
FY18 Actuals
FY19 Final Budget
FY20 Proposed
Budget800.821 - Building Maintenance CAP 0 0 0 16,749
25 - Cost allocation Total 104,808 253,459 232,296 274,58430 - Capital outlays
900.990 - Special Projects - PW 8,107 0 0 030 - Capital outlays Total 8,107 0 0 0
31 - Special projects900.911 - Trees and Badges 5,315 6,751 10,000 12,000
31 - Special projects Total 5,315 6,751 10,000 12,00035 - Contingencies
719.705 - Contingencies 0 0 7,270 6,89035 - Contingencies Total 0 0 7,270 6,890
825 Street Tree Maintenance Total 936,730 1,136,200 1,194,987 1,338,934
204

Appendix A-4 Year Expenditure Trends at the Account Level by Program
Department
FY17 Actuals
FY18 Actuals
FY19 Final Budget
FY20 Proposed
Budget826 Weekend Work Program
05 - Employee compensation500.501 - Salaries Full Time 204,929 199,380 203,780 168,868500.502 - Salaries Part Time 23,772 38,409 56,971 56,238500.505 - Overtime 4,617 6,136 3,600 6,443500.513 - Sick Leave 596 0 1,874 1,874
05 - Employee compensation Total 233,914 243,924 266,225 233,42310 - Employee benefits
501.500 - Retirement System 54,656 51,467 54,999 45,898501.502 - Pers 1959 Surv Empr 155 149 138 140501.505 - Health Insurance 25,671 26,436 24,907 26,092501.506 - Dental Insurance 4,245 3,812 3,501 3,535501.507 - Medicare 3,482 4,314 3,784 3,264501.508 - Life Insurance 2,096 1,758 1,657 1,672501.509 - Long Term Disability 984 1,256 1,315 1,206501.510 - Workers Compensation 22,211 8,448 5,730 2,656501.511 - Vision Insurance 543 482 464 518501.513 - Rec Bucks 0 0 0 929501.516 - Hra City Contribution 1,443 0 0 0
10 - Employee benefits Total 115,487 98,122 96,495 85,91015 - Materials
600.608 - Sml Tools and Equipment 0 0 0 109600.611 - Uniforms/Safety Appar 960 967 800 808600.613 - General Supplies 2,215 4,173 9,000 4,473600.629 - Conference and Training 0 0 0 3,465600.632 - Mileage Reimbursement 11 0 0 0600.642 - Telphone and Data Services 1,040 1,210 800 1,353600.647 - Memberships and Dues 0 0 0 68
15 - Materials Total 4,225 6,350 10,600 10,27620 - Contract services
700.701 - Training and Instruction 45 0 2,300 020 - Contract services Total 45 0 2,300 0
25 - Cost allocation800.801 - Equipment Reimbursement 0 33,500 44,093 56,382800.802 - IT Reimbursement 37,998 5,737 7,576 5,513800.805 - CC CAP Allocation 8,585 6,854 5,481 7,200800.806 - CM CAP Allocation 2,205 2,054 2,210 2,508800.814 - Finance CAP Alloc 6,429 11,392 13,801 18,664800.815 - Human resources CAP Alloc 19,643 17,303 20,050 21,848800.821 - Building Maintenance CAP 0 0 0 7,554
25 - Cost allocation Total 74,860 76,840 93,211 119,66935 - Contingencies
719.705 - Contingencies 0 0 645 514
205

Appendix A-4 Year Expenditure Trends at the Account Level by Program
Department
FY17 Actuals
FY18 Actuals
FY19 Final Budget
FY20 Proposed
Budget35 - Contingencies Total 0 0 645 514
826 Weekend Work Program Total 428,531 425,236 469,476 449,79286 Trees and Right of Way Total 2,555,186 2,749,993 2,915,737 3,040,316
87 Facilities and Fleet827 Bldg Maint City Hall
05 - Employee compensation500.501 - Salaries Full Time 91,573 87,149 93,101 94,398500.504 - Stand By 70 0 0 0500.505 - Overtime 1,222 5,668 6,100 8,230
05 - Employee compensation Total 92,865 92,817 99,201 102,62810 - Employee benefits
501.500 - Retirement System 23,506 22,554 25,114 25,247501.502 - Pers 1959 Surv Empr 23 23 24 60501.505 - Health Insurance 12,921 14,007 14,595 15,099501.506 - Dental Insurance 1,564 1,526 1,524 1,537501.507 - Medicare 1,358 1,525 1,357 1,369501.508 - Life Insurance 780 694 720 727501.509 - Long Term Disability 535 586 671 678501.510 - Workers Compensation 8,063 3,132 2,491 1,155501.511 - Vision Insurance 217 211 216 221501.513 - Rec Bucks 0 0 0 403501.516 - Hra City Contribution 524 0 0 0
10 - Employee benefits Total 49,491 44,258 46,712 46,49615 - Materials
600.601 - General Office Supplies 221 0 0 0600.611 - Uniforms/Safety Appar 320 320 320 322600.613 - General Supplies 27,916 22,448 40,000 23,445600.620 - Gas Service 7,755 9,630 11,770 10,112600.629 - Conference and Training 0 0 0 1,050600.632 - Mileage Reimbursement 0 33 0 34600.635 - Special Departmental Exp 0 0 0 37600.641 - Electrical Service 93,342 105,244 123,585 110,506600.642 - Telphone and Data Services 36,213 34,515 35,000 1,239600.643 - Water Services 4,648 5,959 5,760 6,376600.644 - Sewer Service 2,010 3,705 13,500 3,890600.647 - Memberships and Dues 0 0 0 90
15 - Materials Total 172,426 181,854 229,935 157,10120 - Contract services
700.701 - Training and Instruction 7,103 4,563 10,000 0700.702 - General Service Agreement 107,636 134,632 147,000 235,389
20 - Contract services Total 114,738 139,195 157,000 235,38925 - Cost allocation
800.801 - Equipment Reimbursement 0 10,230 27,993 35,811
206

Appendix A-4 Year Expenditure Trends at the Account Level by Program
Department
FY17 Actuals
FY18 Actuals
FY19 Final Budget
FY20 Proposed
Budget800.802 - IT Reimbursement 14,198 23,905 24,562 17,873800.805 - CC CAP Allocation 0 0 0 3,332800.806 - CM CAP Allocation 0 0 0 1,249800.811 - Public Affairs CAP Alloc 0 0 0 3,536800.814 - Finance CAP Alloc 0 0 0 4,746800.815 - Human resources CAP Alloc 0 0 0 12,882800.821 - Building Maintenance CAP 44,379 0 0 2,317
25 - Cost allocation Total 58,577 34,135 52,555 81,74630 - Capital outlays
900.990 - Special Projects - PW 4,300 27,341 15,000 030 - Capital outlays Total 4,300 27,341 15,000 0
35 - Contingencies719.705 - Contingencies 0 0 19,347 19,625
35 - Contingencies Total 0 0 19,347 19,625827 Bldg Maint City Hall Total 492,397 519,600 619,750 642,985
207

Appendix A-4 Year Expenditure Trends at the Account Level by Program
Department
FY17 Actuals
FY18 Actuals
FY19 Final Budget
FY20 Proposed
Budget828 Bldg Maint Library
05 - Employee compensation500.501 - Salaries Full Time 59,461 58,882 64,111 67,075500.505 - Overtime 739 2,170 1,800 0
05 - Employee compensation Total 60,200 61,052 65,911 67,07510 - Employee benefits
501.500 - Retirement System 15,151 15,152 17,289 17,939501.502 - Pers 1959 Surv Empr 40 40 42 48501.505 - Health Insurance 10,180 11,359 11,859 12,268501.506 - Dental Insurance 1,269 1,220 1,222 1,230501.507 - Medicare 879 974 937 973501.508 - Life Insurance 627 562 576 582501.509 - Long Term Disability 350 400 449 463501.510 - Workers Compensation 6,650 3,601 1,993 924501.511 - Vision Insurance 171 166 173 179501.513 - Rec Bucks 0 0 0 322501.516 - Hra City Contribution 424 0 0 0
10 - Employee benefits Total 35,744 33,476 34,540 34,92815 - Materials
600.611 - Uniforms/Safety Appar 280 280 280 282600.613 - General Supplies 2,575 10,736 14,076 28,564600.621 - Calrecylce City Payment Prgm Adm 552 0 0 0600.629 - Conference and Training 0 0 0 840600.632 - Mileage Reimbursement 0 16 0 17600.651 - Property Tax 0 419 0 440
15 - Materials Total 3,406 11,452 14,356 30,14320 - Contract services
700.702 - General Service Agreement 47,863 308,529 175,000 376,61420 - Contract services Total 47,863 308,529 175,000 376,614
25 - Cost allocation800.801 - Equipment Reimbursement 0 1,980 14,692 18,810800.802 - IT Reimbursement 11,336 9,561 8,567 6,234800.805 - CC CAP Allocation 0 0 0 2,757800.806 - CM CAP Allocation 0 0 0 1,038800.811 - Public Affairs CAP Alloc 0 0 0 2,836800.814 - Finance CAP Alloc 0 0 0 3,988800.815 - Human resources CAP Alloc 0 0 0 8,465800.817 - Community Hall/Quinlan CAP 184,405 0 0 0800.821 - Building Maintenance CAP 67,691 0 0 1,858
25 - Cost allocation Total 263,432 11,541 23,259 45,98630 - Capital outlays
900.990 - Special Projects - PW 113,890 20,259 10,000 030 - Capital outlays Total 113,890 20,259 10,000 0
208

Appendix A-4 Year Expenditure Trends at the Account Level by Program
Department
FY17 Actuals
FY18 Actuals
FY19 Final Budget
FY20 Proposed
Budget31 - Special projects
750.025 - Special Maintenance 0 0 6,000 031 - Special projects Total 0 0 6,000 0
35 - Contingencies719.705 - Contingencies 0 0 9,768 40,647
35 - Contingencies Total 0 0 9,768 40,647828 Bldg Maint Library Total 524,536 446,309 338,834 595,393
209

Appendix A-4 Year Expenditure Trends at the Account Level by Program
Department
FY17 Actuals
FY18 Actuals
FY19 Final Budget
FY20 Proposed
Budget829 Bldg Maint Service Center
05 - Employee compensation500.501 - Salaries Full Time 57,446 54,649 57,910 59,471500.504 - Stand By 70 0 0 0500.505 - Overtime 1,143 2,011 1,500 2,112
05 - Employee compensation Total 58,659 56,660 59,410 61,58310 - Employee benefits
501.500 - Retirement System 14,854 14,109 15,625 15,906501.502 - Pers 1959 Surv Empr 35 35 36 42501.505 - Health Insurance 8,572 9,860 10,250 10,602501.506 - Dental Insurance 1,129 1,061 1,071 1,078501.507 - Medicare 888 909 847 864501.508 - Life Insurance 559 488 504 511501.509 - Long Term Disability 332 362 411 417501.510 - Workers Compensation 6,449 2,196 1,744 808501.511 - Vision Insurance 150 141 150 156501.513 - Rec Bucks 0 0 0 280501.516 - Hra City Contribution 425 0 0 0
10 - Employee benefits Total 33,395 29,160 30,638 30,66415 - Materials
600.608 - Sml Tools and Equipment 0 0 0 65,184600.611 - Uniforms/Safety Appar 290 270 280 240600.613 - General Supplies 18,062 29,936 25,000 19,256600.620 - Gas Service 4,463 5,541 6,474 0600.629 - Conference and Training 0 0 0 735600.632 - Mileage Reimbursement 0 16 0 17600.635 - Special Departmental Exp 0 0 0 656600.641 - Electrical Service 657 787 41,195 826600.642 - Telphone and Data Services 30,163 27,986 24,000 1,599600.643 - Water Services 4,120 5,110 4,320 5,468600.644 - Sewer Service 1,446 1,561 2,000 1,639
15 - Materials Total 59,199 71,207 103,269 95,62020 - Contract services
700.702 - General Service Agreement 35,366 42,010 40,000 46,50520 - Contract services Total 35,366 42,010 40,000 46,505
25 - Cost allocation800.801 - Equipment Reimbursement 0 53,730 13,222 16,915800.802 - IT Reimbursement 11,315 9,562 8,430 6,134800.805 - CC CAP Allocation 0 0 0 2,154800.806 - CM CAP Allocation 0 0 0 797800.811 - Public Affairs CAP Alloc 0 0 0 2,505800.814 - Finance CAP Alloc 0 0 0 2,535800.815 - Human resources CAP Alloc 0 0 0 7,837
210

Appendix A-4 Year Expenditure Trends at the Account Level by Program
Department
FY17 Actuals
FY18 Actuals
FY19 Final Budget
FY20 Proposed
Budget800.821 - Building Maintenance CAP 53,693 0 0 1,641
25 - Cost allocation Total 65,008 63,292 21,652 40,51830 - Capital outlays
900.990 - Special Projects - PW 3,149 34,369 0 030 - Capital outlays Total 3,149 34,369 0 0
35 - Contingencies719.705 - Contingencies 0 0 7,163 14,499
35 - Contingencies Total 0 0 7,163 14,499829 Bldg Maint Service Center Total 254,775 296,699 262,132 289,389
211

Appendix A-4 Year Expenditure Trends at the Account Level by Program
Department
FY17 Actuals
FY18 Actuals
FY19 Final Budget
FY20 Proposed
Budget830 Bldg Maint Quinlan Center
05 - Employee compensation500.501 - Salaries Full Time 62,074 59,303 63,358 64,788500.505 - Overtime 3,710 5,632 4,600 5,914
05 - Employee compensation Total 65,784 64,935 67,958 70,70210 - Employee benefits
501.500 - Retirement System 15,697 15,413 17,098 17,328501.502 - Pers 1959 Surv Empr 46 48 48 48501.505 - Health Insurance 7,464 8,551 8,241 8,525501.506 - Dental Insurance 1,270 1,266 1,220 1,230501.507 - Medicare 993 1,038 925 940501.508 - Life Insurance 628 582 576 583501.509 - Long Term Disability 348 402 445 451501.510 - Workers Compensation 4,969 2,508 1,993 924501.511 - Vision Insurance 177 177 175 180501.513 - Rec Bucks 0 0 0 322501.516 - Hra City Contribution 431 0 0 0
10 - Employee benefits Total 32,024 29,986 30,721 30,53115 - Materials
600.611 - Uniforms/Safety Appar 290 310 280 282600.613 - General Supplies 7,488 19,258 20,000 12,218600.620 - Gas Service 12,590 15,634 12,639 16,415600.629 - Conference and Training 0 0 0 840600.632 - Mileage Reimbursement 0 16 57 17600.641 - Electrical Service 83,362 84,174 92,274 88,382600.642 - Telphone and Data Services 12,772 11,885 21,250 760600.643 - Water Services 5,309 6,702 7,200 7,171600.644 - Sewer Service 1,334 1,440 0 1,512
15 - Materials Total 123,144 139,419 153,700 127,59720 - Contract services
700.702 - General Service Agreement 107,885 126,426 100,000 160,51320 - Contract services Total 107,885 126,426 100,000 160,513
25 - Cost allocation800.801 - Equipment Reimbursement 0 2,100 22,122 28,301800.802 - IT Reimbursement 11,500 6,693 10,230 7,444800.805 - CC CAP Allocation 0 0 0 2,727800.806 - CM CAP Allocation 0 0 0 1,025800.811 - Public Affairs CAP Alloc 0 0 0 2,836800.814 - Finance CAP Alloc 0 0 0 2,750800.815 - Human resources CAP Alloc 0 0 0 8,465800.821 - Building Maintenance CAP 8,002 0 0 1,858
25 - Cost allocation Total 19,502 8,793 32,352 55,40630 - Capital outlays
212

Appendix A-4 Year Expenditure Trends at the Account Level by Program
Department
FY17 Actuals
FY18 Actuals
FY19 Final Budget
FY20 Proposed
Budget900.990 - Special Projects - PW 64,729 66,102 69,000 0
30 - Capital outlays Total 64,729 66,102 69,000 031 - Special projects
750.025 - Special Maintenance 0 0 0 40,00031 - Special projects Total 0 0 0 40,000
35 - Contingencies719.705 - Contingencies 0 0 12,685 27,983
35 - Contingencies Total 0 0 12,685 27,983830 Bldg Maint Quinlan Center Total 413,067 435,660 466,416 512,732
213

Appendix A-4 Year Expenditure Trends at the Account Level by Program
Department
FY17 Actuals
FY18 Actuals
FY19 Final Budget
FY20 Proposed
Budget831 Bldg Maint Senior Center
05 - Employee compensation500.501 - Salaries Full Time 47,918 48,319 55,294 59,058500.504 - Stand By 200 0 0 0500.505 - Overtime 574 2,796 1,400 2,936
05 - Employee compensation Total 48,692 51,115 56,694 61,99410 - Employee benefits
501.500 - Retirement System 12,560 12,517 14,886 15,795501.502 - Pers 1959 Surv Empr 39 45 48 48501.505 - Health Insurance 6,580 10,532 10,891 11,269501.506 - Dental Insurance 1,055 1,179 1,219 1,229501.507 - Medicare 858 843 808 856501.508 - Life Insurance 523 544 576 582501.509 - Long Term Disability 283 347 399 419501.510 - Workers Compensation 4,351 2,508 1,993 924501.511 - Vision Insurance 131 146 155 180501.513 - Rec Bucks 0 0 0 323501.516 - Hra City Contribution 427 0 0 0
10 - Employee benefits Total 26,807 28,660 30,975 31,62515 - Materials
600.611 - Uniforms/Safety Appar 330 430 280 283600.613 - General Supplies 5,215 9,119 6,000 9,786600.620 - Gas Service 1,451 1,801 2,772 1,891600.629 - Conference and Training 0 0 0 840600.632 - Mileage Reimbursement 0 16 0 17600.641 - Electrical Service 38,055 47,222 37,664 49,583600.642 - Telphone and Data Services 11,136 10,196 14,000 760600.643 - Water Services 3,514 6,128 7,200 6,557
15 - Materials Total 59,700 74,913 67,916 69,71720 - Contract services
700.702 - General Service Agreement 78,520 104,793 66,000 94,30120 - Contract services Total 78,520 104,793 66,000 94,301
25 - Cost allocation800.801 - Equipment Reimbursement 0 0 11,762 15,047800.802 - IT Reimbursement 11,256 1,912 1,625 1,183800.805 - CC CAP Allocation 0 0 0 2,250800.806 - CM CAP Allocation 0 0 0 829800.811 - Public Affairs CAP Alloc 0 0 0 2,689800.814 - Finance CAP Alloc 0 0 0 3,285800.815 - Human resources CAP Alloc 0 0 0 8,186800.821 - Building Maintenance CAP 28,405 0 0 1,762
25 - Cost allocation Total 39,661 1,912 13,387 35,23130 - Capital outlays
214

Appendix A-4 Year Expenditure Trends at the Account Level by Program
Department
FY17 Actuals
FY18 Actuals
FY19 Final Budget
FY20 Proposed
Budget900.990 - Special Projects - PW 87,214 35,586 0 0
30 - Capital outlays Total 87,214 35,586 0 031 - Special projects
750.025 - Special Maintenance 0 0 0 12,00031 - Special projects Total 0 0 0 12,000
35 - Contingencies719.705 - Contingencies 0 0 6,714 16,374
35 - Contingencies Total 0 0 6,714 16,374831 Bldg Maint Senior Center Total 340,595 296,979 241,686 321,242
215

Appendix A-4 Year Expenditure Trends at the Account Level by Program
Department
FY17 Actuals
FY18 Actuals
FY19 Final Budget
FY20 Proposed
Budget832 Bldg Maint McClellan Ranch
05 - Employee compensation500.501 - Salaries Full Time 45,635 43,564 47,885 50,299500.505 - Overtime 341 2,575 0 2,703
05 - Employee compensation Total 45,976 46,139 47,885 53,00210 - Employee benefits
501.500 - Retirement System 11,410 11,167 12,903 13,452501.502 - Pers 1959 Surv Empr 34 36 36 36501.505 - Health Insurance 6,421 6,913 7,008 7,251501.506 - Dental Insurance 944 927 916 922501.507 - Medicare 672 763 700 729501.508 - Life Insurance 469 443 432 436501.509 - Long Term Disability 273 322 349 361501.510 - Workers Compensation 2,918 2,965 1,495 693501.511 - Vision Insurance 125 122 125 133501.513 - Rec Bucks 0 0 0 242501.516 - Hra City Contribution 319 0 0 0
10 - Employee benefits Total 23,585 23,658 23,964 24,25515 - Materials
600.611 - Uniforms/Safety Appar 200 200 200 202600.613 - General Supplies 3,099 3,304 8,000 3,441600.620 - Gas Service 756 968 843 443600.621 - Calrecylce City Payment Prgm Adm 0 0 825 0600.629 - Conference and Training 0 0 0 630600.632 - Mileage Reimbursement 0 16 0 17600.641 - Electrical Service 1,021 3,055 4,044 3,208600.643 - Water Services 2,432 3,270 6,480 3,499600.644 - Sewer Service 3,870 4,593 2,000 4,823
15 - Materials Total 11,378 15,407 22,392 16,26320 - Contract services
700.702 - General Service Agreement 35,456 15,129 26,000 52,00720 - Contract services Total 35,456 15,129 26,000 52,007
25 - Cost allocation800.801 - Equipment Reimbursement 0 0 5,892 7,538800.802 - IT Reimbursement 8,432 5,736 6,940 5,050800.805 - CC CAP Allocation 0 0 0 1,399800.806 - CM CAP Allocation 0 0 0 494800.811 - Public Affairs CAP Alloc 0 0 0 2,100800.814 - Finance CAP Alloc 0 0 0 1,664800.815 - Human resources CAP Alloc 0 0 0 7,069800.821 - Building Maintenance CAP 0 0 0 1,376
25 - Cost allocation Total 8,432 5,736 12,832 26,69030 - Capital outlays
216

Appendix A-4 Year Expenditure Trends at the Account Level by Program
Department
FY17 Actuals
FY18 Actuals
FY19 Final Budget
FY20 Proposed
Budget900.990 - Special Projects - PW 10,942 1,837 12,000 0
30 - Capital outlays Total 10,942 1,837 12,000 031 - Special projects
750.025 - Special Maintenance 0 0 30,000 30,00031 - Special projects Total 0 0 30,000 30,000
35 - Contingencies719.705 - Contingencies 0 0 3,920 6,807
35 - Contingencies Total 0 0 3,920 6,807832 Bldg Maint McClellan Ranch Total 135,770 107,905 178,993 209,024
217

Appendix A-4 Year Expenditure Trends at the Account Level by Program
Department
FY17 Actuals
FY18 Actuals
FY19 Final Budget
FY20 Proposed
Budget833 Bldg Maint Monta Vista Ct
05 - Employee compensation500.501 - Salaries Full Time 32,876 31,042 34,411 35,126500.505 - Overtime 262 1,701 1,500 1,786
05 - Employee compensation Total 33,138 32,743 35,911 36,91210 - Employee benefits
501.500 - Retirement System 8,528 8,062 9,283 9,394501.502 - Pers 1959 Surv Empr 23 23 24 24501.505 - Health Insurance 4,508 4,854 4,934 5,105501.506 - Dental Insurance 625 603 611 615501.507 - Medicare 489 567 503 509501.508 - Life Insurance 313 278 288 291501.509 - Long Term Disability 201 226 265 268501.510 - Workers Compensation 3,113 1,248 996 462501.511 - Vision Insurance 88 85 89 87501.513 - Rec Bucks 0 0 0 161501.516 - Hra City Contribution 211 0 0 0
10 - Employee benefits Total 18,101 15,945 16,993 16,91615 - Materials
600.611 - Uniforms/Safety Appar 120 120 120 121600.613 - General Supplies 3,910 5,814 5,000 6,131600.620 - Gas Service 2,268 2,816 3,531 2,957600.629 - Conference and Training 0 0 0 420600.632 - Mileage Reimbursement 0 16 0 17600.641 - Electrical Service 13,212 13,467 17,302 14,140600.642 - Telphone and Data Services 1,600 1,568 3,000 760600.643 - Water Services 1,941 2,430 4,320 2,601600.644 - Sewer Service 733 792 300 832
15 - Materials Total 23,784 27,023 33,573 27,97920 - Contract services
700.702 - General Service Agreement 31,084 35,244 35,000 47,21720 - Contract services Total 31,084 35,244 35,000 47,217
25 - Cost allocation800.801 - Equipment Reimbursement 0 0 7,346 9,398800.802 - IT Reimbursement 5,618 2,868 2,638 1,919800.805 - CC CAP Allocation 0 0 0 1,110800.806 - CM CAP Allocation 0 0 0 405800.811 - Public Affairs CAP Alloc 0 0 0 1,400800.814 - Finance CAP Alloc 0 0 0 1,211800.815 - Human resources CAP Alloc 0 0 0 5,743800.821 - Building Maintenance CAP 17,481 0 0 917
25 - Cost allocation Total 23,099 2,868 9,984 22,10330 - Capital outlays
218

Appendix A-4 Year Expenditure Trends at the Account Level by Program
Department
FY17 Actuals
FY18 Actuals
FY19 Final Budget
FY20 Proposed
Budget900.990 - Special Projects - PW 11,849 19,688 93,000 0
30 - Capital outlays Total 11,849 19,688 93,000 035 - Contingencies
719.705 - Contingencies 0 0 3,429 7,50735 - Contingencies Total 0 0 3,429 7,507
833 Bldg Maint Monta Vista Ct Total 141,055 133,511 227,890 158,634
219

Appendix A-4 Year Expenditure Trends at the Account Level by Program
Department
FY17 Actuals
FY18 Actuals
FY19 Final Budget
FY20 Proposed
Budget834 Bldg Maint Wilson
05 - Employee compensation500.501 - Salaries Full Time 17,729 18,497 17,817 18,004500.504 - Stand By 140 0 0 0500.505 - Overtime 130 535 350 561
05 - Employee compensation Total 17,999 19,031 18,167 18,56510 - Employee benefits
501.500 - Retirement System 4,498 4,641 4,812 4,815501.502 - Pers 1959 Surv Empr 11 12 12 12501.505 - Health Insurance 3,214 3,946 4,186 4,331501.506 - Dental Insurance 304 311 305 307501.507 - Medicare 255 268 260 261501.508 - Life Insurance 148 144 144 145501.509 - Long Term Disability 92 108 108 109501.510 - Workers Compensation 1,237 624 498 231501.511 - Vision Insurance 34 36 36 46501.513 - Rec Bucks 0 0 0 81501.516 - Hra City Contribution 96 0 0 0
10 - Employee benefits Total 9,890 10,089 10,361 10,33815 - Materials
600.611 - Uniforms/Safety Appar 80 80 80 81600.613 - General Supplies 711 2,044 1,500 3,511600.620 - Gas Service 342 425 524 473600.629 - Conference and Training 0 0 0 210600.641 - Electrical Service 7,210 7,978 8,033 8,377600.642 - Telphone and Data Services 1,236 964 1,000 760600.643 - Water Services 1,681 1,858 2,880 1,988600.644 - Sewer Service 1,334 720 1,200 756
15 - Materials Total 12,594 14,070 15,217 16,15620 - Contract services
700.702 - General Service Agreement 12,506 13,952 10,000 37,01320 - Contract services Total 12,506 13,952 10,000 37,013
25 - Cost allocation800.801 - Equipment Reimbursement 0 0 2,941 3,762800.802 - IT Reimbursement 2,814 5,737 5,217 3,796800.805 - CC CAP Allocation 0 0 0 634800.806 - CM CAP Allocation 0 0 0 234800.811 - Public Affairs CAP Alloc 0 0 0 737800.814 - Finance CAP Alloc 0 0 0 1,390800.815 - Human resources CAP Alloc 0 0 0 1,396800.821 - Building Maintenance CAP 0 0 0 483
25 - Cost allocation Total 2,814 5,737 8,158 12,43230 - Capital outlays
220

Appendix A-4 Year Expenditure Trends at the Account Level by Program
Department
FY17 Actuals
FY18 Actuals
FY19 Final Budget
FY20 Proposed
Budget900.990 - Special Projects - PW 1,200 24,446 0 0
30 - Capital outlays Total 1,200 24,446 0 035 - Contingencies
719.705 - Contingencies 0 0 1,261 2,65835 - Contingencies Total 0 0 1,261 2,658
834 Bldg Maint Wilson Total 57,002 87,325 63,164 97,162
221

Appendix A-4 Year Expenditure Trends at the Account Level by Program
Department
FY17 Actuals
FY18 Actuals
FY19 Final Budget
FY20 Proposed
Budget835 Bldg Maint Portal
05 - Employee compensation500.501 - Salaries Full Time 8,865 9,249 8,909 9,002500.504 - Stand By 70 0 0 0500.505 - Overtime 4 1 0 0
05 - Employee compensation Total 8,939 9,250 8,909 9,00210 - Employee benefits
501.500 - Retirement System 2,249 2,321 2,407 2,408501.502 - Pers 1959 Surv Empr 6 6 6 6501.505 - Health Insurance 1,594 1,923 2,093 2,165501.506 - Dental Insurance 151 151 153 154501.507 - Medicare 127 130 130 131501.508 - Life Insurance 74 70 72 73501.509 - Long Term Disability 46 52 54 54501.510 - Workers Compensation 619 312 249 115501.511 - Vision Insurance 17 17 18 23501.513 - Rec Bucks 0 0 0 40501.516 - Hra City Contribution 48 0 0 0
10 - Employee benefits Total 4,930 4,981 5,182 5,16915 - Materials
600.601 - General Office Supplies 0 0 679 0600.611 - Uniforms/Safety Appar 40 40 40 40600.613 - General Supplies 0 664 500 698600.620 - Gas Service 366 454 367 477600.629 - Conference and Training 0 0 0 105600.642 - Telphone and Data Services 509 0 700 0600.643 - Water Services 2,541 4,271 5,760 4,570600.644 - Sewer Service 333 360 560 378
15 - Materials Total 3,789 5,790 8,606 6,26820 - Contract services
700.702 - General Service Agreement 3,123 5,218 8,251 9,62320 - Contract services Total 3,123 5,218 8,251 9,623
25 - Cost allocation800.801 - Equipment Reimbursement 0 0 2,935 3,755800.802 - IT Reimbursement 1,420 2,869 2,481 1,806800.805 - CC CAP Allocation 0 0 0 326800.806 - CM CAP Allocation 0 0 0 121800.811 - Public Affairs CAP Alloc 0 0 0 368800.814 - Finance CAP Alloc 0 0 0 1,151800.815 - Human resources CAP Alloc 0 0 0 698800.821 - Building Maintenance CAP 0 0 0 241
25 - Cost allocation Total 1,420 2,869 5,416 8,46630 - Capital outlays
222

Appendix A-4 Year Expenditure Trends at the Account Level by Program
Department
FY17 Actuals
FY18 Actuals
FY19 Final Budget
FY20 Proposed
Budget900.990 - Special Projects - PW 2,200 18,800 0 0
30 - Capital outlays Total 2,200 18,800 0 035 - Contingencies
719.705 - Contingencies 0 0 843 79535 - Contingencies Total 0 0 843 795
835 Bldg Maint Portal Total 24,401 46,908 37,207 39,323
223

Appendix A-4 Year Expenditure Trends at the Account Level by Program
Department
FY17 Actuals
FY18 Actuals
FY19 Final Budget
FY20 Proposed
Budget836 Bldg Maint Sports Center
05 - Employee compensation500.501 - Salaries Full Time 64,574 72,770 61,743 63,155500.504 - Stand By 280 0 0 0500.505 - Overtime 1,758 2,729 3,800 2,866
05 - Employee compensation Total 66,612 75,499 65,543 66,02110 - Employee benefits
501.500 - Retirement System 13,018 23,348 16,660 16,892501.502 - Pers 1959 Surv Empr 35 37 36 42501.505 - Health Insurance 10,487 14,598 12,545 12,974501.506 - Dental Insurance 1,123 1,102 1,068 1,077501.507 - Medicare 918 977 900 916501.508 - Life Insurance 556 514 507 510501.509 - Long Term Disability 363 392 430 437501.510 - Workers Compensation 3,423 2,196 1,744 808501.511 - Vision Insurance 134 132 131 157501.513 - Rec Bucks 0 0 0 282501.516 - Hra City Contribution 381 0 0 0
10 - Employee benefits Total 30,439 43,295 34,021 34,09515 - Materials
600.611 - Uniforms/Safety Appar 270 290 260 242600.613 - General Supplies (136,556) 10,196 10,000 9,787600.620 - Gas Service 3,831 4,758 5,297 4,995600.629 - Conference and Training 0 0 0 735600.632 - Mileage Reimbursement 8 16 0 17600.641 - Electrical Service 75,776 93,091 88,981 97,746600.642 - Telphone and Data Services 10,469 9,782 20,000 2,981600.643 - Water Services 7,656 10,941 30,240 11,706600.644 - Sewer Service 1,934 1,866 4,000 1,959
15 - Materials Total (36,612) 130,940 158,778 130,16820 - Contract services
700.702 - General Service Agreement 67,112 90,409 60,000 117,12120 - Contract services Total 67,112 90,409 60,000 117,121
25 - Cost allocation800.801 - Equipment Reimbursement 0 2,480 1,502 1,921800.802 - IT Reimbursement 10,623 16,255 13,562 9,868800.805 - CC CAP Allocation 3,606 2,884 1,606 2,560800.806 - CM CAP Allocation 979 934 671 968800.814 - Finance CAP Alloc 12,070 13,251 13,861 17,467800.815 - Human resources CAP Alloc 5,456 4,488 4,896 7,907800.821 - Building Maintenance CAP 0 0 0 1,665
25 - Cost allocation Total 32,734 40,292 36,098 42,35630 - Capital outlays
224
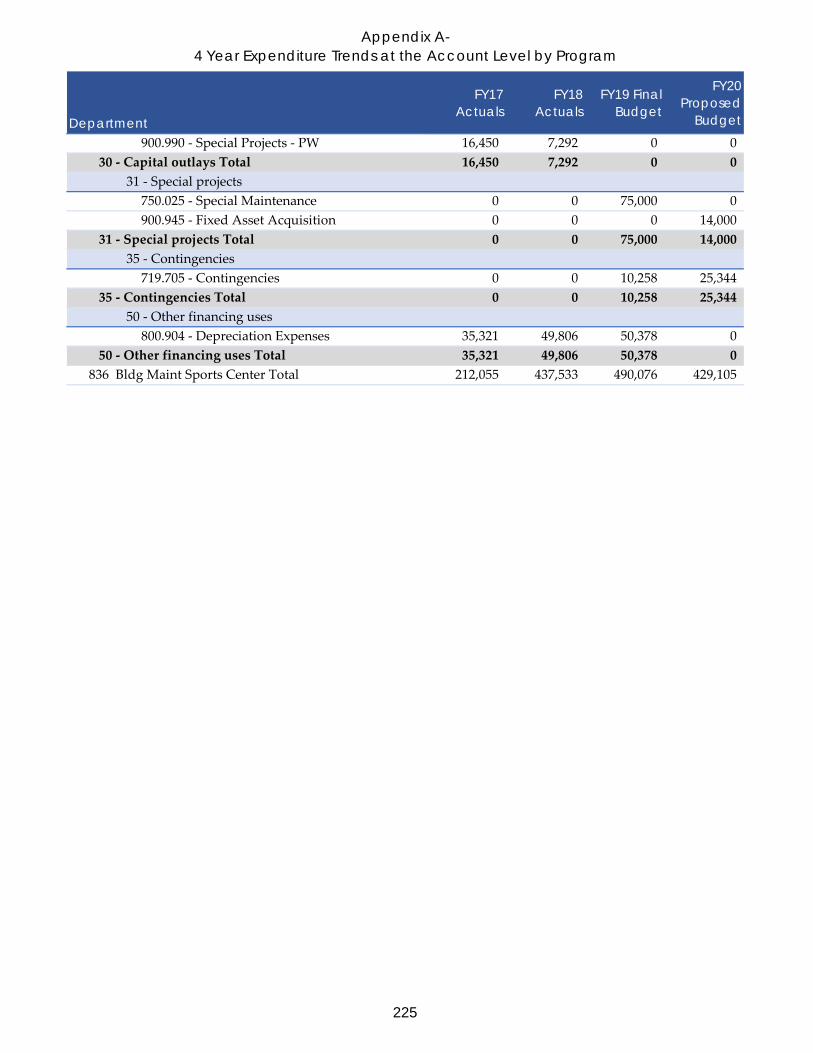
Appendix A-4 Year Expenditure Trends at the Account Level by Program
Department
FY17 Actuals
FY18 Actuals
FY19 Final Budget
FY20 Proposed
Budget900.990 - Special Projects - PW 16,450 7,292 0 0
30 - Capital outlays Total 16,450 7,292 0 031 - Special projects
750.025 - Special Maintenance 0 0 75,000 0900.945 - Fixed Asset Acquisition 0 0 0 14,000
31 - Special projects Total 0 0 75,000 14,00035 - Contingencies
719.705 - Contingencies 0 0 10,258 25,34435 - Contingencies Total 0 0 10,258 25,344
50 - Other financing uses800.904 - Depreciation Expenses 35,321 49,806 50,378 0
50 - Other financing uses Total 35,321 49,806 50,378 0836 Bldg Maint Sports Center Total 212,055 437,533 490,076 429,105
225

Appendix A-4 Year Expenditure Trends at the Account Level by Program
Department
FY17 Actuals
FY18 Actuals
FY19 Final Budget
FY20 Proposed
Budget837 Bldg Maint Creekside
05 - Employee compensation500.501 - Salaries Full Time 17,895 15,868 19,025 19,578500.505 - Overtime 827 774 1,000 813
05 - Employee compensation Total 18,722 16,642 20,025 20,39110 - Employee benefits
501.500 - Retirement System 4,663 4,111 5,126 5,236501.502 - Pers 1959 Surv Empr 12 11 12 12501.505 - Health Insurance 2,883 2,988 3,040 3,145501.506 - Dental Insurance 311 293 306 308501.507 - Medicare 274 332 278 284501.508 - Life Insurance 160 135 144 146501.509 - Long Term Disability 122 132 170 173501.510 - Workers Compensation 1,237 624 498 231501.511 - Vision Insurance 43 39 42 41501.513 - Rec Bucks 0 0 0 80501.516 - Hra City Contribution 109 0 0 0
10 - Employee benefits Total 9,813 8,664 9,616 9,65615 - Materials
600.611 - Uniforms/Safety Appar 40 40 40 40600.613 - General Supplies 140 1,311 2,000 1,376600.629 - Conference and Training 0 0 0 210600.632 - Mileage Reimbursement 0 16 0 17600.641 - Electrical Service 5,177 5,216 8,239 5,477600.642 - Telphone and Data Services 1,348 1,330 1,000 760600.643 - Water Services 1,729 2,304 4,320 2,465600.644 - Sewer Service 456 0 725 0
15 - Materials Total 8,889 10,218 16,324 10,34520 - Contract services
700.702 - General Service Agreement 13,168 15,372 10,000 26,54620 - Contract services Total 13,168 15,372 10,000 26,546
25 - Cost allocation800.801 - Equipment Reimbursement 0 0 5,871 7,511800.802 - IT Reimbursement 2,850 2,868 2,638 1,919800.805 - CC CAP Allocation 0 0 0 499800.806 - CM CAP Allocation 0 0 0 180800.811 - Public Affairs CAP Alloc 0 0 0 663800.814 - Finance CAP Alloc 0 0 0 1,646800.815 - Human resources CAP Alloc 0 0 0 4,347800.821 - Building Maintenance CAP 9,440 0 0 434
25 - Cost allocation Total 12,290 2,868 8,509 17,19930 - Capital outlays
900.990 - Special Projects - PW 192 0 0 0
226

Appendix A-4 Year Expenditure Trends at the Account Level by Program
Department
FY17 Actuals
FY18 Actuals
FY19 Final Budget
FY20 Proposed
Budget30 - Capital outlays Total 192 0 0 0
35 - Contingencies719.705 - Contingencies 0 0 1,316 2,885
35 - Contingencies Total 0 0 1,316 2,885837 Bldg Maint Creekside Total 63,074 53,764 65,790 87,022
227
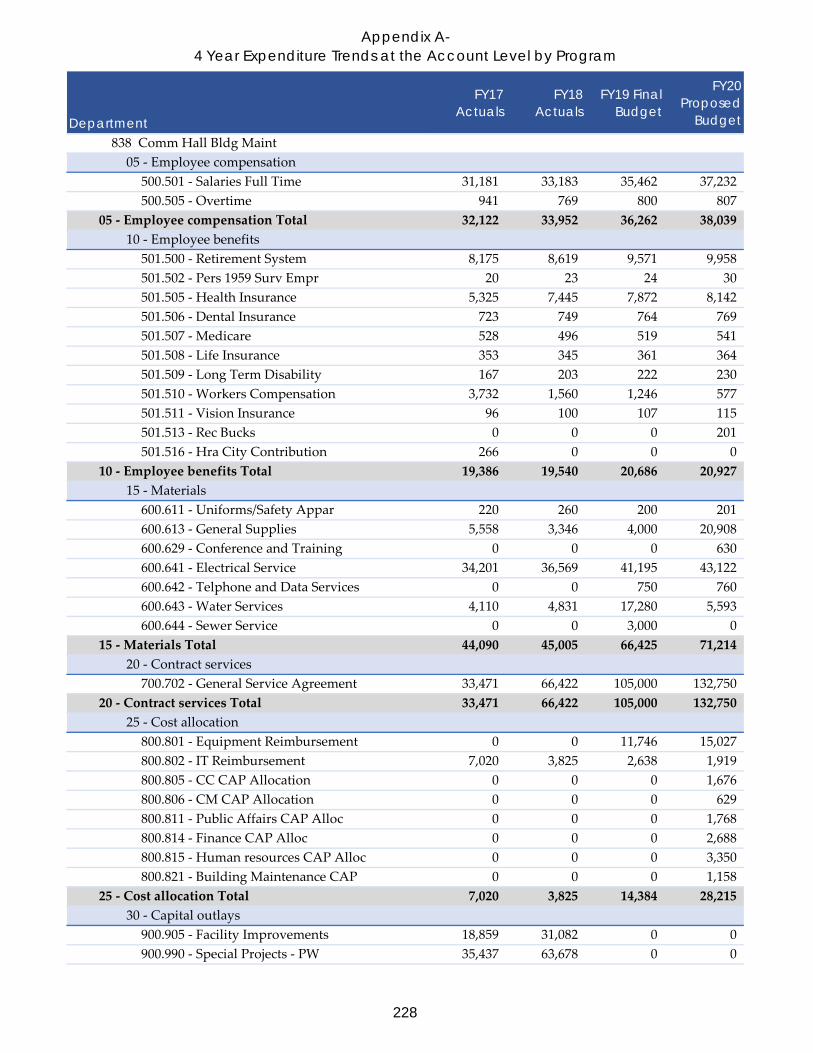
Appendix A-4 Year Expenditure Trends at the Account Level by Program
Department
FY17 Actuals
FY18 Actuals
FY19 Final Budget
FY20 Proposed
Budget838 Comm Hall Bldg Maint
05 - Employee compensation500.501 - Salaries Full Time 31,181 33,183 35,462 37,232500.505 - Overtime 941 769 800 807
05 - Employee compensation Total 32,122 33,952 36,262 38,03910 - Employee benefits
501.500 - Retirement System 8,175 8,619 9,571 9,958501.502 - Pers 1959 Surv Empr 20 23 24 30501.505 - Health Insurance 5,325 7,445 7,872 8,142501.506 - Dental Insurance 723 749 764 769501.507 - Medicare 528 496 519 541501.508 - Life Insurance 353 345 361 364501.509 - Long Term Disability 167 203 222 230501.510 - Workers Compensation 3,732 1,560 1,246 577501.511 - Vision Insurance 96 100 107 115501.513 - Rec Bucks 0 0 0 201501.516 - Hra City Contribution 266 0 0 0
10 - Employee benefits Total 19,386 19,540 20,686 20,92715 - Materials
600.611 - Uniforms/Safety Appar 220 260 200 201600.613 - General Supplies 5,558 3,346 4,000 20,908600.629 - Conference and Training 0 0 0 630600.641 - Electrical Service 34,201 36,569 41,195 43,122600.642 - Telphone and Data Services 0 0 750 760600.643 - Water Services 4,110 4,831 17,280 5,593600.644 - Sewer Service 0 0 3,000 0
15 - Materials Total 44,090 45,005 66,425 71,21420 - Contract services
700.702 - General Service Agreement 33,471 66,422 105,000 132,75020 - Contract services Total 33,471 66,422 105,000 132,750
25 - Cost allocation800.801 - Equipment Reimbursement 0 0 11,746 15,027800.802 - IT Reimbursement 7,020 3,825 2,638 1,919800.805 - CC CAP Allocation 0 0 0 1,676800.806 - CM CAP Allocation 0 0 0 629800.811 - Public Affairs CAP Alloc 0 0 0 1,768800.814 - Finance CAP Alloc 0 0 0 2,688800.815 - Human resources CAP Alloc 0 0 0 3,350800.821 - Building Maintenance CAP 0 0 0 1,158
25 - Cost allocation Total 7,020 3,825 14,384 28,21530 - Capital outlays
900.905 - Facility Improvements 18,859 31,082 0 0900.990 - Special Projects - PW 35,437 63,678 0 0
228

Appendix A-4 Year Expenditure Trends at the Account Level by Program
Department
FY17 Actuals
FY18 Actuals
FY19 Final Budget
FY20 Proposed
Budget30 - Capital outlays Total 54,296 94,760 0 0
35 - Contingencies719.705 - Contingencies 0 0 8,571 10,198
35 - Contingencies Total 0 0 8,571 10,198838 Comm Hall Bldg Maint Total 190,385 263,505 251,328 301,343
229

Appendix A-4 Year Expenditure Trends at the Account Level by Program
Department
FY17 Actuals
FY18 Actuals
FY19 Final Budget
FY20 Proposed
Budget839 Teen Center Bldg Maint
05 - Employee compensation500.501 - Salaries Full Time 8,865 9,249 8,909 9,002500.504 - Stand By 70 0 0 0500.505 - Overtime 335 709 100 744
05 - Employee compensation Total 9,270 9,957 9,009 9,74610 - Employee benefits
501.500 - Retirement System 2,249 2,321 2,407 2,408501.502 - Pers 1959 Surv Empr 6 6 6 6501.505 - Health Insurance 1,635 1,962 2,093 2,165501.506 - Dental Insurance 154 155 153 154501.507 - Medicare 130 142 130 131501.508 - Life Insurance 75 70 72 73501.509 - Long Term Disability 46 52 54 54501.510 - Workers Compensation 619 312 249 115501.511 - Vision Insurance 18 18 18 23501.513 - Rec Bucks 0 0 0 40501.516 - Hra City Contribution 48 0 0 0
10 - Employee benefits Total 4,981 5,037 5,182 5,16915 - Materials
600.611 - Uniforms/Safety Appar 40 40 40 40600.613 - General Supplies 140 0 500 0600.620 - Gas Service 0 0 139 0600.641 - Electrical Service 9,383 4,125 7,062 0600.642 - Telphone and Data Services 1,820 1,984 2,000 0600.643 - Water Services 198 264 432 0
15 - Materials Total 11,581 6,413 10,173 4020 - Contract services
700.702 - General Service Agreement 19,411 0 14,000 17,04920 - Contract services Total 19,411 0 14,000 17,049
25 - Cost allocation800.801 - Equipment Reimbursement 0 0 1,470 1,881800.802 - IT Reimbursement 1,432 2,869 2,481 1,806800.805 - CC CAP Allocation 0 0 0 261800.806 - CM CAP Allocation 0 0 0 93800.811 - Public Affairs CAP Alloc 0 0 0 368800.814 - Finance CAP Alloc 0 0 0 239800.815 - Human resources CAP Alloc 0 0 0 698800.821 - Building Maintenance CAP 4,650 0 0 241
25 - Cost allocation Total 6,082 2,869 3,951 5,58731 - Special projects
750.025 - Special Maintenance 0 0 50,000 0900.945 - Fixed Asset Acquisition 0 0 0 17,000
230

Appendix A-4 Year Expenditure Trends at the Account Level by Program
Department
FY17 Actuals
FY18 Actuals
FY19 Final Budget
FY20 Proposed
Budget31 - Special projects Total 0 0 50,000 17,000
35 - Contingencies719.705 - Contingencies 0 0 3,709 854
35 - Contingencies Total 0 0 3,709 854839 Teen Center Bldg Maint Total 51,325 24,276 96,024 55,445
231

Appendix A-4 Year Expenditure Trends at the Account Level by Program
Department
FY17 Actuals
FY18 Actuals
FY19 Final Budget
FY20 Proposed
Budget840 Park Bathrooms
05 - Employee compensation500.501 - Salaries Full Time 14,166 14,680 15,197 15,548500.505 - Overtime 1,523 2,046 1,700 2,149
05 - Employee compensation Total 15,689 16,726 16,897 17,69710 - Employee benefits
501.500 - Retirement System 3,642 3,821 4,110 4,158501.502 - Pers 1959 Surv Empr 12 13 12 12501.505 - Health Insurance 2,715 3,187 3,041 3,145501.506 - Dental Insurance 343 333 306 308501.507 - Medicare 229 235 223 226501.508 - Life Insurance 167 159 145 146501.509 - Long Term Disability 75 89 95 96501.510 - Workers Compensation 0 624 498 231501.511 - Vision Insurance 50 49 47 46501.513 - Rec Bucks 0 0 0 80501.516 - Hra City Contribution 112 0 0 0
10 - Employee benefits Total 7,346 8,511 8,477 8,44815 - Materials
600.611 - Uniforms/Safety Appar 80 80 80 80600.613 - General Supplies 22,424 9,448 25,000 9,920600.629 - Conference and Training 0 0 0 210600.644 - Sewer Service 3,691 2,923 0 3,069
15 - Materials Total 26,196 12,451 25,080 13,27920 - Contract services
700.702 - General Service Agreement 28,604 29,459 75,000 84,96120 - Contract services Total 28,604 29,459 75,000 84,961
25 - Cost allocation800.801 - Equipment Reimbursement 0 0 5,871 7,511800.802 - IT Reimbursement 2,932 1,912 2,531 1,842800.805 - CC CAP Allocation 0 0 0 662800.806 - CM CAP Allocation 0 0 0 247800.811 - Public Affairs CAP Alloc 0 0 0 737800.814 - Finance CAP Alloc 0 0 0 1,694800.815 - Human resources CAP Alloc 0 0 0 1,396800.821 - Building Maintenance CAP 0 0 0 483
25 - Cost allocation Total 2,932 1,912 8,402 14,57230 - Capital outlays
900.990 - Special Projects - PW 3,305 28,152 30,000 030 - Capital outlays Total 3,305 28,152 30,000 0
35 - Contingencies719.705 - Contingencies 0 0 5,004 4,912
35 - Contingencies Total 0 0 5,004 4,912
232

Appendix A-4 Year Expenditure Trends at the Account Level by Program
Department
FY17 Actuals
FY18 Actuals
FY19 Final Budget
FY20 Proposed
Budget840 Park Bathrooms Total 84,071 97,211 168,860 143,869
841 BBF Facilities Maintenance05 - Employee compensation
500.501 - Salaries Full Time 52,616 57,093 62,363 68,842500.505 - Overtime 2,824 2,747 4,000 2,885
05 - Employee compensation Total 55,440 59,840 66,363 71,72710 - Employee benefits
501.500 - Retirement System 13,105 14,393 16,802 18,413501.502 - Pers 1959 Surv Empr 52 55 54 54501.505 - Health Insurance 13,004 15,436 15,943 16,490501.506 - Dental Insurance 1,452 1,432 1,371 1,383501.507 - Medicare 803 864 911 998501.508 - Life Insurance 708 646 650 654501.509 - Long Term Disability 306 360 388 423501.510 - Workers Compensation 3,187 6,100 2,242 1,039501.511 - Vision Insurance 180 181 177 209501.513 - Rec Bucks 0 0 0 363501.516 - Hra City Contribution 484 0 0 0
10 - Employee benefits Total 33,282 39,467 38,538 40,02615 - Materials
600.611 - Uniforms/Safety Appar 360 360 360 363600.613 - General Supplies 33,080 29,750 32,437 29,305600.620 - Gas Service 5,476 6,565 4,708 6,893600.629 - Conference and Training 0 0 0 945600.632 - Mileage Reimbursement 35 0 0 0600.635 - Special Departmental Exp 0 0 0 188600.641 - Electrical Service 39,621 41,846 37,076 43,938600.643 - Water Services 18,864 26,612 29,520 28,475600.644 - Sewer Service 0 0 500 0
15 - Materials Total 97,435 105,132 104,601 110,10720 - Contract services
700.702 - General Service Agreement 54,148 76,745 55,000 86,58220 - Contract services Total 54,148 76,745 55,000 86,582
25 - Cost allocation800.801 - Equipment Reimbursement 0 0 76,229 97,515800.802 - IT Reimbursement 12,796 8,606 7,593 5,525800.805 - CC CAP Allocation 0 0 0 2,731800.806 - CM CAP Allocation 0 0 0 1,007800.811 - Public Affairs CAP Alloc 0 0 0 3,242800.814 - Finance CAP Alloc 0 0 0 4,555800.815 - Human resources CAP Alloc 0 0 0 6,142800.821 - Building Maintenance CAP 39,928 0 0 2,124
25 - Cost allocation Total 52,724 8,606 83,822 122,841
233

Appendix A-4 Year Expenditure Trends at the Account Level by Program
Department
FY17 Actuals
FY18 Actuals
FY19 Final Budget
FY20 Proposed
Budget30 - Capital outlays
900.990 - Special Projects - PW 16,288 74,498 200,000 030 - Capital outlays Total 16,288 74,498 200,000 0
35 - Contingencies719.705 - Contingencies 0 0 7,790 19,632
35 - Contingencies Total 0 0 7,790 19,632841 BBF Facilities Maintenance Total 309,317 364,288 556,114 450,915
234

Appendix A-4 Year Expenditure Trends at the Account Level by Program
Department
FY17 Actuals
FY18 Actuals
FY19 Final Budget
FY20 Proposed
Budget852 Franco Traffic Operations Center
15 - Materials600.613 - General Supplies 0 0 0 137
15 - Materials Total 0 0 0 13725 - Cost allocation
800.801 - Equipment Reimbursement 0 0 1,465 1,874800.802 - IT Reimbursement 0 0 34,168 24,863
25 - Cost allocation Total 0 0 35,633 26,73731 - Special projects
750.025 - Special Maintenance 0 0 0 7,50031 - Special projects Total 0 0 0 7,500
35 - Contingencies719.705 - Contingencies 0 0 0 7
35 - Contingencies Total 0 0 0 750 - Other financing uses
701.702 - Special Contracts 0 0 0 17,86250 - Other financing uses Total 0 0 0 17,862
852 Franco Traffic Operations Center Total 0 0 35,633 52,24387 Facilities and Fleet Total 3,293,825 3,611,474 4,099,897 4,385,826
235

Appendix A-4 Year Expenditure Trends at the Account Level by Program
Department
FY17 Actuals
FY18 Actuals
FY19 Final Budget
FY20 Proposed
Budget88 Transportation
844 Traffic Engineering05 - Employee compensation
500.501 - Salaries Full Time 392,524 373,700 461,790 474,818500.505 - Overtime 0 108 2,000 0500.506 - Car Allowance 2,700 2,896 3,001 0
05 - Employee compensation Total 395,224 376,704 466,791 474,81810 - Employee benefits
501.500 - Retirement System 101,270 97,260 124,144 126,995501.502 - Pers 1959 Surv Empr 204 183 209 213501.505 - Health Insurance 31,834 24,947 40,621 46,150501.506 - Dental Insurance 5,189 4,596 5,280 5,379501.507 - Medicare 5,626 5,384 6,743 6,885501.508 - Life Insurance 2,627 2,167 2,521 2,545501.509 - Long Term Disability 3,062 3,531 4,409 4,524501.510 - Workers Compensation 13,342 10,956 8,719 4,042501.511 - Vision Insurance 647 532 624 634501.513 - Rec Bucks 0 0 0 1,414501.516 - Hra City Contribution 1,566 0 0 0
10 - Employee benefits Total 165,368 149,555 193,270 198,78115 - Materials
600.601 - General Office Supplies 2,011 1,984 1,000 2,122600.603 - Maps, Blueprints, Etc 0 0 55 0600.605 - Meeting Expenses 0 0 0 80600.608 - Sml Tools and Equipment 0 0 0 212600.613 - General Supplies 1,064 7,591 500 2,128600.618 - Utilities and Phone 0 0 1,575 0600.629 - Conference and Training 1,414 0 2,500 3,675600.632 - Mileage Reimbursement 306 44 100 46600.635 - Special Departmental Exp 0 0 0 85,586600.642 - Telphone and Data Services 3,696 4,803 5,825 4,093600.647 - Memberships and Dues 0 0 0 7,350
15 - Materials Total 8,492 14,422 11,555 105,29220 - Contract services
700.701 - Training and Instruction 1,052 656 4,000 0700.702 - General Service Agreement 267,752 146,821 232,800 13,546700.703 - Maintenance of Equipment 2,255 0 0 0
20 - Contract services Total 271,058 147,477 236,800 13,54625 - Cost allocation
800.801 - Equipment Reimbursement 0 5,170 185 237800.802 - IT Reimbursement 50,758 39,204 44,806 32,605800.805 - CC CAP Allocation 7,413 12,590 9,822 9,520800.806 - CM CAP Allocation 1,991 4,099 4,245 3,561
236

Appendix A-4 Year Expenditure Trends at the Account Level by Program
Department
FY17 Actuals
FY18 Actuals
FY19 Final Budget
FY20 Proposed
Budget800.814 - Finance CAP Alloc 10,103 12,766 23,370 23,702800.815 - Human resources CAP Alloc 12,368 18,638 24,033 50,310800.821 - Building Maintenance CAP 0 0 0 6,709
25 - Cost allocation Total 82,633 92,467 106,461 126,64431 - Special projects
750.011 - Monitor Cut-Through Traffic 0 22,725 0 0900.923 - Apple Campus 2 0 41,160 20,500 0900.964 - I-280/Wolfe Rd Interchange Imprv 500,000 260,000 0 0900.965 - Traffic Impact Fee 88,136 37,824 0 0900.968 - Planned Transportation Project 310,144 318,099 400,000 0
31 - Special projects Total 898,279 679,808 420,500 035 - Contingencies
719.705 - Contingencies 0 0 11,318 5,94235 - Contingencies Total 0 0 11,318 5,942
844 Traffic Engineering Total 1,821,054 1,460,433 1,446,695 925,023
237

Appendix A-4 Year Expenditure Trends at the Account Level by Program
Department
FY17 Actuals
FY18 Actuals
FY19 Final Budget
FY20 Proposed
Budget845 Traffic Signal Maintenance
05 - Employee compensation500.501 - Salaries Full Time 186,256 149,584 206,033 209,137500.502 - Salaries Part Time 0 14,353 0 0500.504 - Stand By 11,300 13,200 11,000 13,860500.505 - Overtime 8,562 7,860 10,000 0
05 - Employee compensation Total 206,118 184,997 227,033 222,99710 - Employee benefits
501.500 - Retirement System 47,955 38,706 55,387 55,936501.502 - Pers 1959 Surv Empr 116 101 120 122501.505 - Health Insurance 22,910 24,883 30,401 26,455501.506 - Dental Insurance 2,842 2,715 3,044 3,074501.507 - Medicare 4,030 2,692 2,988 3,032501.508 - Life Insurance 1,555 1,237 1,440 1,454501.509 - Long Term Disability 1,540 1,598 2,188 2,222501.510 - Workers Compensation 12,413 6,264 4,982 2,310501.511 - Vision Insurance 369 312 360 362501.513 - Rec Bucks 0 0 0 808501.516 - Hra City Contribution 1,087 0 0 0
10 - Employee benefits Total 94,818 78,508 100,910 95,77515 - Materials
600.601 - General Office Supplies 59 291 350 306600.613 - General Supplies 1,182 40,686 7,000 42,719600.629 - Conference and Training 0 0 0 2,100600.632 - Mileage Reimbursement 0 0 200 0600.641 - Electrical Service 41,078 51,076 49,434 53,629600.642 - Telphone and Data Services 4,916 5,844 5,000 4,768600.647 - Memberships and Dues 0 0 0 90
15 - Materials Total 47,234 97,897 61,984 103,61220 - Contract services
700.701 - Training and Instruction 80 686 2,000 0700.702 - General Service Agreement 35,796 33,127 40,000 35,140700.703 - Maintenance of Equipment 58,741 7,844 0 8,237
20 - Contract services Total 94,617 41,657 42,000 43,37725 - Cost allocation
800.801 - Equipment Reimbursement 0 45,900 4,501 5,758800.802 - IT Reimbursement 28,042 47,810 42,563 30,974800.805 - CC CAP Allocation 8,485 5,987 4,429 4,631800.806 - CM CAP Allocation 2,272 1,854 1,865 1,677800.814 - Finance CAP Alloc 12,680 13,611 18,128 23,016800.815 - Human resources CAP Alloc 14,550 12,694 12,918 11,587800.821 - Building Maintenance CAP 0 0 0 4,006
25 - Cost allocation Total 66,029 127,856 84,404 81,649
238

Appendix A-4 Year Expenditure Trends at the Account Level by Program
Department
FY17 Actuals
FY18 Actuals
FY19 Final Budget
FY20 Proposed
Budget30 - Capital outlays
900.990 - Special Projects - PW 128,318 (23,995) 0 030 - Capital outlays Total 128,318 (23,995) 0 0
35 - Contingencies719.705 - Contingencies 0 0 10,199 7,349
35 - Contingencies Total 0 0 10,199 7,349845 Traffic Signal Maintenance Total 637,134 506,921 526,530 554,759
239

Appendix A-4 Year Expenditure Trends at the Account Level by Program
Department
FY17 Actuals
FY18 Actuals
FY19 Final Budget
FY20 Proposed
Budget846 Safe Routes 2 School
05 - Employee compensation500.501 - Salaries Full Time 0 83,867 88,945 92,647500.502 - Salaries Part Time 0 14,432 16,127 16,915500.505 - Overtime 0 0 500 0500.513 - Sick Leave 0 0 531 564
05 - Employee compensation Total 0 98,299 106,103 110,12610 - Employee benefits
501.500 - Retirement System 0 21,421 23,911 24,999501.502 - Pers 1959 Surv Empr 0 58 60 61501.505 - Health Insurance 0 8,773 9,471 9,798501.506 - Dental Insurance 0 1,518 1,522 1,537501.507 - Medicare 0 1,382 1,521 1,588501.508 - Life Insurance 0 685 720 727501.509 - Long Term Disability 0 856 953 990501.510 - Workers Compensation 0 0 2,491 1,155501.511 - Vision Insurance 0 174 180 181501.513 - Rec Bucks 0 0 0 404
10 - Employee benefits Total 0 34,867 40,829 41,44015 - Materials
600.601 - General Office Supplies 0 801 200 76600.602 - Printing and Duplication 0 8,065 3,500 6,874600.605 - Meeting Expenses 0 0 0 315600.608 - Sml Tools and Equipment 0 0 0 62600.613 - General Supplies 0 7,502 25,000 9,629600.629 - Conference and Training 0 2,680 2,500 1,575600.632 - Mileage Reimbursement 0 208 175 0600.635 - Special Departmental Exp 0 0 0 218600.642 - Telphone and Data Services 0 1,671 1,200 1,139
15 - Materials Total 0 20,926 32,575 19,88820 - Contract services
700.701 - Training and Instruction 0 0 1,000 420700.702 - General Service Agreement 0 16,646 234,000 281,413
20 - Contract services Total 0 16,646 235,000 281,83325 - Cost allocation
800.801 - Equipment Reimbursement 0 0 1,518 1,942800.802 - IT Reimbursement 0 9,562 17,095 12,440800.805 - CC CAP Allocation 0 0 0 3,173800.806 - CM CAP Allocation 0 0 0 1,103800.811 - Public Affairs CAP Alloc 0 0 0 5,120800.814 - Finance CAP Alloc 0 0 0 17,664800.815 - Human resources CAP Alloc 0 0 0 40,607800.821 - Building Maintenance CAP 0 0 0 3,355
240

Appendix A-4 Year Expenditure Trends at the Account Level by Program
Department
FY17 Actuals
FY18 Actuals
FY19 Final Budget
FY20 Proposed
Budget25 - Cost allocation Total 0 9,562 18,613 85,404
35 - Contingencies719.705 - Contingencies 0 0 13,379 15,086
35 - Contingencies Total 0 0 13,379 15,086846 Safe Routes 2 School Total 0 180,301 446,499 553,777
88 Transportation Total 2,458,189 2,147,655 2,419,724 2,033,559
241

Appendix A-4 Year Expenditure Trends at the Account Level by Program
Department
FY17 Actuals
FY18 Actuals
FY19 Final Budget
FY20 Proposed
Budget90 Citywide - Non Departmental
978 Minor Storm Drain Impv30 - Capital outlays
900.905 - Facility Improvements 4,000 9,000 0 030 - Capital outlays Total 4,000 9,000 0 0
978 Minor Storm Drain Impv Total 4,000 9,000 0 0
242

Appendix A-4 Year Expenditure Trends at the Account Level by Program
Department
FY17 Actuals
FY18 Actuals
FY19 Final Budget
FY20 Proposed
Budget985 Fixed Assets Acquisition
31 - Special projects900.945 - Fixed Asset Acquisition 5,217 (57,290) 538,000 594,100
31 - Special projects Total 5,217 (57,290) 538,000 594,100985 Fixed Assets Acquisition Total 5,217 (57,290) 538,000 594,100
90 Citywide - Non Departmental Total 9,217 (48,290) 538,000 594,100Public works Total 33,185,476 34,968,484 34,629,686 30,744,275
243

Appendix A-4 Year Expenditure Trends at the Account Level by Program
Department
FY17 Actuals
FY18 Actuals
FY19 Final Budget
FY20 Proposed
BudgetRecreation services
60 Administration601 Rec & Comm Svcs Administration
05 - Employee compensation500.501 - Salaries Full Time 126,104 252,025 420,374 608,198500.502 - Salaries Part Time 17,691 45,569 36,900 36,909500.505 - Overtime 209 834 0 7,751500.506 - Car Allowance 1,710 3,289 5,701 5,696
05 - Employee compensation Total 145,714 301,717 462,975 658,55410 - Employee benefits
501.500 - Retirement System 30,115 62,475 113,531 173,214501.502 - Pers 1959 Surv Empr 65 114 171 277501.505 - Health Insurance 14,699 27,965 48,767 73,968501.506 - Dental Insurance 1,547 2,971 4,338 6,993501.507 - Medicare 2,105 4,468 6,780 9,354501.508 - Life Insurance 691 1,255 1,918 3,206501.509 - Long Term Disability 843 1,904 3,297 5,108501.510 - Workers Compensation 4,580 5,952 7,125 4,100501.511 - Vision Insurance 190 342 513 824501.513 - Rec Bucks 0 0 0 1,839501.516 - Hra City Contribution 24,130 0 0 0
10 - Employee benefits Total 78,966 107,447 186,440 278,88315 - Materials
600.601 - General Office Supplies 7,349 1,006 5,600 1,720600.602 - Printing and Duplication 0 0 206 84,450600.604 - Postage 0 0 0 20,000600.605 - Meeting Expenses 575 109 1,100 3,485600.608 - Sml Tools and Equipment 0 0 0 1,400600.613 - General Supplies 4,386 489 2,100 6,000600.629 - Conference and Training 8,057 7,241 22,000 54,938600.632 - Mileage Reimbursement 33 148 300 0600.635 - Special Departmental Exp 7,500 0 0 0600.642 - Telphone and Data Services 1,611 2,185 2,100 757600.647 - Memberships and Dues 0 0 0 8,551600.650 - Special Dept Expense 42,940 39,003 41,115 0
15 - Materials Total 72,451 50,180 74,521 181,30120 - Contract services
700.701 - Training and Instruction 800 27,050 40,500 0700.702 - General Service Agreement 27,160 0 0 7,980700.704 - Insurance Fees, Claims, Premiums 0 0 0 28,700700.707 - Bank Charges 0 0 0 36,232
20 - Contract services Total 27,960 27,050 40,500 72,91225 - Cost allocation
244

Appendix A-4 Year Expenditure Trends at the Account Level by Program
Department
FY17 Actuals
FY18 Actuals
FY19 Final Budget
FY20 Proposed
Budget800.801 - Equipment Reimbursement 0 0 3,030 3,989800.802 - IT Reimbursement 29,893 36,814 32,396 23,574800.805 - CC CAP Allocation 8,350 0 0 0800.806 - CM CAP Allocation 150,114 0 0 0800.809 - City Clerk CAP Alloc 87,994 0 0 0800.810 - City Attorney CAP Alloc 83,561 0 0 0800.814 - Finance CAP Alloc 13,528 0 0 0800.815 - Human resources CAP Alloc 283,303 0 0 0800.817 - Community Hall/Quinlan CAP 2,054 0 0 0
25 - Cost allocation Total 658,797 36,814 35,426 27,56331 - Special projects
900.945 - Fixed Asset Acquisition 2,468 0 0 031 - Special projects Total 2,468 0 0 0
35 - Contingencies719.705 - Contingencies 0 0 4,276 10,899
35 - Contingencies Total 0 0 4,276 10,899601 Rec & Comm Svcs Administration Total 986,356 523,208 804,138 1,230,112
245

Appendix A-4 Year Expenditure Trends at the Account Level by Program
Department
FY17 Actuals
FY18 Actuals
FY19 Final Budget
FY20 Proposed
Budget634 Park Planning and Restoration
05 - Employee compensation500.501 - Salaries Full Time 143,496 151,063 153,090 0
05 - Employee compensation Total 143,496 151,063 153,090 010 - Employee benefits
501.500 - Retirement System 38,295 38,968 41,155 0501.502 - Pers 1959 Surv Empr 58 60 60 0501.505 - Health Insurance 13,394 15,247 16,100 0501.506 - Dental Insurance 1,426 1,551 1,522 0501.507 - Medicare 2,102 2,175 2,220 0501.508 - Life Insurance 780 714 720 0501.509 - Long Term Disability 959 1,222 1,329 0501.510 - Workers Compensation 0 3,132 2,491 0501.511 - Vision Insurance 182 178 180 0501.516 - Hra City Contribution 527 0 0 0
10 - Employee benefits Total 57,721 63,248 65,777 015 - Materials
600.601 - General Office Supplies 73 50 750 0600.608 - Sml Tools and Equipment 0 0 500 0600.613 - General Supplies 0 61 1,000 0600.618 - Utilities and Phone 0 0 200 0600.629 - Conference and Training 1,325 911 4,300 0600.632 - Mileage Reimbursement 43 193 550 0600.642 - Telphone and Data Services 1,020 0 0 0600.650 - Special Dept Expense 0 1,140 4,200 0
15 - Materials Total 2,461 2,354 11,500 020 - Contract services
700.702 - General Service Agreement 0 1,050 10,000 020 - Contract services Total 0 1,050 10,000 0
25 - Cost allocation800.801 - Equipment Reimbursement 0 0 53 0800.802 - IT Reimbursement 16,938 0 8,605 0800.805 - CC CAP Allocation 3,506 2,911 2,083 0800.806 - CM CAP Allocation 915 900 860 0800.814 - Finance CAP Alloc 6,160 6,626 8,815 0800.815 - Human resources CAP Alloc 7,275 6,225 6,766 0
25 - Cost allocation Total 34,794 16,662 27,182 0634 Park Planning and Restoration Total 238,472 234,377 267,549 0
246

Appendix A-4 Year Expenditure Trends at the Account Level by Program
Department
FY17 Actuals
FY18 Actuals
FY19 Final Budget
FY20 Proposed
Budget636 Library Services
20 - Contract services700.702 - General Service Agreement 443,106 449,295 468,023 117,000
20 - Contract services Total 443,106 449,295 468,023 117,00025 - Cost allocation
800.805 - CC CAP Allocation 1,624 1,559 2,882 2,261800.806 - CM CAP Allocation 488 565 1,415 965800.814 - Finance CAP Alloc 64 70 1,436 1,073800.817 - Community Hall/Quinlan CAP 0 3,438 0 0800.820 - Grounds Maintenance CAP 127,077 175,468 193,990 204,590800.821 - Building Maintenance CAP 0 0 301,759 472,151800.822 - Library Facilities CAP 586,459 152,921 0 0
25 - Cost allocation Total 715,712 334,021 501,482 681,040636 Library Services Total 1,158,818 783,316 969,505 798,040
60 Administration Total 2,383,646 1,540,901 2,041,192 2,028,152
247

Appendix A-4 Year Expenditure Trends at the Account Level by Program
Department
FY17 Actuals
FY18 Actuals
FY19 Final Budget
FY20 Proposed
Budget61 Business and Community Services
602 Administration05 - Employee compensation
500.501 - Salaries Full Time 360,271 417,346 482,849 386,046500.502 - Salaries Part Time 0 4,348 10,000 4,565500.505 - Overtime 1,381 8,143 0 0500.506 - Car Allowance 1,802 2,230 2,642 1,212
05 - Employee compensation Total 363,454 432,066 495,491 391,82310 - Employee benefits
501.500 - Retirement System 94,159 107,697 129,807 103,311501.502 - Pers 1959 Surv Empr 307 347 369 304501.505 - Health Insurance 48,964 70,366 81,364 66,775501.506 - Dental Insurance 7,360 8,934 9,208 7,684501.507 - Medicare 5,250 6,164 7,044 5,663501.508 - Life Insurance 3,048 3,195 3,428 3,055501.509 - Long Term Disability 3,053 4,505 5,202 4,165501.510 - Workers Compensation 12,988 19,560 15,097 6,468501.511 - Vision Insurance 939 1,023 1,089 906501.513 - Rec Bucks 0 0 0 2,020501.516 - Hra City Contribution 2,819 0 0 0
10 - Employee benefits Total 178,886 221,792 252,608 200,35115 - Materials
600.601 - General Office Supplies 10,952 420 3,000 500600.605 - Meeting Expenses 0 0 0 600600.613 - General Supplies 2,143 3,719 17,650 0600.629 - Conference and Training 200 3,554 6,000 212600.632 - Mileage Reimbursement 30 51 200 0600.642 - Telphone and Data Services 837 943 3,320 604600.647 - Memberships and Dues 0 0 0 405
15 - Materials Total 14,163 8,687 30,170 2,32120 - Contract services
700.701 - Training and Instruction 1,063 1,483 6,000 0700.702 - General Service Agreement 0 2,329 2,500 0
20 - Contract services Total 1,063 3,811 8,500 025 - Cost allocation
800.801 - Equipment Reimbursement 0 0 1,785 2,253800.802 - IT Reimbursement 76,526 61,674 65,564 47,711800.805 - CC CAP Allocation 16,858 13,386 9,525 13,095800.806 - CM CAP Allocation 4,314 3,966 3,835 4,569800.814 - Finance CAP Alloc 29,617 15,549 19,508 27,193800.815 - Human resources CAP Alloc 39,431 35,613 35,073 39,438800.821 - Building Maintenance CAP 0 0 0 13,636
25 - Cost allocation Total 166,746 130,188 135,290 147,895
248

Appendix A-4 Year Expenditure Trends at the Account Level by Program
Department
FY17 Actuals
FY18 Actuals
FY19 Final Budget
FY20 Proposed
Budget31 - Special projects
900.945 - Fixed Asset Acquisition 0 5,313 0 031 - Special projects Total 0 5,313 0 0
35 - Contingencies719.705 - Contingencies 0 0 1,934 116
35 - Contingencies Total 0 0 1,934 116602 Administration Total 724,312 801,857 923,993 742,506
249

Appendix A-4 Year Expenditure Trends at the Account Level by Program
Department
FY17 Actuals
FY18 Actuals
FY19 Final Budget
FY20 Proposed
Budget605 Cultural Events
05 - Employee compensation500.501 - Salaries Full Time 74,647 69,744 73,193 44,189500.502 - Salaries Part Time 10,022 22,063 190,380 20,546500.505 - Overtime 5,152 11,619 0 0500.506 - Car Allowance 600 512 480 0
05 - Employee compensation Total 90,421 103,939 264,053 64,73510 - Employee benefits
501.500 - Retirement System 19,490 18,454 21,947 11,796501.502 - Pers 1959 Surv Empr 51 58 47 30501.505 - Health Insurance 8,996 14,629 15,312 10,827501.506 - Dental Insurance 1,248 1,512 1,173 768501.507 - Medicare 1,266 1,479 3,603 916501.508 - Life Insurance 567 642 545 364501.509 - Long Term Disability 623 838 784 462501.510 - Workers Compensation 753 2,508 1,943 808501.511 - Vision Insurance 159 175 139 91501.513 - Rec Bucks 0 0 0 202501.516 - Hra City Contribution 465 0 0 0
10 - Employee benefits Total 33,619 40,295 45,493 26,26415 - Materials
600.601 - General Office Supplies 0 24 0 0600.613 - General Supplies 3,714 12,806 23,750 7,798600.632 - Mileage Reimbursement 3 42 100 0
15 - Materials Total 3,717 12,872 23,850 7,79820 - Contract services
700.701 - Training and Instruction 2,658 0 0 0700.702 - General Service Agreement 82,744 124,216 196,096 134,179700.706 - Rent Expense 0 20,327 21,400 19,028
20 - Contract services Total 85,402 144,543 217,496 153,20725 - Cost allocation
800.801 - Equipment Reimbursement 0 0 41 47800.802 - IT Reimbursement 13,433 11,474 7,807 5,681800.805 - CC CAP Allocation 1,859 2,722 2,350 3,551800.806 - CM CAP Allocation 513 810 966 1,273800.814 - Finance CAP Alloc 8,469 9,544 14,144 19,898800.815 - Human resources CAP Alloc 13,015 18,135 19,901 9,353800.821 - Building Maintenance CAP 0 0 0 3,234
25 - Cost allocation Total 37,289 42,685 45,209 43,03731 - Special projects
900.945 - Fixed Asset Acquisition 1,582 0 40,000 031 - Special projects Total 1,582 0 40,000 0
35 - Contingencies
250

Appendix A-4 Year Expenditure Trends at the Account Level by Program
Department
FY17 Actuals
FY18 Actuals
FY19 Final Budget
FY20 Proposed
Budget719.705 - Contingencies 0 0 10,517 7,818
35 - Contingencies Total 0 0 10,517 7,818605 Cultural Events Total 252,030 344,334 646,618 302,859
251

Appendix A-4 Year Expenditure Trends at the Account Level by Program
Department
FY17 Actuals
FY18 Actuals
FY19 Final Budget
FY20 Proposed
Budget630 Facilities
05 - Employee compensation500.501 - Salaries Full Time 211,878 211,495 198,961 188,758500.502 - Salaries Part Time 76,088 90,913 130,141 95,459500.505 - Overtime 268 1,982 0 0500.506 - Car Allowance 1,802 1,648 1,561 1,212500.513 - Sick Leave 404 374 0 0
05 - Employee compensation Total 290,439 306,411 330,663 285,42910 - Employee benefits
501.500 - Retirement System 56,242 55,388 55,132 51,726501.502 - Pers 1959 Surv Empr 179 174 162 152501.505 - Health Insurance 28,233 28,366 27,102 31,354501.506 - Dental Insurance 4,461 4,501 4,080 3,842501.507 - Medicare 4,163 4,419 4,742 4,122501.508 - Life Insurance 1,670 1,943 1,904 1,526501.509 - Long Term Disability 1,837 2,213 2,156 2,039501.510 - Workers Compensation 3,652 8,604 6,676 3,061501.511 - Vision Insurance 561 519 483 453501.513 - Rec Bucks 0 0 0 1,010501.516 - Hra City Contribution 1,432 0 0 0
10 - Employee benefits Total 102,430 106,126 102,437 99,28515 - Materials
600.601 - General Office Supplies 8,139 6,912 10,600 7,500600.602 - Printing and Duplication 9,938 9,924 11,260 0600.604 - Postage 17 0 6,145 0600.605 - Meeting Expenses 0 0 0 600600.608 - Sml Tools and Equipment 3,575 0 0 5,000600.611 - Uniforms/Safety Appar 0 18 1,000 750600.613 - General Supplies 15,831 25,597 26,300 15,200600.621 - Calrecylce City Payment Prgm Adm 714 0 0 0600.622 - State Mandated Cost 0 0 360 0600.632 - Mileage Reimbursement 90 70 400 0600.642 - Telphone and Data Services 9,570 9,122 12,400 1,060600.644 - Sewer Service 3,513 4,362 0 0600.651 - Property Tax 0 650 0 0
15 - Materials Total 51,386 56,656 68,465 30,11020 - Contract services
700.701 - Training and Instruction 1,234 858 5,500 0700.702 - General Service Agreement 8,739 6,178 7,000 4,020700.703 - Maintenance of Equipment 5,054 1,174 4,500 1,200
20 - Contract services Total 15,028 8,210 17,000 5,22025 - Cost allocation
800.801 - Equipment Reimbursement 0 7,680 142 180
252
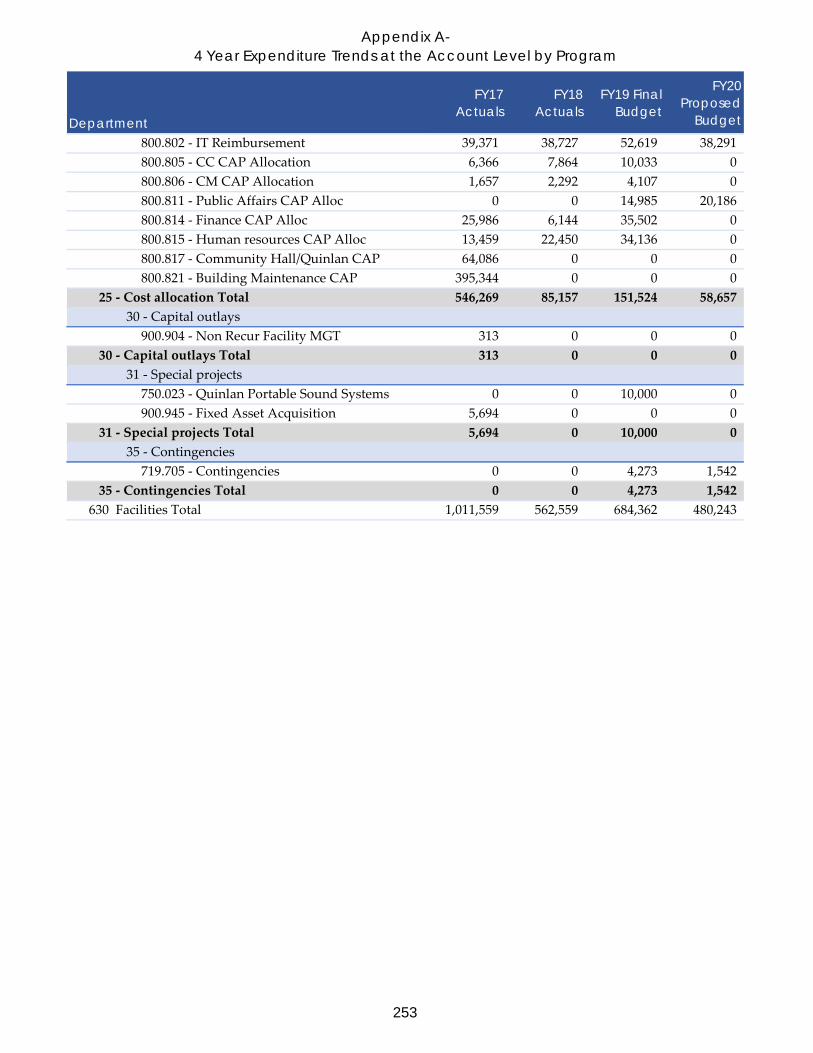
Appendix A-4 Year Expenditure Trends at the Account Level by Program
Department
FY17 Actuals
FY18 Actuals
FY19 Final Budget
FY20 Proposed
Budget800.802 - IT Reimbursement 39,371 38,727 52,619 38,291800.805 - CC CAP Allocation 6,366 7,864 10,033 0800.806 - CM CAP Allocation 1,657 2,292 4,107 0800.811 - Public Affairs CAP Alloc 0 0 14,985 20,186800.814 - Finance CAP Alloc 25,986 6,144 35,502 0800.815 - Human resources CAP Alloc 13,459 22,450 34,136 0800.817 - Community Hall/Quinlan CAP 64,086 0 0 0800.821 - Building Maintenance CAP 395,344 0 0 0
25 - Cost allocation Total 546,269 85,157 151,524 58,65730 - Capital outlays
900.904 - Non Recur Facility MGT 313 0 0 030 - Capital outlays Total 313 0 0 0
31 - Special projects750.023 - Quinlan Portable Sound Systems 0 0 10,000 0900.945 - Fixed Asset Acquisition 5,694 0 0 0
31 - Special projects Total 5,694 0 10,000 035 - Contingencies
719.705 - Contingencies 0 0 4,273 1,54235 - Contingencies Total 0 0 4,273 1,542
630 Facilities Total 1,011,559 562,559 684,362 480,243
253

Appendix A-4 Year Expenditure Trends at the Account Level by Program
Department
FY17 Actuals
FY18 Actuals
FY19 Final Budget
FY20 Proposed
Budget632 Comm Outreach & Neigh Watch
05 - Employee compensation500.501 - Salaries Full Time 96,757 85,592 55,440 0500.502 - Salaries Part Time 30,543 30,896 43,443 0500.505 - Overtime 0 98 0 0500.506 - Car Allowance 600 318 120 0
05 - Employee compensation Total 127,900 116,904 99,003 010 - Employee benefits
501.500 - Retirement System 25,614 22,693 15,456 0501.502 - Pers 1959 Surv Empr 68 66 63 0501.505 - Health Insurance 11,711 11,539 10,520 0501.506 - Dental Insurance 1,701 1,715 1,599 0501.507 - Medicare 1,804 1,647 1,420 0501.508 - Life Insurance 782 658 613 0501.509 - Long Term Disability 816 1,018 1,114 0501.510 - Workers Compensation 630 3,288 1,993 0501.511 - Vision Insurance 217 199 190 0501.516 - Hra City Contribution 624 0 0 0
10 - Employee benefits Total 43,967 42,824 32,968 015 - Materials
600.601 - General Office Supplies 44 510 4,500 0600.602 - Printing and Duplication 0 183 1,600 0600.613 - General Supplies 7,563 7,392 10,750 0600.629 - Conference and Training 1,968 75 2,000 0600.632 - Mileage Reimbursement 13 7 400 0
15 - Materials Total 9,588 8,166 19,250 020 - Contract services
700.701 - Training and Instruction 585 0 1,000 0700.702 - General Service Agreement 1,987 1,558 5,000 0700.703 - Maintenance of Equipment 608 211 0 0700.704 - Insurance Fees, Claims, Premiums 0 0 3,500 0
20 - Contract services Total 3,181 1,769 9,500 025 - Cost allocation
800.801 - Equipment Reimbursement 0 0 42 0800.802 - IT Reimbursement 19,742 20,558 9,291 0800.805 - CC CAP Allocation 2,447 2,665 2,665 0800.806 - CM CAP Allocation 631 796 1,082 0800.811 - Public Affairs CAP Alloc 0 0 3,972 0800.814 - Finance CAP Alloc 9,342 9,814 12,656 0800.815 - Human resources CAP Alloc 5,456 6,848 9,434 0800.817 - Community Hall/Quinlan CAP 9,305 1,719 0 0800.821 - Building Maintenance CAP 4,802 0 0 0
25 - Cost allocation Total 51,725 42,400 39,142 0
254

Appendix A-4 Year Expenditure Trends at the Account Level by Program
Department
FY17 Actuals
FY18 Actuals
FY19 Final Budget
FY20 Proposed
Budget35 - Contingencies
719.705 - Contingencies 0 0 1,388 035 - Contingencies Total 0 0 1,388 0
632 Comm Outreach & Neigh Watch Total 236,361 212,063 201,251 061 Business and Community Services Total 2,224,263 1,920,813 2,456,224 1,525,608
255

Appendix A-4 Year Expenditure Trends at the Account Level by Program
Department
FY17 Actuals
FY18 Actuals
FY19 Final Budget
FY20 Proposed
Budget62 Recreation and Education
608 Administration05 - Employee compensation
500.501 - Salaries Full Time 391,971 336,419 240,754 266,701500.502 - Salaries Part Time 31,610 84,502 110,530 88,728500.505 - Overtime 3,652 1,377 5,000 0500.506 - Car Allowance 2,641 2,640 1,800 2,303500.513 - Sick Leave 276 386 0 0
05 - Employee compensation Total 430,150 425,324 358,084 357,73210 - Employee benefits
501.500 - Retirement System 103,336 87,218 78,621 72,484501.502 - Pers 1959 Surv Empr 292 253 195 204501.505 - Health Insurance 52,520 50,964 42,342 33,417501.506 - Dental Insurance 7,193 6,489 4,874 5,150501.507 - Medicare 6,307 5,957 5,139 5,155501.508 - Life Insurance 3,053 2,587 1,981 2,116501.509 - Long Term Disability 3,243 3,511 2,612 2,871501.510 - Workers Compensation 17,402 10,488 7,972 3,869501.511 - Vision Insurance 922 756 576 606501.513 - Rec Bucks 0 0 0 1,352501.516 - Hra City Contribution 2,776 0 0 0
10 - Employee benefits Total 197,044 168,223 144,312 127,22415 - Materials
600.601 - General Office Supplies 4,254 1,926 6,995 3,000600.602 - Printing and Duplication 0 210 650 0600.605 - Meeting Expenses 0 0 5,500 300600.611 - Uniforms/Safety Appar 0 0 0 330600.613 - General Supplies 4,272 21,229 18,335 800600.629 - Conference and Training 2,696 7,764 12,000 2,000600.632 - Mileage Reimbursement 80 91 216 50600.642 - Telphone and Data Services 9,364 9,154 10,155 5,520600.647 - Memberships and Dues 0 0 0 1,310
15 - Materials Total 20,666 40,374 53,851 13,31020 - Contract services
700.701 - Training and Instruction 588 3,263 3,000 0700.702 - General Service Agreement 8,906 17,574 26,750 1,800700.703 - Maintenance of Equipment 722 4 1,000 1,000
20 - Contract services Total 10,216 20,840 30,750 2,80025 - Cost allocation
800.801 - Equipment Reimbursement 0 0 183 227800.802 - IT Reimbursement 89,046 49,435 223,771 165,111800.805 - CC CAP Allocation 17,829 15,292 11,752 14,622800.806 - CM CAP Allocation 4,584 4,551 4,801 5,172
256
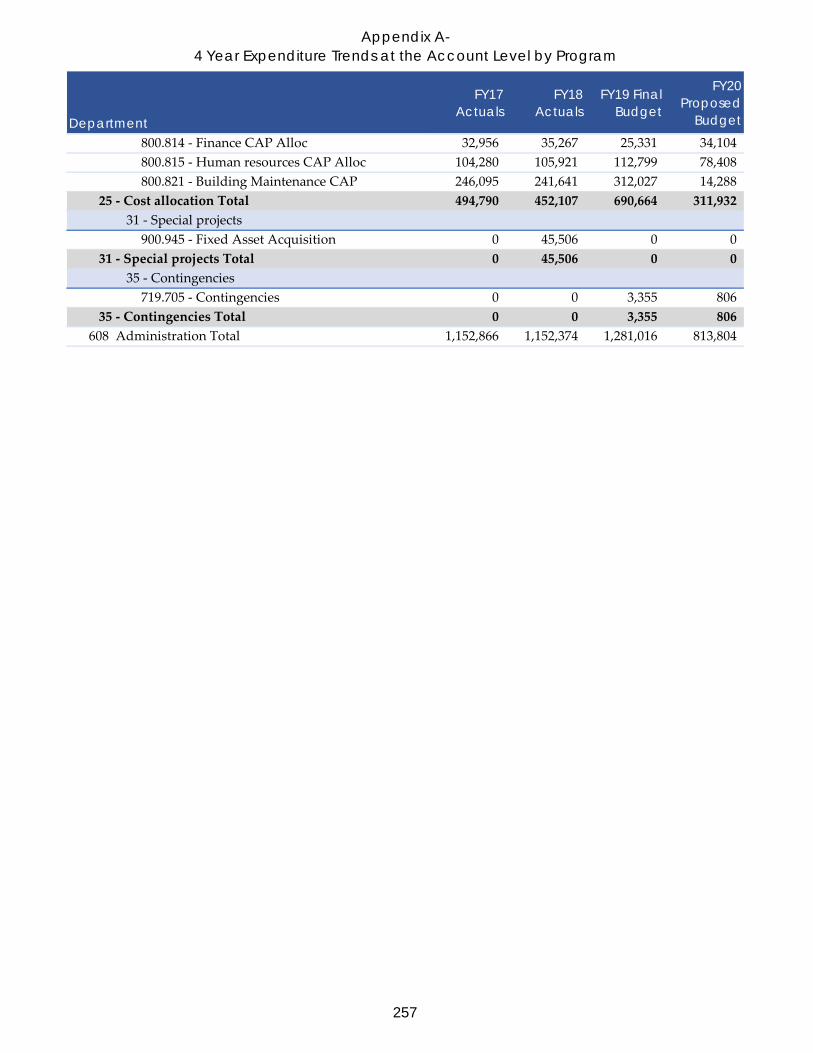
Appendix A-4 Year Expenditure Trends at the Account Level by Program
Department
FY17 Actuals
FY18 Actuals
FY19 Final Budget
FY20 Proposed
Budget800.814 - Finance CAP Alloc 32,956 35,267 25,331 34,104800.815 - Human resources CAP Alloc 104,280 105,921 112,799 78,408800.821 - Building Maintenance CAP 246,095 241,641 312,027 14,288
25 - Cost allocation Total 494,790 452,107 690,664 311,93231 - Special projects
900.945 - Fixed Asset Acquisition 0 45,506 0 031 - Special projects Total 0 45,506 0 0
35 - Contingencies719.705 - Contingencies 0 0 3,355 806
35 - Contingencies Total 0 0 3,355 806608 Administration Total 1,152,866 1,152,374 1,281,016 813,804
257
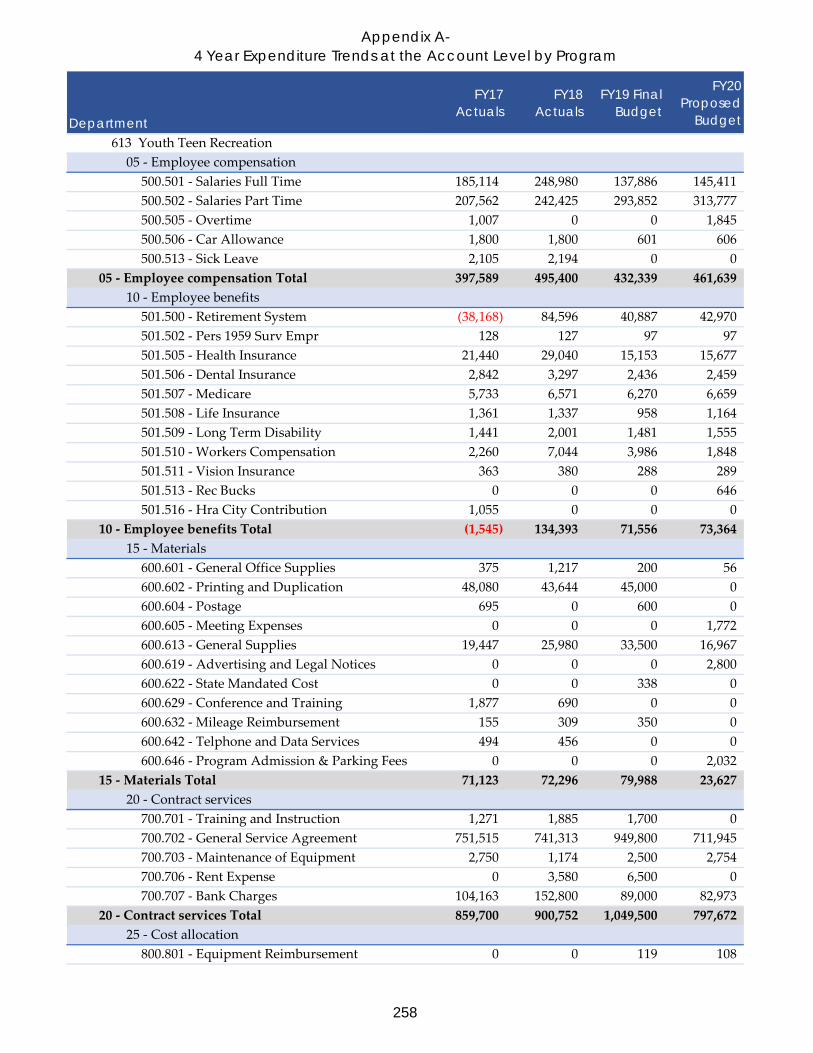
Appendix A-4 Year Expenditure Trends at the Account Level by Program
Department
FY17 Actuals
FY18 Actuals
FY19 Final Budget
FY20 Proposed
Budget613 Youth Teen Recreation
05 - Employee compensation500.501 - Salaries Full Time 185,114 248,980 137,886 145,411500.502 - Salaries Part Time 207,562 242,425 293,852 313,777500.505 - Overtime 1,007 0 0 1,845500.506 - Car Allowance 1,800 1,800 601 606500.513 - Sick Leave 2,105 2,194 0 0
05 - Employee compensation Total 397,589 495,400 432,339 461,63910 - Employee benefits
501.500 - Retirement System (38,168) 84,596 40,887 42,970501.502 - Pers 1959 Surv Empr 128 127 97 97501.505 - Health Insurance 21,440 29,040 15,153 15,677501.506 - Dental Insurance 2,842 3,297 2,436 2,459501.507 - Medicare 5,733 6,571 6,270 6,659501.508 - Life Insurance 1,361 1,337 958 1,164501.509 - Long Term Disability 1,441 2,001 1,481 1,555501.510 - Workers Compensation 2,260 7,044 3,986 1,848501.511 - Vision Insurance 363 380 288 289501.513 - Rec Bucks 0 0 0 646501.516 - Hra City Contribution 1,055 0 0 0
10 - Employee benefits Total (1,545) 134,393 71,556 73,36415 - Materials
600.601 - General Office Supplies 375 1,217 200 56600.602 - Printing and Duplication 48,080 43,644 45,000 0600.604 - Postage 695 0 600 0600.605 - Meeting Expenses 0 0 0 1,772600.613 - General Supplies 19,447 25,980 33,500 16,967600.619 - Advertising and Legal Notices 0 0 0 2,800600.622 - State Mandated Cost 0 0 338 0600.629 - Conference and Training 1,877 690 0 0600.632 - Mileage Reimbursement 155 309 350 0600.642 - Telphone and Data Services 494 456 0 0600.646 - Program Admission & Parking Fees 0 0 0 2,032
15 - Materials Total 71,123 72,296 79,988 23,62720 - Contract services
700.701 - Training and Instruction 1,271 1,885 1,700 0700.702 - General Service Agreement 751,515 741,313 949,800 711,945700.703 - Maintenance of Equipment 2,750 1,174 2,500 2,754700.706 - Rent Expense 0 3,580 6,500 0700.707 - Bank Charges 104,163 152,800 89,000 82,973
20 - Contract services Total 859,700 900,752 1,049,500 797,67225 - Cost allocation
800.801 - Equipment Reimbursement 0 0 119 108
258
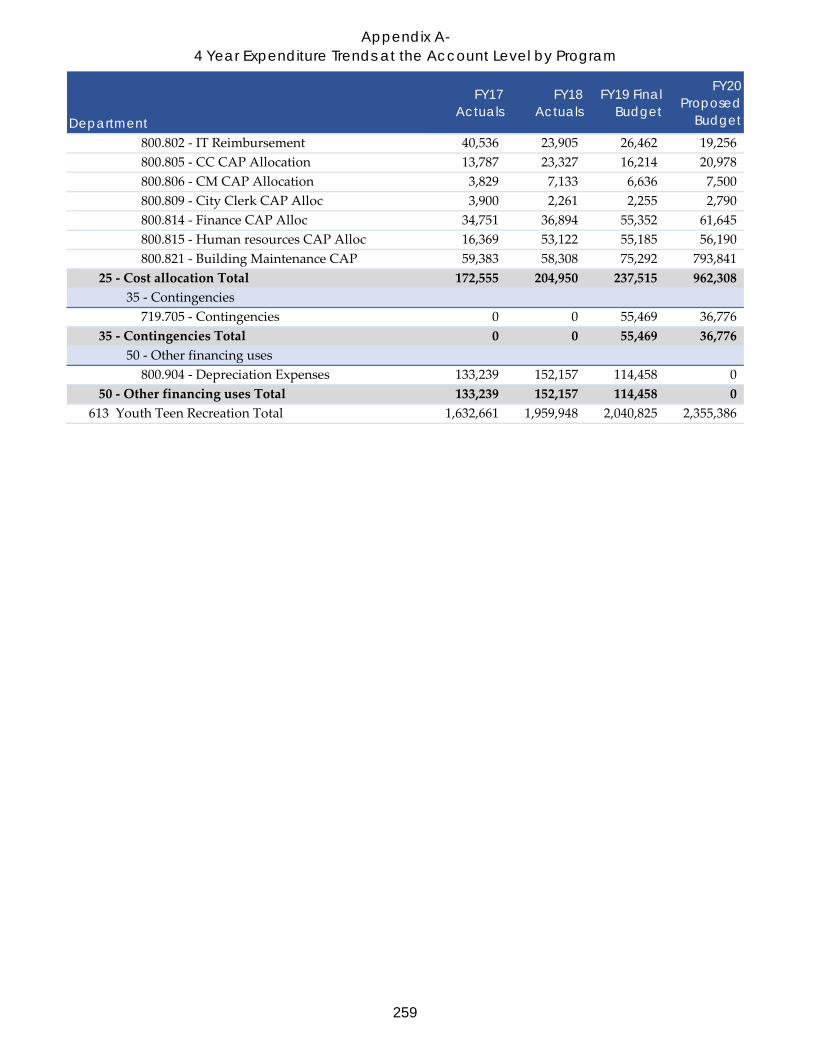
Appendix A-4 Year Expenditure Trends at the Account Level by Program
Department
FY17 Actuals
FY18 Actuals
FY19 Final Budget
FY20 Proposed
Budget800.802 - IT Reimbursement 40,536 23,905 26,462 19,256800.805 - CC CAP Allocation 13,787 23,327 16,214 20,978800.806 - CM CAP Allocation 3,829 7,133 6,636 7,500800.809 - City Clerk CAP Alloc 3,900 2,261 2,255 2,790800.814 - Finance CAP Alloc 34,751 36,894 55,352 61,645800.815 - Human resources CAP Alloc 16,369 53,122 55,185 56,190800.821 - Building Maintenance CAP 59,383 58,308 75,292 793,841
25 - Cost allocation Total 172,555 204,950 237,515 962,30835 - Contingencies
719.705 - Contingencies 0 0 55,469 36,77635 - Contingencies Total 0 0 55,469 36,776
50 - Other financing uses800.904 - Depreciation Expenses 133,239 152,157 114,458 0
50 - Other financing uses Total 133,239 152,157 114,458 0613 Youth Teen Recreation Total 1,632,661 1,959,948 2,040,825 2,355,386
259

Appendix A-4 Year Expenditure Trends at the Account Level by Program
Department
FY17 Actuals
FY18 Actuals
FY19 Final Budget
FY20 Proposed
Budget623 Youth, Teen and Senior Adult Rec
05 - Employee compensation500.501 - Salaries Full Time 276,399 368,831 440,519 398,615500.502 - Salaries Part Time 163,603 205,908 369,044 124,928500.505 - Overtime 7,684 4,467 8,450 11,500500.506 - Car Allowance 239 240 601 121500.513 - Sick Leave 1,581 1,914 0 0
05 - Employee compensation Total 449,507 581,360 818,614 535,16410 - Employee benefits
501.500 - Retirement System 80,999 102,037 136,252 106,884501.502 - Pers 1959 Surv Empr 301 338 314 284501.505 - Health Insurance 35,825 48,781 60,139 56,827501.506 - Dental Insurance 4,988 6,691 7,916 7,146501.507 - Medicare 6,480 8,490 11,747 7,503501.508 - Life Insurance 2,192 2,660 3,301 3,120501.509 - Long Term Disability 2,256 3,661 4,733 4,224501.510 - Workers Compensation 6,587 12,828 12,954 5,371501.511 - Vision Insurance 637 763 936 842501.513 - Rec Bucks 0 0 0 1,880501.516 - Hra City Contribution 1,880 0 0 0
10 - Employee benefits Total 142,146 186,248 238,292 194,08115 - Materials
600.601 - General Office Supplies 3,367 3,578 7,225 3,320600.602 - Printing and Duplication 0 7,103 18,750 15,029600.604 - Postage 0 420 6,700 485600.605 - Meeting Expenses 0 56,516 80,560 250600.606 - Software 0 0 140 0600.608 - Sml Tools and Equipment 0 184 0 350600.611 - Uniforms/Safety Appar 67 0 2,400 0600.613 - General Supplies 20,082 32,308 54,325 76,120600.623 - Grant Expenditures 91 0 0 0600.629 - Conference and Training 0 0 4,000 0600.632 - Mileage Reimbursement 155 682 1,775 800600.639 - Special Program Expenses 311,405 (62) 0 0600.642 - Telphone and Data Services 6,229 6,428 6,340 3,840600.646 - Program Admission & Parking Fees 0 20,566 38,770 22,500
15 - Materials Total 341,397 127,725 220,985 122,69420 - Contract services
700.701 - Training and Instruction 12,893 14,560 16,000 0700.702 - General Service Agreement 81,008 232,417 284,720 191,875700.703 - Maintenance of Equipment 4,337 2,022 8,500 0700.707 - Bank Charges 160 7,677 8,000 0
20 - Contract services Total 98,398 256,676 317,220 191,875
260

Appendix A-4 Year Expenditure Trends at the Account Level by Program
Department
FY17 Actuals
FY18 Actuals
FY19 Final Budget
FY20 Proposed
Budget25 - Cost allocation
800.801 - Equipment Reimbursement 0 0 3,194 4,063800.802 - IT Reimbursement 68,501 50,965 170,389 123,991800.805 - CC CAP Allocation 17,764 19,513 15,212 20,949800.806 - CM CAP Allocation 4,718 5,852 6,250 7,424800.811 - Public Affairs CAP Alloc 0 0 20,810 30,943800.814 - Finance CAP Alloc 57,344 66,024 61,267 90,968800.815 - Human resources CAP Alloc 64,362 82,122 87,007 58,633800.817 - Community Hall/Quinlan CAP 333,320 288,867 0 0800.821 - Building Maintenance CAP 42,860 39,558 51,081 20,273
25 - Cost allocation Total 588,869 552,901 415,210 357,24435 - Contingencies
719.705 - Contingencies 0 0 25,788 15,27335 - Contingencies Total 0 0 25,788 15,273
623 Youth, Teen and Senior Adult Rec Total 1,620,317 1,704,910 2,036,109 1,416,331
261

Appendix A-4 Year Expenditure Trends at the Account Level by Program
Department
FY17 Actuals
FY18 Actuals
FY19 Final Budget
FY20 Proposed
Budget639 Youth and Teen Programs
05 - Employee compensation500.501 - Salaries Full Time 0 0 0 30,193500.502 - Salaries Part Time 0 0 0 163,640500.505 - Overtime 0 0 0 3,598
05 - Employee compensation Total 0 0 0 197,43110 - Employee benefits
501.500 - Retirement System 0 0 0 9,334501.502 - Pers 1959 Surv Empr 0 0 0 21501.505 - Health Insurance 0 0 0 3,429501.506 - Dental Insurance 0 0 0 538501.507 - Medicare 0 0 0 1,843501.508 - Life Insurance 0 0 0 255501.509 - Long Term Disability 0 0 0 324501.510 - Workers Compensation 0 0 0 404501.511 - Vision Insurance 0 0 0 63501.513 - Rec Bucks 0 0 0 141
10 - Employee benefits Total 0 0 0 16,35215 - Materials
600.601 - General Office Supplies 0 0 0 565600.605 - Meeting Expenses 0 0 0 3,008600.611 - Uniforms/Safety Appar 0 0 0 2,007600.613 - General Supplies 0 0 0 31,151600.642 - Telphone and Data Services 0 0 0 474
15 - Materials Total 0 0 0 37,20520 - Contract services
700.702 - General Service Agreement 0 0 0 882700.706 - Rent Expense 0 0 0 7,000
20 - Contract services Total 0 0 0 7,882639 Youth and Teen Programs Total 0 0 0 258,870
262

Appendix A-4 Year Expenditure Trends at the Account Level by Program
Department
FY17 Actuals
FY18 Actuals
FY19 Final Budget
FY20 Proposed
Budget640 Neighborhood Events
05 - Employee compensation500.501 - Salaries Full Time 0 0 0 11,581500.502 - Salaries Part Time 0 0 0 69,822500.505 - Overtime 0 0 0 2,377500.506 - Car Allowance 0 0 0 242
05 - Employee compensation Total 0 0 0 84,02210 - Employee benefits
501.500 - Retirement System 0 0 0 3,992501.502 - Pers 1959 Surv Empr 0 0 0 6501.505 - Health Insurance 0 0 0 980501.506 - Dental Insurance 0 0 0 154501.507 - Medicare 0 0 0 1,166501.508 - Life Insurance 0 0 0 73501.509 - Long Term Disability 0 0 0 122501.510 - Workers Compensation 0 0 0 115501.511 - Vision Insurance 0 0 0 18501.513 - Rec Bucks 0 0 0 40
10 - Employee benefits Total 0 0 0 6,66615 - Materials
600.601 - General Office Supplies 0 0 0 250600.608 - Sml Tools and Equipment 0 0 0 10,000600.611 - Uniforms/Safety Appar 0 0 0 1,000600.613 - General Supplies 0 0 0 4,500600.619 - Advertising and Legal Notices 0 0 0 4,283
15 - Materials Total 0 0 0 20,03320 - Contract services
700.702 - General Service Agreement 0 0 0 57,197700.704 - Insurance Fees, Claims, Premiums 0 0 0 1,650
20 - Contract services Total 0 0 0 58,847640 Neighborhood Events Total 0 0 0 169,568
62 Recreation and Education Total 4,405,844 4,817,231 5,357,950 5,013,959
263

Appendix A-4 Year Expenditure Trends at the Account Level by Program
Department
FY17 Actuals
FY18 Actuals
FY19 Final Budget
FY20 Proposed
Budget63 Sports, Safety and Outdoor Rec
612 Park Facilities05 - Employee compensation
500.501 - Salaries Full Time 209,309 205,434 293,328 287,183500.502 - Salaries Part Time 370,794 375,922 432,512 417,406500.505 - Overtime 4,346 973 2,880 3,955500.506 - Car Allowance 388 0 1,800 1,454500.513 - Sick Leave 1,603 3,599 0 0
05 - Employee compensation Total 586,441 585,928 730,520 709,99810 - Employee benefits
501.500 - Retirement System 60,139 57,968 63,389 82,218501.502 - Pers 1959 Surv Empr 164 160 207 198501.505 - Health Insurance 30,263 31,321 38,443 40,051501.506 - Dental Insurance 4,035 4,171 5,222 5,040501.507 - Medicare 8,017 7,624 8,547 9,258501.508 - Life Insurance 1,655 1,730 2,346 2,257501.509 - Long Term Disability 1,794 2,184 3,152 3,076501.510 - Workers Compensation 4,725 9,168 8,570 3,788501.511 - Vision Insurance 519 479 617 594501.513 - Rec Bucks 0 0 0 1,325501.516 - Hra City Contribution 1,590 0 0 0
10 - Employee benefits Total 112,901 114,806 130,493 147,80515 - Materials
600.601 - General Office Supplies 1,555 305 5,825 2,622600.602 - Printing and Duplication 1,551 591 2,000 250600.604 - Postage 52 70 650 75600.605 - Meeting Expenses 0 0 0 2,398600.609 - Equipment Parts 0 0 369 0600.611 - Uniforms/Safety Appar 3,853 4,504 5,000 5,840600.613 - General Supplies 69,292 84,664 89,500 81,677600.616 - Haz Material Mgmt 1,152 (84) 2,000 500600.619 - Advertising and Legal Notices 0 0 369 0600.622 - State Mandated Cost 0 0 1,800 0600.629 - Conference and Training 739 5,234 6,000 0600.632 - Mileage Reimbursement 378 406 650 0600.635 - Special Departmental Exp 2,362 0 0 0600.642 - Telphone and Data Services 15,723 15,037 20,360 858600.647 - Memberships and Dues 0 0 0 215600.651 - Property Tax 0 0 1,550 0
15 - Materials Total 96,656 110,726 136,073 94,43520 - Contract services
700.701 - Training and Instruction 2,522 2,814 3,500 3,181700.702 - General Service Agreement 7,432 44,976 13,200 85,745
264
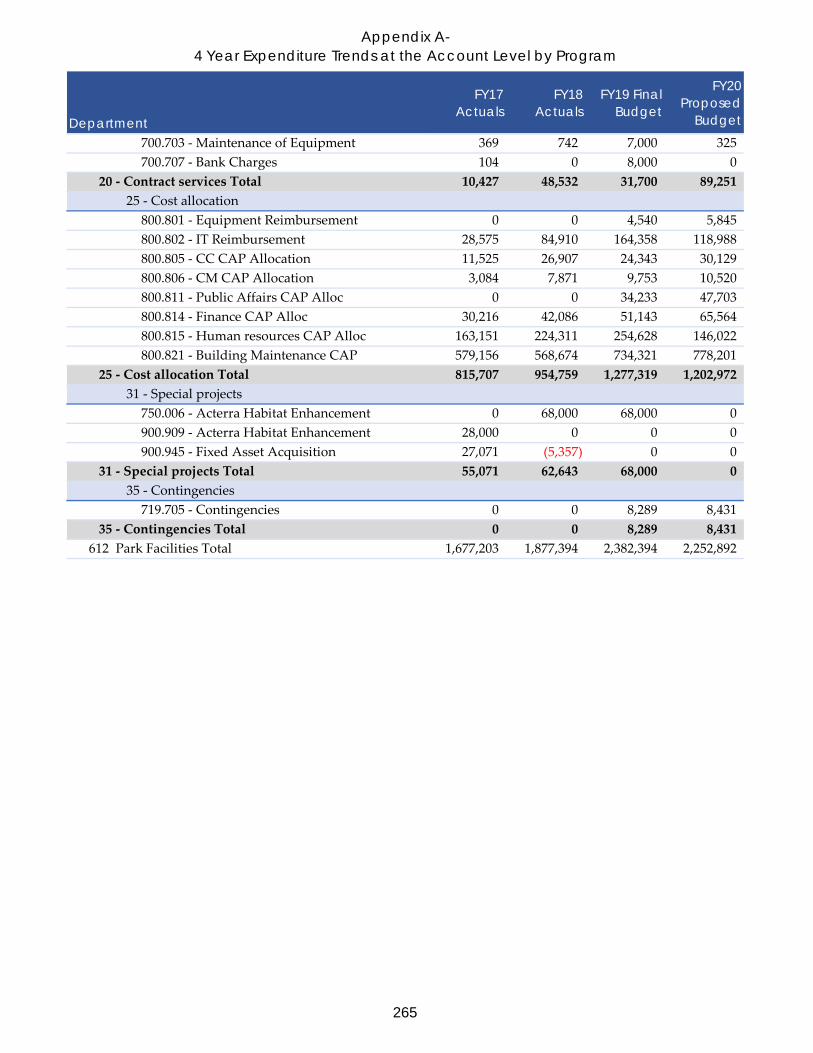
Appendix A-4 Year Expenditure Trends at the Account Level by Program
Department
FY17 Actuals
FY18 Actuals
FY19 Final Budget
FY20 Proposed
Budget700.703 - Maintenance of Equipment 369 742 7,000 325700.707 - Bank Charges 104 0 8,000 0
20 - Contract services Total 10,427 48,532 31,700 89,25125 - Cost allocation
800.801 - Equipment Reimbursement 0 0 4,540 5,845800.802 - IT Reimbursement 28,575 84,910 164,358 118,988800.805 - CC CAP Allocation 11,525 26,907 24,343 30,129800.806 - CM CAP Allocation 3,084 7,871 9,753 10,520800.811 - Public Affairs CAP Alloc 0 0 34,233 47,703800.814 - Finance CAP Alloc 30,216 42,086 51,143 65,564800.815 - Human resources CAP Alloc 163,151 224,311 254,628 146,022800.821 - Building Maintenance CAP 579,156 568,674 734,321 778,201
25 - Cost allocation Total 815,707 954,759 1,277,319 1,202,97231 - Special projects
750.006 - Acterra Habitat Enhancement 0 68,000 68,000 0900.909 - Acterra Habitat Enhancement 28,000 0 0 0900.945 - Fixed Asset Acquisition 27,071 (5,357) 0 0
31 - Special projects Total 55,071 62,643 68,000 035 - Contingencies
719.705 - Contingencies 0 0 8,289 8,43135 - Contingencies Total 0 0 8,289 8,431
612 Park Facilities Total 1,677,203 1,877,394 2,382,394 2,252,892
265

Appendix A-4 Year Expenditure Trends at the Account Level by Program
Department
FY17 Actuals
FY18 Actuals
FY19 Final Budget
FY20 Proposed
Budget615 Administration
05 - Employee compensation500.501 - Salaries Full Time 86,110 182,099 53,311 45,064500.505 - Overtime 356 323 0 0500.506 - Car Allowance 1,611 4,200 1,202 970
05 - Employee compensation Total 88,077 186,622 54,513 46,03410 - Employee benefits
501.500 - Retirement System 21,749 47,174 14,332 12,053501.502 - Pers 1959 Surv Empr 48 111 32 24501.505 - Health Insurance 7,549 9,958 2,368 1,470501.506 - Dental Insurance 1,237 2,879 762 614501.507 - Medicare 1,828 2,674 791 654501.508 - Life Insurance 613 1,324 360 291501.509 - Long Term Disability 613 1,866 569 477501.510 - Workers Compensation 5,364 2,976 1,246 462501.511 - Vision Insurance 160 332 90 72501.513 - Rec Bucks 0 0 0 162501.516 - Hra City Contribution 606 0 0 0
10 - Employee benefits Total 39,767 69,295 20,550 16,27915 - Materials
600.601 - General Office Supplies 83 324 600 0600.613 - General Supplies 378 2,177 150 8,300600.629 - Conference and Training 3,371 3,332 4,000 0600.632 - Mileage Reimbursement 54 16 0 0600.642 - Telphone and Data Services 734 380 2,005 0600.647 - Memberships and Dues 0 0 0 165
15 - Materials Total 4,620 6,228 6,755 8,46520 - Contract services
700.701 - Training and Instruction 388 3,889 0 020 - Contract services Total 388 3,889 0 0
25 - Cost allocation800.801 - Equipment Reimbursement 0 0 93 27800.802 - IT Reimbursement 19,742 1,912 6,469 4,707800.805 - CC CAP Allocation 1,953 1,004 1,926 4,511800.806 - CM CAP Allocation 504 301 800 1,595800.814 - Finance CAP Alloc 6,804 7,055 11,714 15,361800.815 - Human resources CAP Alloc 76,010 76,875 87,576 12,774800.821 - Building Maintenance CAP 0 0 0 4,417
25 - Cost allocation Total 105,013 87,147 108,578 43,39235 - Contingencies
719.705 - Contingencies 0 0 338 835 - Contingencies Total 0 0 338 8
615 Administration Total 237,865 353,181 190,734 114,178
266

Appendix A-4 Year Expenditure Trends at the Account Level by Program
Department
FY17 Actuals
FY18 Actuals
FY19 Final Budget
FY20 Proposed
Budget616 BBF Golf Course
05 - Employee compensation500.501 - Salaries Full Time 106,737 81,392 76,843 94,255500.502 - Salaries Part Time 40,155 54,969 73,968 73,718500.505 - Overtime 61 0 0 0500.506 - Car Allowance 388 0 0 364500.513 - Sick Leave 165 0 0 0
05 - Employee compensation Total 147,505 136,361 150,811 168,33710 - Employee benefits
501.500 - Retirement System 28,496 31,848 21,620 26,167501.502 - Pers 1959 Surv Empr 67 57 54 64501.505 - Health Insurance 10,296 10,118 8,524 8,819501.506 - Dental Insurance 1,658 1,476 1,370 1,613501.507 - Medicare 2,405 1,931 2,188 2,436501.508 - Life Insurance 753 660 648 763501.509 - Long Term Disability 860 852 824 1,008501.510 - Workers Compensation 2,290 3,444 2,242 1,213501.511 - Vision Insurance 213 170 162 190501.513 - Rec Bucks 0 0 0 425501.516 - Hra City Contribution 621 0 0 0
10 - Employee benefits Total 47,658 50,556 37,632 42,69815 - Materials
600.601 - General Office Supplies 0 1,073 1,000 1,015600.602 - Printing and Duplication 0 0 1,500 0600.604 - Postage 0 0 500 0600.609 - Equipment Parts 2,684 95 3,200 2,000600.613 - General Supplies (33,181) 10,576 27,000 21,429600.619 - Advertising and Legal Notices 749 552 3,263 595600.629 - Conference and Training 0 1,776 2,000 0600.632 - Mileage Reimbursement 71 118 300 0600.641 - Electrical Service 2,729 2,843 4,280 0600.642 - Telphone and Data Services 1,206 1,069 850 0600.643 - Water Services 47,890 78,922 80,400 80,000600.644 - Sewer Service 2,000 1,932 400 0600.647 - Memberships and Dues 0 0 0 1,210
15 - Materials Total 24,148 98,956 124,693 106,24920 - Contract services
700.702 - General Service Agreement 266,274 246,889 235,000 252,447700.703 - Maintenance of Equipment 762 0 3,000 1,000700.707 - Bank Charges 0 11,888 6,200 13,898
20 - Contract services Total 267,036 258,776 244,200 267,34525 - Cost allocation
800.801 - Equipment Reimbursement 0 9,100 48 72
267

Appendix A-4 Year Expenditure Trends at the Account Level by Program
Department
FY17 Actuals
FY18 Actuals
FY19 Final Budget
FY20 Proposed
Budget800.802 - IT Reimbursement 16,825 1,912 8,490 6,178800.805 - CC CAP Allocation 5,953 6,882 5,216 5,942800.806 - CM CAP Allocation 1,615 2,116 2,154 2,157800.809 - City Clerk CAP Alloc 3,900 2,261 2,255 0800.814 - Finance CAP Alloc 18,829 20,507 26,428 42,184800.815 - Human resources CAP Alloc 19,708 26,230 29,013 14,658800.821 - Building Maintenance CAP 0 0 0 5,068
25 - Cost allocation Total 66,830 69,008 73,604 76,25931 - Special projects
750.021 - BBF Golf Facility Maintenance 0 0 10,000 0900.945 - Fixed Asset Acquisition 22,758 32,900 0 0
31 - Special projects Total 22,758 32,900 10,000 035 - Contingencies
719.705 - Contingencies 0 0 18,445 16,44835 - Contingencies Total 0 0 18,445 16,448
50 - Other financing uses800.904 - Depreciation Expenses 21,470 28,553 28,554 0
50 - Other financing uses Total 21,470 28,553 28,554 0616 BBF Golf Course Total 597,405 675,109 687,939 677,336
268

Appendix A-4 Year Expenditure Trends at the Account Level by Program
Department
FY17 Actuals
FY18 Actuals
FY19 Final Budget
FY20 Proposed
Budget620 Outdoor Recreation
05 - Employee compensation500.501 - Salaries Full Time 112,239 242,908 213,882 223,516500.502 - Salaries Part Time 51,732 88,500 183,193 132,821500.505 - Overtime 3,859 3,324 4,000 7,200500.506 - Car Allowance 734 600 601 606500.513 - Sick Leave 0 95 0 0
05 - Employee compensation Total 168,563 335,428 401,676 364,14310 - Employee benefits
501.500 - Retirement System 42,655 63,660 69,772 61,119501.502 - Pers 1959 Surv Empr 75 110 149 153501.505 - Health Insurance 13,137 19,799 23,356 24,850501.506 - Dental Insurance 1,871 2,911 3,730 3,873501.507 - Medicare 2,610 3,398 5,494 4,457501.508 - Life Insurance 860 1,264 1,766 1,833501.509 - Long Term Disability 937 1,636 2,295 2,392501.510 - Workers Compensation 1,506 8,232 6,128 2,911501.511 - Vision Insurance 241 329 441 456501.513 - Rec Bucks 0 0 0 1,018501.516 - Hra City Contribution 740 0 0 0
10 - Employee benefits Total 64,633 101,340 113,131 103,06215 - Materials
600.601 - General Office Supplies 1,266 118 1,500 870600.602 - Printing and Duplication 45,012 44,726 30,000 3,090600.604 - Postage 17 1,450 1,760 3,650600.605 - Meeting Expenses 0 0 0 350600.608 - Sml Tools and Equipment 0 0 96 0600.611 - Uniforms/Safety Appar 0 0 0 4,260600.613 - General Supplies 35,411 47,224 43,270 44,052600.622 - State Mandated Cost 0 0 865 0600.629 - Conference and Training 4,537 3,283 4,000 0600.632 - Mileage Reimbursement 272 226 425 0600.635 - Special Departmental Exp 217 290 2,100 0600.640 - Pass Thru Expenditure 3,670 5,200 6,000 6,000600.642 - Telphone and Data Services 12,359 9,924 351 432600.646 - Program Admission & Parking Fees 0 0 0 3,900600.647 - Memberships and Dues 0 0 0 1,590
15 - Materials Total 102,762 112,440 90,367 68,19420 - Contract services
700.701 - Training and Instruction 1,337 1,134 2,350 1,800700.702 - General Service Agreement 419,085 432,324 617,087 614,846700.703 - Maintenance of Equipment 3,348 1,174 1,000 0700.704 - Insurance Fees, Claims, Premiums 500 0 500 0
269
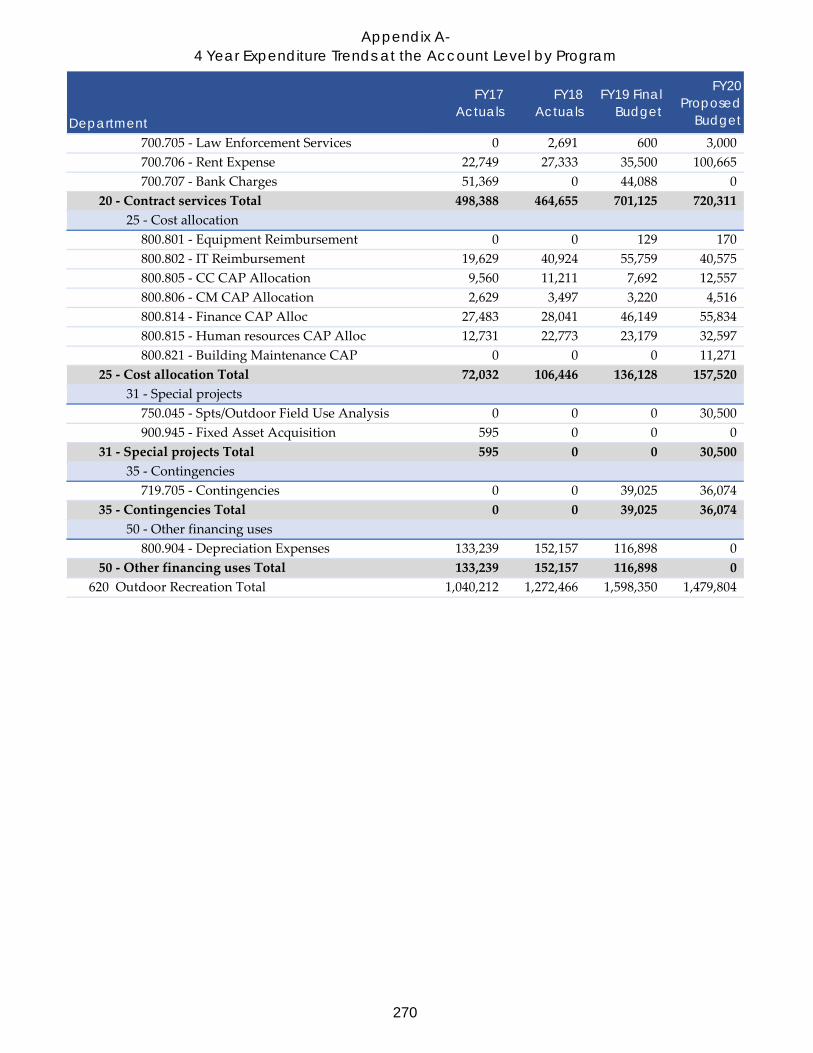
Appendix A-4 Year Expenditure Trends at the Account Level by Program
Department
FY17 Actuals
FY18 Actuals
FY19 Final Budget
FY20 Proposed
Budget700.705 - Law Enforcement Services 0 2,691 600 3,000700.706 - Rent Expense 22,749 27,333 35,500 100,665700.707 - Bank Charges 51,369 0 44,088 0
20 - Contract services Total 498,388 464,655 701,125 720,31125 - Cost allocation
800.801 - Equipment Reimbursement 0 0 129 170800.802 - IT Reimbursement 19,629 40,924 55,759 40,575800.805 - CC CAP Allocation 9,560 11,211 7,692 12,557800.806 - CM CAP Allocation 2,629 3,497 3,220 4,516800.814 - Finance CAP Alloc 27,483 28,041 46,149 55,834800.815 - Human resources CAP Alloc 12,731 22,773 23,179 32,597800.821 - Building Maintenance CAP 0 0 0 11,271
25 - Cost allocation Total 72,032 106,446 136,128 157,52031 - Special projects
750.045 - Spts/Outdoor Field Use Analysis 0 0 0 30,500900.945 - Fixed Asset Acquisition 595 0 0 0
31 - Special projects Total 595 0 0 30,50035 - Contingencies
719.705 - Contingencies 0 0 39,025 36,07435 - Contingencies Total 0 0 39,025 36,074
50 - Other financing uses800.904 - Depreciation Expenses 133,239 152,157 116,898 0
50 - Other financing uses Total 133,239 152,157 116,898 0620 Outdoor Recreation Total 1,040,212 1,272,466 1,598,350 1,479,804
270

Appendix A-4 Year Expenditure Trends at the Account Level by Program
Department
FY17 Actuals
FY18 Actuals
FY19 Final Budget
FY20 Proposed
Budget621 Sports Center Operation
05 - Employee compensation500.501 - Salaries Full Time 155,058 149,567 171,409 175,780500.502 - Salaries Part Time 146,410 155,940 167,102 171,738500.505 - Overtime 2,317 1,572 1,000 0500.506 - Car Allowance 388 0 601 606500.513 - Sick Leave 1,215 1,270 0 0
05 - Employee compensation Total 305,387 308,350 340,112 348,12410 - Employee benefits
501.500 - Retirement System 47,637 57,088 48,253 49,248501.502 - Pers 1959 Surv Empr 124 120 138 137501.505 - Health Insurance 22,054 28,758 25,760 26,455501.506 - Dental Insurance 3,069 3,121 3,456 3,458501.507 - Medicare 4,732 4,310 4,920 5,039501.508 - Life Insurance 1,193 1,129 1,347 1,345501.509 - Long Term Disability 1,291 1,493 1,854 1,895501.510 - Workers Compensation 4,580 6,948 5,680 2,599501.511 - Vision Insurance 394 359 409 407501.513 - Rec Bucks 0 0 0 909501.516 - Hra City Contribution 1,158 0 0 0
10 - Employee benefits Total 86,232 103,327 91,817 91,49215 - Materials
600.601 - General Office Supplies 7,448 2,898 5,000 7,000600.602 - Printing and Duplication 0 0 25,000 0600.604 - Postage 22 876 950 0600.605 - Meeting Expenses 0 0 0 150600.608 - Sml Tools and Equipment 0 0 15,000 22,000600.611 - Uniforms/Safety Appar 0 0 0 1,500600.613 - General Supplies 23,635 23,749 23,000 21,950600.618 - Utilities and Phone 0 0 5,000 4,910600.619 - Advertising and Legal Notices 1,350 1,459 2,500 1,500600.622 - State Mandated Cost 0 0 80 0600.629 - Conference and Training 0 2,744 4,000 0600.632 - Mileage Reimbursement 182 122 150 200600.642 - Telphone and Data Services 7,068 7,927 5,920 600
15 - Materials Total 39,705 39,774 86,600 59,81020 - Contract services
700.701 - Training and Instruction 238 480 1,600 0700.702 - General Service Agreement 1,320,847 1,549,937 1,590,000 1,609,500700.703 - Maintenance of Equipment 4,079 357 4,500 0700.707 - Bank Charges 13,348 10,845 10,000 87,189
20 - Contract services Total 1,338,511 1,561,619 1,606,100 1,696,68925 - Cost allocation
271

Appendix A-4 Year Expenditure Trends at the Account Level by Program
Department
FY17 Actuals
FY18 Actuals
FY19 Final Budget
FY20 Proposed
Budget800.801 - Equipment Reimbursement 0 0 107 153800.802 - IT Reimbursement 30,846 21,227 105,171 76,532800.805 - CC CAP Allocation 15,647 19,921 15,444 19,295800.806 - CM CAP Allocation 4,367 6,197 6,425 7,005800.809 - City Clerk CAP Alloc 3,900 2,261 2,255 2,790800.814 - Finance CAP Alloc 29,969 33,986 46,993 63,611800.815 - Human resources CAP Alloc 30,728 54,870 63,306 47,535800.817 - Community Hall/Quinlan CAP 49,811 37,242 0 0800.821 - Building Maintenance CAP 0 0 0 16,436
25 - Cost allocation Total 165,268 175,704 239,701 233,35731 - Special projects
750.022 - Hand Sanitizer Mounts 0 0 5,000 0900.945 - Fixed Asset Acquisition 481 0 0 27,000
31 - Special projects Total 481 0 5,000 27,00035 - Contingencies
719.705 - Contingencies 0 0 84,535 83,46635 - Contingencies Total 0 0 84,535 83,466
50 - Other financing uses800.904 - Depreciation Expenses 5,217 7,442 6,870 0
50 - Other financing uses Total 5,217 7,442 6,870 0621 Sports Center Operation Total 1,940,802 2,196,215 2,460,735 2,539,938
272

Appendix A-4 Year Expenditure Trends at the Account Level by Program
Department
FY17 Actuals
FY18 Actuals
FY19 Final Budget
FY20 Proposed
Budget633 Disaster Preparedness
05 - Employee compensation500.501 - Salaries Full Time 0 57,096 93,764 0500.502 - Salaries Part Time 35,772 34,594 0 0500.505 - Overtime 264 1,287 0 0
05 - Employee compensation Total 36,036 92,977 93,764 010 - Employee benefits
501.500 - Retirement System 465 14,686 25,208 0501.502 - Pers 1959 Surv Empr 0 38 66 0501.505 - Health Insurance 36 9,591 17,048 0501.506 - Dental Insurance 4 1,032 1,675 0501.507 - Medicare 527 1,296 1,361 0501.508 - Life Insurance 2 456 792 0501.509 - Long Term Disability 0 556 1,006 0501.510 - Workers Compensation 0 7,056 2,740 0501.511 - Vision Insurance 1 114 198 0501.516 - Hra City Contribution 8 0 0 0
10 - Employee benefits Total 1,043 34,825 50,094 015 - Materials
600.601 - General Office Supplies 229 5,135 500 0600.602 - Printing and Duplication 0 242 1,600 0600.613 - General Supplies 12,613 19,758 20,000 0600.629 - Conference and Training 0 4,906 6,000 0600.632 - Mileage Reimbursement 0 784 400 0600.642 - Telphone and Data Services 1,580 2,010 2,743 0600.645 - Grant Expenditures 0 0 3,745 0
15 - Materials Total 14,421 32,836 34,988 020 - Contract services
700.701 - Training and Instruction 372 14 5,000 020 - Contract services Total 372 14 5,000 0
25 - Cost allocation800.801 - Equipment Reimbursement 0 0 42,543 0800.802 - IT Reimbursement 0 10,518 26,460 0800.805 - CC CAP Allocation 315 1,104 876 0800.806 - CM CAP Allocation 95 333 353 0800.811 - Public Affairs CAP Alloc 0 0 1,317 0800.814 - Finance CAP Alloc 2,652 3,601 6,303 0800.815 - Human resources CAP Alloc 0 2,700 3,217 0800.817 - Community Hall/Quinlan CAP 7,419 3,056 0 0800.821 - Building Maintenance CAP 2,573 0 0 0
25 - Cost allocation Total 13,054 21,312 81,069 031 - Special projects
900.945 - Fixed Asset Acquisition 2,433 0 0 0
273

Appendix A-4 Year Expenditure Trends at the Account Level by Program
Department
FY17 Actuals
FY18 Actuals
FY19 Final Budget
FY20 Proposed
Budget31 - Special projects Total 2,433 0 0 0
35 - Contingencies719.705 - Contingencies 0 0 1,999 0
35 - Contingencies Total 0 0 1,999 0633 Disaster Preparedness Total 67,359 181,964 266,914 0
63 Sports, Safety and Outdoor Rec Total 5,560,845 6,556,330 7,587,066 7,064,148Recreation services Total 14,574,598 14,835,275 17,442,432 15,631,867
274