APPENDIX 4E – PRELIMINARY FINAL REPORT YEAR ENDED 30 … · 2020. 8. 25. · FINANCIAL REPORT FOR...
75
Page | 1 Energy Action Limited ABN 90 137 363 636 FINANCIAL REPORT FOR THE FULL YEAR ENDED 30 JUNE 2020 APPENDIX 4E – PRELIMINARY FINAL REPORT YEAR ENDED 30 JUNE 2020 Energy Action Limited (ASX: EAX) – ACN 137 363 636 1. Results for announcement to the market % change 30-Jun-20 30-Jun-19 Revenue from ordinary activities (20%) 19,781,729 24,801,100 Statutory Profit/(Loss) after tax attributable to members 79% (2,486,756) (12,092,885) Operating Profit/(Loss) after tax attributable to members (98%) 23,953 1,005,334 Basic earnings per share (Statutory) 79% (9.58c) (46.59c) Diluted earnings per share (Statutory) 79% (9.58c) (46.59c) Basic earnings per share (Operating) (98%) 0.09c 3.87c Diluted earnings per share (Operating) (98%) 0.09c 3.87c 2. Dividends Cents per share Franked amount per share Payment date Record date 2020 final dividend NIL NIL - - For personal use only
Transcript of APPENDIX 4E – PRELIMINARY FINAL REPORT YEAR ENDED 30 … · 2020. 8. 25. · FINANCIAL REPORT FOR...

ENERGY ACTION LIMITED ABN 90 137 363 636
P a g e | 1 Energy Action Limited ABN 90 137 363 636
FINANCIAL REPORT FOR THE FULL YEAR ENDED 30 JUNE 2020
APPENDIX 4E – PRELIMINARY FINAL REPORT
YEAR ENDED 30 JUNE 2020
Energy Action Limited (ASX: EAX) – ACN 137 363 636
1. Results for announcement to the market
% change 30-Jun-20 30-Jun-19
Revenue from ordinary activities (20%) 19,781,729 24,801,100
Statutory Profit/(Loss) after tax attributable to members 79% (2,486,756) (12,092,885)
Operating Profit/(Loss) after tax attributable to members (98%) 23,953 1,005,334
Basic earnings per share (Statutory) 79% (9.58c) (46.59c)
Diluted earnings per share (Statutory) 79% (9.58c) (46.59c)
Basic earnings per share (Operating) (98%) 0.09c 3.87c
Diluted earnings per share (Operating) (98%) 0.09c 3.87c
2. Dividends
Cents per share Franked amount per share
Payment date Record date
2020 final dividend NIL NIL - -
For
per
sona
l use
onl
y

ENERGY ACTION LIMITED ABN 90 137 363 636
P a g e | 2 Energy Action Limited ABN 90 137 363 636
FINANCIAL REPORT FOR THE FULL YEAR ENDED 30 JUNE 2020
Brief Explanation of Statutory and Operating Profit Statutory Profit / (Loss) and Statutory Earnings per share are prepared in accordance with Australian Accounting Standards and the Corporations Act. Statutory Loss after tax of $2,486,756, was 79% lower than FY19 Statutory Loss of $12,092,885. FY19 Statutory Loss after tax included $13,098,219 of Significant Items, while FY20 statutory loss include $2,510,709 of Significant Items. Further details are included in the Directors’ Report. Operating Profit after tax for the year ended 30 June 2020 was $23,953, a 98% decrease from the prior year Operating Profit after tax of $1,005,334. Operating Profit after tax is defined as statutory loss excluding significant items is reported to give information to shareholders that provide a greater understanding of operating performance by removing Significant Items and facilitating a more representative comparison of performance between financial periods. Further details are included in the Directors’ Report. 3. Net tangible assets
30 June 2020 30 June 2019
Net tangible assets per share^
$0.10 $0.09*
^ Excludes internally generated software. Net tangible assets totalling $2.66 million as at 30 June 2020 ($2.43 million as at 30 June 2019).
*Corrected from prior year published results of ($0.09)
4. Status of audit An unqualified, signed Audit Opinion is included within the attached Financial Report.
All other information required to be disclosed by Energy Action in the Appendix 4E is either not applicable or has been included in the attached financial report.
Please also refer to the ASX results announcement and results presentation.
For
per
sona
l use
onl
y

ENERGY ACTION LIMITED ABN 90 137 363 636
P a g e | 3 Energy Action Limited ABN 90 137 363 636
FINANCIAL REPORT FOR THE FULL YEAR ENDED 30 JUNE 2020
ENERGY ACTION LIMITED ABN 90 137 363 636
FINANCIAL REPORT FOR THE YEAR ENDED 30 JUNE 2020
For
per
sona
l use
onl
y

ENERGY ACTION LIMITED ABN 90 137 363 636
P a g e | 4 Energy Action Limited ABN 90 137 363 636
FINANCIAL REPORT FOR THE FULL YEAR ENDED 30 JUNE 2020
Financial Report for the Year Ended 30 June 2020
Table of Contents Auditor’s Independence Declaration ..................................................................................................................... 18 Remuneration Report (Audited) ............................................................................................................................ 19 Financial Statements ............................................................................................................................................. 28 Consolidated Statement of Comprehensive Income ............................................................................................. 28 Consolidated Statement of Financial Position ....................................................................................................... 29 Consolidated Statement of Changes in Equity ...................................................................................................... 30 Consolidated Statement of Cash Flow .................................................................................................................. 31 Notes to the Financial Statements for year ended 30 June 2020 .......................................................................... 32
Note 1: Corporate Information ............................................................................................................................... 32 Note 2: Summary of Significant Accounting Policies ............................................................................................. 32 Note 3: Significant Accounting Judgements, Estimates and Assumptions ............................................................ 44 Note 4: Segment information ................................................................................................................................ 45 Note 5: Revenue, Other Income and Expenses .................................................................................................... 46 Note 6: Income Tax Expense ................................................................................................................................ 48 Note 7: Earnings per Share ................................................................................................................................... 49 Note 8: Dividends .................................................................................................................................................. 50 Note 9: Cash and Cash Equivalents ..................................................................................................................... 51 Note 10: Trade and Other Receivables ................................................................................................................. 51 Note 11: Property Plant and Equipment ................................................................................................................ 53 Note 12: Intangible Assets .................................................................................................................................... 54 Note 13: Other Assets ........................................................................................................................................... 55 Note 13(a): Right-of-use Assets ............................................................................................................................ 55 Note 14: Trade and Other Payables ...................................................................................................................... 56 Note 14(a): Lease Liability .................................................................................................................................... 56 Note 15: Tax.......................................................................................................................................................... 57 Note 16: Provisions and other liabilities ................................................................................................................ 58 Note 17: Loans and Borrowings ............................................................................................................................ 58 Note 18: Issued Capital and Reserves .................................................................................................................. 59 Note 19: Capital and Leasing Commitments ......................................................................................................... 62 Note 20: Cash Flow Information ............................................................................................................................ 63 Note 21: Related Party Disclosures ...................................................................................................................... 64 Note 22: Financial Risk Management ................................................................................................................... 65 Note 23: Auditors’ Remuneration .......................................................................................................................... 69 Note 24: Information relating to Energy Action Limited (“the parent entity”) .......................................................... 70 Note 25: Events After the reporting period ............................................................................................................ 71 Director’s Declaration ............................................................................................................................................ 72 Independent audit report to members of Energy Action Limited............................... Error! Bookmark not defined.
For
per
sona
l use
onl
y

ENERGY ACTION LIMITED ABN 90 137 363 636
P a g e | 5 Energy Action Limited ABN 90 137 363 636
FINANCIAL REPORT FOR THE FULL YEAR ENDED 30 JUNE 2020
Corporate information
ACN: 137 363 636 Directors Murray Bleach - Non-Executive Chairman Nitin Singhi – Independent Non-Executive Director Paul Meehan – Non-Executive Director Mark de Kock – Independent Non-Executive Director (resigned 30 April 2020) Company Secretary Anna Sandham (resigned 27 November 2019) Juan Rodriguez (appointed 27 November 2019, resigned 1 May 2020) Kim Bradley-Ware (appointed 1 May 2020) Registered Office and principal place of business Level 5, 56 Station Street Parramatta NSW 2150 Share register Link Market Services Limited Level 12 680 George Street Sydney NSW 2000 Energy Action Limited shares (EAX) are listed on the Australian Securities Exchange (ASX) Solicitors DLA Piper No 1 Martin Place Sydney NSW 2000 Bankers Commonwealth Bank of Australia Level 3, 101 George Street Parramatta NSW 2150 Auditors RSM Australia Partners Level 13, 60 Castlereagh Street Sydney, NSW 2000
For
per
sona
l use
onl
y

ENERGY ACTION LIMITED ABN 90 137 363 636
P a g e | 6 Energy Action Limited ABN 90 137 363 636
FINANCIAL REPORT FOR THE FULL YEAR ENDED 30 JUNE 2020
Directors’ Report
Your Directors present their report, together with the financial statements for Energy Action Limited (the “Company”) and its consolidated entities (the “Group”), for the financial year ended 30 June 2020.
Directors The names and details of the Company’s Directors in office during the financial year and until the date of this report are as follows. Directors were in office for this entire period unless otherwise stated.
Murray Bleach (Non-Executive Chairman) Qualifications – Bachelor of Arts (Financial Studies) and Master of Applied Finance - Macquarie University, Institute of Chartered Accountants, Graduate Member of the Australian Institute of Company Directors. Experience – Board Member since 2012, Chairman since 2015 Special Responsibilities – Member of each of the Audit & Risk Management and Nomination & Remuneration Committees Directorships held in other listed entities currently and during the three prior years to the current year: Carlton Investments Ltd – Independent Non-Executive Director (appointed 2 December 2014) Other Directorships and interests - Partner in Alfred Street Investment Partners, Chairman of AddVenture Fund.
Paul Meehan (Non-Executive Director) Qualifications – Diploma of Law (SAB), University of Sydney Experience – Board member since 2003 Special Responsibilities – Member of each of the Audit & Risk Management and Nomination & Remuneration Committees. Directorships held in other listed entities currently and during the three prior years to the current year: nil Other Directorships and interests - Director of Meehans Solicitors Pty Ltd, Non-executive Director of Commercial First Realty Pty Ltd T/as LJ Hooker Commercial Macarthur.
Nitin Singhi (Independent Non-Executive Director) Qualifications – Bachelor of Economic and Master of Laws – University of Sydney, Member of the Australian Institute of Company Directors Experience – Board Member since 2015 Special Responsibilities – Chairman of each of the Audit & Risk Management and Nomination & Remuneration Committees. Directorships held in other listed entities currently and during the three prior years to the current year: nil Other Directorships and interests - Managing Director of Horizon Private Capital Partners, Director of TiE Sydney, Director of Sport and Leisure Education Group Pty Limited.
Mark de Kock (Independent Non-Executive Director, resigned 30 April 2020) Qualifications – Bachelor of Science (First Class Honours) in Electronic Engineering from University College London, Executive MBA from the Australian Graduate School of Management, Member of the Institution of Engineering and Technology.
Experience – Nominee Director of Microequities from 2015 – February 2019. Non-executive Director from February 2019 to June 2019. Independent Non-executive Director since 1 July 2019.
Special Responsibilities – Member of each of the Audit & Risk Management and Nomination & Remuneration Committees Directorships held in other listed entities currently and during the three prior years to the current year: nil Other Directorships and interests – Director, Frontier Data Centre Ltd.
Interests in the shares and options of the Company and related bodies corporate As at the date of this report, the interests of the directors in the shares and options of Energy Action Limited were:
Number of ordinary shares Number of options over ordinary shares
Murray Bleach 5,100,700 -
Paul Meehan 4,792,846 -
Nitin Singhi 3,000 -
For
per
sona
l use
onl
y

ENERGY ACTION LIMITED ABN 90 137 363 636
P a g e | 7 Energy Action Limited ABN 90 137 363 636
FINANCIAL REPORT FOR THE FULL YEAR ENDED 30 JUNE 2020
Company Secretary The following person held the position of Company Secretary at the end of the financial year:
Kim Bradley-Ware – Bachelor of Commerce (Lincoln University), LLB (UTS), CPA Australia She is an experienced corporate governance professional with more than 20 years financial, commercial and company secretarial experience gained from in-house roles. Dividends recommended: Cents per share $
Ordinary shares
Final 2020 dividend NIL NIL
Interim 2020 dividend NIL NIL
Final 2019 dividend NIL NIL
Operating and Financial Review The Board presents the 2020 Operating and Financial Review, which has been designed to provide shareholders with a clear and concise overview of Energy Action’s operations, financial position, business strategies and prospects. The review also provides contextual information, including the impact of key events that have occurred during the FY20 financial year and material business risks faced by the business so that shareholders can make an informed assessment of the results and prospects of the Group.
Our business model Energy Action’s core business strategy and purpose is:
“To help our clients understand, and take control of, their energy needs”
The need exists because energy is a minefield of rising financial and environmental costs and risks and data confusion. Energy Action helps businesses reduce costs, the effort to manage energy, and navigate their journey to Net Zero.
Looking forward the business has established a vision of striving to be a category killer for business energy procurement, contract and spend management services .
The distinct advantage for Energy Action customers arises from :
Our expertise - a national team with knowledge and capability to offer better ways of buying, using and generating energy
Our leadership - the buying power to fight for a better deal from retailers and the independence to ensure “apples” to “apples” comparison
Our technology - that ensures automated and reliable delivery of valuable data rich information and insights.
Energy Action’s principal activities are providing integrated energy management services to a diverse base of Commercial, Industrial and small and medium sized business customers. The business has previously reported business units comprising Procurement, Contract Mgt and Environmental Reporting and PAS (or Advisory). Due to the repositioning of Advisory and the growth of Retail Services the business line reporting has been aligned to the following services:
Procurement - Broking or Consulting using a range of procurement methodologies including auctions (via the Australian Energy Exchange), tenders (small and large market), progressive and structured purchasing, corporate power purchase agreements, and broking of Solar and Energy projects;
Managed Services - Managed client energy contracts and environmental reporting, including account management, liaison with their retailer, validating their bill, ensuring the right tariff and helping them to understand how they are using energy;
Retail Services – Support for retailers and embedded network operators with retail billing, management and reporting.
Other - in the past 2 years, Energy Action has repositioned away from building monitoring, audits and energy efficiency initiatives, building ratings and energy generation or efficiency projects including solar. Following the repositioning of Advisory, the business has incorporated environmental reporting services in the Managed Services business line and the broking of Solar and Energy projects in the Procurement reporting services line.
For
per
sona
l use
onl
y

ENERGY ACTION LIMITED ABN 90 137 363 636
P a g e | 8 Energy Action Limited ABN 90 137 363 636
FINANCIAL REPORT FOR THE FULL YEAR ENDED 30 JUNE 2020
Initially founded in 2000, Energy Action listed on the Australian Securities Exchange on 13 October 2011.
2020 financial performance
The Group generated a statutory net profit/(loss) after tax (NPAT) of ($2.49) million for the year ended 30 June 2020, an improvement compared to a statutory NPAT of ($12.09) million for the year ended 30 June 2019, impacted by significant items of $2.5 million (FY19: $13.1 million). Following an operating net loss of $0.15 million in the first half, the business returned to an operating net profit of $0.17 million in the second half, resulting in an operating net profit after tax for the year ended 30 June 2020 of $0.02 million, compared to $1.01 million for the pcp, a decrease of 98%.
A reconciliation of the Group’s Statutory NPAT to Operating NPAT and EBITDA is shown in the table below:
NPAT EBITDA
$ 30-Jun-20 30-Jun-19 Variance 30-Jun-20 30-Jun-19 Variance
Statutory results (2,486,756) (12,092,885) 79% (1,491,769) (10,028,320) 85%
Add back Significant Items after tax:
Strategic review - 265,086 100% - 365,634 100% Restructuring cost 328,265 657,229 50% 452,780 906,523 50% Accelerated D&A* 148,423 1,252,357 88% - - 0% Impairment of goodwill - 9,944,796 100% - 9,944,796 100% Impairment of Software** 2,618,365 906,250 -189% 3,611,538 1,250,000 -189% Other significant items 23,394 72,501 68% 32,269 100,000 68% Government Assistances*** (607,738) - 100% (838,260) - 100% Operating profit after tax 23,953 1,005,334 -98% 1,766,558 2,538,633 -30%
*Accelerated Depreciation & Amortisation on specific items of Software ** Impairment of customer and contract management platform in CRM ***Jobkeeper and payroll tax refund Key Financial Metrics
FY20 FY19 Variance
Revenue $19.78m $24.80m -20%
Operating EBITDA $1.77m $2.54m -30%
Operating EBITDA margin 8.9% 10.2% -1.3 ppt
Operating NPAT $0.02m $1.01m -98%
Operating Cash flow1 $2.0m $3.9m -49%
Statutory NPAT -$2.49m -$12.09m 79% 1Operating Cash Flow is defined as Operating Cash Flow before Interest, Tax and Significant Items
Revenues
Revenues declined by 20% versus the previous period, with a Procurement revenue remaining flat, a decline in Managed Services of 20% offset by growth in Retail Services of 51%. Other revenue declined 75% in line with the repositioning of Advisory.
Revenue $ FY20 FY19 vs FY19 $ vs FY19 % Procurement 6,544,171 6,541,214 2,957 0% Managed Services 11,012,682 13,822,328 (2,809,646) -20% Retail Services 1,339,394 889,173 450,221 51% Other 885,482 3,548,385 (2,662,903) -75% Total Revenue 19,781,729 24,801,100 (5,019,371) -20%
For
per
sona
l use
onl
y

ENERGY ACTION LIMITED ABN 90 137 363 636
P a g e | 9 Energy Action Limited ABN 90 137 363 636
FINANCIAL REPORT FOR THE FULL YEAR ENDED 30 JUNE 2020
Revenue for the full year decreased from $24.80 million to $19.78 million mainly as a result of the following:
Procurement revenues were flat overall with:
o Growth in Auctions Electricity of 10%, driven by a 2% increase in the number of Auctions performed to 759 (up from 744 restated pcp), and an increase in the average annualized MWh’s per AEX up 7.7% to 1,124 from pcp of 1,044. Average $/Mwh declined 6.7% with pricing decreasing to 5 year lows in 2H FY20 and stabilising. In line with our contracting guidance, contract duration was 29.4 months, and increase of 1.3mths from pcp of 28.1 months. Retention rates saw significant improvement, with success in contracting early in a low price environment.
o Growth in Auctions Gas up 26% with increased gas availability and competitive tension allowing customers taking advantage of procurement savings.
o Tenders – growth of 34% with growth in volume and price with a product mix shift towards competitive tenders.
o Tariffs saw a decline of 41% impacted by lower volumes, and structured products and procurement consultancy declined 24% with a product mix shift to other procurement methods in a low price and low volatility environment.
o Broking of Solar and Energy projects, now included in procurement, saw some growth off a relatively lower base and is continuing as a future growth strategy to deliver our customers.
Managed Services revenue declined by 20% with a decline in sites under management by 1,761 to 5,446. 36% of sites loss in Metrics and Data only contracts, relates to multiple small customers <10 sites, contracted over a 5 year period and now ending. The remaining decline is the non-renewal of large site customers predominately in our Corporate solutions area. Bureau services reduced significantly from 1 Corporate solutions customer not renewed in Oct 19.
Gross Sales order for Metrics Managed Services has seen significant growth of 52% in FY20 with a key strategy to invest in value added technology, service and delivery and expand customer value in this core product.
Retail Services revenue increased 51% with growth in sites and annualisation of revenue from significant onboarding in FY20. Sydney Trains was secured in FY20 with +303 sites, it is part way through onboarding with 130 sites remaining in FY21.
Other – 47% of the total company revenue decline over pcp is related to the repositioning of Advisory, with $0.8M revenue in FY20 as compared to pcp of $3.55M, a decline of -$2.66M. However, the impact on overall profit as a result of repositioning these services is positive, with reduced COGS, wages and other costs also reduced.
Operating expenditure and Cost of Goods Sold (COGS) Operating overheads (net of significant items) and COGS (predominately internal resources) totalled $17.8 million, compared to $22.3 million in FY19, a reduction of $4.25 million (19%), with reduced operating costs predominantly related to employment costs. The reduction in costs has partially offset the decline in revenue resulting a decline in EBITDA margin to 8.9%, down from 10.2%. In particular:
Employment costs were $2.1 million lower than pcp primarily as a result of:
o A reduction of 15 FTE as a result of the repositioning of the Advisory business, impacting COGS (internal resources) and Operating expenditure
o A reduction of 9 FTE with improved integration and efficiency o The Company continues to expand its offshore resources replacing onshore transactional roles as
appropriate with an increase of +8 resources to 26 FTE in FY20. o A voluntary salary reduction of 20% adopted by the Directors, Senior Leadership team and the vast
majority of staff impacting FY20 for a 2-3 month period. o Reduction in the number of Directors from 4 to 3 effective 1 May 20 o Increased sales commission in line with improved sales results and execution
Reduction of rental occupancy costs with: o Annualised savings from the consolidation of office locations in Sydney and Melbourne o Canberra onerous lease in June 2019, following the repositioning of the Advisory business.
For
per
sona
l use
onl
y

ENERGY ACTION LIMITED ABN 90 137 363 636
P a g e | 10 Energy Action Limited ABN 90 137 363 636
FINANCIAL REPORT FOR THE FULL YEAR ENDED 30 JUNE 2020
o Adoption of AASB16 Leases for premises in Parramatta and Brisbane, reducing rent expense and increasing amortisation of Right of Use Asset.
o Due to COVID-19 costs for serviced offices have reduced and some rental savings achieved in fixed tenanted locations.
COVID-19 related cost savings estimated at $0.3 million with reduced travel
Reduced accounting & audit fees with a change in auditors and legal fees with ongoing strict cost control across all discretionary spend areas.
Depreciation & Amortisation (D&A)
D&A increased $0.45 million predominately as a result of the adoption accounting standard AASB16 Leases, with amortisation of a Right of Use Asset implemented from 1 July 2020.
Cashflows
Operating Cash flow was $2.0 million, down 49% on pcp, however continuing the strong underlying cash generation in the business. The Company has continued an ongoing focus on working capital management, achieving an operating cash flow conversion of 112% to operating EBITDA.
Reconciliation of Operating Cash Flow before interest, tax and significant items
30 June 2020 30 June 2019
Statutory operating cash flow 3,013,733 2,702,643
Add back:
Taxes paid (18,517) 168,952
Interest paid / (received) 311,654 405,679
Cash flows related to significant items 88,505 666,088
Significant items working capital – government relief, government assistance & others
(1,409,954) -
Operating cash flow before interest, tax and significant items 1,985,421 3,943,362
Operating EBITDA 1,766,558 2,538,633
Operating cash flow as % of Operating EBITDA 112% 155%
The group incurred capital expenditure of $1.90 million during the year predominately on IT projects, particularly completing the renewal of the Group’s core Customer and Contract Management platforms.
The Company holds a $7.55 million loan agreement, expiring September 2021, with the facility limit reduced by $2 million during FY20, providing savings in borrowing costs of $32,000 per annum.
Funds can be provided under the facility as loans, bank guarantees or as letters of credit with $7.3 million available to be utilised for liquidity purposes. As at 30 June 2020, the Company had utilised $6.38 million of the facility comprising a loan of $6.20 million and bank guarantees principally in relation to rental properties and guarantee provided on project works of $0.18 million. The Group had $3.18 million of unrestricted cash at bank at 30 June 2020, and total undrawn facilities and cash of approximately $0.92 million.
Net debt was reduced in FY20 to $3.19 million as at 30 June 20, a decrease of $1.2 million over pcp, positively impacted by COVID-19 related government stimulus of $1.75 million.
The company reached an agreement to waive the requirement to test and comply with the financial covenants under the facility as at 30 June 2020. The Company is proactively partnering with the bank to renegotiate the existing facility to a long term facility agreement, prior to 31 Dec, 2020.
For
per
sona
l use
onl
y

ENERGY ACTION LIMITED ABN 90 137 363 636
P a g e | 11 Energy Action Limited ABN 90 137 363 636
FINANCIAL REPORT FOR THE FULL YEAR ENDED 30 JUNE 2020
Other
A Nil dividend was declared in FY20 with a priority of managing net debt, investing in value added technology, service and delivery, expand customer value and continue to see growth in customer sales and revenue.
The Group incurred significant items net of tax effect totaling $2,510,709 including :
Impairment of software of $2,618,365 related to CRM software. A formal assessment of the carrying value of the CRM software undertaken. This assessment resulted in the impairment of the remaining written down value of the CRM assets.
Acceleration of amortization for software of $148,423. A formal assessment of the carrying value of Software has been undertaken. This assessment resulted in an acceleration of amortisation of software.
Government assistance of $607,738 including Jobkeeper payment and payroll tax refund, before tax representing $838,260. Cash of $545,117 was received in FY20 and $293,143 to be received in FY21.
Costs associated with an organisational restructure of $328,265 relates to the repositioning of the Advisory division, and additional reduction of roles creating improved integration and efficiency
Costs associated with other items is $23,393.
Forward revenue
Forward revenue for the year ending 30 June 2020 has declined to $16.8 million with Procurement and Managed Services forward revenue declining with new contract sales lower than roll-off revenue and $2.3M decline from the repositioning of Advisory. The Company continues to focus on improving acquisitions, retentions, customer service and enhancing the Managed Services offering.
For
per
sona
l use
onl
y

ENERGY ACTION LIMITED ABN 90 137 363 636
P a g e | 12 Energy Action Limited ABN 90 137 363 636
FINANCIAL REPORT FOR THE FULL YEAR ENDED 30 JUNE 2020
Operational Key Performance Indicators
FY20 FY193 % change
Procurement
No. of successful AEX auctions 759 744* 2%
Average AEX contract duration (months) 29.4 28.1 1.3mths
TWhs sold via Auction (annualised equivalent) 0.80 0.77 3.9%
Average annualised MWhs per successful AEX 1,124 1,044 7.7%
Average $/MWh $75.4 $80.8 -6.7%
Total Auction bid value1 $154m $147m 4.8%
No. of electricity tender events 31 27 14.8%
No. of gas tender events 29 32 -9.4%
Managed & Retail Services 30 June 2020 30 June 2019
Sites under current contract2 No.
Total Managed Services sites under contract 5,446 7,207 -1,761
Average Metrics contract duration (months) 41.0 43.0 -2.0mths
Retailer and Embedded Network tenancies 3,570 3,116 +454
Total sites 9,016 10,323 -1,307
Total Company Future contracted revenue $16.8m $25.1m -33.1%
Advisory repositioned services future contracted revenue $0.1m $2.4m -95.8%
Ongoing Services future contracted revenue $16.7m $22.7m -26.4%
1 Electricity component of contract only, i.e. excluding network and other charges 2 Does not include contracts which are signed, but yet to commence service delivery 3 Some FY19 comparables have been restated
*The revised values in the below table reflect a restatement of historical auction volumes. This is due to excluding non-material, revenue neutral transactions to align with classifications implemented in new CRM development.
FY20 FY19 FY18 FY17 FY16
Restated AEX Volume 759 744 1078 1078 1336 Prior year reported AEX volume 759 854 1311 1306 1550 Variance 0 -110 -233 -228 -214
Operational Performance
The financial year 2020 has been a year of transition as the business:
• Improved focus and underlying performance on core activities and growth lines whilst addressing the fundamentals of sales, service and culture
• Repositioning of loss making business lines
• Completed a 5 year technology project
The business continues to be impacted by revenue decline for managed services. This revenue declined ($2.2M) due to client decisions over the past two to three years. As the business is principally an annuity, “as a service” business, the roll off of long-term contracts requires significant current year sales growth to secure future revenues. Sales in FY20 for managed services were 26% up from the prior year, and were a record for many years. This will help underpin future year revenues.
For
per
sona
l use
onl
y

ENERGY ACTION LIMITED ABN 90 137 363 636
P a g e | 13 Energy Action Limited ABN 90 137 363 636
FINANCIAL REPORT FOR THE FULL YEAR ENDED 30 JUNE 2020
The operating loss in the first half was due to lower than expected sales growth, despite improvements over prior years, and the under performance of the Advisory business. Immediate action was taken including the accelerated repositioning from the unprofitable advisory business and additional headcount and overhead reductions.
The mid year outlook was to return to profit in the second half, with a breakeven full year guidance. However, the business was further impacted by COVID-19 with the cancellation or deferral of sales in late March 20 and April 20.
The ability to return to a small full year operating profit was due to both strong sales growth in May 20 and June 20 and a voluntary pay cut of 20% adopted by the Directors, Senior Leadership team and the vast majority of staff. Welcome government or landlord support improved the cash position and improved the operating result, however the primary contribution for Job Keeper $0.84M, has been recorded as a Significant Item including $0.55M cash received in FY20 and $0.29M to be received in Jul 20.
Business Priorities
During the financial year 2020 the primary focus of the business has been pursuing Foundations of Growth and five key priorities. This program is now largely complete and the platform is set to Accelerate growth.
Priorities Activity Achievements
Sales Growth The sales function has been largely re-built. Market leadership has been maintained in core procurement activity with increased volumes negotiated and managed for clients.
Sales Growth 33% of core products
Auction levels increased
Tenders and Negotiated Volumes increased
Highest Managed Services Net Sales in 5 years
Expanded number of competing retailers and metering companies
Capability
The Group’s core Customer and Contract Management Platforms in Microsoft CRM was completed in January 2020 and is stabilised but additional effort is underway to capture productivity benefits.
5 Year transformation completed in January Appointment of new Chief Technology Officer (CTO) and recruitment of inhouse technology development team
Service Focus on on-time reliable delivery of milestone reports. Development and maintenance of agreed service level agreements with key accounts.
Highest net promoter scores in 5 years
Highest retention rates in 5 years
Profit Disciplined cost, cash and KPI management. Proactive management of bank facilities and relationship.
Accelerated repositioning from loss making business lines
Additional redundancies without impacting sales and core service delivery
20% Voluntary Pay Cut adopted by the Directors, Senior Leadership team and the vast majority of staff
Engagement Focus on developing a high-performance culture
Improved engagement remains at industry benchmark
Staff turnover reduced 39%, excluding involuntary separation staff turnover reduced 65%
For
per
sona
l use
onl
y

ENERGY ACTION LIMITED ABN 90 137 363 636
P a g e | 14 Energy Action Limited ABN 90 137 363 636
FINANCIAL REPORT FOR THE FULL YEAR ENDED 30 JUNE 2020
Innovation & Market Leadership
There have been a number of key operational highlights in the period that include:
• Leading the market with Net Zero – 80% of clients want to achieve Net Zero, only 30% have a plan. In response, Energy Action has adopted its own Net Zero sales strategy and offering, with the sales team actively engaging clients to help them achieve Net Zero
• Launch of Auction Blitz – Initiative to help clients achieve more competitive pricing through having retailers bid on concurrent auction loads. This has attracted new clients to Energy Action
• Launch of Market Wrap - providing expert weekly market commentary, insights and opinion for clients and prospects
• Hibernate or Innovate – Energy Action adopted a leadership role in the early days of COVID-19 through webinars and emails to keep clients informed, and to provide practical steps to reduce costs or manage risk
• Launch of Bill Buster – Initiative to bring group buying to “small market” business customers to complete with high cost, lower discount transactional comparison sites
• Sydney Trains - Expended Embedded Network Retail Services scope for Sydney Trains to include accounts receivable for 300 sites as part of energy spend management
COVID-19
Energy Action has demonstrated incredible resilience, quality cashflows and continued sales growth, in a period of significant uncertainty and change for all organisations during the COVID-19 pandemic as below:
• Energy market
o Only moderate impact on total electricity demand
o Lower oil and gas prices leading to lower wholesale electricity prices and a great opportunity for customers to secure a lower priced contract
o Commercial usage fluctuations amid various restrictions across states
• Client Base
o Cancellation or deferral of sales in late March 20 and April 20, with customers stabilising their organisations in the first few weeks of COVID-19 impact. However, since May 20 we have seen stabilisation of the majority of clients, now engaging and contracting. Some isolated occurrence of clients seeking cancellation of blend and extend arrangements.
o Highly diverse client base across industry sectors has mitigated disruption
o Client energy usage in Pubs, Clubs and Accommodation impacted by re-introduction of restrictions in Victoria
o High levels of engagement and response to leadership webinars “Innovate of Hibernate during COVID-19”
• Operational Response
o Developing resilience through clear leadership and employee engagement
o Rapid and effective deployment of all staff working from home (WFH) in all states and offshore locations
o Productivity stabilised and maintained at highly effective levels
o Effectively working with customers who are working remotely through various digital platforms
For
per
sona
l use
onl
y

ENERGY ACTION LIMITED ABN 90 137 363 636
P a g e | 15 Energy Action Limited ABN 90 137 363 636
FINANCIAL REPORT FOR THE FULL YEAR ENDED 30 JUNE 2020
• Financial Considerations
o JobKeeper and payroll tax government assistance of $0.8M have offset operating expenses, with $0.55 received in cash prior to 30 June 20 and $0.3 million to be received in FY21. It is anticipated that the Company will receive additional government assistance in FY21 of $1 million until 30 September 2020.
o Net debt was positively impacted by COVID-19 related government stimulus of $1.75 million, the majority of which will be required to be paid in FY21.
o Wide-scale adoption of 20% voluntary pay reduction by Directors, Senior Leadership and majority of staff.
o Operating cost reductions with lower travel and entertainment.
Business strategy and prospects for future financial years
The business has adopted the 3 Horizons plan for long term growth.
Horizon 1 – FY21 and beyond
• Accelerate leadership in procurement and managed services
• Build Retail Services business
• Bootstrap investment in technology platform to enhance scalability
Horizon 2 – (FY21-22)
• Leverage technology platform to grow sales and reduce costs
• Introduce additional products such as solar procurement
• Expand Retail Services offer and capabilities for Micro-grids
Horizon 3 – (FY22-25)
• Leverage local customer base, partners and technology platform to pursue international expansion, regionally and globally
Focusing on “Accelerate” the 5 key priorities will be:
Priorities Accelerate
Sales Revenue, Auction, Tenders and Sites under management growth
Service Continue to Improve retention and net promoter scores
Technology In house team for production support and service innovation
Profit Disciplined cost, cash and KPI management. Proactive management of loan facility
People A focus on Engagement and a High Performance Culture
Outlook
Guidance remains withdrawn due to the prolonged and unclear impact of COVID-19, however the business expects to achieve the following milestones in the next 1-2 year period:
• 1,000 Auctions per annum
• 10,000 Sites under Management
• 10% EBITDA
Risks to achieving financial outcomes in relation to future prospects
Energy Action identifies major risks using an enterprise wide risk program. Energy Action faces a wide variety of risks due to the nature of the industry in which it operates. In relation to each risk, Energy Action has in place actions to reduce the
For
per
sona
l use
onl
y

ENERGY ACTION LIMITED ABN 90 137 363 636
P a g e | 16 Energy Action Limited ABN 90 137 363 636
FINANCIAL REPORT FOR THE FULL YEAR ENDED 30 JUNE 2020
likelihood of the risk eventuation and / or to reduce, as far as practicable, the adverse consequences of the risk should it occur. Many of the risks are influenced by factors external to, and beyond the control of Energy Action. Details of Energy Action’s main risks and the related mitigations are set out below:
Risk Risk Description Potential consequences and mitigation strategies
Customer Retention/Acquisition
Failure to attract and retain sufficient customers to sustain the business
Continued focus on acquisitions and retention rates. A major review of Corporate Solutions retention was initiated in FY20 and continues to examine all aspects of sales activity, identifying actions that are required from operations and administration to improve customer retention.
Increasing competition
The risk that Energy Action is unable to differentiate from competitors.
Review of service offerings undertaken during FY20 led to the repositioning of product lines. Continuing innovation in core Procurement and Managed Services products.
Failure to deliver against customer obligations.
The risk that Energy Action is unable to meet its contractual obligations to customers for the delivery of services.
Potential earnings and reputational impact from failure to deliver contracted services has been mitigated by repositioning from unprofitable markets, improved business processes for delivery of ongoing services, including the replacement of Energy Action’s core Customer and Contract Management platforms, and increased risk management planning for customer outcomes. The initiation and analysis of core product NPS scores and brand continues.
Earnings and Cash Flow
The risk of failing to maintain adequate earnings and funding to finance growth objectives and to generate adequate returns for shareholders.
Mitigated by implementation of a focused back to basics strategy and to establish the core foundations for growth. This includes the decision to re-position PAS, a leaner management structure, improve sales growth, company capability, service delivery and employee engagement through building a high performance culture. In addition, mitigated by improved visibility of key performance indicators and drivers of performance, timely and transparent market disclosures, and maintenance of strong relationships with banking partners and shareholders.
Occupational Health & Safety (OH&S)
The risk of not operating safely and in accordance with relevant legislation leading to an employee injury.
Potential for employee injury and Company reputation addressed by OH&S systems and practices. Mitigated by ongoing training and updates to OH&S policies. The OH&S risk has also reduced with the repositioning of the Advisory business. The business has limited requirements now to attend sites for projects.
Employee engagement and performance
The risk of failing to attract and retain the best talent available.
Impacts on performance due to unavailability of talent. This is mitigated by staff development plans, succession plans and remuneration strategies.
Loss of key staff
The risk of company performance declining due to key staff either leaving or being unavailable unexpectedly or due to high turnover of non-key staff hampering performance due to training lead times.
Mitigated by staff reviews, identification of points of vulnerability, cross training and succession planning and appropriate remuneration strategies.
Legal risk – Competition and consumer law or terms of the company’s AFS licence.
The risk of legal action following a breach of the Competition and Consumer Act or the terms of Energy Action’s Australian Financial Services Licence.
Likelihood of breaches reduced by training of all outward facing staff in Consumer and Competition Law requirements. AFSL compliance system in place. Procedures in place for monitoring and reporting of breaches and potential breaches.
Cyber Security Risk
Cyber-attack or similar event involving unauthorised access to EAX’s IT systems leading to denial of systems and/or corruption of data.
Procedures for systems recovery are in place including off site storage of data. Systems restoration has been completed within 24 hours where a cyber breach has occurred.
For
per
sona
l use
onl
y

ENERGY ACTION LIMITED ABN 90 137 363 636
P a g e | 17 Energy Action Limited ABN 90 137 363 636
FINANCIAL REPORT FOR THE FULL YEAR ENDED 30 JUNE 2020
Environmental issues The Group’s operations are not regulated by any significant environmental regulation under a law of the Commonwealth or of a state or territory.
Energy Action is committed to contributing to the achievement of the UN Sustainability Development Goals and assisting our clients to transition to a low carbon economy, recognising its obligations both locally and globally, to the present and succeeding generations. Energy Action aims to lead in defining best environmental practice and will set its own demanding standards where none exist. Energy Action is committed to implementing the requirements of all applicable Commonwealth, State and local environmental legislation and regulations and, where possible, exceeding any relevant minimum requirements.
Energy Action aims to raise the environmental awareness of the public, governments, industry, and the general community by promoting the concept of ecological sustainability and by openly recognising the ongoing need to move toward an ecologically sustainable future.
Meetings of Directors
The number of meetings of Directors (including meetings of committees of Directors) held during the year and the number of meetings attended by each Director was as follows:
Board Meeting Audit & Risk Committee
Nomination and Remuneration Committee
No. Eligible to attend
No. Attended
No. Eligible to attend
No. Attended
No. Eligible to attend No. Attended
Murray Bleach 14 14 4 4 3 3
Paul Meehan 14 14 4 4 3 3
Nitin Singhi 14 14 4 4 3 3
Mark de Kock 12 11 3 2 2 2
Indemnifying Officers or Auditor During or since the end of the financial year, the Company has given an indemnity or entered into an agreement to indemnify, or paid or agreed to pay insurance premiums as follows:
• The Company has paid premiums to insure each of the Directors against liabilities for costs and expenses incurred by them in defending legal proceedings arising from their conduct while acting in the capacity of Director of the Company, other than conduct involving a wilful breach of duty in relation to the Company.
• To the extent permitted by law, the Company has agreed to indemnify its auditors, RSM Australia Partners, as part of the terms of its audit engagement agreement against claims by third parties arising from the audit (for an unspecified amount). No payment has been made to indemnify RSM Australia Partners during or since the financial year.
Proceedings on Behalf of Company No person has applied for leave of Court to bring proceedings on behalf of the Company or intervene in any proceedings to which the Company is a party for the purpose of taking responsibility on behalf of the Company for all or any part of those proceedings. The Company was not a party to any such proceeding during the year.
Non-audit Services The Board of Directors, in accordance with advice from the audit and risk management committee, is satisfied that the provision of non-audit services during the year is compatible with the general standard of independence for auditors imposed by the Corporations Act 2001. The Directors are satisfied that the services disclosed below did not compromise the external auditor’s independence for the following reasons:
– all non-audit services are reviewed and approved by the audit committee prior to commencement to ensure they do not adversely affect the integrity and objectivity of the auditor;
– the nature of the services provided does not compromise the general principles relating to auditor independence in accordance with APES 110: Code of Ethics for Professional Accountants set by the Accounting Professional and Ethical Standards Board; and
– no fees were paid or payable to RSM Australia for non-audit services provided during the year ended 30 June 2020.
For
per
sona
l use
onl
y

18
THE POWER OF BEING UNDERSTOOD AUDIT | TAX | CONSULTING
RSM Australia Partners is a member of the RSM network and trades as RSM. RSM is the trading name used by the members of the RSM network. Each member of the RSM network is an independent accounting and consulting firm which practices in its own right. The RSM network is not itself a separate legal entity in any jurisdiction.
RSM Australia Partners ABN 36 965 185 036
Liability limited by a scheme approved under Professional Standards Legislation
RSM Australia Partners
Level 13, 60 Castlereagh Street Sydney NSW 2000 GPO Box 5138 Sydney NSW 2001
T +61 (0) 2 8226 4500 F +61 (0) 2 8226 4501
www.rsm.com.au
AUDITOR’S INDEPENDENCE DECLARATION
As lead auditor for the audit of the financial report of Energy Action Limited for the year ended 30 June 2020, I declare that, to the best of my knowledge and belief, there have been no contraventions of:
(i) the auditor independence requirements of the Corporations Act 2001 in relation to the audit; and
(ii) any applicable code of professional conduct in relation to the audit. RSM AUSTRALIA PARTNERS C J Hume Partner Sydney, NSW Dated: 26 August 2020
For
per
sona
l use
onl
y

ENERGY ACTION LIMITED ABN 90 137 363 636
P a g e | 19 Energy Action Limited ABN 90 137 363 636
FINANCIAL REPORT FOR THE FULL YEAR ENDED 30 JUNE 2020
Remuneration Report (Audited)
The directors present the Remuneration Report for Energy Action Limited (“Company”) and its consolidated entities (“Group”) for the year ended 30 June 2020. 1. REMUNERATION FRAMEWORK
1.1. Role of the Remuneration Committee
The Remuneration Committee ensures that the remuneration of directors and senior executives is consistent with market practice and sufficient to ensure that the Group can attract, develop and retain the best individuals. The committee review directors’ fees, and remuneration of the CEO and senior executives against the market, Group and individual performance. The committee consisted of four non-executive directors, namely Nitin Singhi (Chairman), Murray Bleach, Mark de Kock (resigned 30 April 2020) and Paul Meehan. The committee charter is available on the Group’s website. The committee oversees governance procedures and policy on remuneration including:
General remuneration practices, Performance management, Bonus and incentive schemes, and Recruitment and termination.
Through the committee, the board ensures the company’s remuneration philosophy and strategy continues to be designed to: Attract, develop and retain Board and executive talent, Create a high-performance culture by driving and rewarding executives for achievement of the Group’s
strategy and business objectives, and
Link incentives to the creation of shareholder value.
In undertaking its work, the committee seeks advice as required.
1.2. Key Management Personnel
Key Management Personnel (“KMP”) are those persons having authority and responsibility for planning, directing and controlling the activities of the entity, directly or indirectly, including any director of the Company or subsidiaries. The following persons were KMPs during the financial year. Unless otherwise indicated, they were KMPs for the entire year.
1.2.1. Non-Executive directors Murray Bleach Non-Executive Chairman Paul Meehan Non-Executive Director Nitin Singhi Non-Executive Director Mark de Kock Non-Executive Director (resigned effective 30 April 2020)
1.2.2. Senior executives (not directors of the board)
John Huggart Chief Executive Officer Tracy Bucciarelli Chief Financial Officer
For
per
sona
l use
onl
y
ENERGY ACTION LIMITED ABN 90 137 363 636
P a g e | 20 Energy Action Limited ABN 90 137 363 636
FINANCIAL REPORT FOR THE FULL YEAR ENDED 30 JUNE 2020
1.3. Remuneration Consultants
Where necessary, the Board seeks advice from independent experts and advisors including remuneration consultants. Remuneration consultants are used to ensure that remuneration packages are appropriately structured and are consistent with comparable roles in the market. Remuneration consultants are approved by, and recommendations provided directly to, non-executive directors (the remuneration committee). When remuneration consultants are engaged, the remuneration committee ensures that the appropriate level of independence exists from the Group’s management. No remuneration consultants were used this year.
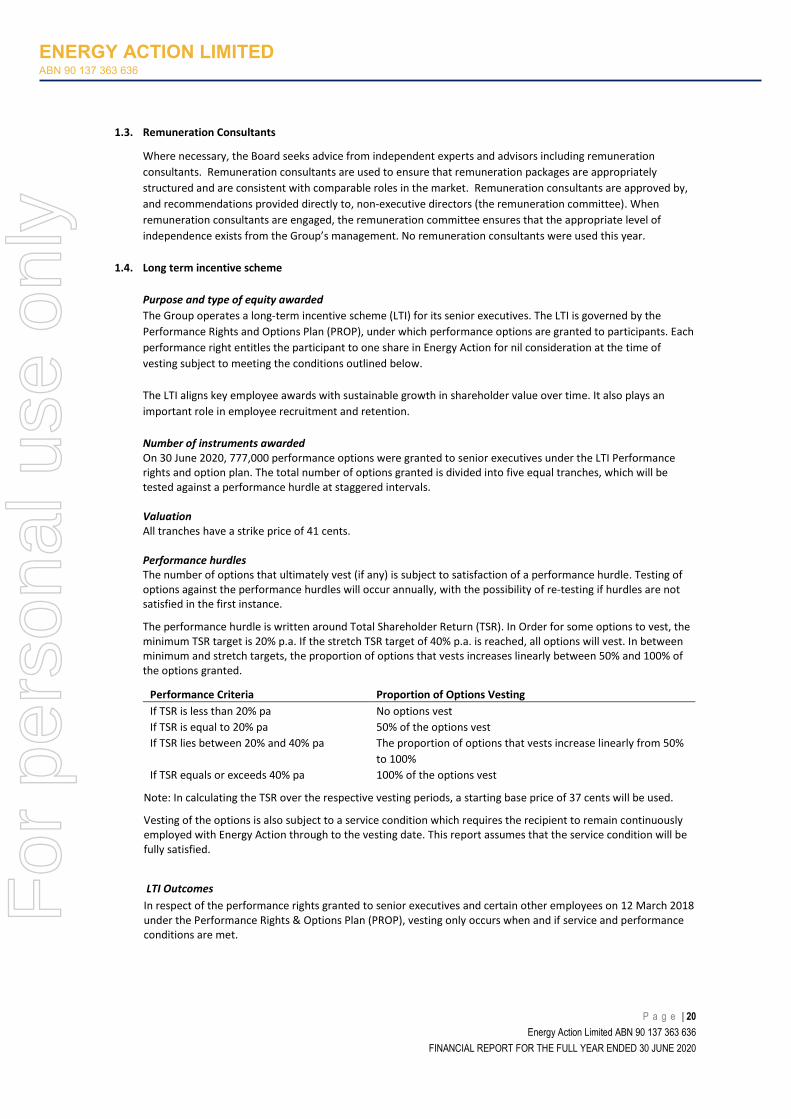
1.4. Long term incentive scheme
Purpose and type of equity awarded The Group operates a long-term incentive scheme (LTI) for its senior executives. The LTI is governed by the Performance Rights and Options Plan (PROP), under which performance options are granted to participants. Each performance right entitles the participant to one share in Energy Action for nil consideration at the time of vesting subject to meeting the conditions outlined below. The LTI aligns key employee awards with sustainable growth in shareholder value over time. It also plays an important role in employee recruitment and retention. Number of instruments awarded On 30 June 2020, 777,000 performance options were granted to senior executives under the LTI Performance rights and option plan. The total number of options granted is divided into five equal tranches, which will be tested against a performance hurdle at staggered intervals. Valuation All tranches have a strike price of 41 cents. Performance hurdles The number of options that ultimately vest (if any) is subject to satisfaction of a performance hurdle. Testing of options against the performance hurdles will occur annually, with the possibility of re-testing if hurdles are not satisfied in the first instance.
The performance hurdle is written around Total Shareholder Return (TSR). In Order for some options to vest, the minimum TSR target is 20% p.a. If the stretch TSR target of 40% p.a. is reached, all options will vest. In between minimum and stretch targets, the proportion of options that vests increases linearly between 50% and 100% of the options granted.
Performance Criteria Proportion of Options Vesting If TSR is less than 20% pa No options vest If TSR is equal to 20% pa 50% of the options vest If TSR lies between 20% and 40% pa The proportion of options that vests increase linearly from 50%
to 100% If TSR equals or exceeds 40% pa 100% of the options vest
Note: In calculating the TSR over the respective vesting periods, a starting base price of 37 cents will be used.
Vesting of the options is also subject to a service condition which requires the recipient to remain continuously employed with Energy Action through to the vesting date. This report assumes that the service condition will be fully satisfied.
LTI Outcomes In respect of the performance rights granted to senior executives and certain other employees on 12 March 2018 under the Performance Rights & Options Plan (PROP), vesting only occurs when and if service and performance conditions are met.
For
per
sona
l use
onl
y

ENERGY ACTION LIMITED ABN 90 137 363 636
P a g e | 21 Energy Action Limited ABN 90 137 363 636
FINANCIAL REPORT FOR THE FULL YEAR ENDED 30 JUNE 2020
Neither the TSR nor EPS hurdles were met for the year ending 30 June 2020 for such performance rights. The Energy Action TSR for the period 1 July 2019 to 30 June 2020 was negative 61.4% compared to the benchmark ASX300 index which returned negative 12.1%. Accordingly, no rights will vest in 2020.
Number of instruments awarded As at 30 June 2020, the PROP accounted for nil% (FY19 0.1%) of issued securities of the Group, made up of nil (FY19 33,334) performance rights. This was due to no performance hurdle has been met in respect of the rights issued. REMUNERATION
1.5. Fees payable to non-executive directors
Fees paid to non-executive directors reflect the demands which are made on, and the responsibilities of, directors. Directors’ fees are reviewed annually by the board. Directors who chair or are members of a committee do not receive fees for these services. The board considers the advice of independent remuneration consultants to ensure directors’ fees are appropriate and in line with the market. The chairman’s fees are determined independently to the fees of directors and are based on comparative roles in the market. The chairman is not present at any discussion relating to the determination of his remuneration. Directors’ fees are determined within an aggregate fee pool limit approved by shareholders. This is currently set at $400,000 per annum. The annual fee structure for non-executive directors for the year ended 30 June 2020, including superannuation, was as follows:
Base fee
$ FY20 $ FY20 $ FY19 $ FY19 1/4/20-30/6/20 1/7/19-31/3/20 1/2/19-30/6/19 1/7/18-31/1/19
Non-Executive Chairman 32,000 45,000 45,000 75,000 Non-Executive Director 1 36,000 36,000 36,000 60,000
Non-Executive Director 2 25,600 36,000 36,000 60,000
The above fees include committee membership. The tables at the end of this remuneration report provide details of fees paid during the financial year to each non-executive director.
The non-executive directors and chairman fees were reduced by 40% effective 1 February 2019. Due to the impact that COVID-19 has on the business, the non-executive directors and chairman fees was temporarily reduced by a further 20% for this pool for 6 months effective from 1 April 2020.
1.6. Senior executives
The framework for the remuneration of senior executives consists of a mix of fixed and variable remuneration. The components are:
Base remuneration package and benefits, inclusive of superannuation (Total Fixed Remuneration) Short-Term Incentive – based on the Group’s, team and individual performance and results delivered
against pre-determined Key Performance Indicators (KPIs) Long Term Incentive – governed by the Performance Rights and Options Plan (PROP)
The combination of the above components comprises the executive’s total remuneration.
The Group undertakes a market benchmarking analysis and provide recommendations. The market analysis considers the target total remuneration opportunity as well as its core components and the mix of those components. In addition, the information also contains a view on market and emerging trends in executive remuneration structures and the mix of fixed and performance-based remuneration arrangements. The agreed remuneration mix for the CEO and CFO for the year ended 30 June 2020 was:
For
per
sona
l use
onl
y

ENERGY ACTION LIMITED ABN 90 137 363 636
P a g e | 22 Energy Action Limited ABN 90 137 363 636
FINANCIAL REPORT FOR THE FULL YEAR ENDED 30 JUNE 2020
Fixed Component STI Bonus Component
LTI Component
Chief Executive Officer 79% 18% 3% Chief Financial Officer 83% 15% 2%
Long Term Incentive (LTI) The LTI component percentage set out above as part of the annual remuneration is based on the fair value of the options granted for the CEO and CFO (see detailed explanation below). The Performance Options granted for the benefit of the CEO and CFO vest in equal proportions over a five-year vesting period on the basis of share price appreciation. The options would, if fully vested, represent a net gain of approximately 32% of the total fixed remuneration of the CEO and CFO (on current terms and conditions) over such period.
Short-Term Incentive (STI) The STI is based upon performance against the Group financial performance and results from the Group’s performance review process. Mid-year and final year performance reviews measure performance against established KPI’s and criteria which are compiled in a matrix comprising Group and individual components. The specific company measures include profitability, revenue growth and customer satisfaction. Individual measures are developed having regard to functional plans and targets, aligned to the company strategy.
The outcome of the performance review process is a rating, applied to each of these three components for an individual, culminating in a percentage (capped at 150%). The final percentage allocated to each person is then applied to the STI potential to determine the actual STI payment to be made to an individual.
The performance matrix used to determine actual STI earnings against the STI potential for the CEO and CFO is:
Company Individual Chief Executive Officer 70% 30% Chief Financial Officer 70% 30%
The company 70% is made up of Company NPAT 50%, Client NPS 10% and Employee engagement 10%
The Board is responsible for assessing the performance of the CEO. The CEO is responsible for assessing the performance of other executives.
Bonus payments are made annually, where applicable, in September in relation to the preceding year.
The actual percentage of STI potential and LTI potential earned by the CEO and COO/CFO for the year ended 30 June 2020 was:
% of Bonus Potential
% LTI Potential
John Huggart 0% 0% Tracy Bucciarelli 0% 0%
The STI potential for each individual is set at the beginning of the year, having regard to service agreement terms and conditions, and relates to the appropriate extent of the at-risk component of the executive’s remuneration. The broader company performance criteria ensure that an overall management focus is maintained by the executives, however the inclusion of individual criteria is also necessary to ensure that each person is recognised and rewarded for their individual contribution and efforts. Payment of any individual KPI achievement is conditional on the Group meeting a minimum threshold Operating Profit.
For
per
sona
l use
onl
y

ENERGY ACTION LIMITED ABN 90 137 363 636
P a g e | 23 Energy Action Limited ABN 90 137 363 636
FINANCIAL REPORT FOR THE FULL YEAR ENDED 30 JUNE 2020
2. Service agreements
On appointment, all non-executive directors enter into an agreement which outlines obligations and minimum terms and conditions. Remuneration and other terms of employment for the CEO and other key management personnel are formalised in employment agreements. Each of these agreements specify the components of remuneration to which they are entitled and outline base salary, eligibility for incentives and other benefits including superannuation. Key terms for the CEO and CFO are as follows:
Name Term of agreement Termination*
John Huggart On-going (no fixed term) 3 months base salary termination by company or 3 months termination by executive
Tracy Bucciarelli On-going (no fixed term) 3 months base salary termination by company or 3 months termination by executive
* Termination benefits are payable at the option of the company in lieu of notice, other than termination for cause.
Remuneration tables
4.1 Remuneration table for the year ended 30 June 2020
Details of remuneration of directors and executive KMP of the Group for the 2020 financial year are set out in the following table. The executive KMP are considered to be the CEO and CFO only.
$
Short Term Benefits Post-employmen
t Benefits
Long Term Benefits Share Based Payments
Total
Non-executive directors
Cash salary and fees
Cash bonus
Non- monetar
y benefits
Super Termination benefits
Long service leave
Performance rights
Total
Murray Bleach 40,572 - - 3,622 - - - 44,194
Paul Meehan 30,502 - - 2,898 - - - 33,400
Nitin Singhi 32,877 - - 3,123 - - - 36,000
Mark de Kock 1 27,397 - - 2,603 - - - 30,000
Sub-total 131,348 - - 12,246 - - - 143,594
Executives
John Huggart 322,092 25,571 - 21,003 - - - 368,665
Tracy Bucciarelli 214,555 - - 20,383 - - - 234,939
Sub-total 536,647 25,571 - 41,386 - - - 603,604
Total 667,995 25,571 - 53,632 - - - 747,198
Notes 1 Mark de Kock resigned 30 April 2020
For
per
sona
l use
onl
y

ENERGY ACTION LIMITED ABN 90 137 363 636
P a g e | 24 Energy Action Limited ABN 90 137 363 636
FINANCIAL REPORT FOR THE FULL YEAR ENDED 30 JUNE 2020
4.2 Remuneration table for the year ended 30 June 2019
Details of remuneration of directors and KMP of the Group for the 2019 financial year are set out in the following table. The KMP are considered to be the CEO and COO/CFO only.
$
Short Term Benefits Post- employment benefits
Long term benefits Share based payments
Total
Non-executive directors
Cash salary and fees
Cash bonus
Non- monetary benefits
Super Termination benefits
Long service leave
Performance rights
Total
Murray Bleach 57,078 - - 5,422 - - - 62,500
Paul Meehan 45,662 - - 4,338 - - - 50,000
John Mackay 1 45,662 - - 4,338 - - - 50,000
Nitin Singhi 45,662 - - 4,338 - - - 50,000
Mark de Kock 45,662 - - 4,338 - - - 50,000
Sub-total 239,726 - - 22,774 - - - 262,500
Executives
Ivan Slavich 2 210,707 - - 20,716 110,000 - -3,263* 338,160
John Huggart 3 300,170 - - 20,531 - - - 320,801
Michael Fahey 4 326,373 - - 21,922 141,032 - -2,446* 486,881
Tracy Bucciarelli 5 205,890 - - 19,329 - - - 225,219
Sub-total 1,043,240 - - 82,498 251,032 - -5,709 1,371,061
Total 1,282,966 - - 105,272 251,032 - -5,709 1,633,561
Notes 1 John Mackay resigned 30 June 2019 4 Michael Fahey resigned 27 February 2019 2 Ivan Slavich resigned 21 December 2018 5 Tracy Bucciarelli appointed 18 February 2019 3 John Huggart appointed 1 January 2019 *Lapsed on termination
Relative Proportion of Remuneration
The relative proportion of remuneration of KMP that was linked to performance and those that were fixed are as follows:
Non-executive directors
Fixed Remuneration At Risk – Cash Bonus/Other At Risk - Securities
2020 %
2019 %
2020 %
2019 %
2020 %
2019 %
Murray Bleach 100 100 - - N/A N/A
Paul Meehan 100 100 - - N/A N/A
John Mackay ^ - 100 - - N/A N/A
Nitin Singhi 100 100 - - N/A N/A
Mark de Kock ^^ 100 100 - - N/A N/A
Executives
John Huggart 81 100 16 - 3 -
Tracy Bucciarelli 85 100 13 - 2 -
Resigned as Director effective 30 June 2019 ^^ Resigned as Director effective 30 April 2020
For
per
sona
l use
onl
y

ENERGY ACTION LIMITED ABN 90 137 363 636
P a g e | 25 Energy Action Limited ABN 90 137 363 636
FINANCIAL REPORT FOR THE FULL YEAR ENDED 30 JUNE 2020
Performance rights of key management personnel.
There were 582,750 Performance Options granted to key management personnel as at 30 June 2020 (FY19 NIL Performance Options).
Fair value of Performance Options
The fair value of each Performance Option is determined on the date the Performance Options are granted using a Monte Carlo Simulation valuation model. For details on the valuation of the Performance Options, including models and assumptions used, please refer to Note 18.
All Performance Options granted for the benefit of the CEO and CFO vest in equal proportions over a five-year vesting period. The Performance Options are exercisable immediately at vesting date, subject to achievement of the relevant performance hurdles.
The tables below disclose the number of Performance Options granted, vested, or lapsed during the year. Performance Options do not carry any voting or dividend rights and can only be exercised once the vesting conditions have been met, until their expiry date.
No performance rights were issued to KMP during the 2020 financial year.
Total value of performance Options issued:
30 June 2020
Balance at
1 July 2019
Granted Grant Date
Options vested & transferre
d
Options cancelled/ forfeited/
other
Options expired without exercise
Net change Balance at
end of period
$ $ $ $ $ $ $
John Huggart - 12,113 30/6/20 - - - - 12,113
Tracy Bucciarelli - 6,057 30/6/20 - - - - 6,057
Total - 18,170 - - - - - 18,170
Total number of Performance Options issued:
30 June 2020
Balance at
1 July 2019
Granted Grant Date
Options vested &
transferred
Options cancelled/ forfeited/
other
Options expired without exercise
Net change Balance at
end of period
No. No. No. No. No. No. No.
John Huggart - 388,500 30/6/20 - - - - 388,500
Tracy Bucciarelli - 194,250 30/6/20 - - - - 194,250
Total - 582,750 - - - - - 582,750
There were no alterations to the terms and conditions of Performance Options awarded as remuneration since their grant date.
For
per
sona
l use
onl
y

ENERGY ACTION LIMITED ABN 90 137 363 636
P a g e | 26 Energy Action Limited ABN 90 137 363 636
FINANCIAL REPORT FOR THE FULL YEAR ENDED 30 JUNE 2020
Shareholdings of key management personnel 30 June 2020
Balance 1 July 2019
Net change
Transfer from
Eplan
KPM resigned
Balance 30 June
2020
Directors
Murray Bleach 2,700,700 2,400,000 - - 5,100,700
Paul Meehan 4,792,846 - - - 4,792,846
Nitin Singhi 3,000 - - - 3,000
John Mackay AM* 58,470 (58,470) - - -
Mark de Kock** 50,000 (50,000) - - -
Executives
John Huggart - 50,000 - - 50,000
Tracy Bucciarelli - - - - -
Total 7,605,016 2,341,530 - - 9,946,546
* John Mackay resigned as director effective 30 June 2019 ** Mark de Kock resigned as director effective 30 April 2020
Shareholdings of key management personnel 30 June 2019
Balance 1 July 2018
Net change
Transfer from
Eplan
KPM resigned
Balance 30 June
2019
Directors
Murray Bleach 1,881,645 819,055 - - 2,700,700
Paul Meehan 4,792,846 - - - 4,792,846
Nitin Singhi 3,000 - - - 3,000
John Mackay AM* 58,470 - - - 58,470
Mark de Kock - 50,000 - - 50,000
Executives
Ivan Slavich** 329,214 - - (329,214) -
John Huggart - - - - -
Michael Fahey*** 14,000 - - (14,000) -
Tracy Bucciarelli - - - - -
Total 7,079,175 869,055 - (343,214) 7,605,016
* John Mackay resigned as director effective 30 June 2019 ** Ivan Slavich resigned 21 December 2018 *** Michael Fahey resigned 27 February 2019
For
per
sona
l use
onl
y

ENERGY ACTION LIMITED ABN 90 137 363 636
P a g e | 27 Energy Action Limited ABN 90 137 363 636
FINANCIAL REPORT FOR THE FULL YEAR ENDED 30 JUNE 2020
Transactions with related parties:
Transactions between related parties are on normal commercial terms and conditions no more favourable than those available to other parties unless otherwise stated. Outstanding balances at year end are unsecured and interest free. No guarantees have been provided or received.
The following transactions occurred with related parties:
Consolidated Group
2020 $
2019 $
Key Management Personnel
Meehans Solicitors1 990 -
Horizon Services Trust2 – business consulting 36,300 116,875
Total Key Management Personnel 37,290 116,875 1The Group procures legal advice from Meehans Solicitors. Paul Meehan is the Principal of Meehans Solicitors and his firm provided legal services to the value of $990 in FY20 (FY19 NIL). 2The Group procures management services from Horizon Private Capital Partners. Nitin Singhi is director of Horizon Private Capital Partners. $36,300 was paid in FY20 (FY19 $116,875). Horizon provided consulting advice in relation to the renegotiation of the bank facility, the transfer of certain contracts in the Advisory division and the introduction of new partnerships.
4.3 Company Performance
The Group results for the financial year ended 30 June 2020 was a Statutory loss after tax of $2.49 million compared to a loss of $12.09 million in the prior year.
FY20 FY19 FY18
(Restated) FY17 FY16
Revenue & other income ($000’s)
19,782 24,801 31,767 32,957 33,978
Net profit / (loss) after tax ($000’s)
(2,487) (12,093) 3,261 1,773 (449)
Operating profit after tax ($000’s)*
24 1,005 3,261 2,521 3,520
Earnings per share – Operating
0.09 cents 3.87 cents 12.56 cents 9.71 cents 13.56 cents
Market capitalisation
$4.2m $10.4m $18.2m $19.5m $30.6m
Closing share price
$0.16 $0.40 $0.70 $0.75 $1.18
This director’s report is signed in accordance with a resolution of the Board of Directors. *refer to 2020 financial performance on page 8
Murray Bleach Director
Dated: 26 August 2020
For
per
sona
l use
onl
y
ENERGY ACTION LIMITED ABN 90 137 363 636
P a g e | 28 Energy Action Limited ABN 90 137 363 636
FINANCIAL REPORT FOR THE FULL YEAR ENDED 30 JUNE 2020
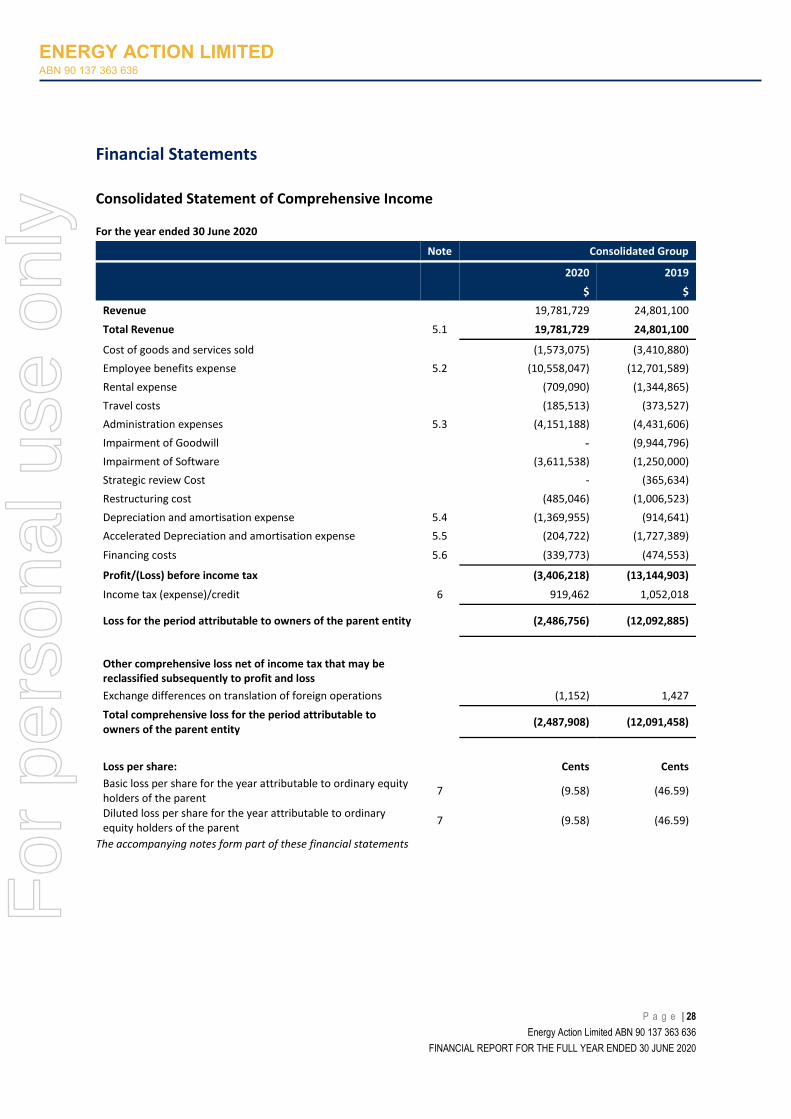
Financial Statements Consolidated Statement of Comprehensive Income
For the year ended 30 June 2020
Note Consolidated Group
2020 2019
$ $ Revenue 19,781,729 24,801,100
Total Revenue 5.1 19,781,729 24,801,100
Cost of goods and services sold (1,573,075) (3,410,880) Employee benefits expense 5.2 (10,558,047) (12,701,589) Rental expense (709,090) (1,344,865) Travel costs (185,513) (373,527) Administration expenses 5.3 (4,151,188) (4,431,606) Impairment of Goodwill - (9,944,796) Impairment of Software (3,611,538) (1,250,000) Strategic review Cost - (365,634) Restructuring cost (485,046) (1,006,523) Depreciation and amortisation expense 5.4 (1,369,955) (914,641) Accelerated Depreciation and amortisation expense 5.5 (204,722) (1,727,389)
Financing costs 5.6 (339,773) (474,553)
Profit/(Loss) before income tax (3,406,218) (13,144,903)
Income tax (expense)/credit 6 919,462 1,052,018
Loss for the period attributable to owners of the parent entity (2,486,756) (12,092,885)
Other comprehensive loss net of income tax that may be reclassified subsequently to profit and loss
Exchange differences on translation of foreign operations (1,152) 1,427
Total comprehensive loss for the period attributable to owners of the parent entity
(2,487,908) (12,091,458)
Loss per share: Cents Cents Basic loss per share for the year attributable to ordinary equity holders of the parent 7 (9.58) (46.59)
Diluted loss per share for the year attributable to ordinary equity holders of the parent 7 (9.58) (46.59)
The accompanying notes form part of these financial statements
For
per
sona
l use
onl
y

ENERGY ACTION LIMITED ABN 90 137 363 636
P a g e | 29 Energy Action Limited ABN 90 137 363 636
FINANCIAL REPORT FOR THE FULL YEAR ENDED 30 JUNE 2020
Consolidated Statement of Financial Position
For the year ended 30 June 2020
Note Consolidated Group
2020 2019
$ $ ASSETS CURRENT ASSETS Cash and cash equivalents 9 3,195,898 1,608,515 Trade and other receivables 10 2,402,416 3,495,883 Current Tax Asset 15 21,450 74,638 Other assets 13 4,231,544 4,463,137 TOTAL CURRENT ASSETS 9,851,308 9,642,173 NON-CURRENT ASSETS Trade and other receivables – non-current 10 81,948 86,043 Property, plant and equipment 11 137,057 257,283 Other assets 13 2,983,425 2,935,228 Other Intangible assets 12 514,695 3,264,423 Deferred tax asset 15 85,989 - Right of Use Asset – Non-current 13a 640,519 -
TOTAL NON-CURRENT ASSETS 4,443,633 6,542,977
TOTAL ASSETS 14,294,941 16,185,150 CURRENT LIABILITIES Trade and other payables 14 3,354,514 2,531,845 Short-term provisions 16 743,709 1,168,528 Lease liability - Current 14a 336,896 -
TOTAL CURRENT LIABILITIES 4,435,119 3,700,373 NON-CURRENT LIABILITIES Other long-term provisions 16 173,828 234,402 Loans and Borrowings 17 6,176,175 5,688,471 Deferred tax liability 15 - 868,145 Lease liability – Non-current 14a 336,126 -
TOTAL NON-CURRENT LIABILITIES 6,686,129 6,791,018
TOTAL LIABILITIES 11,121,248 10,491,391
NET ASSETS 3,173,693 5,693,759
EQUITY Issued capital 18b 6,537,906 6,537,906 Share based payments reserve 167,832 170,833 Retained earnings (10,256,261) (1,006,800) Dividend profit reserve 18g 6,723,064 - Interest Swap Reserve 18f - (9,610) Foreign currency translation reserve 1,152 1,430
TOTAL EQUITY 3,173,693 5,693,759
The accompanying notes form part of these f inancial statements
For
per
sona
l use
onl
y

ENERGY ACTION LIMITED ABN 90 137 363 636
P a g e | 30 Energy Action Limited ABN 90 137 363 636
FINANCIAL REPORT FOR THE FULL YEAR ENDED 30 JUNE 2020
Consolidated Statement of Changes in Equity
For the year ended 30 June 2020
Consolidated Group Note Ordinary
Issued Share Capital
Share Based Payments Reserve
Retained Earnings
Dividend Profit
Reserve
Foreign currency
translation reserve
Interest Swap
Reserve Total
$ $ $ $ $ $
Balance at 30 June 2018 (Restated) 6,537,906 318,226 12,124,250 - (39,810) (7,567) 18,933,005
Profit/(Loss) attributable to owners of parent entity
- - (12,092,885) - - - (12,092,885)
Foreign currency translation reserve 18d - - - - 41,240 - 41,240
Total comprehensive income
- - (12,092,885) - 41,240 - (12,051,645)
Interest rate hedging reserve 18f - - - - -
(2,043) (2,043)
Share based payments 18c - (147,393) - - - - (147,393)
Dividends paid or provided for 8 - - (1,038,165) - - - (1,038,165)
Balance at 30 June 2019 6,537,906 170,833 (1,006,800) - 1,430 (9,610) 5,693,759
Balance at 30 June 2019 6,537,906 170,833 (1,006,800) - 1,430 (9,610) 5,693,759
Profit/(Loss) attributable to owners of parent entity
- - (2,486,756) - - - (2,486,756)
Foreign currency translation reserve 18d - - (39,641) - (277) - (39,918)
Total comprehensive income
- - (2,526,397) - (277) - (2,526,674)
Dividend profit reserve 18g - - (6,723,064) 6,723,064 - - -
Interest rate hedging reserve 18f - - - - - 9,610 9,610
Share based payments 18c - (3,001) - - - - (3,001)
Dividends paid or provided for 8 - - - - - - -
Balance at 30 June 2020 6,537,906 167,832 (10,256,261)
6,723,064
1,152 - 3,173,693
The accompanying notes form part of these f inanc ial s tatements
For
per
sona
l use
onl
y

ENERGY ACTION LIMITED ABN 90 137 363 636
P a g e | 31 Energy Action Limited ABN 90 137 363 636
FINANCIAL REPORT FOR THE FULL YEAR ENDED 30 JUNE 2020
Consolidated Statement of Cash Flow
For the year ended 30 June 2020
Note Consolidated Group
2020 2019
$ $
CASH FLOWS FROM OPERATING ACTIVITIES
Receipts from customers (inclusive of GST) 22,964,303 29,169,796
Payments to suppliers and employees (inclusive of GST) (19,582,982) (25,226,434)
Restructuring costs (619,568) (393,728)
Government assistance 545,117
Strategic review - (272,360)
Interest received 4,611 6,974
Interest paid (316,265) (412,653)
Income tax paid 18,517 (168,952)
Net cash (used in) / provided by operating activities 20a 3,013,733 2,702,643
CASH FLOWS FROM INVESTING ACTIVITIES
Purchase of property, plant and equipment 11 (36,599) (122,760)
Software development costs 12 (1,866,030) (1,728,212)
Net cash used in investing activities (1,902,629) (1,850,972)
CASH FLOWS FROM FINANCING ACTIVITIES
Dividends paid by parent entity 8 - (1,038,165)
Bank loan drawn down/(repayment) 20b 476,279 623,721
Net cash (used in) / provided by financing activities 476,279 (414,444)
Net (decrease)/increase in cash held 1,587,383 437,227
Cash (including restricted cash) at beginning of financial year 9 1,608,515 1,171,288
Cash (including restricted cash) at end of financial year 9 3,195,898 1,608,515
The accompanying notes form part of these f inanc ial s tatement
For
per
sona
l use
onl
y

ENERGY ACTION LIMITED ABN 90 137 363 636
P a g e | 32 Energy Action Limited ABN 90 137 363 636
FINANCIAL REPORT FOR THE FULL YEAR ENDED 30 JUNE 2020
Notes to the Financial Statements for year ended 30 June 2020
Note 1: Corporate Information The consolidated financial statements and notes represent those of Energy Action Limited and its Controlled Entities (the “consolidated group” or “group” or ‘’EAX’’) for the year ended 30 June 2020. The financial statements were authorised for issue in accordance with a resolution of the directors on 26 August 2020. Energy Action Limited (“the Parent”) is a company limited by shares incorporated in Australia whose shares are publicly traded on the Australian Securities Exchange. The Group is a for profit entity.
The nature of the operation and principal activities of the Group are described in the directors’ report.
Note 2: Summary of Significant Accounting Policies 2.1 Basis of Preparation
The financial statements are general purpose financial statements that have been prepared in accordance with Australian Accounting Standards, Australian Accounting Interpretations, other authoritative pronouncements of the Australian Accounting Standards Board (AASB) and the Corporations Act 2001.
Material accounting policies adopted in the preparation of these financial statements are presented below and have been consistently applied unless otherwise stated. The financial statements have been prepared on an accruals basis and are based on historical costs, modified, where applicable, by the measurement at fair value of selected non-current assets, financial assets and financial liabilities. The financial report is presented in Australian dollars. The functional currency is also Australian dollars.
The financial report also complies with International Financial Reporting Standards (IFRS) as issued by the International Accounting Standards Board.
2.2 New Accounting Standards and interpretations
(i) Changes in accounting policies
The accounting policies adopted are consistent with those of the previous financial year except as follows:
The group has adopted the following Australian Accounting Standards and AASB Interpretations and change in the Company accounting policy as of 1 July 2019:
– AASB 16 Leases
AASB16 Leases The consolidated entity has adopted AASB 16 from 1 July 2019. The standard replaces AASB 117 “Leases” and for lessees eliminates the classifications of operating leases and finance leases. Except for short-term leases and leases for low-value assets, right-of-use assets and corresponding lease liabilities are recognised in the statement of financial position. Straight-line operating lease expense recognition is replaced with a depreciation charge for the right-of-use assets and an interest expense on the recognised lease liabilities. In the ealier periods of the lease, the expenses associated with the lease under AASB 16 will be higher when compared to lease expenses under AASB 117. However, EBITDA results improve as the operating expense is now replaced by interest expense and depreciation in profit or loss. For classification within the statement of cash flows, the interest portion is disclosed in operating activities and the standard does not substantially change how a lessor accounts for leases.
The accounting for operating lease will result in the recognition of a right-of-use (RoU) asset and an associated lease liability on the consolidated statement of financial position. The lease liability represents the present value of future lease payment. An interest expense will be recognised on the lease liabilities and a depreciation charge will be recognised for the RoU assets. F
or p
erso
nal u
se o
nly

ENERGY ACTION LIMITED ABN 90 137 363 636
P a g e | 33 Energy Action Limited ABN 90 137 363 636
FINANCIAL REPORT FOR THE FULL YEAR ENDED 30 JUNE 2020
Note 2: Summary of Significant Accounting Policies (Continued)
Energy Action has adopted AASB 16 on the 1 July 2019 and this has resulted in an initial increase in assets and liabilities of $992,365 (note 13(a)). During the period, the right-of-use asset was reduced by lease depreciation of $351,846 leaving a balance of $640,519 as at 30 June 2020.
As at 30 June 2020, the adoption of AASB 16 has the following impact on both the balance sheet and the financial result of the Group: • EBITDA improved by $370,215 due to lower rental expense • EBIT improved by $18,369 due to lease depreciation of $351,846 • Profit before tax has a negative impact of $32,503 due to lease interest expense • Net asset reduced by $32,503 (right-of-use asset lower than lease liability)
(ii) Accounting Standards and Interpretations issued but not yet effective
Australian Accounting Standards and Interpretations that have recently been issued or amended but are not yet effective and have not been adopted by the Group for the annual reporting period ending 30 June 2020 are outlined in the table below:
Standard/Interpretation Effective for the annual reporting period beginning on
Expected to be initially applied in the financial year ending
AASB 17 Insurance Contracts January 1, 2021 June 30, 2022 AASB 2018-6 Amendments to Australian Accounting Standards – Definition of a Business
January 1, 2020 June 30, 2021
AASB 2018-7 Amendments to Australian Accounting Standards – Definition of Material
January 1, 2020 June 30, 2021
AASB 2019-1 Amendments to Australian Accounting Standards – References to the Conceptual Framework
January 1, 2020 June 30,2021
AASB 2019-2 Amendments to Australian Accounting Standards – Implementation of AASB 1059
January 1, 2020 June 30,2021
AASB 2019-3 Amendments to Australian Accounting Standards – Interest Rate Benchmark Reform
January 1, 2020 June 30, 2021
AASB 2019-5 Amendments to Australian Accounting Standards – Disclosure of the Effect of New IFRS Standards not yet issued in Australia
January 1, 2020 June 30, 2021
These accounting standards do not expect to have material impact for Energy Action.
Going concern assessments and solvency
The Company expects to comply with going concern and solvency assessments given the Waiver of covenant testing as at 30 June 2020 and the outlook for operating EBITDA and operating cash.
There is no other material impact in relation to accounting standards and ASIC focus for Energy Action in FY20.
2.3 a.
Key Accounting Policies Principles of Consolidation
The consolidated financial statements are comprised of the financial statements of the Group and its subsidiaries as at 30 June 2020. Control is achieved when the Group is exposed, or has rights, to variable returns from its involvement with the investee and has the ability to affect those returns through its power over the investee.
For
per
sona
l use
onl
y

ENERGY ACTION LIMITED ABN 90 137 363 636
P a g e | 34 Energy Action Limited ABN 90 137 363 636
FINANCIAL REPORT FOR THE FULL YEAR ENDED 30 JUNE 2020
Note 2: Summary of Significant Accounting Policies (Continued)
Specifically, the Group controls an investee if and only if the Group has: Power over the investee (i.e. existing rights that give it the current ability to direct the relevant activities
of the investee) Exposure, or rights, to variable returns from its involvement with the investee, and The ability to use its power over the investee to affect its returns
Generally, there is a presumption that a majority of voting rights results in control. To support this presumption and when the Group has less than a majority of the voting or similar rights of an investee, the Group considers all relevant facts and circumstances in assessing whether it has power over an investee, including: The contractual arrangement(s) with the other vote holders of the investee Rights arising from other contractual arrangements
The Group’s voting rights and potential voting rights
The Group re-assesses whether or not it controls an investee if facts and circumstances indicate that there are changes to one or more of the three elements of control. Consolidation of a subsidiary begins when the Group obtains control over the subsidiary and ceases when the Group loses control of the subsidiary. Assets, liabilities, income and expenses of a subsidiary acquired or disposed of during the year are included in the consolidated statement of comprehensive income from the date the Group gains control until the date the Group ceases to control the subsidiary.
Profit or loss and each component of other comprehensive income (OCI) are attributed to the equity holders of the parent of the Group and to the non-controlling interests, even if this results in the non-controlling interests having a deficit balance. When necessary, adjustments are made to the financial statements of subsidiaries to bring their accounting policies into line with the Group’s accounting policies. All intra-group assets and liabilities, equity, income, expenses and cash flows relating to transactions between members of the Group are eliminated in full on consolidation.
A change in the ownership interest of a subsidiary, without a loss of control, is accounted for as an equity transaction. If the Group loses control over a subsidiary, it derecognises the related assets (including goodwill), liabilities, non-controlling interest and other components of equity, while any resultant gain or loss is recognised in profit or loss. Any investment retained is recognised at fair value.
b. Goodwill
Goodwill is initially measured at cost (being the excess of the aggregate of the consideration transferred and the amount recognised for non-controlling interests and any previous interest held over the net identifiable assets acquired and liabilities assumed). If the fair value of the net assets acquired is in excess of the aggregate consideration transferred, the Group re-assesses whether it has correctly identified all of the assets acquired and all of the liabilities assumed and reviews the procedures used to measure the amounts to be recognised at the acquisition date. If the reassessment still results in an excess of the fair value of net assets acquired over the aggregate consideration transferred, then the gain is recognised in profit or loss. After initial recognition, goodwill is measured at cost less any accumulated impairment losses. For the purpose of impairment testing, goodwill acquired in a business combination is, from the acquisition date, allocated to each of the Group’s cash-generating units that are expected to benefit from the combination, irrespective of whether other assets or liabilities of the acquiree are assigned to those units. Where goodwill has been allocated to a cash-generating unit (CGU) and part of the operation within that unit is disposed of, the goodwill associated with the disposed operation is included in the carrying amount of the operation when determining the gain or loss on disposal. Goodwill disposed in these circumstances is measured based on the relative values of the disposed operation and the portion of the cash-generating unit retained.
For
per
sona
l use
onl
y

ENERGY ACTION LIMITED ABN 90 137 363 636
P a g e | 35 Energy Action Limited ABN 90 137 363 636
FINANCIAL REPORT FOR THE FULL YEAR ENDED 30 JUNE 2020
Note 2: Summary of Significant Accounting Policies (Continued)
c. Income Tax and other taxes
Current income tax assets and liabilities are measured at the amount expected to be recovered from or paid to the taxation authorities. The tax rates and tax laws used to compute the amount are those that are enacted or substantively enacted at the reporting date in the countries where the Group operates and generates taxable income. Current income tax relating to items recognised directly in equity is recognised in equity and not in the statement of profit or loss. Management periodically evaluates positions taken in the tax returns with respect to situations in which applicable tax regulations are subject to interpretation and establishes provisions where appropriate.
Deferred tax is provided using the liability method on temporary differences between the tax bases of assets and liabilities and their carrying amounts for financial reporting purposes at the reporting date. Deferred tax liabilities are recognised for all taxable temporary differences, except: When the deferred tax liability arises from the initial recognition of goodwill or an asset or liability in a
transaction that is not a business combination and, at the time of the transaction, affects neither the accounting profit nor taxable profit or loss
In respect of taxable temporary differences associated with investments in subsidiaries, associates and interests in joint arrangements, when the timing of the reversal of the temporary differences can be controlled and it is probable that the temporary differences will not reverse in the foreseeable future
Deferred tax assets are recognised for all deductible temporary differences, the carry forward of unused tax credits and any unused tax losses. Deferred tax assets are recognised to the extent that it is probable that taxable profit will be available against which the deductible temporary differences, and the carry forward of unused tax credits and unused tax losses can be utilised, except: When the deferred tax asset relating to the deductible temporary difference arises from the initial
recognition of an asset or liability in a transaction that is not a business combination and, at the time of the transaction, affects neither the accounting profit nor taxable profit or loss
In respect of deductible temporary differences associated with investments in subsidiaries, associates and interests in joint arrangements, deferred tax assets are recognised only to the extent that it is probable that the temporary differences will reverse in the foreseeable future and taxable profit will be available against which the temporary differences can be utilised
The carrying amount of deferred tax assets is reviewed at each reporting date and reduced to the extent that it is no longer probable that sufficient taxable profit will be available to allow all or part of the deferred tax asset to be utilised. Unrecognised deferred tax assets are re-assessed at each reporting date and are recognised to the extent that it has become probable that future taxable profits will allow the deferred tax asset to be recovered. Deferred tax assets and liabilities are measured at the tax rates that are expected to apply in the year when the asset is realised or the liability is settled, based on tax rates (and tax laws) that have been enacted or substantively enacted at the reporting date. Deferred tax relating to items recognised outside profit or loss is recognised outside profit or loss. Deferred tax items are recognised in correlation to the underlying transaction either in OCI or directly in equity. Tax benefits acquired as part of a business combination, but not satisfying the criteria for separate recognition at that date, are recognised subsequently if new information about facts and circumstances change. The adjustment is either treated as a reduction in goodwill (as long as it does not exceed goodwill) if it reflects new information obtained about facts and circumstances that exist at the acquisition date that, if known, would have affected the amount recognised at that date where recognised during the measurement period or recognised in profit or loss.
For
per
sona
l use
onl
y
ENERGY ACTION LIMITED ABN 90 137 363 636
P a g e | 36 Energy Action Limited ABN 90 137 363 636
FINANCIAL REPORT FOR THE FULL YEAR ENDED 30 JUNE 2020
Note 2: Summary of Significant Accounting Policies (Continued)
The Group offsets deferred tax assets and deferred tax liabilities if and only if it has a legally enforceable right to set off current tax assets and current tax liabilities and the deferred tax assets and deferred tax liabilities relate to income taxes levied by the same taxation authority on either the same taxable entity or different taxable entities which intend either to settle current tax liabilities and assets on a net basis, or to realise the assets and settle the liabilities simultaneously, in each future period in which significant amounts of deferred tax liabilities or assets are expected to be settled or recovered.
Other taxes Revenues, expenses and assets are recognised net of the amount of GST except: When the GST incurred on a sale or purchase of assets or services in not payable to or recoverable from
the taxation authority, in which case the GST is recognised as part of the revenue or the expense item or as part of the cost of acquisition of the asset, as applicable
When receivables and payables are stated with the amount of GST included The net amount of GST recoverable from, or payable to, the taxation authority is included as part of receivables or payables in the statement of financial position. Commitments and contingencies are disclosed net of the amount of GST recoverable from, or payable to, the taxation authority. Cash flows are included in the statement of cash flows on a gross basis and the GST component of cash flows arising from investing and financing activities, which is recoverable from, or payable to, the taxation authority is classified as part of operating cash flows.
d. Plant and Equipment
Each class of plant and equipment is carried at cost or fair value as indicated less, where applicable, any accumulated depreciation and impairment losses.
Plant and equipment are measured on the cost basis and therefore carried at cost less accumulated depreciation and any accumulated impairment. In the event the carrying amount of plant and equipment is greater than the estimated recoverable amount, the carrying amount is written down immediately to the estimated recoverable amount and impairment losses are recognised either in profit or loss or as a revaluation decrease if the impairment losses relate to a re-valued asset.
The carrying amount of plant and equipment is reviewed annually by directors to ensure it is not in excess of the recoverable amount from these assets. The recoverable amount is assessed on the basis of the expected net cash flows that will be received from the asset’s employment and subsequent disposal. The expected net cash flows have been discounted to their present values in determining recoverable amounts.
Subsequent costs are included in the asset’s carrying amount or recognised as a separate asset, as appropriate, only when it is probable that future economic benefits associated with the item will flow to the Group and the cost of the item can be measured reliably. All other repairs and maintenance are charged to the statement of comprehensive income during the financial period in which they are incurred.
Depreciation
The depreciable amount of all fixed assets including buildings and capitalised lease assets, but excluding freehold land, is depreciated on a straight-line basis over the asset’s useful life to the consolidated group commencing from the time the asset is held ready for use. Leasehold improvements are depreciated over the shorter of either the unexpired period of the lease or the estimated useful lives of the improvements
The depreciation rates used for each class of depreciable assets are
Class of Fixed Asset Depreciation Rate
Computer equipment 25% - 33.3%
Furniture and fittings 20%
The assets’ residual values and useful lives are reviewed, and adjusted if appropriate, at the end of each reporting period.
For
per
sona
l use
onl
y

ENERGY ACTION LIMITED ABN 90 137 363 636
P a g e | 37 Energy Action Limited ABN 90 137 363 636
FINANCIAL REPORT FOR THE FULL YEAR ENDED 30 JUNE 2020
Note 2: Summary of Significant Accounting Policies (Continued) An asset’s carrying amount is written down immediately to its recoverable amount if the asset’s carrying amount is greater than its estimated recoverable amount. Gains and losses on disposals are determined by comparing proceeds with the carrying amount. These gains and losses are included in the statement of comprehensive income. When re-valued assets are sold, amounts included in the revaluation surplus relating to that asset are transferred to retained earnings.
e. Right-of-use assets
The right-of-use asset is recognised at the commencement date of a lease. The right-of-use asset is measured at cost, which comprises the initial amount of the lease liability, adjusted for, as appropriate, any lease payments made at or before the commencement date net of any lease incentives received, any initial direct costs incurred and except where included in the cost of inventories, an estimate of costs expected to be incurred for dismantling and removing the underlying asset and restoring the site or asset. Right-of-use assets are depreciated on a straight-line basis over the unexpired period of the lease or the estimated useful life of the asset, whichever is shorter. Where the consolidated entity expects to obtain ownership of the leased asset at the end of the lease term, the depreciation is over its estimated useful life. Right-of-use assets are subject to impairment or adjusted for any remeasurement of leased liabilities. The consolidated entity has elected not to recognised a right-of-use asset and corresponding lease liability for the short-term leases with terms of 12 months or less and leases of low-value assets. Lease payments on these assets are expensed to profit or loss as incurred.
f. Lease liabilities
A lease liability is recognised at the commencement date of a lease. The lease liability is initially recognised at the present value of the lease payments to be made over the term of the lease, discounted using the interest rate implicit in the lease or, if that rate cannot be readily determined, the consolidated entity’s incremental borrowing rate. Lease payments comprise of fixed payments less any lease incentives receivable, variable lease payments that depend on an index or a rate, amounts expected to be paid under residual value guarantees, exercise price of a purchase option when the exercise of the option is reasonably certain to occur, and any anticipated termination penalties. The variable lease payments that do not depend on an index or a rate are expensed in the period in which they are incurred. Lease liabilities are measured at amortised cost using the effective interest method. The carrying amounts are remeasured if there is a change in the following: future lease payments arising from a change in an index or a rate used; residual guarantee; lease term; certainty of a purchase option and termination penalties. When a lease liability is remeasured, an adjustment is made to the corresponding right-of-use asset, or to profit or loss if the carrying amount of the right-of-use asset is fully written down.
g. Current and non-current classification Assets and liabilities are presented in the statement of financial position based on current and non-current classification. An asset is classified as current when: it is either expected to be realised or intended to be sold or consumed in the consolidated entity’s normal operating cycle; it is held primarily for the purpose of trading. It is expected to be realised within 12 months after the reporting period or the asset is cash or cash equivalent unless restricted from being exchanged or used to settle a liability for at least 12 months after the reporting period. All other assets are classified as non-current. A liability is classified as current when: it is either expected to be settled in the consolidated entity’s normal operating cycle; it is held primarily for the purpose of trading; it is due to be settled within 12 months after the reporting period; or there is no unconditional right to defer the settlement of the liability for at least 12 months after the reporting period. All other liabilities are classified as non-current. Deferred tax assets and liabilities are always classified as non-current
For
per
sona
l use
onl
y

ENERGY ACTION LIMITED ABN 90 137 363 636
P a g e | 38 Energy Action Limited ABN 90 137 363 636
FINANCIAL REPORT FOR THE FULL YEAR ENDED 30 JUNE 2020
h.
Note 2: Summary of Significant Accounting Policies (Continued) Financial Instruments Financial assets – initial recognition and subsequent measurement Financial assets are classified, at initial recognition, as subsequently measured at amortised cost, fair value through other comprehensive income (OCI), and fair value through profit or loss. The Group recognises an allowance for expected credit losses (ECLs) for all receivables and contract assets. ECLs are recognised in two stages. For credit exposures for which there has not been a significant increase in credit risk since initial recognition, ECLs are provided for credit losses that result from default events that are possible within the next 12-months (a 12-month ECL). For those credit exposures for which there has been a significant increase in credit risk since initial recognition, a loss allowance is required for credit losses expected over the remaining life of the exposure, irrespective of the timing of the default (a lifetime ECL).
For trade receivables and contract assets, the Group applies a simplified approach in calculating ECLs. Therefore, the Group does not track changes in credit risk, but instead recognises a loss allowance based on lifetime ECLs at each reporting date. The Group has established a provision matrix that is based on its historical credit loss experience, the impact of the Coronavirus (COVID-19) pandemic and adjusted for forward-looking factors specific to the debtors and the economic environment.
The Group adopted AASB 9 effectively moves from an “incurred losses” model to an “expected losses” model, which requires a forward-looking assessment of potential default events and losses over the life of these assets. The Group’s trade receivables do not contain a significant financing component, lifetime expected credit losses can be recognised right on initial recognition. The Group elected to use the simplification method hence a provision matrix can be used.
The Group’s trade and other receivables are exposed to credit risk with ageing analysis and impairment provided for thereon. Amounts are considered as “past due” when the debt has not been settled, with the terms and conditions agreed between the Group and the customer or counterparty to the transaction. Receivables that are past due are assessed for impairment by ascertaining solvency of the debtors and are provided for where there are specific circumstances indicating that the debt may not be fully repaid to the Group.
Financial Liabilities - Loans and borrowings This is the category most relevant to the Group. After initial recognition, interest-bearing loans and borrowings are subsequently measured at amortised cost using the Effective Interest Rate method. Gains and losses are recognised in profit or loss when the liabilities are derecognised as well as through the EIR amortisation process. Amortised cost is calculated by taking into account any discount or premium on acquisition and fees or costs that are an integral part of the EIR. The EIR amortisation is included as finance costs in the statement of profit or loss.
i.
Impairment of Non-financial Assets The Group assesses at each reporting date whether there is an indication that an asset may be impaired. If any indication exists, or when annual impairment testing for an asset is required, the Group estimates the asset’s recoverable amount. An asset’s recoverable amount is the higher of an asset’s or cash-generating unit’s (CGU) fair value less costs of disposal and its value in use. The recoverable amount is determined for an individual asset, unless the asset does not generate cash inflows that are largely independent of those from other assets or groups of assets. When the carrying amount of an asset or CGU exceeds its recoverable amount, the asset is considered impaired and is written down to its recoverable amount.
In assessing value in use, the estimated future cash flows are discounted to their present value using a pre-tax discount rate that reflects current market assessments of the time value of money and the risks specific to the asset. In determining fair value less costs of disposal, recent market transactions are taken into account. If no such transactions can be identified, an appropriate valuation model is used. These calculations are corroborated by valuation multiples, quoted share prices for publicly traded subsidiaries or other available fair value indicators.
For
per
sona
l use
onl
y

ENERGY ACTION LIMITED ABN 90 137 363 636
P a g e | 39 Energy Action Limited ABN 90 137 363 636
FINANCIAL REPORT FOR THE FULL YEAR ENDED 30 JUNE 2020
Note 2: Summary of Significant Accounting Policies (Continued)
The Group bases its impairment calculation on detailed budgets and forecast calculations, which are prepared separately for each of the Group’s CGUs to which the individual assets are allocated. These budgets and forecast calculations generally cover a period of five years. Long-term growth rate is calculated and applied to project future cash flows after the fifth year.
Impairment losses of continuing operations are recognised in the statement of profit or loss in expense categories consistent with the function of the impaired asset, except for properties previously revalued with the revaluation taken to Other Comprehensive Income (OCI). For such properties, the impairment is recognised in OCI up to the amount of any previous revaluation.
For assets excluding goodwill and intangibles with indefinite useful life, an assessment is made at each reporting date to determine whether there is an indication that previously recognised impairment losses may no longer exist or may have decreased. If such indication exists, the Group estimates the assets or CGUs recoverable amount.
A previously recognised impairment loss is reversed only if there has been a change in the assumptions used to determine the asset’s recoverable amount since the last impairment loss was recognised. The reversal is limited so that the carrying amount of the asset does not exceed its recoverable amount, nor exceed the carrying amount that would have been determined, net of depreciation, had no impairment loss been recognised for the asset in prior years. Such reversal is recognised in the statement of profit or loss unless the asset is carried at a revalued amount, in which case, the reversal is treated as a revaluation increase.
The following assets have specific characteristics for impairment testing:
Goodwill Goodwill is tested for impairment annually (as at 30 June) and when circumstances indicate that the carrying value may be impaired. Impairment is determined for goodwill by assessing the recoverable amount of each CGU (or group of CGUs) to which the goodwill relates. When the recoverable amount of the CGU is less than its carrying amount, an impairment loss is recognised. Impairment losses relating to goodwill cannot be reversed in future periods.
Intangible assets Intangible assets with indefinite useful lives are tested for impairment annually as at 30 June at the CGU level, as appropriate, and when circumstances indicate that the carrying value may be impaired. Intangible assets with finite lives are amortised over the useful life and assessed for impairment whenever there is an indication that the intangible asset may be impaired. The amortisation period and the amortisation method for any intangible asset with a finite useful life is reviewed at least at each financial year end. Changes in the expected useful life or the expected pattern of consumption of future economic benefits embodied in the asset are accounted for by changing the amortisation period or method, as appropriate, which is a change in accounting estimate. The amortisation expense on intangible assets with finite lives is recognised in the Statement of Comprehensive Income in the expense category consistent with the function of the intangible asset.
For
per
sona
l use
onl
y

ENERGY ACTION LIMITED ABN 90 137 363 636
P a g e | 40 Energy Action Limited ABN 90 137 363 636
FINANCIAL REPORT FOR THE FULL YEAR ENDED 30 JUNE 2020
j.
Note 2: Summary of Significant Accounting Policies (Continued) Intangible assets other than Goodwill
Software, research and development costs Research costs are expensed as incurred. Development expenditures including website development costs on an individual project are recognised as an intangible asset when the Group can demonstrate:
The technical feasibility of completing the intangible asset so that it will be available for use or sale Its intention to complete and its ability to use or sell the asset How the asset will generate future economic benefits The availability of resources to complete the asset The ability to measure reliably the expenditure during development
Following initial recognition of the development expenditure as an asset, the asset is carried at cost less any accumulated impairment losses. Amortisation of the asset begins when development is complete and the asset is available for use. It is amortised over the period of expected future benefit. Amortisation is expensed through the profit and loss. During the period of development, the asset is tested for impairment annually.
The useful life of development costs is finite. It is amortised on a straight-line basis over its expected useful life. The development costs are internally developed. The amortisation rates are as follows: Software development costs 20%
Customer relationships
The useful life of customer relationships is finite. It is amortised on a straight-line basis over its expected useful life, which is between six and twelve years.
k. Employee Benefits
Provision is made for the Group’s liability for employee benefits arising from services rendered by employees to the end of the reporting period. Employee benefits that are expected to be settled within one year have been measured at the amounts expected to be paid when the liability is settled. Employee benefits payable later than one year have been measured at the present value of the estimated future cash outflows to be made for those benefits. In determining the liability, consideration is given to employee wages increases and the probability that the employee may satisfy vesting requirements. Those cash flows are discounted using market yields on high quality corporate bonds with terms to maturity that match the expected timing of cash flows.
l. Provisions
Provisions are recognised when the Group has a legal or constructive obligation, as a result of past events, for which it is probable that an outflow of economic benefits will result, and that outflow can be reliably measured. When the Group expects some or all of a provision to be reimbursed, for example, under an insurance contract, the reimbursement is recognised as a separate asset, but only when the reimbursement is virtually certain. The expense relating to any provision is present in the income statement net of any reimbursement. Provisions are measured using the best estimate of the amounts required to settle the obligation at the end of the reporting period.
For
per
sona
l use
onl
y

ENERGY ACTION LIMITED ABN 90 137 363 636
P a g e | 41 Energy Action Limited ABN 90 137 363 636
FINANCIAL REPORT FOR THE FULL YEAR ENDED 30 JUNE 2020
Note 2: Summary of Significant Accounting Policies (Continued) Onerous contracts An onerous contract is considered to exist where the company has a contract under which the unavoidable cost of meeting the contractual obligations exceed the economic benefits estimated to be received. Present obligations arising under onerous contracts are recognised as a provision to the extent that the present obligation exceeds the economic benefits estimated to be received. Restructuring A restructuring provision is recognised when the Group has developed a detailed formal plan for the restructuring and has raised a valid expectation in those affected that it will carry out the restructuring by starting to implement the plan or announcing its main features to those affected by it. Future operating losses are not provided for.
m. Cash and Cash Equivalents
Cash and cash equivalents include cash on hand, deposits available on demand with banks, other short-term highly liquid investments with original maturities of three months or less, and bank overdrafts. Bank overdrafts are reported within short-term borrowings in current liabilities in the statement of financial position.
n. Revenue and Other Income
The Group is in the business of providing Procurement services, Managed services, Retail services and other services (Major Product Lines) predominately in Australia. Revenue from contracts with customers is recognised when controls of the services are transferred to the customer at an amount that reflects the consideration to which the Group expects to be entitled in exchange for those services. Revenue from Auction and Commission based tenders are recognised upfront once the Auction is complete and contracts signed between the retailer and the customer. The commercial and payment terms of the contract term remain unchanged with payments being received over the life of the contract. Accordingly, a contract asset called “Revenue not invoiced” has been created to recognise the difference between revenue recognised and the amount invoiced.
Auction contracts provide a customer with a right to cancel during the contract period. The Group estimates cancellation of Auction revenue during the contract period of approximately 6.7% based on the last 2 years of history. Accordingly it was assessed that 6.7% of the total values of contracts entered into should be provided for on the balance sheet as a provision for cancellations on an ongoing basis. This has the effect of reducing revenue and providing for the risk of cancellation, for the period between recognising revenue and invoicing the retailer.
Other Procurement and Managed services revenue, Retail services revenue are recognised in the accounting period in which services are rendered and/or in accordance with the percentage of completion of the project. (Revenue is transferred over time)
The sales commission paid to sales representatives and external agent will be expensed up front in line with the revenue also being recognised upfront.
o. Foreign Currency Transaction
The Group’s consolidated financial statements are presented in Australian dollars, which is also the Parent’s functional currency. For each entity the Group determines the functional currency and items included in the financial statements of each entity are measured using that functional currency. The Group uses the direct method of consolidation and has elected to recycle the gain or loss that arises from using this method.
i) Transactions and balances Transactions in foreign currencies are initially recorded by the Group’s entities at their respective functional currency spot rates at the date the transaction first qualifies for recognition.
For
per
sona
l use
onl
y

ENERGY ACTION LIMITED ABN 90 137 363 636
P a g e | 42 Energy Action Limited ABN 90 137 363 636
FINANCIAL REPORT FOR THE FULL YEAR ENDED 30 JUNE 2020
Note 2: Summary of Significant Accounting Policies (Continued)
Monetary assets and liabilities denominated in foreign currencies are translated at the functional currency spot rates of exchange at the reporting date. Differences arising on settlement or translation of monetary items are recognised in profit or loss with the exception of monetary items that are designated as part of the hedge of the Group’s net investment of a foreign operation. These are recognised in other comprehensive income until the net investment is disposed of, at which time, the cumulative amount is reclassified to profit or loss. Tax charges and credits attributable to exchange differences on those monetary items are also recorded in other comprehensive income.
Non-monetary items that are measured in terms of historical cost in a foreign currency are translated using the exchange rates at the dates of the initial transactions. Non-monetary items measured at fair value in a foreign currency are translated using the exchange rates at the date when the fair value is determined. The gain or loss arising on translation of non-monetary items measured at fair value is treated in line with the recognition of gain or loss on change in fair value of the item (i.e., translation differences on items whose fair value gain or loss is recognised in other comprehensive income or profit or loss are also recognised in other comprehensive income or profit or loss, respectively).
In determining the spot exchange rate to use on initial recognition of the related asset, expense or income (or part of it) on the derecognition of a non-monetary asset or non-monetary liability relating to advance consideration, the date of the transaction is the date on which the Group initially recognises the non-monetary asset or non-monetary liability arising from the advance consideration. If there are multiple payments or receipts in advance, the Group determines the transaction date for each payment or receipt of advance consideration.
Any goodwill arising on the acquisition of a foreign operation and any fair value adjustments to the carrying amounts of assets and liabilities arising on the acquisition are treated as assets and liabilities of the foreign operation and translated at the spot rate of exchange at the reporting date
ii) Group companies On consolidation, the assets and liabilities of foreign operations are translated into dollars at the rate of exchange prevailing at the reporting date and their statements of profit or loss are translated at exchange rates prevailing at the dates of the transactions. The exchange differences arising on translation for consolidation are recognised in other comprehensive income. On disposal of a foreign operation, the component of other comprehensive income relating to that particular foreign operation is recognised in profit or loss.
p.
Work-in-progress When the outcome of a contract can be estimated reliably, contract revenue and contract costs are recognised as revenue and expenses respectively by reference to the stage of completion of the contract activity at the balance sheet date. When the outcome of a contract cannot be estimated reliably, contract revenue is recognised to the extent of contract costs incurred that are likely to be recoverable. When it is probable that total contract costs will exceed total contract revenue, the expected loss is recognised as an expense immediately.
At the end of each accounting period the long-term contracts percentage completion is assessed individually, and any unbilled percentage completion is recognised as work in progress income for the period.
For
per
sona
l use
onl
y

ENERGY ACTION LIMITED ABN 90 137 363 636
P a g e | 43 Energy Action Limited ABN 90 137 363 636
FINANCIAL REPORT FOR THE FULL YEAR ENDED 30 JUNE 2020
q.
Note 2: Summary of Significant Accounting Policies (Continued)
Share based payments
The Group provides benefits to employees in the form of equity settled share-based payments, whereby employees render services in exchange for shares or rights over shares. The fair value of rights granted to eligible employees under the Energy Action Performance Rights & Options Plan (PROP) is recognised as an employee benefits expense, with a corresponding increase in the employee equity benefits reserve. The fair value is measured at grant date and recognised over the period in which the employee becomes entitled to the PROP grant. The fair value at grant date is determined by an independent valuer. Details of the fair value of share-based payment plans are set out in Note 18 (c).
At the end of each reporting period, the Group revises its estimate of the numbers of rights expected to vest. The amount recognised as an expense is only adjusted when the rights do no vest due to non-market related conditions.
r. Interest Rate Hedging
The Group uses derivative financial instruments, such as interest rate swaps to hedge its interest rate risks. Such derivative financial instruments are initially recognised at fair value on the date on which a derivative contract is entered into and are subsequently remeasured at fair value. Derivatives are carried as financial assets when the fair value is positive and as financial liabilities when the fair value is negative.
At the inception of the hedge relationship, the Group formally designates and documents the hedge relationship to which it wishes to apply hedge accounting and the risk management objective and strategy for undertaking the hedge. The documentation includes identification of the hedging instrument, the hedge item, the nature of the risk being hedged and how the entity will assess the effectiveness of changes in the hedging instrument’s fair value in offsetting the exposure to changes in the hedged item’s fair value or cash flows attributable to the hedged risk.
At the end of each reporting period, the Group assesses the hedge effectiveness between hedged item and hedging instrument to determine whether the risk management objective for the hedging relationship has changed.
The estimates and assumptions are reviewed on an ongoing basis. Revisions to accounting estimates are recognised in the period in which the estimate is revised if the revision affects only that period, or in the period of the revision and future periods if the revision affects both current and future periods.
s. Issued Capital
Ordinary shares are classified as equity.
Incremental costs directly attributable to the issue of new shares or options are shown in equity as a deduction, net of tax, from the proceeds.
t. Dividends
Dividends are recognised when declared during the financial year and no longer at the discretion of the company.
u. Goods and Services Tax (GST)
Revenues, expenses and assets are recognised net of the amount of associated GST, unless the GST incurred is not recoverable from the tax authority. In this case it is recognised as part of the cost of the acquisition of the asset or as part of the expense.
Receivables and payables are stated inclusive of the amount of GST receivable or payable. The net amount of GST recoverable from, or payable to, the tax authority is included in other receivables or other payables in the statement of financial position.
Cashflows are presented on a gross basis. The GST components of cash flow arising from investing or financing activities which are recoverable from, or payable to the tax authority, are presented as operating cash flows.
For
per
sona
l use
onl
y

ENERGY ACTION LIMITED ABN 90 137 363 636
P a g e | 44 Energy Action Limited ABN 90 137 363 636
FINANCIAL REPORT FOR THE FULL YEAR ENDED 30 JUNE 2020
Note 2: Summary of Significant Accounting Policies (Continued)
Commitments and contingencies are disclosed net of the amount of GST recoverable from, or payable to, the tax authority.
Note 3: Significant Accounting Judgements, Estimates and Assumptions
Impairment of goodwill and other intangible assets
The Group assesses impairment at the end of each reporting period by evaluating conditions and events specific to the Group that may be indicative of impairment triggers. Recoverable amounts of relevant assets are reassessed using value-in-use calculations which incorporate various key assumptions.
Share-based payment transactions
The Group measures the cost of equity-settled transactions with suppliers with reference to the fair value of the equity instruments at the date at which they are granted. Estimating fair value for share-based payment transactions requires determining the most appropriate valuation model, which is dependent on the terms and conditions of the grant. This estimate also requires determining the most appropriate inputs to the valuation model including the expected life of the share option, volatility and dividend yield and making assumptions about them. The assumptions and models used for estimating fair value for share-based payment transactions are disclosed in Note 18 (c).
Development costs
Development costs are capitalised in accordance with the accounting policy in Note 2(i). Initial capitalisation of costs is based on management’s judgement that technological and economic feasibility is confirmed, usually when a product development project has reached a defined milestone according to an established project management model. In determining the amounts to be capitalised, management makes assumptions regarding the expected future cash generation of the project, discount rates to be applied and the expected period of benefits. This includes significant investments in the development of software. The software is being enhanced and /or developed for use within the business, improving operational efficiency.
Onerous Contracts
Energy Action’s policy for onerous contracts is stated in Note 2(i). The application of this policy requires management to make certain estimates and assumptions as to future events and circumstances in relation to costs to meet contractual obligations.
Employee benefits
Employee benefits are predominantly annual leave and long service leave. In determining these provisions, management makes assumptions in regard to future wage increases, and the probability that employees may satisfy vesting requirements for long service leave.
Work in progress
Energy Action performs services under contracts that last longer than one reporting period. For these contracts, revenue and costs are recognised on a percentage of completion basis. Percentage of completion by project is estimated by the project relevant project manager based on their assessment of completion versus milestones.
Revenue not invoiced and Provision for Cancellation
The Group adopted the full retrospective approach to implement AASB 15 Revenue from Contracts with Customers from 1 July 2018. The revenue is recognised upfront once the auction is complete and contracts signed between the retailer and the customer. An asset “Revenue not invoice” has been created to recognise the difference between revenue recognised and the amount invoiced. The total value of contracts entered into historically experienced cancellation of auction revenue during the contract period. A provision for cancellations of 7.3% has been provided at adoption to reduce the risk of cancellation. The assessment of historical cancellations is reviewed at each reporting period and revised accordingly. As at 30 June 2020, a provision of 6.7% of the total value of revenue not invoiced has been calculated based on historical cancellation over the past 24 months.
For
per
sona
l use
onl
y

ENERGY ACTION LIMITED ABN 90 137 363 636
P a g e | 45 Energy Action Limited ABN 90 137 363 636
FINANCIAL REPORT FOR THE FULL YEAR ENDED 30 JUNE 2020
Note 4: Segment information
Identification of reportable segments
The Group has identified one reportable operating segment, which provides electricity and gas procurement services, managed services, and retail billing services in Australia. The types of services provided are detailed below.
Types of Services
Energy Action’s principal activities are providing integrated energy management services to a diverse base of Commercial, Industrial and small and medium sized business customers. The business has previously reported business units comprising Procurement, Contract Mgt and Environmental Reporting and PAS (or Advisory). Due to the repositioning of Advisory and the growth of Retail Services the business line reporting has been aligned to the following services:
Procurement - Broking or Consulting using a range of procurement methodologies including auctions (via the Australian Energy Exchange), tenders (small and large market), progressive and structured purchasing, corporate power purchase agreements, and broking of Solar and Energy projects;
Managed Services - Managed client energy contracts and environmental reporting, including account management, liaison with their retailer, validating their bill, ensuring the right tariff and helping them to understand how they are using energy;
Retail Services – Support for retailers and embedded network operators with retail billing, management and reporting.
Other - in the past 2 years, Energy Action has repositioned away from building monitoring, audits and energy efficiency initiatives, building ratings and energy generation or efficiency projects including solar.
The Australian Energy Exchange (AEX) electricity and gas procurement service is an online, real time and reverse auction platform for business customers which provides the opportunity to competitively obtain energy supply contracts from various energy providers.
Energy Metrics is an independent Manager Services platform which transforms energy data into usable business intelligence that is easy to understand and essential for improving overall business efficiency.
The types of Managed Services include energy consumption monitoring and costing, energy emissions monitoring, contract administration, detailed technical reporting, desktop energy efficiency review and additional reporting and monitoring.
Retail Services included both embedded networks and retailer onboarding, meter reading, billing, standing data management, receivables management and performance reporting. In addition, Energy Action provides consultancy and onboarding services for Embedded Network operators.
In the past 2 years, Energy Action has repositioned from building monitoring, audits and energy efficiency initiatives, building ratings and energy generation or efficiency projects including solar. The Group has completed or novated the majority of the current order book related to these activities as at 30 June 2020 with minor delivery remaining in FY21.
In Note 5 revenue is analysed by service line, however over all the performance of the business is monitored as one.
Accounting Policies and inter-segment transaction
The accounting policies used by the Group in the reporting segment internally are the same as those contained in Note 2 to the accounts.
Revenue by customer
There is no revenue with a single external customer that contributes more than 10% of total revenue.
For
per
sona
l use
onl
y

ENERGY ACTION LIMITED ABN 90 137 363 636
P a g e | 46 Energy Action Limited ABN 90 137 363 636
FINANCIAL REPORT FOR THE FULL YEAR ENDED 30 JUNE 2020
Note 5: Revenue, Other Income and Expenses
Year-ended
30-Jun-20 Procurement Managed Service Retail
services Others Total
$ $ $ $ $
Revenue from Contract with Customer
6,544,171 11,012,682 1,339,394 885,482 19,781,729
6,544,171 11,012,682 1,339,394 885,482 19,781,729
Year-ended 30-Jun-19 Procurement Managed
Service Retail
services Others Total
$ $ $ $ $
Revenue from Contract with Customer
6,541,214 13,822,328 889,173 3,548,385 24,801,100
6,541,214 13,822,328 889,173 3,548,385 24,801,100
5.1 Consolidated Group
Timing of Revenue Recognition 2020 2019
$ $
Services transferred at a point in time 5,034,539 5,129,626 Services transferred over time 14,747,190 19,671,474 Total Revenue from contracts with customers 19,781,729 24,801,100
All material revenues are generated in Australia.
For
per
sona
l use
onl
y

ENERGY ACTION LIMITED ABN 90 137 363 636
P a g e | 47 Energy Action Limited ABN 90 137 363 636
FINANCIAL REPORT FOR THE FULL YEAR ENDED 30 JUNE 2020
Note 5: Revenue, Other Income and Expenses (continued) Note Consolidated Group
2020 2019 $ $
5.2 Employee benefits Salaries 9,192,017 10,501,458 Commissions 460,656 223,376 Superannuation 954,276 1,098,749 Share based payment expenses (3,001) (93,759) Other 792,359 971,765 Government assistance (838,260) -
Total Employment benefits 10,558,047 12,701,589
5.3
Administrative costs Accounting, audit and tax fees 202,062 225,049 Advertising 286,334 253,496 Legal and professional fees 87,378 125,606 Telephone and internet 90,146 99,677 Computer maintenance costs 2,081,979 1,992,418 Bad debt expense 22,005 (12,302) Recruitment Costs 91,917 118,579 Insurance Costs 166,366 164,343 Subscription 138,622 127,709 Entertainment & sustenance costs 84,307 149,326 FBT expense 107,400 155,878 Consulting 152,589 242,013 Other expenses 640,083 789,814
Total Administrative costs 4,151,188 4,431,606
5.4 Depreciation and amortisation Depreciation 156,824 238,409 Lease depreciation 351,846 - Amortisation - Software 861,285 676,232 Total Depreciation & Amortisation 1,369,955 914,641
5.5
Accelerated Depreciation and amortization and write down Accelerated Amortisation - Customer relationships - 1,167,090 Accelerated Amortisation - Software 204,722 496,671 Accelerated Depreciation - Furniture and Fitting - 63,628
Total Depreciation & Amortisation 204,722 1,727,389
5.6 Financing costs / (income) Interest income (4,611) (6,960) Interest expenses 276,187 372,192 Borrowing costs 68,199 109,321
Total Financing costs / (income) 339,773 474,553
For
per
sona
l use
onl
y

ENERGY ACTION LIMITED ABN 90 137 363 636
P a g e | 48 Energy Action Limited ABN 90 137 363 636
FINANCIAL REPORT FOR THE FULL YEAR ENDED 30 JUNE 2020
Note 6: Income Tax Expense
Note Consolidated Group
2020 2019
$ $
a. The components of tax expense comprise:
Current tax 16,416 115,183
Current tax – under/(over) prior year 18,256 (7,224)
Tax rate change 4,961 (169,010) Deferred tax 15 (959,095) (990,967)
(919,462) (1,052,018)
b. The prima facie tax on profit from ordinary activities before income tax is reconciled to the income tax as follows:
Prima facie tax (benefit) / payable on profit / (loss) from ordinary activities before income tax at 27.5% (2019: 27.5%)
(936,710)
(3,614,849)
Add Tax effect of: Permanent Differences — Tax rate change 4,961 (169,010) — Share based payments/trust 123 (12,128)
— Goodwill impairment - 2,734,819 — Other permanent differences 11,353 16,374
— DTA Not Recognised / Recognised 993 0 — Prior year adjustments (182) (7,224) Less Tax effect of: Deductible Expense — Unbooked tax losses - - Income tax attributable to entity (919,462) (1,052,018)
The applicable weighted average effective tax rates are as follows:
27.00% 8.00%
Energy Action Limited and its 100% owned subsidiaries formed a tax consolidated group with effect from 3 March 2009. Energy Action Limited is the head entity of the tax consolidated group.
For
per
sona
l use
onl
y

ENERGY ACTION LIMITED ABN 90 137 363 636
P a g e | 49 Energy Action Limited ABN 90 137 363 636
FINANCIAL REPORT FOR THE FULL YEAR ENDED 30 JUNE 2020
Note 7: Earnings per Share
Basic earnings per share amounts are calculated by dividing net profit for the year attributable to ordinary equity holders of the parent by the weighted average number of ordinary shares outstanding during the year. Diluted earnings per share amounts are calculated by dividing the net profit attributable to ordinary equity holders of the parent (after adjusting for interest on the convertible preference shares) by the weighted average number of ordinary shares outstanding during the year plus the weighted average number of ordinary shares that would be issued on conversion of all dilutive potential ordinary shares into ordinary shares. The following reflects the income and share data used in the basic diluted earnings per share computations:
2020
2019
$ $ Net profit / (loss) attributable to ordinary equity holders of the parent from continuing operations (2,486,756) (12,092,885)
Net profit / (loss) attributable to ordinary equity holders of the parent for basic earnings (2,486,756) (12,092,885)
Net profit / (loss) attributable to ordinary equity holders of the parent adjusted for the effect of dilutions (2,486,756) (12,092,885)
2020 No.
2019 No.
Weighted average number of ordinary shares for basic earnings per share 25,954,117 25,954,117
Effect of dilution:
Performance rights - -
Weighted average number of ordinary shares adjusted for the effect of dilution 25,954,117 25,954,117
Basic earnings / (loss) per share (Statutory) (9.58) (46.59)
Diluted Earnings / (loss) per share (Statutory) (9.58) (46.59)
There have been no other transactions involving ordinary shares or potential ordinary shares between the reporting date and the date of completion of these financial statements. Under the accounting standards, losses are not diluted. Refer also to the Directors’ Report for further information on the calculation of Operating Profit.
For
per
sona
l use
onl
y

ENERGY ACTION LIMITED ABN 90 137 363 636
P a g e | 50 Energy Action Limited ABN 90 137 363 636
FINANCIAL REPORT FOR THE FULL YEAR ENDED 30 JUNE 2020
Note 8: Dividends Consolidated Group
Note 2020 $
2019 $
Dividends paid:
Interim 2020 franked dividend of NIL cents per share - -
Final 2019 franked dividend of NIL cents per share - -
Final 2018 franked dividend of 4.00 cents per share - 1,038,165
- 1,038,165
a. Proposed final 2020 franked dividend of NIL cents per share - -
b.
(Final 2019 franked dividend of NIL cents per share) Balance of franking account at year end adjusted for franking credits arising from:
— Opening balance 7,553,936 7,829,912
— Opening balance adjustment - -
— Payment/(Refund) of provision for income tax (18,518) 168,952
— Dividends recognised as receivables and franking debits arising from payment of proposed dividends, and franking credits that may be prevented from distribution in subsequent financial years - (444,928)
7,535,418 7,553,936
Subsequent to year end, the franking account would be reduced by the proposed dividend reflected per (a) as follows:
- -
7,535,418 7,553,936
Tax rates
From 1 July 2018 the tax rate at which paid dividends have been franked is 27.5% (2019: 27.5%), prior to this, dividends were franked at 30.0%. Dividends proposed will be franked at the rate of 26% from 1 July 2020 (2020: 27.5%).
For
per
sona
l use
onl
y

ENERGY ACTION LIMITED ABN 90 137 363 636
P a g e | 51 Energy Action Limited ABN 90 137 363 636
FINANCIAL REPORT FOR THE FULL YEAR ENDED 30 JUNE 2020
Note 9: Cash and Cash Equivalents
Consolidated Group
Note
2020 2019
$ $
Cash at bank* 3,181,876 1,579,429
Restricted cash** 14,022 29,086
Total Cash 22 3,195,898 1,608,515
*Cash at bank earns interest at floating rates based on daily bank deposit rates. Short-term deposits are made for varying periods of between one day and three months, depending on the immediate cash requirements of the Group, and earn interest at the respective short-term deposit rates.
**Refers to cash held in the Energy Action Employee Share Trust; an entity used to manage employee equity plans as well as cash bank guarantee held by the bank.
Note 10: Trade and Other Receivables
Consolidated Group
Note
2020 2019
$ $
CURRENT
Trade receivables 2,701,714 3,767,945
Provision for expected credit loss (299,298) (272,062)
Total current trade receivables 22 2,402,416 3,495,883
NON-CURRENT
Bonds and security deposits 22 81,948 86,043
a. Provision for Impairment of Receivables
Current trade and term receivables are non-interest bearing and generally on 30 to 90-day terms. Credit risk The Group has no significant concentration of credit risk with respect to any single counterparty or group of counterparties other than those receivables specifically provided for and mentioned within Note 10. The class of assets described as “trade and other receivables” is considered to be the main source of credit risk related to the Group. The following table details the Group’s trade and other receivables exposed to credit risk (prior to collateral and other credit enhancements) with ageing analysis and impairment provided for thereon. Amounts are considered as “past due” when the debt has not been settled, with the terms and conditions agreed between the Group and the customer or counterparty to the transaction. The Group policy stipulates that the receivable accounts with an administrator appointed or in liquidation or with 90 days+ outstanding – fully (100%) provided for except where a reasonable estimate can be made of the recoverable amount. Accounts assigned to a debt collector – 50% provided. Direct customers – expected credit loss (ECL) model based on risk associated with different ageing bucket. Retailers and Metering companies – no provision required; historical evidence shows immaterial write-off of debt. Partially due to the pre-approval process for many of the retailers which results in the amounts validated prior to invoicing. Disputed amounts owing which are in the process of litigation will be provided for on a case by case basis depending on the probability of recovery. ECL rates are applied to gross receivable balances after adjusting for any specific bad debts.
For
per
sona
l use
onl
y

ENERGY ACTION LIMITED ABN 90 137 363 636
P a g e | 52 Energy Action Limited ABN 90 137 363 636
FINANCIAL REPORT FOR THE FULL YEAR ENDED 30 JUNE 2020
Note 10: Trade and Other Receivables (Continued)
Past due but not impaired (days overdue)
Within
Total Trade Terms < 30 31–60 61–90 91+
$ $ $ $ $ $
2020
Trade and term receivables 2,701,714 2,032,343 127,530 65,279 46,382 430,180
Expected credit loss allowance 299,298 38,500 842 3,801 13,741 242,414 2,402,416 1,993,843 126,688 61,478 32,641 187,766
2019
Trade and term receivables 3,767,945 2,385,864 675,104 145,667 193,676 367,634 Expected credit loss allowance 272,062 - 4,370 11,199 9,395 247,098
3,495,883 2,385,864 670,734 134,468 184,281 120,536 Neither the Group nor parent entity holds any financial assets with terms that have been renegotiated, which would otherwise be past due or impaired. Revenue not invoiced is shown as net of provision for cancellation in Note 13. b. Collateral Held as Security
Current trade and term receivables are non-interest bearing and generally on 30 to 90-day terms. No collateral or security is held by the company for loans or receivables.
For
per
sona
l use
onl
y

ENERGY ACTION LIMITED ABN 90 137 363 636
P a g e | 53 Energy Action Limited ABN 90 137 363 636
FINANCIAL REPORT FOR THE FULL YEAR ENDED 30 JUNE 2020
Note 11: Property Plant and Equipment
Note Consolidated Group
2020 2019
$ $
Computer equipment:
At cost 2,060,913 2,026,141
Accumulated depreciation (1,976,440) (1,879,857) 84,473 146,284
Furniture and fittings:
At cost 1,424,826 1,422,999
Accumulated depreciation (1,372,242) (1,312,000) 52,584 110,999
Total Plant and Equipment 137,057 257,283
a. Movements in Carrying Amounts Movement in the carrying amounts for each class of property, plant and equipment between the beginning and the end of the current financial year
Note Computer Equipment
Furniture and Fittings Total
$ $ $
Consolidated Group:
Balance at 1 July 2018 217,302 312,588 529,890
Additions 65,272 57,488 122,760
Assets disposed - (93,330) (93,330)
Depreciation expense 5.4 (136,290) (102,119) (238,409)
Accelerated Depreciation 5.5 - (63,628) (63,628)
Balance at 30 June 2019 146,284 110,999 257,283
Additions 34,772 1,827 36,599
Assets disposed - - -
Depreciation expense 5.4 (96,583) (60,242) (156,825)
Accelerated Depreciation 5.5 - - -
Balance at 30 June 2020 84,473 52,584 137,057
For
per
sona
l use
onl
y

ENERGY ACTION LIMITED ABN 90 137 363 636
P a g e | 54 Energy Action Limited ABN 90 137 363 636
FINANCIAL REPORT FOR THE FULL YEAR ENDED 30 JUNE 2020
Note 12: Intangible Assets Consolidated Group
2020 2019
$ $
Software development costs 11,518,790 10,841,063
Software Impairment (4,861,538) (1,250,000)
Accumulated amortisation (6,142,557) (6,326,640)
Net carrying value 514,695 3,264,423
Total intangibles 514,695 3,264,423
Goodwill Customer relationships
Software Development
costs
Total Intangibles
$ $ $ $
Consolidated Group:
Year ended 30 June 2018
Balance at the beginning of year 9,944,796 1,167,090 3,959,113 15,070,999
Internal development - - 1,728,212 1,728,212
Disposal - - - -
Impairment (9,944,796) - (1,250,000) (11,194,796)
Amortisation charge 5.4 - - (676,232) (676,232)
Accelerated Amortisation 5.5 - (1,167,090) (496,671) (1,663,761)
Closing value at 30 June 2019 - - 3,264,423 3,264,423
Year ended 30 June 2019
Balance at the beginning of year - - 3,264,423 3,264,423
Internal development - - 1,935,784 1,935,784
Disposal - - (7,967) (7,967)
Impairment - - (3,611,538) (3,611,538)
Amortisation charge 5.4 - - (861,286) (861,286)
Accelerated Amortisation 5.5 - - (204,722) (204,722)
Closing value at 30 June 2020 - - 514,695 514,695
Intangible assets, excluding goodwill, have finite useful lives. The current amortisation charges for intangible assets are included under depreciation and amortisation expense in the statement of comprehensive income.
Refer to Note 2 for capitalisation policy.
For
per
sona
l use
onl
y

ENERGY ACTION LIMITED ABN 90 137 363 636
P a g e | 55 Energy Action Limited ABN 90 137 363 636
FINANCIAL REPORT FOR THE FULL YEAR ENDED 30 JUNE 2020
Note 12: Intangible Assets (continued)
12 (a) Impairment testing of goodwill and other intangible assets
AASB 136 (9) “Impairment of Assets” requires an entity to assess at the end of each reporting period whether there is any indication that impairment exists, and if there are indicators of impairment to reassess the assets recoverable amount. The recoverable amount is defined in AASB 136 as the higher of fair value less cost to sell, and value in use.
12 (b) Accelerate amortisation
For the year ended 30 June 2020, the Company performed a review of the software assets and reassessed the useful life of the software asset pool. As a result, some software assets were assessed to have reduced useful life to 30 June 2020, resulting in an accelerated amortisation of the $0.20 million processed as a one off.
12 (c) Impairment of software
The Company has made a large investment in business software to replace its legacy applications with Microsoft CRM. As at 30 June, CRM book value was $3,611,538.
Due to extended delays and rework, the project experienced significant increase in implementation cost. The extended project duration and cost has reduced the opportunity to realise additional future benefits and the completed CRM project will now incur regular maintenance.
As at 30 June 2020, the Company has assessed that the CRM software assets has a nil valued as at 30 June 2020 and the Company has impaired this asset by the value of $3,611,538.
Note 13: Other Assets
Consolidated Group
2020 2019
$ $
CURRENT
Prepayments 283,062 271,199
Other receivables 293,143 -
Work in progress* 470,111 948,836
Revenue not invoiced* 3,185,228 3,243,102
4,231,544 4,463,137
NON CURRENT
Revenue not invoiced* 2,983,425 2,935,228 2,983,425 2,935,228
* These represents conditional contract asset as on 30 June 2020. (Note 3)
Note 13(a): Right-of-use Assets Consolidated Group
2020 2019
$ $
NON CURRENT
Opening Right-of-use Assets 992,365 -
Accumulated depreciation (351,846) - Closing Right-of-use Assets 640,519 -
For
per
sona
l use
onl
y

ENERGY ACTION LIMITED ABN 90 137 363 636
P a g e | 56 Energy Action Limited ABN 90 137 363 636
FINANCIAL REPORT FOR THE FULL YEAR ENDED 30 JUNE 2020
Note 14: Trade and Other Payables Consolidated Group
2020 2019
$ $
CURRENT
Unsecured liabilities:
Trade payables 535,831 695,339
Other payables and accrued expenses 2,818,683 1,836,506 3,354,514 2,531,845
a. Financial liabilities at amortised cost classified as trade and other payables
Trade and other payables: - Total current 3,354,514 2,531,845
Financial liabilities as trade and other payables 22 3,354,514 2,531,845
Terms and conditions of the above financial liabilities:
– Trade payables are non-interest bearing and are normally settled on 30 or 60 days terms
– Other payables are non-interest bearing and have an average term of six months
Note 14(a): Lease Liability Consolidated Group
2020 2019
$ $
CURRENT
Closing Lease Liability Current 336,896 -
NON CURRENT
Closing Lease Liability Non - Current 336,126 -
For
per
sona
l use
onl
y

ENERGY ACTION LIMITED ABN 90 137 363 636
P a g e | 57 Energy Action Limited ABN 90 137 363 636
FINANCIAL REPORT FOR THE FULL YEAR ENDED 30 JUNE 2020
Note 15: Tax
Consolidated Group
Note 2020 2019
$ $
CURRENT
Current tax asset 22 21,450 74,638
NON-CURRENT
Opening Balance
Tax rate change
Adj Prior year
Charged to Income Closing Balance
$ $ $ $ $
Consolidated Group
Deferred Tax 2020
Provisions 493,986 (26,370) (272,900) 262,365 457,080
Accruals 282,623 (20,319) 303,913 (214,023) 352,195
Fixed assets 379,244 (71,944) - 939,723 1,247,023
Customer relationships - - - - -
Prepaid commissions (18,379) 770 - 4,266 (13,344)
Work in progress (234,187) 5,587 - 131,762 (96,838)
Share Based Payments 948 - - (948) -
Sundry 48,399 (1,465) (12,575) (8,956) 25,403
Revenue not invoiced (1,820,778) 99,173 - 2,610 (1,718,995)
Right of Use Asset 9,608 - (176,143) (166,535) (868,145) (4,960) 18,438 940,656 85,989
Deferred Tax 2019
Provisions 710,018 (58,288) (10,564) (147,180) 493,986
Accruals 390,473 (32,539) - (75,311) 282,623
Fixed assets (118,675) 9,890 - 488,029 379,244
Customer relationships (350,127) 29,177 - 320,950 -
Prepaid commissions (54,153) 41 53,658 (17,925) (18,379)
Work in progress (259,554) 21,630 - 3,737 (234,187)
Share Based Payments 15,932 (1,328) - (13,656) 948
Sundry - - 48,399 48,399
Revenue not invoiced (2,405,130) 200,428 - 383,924 (1,820,778) (2,071,216) 169,011 43,094 990,966 (868,145)
For
per
sona
l use
onl
y

ENERGY ACTION LIMITED ABN 90 137 363 636
P a g e | 58 Energy Action Limited ABN 90 137 363 636
FINANCIAL REPORT FOR THE FULL YEAR ENDED 30 JUNE 2020
Note 16: Provisions and other liabilities Analysis of total provisions
Consolidated Group
Note 2020 $
2019 $
Current
Restructuring Provision - 382,705
Annual leave 486,350 588,084
Long service leave 257,359 197,738
743,709 1,168,528
Non-current Long service leave
173,828
234,402
173,828 234,402
Provision for Long-term Employee Benefits
A provision has been recognised for employee entitlements relating to long service leave. In calculating the present value of future cash flows in respect of long service leave, the probability of long service leave being taken is based on historical data. The measurement and recognition criteria relating to employee benefits have been included in Note 2.
Note 17: Loans and Borrowings
Consolidated Group
Note 2020 $
2019 $
Market Rate Loan Facility 6,200,000 5,723,721
Less capitalised debt establishment fees (23,825) (35,250)
22 6,176,175 5,688,471
Utilisation of the facility is summarised in the following table:
Financing facilities
Consolidated Group
2020 $
2019 $
Loan facilities (excluding corporate card facility) 7,300,000 9,300,000
Amounts utilised Borrowings Bank guarantees – non-cash
6,200,000
176,670
5,723,721
237,667
Total amounts utilised 6,376,670 5,961,388
Total amounts unutilised 923,330 3,338,612
For
per
sona
l use
onl
y

ENERGY ACTION LIMITED ABN 90 137 363 636
P a g e | 59 Energy Action Limited ABN 90 137 363 636
FINANCIAL REPORT FOR THE FULL YEAR ENDED 30 JUNE 2020
Note 17: Loans & Borrowings (Continued)
Energy Action entered into a total loan commitment of $9.55 million with the CBA on 8 May 2019, including a market rate loan facility of $9 million, bank guarantee facility of $0.3 million and corporate card facility of $0.25 million. The facility was extended during the year for a two-year term expiring 29 September 2021. The facility limit was further reduced by $2 million during FY20, this will provide savings in borrowing costs of $32,000 per annum.
Energy Action confirm that there was a breach of the Gearing Ratio covenant under the Company’s bank facility which was required to be tested as at 31 December 2019, and as a result the Loans and Borrowings were reported as a current liability as at 31 December 2019.
Subsequently, Energy Action formally requested and in February 2020 the Bank agreed to waive of the banks rights under the Event of Default due to the breach of the Gearing ratio. As a result, the bank loan has moved back to non-current liabilities.
As at 30 June 2020, Energy Action had utilised $6.20 million of market rate loan and $0.18 million bank guarantees. The carrying value of the loans and borrowings materially approximate fair value. Funds advanced under the facility are secured by a charge over the assets of the Group and includes Interest Cover and Gearing ratios.
The company reached an agreement to waive the requirement to test and comply with the financial covenants under the facility as at 30 June 2020. The Company is proactively partnering with the bank to renegotiate the existing facility to a long term facility agreement, prior to 31 December 2020.
Note 18: Issued Capital and Reserves
Consolidated Group
2019 $
2019 $
Fully paid ordinary shares 6,537,906 6,537,906 6,537,906 6,537,906
Consolidated Group
2020 No.
2019 No.
a. Ordinary Shares (number) At the beginning of the reporting period: 25,954,117 25,954,117 Movement in the year: - - At the end of the reporting period 25,954,117 25,954,117
Consolidated Group
2020 $
2019 $
b. Ordinary Shares ($) At the beginning of the reporting period: 6,537,906 6,537,906 Movement in the year - - At the end of the reporting period 6,537,906 6,537,906
Ordinary shares participate in dividends and the proceeds on winding-up of the parent entity in proportion to the number of shares held.
At the shareholders’ meetings each ordinary share is entitled to one vote when a poll is called, otherwise each shareholder has one vote on a show of hands.
For
per
sona
l use
onl
y

ENERGY ACTION LIMITED ABN 90 137 363 636
P a g e | 60 Energy Action Limited ABN 90 137 363 636
FINANCIAL REPORT FOR THE FULL YEAR ENDED 30 JUNE 2020
Note 18: Issued Capital and Reserves (Continued)
c. Share based payments reserve
Share-based payment transactions:
The share-based payment reserve is used to recognise the value of equity-settled share-based payment provided to employees.
On 30 June 2020, 777,000 performance options were granted to senior executives under the 2020 LTI Performance rights and option plan. The total number of options granted is divided into five equal tranches, which will be tested against a performance hurdle at staggered intervals. All tranches have a strike price of 41 cents.
The number of options that ultimately vest (if any) is subject to satisfaction of a performance hurdle. Testing of options against the performance hurdles will occur annually, with the possibility of re-testing if hurdles are not satisfied in the first instance.
The performance hurdle is written around Total Shareholder Return (TSR). In Order for some options to vest, the minimum target is 20% p.a. If the stretch target of 40% p.a. is reached, all options will vest. In between minimum and stretch targets, the proportion of options that vests increases linearly between 50% and 100% of the options granted.
Performance Criteria Proportion of Options Vesting If TSR is less than 20% pa No options vest If TSR is equal to 20% pa 50% of the options vest If TSR lies between 20% and 40% pa The proportion of options that vests increase linearly from 50% to 100% If TSR equals or exceeds 40% pa 100% of the options vest
Note: In calculating the TSR over the respective vesting periods, a starting base price of 37 cents will be used.
Vesting of the options is also subject to a service condition which requires the recipient to remain continuously employed with Energy Action through to the vesting date. This report assumes that the service condition will be fully satisfied.
A Monte Carlo simulation valuation technique has been adopted to value the performance rights at grant date. The grant date share price was based on the EAX closing share price of 16 cents as at 30 June 2020 and the option exercise price for all tranches of options is 41 cents. The 12 March 2018 performance rights granted to senior executives and certain other employees under the Performance Rights & Options Plan (PROP), vesting only occurs when and if service and performance conditions are met. As at 30 June 2020 all of these performance rights have been cancelled or forfeited. For the year ended 30 June 2020, the Group has recognised ($3,001) of share-based payment expense in the statement of comprehensive income (30 June 2019: ($93,759)). Share based payments expense is net of reversals due to non-achievement of targets (EPS targets) and forfeitures in the case of terminated employees.
Consolidated Group
Share Based Payment Reserve Note 2020 2019
$ $ at the beginning of the reporting period 170,833 318,226 Share based payment expenses (3,001) (93,759) Employee shares - - PROP payment - (53,634) Transfer cash to Employee Shared Trust - - Movement in the year (3,001) (147,393) At the end of the reporting period 167,832 170,833
For
per
sona
l use
onl
y

ENERGY ACTION LIMITED ABN 90 137 363 636
P a g e | 61 Energy Action Limited ABN 90 137 363 636
FINANCIAL REPORT FOR THE FULL YEAR ENDED 30 JUNE 2020
Note 18: Issued Capital and Reserves (Continued)
d. Foreign currency translation reserve Exchange differences arising on translation of the foreign controlled entity are taken to the foreign currency translation reserve, as described in Note 2. The reserve is recognised in profit or loss when the net investment is disposed of.
Consolidated Group
Foreign Currency Translation Reserve Note 2020 2019
$ $ at the beginning of the reporting period 1,430 (39,810) Foreign currency translation reserve write off - 39,641 Foreign currency translation entry (current period) (277) 1,599 Movement in the year (277) 41,240 At the end of the reporting period 1,152 1,430
e. Capital Management The Group’s capital includes ordinary share capital. Management controls the capital of the Group in order to maintain a prudent debt to equity ratio, provide the shareholders with adequate returns and ensure that the Group can fund its operations and continue as a going concern. This includes adjusting dividend payments to shareholders and equity attributable to the entity holders of the parent. There is an externally imposed capital requirement of $50,000 to be held in cash, as a requirement of holding an Australian Financial Services Licence. The way management controls Group’s capital is by assessing the Group’s financial risks and adjusting its capital structure in response to changes in those risks and in the market. The responses include the management of debt levels, distributions to shareholders and share issues.
f. Interest Rate Hedging Reserve Exposure to interest rate risk arises on financial assets recognised at reporting date whereby a future change in interest rates will affect future cash flows or the fair value of fixed rate financial instruments. The Group’s exposure to the risk of changes in market interest rates relates primarily to the Group’s borrowings balances with floating interest rates. Interest rate risk is managed primarily using floating interest rates on bank borrowings. At the end of each reporting period, the Group assesses the hedge effectiveness between hedged item and hedging instrument to determine whether the risk management objective for the hedging relationship has changed as described in note 2. For the year ended 30 June 2020, the interest rate hedging reserve was NIL (FY19: $9,610)
Consolidated Group
Interest Rate Hedging Reserve Note 2020 2019
$ $ at the beginning of the reporting period (9,610) (7,567) Interest rate hedging entry (reverse prior period) 9,610 7,567 Interest rate hedging entry (current period) - (9,610) Movement in the year 9,610 (2,043) At the end of the reporting period - (9,610)
For
per
sona
l use
onl
y

ENERGY ACTION LIMITED ABN 90 137 363 636
P a g e | 62 Energy Action Limited ABN 90 137 363 636
FINANCIAL REPORT FOR THE FULL YEAR ENDED 30 JUNE 2020
Note 18: Issued Capital and Reserves (Continued) There have been no changes in the strategy adopted by management to control the capital of the Group since the prior year. The Group includes within net debt, trade and other payables including provision for income tax, less cash and cash equivalents. Bank guarantees are excluded from this calculation. The gearing ratios for the year ended 30 June 2020 and 30 June 2019 are as follows:
Consolidated Group
Note 2020 2019
$ $
Bank loans 17 6,176,175 5,688,471
Less cash and cash equivalents 9 (3,195,898) (1,608,515)
Net debt / (cash) 2,980,277 4,079,956
Total Equity 3,173,693 5,693,759
Gearing percentage (%) 94% 72%
Gearing as measured by total net debt divided by total equity was 94% as at 30 June 2020 and 72% at 30 June 2019.
g. Dividend Profit Reserve
During the year ended 30 June 2020, some subsidiaries of the Group resolved to reserve current and prior year profits as a dividend profit reserve. These reserves held in the subsidiaries of Energy Action Australia Pty Limited and Exergy Australia Limited for the potential future dividend distribution to the Parent Company, Energy Action Limited. Note 19: Capital and Leasing Commitments
Consolidated Group
Note 2020 $
2019 $
a. Operating Lease Commitments
Non-cancellable property operating leases contracted for but not recognised in the financial statements
Payable – minimum lease payments:
– not later than 12 months - 668,864
– between 12 months and 5 years - 796,787
- 1,465,651
Due to the adoption of AASB16, there is no operating lease commitments.
The Group has provided the following bank guarantees at 30 June 2020 for regional offices: Consolidated Group
Note 2020 $
2019 $
– Parramatta office 145,347 145,347
– Brisbane office 31,323 31,323
– Melbourne office - 19,250
176,670 195,920
For
per
sona
l use
onl
y

ENERGY ACTION LIMITED ABN 90 137 363 636
P a g e | 63 Energy Action Limited ABN 90 137 363 636
FINANCIAL REPORT FOR THE FULL YEAR ENDED 30 JUNE 2020
Note 20: Cash Flow Information
Consolidated Group
2020
2019
$ $
a. Reconciliation of Cash Flow from Operations with Profit after Income Tax Profit after income tax (2,486,756) (12,092,885) – Depreciation and amortisation 1,574,678 2,735,361 – Share based payments expense (3,002) (147,392) – Amortisation of borrowing costs 33,876 68,875 – Impairment of goodwill - 9,944,796 – Impairment of software 3,611,538 1,250,000 – Strategic review - 93,274 – Restructuring costs 50,000 520,145 – Government assistance (293,143) -
Changes in assets and liabilities, net of the effects of purchase and disposal of subsidiaries:
– (increase)/decrease in trade and term receivables 1,204,401 1,888,584 – (increase)/decrease in prepayments and other assets 369,698 265,254 – increase/(decrease) in trade payables and accruals (624,471) (290,393) – increase/(decrease) in deferred taxes (900,946) (1,220,971) – increase/(decrease) in provisions 477,859 (312,005)
Cash flow from operations 3,013,733 2,702,643 b. Reconciliation of liabilities arising from financing activities
Non-cash changes Total liability from financing activities Opening
Balance Cash flow Acquisition Foreign
exchange movement
Fair value changes
Closing Balance
$ $ $ $ $ $
FY20 Long term borrowings
5,723,721 476,279 - - - 6,200,000
FY19 Long term borrowings
5,100,000 623,721 - - - 5,723,721
For
per
sona
l use
onl
y

ENERGY ACTION LIMITED ABN 90 137 363 636
P a g e | 64 Energy Action Limited ABN 90 137 363 636
FINANCIAL REPORT FOR THE FULL YEAR ENDED 30 JUNE 2020
Note 21: Related Party Disclosures
The financial statements include the financial statements of the Group and the subsidiaries listed in the following table:
a. Controlled Entities Consolidated Country of Incorporation Percentage Owned (%)*
Subsidiaries of Energy Action Limited: 2020 2019
Eactive Consulting Pty Limited Australia 100% 100%
Energy Action (Australia) Pty Limited Australia 100% 100%
EAIP Pty Limited Australia 100% 100%
ACN 087 790 770 Pty Limited Australia 100% 100%
Exergy Holdings Pty Limited Australia 100% 100%
Exergy Australia Pty Limited Australia 100% 100%
Exergy New Zealand Limited Energy Advice Pty Ltd
New Zealand Australia
100% 100%
100% 100%
Employee Share Trust Australia 100% 100%
* Percentage of voting power is in proportion to ownership
b. The Group’s main related parties are as follows:
i. Key management personnel:
Any person(s) having authority and responsibility for planning, directing and controlling the activities of the entity, directly or indirectly, including any director (whether executive or otherwise) of that entity, are considered key management personnel.
For details of disclosures relating to key management personnel, refer to the Remuneration Report contained in the Director’s Report.
ii. Other related parties:
Other related parties include entities controlled by the ultimate parent entity and entities over which key management personnel exercise significant influence. The Group procures management services from Horizon Private Capital Partners. Nitin Singhi is a director of Horizon Services Trust, which was paid $36,300 in FY20 (FY19 $116,875). Horizon provided consulting advice in relation to the renegotiation of the bank facility, the transfer of certain contracts in the Advisory division and the introduction of new partnerships. The Group procures legal advice from Meehans Solicitors. Paul Meehan is the Principal of Meehans Solicitors and his firm provide legal services to the value of $990 in FY20 (FY19 NIL).
c. Compensation of Key Management Personnel (KMP)
Refer to the Remuneration Report contained in the Director’s Report for details of the remuneration paid or payable to each member of the Group’s key management personnel for the year ended 30 June 2020. The totals of remuneration paid to KMP of the Group during the year are as follows:
Consolidated Group
2020 $
2019 $
Short-term employee benefits 693,566 1,282,966
Long-term employee benefits - 251,032
Post-employment benefits – superannuation 53,632 105,272
Total Compensation 747,198 1,639,270
The amounts disclosed in the table are the amounts recognised as an expense during the reporting period relating to KMP.
For
per
sona
l use
onl
y

ENERGY ACTION LIMITED ABN 90 137 363 636
P a g e | 65 Energy Action Limited ABN 90 137 363 636
FINANCIAL REPORT FOR THE FULL YEAR ENDED 30 JUNE 2020
Note 21: Related Party Disclosures (Continues)
d.
The ultimate parent Energy Action Limited is the ultimate parent based and listed in Australia.
Note 22: Financial Risk Management
The Group’s principal financial liabilities comprise borrowings, trade and other payables. The main purpose of these financial liabilities is to finance the Group’s operations. The Group has trade and other receivables, and cash and short-term deposits that arrive directly from its operations. The totals for each category of financial instruments, measured in accordance with AASB 9 as detailed in the accounting policies to these financial statements, are as follows:
Consolidated Group
Note 2020 2019
$ $
Financial assets
Cash and cash equivalents, including restricted cash 9 3,195,898 1,608,515
Receivables 10 2,402,416 3,495,883
Bond and security deposits 10 81,948 86,043
Revenue not invoiced 13 6,168,653 6,178,330
Total financial assets 11,848,915 11,368,771
Financial liabilities
Loans and Borrowings 17 6,176,175 5,688,471
Trade & Other payables 14 3,354,514 2,531,845
Total financial liabilities 9,530,689 8,220,316
Financial Risk Management Policies
The Audit and Risk Management Committee (ARMC) has been delegated responsibility by the Board of Directors for, amongst other matters, monitoring and managing financial risk exposures of the Group. The ARMC monitors the Group’s financial risk management policies and exposures and approves financial transactions within the scope of its authority. It also reviews the effectiveness of internal controls relating to financing risk and interest rate risk. The ARMC meets at least three times a year and minutes of the ARMC are reviewed by the Board. The ARMC’s overall risk management strategy seeks to assist the consolidated group in meeting its financial targets, while minimising potential adverse effects on financial performance. Its functions include the review of the credit risk policies and future cash flow requirements.
For
per
sona
l use
onl
y

ENERGY ACTION LIMITED ABN 90 137 363 636
P a g e | 66 Energy Action Limited ABN 90 137 363 636
FINANCIAL REPORT FOR THE FULL YEAR ENDED 30 JUNE 2020
Note 22: Financial Risk Management (Continues)
Specific Financial Risk Exposures and Management The main risks the Group is exposed to through its financial instruments are credit risk, liquidity risk and market risk consisting of interest rate risk.
a. Credit Risk
Credit risk is the risk that a counterparty will not meet its obligations under a financial instrument or customer contract, leading to a financial loss. The Group is exposed to credit risk from its operating activities (primarily for trade receivables) and from its financing activities, including deposits with banks and financial institutions, and other financial instruments.
Credit risk is managed through the maintenance of procedures (such procedures include the utilisation of systems for the approval, granting and renewal of credit limits, regular monitoring of exposures against such limits and monitoring of the financial stability of significant customers and counterparties), ensuring to the extent possible, that customers and counterparties to transactions are of sound credit worthiness. Such monitoring is used in assessing receivables for impairment. Credit terms are generally 30 to 90 days from the invoice date.
Risk is also minimised through investing surplus funds in financial institutions that maintain a high credit rating. The institutions selected are determined by the Board.
The maximum exposure to credit risk by class of recognised financial assets at the end of the reporting period excluding the value of any collateral or other security held, is equivalent to the carrying value and classification of those financial assets (net of any provisions) as presented in the statement of financial position.
The Group has no significant concentrations of credit risk with any single counterparty or group of counterparties. Details with respect to credit risk of trade and other receivables are provided in Note 10.
Trade and other receivables that are neither past due nor impaired are considered to be of high credit quality. Aggregates of such amounts are as detailed in Note 10.
b. Liquidity risk
Liquidity risk arises from the possibility that the Group might encounter difficulty in settling its debts or otherwise meeting its obligations related to financial liabilities. The Group manages this risk through the following mechanisms:
– preparing forward looking cash flow analysis in relation to its operational, investing and financing activities;
– obtaining funding from a variety of sources; – maintaining a reputable credit profile; – managing credit risk related to financial assets; – only investing surplus cash with major financial institutions; and – comparing the maturity profile of financial liabilities with the realisation profile of financial
assets
For
per
sona
l use
onl
y

ENERGY ACTION LIMITED ABN 90 137 363 636
P a g e | 67 Energy Action Limited ABN 90 137 363 636
FINANCIAL REPORT FOR THE FULL YEAR ENDED 30 JUNE 2020
Note 22: Financial Risk Management (continued)
Within 1 Year 1 to 5 years Over 5 years Total
2020 2019 2020 2019 2020 2019 2020 2019
Consolidated Group $ $ $ $ $ $ $ $ Financial liabilities due for payment
Bank loans 16,395 50,573 6,159,780 5,688,471 - - 6,176,175 5,739,044 Trade and other payables (excluding est. annual leave)
3,354,514 2,531,845 - - - - 3,354,514 2,531,845
Total expected outflows 3,370,909 2,582,418 6,159,780 5,688,471 - - 9,530,689 8,270,889
Financial assets — cash flows realisable
Cash and cash equivalents 3,181,951 1,579,429 - - - - 3,181,951 1,579,429
Restricted cash 14,022 29,086 - - - - 14,022 29,086 Trade, term and loans receivables 2,402,416 3,495,883 - - - - 2,402,416 3,495,883
Work in progress 470,111 948,836 - - - - 470,111 948,836 Bonds and security deposits - - 81,948 86,043 - - 81,948 86,043
Revenue not invoiced 3,185,228 3,243,102 2,983,425 2,935,228 - - 6,168,653 6,178,330
Total anticipated inflows 9,253,654 9,296,336 3,065,373 3,021,271 - - 12,319,026 12,317,607
Net (outflow)/inflow on financial instruments 5,882,745 6,713,918 (3,094,408) (2,667,200) - - 2,788,337 4,046,718
b. Interest rate risk Interest rate risk arises as a result of changes in market interest rates and will affect the future cash flows. The Group manages its interest rate risk by having a variety of loan rollover terms from 30 days to 180 days. Cash and cash equivalents are all on short term deposits. As at 30 June 2020, the Group had bank loans of $6.2 million on 90-day terms at (line fee of 1.6%, usage fee of 1.14% and 0.15% interest rate). c. Market Risk Market risk is the risk that the fair value of future cash flows of a financial instrument will fluctuate because of changes in market prices. Market prices for Energy Action Limited comprise interest rate risk. Financial instruments affected by interest risk include cash at bank.
1) Interest Rate Risk Exposure to interest rate risk arises on financial assets recognised at reporting date whereby a future change in interest rates will affect future cash flows or the fair value of fixed rate financial instruments. The Group’s exposure to the risk of changes in market interest rates relates primarily to the Group’s borrowings balances with floating interest rates net of cash. The company has insignificant other balances that have interest payment terms.
For
per
sona
l use
onl
y

ENERGY ACTION LIMITED ABN 90 137 363 636
P a g e | 68 Energy Action Limited ABN 90 137 363 636
FINANCIAL REPORT FOR THE FULL YEAR ENDED 30 JUNE 2020
Note 22: Financial Risk Management (continued)
2) Sensitivity Analysis The following table illustrates sensitivities to the Group’s exposures to changes in interest rates. The table indicates the impact on how profit and equity values reported at balance date would have been affected by changes in the relevant risk variable that management considers to be reasonably possible. These sensitivities assume that the movement in a particular variable is independent of other variables, and the other assumptions remain consistent with prior years.
Consolidated Group
Increase/decrease in basis points
Profit before tax
$ $
Year ended 30 June 2020 +/- 100 -/+ 61,385
Year ended 30 June 2019 +/- 100 -/+ 56,495
The assumed movement in basis points for the interest rate sensitivity analysis is based on currently observable market environment, showing a significantly lower volatility than in prior years.
Fair Values
Fair value estimation
The carrying value of financial assets and financial liabilities is materially the same as the fair value.
The fair values of the following financial assets and liabilities have been determined based on the following methodologies and assumptions:
(i) Cash and cash equivalents, trade and other receivables and trade and other payables are short-term instruments whose carrying value are deemed to be equivalent to fair value. Trade and other payables exclude amounts provided for relating to annual leave which is not considered a financial instrument.
(ii) Term receivables generally reprice to a market interest rate every 6 months, and fair value therefore approximates carrying value.
(iii) Bank borrowings entered into an interest rates swap hedging instrument, fair value assessment every 6 months
Financial liabilities are classified into Levels: Level 1 those items traded with quoted prices in active markets for identical liabilities Level 2 those items with significantly observable inputs other than quoted process in active markets Level 3 those with unobservable inputs
Fair Values FY20 FY19
Level 1 Level 2 Level 3 Level 1 Level 2 Level 3
Financial Liabilities
Bank loans 6,176,175 - - 5,688,471 - - F
or p
erso
nal u
se o
nly

ENERGY ACTION LIMITED ABN 90 137 363 636
P a g e | 69 Energy Action Limited ABN 90 137 363 636
FINANCIAL REPORT FOR THE FULL YEAR ENDED 30 JUNE 2020
Note 23: Auditors’ Remuneration
Consolidated Group
2020 2019
$ $ The auditor for Energy Action Limited is RSM Amounts received or due and receivable by Ernst & Young (Australia) (resigned 30 June 2019) for:
— An audit or review of the financial report of the entity and any other entity in the consolidated group
25,000 208,400
— Other services in relation to the entity and any other entity in the consolidated group
— Due diligence services -
-
— Tax services - - Amounts received or due and receivable by RSM (Australia) (appointed 1 July 2019) for:
— An audit or review of the financial report of the entity and any other entity in the consolidated group
110,000 -
— Other services in relation to the entity and any other entity in the consolidated group
- - — Due diligence services - - — Tax services - -
135,000 208,400
For
per
sona
l use
onl
y

ENERGY ACTION LIMITED ABN 90 137 363 636
P a g e | 70 Energy Action Limited ABN 90 137 363 636
FINANCIAL REPORT FOR THE FULL YEAR ENDED 30 JUNE 2020
Note 24: Information relating to Energy Action Limited (“the parent entity”)
The following information has been extracted from the books and records of the parent and has been prepared in accordance with Accounting Standards.
Parent
Note 2020 2019*
$ $
STATEMENT OF FINANCIAL POSITION
ASSETS
Current assets 16,082,200 14,454,649
Non-current assets 15,013,084 15,034,018
Total assets 31,095,284 29,488,667
Current liabilities (10,077,676) (8,729,139)
Non-current liabilities (8,773,999) (8,296,772)
Total liabilities (18,851,675) (17,025,911)
Issued capital 8,005,600 8,005,600
Retained earnings 4,238,010 4,457,158
Total Equity 12,243,609 12,462,756
Profit/(loss) of the parent entity (186,115) 2,721,588
Total comprehensive income/(loss) of the parent entity (186,115) 2,721,588 *restated due to prior year correction During the year ended 30 June 2019, the impairment of Goodwill and tax effected accelerated amortisation of customer relationships was incorrectly adjusted in the Parent Company, resulting in incorrect Statement of Financial Position. The 2019 comparable period has been restated accordingly. The movement of the 2019 Statement of Financial Position is restated below:
Parent
2019 Goodwill Customer relationship Entity Tax 2019*
(Restated)
STATEMENT OF FINANCIAL POSITION
ASSETS
Current assets 16,600,039 (2,145,390) 14,454,649
Non-current assets 3,448,650 9,147,368 2,438,000 15,034,018
Total assets 20,048,689 9,147,368 2,438,000 (2,145,390) 29,488,667
Current liabilities (10,422,300) (670,450) 2,363,611 (8,729,139)
Non-current liabilities (7,471,939) (824,833) (8,296,772)
Total liabilities (17,894,239) (670,450) 1,538,778 (17,025,911)
Issued capital 8,005,600 8,005,600
Retained earnings (5,851,149) 9,147,368 1,767,550 (606,612) 4,457,158
Total Equity 2,154,451 9,147,368 1,767,550 (606,612) 12,462,756
For
per
sona
l use
onl
y

ENERGY ACTION LIMITED ABN 90 137 363 636
P a g e | 71 Energy Action Limited ABN 90 137 363 636
FINANCIAL REPORT FOR THE FULL YEAR ENDED 30 JUNE 2020
Note 24: Information relating to Energy Action Limited (“the parent entity”) (Continued)
Guarantees entered into by the parent entity in relation to the debts of its subsidiaries The parent entity and some of its subsidiaries are not party to a deed of cross guarantee under which each company guarantee the debts of the others. No deficiencies of assets exist in any of these subsidiaries. Contingent Liabilities A demand was made during the financial year in respect of alleged unpaid amounts for previous work provided to the Company. The Company has disclaimed liability and is defending the action. Legal advice obtained indicates that it unlikely that any significant liability arises. The directors are of the view that no material losses will arise in respect of the legal claim at the date of these financial statements. The parent entity had no contingent liabilities as at 30 June 2020. Capital Commitments – Property, Plant and Equipment The parent entity had no capital commitments for property, plant and equipment as at 30 June 2020 and 30 June 2019
Note 25: Events After the reporting period
No other matters or circumstances have arisen since the end of the financial year which significantly affected or could significantly affect the operations of the consolidated group, the results of those operations, or the state of affairs of the consolidated group in future financial years.
For
per
sona
l use
onl
y

ENERGY ACTION LIMITED ABN 90 137 363 636
P a g e | 72 Energy Action Limited ABN 90 137 363 636
FINANCIAL REPORT FOR THE FULL YEAR ENDED 30 JUNE 2020
Director’s Declaration
In accordance with a resolution of the Directors of Energy Action Limited, I state that:
1. In the opinion of the Directors:
a. The financial statements and notes of Energy Action Limited for the financial year ended 30 June 2020 are in accordance with the Corporations Act 2001, including:
i. giving a true and fair view of its financial position as at 30 June 2020 and performance ii. complying with Accounting Standards (including the Australian Accounting Interpretations) and the Corporations Regulations 2001
b. The financial statements and notes also comply with International Financial Reporting Standards as disclosed in Note 2.1
c. There are reasonable grounds to believe that the Company will be able to pay its debts as and when they become due and payable
2. This declaration has been made after receiving the declarations required to be made to the Directors in accordance with section 295A of the Corporations Act 2001 for the financial year ended 30 June 2020.
On behalf of the board
Murray Bleach Director
26 August 2020
For
per
sona
l use
onl
y

73
THE POWER OF BEING UNDERSTOOD AUDIT | TAX | CONSULTING
RSM Australia Partners is a member of the RSM network and trades as RSM. RSM is the trading name used by the members of the RSM network. Each member of the RSM network is an independent accounting and consulting firm which practices in its own right. The RSM network is not itself a separate legal entity in any jurisdiction.
RSM Australia Partners ABN 36 965 185 036
Liability limited by a scheme approved under Professional Standards Legislation
RSM Australia Partners
Level 13, 60 Castlereagh Street Sydney NSW 2000 GPO Box 5138 Sydney NSW 2001
T +61 (0) 2 8226 4500 F +61 (0) 2 8226 4501
www.rsm.com.au
INDEPENDENT AUDITOR’S REPORT To the Members of Energy Action Limited Opinion
We have audited the financial report of Energy Action Limited. (the Company) and its subsidiaries (the Group), which comprises the consolidated statement of financial position as at 30 June 2020, the consolidated statement of comprehensive income, the consolidated statement of changes in equity and the consolidated statement of cash flows for the year then ended, and notes to the financial statements, including a summary of significant accounting policies, and the directors' declaration.
In our opinion the accompanying financial report of the Group is in accordance with the Corporations Act 2001, including:
(i) giving a true and fair view of the Group's financial position as at 30 June 2020 and of its financial performance for the year then ended; and
(ii) complying with Australian Accounting Standards and the Corporations Regulations 2001.
Basis for Opinion
We conducted our audit in accordance with Australian Auditing Standards. Our responsibilities under those
standards are further described in the Auditor's Responsibilities for the Audit of the Financial Report section of
our report. We are independent of the Group in accordance with the auditor independence requirements of the
Corporations Act 2001 and the ethical requirements of the Accounting Professional and Ethical Standards Board's
APES 110 Code of Ethics for Professional Accountants (the Code) that are relevant to our audit of the financial
report in Australia. We have also fulfilled our other ethical responsibilities in accordance with the Code.
We confirm that the independence declaration required by the Corporations Act 2001, which has been given to
the directors of the Company, would be in the same terms if given to the directors as at the time of this auditor's
report.
We believe that the audit evidence we have obtained is sufficient and appropriate to provide a basis for our
opinion.
For
per
sona
l use
onl
y

74
Key Audit Matters
Key audit matters are those matters that, in our professional judgement, were of most significance in our audit of the financial report of the current period. These matters were addressed in the context of our audit of the financial report as a whole, and in forming our opinion thereon, and we do not provide a separate opinion on these matters.
Key Audit Matter How our audit addressed this matter
Impairment of Intangible Assets
Refer to Note 12 in the financial statements
Other intangible assets comprise capitalised
software development costs which were assessed
by the Group for indicators of impairment. If
indicators of impairment exist during the year, an
impairment test for these assets is performed.
During the year the Group recognised an impairment
of $3,611,538 in respect of capitalised software
development costs relating to an internally
developed software platform.
The carrying value of intangible assets was
considered to be a key audit matter due to the
magnitude of the balance in the consolidated
statement of financial position.
Refer to Note 12 of the financial report for the related
disclosures.
Our audit procedures included:
Evaluating the Group’s assessment of indicators of impairment for capitalised software development costs.
Obtained and assessed the board approved impairment review in relation to capitalised software development costs.
Considered the adequacy of the financial report disclosures contained in Note 12 of the financial report.
Other Information
The directors are responsible for the other information. The other information comprises the information included
in the Group's annual report for the year ended 30 June 2020, but does not include the financial report and the
auditor's report thereon.
Our opinion on the financial report does not cover the other information and accordingly we do not express any
form of assurance conclusion thereon.
In connection with our audit of the financial report, our responsibility is to read the other information and, in doing
so, consider whether the other information is materially inconsistent with the financial report or our knowledge
obtained in the audit or otherwise appears to be materially misstated.
If, based on the work we have performed, we conclude that there is a material misstatement of this other
information, we are required to report that fact. We have nothing to report in this regard.
For
per
sona
l use
onl
y

75
Responsibilities of the Directors for the Financial Report
The directors of the Company are responsible for the preparation of the financial report that gives a true and fair
view in accordance with Australian Accounting Standards and the Corporations Act 2001 and for such internal
control as the directors determine is necessary to enable the preparation of the financial report that gives a true
and fair view and is free from material misstatement, whether due to fraud or error.
In preparing the financial report, the directors are responsible for assessing the ability of the Group to continue as
a going concern, disclosing, as applicable, matters related to going concern and using the going concern basis of
accounting unless the directors either intend to liquidate the Group or to cease operations, or have no realistic
alternative but to do so.
Auditor's Responsibilities for the Audit of the Financial Report
Our objectives are to obtain reasonable assurance about whether the financial report as a whole is free from
material misstatement, whether due to fraud or error, and to issue an auditor's report that includes our opinion.
Reasonable assurance is a high level of assurance, but is not a guarantee that an audit conducted in accordance
with the Australian Auditing Standards will always detect a material misstatement when it exists. Misstatements
can arise from fraud or error and are considered material if, individually or in the aggregate, they could reasonably
be expected to influence the economic decisions of users taken on the basis of this financial report.
A further description of our responsibilities for the audit of the financial report is located at the Auditing and
Assurance Standards Board website at: http://www.auasb.gov.au/auditors_responsibilities/ar2.pdf.
This description forms part of our auditor's report.
Report on the Remuneration Report
Opinion on the Remuneration Report
We have audited the Remuneration Report included in pages 19 to 27 of the directors' report for the year ended
30 June 2020.
In our opinion, the Remuneration Report of Energy Action Limited., for the year ended 30 June 2020, complies
with section 300A of the Corporations Act 2001.
Responsibilities
The directors of the Company are responsible for the preparation and presentation of the Remuneration Report
in accordance with section 300A of the Corporations Act 2001. Our responsibility is to express an opinion on the
Remuneration Report, based on our audit conducted in accordance with Australian Auditing Standards.
RSM AUSTRALIA PARTNERS
C J Hume
Partner
Sydney, NSW
Dated: 26 August 2020
For
per
sona
l use
onl
y