Appendix 3: Cooperage Well Pumping Test Report to EPA RFI – Diageo Ireland Application for Review...
115
Response to EPA RFI – Diageo Ireland Application for Review of an Industrial Emissions Licence 287-X0247 6 May 2015 Appendix 3: Cooperage Well Pumping Test Report
Transcript of Appendix 3: Cooperage Well Pumping Test Report to EPA RFI – Diageo Ireland Application for Review...

Response to EPA RFI – Diageo Ireland Application for Review of an Industrial Emissions Licence
287-X0247 6 May 2015
Appendix 3: Cooperage Well Pumping Test Report

Cooperage Well Pumping Test Report
Diageo St James’ Gate Brewery (IPPC licence P0301-02)
28 March 2014 FINAL
47092660
Prepared for: Diageo Ireland
UNITED KINGDOM & IRELAND

Diageo Ireland — Cooperage Well Pumping Test, St. James’ Gate Brewery
DIAGEO ST. JAMES’ GATE
IPPC Licence Register No. P0301-02 March 2014 FINAL
i
REVISION SCHEDULE
Rev Date Details Prepared by Reviewed by Approved by
1 28 March 2014
Draft Report N D Mackenzie & P Johnston
Principal Hydrogeologists
Eilis Linehan Senior Environmental Scientist
Sinead Fitzpatrick Principal Environmental Scientist
Kevin Forde Principal Hydrogeologist
2 28 March 2014
Final Report N D Mackenzie & P Johnston
Principal Hydrogeologists
Eilis Linehan Senior Environmental Scientist
Sinead Fitzpatrick Principal Environmental Scientist
Kevin Forde Principal Hydrogeologist
URS Ireland Limited 410-411 Q House

Diageo Ireland — Cooperage Well Pumping Test, St. James’ Gate Brewery
DIAGEO ST. JAMES’ GATE
IPPC Licence Register No. P0301-02 March 2014 FINAL
ii
76 Furze Road, Dublin 18 Ireland Tel: +353 (0)1 293 3200
Fax: +353 (0)1 293 3201 www.ursglobal.com

Diageo Ireland — Cooperage Well Pumping Test, St. James’ Gate Brewery
DIAGEO ST. JAMES’ GATE
IPPC Licence Register No. P0301-02 March 2014 FINAL
iii
Limitations
URS Ireland Limited (“URS”) has prepared this Report for the sole use of Diageo Ireland (“Client”) in accordance with the Agreement under which our services were performed (Proposal dated 09 December 2013). No other warranty, expressed or implied, is made as to the professional advice included in this Report or any other services provided by URS. This Report is confidential and may not be disclosed by the Client nor relied upon by any other party without the prior and express written agreement of URS.
The conclusions and recommendations contained in this Report are based upon information provided by others and upon the assumption that all relevant information has been provided by those parties from whom it has been requested and that such information is accurate. Information obtained by URS has not been independently verified by URS, unless otherwise stated in the Report.
The methodology adopted and the sources of information used by URS in providing its services are outlined in this Report. The work described in this Report was undertaken between December 2013 and March 2014 and is based on the conditions encountered and the information available during the said period of time. The scope of this Report and the services are accordingly factually limited by these circumstances.
Where assessments of works or costs identified in this Report are made, such assessments are based upon the information available at the time and where appropriate are subject to further investigations or information which may become available.
URS disclaim any undertaking or obligation to advise any person of any change in any matter affecting the Report, which may come or be brought to URS’ attention after the date of the Report.
Certain statements made in the Report that are not historical facts may constitute estimates, projections or other forward-looking statements and even though they are based on reasonable assumptions as of the date of the Report, such forward-looking statements by their nature involve risks and uncertainties that could cause actual results to differ materially from the results predicted. URS specifically does not guarantee or warrant any estimate or projections contained in this Report.
Unless otherwise stated in this Report, the assessments made assume that the sites and facilities will continue to be used for their current purpose without significant changes.
Copyright
© This Report is the copyright of URS Ireland Limited. Any unauthorised reproduction or usage by any person other than the addressee is strictly prohibited.

Diageo Ireland — Cooperage Well Pumping Test, St. James’ Gate Brewery
DIAGEO ST. JAMES’ GATE
IPPC Licence Register No. P0301-02 March 2014 FINAL
iv
TABLE OF CONTENTS EXECUTIVE SUMMARY ..................................................................... 2
1 INTRODUCTION ............................................................... 4
1.1 Background ...................................................................... 4
1.2 Location ............................................................................ 4
1.3 Scope of Study ................................................................. 4
1.4 Construction of Cooperage Well .................................... 5
1.5 Sources of Information.................................................... 6
2 BASELINE DATA .............................................................. 8
2.1 Groundwater levels .......................................................... 8
2.2 Groundwater Quality ....................................................... 8
3 HISTORIC PUMPING TESTS ......................................... 11
4 URS PUMPING TEST 2014 ............................................ 12
4.1 Objectives ....................................................................... 12
4.2 Pump Test Analysis ....................................................... 12
4.3 Predicted Drawdown at River Liffey ............................ 16
4.4 Predicted Impact on Surface water .............................. 17
4.5 Predicted Impact on Groundwater ............................... 17
5 FINDINGS AND RECOMMENDATIONS ........................ 19
5.1 Findings .......................................................................... 19
5.2 Recommendations ......................................................... 19

Diageo Ireland — Cooperage Well Pumping Test, St. James’ Gate Brewery
DIAGEO ST. JAMES’ GATE
IPPC Licence Register No. P0301-02 March 2014 FINAL
2
EXECUTIVE SUMMARY
URS Ireland Limited (URS) was commissioned by Diageo Ireland (Diageo) in December 2013, to undertake a pumping test on the disused on-site Cooperage Well at St. James’ Gate Brewery, Dublin. This work follows on from an assessment of the potential impact of abstracting from this well on controlled waters (surface water and groundwater) which was undertaken in March 2013
1.
Background
The pumping test was completed because Diageo is seeking to reduce its reliance on a mains water supply to the brewery, and to replace this with well supply.
The test was also completed in order to fulfil the requirements of Section 6.14.3 of the sites IPPC licence P0301-02, which indicates:
“The licensee shall carry out an investigation of the impact of the proposed abstraction from the Cooperage Well on-site prior to the commencement of abstraction (other than for the purpose of testing and evaluation). All potential impacts from the groundwater abstraction should be considered, in particular the potential impacts of the abstraction on the flow in the nearby rivers. The scope of the investigation shall be agreed by the Agency prior to implementation and shall include details concerning future water requirements/plan. Abstraction shall only commence subject to the agreement of the agency”
The March 2013 assessment of impact of abstracting was based on historic and recent information collected at the site. However, in order to fully address the above, it was recommended that a long term pumping test be completed to understand the impact – the pumping test could not be undertaken in March 2013 due to difficulties in discharging the large volumes of groundwater that would be generated during the test (a water treatment plant has since been constructed and commissioned at the site).
Summary and Findings
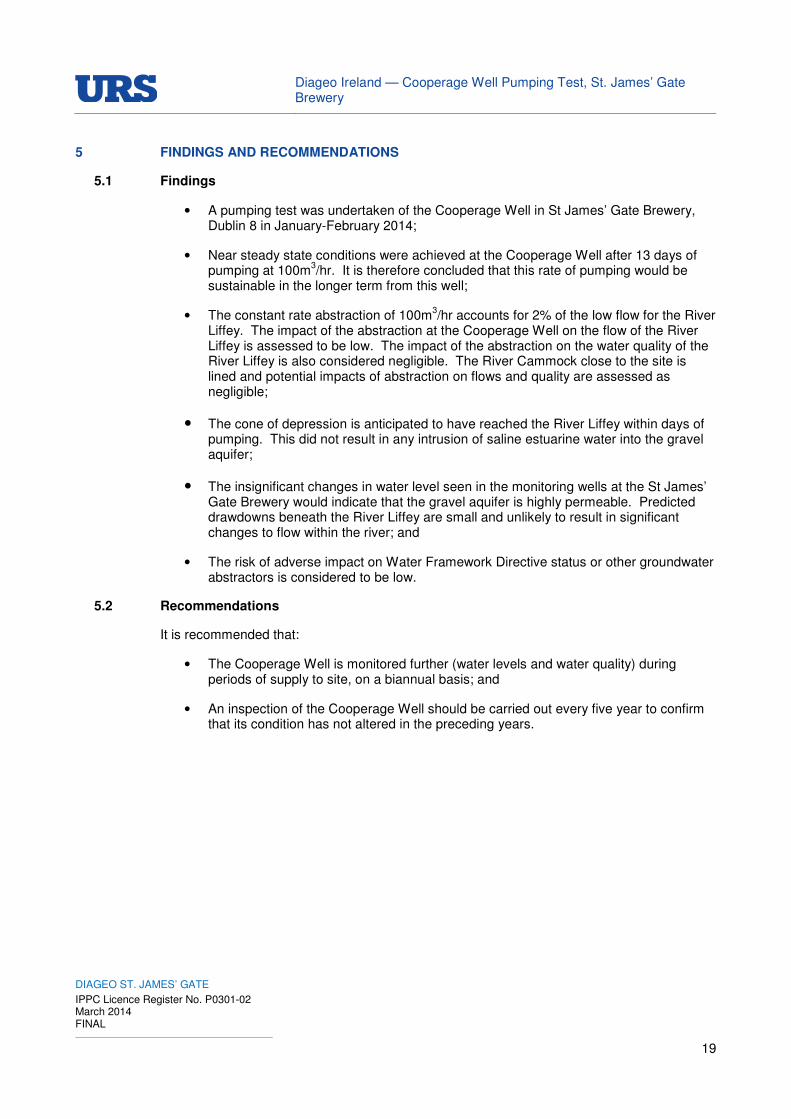
A pumping test was undertaken of the Cooperage Well in St James’ Gate Brewery, Dublin 8 in January-February 2014. The findings from the test are provided below:
• Near steady state conditions were achieved at the Cooperage Well after 13 days of pumping at 100m
3/hr. It is therefore concluded that this rate of pumping would be sustainable in the longer
term from this well;
• The constant rate abstraction of 100m3/hr accounts for 2% of the low flow for the River Liffey. The
impact of the abstraction at the Cooperage Well on the flow of the River Liffey is assessed to be low. The impact of the abstraction on the water quality of the River Liffey is also considered negligible.
• The River Cammock close to the site is lined and potential impacts of abstraction on flows and quality are assessed as negligible;
• The cone of depression is anticipated to have reached the River Liffey within days of pumping. This did not result in any intrusion of saline estuarine water into the gravel aquifer.
• Insignificant changes in water level seen in the monitoring wells at the St James’ Gate Brewery would indicate that the gravel aquifer is highly permeable. Predicted drawdowns beneath the River Liffey are small and unlikely to result in significant changes to flow within the river; and
1 URS Ireland Limited (2013) Impact Assessment on Controlled Waters”, report ref. 46402058, Issue 2, dated 19 March
2013.

Diageo Ireland — Cooperage Well Pumping Test, St. James’ Gate Brewery
DIAGEO ST. JAMES’ GATE
IPPC Licence Register No. P0301-02 March 2014 FINAL
3
• The risk of adverse impact on Water Framework Directive status or other groundwater abstractors is considered to be low.
It is noted that it would be possible to pump at a higher rate from the Cooperage Well than the 100 m3/hr
tested by the pumping test, given the permeability of the gravels. Historical data indicates that abstraction rates of 200-250 m
3/hour were sustained for periods of several months at times, albeit with significantly
higher drawdowns and with no assessment of any impacts on water quality. Therefore, it is not known what effect pumping at higher rates would have on water quality of the gravel aquifer, in terms of saline intrusion. Therefore, electrical conductivity (EC) monitoring of the surrounding wells should be completed if a higher pumping rate is required, in order to monitor if any saline intrusion takes place.
Recommendations
It is recommended that:
• The Cooperage Well is monitored further (water levels and water quality) during periods of supply to site, on a biannual basis; and
• An inspection of the Cooperage Well should be carried out every five year to confirm that its condition has not altered in the preceding years.

Diageo Ireland — Cooperage Well Pumping Test, St. James’ Gate Brewery
DIAGEO ST. JAMES’ GATE
IPPC Licence Register No. P0301-02 March 2014 FINAL
4
1 INTRODUCTION
URS Ireland Limited (URS) was commissioned by Diageo Ireland (Diageo) in December 2013, to undertake a pumping test on the disused on-site Cooperage Well at St. James’ Gate Brewery, Dublin. This work follows on from an assessment of the potential impact of abstracting from this well on controlled waters (surface water and groundwater) which was undertaken in March 2013
2.
1.1 Background
The pumping test was completed because Diageo is seeking to reduce its reliance on a mains water supply to the brewery, and to replace this with well supply.
The test was also completed in order to fulfil the requirements of Section 6.14.3 of the sites IPPC licence P0301-02, which indicates:
“The licensee shall carry out an investigation of the impact of the proposed abstraction from the Cooperage Well on-site prior to the commencement of abstraction (other than for the purpose of testing and evaluation). All potential impacts from the groundwater abstraction should be considered, in particular the potential impacts of the abstraction on the flow in the nearby rivers. The scope of the investigation shall be agreed by the Agency prior to implementation and shall include details concerning future water requirements/plan. Abstraction shall only commence subject to the agreement of the agency”
The potential impact of abstracting was based on historic and recent information collected at the site. However, in order to fully address the above, it was recommended that a long term pumping test be completed to understand the impact – such a pumping test could not be undertaken in March 2013 due to regulatory and volumetric difficulties in discharging the large volumes of groundwater that would be generated during the test either to municipal drains or to the River Liffey (a water treatment plant has since been constructed and commissioned at the site).
1.2 Location
The site is located at the St James’ Gate Brewery, Dublin 8 (the site). The location of the Cooperage Well is shown in Figure 1.
1.3 Scope of Study
The scope of the study included the following:
• Review of baseline data collected from wells in the area since 2006;
• Completion of a step test on the Cooperage Well, including measurement of groundwater levels and quality in surrounding wells; and
• Completion of a constant rate and a recovery test on the Cooperage Well, including measurement of groundwater levels and quality in surrounding wells.
2 URS Ireland Limited (2013) Impact Assessment on Controlled Waters”, report ref. 46402058, Issue 2, dated 19 March
2013.

Diageo Ireland — Cooperage Well Pumping Test, St. James’ Gate Brewery
DIAGEO ST. JAMES’ GATE
IPPC Licence Register No. P0301-02 March 2014 FINAL
5
The water level, electrical conductivity (EC) and temperature data was collected using in-situ Level-Conductivity-Temperature (LCT) probes that were placed in each well for the duration of the tests.
The assessment was completed by URS Hydrogeological teams in Ireland and the UK. The key skills of this team include groundwater resource assessment, catchment and aquifer management, groundwater quality and remediation, impact assessment and groundwater control and dewatering. The UK team is headed by Jane Sladen who is a Hydrogeologist and Chartered Civil Engineer with over 20 years’ experience in groundwater hydrology. Her expertise includes groundwater resource assessment, wellfield management, groundwater quality evaluation and pollution control, groundwater control and quarry, mine and construction site dewatering. She has been involved with projects addressing the requirements of the Water Framework Directive, Habitats Directive and other legislation, and has worked on low flow river augmentation and groundwater flooding projects.
1.4 Construction of Cooperage Well
The Cooperage Well was most probably constructed in three stages, as follows;
• 1880 - 3.1 m diameter well to 17.1 metres - inner and outer cast-iron caissons - narrower inner caisson below grating at approximately 3 metres (shown in red in drawing below);
• 1902 – 292 mm diameter tube was driven down below the dug well and proved increased supply available from the deeper strata (not shown); and
• 1903 - 762 mm diameter tube to 35.36 m and 660mm diameter bored well below to 56.99 metres below the former Cooperage yard floor level (this level is unknown and is not equivalent to the current Export Warehouse floor level).

Diageo Ireland — Cooperage Well Pumping Test, St. James’ Gate Brewery
DIAGEO ST. JAMES’ GATE
IPPC Licence Register No. P0301-02 March 2014 FINAL
6
(URS, 2011a)
The floor level of the current Export Warehouse has recently been levelled in to Ordnance Datum (OD) and is at an absolute level of 5.45 m above OD (m aOD). From this level, the base of Cooperage Well is at approximately -51 m aOD.
URS’ Downhole CCTV and Geophysical testing (Natural Gamma log) also indicated the top of bedrock (see Section 2.1) at 24 m below the Export Warehouse floor level or approximately -18 m aOD (URS, 2011a).
1.5 Sources of Information
The following sources of information were used in the preparation of this report;
• Minerex Limited (1982) “Potential of the Cooperage Well at Victoria Quay, Dublin”, dated 25
th June 1982, Minerex Ref. 205-39;
• O’Neill Groundwater Engineering (2001) Cooperage Well Report, dated 30th July
2001;
• URS (2010) Diageo St James’ Gate Cooperage Well, Assessment of the Development Potential of the Old Cooperage Well, dated 10
th June 2010, Draft Issue
No. 1 03082242/;
• URS (2011a) Diageo St James’ Gate Cooperage Well, Downhole CCTV & Geophysical Testing, MS Powerpoint presentation, dated 17th November 2011;

Diageo Ireland — Cooperage Well Pumping Test, St. James’ Gate Brewery
DIAGEO ST. JAMES’ GATE
IPPC Licence Register No. P0301-02 March 2014 FINAL
7
• URS (2011b) Diageo St James’ Gate Cooperage Well, Geophysical and CCTV survey of Cooperage Well, dated 7
th December 2011, Draft Issue No.1 46402057/;
• URS (2012) Cooperage Well Preliminary Risk Assessment, Issue No. 3 46402058, dated 24 October 2012;
• Groundwater level monitoring data from St James’ Gate Brewery site, November 2012 to January 2013 and December 2013 to February 2014;
• Groundwater quality monitoring data from St James’ Gate Brewery boreholes since 2006 (including the period of the 2014 pumping test);
• Marine Institute (2014) Digital Data Surface water levels and flow information for the River Liffey and Cammock River, December 2013 to February 2014; and
• Met Eireann (2014) Hourly rainfall data from the Phoenix Park December 2013 to February 2014.
In addition, publically available sources, principally from Environmental Protection Agency (EPA), Geological Survey of Ireland (GSI) (www.gsi.ie) and the Water Framework Directive in Ireland website (www.wfdireland.ie), have been used.

Diageo Ireland — Cooperage Well Pumping Test, St. James’ Gate Brewery
DIAGEO ST. JAMES’ GATE
IPPC Licence Register No. P0301-02 March 2014 FINAL
8
2 BASELINE DATA
2.1 Groundwater levels
The location of the various on-site groundwater monitoring wells is shown in Figure 1. The datum levels for these different boreholes are given in Table 1.
Table 1: Water Level Datum - St James’ Gate Brewery
Well locations Level (m above OD) Datum description
Cooperage Well 5.427
Top of temporary casing tube to house measurement probe
3
MW6 3.217 Top of casing
MW9 4.877 Top of casing
MW13 2.979 Top of casing
MW14a 6.192 Top of casing
MW23 5.327 Top of casing
The topographic elevations of borehole were re-surveyed in to OD on 19 January 2014.
The approximate distances of the following boreholes from the River Liffey are:
• MW6 is 30m;
• MW13 is 40m;
• MW23 is 80m;
• MW9 is 100m;
• MW14a is 110m;
• Cooperage Well is 120m; and
• MW8b is 160m.
The average water levels recorded in these boreholes running up to the start of the test (8 – 13 January 2014) and during the pumping tests are presented in Figure 2.
2.2 Groundwater Quality
Figure 3 and Table 2 below shows the pH and EC recorded in the boreholes during two tidal cycles in 2013 - 22 July and 6 August. The wells monitored during these tidal cycles were the Cooperage Well, MW13, MW06 and MW14a.
3 The in-situ water level/temperature/conductivity probe was placed in the Cooperage Well inside a 50mm diameter
plastic tube (16 m length) and securely anchored at surface, in order to avoid water turbulence during pumping.

Diageo Ireland — Cooperage Well Pumping Test, St. James’ Gate Brewery
DIAGEO ST. JAMES’ GATE
IPPC Licence Register No. P0301-02 March 2014 FINAL
9
Table 2: Water Quality Baseline - St James’ Gate Brewery
Location Parameter High Tide - 22/07/13
Low Tide - 22/07/13
High Tide - 06/08/13
Low Tide - 06/08/13
Cooperage
Well Time 11.20 16.45 12.00 17.00
Temperature (oC)
14.40 14.5 14.80 15.10
pH 7.03 7.31 6.83 7.25
EC (µS/cm) 1,158 1,171 775 771
Comments Clear, NEC, readings taken
from grab sample
Clear, NEC, readings taken
from grab sample
Clear, NEC, readings taken
from grab sample
Clear, NEC, readings taken
from grab sample
MW13 Time 11.35 17.20 12.15 18.00
Temperature (oC)
14.10 14.0 14.80 14.80
pH 6.98 7.31 7.07 7.14
EC (µS/cm) 1,999 2,525 1,914 2,714
Comments High turbidity, red in colour,
NEC
High turbidity, red in colour,
NEC
Moderate to high, turbidity, red in colour,
NEC
Moderate to high, turbidity, red in colour,
NEC MW06 Time 12.05 17.05 12.25 17.45
Temperature (oC)
15.04 15.40 15.50 16.40
pH 7.56 7.90 7.7 7.67
EC (µS/cm) 1,254 1,246 1,270 1,245
Comments Low to moderate turbidity
Slightly brown in colour
NEC
Low to moderate turbidity
Slightly brown in colour
NEC
Moderate to high turbidity, red in colour
NEC
High turbidity, red in colour,
NEC
MW14a Time 12.15 16.55 13.00 17.30
Temperature (oC)
14.00 14.10 13.70 15.50
pH 8.86 8.48 8.58 8.58
EC (µS/cm) 821 830 129.2 133.4
Comments Poor recharge; approximately 3 litres purged. High turbidity,
sandy/silty brown water.
Poor recharge; approximately 3 litres purged. High turbidity,
sandy/silty brown water.
Poor recharge; approximately 4 litres purged. High turbidity,
sandy/silty brown water.
Poor recharge; approximately 4 litres purged. High turbidity,
sandy/silty brown water.
The main observations from this data are as follows;
• The data shows very little variation between high and low tide in terms of pH and temperature;
• There was a slight variation in EC readings between high and low tide in some of the wells;

Diageo Ireland — Cooperage Well Pumping Test, St. James’ Gate Brewery
DIAGEO ST. JAMES’ GATE
IPPC Licence Register No. P0301-02 March 2014 FINAL
10
• The groundwater at MW14a near the Cammock River had a low EC reading indicating no tidal influence at this location; and
• The elevated EC reading in MW13 is likely to be due to the presence of iron in the groundwater as evidenced by the red colouration of the water observed during groundwater monitoring - the explanation for this feature is most probably due to the water in this borehole having been confined by peat (identified in the drilling log for this well) and becoming anoxic i.e. reduced conditions and with iron being present in the Fe
2+ form. By drilling through the peat layer, air is introduced into the system and
the iron gets converted to Fe3+
form (‘red’ ochre material). The presence of high amounts of iron in suspension may affect the EC readings seen in this monitoring well during the pump test.
The EC was also recorded in these boreholes in advance of the pumping tests (8 – 14 January 2014) and is provided in Figure 3. The average daily EC observed between 8 and 13 January 2014 was within the range of conductivities observed during the tidal cycles on 22 July 2013 and 6 August 2013 (both sets of EC data are shown in Figure 3).
Table 3: Electrical Conductivity Readings – Cooperage Well, St. James’ Gate Brewery
Date Average Daily EC (µS/cm)
08/01/14 (part day)
985
09/01/14 985
10/01/14 990
11/01/14 1,005
12/01/14 1,018
13/01/14 1,021

Diageo Ireland — Cooperage Well Pumping Test, St. James’ Gate Brewery
DIAGEO ST. JAMES’ GATE
IPPC Licence Register No. P0301-02 March 2014 FINAL
11
3 HISTORIC PUMPING TESTS
The Cooperage Well has been test pumped on a number of occasions in the past. A summary from two reports prepared by Minerex (1982) and O’Neill Groundwater Engineering (2001) containing details of historic pumping tests is provided below:
• Minerex (1982) – A step test (6 hours) and constant rate test (3 days) was undertaken in 1981-82. The step test was undertaken at two rates; 136-272 m
3/hr and 272-408
m3/hr on 6 October 1981. Each step was run for approximately 3 hours. The
drawdown for each step after 150 minutes was 1.26m and 2.45m respectively. The rate of 136 m
3/hr was chosen for the constant rate pumping test (3 days). This took
place between 23 March and 26 March 1982. There was some influence from the storage of Cooperage Well on the early stage results, but by the end of the test, well levels were declining at a rate of 1.2m per log cycle (i.e. between day 3 and day 30).
• O’Neill Groundwater Engineering (2001) – An operational test was undertaken on 27th April 2001, along with CCTV borehole monitoring. The maximum and minimum water levels in the Cooperage Well were recorded over an 84 minute period. The drawdown observed over this period was 1.23m with a pumping rate of 273 m
3/hr.
The Specific Capacity (defined as the rate of discharge of a well per unit drawdown, expressed as m
3/d/m or m
2/d) was calculated as 5,321 m
2/d.

Diageo Ireland — Cooperage Well Pumping Test, St. James’ Gate Brewery
DIAGEO ST. JAMES’ GATE
IPPC Licence Register No. P0301-02 March 2014 FINAL
12
4 URS PUMPING TEST 2014
4.1 Objectives
The objectives of the pumping test were to:
• Evaluate hydrogeological conditions and maximum well capacity of the gravel aquifer;
• Further refinement of the site hydrogeology conceptual model in order to inform the impacts on the River Liffey; and
• Determine whether the operation of the Cooperage Well causes saline intrusion into the gravel aquifer.
4.2 Pump Test Analysis
The step, constant rate and recovery test time/drawdown data was analysed using Aquifer Win32. The software was developed by Environmental Simulations International, UK and is the preferred package used by the UK Environment Agency.
Step Test
URS carried out a calibration test on 13 January 2014, followed by a step test on the 15 January 2014. The specification used is provided in Appendix A.1.
During the step test, there were four 100 minute steps:
• Step 1 – 10:10 (70 m3/hr)
• Step 2 – 11:50 (100 m3/hr)
• Step 3 – 13:30 (130 m3/hr)
• Step 4 – 15:10 (170 m3/hr)
The step test was completed at 16:55 and the Cooperage Well was allowed to recover for 16 hours.
The flow rates were recorded using a sonic flow meter installed between the Cooperage Well and the treatment plant.
The results of the step test are presented in Figure 4. The cumulative drawdown in the test well over the test period was approximately 1m. Figure 5 shows the specific capacity versus drawdown plot for the Cooperage Well and indicates that a well yield of 100 m
3/hr is a
sustainable abstraction rate. The specific capacity of the Cooperage Well is estimated to be 150m
2/hr, or 3,600m
2/d. This is somewhat lower than the previous estimate of 5,321m
2/d (see
Section 3).
The drawdown vs. time data of the three steps within the step test was analysed. The transmissivity and well efficiency were determined using the Eden and Hazel method. The drawdown is accounted for by head loss within the formation and head loss due to the well. The drawdown is related to the formation head loss and well losses by the following expression:

Diageo Ireland — Cooperage Well Pumping Test, St. James’ Gate Brewery
DIAGEO ST. JAMES’ GATE
IPPC Licence Register No. P0301-02 March 2014 FINAL
13
2CQbHaQs ++=
Where s is the drawdown [m]
Q is the abstraction rate [m3/d]
a is a formation coefficient [d/m2]
b is a formation coefficient [d/m2]
C is the non-linear well loss coefficient [d2/m
5]
H is a parameter which is related to the sum of Q and log time [d/m3xlog(d)]
The transmissivity and turbulent head loss constants are as follows:
Transmissivty, T = 2608 m2/d
Turbulent head loss, C = 5.7x10⁻⁸
d2/m
5
Parameter, a = -3x10⁻⁴
d/m2
Parameter, b = 7x10⁻⁵
d/m2
The estimated head loss due to non-linear effects is given by CQ2. At a pumping rate of
170m3/hr, and a drawdown of 1.2m, the non-linear head loss is estimated to be 0.95m or 79%
of the drawdown. This is a similar non-linear head loss calculated by Minerex (1982), which estimated 67% at a pumping rate of 136m
3/hr. The poor efficiency is likely to be due to the
presence of the caisson, which may act as a barrier to groundwater flow. The well efficiency has no bearing on the study, but will provide a useful baseline for well performance over time.
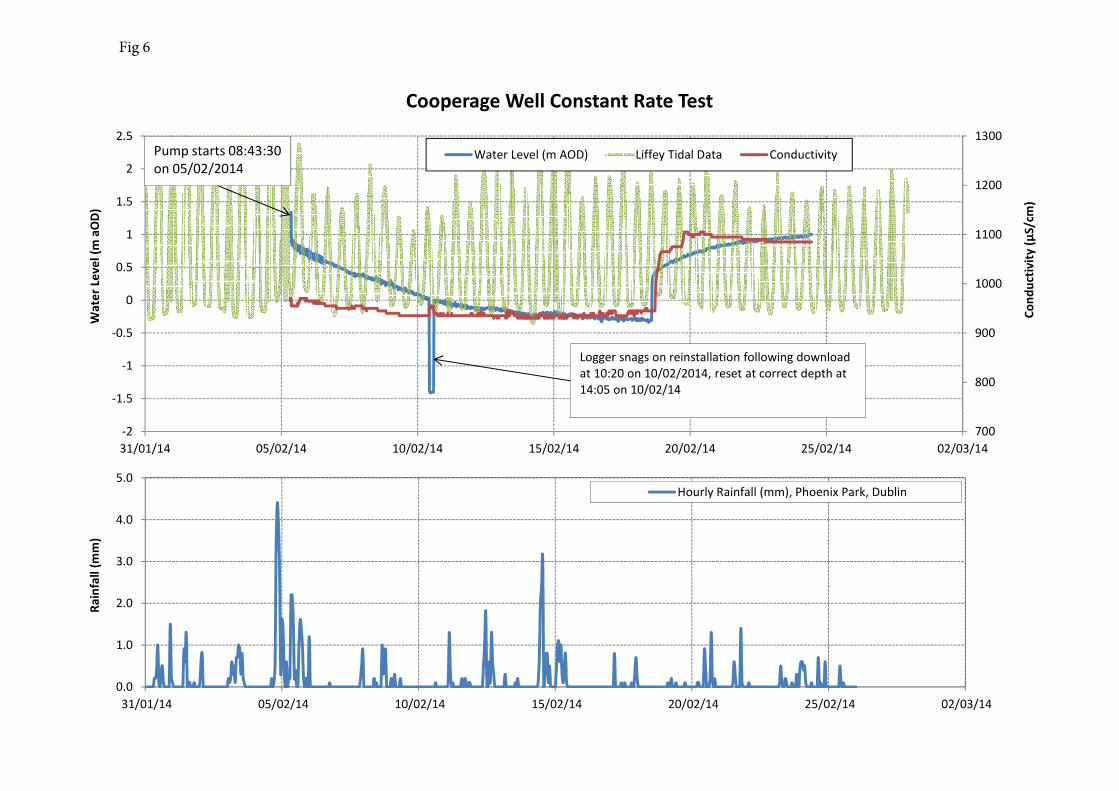
Constant Rate Test
During the constant rate test, the Cooperate well was pumped at a flow rate of 100 m3/hr for a
period of thirteen days. The results of this test are presented in Figures 6 to 11.
After thirteen days of pumping a near steady state was reached. A drawdown of approximately 1.6m was measured in the Cooperage Well. Drawdowns of 1m, 0.6m, 0.9m, 1m and 0.8m were measured in monitoring wells MW6, MW9, MW13, MW14a and MW23, respectively. A peak in rainfall was noted at the beginning of the test with a decline in rainfall during the test. Recovery to pre-test levels was not achieved and drawdowns are likely in part to be due to reductions in rainfall as the test proceeded. If the recovery levels are taken as rest level then drawdowns are 1.3m in the Cooperage Well and 0.2m - 0.4m in the monitoring wells.
The response in groundwater levels to pumping is similar in all wells, which indicates that the water table during pumping is relatively flat and that the gravels have a high permeability. However, the drawdown in MW6 and MW13 could also be affected by the presence of the river wall. The river wall may act as a barrier to flow increasing the drawdown in these wells.
MW14a shows the clearest relationship between rainfall and groundwater level with the changes in EC corresponding with peaks in rainfall level. However, the variations in EC are small and vary between 80µs/cm and 160µs/cm.
Tidal influence can be clearly seen in MW6, MW9, MW13 and MW23. However, the fluctuations are less than 0.1m. This is compared with a tidal range in the River Liffey of 1.5-

Diageo Ireland — Cooperage Well Pumping Test, St. James’ Gate Brewery
DIAGEO ST. JAMES’ GATE
IPPC Licence Register No. P0301-02 March 2014 FINAL
14
2.5m, again suggesting limited hydraulic connectivity to the river. There is a small increase in the EC within MW6 during the pumping test, indicating that there is at least partial interaction between the gravel aquifer and the River Liffey. The high EC within MW13 is consistent with previous observations made (see Section 2.2), and is likely to be as a result of the oxidation of iron. As expected, the groundwater level within MW13 responded in a similar way to water levels in MW6.
After thirteen days of pumping the EC levels in MW9 and MW23 do not show signs of saline intrusion. There is a small increase in the EC within MW6, however, the increase is only approximately 300µs/cm, and not a sufficient rise to indicate that saline intrusion is occurring.
The Neuman, Theis and Cooper-Jacob methods for an unconfined aquifer were used to estimate the transmissivity and storativity of the gravel aquifer. The transmissivity and storativity are reported in Table 4 below. The transmissivity ranges between 414m
2/d and
864m2/d, and the storage coefficient between 5x10
-5 and 0.063. The curve matches are
presented in Appendix A.2.
Table 4: Aquifer Properties based on Constant Rate Test – St James’ Gate Brewery
Well
Cooper & Jacob, 1946 (Straight Line Method)
Theis, 1935 (unconfined approximation)
Neuman, 1972 (unconfined aquifer)
Transmissivity (m
2/d)
Storage Coefficient
Transmissivity (m
2/d)
Storage Coefficient
Transmissivity (m
2/d)
Storage Coefficient
Cooperage Well 464 432 432
MW6 656 0.026 572 0.037 527 0.013
MW9 857 0.024 864 0.026 785 0.011
MW13 414 0.058 435 0.068 464 0.015
MW14a 418 0.073 482 0.069 466 0.00008
MW23 745 0.051 645 0.068 511 0.075
Groundwater quality sampling was undertaken in the Cooperage Well five times during day 1 and on days 2, 3, 6, 8, 10, 12 and 13. The results are presented in Table 5 below. With the exception of manganese, all determinands show little variation during the constant rate test. The manganese concentrations in the Cooperage Well approximately doubled during the test. Groundwater sampling results from the Cooperage Well and EC monitoring in the nearby monitoring wells during the test indicate that saline intrusion from the River Liffey to the gravel aquifer is unlikely to occur to any significant extent at an extraction rate of 100m
3/day.
Table 5: Selected Water Quality Parameters from the Cooperage Well – St James’ Gate Brewery
COOPERAGE WELL
Parameter End of day
(EoD) 1 EoD8 EoD10 EoD13
EC@20°C (µS/cm) 1,170 1,113 1,133 1,148
pH 7.93 7.81 7.27 7.51
Temperature °C 13.4 13.2 13.4 13.5
Alkalinity as CaCO3 (mg/l CaCO3) <1 <1 <1 <1
Bicarbonate Alkalinity as CaCO3 285 306 300 309

Diageo Ireland — Cooperage Well Pumping Test, St. James’ Gate Brewery
DIAGEO ST. JAMES’ GATE
IPPC Licence Register No. P0301-02 March 2014 FINAL
15
COOPERAGE WELL
Parameter End of day
(EoD) 1 EoD8 EoD10 EoD13
(mg/l)
Chloride (mg/l Cl) 98.8 93.9 93.5 93.9
Fluoride (mg/l Fl) <0.3 <0.3 <0.3 <0.3
Sulphate mg/l 119.67 112.31 109.4 106.12
Nitrate (mg/l N) 33.1 25.4 24.6 23.6
Nitrite (mg/l N) <0.02 <0.02 <0.02 <0.02
ortho-Phosphate (mg/l P) 0.04 <0.03 <0.03 <0.03
Ammoniacal Nitrogen as N (mg/l N) 0.17 0.2 0.22 0.24
Dissolved Calcium (mg/l) 131 123.3 120.6 116.9
Dissolved Iron (µg/l) <20 <20 <20 <20
Dissolved Magnesium (mg/l) 17.8 17 16.8 17.3
Dissolved Manganese (µg/l) 167 295 301 309
Dissolved Potassium (mg/l) 8.3 8.2 7.9 7.9
Dissolved Sodium (mg/l) 90.1 91.1 96 96.2
Total Iron (mg/l) <20 <20 <20 <20
Total Manganese (mg/l) 185 297 307 316
Turbidity NTU 0.3 0.7 0.9 0.9
Groundwater quality data collected during the pumping test is summarised in Appendix A.3. Laboratory reports are provided in Appendix B.
Recovery Test
The results of the recovery test are presented in Figures 6 to 11. The recovery groundwater levels are lower than the pre-test level. This is likely to be due to the peak rainfall level at the beginning of the constant rate test.
The transmissivities for the Cooperage Well and monitoring wells are presented in Table 6 below and range between 688m
2/d and 3,320m
2/d. The transmissivities estimated from the
recovery test are higher than the transmissivities determined from the constant rate test (414m
2/d to 864m
2/d), but are in a similar order of magnitude.
Table 6: Aquifer Properties from Recovery Test – St James’ Gate Brewery
Well
Theis, 1946 (Recovery)
Transmissivity (m
2/d)
Cooperage Well 781
MW6 1,217
MW9 3,320
MW13 1,379
MW14a 688

Diageo Ireland — Cooperage Well Pumping Test, St. James’ Gate Brewery
DIAGEO ST. JAMES’ GATE
IPPC Licence Register No. P0301-02 March 2014 FINAL
16
Well
Theis, 1946 (Recovery)
Transmissivity (m
2/d)
MW23 1,559
4.3 Predicted Drawdown at River Liffey
The drawdowns measured within monitoring wells MW6, MW8b, MW9, MW13, MW14a and MW23, as shown in Figures 6 - 11, are in the same order of magnitude. The flat water table during pumping indicates that the gravel is highly permeable. Pumping test analysis gave a transmissivity range of between 414m
2/d and 3,320m
2/d, with an average of 869m
2/d, at these
monitoring wells.
Evidence from CCTV survey (O’Neill, 2001) of the Cooperage Well indicates that the Cooperage Well primarily abstracts water from the gravel aquifer. Assuming that all flow is within the gravel aquifer, the saturated aquifer thickness has been estimated from borehole logs and the pre-constant rate water level in the Cooperage Well. A saturated aquifer thickness of the gravel aquifer is estimated to be 17m. Based on the transmissivity range estimated from the pumping test and the saturated aquifer thickness, then the hydraulic conductivity of the gravel aquifer is likely to be in the range 24m/d and 195m/d (with an average of 51m/day).
Using the Dupuit-Thiem equation it is possible to estimate the drawdown at the River Liffey under steady state conditions. The Dupuit-Thiem equation is given as:
( )
−=
1
2
2
1
2
2
log3.2r
r
hhKQ π
Where Q is discharge [m3/d]
K is hydraulic conductivity [m/d]
r is radius [m]
h is hydraulic head [m]
The permeability of the gravel formation can be estimated by using the discharge rate of 100m
3/hr, or 2,400m
3/d, and drawdowns at each well. Radius r1 is set to be the radius of
Cooperage Well (1.5m), at which the drawdown is 1.28m and the hydraulic head at the pumping well is therefore 15.72m. Radius r2 is set as the distance to each monitoring well. The hydraulic heads, h2, and modelled permeabilities for each monitoring well are presented in Table 7.
Table 7: Model Parameters and Estimated Permeabilities for Monitoring Wells – St James’ Gate Brewery
MODEL PARAMETERS

Diageo Ireland — Cooperage Well Pumping Test, St. James’ Gate Brewery
DIAGEO ST. JAMES’ GATE
IPPC Licence Register No. P0301-02 March 2014 FINAL
17
Monitoring Well
Modelled Permeability
m/d
h1
m
h2
m
r1
m
r2
m
Q
m3/d
MW6 135 15.72 16.52 1.5 147 2,400
MW9 110 15.72 16.86 1.5 293 2,400
MW13 130 15.72 16.58 1.5 164 2,400
MW14a 145 15.72 16.44 1.5 112 2,400
MW23 120 15.72 16.62 1.5 160 2,400
The modelled permeability of the gravel aquifer ranges between 110m/d and 145m/d. The modelled permeability lies within the range calculated from the pumping test (permeability = transmissivity/aquifer saturated thickness). Applying this permeability range, the predicted drawdown at the River Liffey is estimated to be between 0.2m and 0.5m.
4.4 Predicted Impact on Surface water
The pumping test carried out at an abstraction rate of 100 m3/hr indicates that this yield is
sustainable in the long term.
Comparing flow rate at the Cooperage Well with river flow measurements, 100 m3/hr
represents approximately 2% of 95% flow for the River Liffey. As the proposed abstraction rate is only 2% of this low flow rate of the River Liffey, the impact of the abstraction on river flows is considered to be low. Moreover, the pumping test indicates that the interaction between the River Liffey and the gravel aquifer is limited, as evidenced by the response to pumping in MW6 and MW14a compared with the other monitoring wells, the absence of significant salinity increases in monitoring wells close to the Liffey during the test and the small predicted drawdown at the River Liffey. The abstraction is therefore predicted to have a negligible effect on the water quality of the River Liffey.
The River Cammock is culverted within the vicinity of the site and interaction with groundwater will not take place. This is evidenced by monitoring well MW14a showing a similar response to pumping as MW23 and MW9 located furthest away from the River Cammock. Abstraction at the Cooperage well is predicted to have a negligible effect on the flows and the water quality of the River Cammock due to the presence of the culvert, though the ribbon gravels around the Cammock may provide some flow towards the Cooperage Well.
4.5 Predicted Impact on Groundwater
The constant rate pumping test undertaken by URS achieved near steady state conditions after 13 days of pumping.
The abstraction has resulted in relatively small and insignificant effects on the groundwater levels and flows within the gravel aquifer. In particular, the steady state drawdowns below the River Liffey are only estimated to be between 0.3m to 0.5m.
The cone of depression is anticipated to have reached the River Liffey within days of pumping. This did not result in any intrusion of saline estuarine water into the gravel aquifer, as observed in the monitoring wells on the St James’ Gate Brewery site.

Diageo Ireland — Cooperage Well Pumping Test, St. James’ Gate Brewery
DIAGEO ST. JAMES’ GATE
IPPC Licence Register No. P0301-02 March 2014 FINAL
18
Finally, it is noted that there are no other groundwater users within the immediate vicinity of the abstraction well.
It is noted that it would be possible to pump at a higher rate from the Cooperage Well than the 100 m
3/hr tested by the pumping test, given the permeability of the gravels. Historical data
indicates that abstraction rates of 200-250 m3/hour were sustained for periods of several
months at times, albeit with significantly higher drawdowns and with no assessment of any impacts on water quality. Therefore, it is not known what effect pumping at higher rates would have on water quality of the gravel aquifer, in terms of saline intrusion. Therefore, EC monitoring of the surrounding wells should be completed if a higher pumping rate is required, in order to monitor if any saline intrusion takes place.
Diageo Ireland — Cooperage Well Pumping Test, St. James’ Gate Brewery
DIAGEO ST. JAMES’ GATE
IPPC Licence Register No. P0301-02 March 2014 FINAL
19
5 FINDINGS AND RECOMMENDATIONS
5.1 Findings
• A pumping test was undertaken of the Cooperage Well in St James’ Gate Brewery, Dublin 8 in January-February 2014;
• Near steady state conditions were achieved at the Cooperage Well after 13 days of pumping at 100m
3/hr. It is therefore concluded that this rate of pumping would be
sustainable in the longer term from this well;
• The constant rate abstraction of 100m3/hr accounts for 2% of the low flow for the River
Liffey. The impact of the abstraction at the Cooperage Well on the flow of the River Liffey is assessed to be low. The impact of the abstraction on the water quality of the River Liffey is also considered negligible. The River Cammock close to the site is lined and potential impacts of abstraction on flows and quality are assessed as negligible;
• The cone of depression is anticipated to have reached the River Liffey within days of pumping. This did not result in any intrusion of saline estuarine water into the gravel aquifer;
• The insignificant changes in water level seen in the monitoring wells at the St James’ Gate Brewery would indicate that the gravel aquifer is highly permeable. Predicted drawdowns beneath the River Liffey are small and unlikely to result in significant changes to flow within the river; and
• The risk of adverse impact on Water Framework Directive status or other groundwater abstractors is considered to be low.
5.2 Recommendations
It is recommended that:
• The Cooperage Well is monitored further (water levels and water quality) during periods of supply to site, on a biannual basis; and
• An inspection of the Cooperage Well should be carried out every five year to confirm that its condition has not altered in the preceding years.

Diageo Ireland — Cooperage Well Pumping Test, St. James’ Gate Brewery
DIAGEO ST. JAMES’ GATE
IPPC Licence Register No. P0301-02 March 2014 FINAL
20
FIGURES

410/411 Q House, 76 Furze Road, Sandyford, Dublin 18.Tel: +353 (1) 293 3200 Fax: +353 (1) 293 3201
PROJECT
CLIENT
DRAWING TITLE
DRAWN TRACED CHECKED APPROVED
SML SF SF/DUBSCALE DRG NO.
DATE
REV
AS SHOWN
FEB 2013
46402058
FIGURE 1 _ IPPC GROUNDWATER MONITORINGWELL LOCATIONS
PRIVATE AND CONFIDENTIAL
NOTES
N
APPROXIMATE SCALE (m)
0m 250m
Site Boundary
Cooperage Well
DIAGEO IRELAND
IMPACT ASSESSMENT OFCONTROLLED WATERS
IPPC Groundwater Monitoring Well
MW14aMW14aMW14a
MW5aMW5aMW5a
MW6aMW6aMW6a MW6MW6MW6
MW15MW15MW15
MW13MW13MW13MW20MW20MW20
MW21MW21MW21
MW22MW22MW22
MW10MW10MW10MW23MW23MW23
MW9MW9MW9
MW8bMW8bMW8b
MW8MW8MW8MW8cMW8cMW8c
MW12MW12MW12
MW3MW3MW3
MW2MW2MW2
MW4MW4MW4
MW1aMW1aMW1aMW1MW1MW1
MW7MW7MW7
Fig 1

500
600
700
800
900
1000
1100
1200
1300
1400
1500
-2
-1
0
1
2
3
4
5
Ele
ctri
cal
Co
nd
uct
ivit
y
Wa
ter
Lev
el
(m a
OD
) a
nd
Ra
infa
ll (
mm
)Cooperage Well pump test - Hydrometric data
Calculated SWL (m AOD) - during calibration, step test, dewatering period and constant rate test
Phoenix Park, Dublin Hourly Rainfall (mm)
River Liffey tidal gauge water level (m AOD)
Electrical Conductivity
Calibration test commenced at
12:15, pumping at approx 52 m3/hr,
@ 14:15 increase flow to maximum
rate; flow approx. 176 m3/hr; pump
for approx 5 minutes at this rate,
turn off pump at c. 14:20
RWE started
pump for step
test at approx
07:15
Pumping for constant
rate test starts at
08:43:30 on 05/02/2014
Logger snags on
reinstallation following
download at 10:20 on
10/02/2014, reset at
correct depth at 14:05
on 10/02/14
Fig 2

0
0.5
1
1.5
2
2.5
3
3.5
4
4.5
5
0
500
1000
1500
2000
2500
3000
21/07/2013 26/07/2013 31/07/2013 05/08/2013 10/08/2013
Td
ie L
ev
el
Co
nd
uct
ivit
y (µ
S/c
m)
Cooperage Well MW13 MW6 MW14a Tidal Data
EC measured
8-13/1/2014
Electrical Conductivity and tidal levels during two tidal cycles in 2013
0
5
10
15
20
25
21/07/2013 26/07/2013 31/07/2013 05/08/2013 10/08/2013
Ra
infa
ll (
mm
)
Daily Rainfall at Dublin Airport
Fig 3

-1
-0.5
0
0.5
1
1.5
2
2.5
15/01/14 00:00 15/01/14 04:48 15/01/14 09:36 15/01/14 14:24 15/01/14 19:12 16/01/14 00:00 16/01/14 04:48
Wa
ter
Lev
el
(m A
OD
)
Cooperage Well Step Test
Liffey Tidal Data Water Level (m AOD)
0.0
1.0
2.0
3.0
4.0
5.0
15/01/14 00:00 15/01/14 04:48 15/01/14 09:36 15/01/14 14:24 15/01/14 19:12 16/01/14 00:00 16/01/14 04:48
Ra
infa
ll (
mm
)
Hourly Rainfall (mm), Phoenix Park, Dublin
Fig 4

0
50
100
150
200
250
300
350
0 0.2 0.4 0.6 0.8 1 1.2
Sp
eci
fic
Ca
pa
city
(m
3/d
.hr)
Drawdown (m)
Specific Capacity vs Drawdown
Fig 5
31848sc
Typewritten Text
700
800
900
1000
1100
1200
1300
-2
-1.5
-1
-0.5
0
0.5
1
1.5
2
2.5
31/01/14 05/02/14 10/02/14 15/02/14 20/02/14 25/02/14 02/03/14
Co
nd
uct
ivit
y (
µS
/cm
)
Wa
ter
Lev
el
(m a
OD
)Cooperage Well Constant Rate Test
Water Level (m AOD) Liffey Tidal Data ConductivityPump starts 08:43:30
on 05/02/2014
Logger snags on reinstallation following download
at 10:20 on 10/02/2014, reset at correct depth at
14:05 on 10/02/14
0.0
1.0
2.0
3.0
4.0
5.0
31/01/14 05/02/14 10/02/14 15/02/14 20/02/14 25/02/14 02/03/14
Ra
infa
ll (
mm
)
Hourly Rainfall (mm), Phoenix Park, Dublin
Fig 6

0
200
400
600
800
1000
1200
1400
-1
-0.5
0
0.5
1
1.5
2
2.5
3
3.5
31/01/14 05/02/14 10/02/14 15/02/14 20/02/14 25/02/14 02/03/14
Co
nd
uct
ivit
y (
µS
/cm
)
Wa
ter
Lev
el
(m A
OD
)Constant Rate Test MW6
Water Level (m AOD) Liffey Tidal Data Conductivity
Pump starts 08:43:30
on 05/02/2014
0.0
1.0
2.0
3.0
4.0
5.0
31/01/14 05/02/14 10/02/14 15/02/14 20/02/14 25/02/14 02/03/14
Ra
infa
ll (
mm
)
Hourly Rainfall (mm), Phoenix Park, Dublin
Fig 7

0
500
1000
1500
2000
2500
3000
-1
-0.5
0
0.5
1
1.5
2
2.5
3
31/01/14 05/02/14 10/02/14 15/02/14 20/02/14 25/02/14 02/03/14
Co
nd
uct
ivit
y (µ
S/c
m)
Wa
ter
Lev
el
(m A
OD
)Constant Rate Test MW9
Water Level (m AOD) Liffey Tidal Data Conductivity (uS/cm)
Pump starts 08:43:30
on 05/02/2014
0.0
1.0
2.0
3.0
4.0
5.0
31/01/14 05/02/14 10/02/14 15/02/14 20/02/14 25/02/14 02/03/14
Ra
infa
ll (
mm
)
Hourly Rainfall (mm), Phoenix Park, Dublin
Fig 8

0
1000
2000
3000
4000
5000
6000
7000
-1
-0.5
0
0.5
1
1.5
2
2.5
3
3.5
31/01/14 05/02/14 10/02/14 15/02/14 20/02/14 25/02/14 02/03/14
Co
nd
uct
ivit
y (µ
S/c
m)
Wa
ter
Lev
el
(m A
OD
)
Constant Rate Test MW13
Water Level (m AOD) Liffey Tidal Data Conductivity (uS/cm)
Low-flow purging carried out to take pH
readings - 24 cm change in head following
installation of low flow tubing, 3 mm
drawdown noted after low-flow purgePump starts
08:43:30
on 05/02/2014
0.0
1.0
2.0
3.0
4.0
5.0
31/01/14 05/02/14 10/02/14 15/02/14 20/02/14 25/02/14 02/03/14
Ra
infa
ll (
mm
)
Hourly Rainfall (mm), Phoenix Park, Dublin
Fig 9

0
20
40
60
80
100
120
140
160
180
-1
-0.5
0
0.5
1
1.5
2
2.5
3
3.5
31/01/14 05/02/14 10/02/14 15/02/14 20/02/14 25/02/14 02/03/14
Co
nd
uct
ivit
y (µ
S/c
m)
Wa
ter
Lev
el
(m A
OD
)Constant Rate Test MW14a
Liffey Tidal Data Water Level (m AOD) Conductivity
0.0
1.0
2.0
3.0
4.0
5.0
31/01/14 05/02/14 10/02/14 15/02/14 20/02/14 25/02/14 02/03/14
Ra
infa
ll (
mm
)
Hourly Rainfall (mm), Phoenix Park, Dublin
Fig 10

0
50
100
150
200
250
-1
-0.5
0
0.5
1
1.5
2
2.5
3
3.5
31/01/14 05/02/14 10/02/14 15/02/14 20/02/14 25/02/14 02/03/14
Co
nd
uct
ivit
y (µ
S/c
m)
Wa
ter
Lev
el
(m A
OD
)Constant Rate Test MW23
Liffey Tidal Data Water Level (m AOD) Conductivity (uS/cm)
0.0
1.0
2.0
3.0
4.0
5.0
31/01/14 05/02/14 10/02/14 15/02/14 20/02/14 25/02/14 02/03/14
Ra
infa
ll (
mm
)
Hourly Rainfall (mm), Phoenix Park, Dublin
Fig 11

Diageo Ireland — Cooperage Well Pumping Test, St. James’ Gate Brewery
DIAGEO ST. JAMES’ GATE
IPPC Licence Register No. P0301-02 March 2014 FINAL
21
APPENDIX A 1 SPECIFICATION FOR PUMP TESTING OF COOPERAGE WELL 2 AQUIFER TEST FIGURES 3 GROUNDWATER QUALITY SUMMARY TABLE

Diageo, Dublin
Specification for Pump Testing of Cooperage Well
1 Introduction
1.1 Purpose
This document provides a specification for the test pumping at Diageo, Dublin. The
test pumping is intended to:
• determine the transmissivity and storativity of the Gravel;
• evaluate the sustainable abstraction rate of Cooperage Well; and
• determine the interaction of the cone of depression created by Cooperage Well
and the River Liffey.
As currently understood, the site conditions of geology, hydrogeology and aquifer
properties are described, followed by a detailed specification for the proposed works.
The site geology comprises Made Ground, overlying Gravel and Limestone.
1.2 Scope of works
This specification provides details of a pumping test designed to determine the
hydraulic properties of the Gravel formation beneath the site and to assess the
interaction between the cone of depression and the River Liffey boundary.
The scope of works for the monitoring and testing programme include:
• Undertake pre-test monitoring;
• Conduct calibration test;
• Conduct step tests;
• Conduct constant rate test;
• Conduct recovery test; and
• Undertake post-test monitoring.
The objectives of the study are to address the following aspects:
• Hydrogeological conditions and maximum well capacity of the Gravel.
• Further refinement of the site hydrogeology conceptual model in order to
inform the impacts on the River Liffey.
App A.1

• Determine whether the operation of Cooperage Well causes saline intrusion
into the Gravel aquifer.
All water quality and groundwater level monitoring will be undertaken by URS.
Where URS has responsibility for monitoring they are clearly stated. All other
activities are the responsibility of the contractor. Engineer refers to a representative of
URS.
1.3 Site Conditions
1.3.1 Geology
Based on geotechnical investigation boreholes drilled in February 2006 the geology is
comprised of sand and gravels to about 20m, or -18m AOD, which is immediately
underlain by the limestone bedrock.
The materials encountered during the site investigation comprise:
• Made Ground
• Alluvium (including Peat)
• Sands
• Gravels
• Limestone
1.3.2 Hydrogeology
There is likely to be good hydraulic continuity between the River Liffey and the
gravel deposits. The Gravel aquifer is likely to be in hydraulic continuity with the
underlying Limestone. The groundwater level is approximately 3m below the ground
surface or 0.5 metres above ordnance datum (m AOD).
2 Specification - Pump Testing
2.1 Pumping Test
The purpose of the test pumping is to inform the impacts of the operation of
Cooperage Well on the River Liffey and groundwater quality of the Gravel aquifer.
All procedures and equipment shall comply with the British Standard Code of
Practice for test pumping of boreholes unless otherwise stated (BS ISO 14686: 2003).

The well head shall include flow control valves and pressure gauges, which shall be in
good working order and approved by the Engineer prior to installation. One stainless
steel sample tap shall be included in the well head.
The abstraction borehole will be fitted with a dipping access tube (of sufficient size to
house a pressure transducer) and securely anchored at surface. The position of this
dipping access tube shall not be changed during the test pumping unless prior
permission is obtained from the Engineer.
The measurement of discharge rate shall be by both a metering device installed in the
delivery pipe. A continuous record of pumped discharge shall be maintained by the
Contractor for both flow measuring devices.
2.1.1 Test Pumping Programme
The pumping test shall comprise:
• Calibration Test
• Groundwater Monitoring
• Step test
• Constant rate test
• Recovery test
2.1.2 Calibration Test
A calibration test shall be carried out before commencement of the step test and shall
involve a period of pumping during which the flow control valve is calibrated and all
equipment checked. Calibration tests are not required between the step and constant
rate test. The duration of pumping is expected to be no more than 2 hours or as
directed by the Engineer. A rest period of 12 hours to achieve substantial recovery of
water levels shall follow calibration testing as directed by the Engineer.
2.1.3 Interruptions during Test Pumping
Should interruptions occur to any of the pumping tests the failed test shall be repeated
in full after a suitable waiting period for recovery to be decided by the Engineer.
2.1.4 Dippers and Stop watches

URS shall ensure a sufficient number of well dippers /and or data loggers to undertake
the monitoring of water levels required by the specification. Dippers shall have a
minimum length of tape of 30m with centimetre and metre graduations. . Manually
dipped water level measurements shall be taken at the beginning and at the end of
each test cycle (Table 3). In addition to monitoring groundwater level the dippers
shall monitor electrical conductivity and temperature. The electrical conductivity and
temperature shall be measured for each cycle of the test (see Tables 4-5) and at the
same time and frequency as the test being undertaken.
2.1.5 Barometric Pressure and Tide Level
The barometric pressure and tide level shall be measured for each cycle of the test
(see Tables 4-5) and at the same time and frequency as the test being undertaken. The
tide level should be measured to the same datum, time and frequency as the
groundwater level measurements.
2.1.6 Pre and Post-pumping procedure
URS shall measure the rest groundwater levels in MW6, MW7, MW9, MW13,
MW14 and MW23 for a period of (at a minimum) 7 days prior to and 7 days post
calibration, step, constant, and recovery test using pressure transducers. The
frequency of measurement shall be every 30 minutes. The wells shall be dipped
manually at the beginning and end of the monitoring periods.
2.1.7 Groundwater Level/ Water Quality Monitoring Locations
The following table provides the locations of boreholes to be monitored for
groundwater level, electrical conductivity and temperature during the tests. Loggers
shall be installed in all specified boreholes prior to the commencement of works.
Monitoring wells MW7, MW9 and MW23 are in addition to that presented in the
proposal. MW7 and MW23 are required to monitor intermediate response and to
enable the calculation of transmissivity and storativity. MW9 is required as a control
borehole to enable the effects of the tide to be removed from groundwater level
monitoring.
Table 3 Monitoring Locations (See Figure 1)
Borehole Location
Monitoring Method During each Test Cycle
Pre-
Monitoring
Step
Test
Constant
Rate Test
Recover
Test
Post-
Monitoring
MW6 Logger logger logger Logger logger

Borehole Location
Monitoring Method During each Test Cycle
MW7 Logger logger logger Logger logger
MW9 Logger logger logger Logger logger
MW13 Logger logger logger Logger logger
MW14 Logger logger logger Logger logger
MW23 Logger logger logger Logger logger
2.1.8 Step Test
The Step Drawdown Test shall consist of 4 steps at 100 minutes each with increasing
rates of discharge with rates of 50, 100, 150, and 200m3/hr. The water level in the test
well and in observation wells shall be monitored using the monitoring frequency
outlined in Table 4. The control valve shall be adjusted for each step in accordance
with the settings defined during the Calibration Test.
The step test shall be undertaken consecutively with a rest period of at least 12 hours
at the end of the test to achieve full recovery of the water level in the borehole, as
directed by the Engineer.
Table 4. Groundwater monitoring frequency
Time Readings
Prior to start Once
0 – 5 min Every 10 sec
5 – 10 min Every 30 sec
10 – 100 min Every 5 min
Recovery Frequency as above for
as long as recovery lasts
2.1.9 Constant Rate test
The Constant Rate test shall be conducted at a constant pumping rate for a period of
10 days. The actual rate and duration will be decided by the Engineer. The duration
will depend upon the criteria being to reach steady state conditions, i.e. a steady
groundwater level equivalent to a steady pumping rate.

The rate of discharge shall be monitored and maintained at a constant level
throughout the test. The rate of discharge shall be constant to an accuracy of five
percent. The water level in the test well and in observation wells shall be monitored
using the monitoring frequency outlined in Table 5.
On cessation of pumping, water level recovery shall be monitored for a period of at
least 12 hours using the monitoring frequency outlined in Table 5. If at this time, the
level has not reached rest level as measured at the start of the test, then monitoring
shall continue until this is achieved or as directed by the Engineer.
Table 5. Groundwater monitoring frequency
Time Readings
Prior to start Once
0 – 5 min Every 10 sec
5 - 10 min Every 30 sec
10 – 60 min Every 5 min
60 – 240 min Every 15 min
240 – 480 min Every 30 min
480 min to
completion
Every hour (by Logger)
Recovery Frequency as above for
as long as recovery lasts
2.1.10 Test pumps and ancillary equipment
1. The Contractor shall provide two test pumps (one duty within the abstraction
well, and one standby, but maintained on site) of a type and dimensions such
that it can be accommodated within the inside diameter casing. The clearance
between the pump to be installed and the casing shall be such that it allows the
installation of the 'dip access tube' for the accurate measurement of water
levels.
2. The attention of the Contractor is drawn to the following requirements:
- The pump shall be of sufficient size to allow discharges up to
200m3/hr.
- A non-return valve shall be fitted below the test pump.
- An approved valve shall be provided in the discharge pipework to
permit flow control.

- An approved pressure gauge shall be installed upstream of the flow
control valve.
2.1.11 Disposal of discharged waters
1. The Contractor shall ensure that all pipelines where required are watertight
and sufficient for any discharges to be pumped. The diameter of the pipe shall
be of sufficient size to allow the discharge of 200m3/hr. The contractor shall
be responsible for the discharge and all necessary permits.
2.1.12 Factual Report - Requirements
URS/Contractor shall include
• Date of test, location and pumping test operational diagram.
• Drawdown measurements, time of measurement and flow rate.
• Background data, including tidal information
• Any interruptions to pump operation;
• As stated in Section 2.1.5 the barometric pressure and tide level shall be
measured and reported for each cycle of the test , starting at the same time
(preferably on the hour or half hour) and at the same frequency as the test
being undertaken;
• All reference points (datums) for tide level and groundwater level
measurement.
It is critical for the analysis of the collected information that all data are collected to
the same relative datum, time and frequency, i.e. all measurements on a frequency of
30 minutes start on the hour or at 30 minutes past the hour. All groundwater level
observations, barometric and tidal data recorded during the pump test shall be made
available in an Excel format, to be agreed with the Engineer.

Cooperage Well Step Test
App A.2


Recovery Analysis
Cooperage Well

Monitoring Well 6

Monitoring Well 9
Tidal
influence

Monitoring Well 13

Monitoring Well 14a

Monitoring Well 23

Constant Rate Test
Cooperage Well – Cooper & Jacob, 1946 (Straight Line Method)
Cooperage Well – Theis, 1935 (unconfined approximation)

Cooperage Well – Neuman, 1972 (unconfined aquifer)
Monitoring Well 6 – Cooper & Jacob, 1946 (Straight Line Method)

Monitoring Well 6 – Theis, 1935 (unconfined approximation)
Rainfall has
caused water
levels to increase
on the 5th
February

Monitoring Well 6 – Neuman, 1972 (unconfined aquifer)
Monitoring Well 9 – Cooper & Jacob, 1946 (Straight Line Method)

Monitoring Well 9 – Theis, 1935 (unconfined approximation)
Monitoring Well 9 – Neuman, 1972 (unconfined aquifer)

Monitoring Well 13 – Cooper & Jacob, 1946 (Straight Line Method)
Monitoring Well 13 – Theis, 1935 (unconfined approximation)

Monitoring Well 13 – Neuman, 1972 (unconfined aquifer)
Monitoring Well 14a – Cooper & Jacob, 1946 (Straight Line Method)

Monitoring Well 14a – Theis, 1935 (unconfined approximation)
Monitoring Well 14a – Neuman, 1972 (unconfined aquifer)

Monitoring Well 23 – Cooper & Jacob, 1946 (Straight Line Method)
Monitoring Well 23 – Theis, 1935 (unconfined approximation)

Monitoring Well 23 – Neuman, 1972 (unconfined aquifer)

Day 8 Day 12 Day 13
Determinand Units Sample 1 Sample 2 Sample 3 Sample 4 Duplicate 12:15 16:15 16:40 10:30 12:20
Dissolved Calcium # mg/l 135.2 135.3 138.5 135.2 132.7 122.7 131 124.1 123.3 120.6 116.9
Total Dissolved Iron # ug/l <20 <20 <20 <20 <20 <20 <20 <20 <20 <20 <20 200
Dissolved Magnesium # mg/l 17.7 18 18.3 18 17.5 17.4 17.8 16.8 17 16.8 17.3
Dissolved Manganese # ug/l 96 124 157 194 153 260 167 238 295 301 309 50
Dissolved Potassium # mg/l 8.4 8.2 8.4 8.2 8.4 7.9 8.3 8 8.2 7.9 7.9
Dissolved Sodium # mg/l 89.7 92.1 95.2 94.9 91.7 94.7 90.1 89.5 91.1 96 96.2 200
Total Iron ug/l 28 <20 <20 63 <20 <20 <20 <20 <20 <20 <20 200
Total Manganese ug/l 98 125 165 198 165 261 185 253 297 307 316 50
Fluoride mg/l <0.3 <0.3 <0.3 <0.3 <0.3 <0.3 <0.3 <0.3 <0.3 <0.3 <0.3 2
Sulphate # mg/l 132.76 132.3 133.43 131.95 134.07 112.21 119.67 116.28 112.31 109.4 106.12 250
Chloride # mg/l 96.8 101.3 101 94 98.8 96.6 98.8 94.5 93.9 93.5 93.9 250
Nitrate as NO3 # mg/l 32.9 31.4 30.3 29.4 30.1 29 33.1 26.1 25.4 24.6 23.6 50
Nitrite as NO2 # mg/l <0.02 <0.02 <0.02 <0.02 <0.02 <0.02 <0.02 <0.02 <0.02 <0.02 <0.02 1
Ortho Phosphate as PO4 mg/l 0.03 0.04 0.05 0.04 <0.03 0.04 0.04 0.04 <0.03 <0.03 <0.03
Ammoniacal Nitrogen as N # mg/l 0.11 0.13 0.14 0.16 0.14 0.2 0.17 0.19 0.2 0.22 0.24
Carbonate Alkalinity as CaCO3 mg/l <1 <1 <1 <1 <1 <1 <1 <1 <1 <1 <1
Bicarbonate Alkalinity as CaCO3 mg/l 328 314 326 321 328 334 285 307 306 300 309
Enterococci* CFU/100ml 2 <1 <1 <1 1 0
Escherichia Coli* CFU/100ml 1 1 1 <1 1 0
Turbidity NTU 0.4 0.2 0.3 0.2 0.2 0.5 0.3 0.8 0.7 0.9 0.9
Cooperage Well WQA data from step test and
constant rate testWQS (2007
EC drinking
water
standards)
07/02/2014 - Constant
Rate Test15/01/2014 - Step Test
10/02/2014 - PT,
CRT QA/QC
12/02/2014 - Pump Test, Constant Rate
Test
App A.3

Diageo Ireland — Cooperage Well Pumping Test, St. James’ Gate Brewery
DIAGEO ST. JAMES’ GATE
IPPC Licence Register No. P0301-02 March 2014 FINAL
22
APPENDIX B LABORATORY TEST REPORTS

Unit 3 Deeside Point
Zone 3
Deeside Industrial Park
Deeside
URS
Attention :
Date :
Your reference :
Our reference :
Location :
Date samples received :
Status :
Issue :
Bob Millward BSc FRSC
Principal Chemist
1
Jones Environmental Laboratory
CH5 2UA
Tel: +44 (0) 1244 833780
Fax: +44 (0) 1244 833781
Sinead Fitzpatrick
410/411 Q House
76 Furze Road
Sandyford
Dublin 18
Ireland
Five samples were received for analysis on 17th January, 2014. Please find attached our Test Report which should be read with notes at the end of
the report and should include all sections if reproduced. Interpretations and opinions are outside the scope of any accreditation, and all results relate
only to samples supplied.
All analysis is carried out on as received samples and reported on a dry weight basis unless stated otherwise. Results are not surrogate corrected.
Kim Mills
Project Co-ordinator
24th January, 2014
CWPT
SJG
17th January, 2014
Final report
Compiled By:
Test Report 14/1884 Batch 1
QF-PM 3.1.1 v14Please include all sections of this report if it is reproduced
All solid results are expressed on a dry weight basis unless stated otherwise. 1 of 6

Client Name: Report : Liquid
Reference:
Location:
Contact: Liquids/products: V=40ml vial, G=glass bottle, P=plastic bottle
JE Job No.: 14/1884 H=H2SO4, Z=ZnAc, N=NaOH, HN=HN03
J E Sample No. 1-3 4-6 7-9 10-12 13-15
Sample ID CWPT_ST1 CWPT_ST2 CWPT_ST3 CWPT_ST4 CWPT_ST_DUP
Depth
COC No / misc
Containers H HN P H HN P H HN P H HN P H HN P
Sample Date 15/01/2014 15/01/2014 15/01/2014 15/01/2014 15/01/2014
Sample Type Ground Water Ground Water Ground Water Ground Water Ground Water
Batch Number 1 1 1 1 1
Date of Receipt 17/01/2014 17/01/2014 17/01/2014 17/01/2014 17/01/2014
Dissolved Calcium # 135.2 135.3 138.5 135.2 132.7 <0.2 mg/l TM30/PM14
Total Dissolved Iron # <20 <20 <20 <20 <20 <20 ug/l TM30/PM14
Dissolved Magnesium # 17.7 18.0 18.3 18.0 17.5 <0.1 mg/l TM30/PM14
Dissolved Manganese # 96 124 157 194 153 <2 ug/l TM30/PM14
Dissolved Potassium # 8.4 8.2 8.4 8.2 8.4 <0.1 mg/l TM30/PM14
Dissolved Sodium # 89.7 92.1 95.2 94.9 91.7 <0.1 mg/l TM30/PM14
Total Iron 28 <20 <20 63 <20 <20 ug/l TM30/PM14
Total Manganese 98 125 165 198 165 <2 ug/l TM30/PM14
Fluoride <0.3 <0.3 <0.3 <0.3 <0.3 <0.3 mg/l TM27/PM0
Sulphate # 132.76 132.30 133.43 131.95 134.07 <0.05 mg/l TM38/PM0
Chloride # 96.8 101.3 101.0 94.0 98.8 <0.3 mg/l TM38/PM0
Nitrate as NO3 # 32.9 31.4 30.3 29.4 30.1 <0.2 mg/l TM38/PM0
Nitrite as NO2 # <0.02 <0.02 <0.02 <0.02 <0.02 <0.02 mg/l TM38/PM0
Ortho Phosphate as PO4 0.03 0.04 0.05 0.04 <0.03 <0.03 mg/l TM38/PM0
Ammoniacal Nitrogen as N # 0.11 0.13 0.14 0.16 0.14 <0.03 mg/l TM38/PM0
Carbonate Alkalinity as CaCO3 <1 <1 <1 <1 <1 <1 mg/l TM75/PM0
Bicarbonate Alkalinity as CaCO3 328 314 326 321 328 <1 mg/l TM75/PM0
Enterococci* 2 <1 <1 <1 1 CFU/100ml Subcontracted
Escherichia Coli* 1 1 1 <1 1 CFU/100ml Subcontracted
Turbidity 0.4 0.2 0.3 0.2 0.2 <0.1 NTU TM34/PM0
SJG
Sinead Fitzpatrick
Please see attached notes for all
abbreviations and acronyms
LOD UnitsMethod
No.
Jones Environmental Laboratory
URS
CWPT
QF-PM 3.1.2 v10Please include all sections of this report if it is reproduced
All solid results are expressed on a dry weight basis unless stated otherwise. 2 of 6

Notification of Deviating Samples
Matrix : Liquid
J E
Job
No.
Batch Depth J E Sample
No.Analysis Reason
Please note that only samples that are deviating are mentioned in this report. If no samples are listed it is because none were deviating.
Only analyses which are accredited are recorded as deviating if set criteria are not met.
Location: SJG
Contact: Sinead Fitzpatrick
Sample ID
Jones Environmental Laboratory
Client Name: URS
Reference: CWPT
QF-PM 3.1.11 v3 Please include all sections of this report if it is reproduced 3 of 6

JE Job No.:
SOILS
DEVIATING SAMPLES
SURROGATES
NOTE
Surrogate compounds are added during the preparation process to monitor recovery of analytes. However low recovery in soils is often due to peat,
clay or other organic rich matrices. For waters this can be due to oxidants, surfactants, organic rich sediments or remediation fluids. Acceptable
limits for most organic methods are 70 - 130% and for VOCs are 50 - 150%. When surrogate recoveries are outside the performance criteria but
the associated AQC passes this is assumed to be due to matrix effect. Results are not surrogate corrected.
Data is only accredited when all the requirements of our Quality System have been met. In certain circumstances where the requirements have not
been met, the laboratory may issue the data in an interim report but will remove the accreditation, in this instance results should be considered
indicative only. Where possible samples will be re-extracted and a final report issued with accredited results. Please do not hesitate to contact the
laboratory if further details are required of the circumstances which have led to the removal of accreditation.
It is assumed that you have taken representative samples on site and require analysis on a representative subsample. Stones will generally be
included unless we are requested to remove them.
UKAS accreditation applies to surface water and groundwater and one other matrix which is analysis specific, any other liquids are outside our
scope of accreditation
As surface waters require different sample preparation to groundwaters the laboratory must be informed of the water type when submitting samples.
Samples must be received in a condition appropriate to the requested analyses. All samples should be submitted to the laboratory in suitable
containers with sufficient ice packs to sustain an appropriate temperature for the requested analysis. If this is not the case you will be informed and
any test results that may be compromised highlighted on your deviating samples report.
Where appropriate please make sure that our detection limits are suitable for your needs, if they are not, please notify us immediately.
Please note we are not a Drinking Water Inspectorate (DWI) Approved Laboratory . It is important that detection limits are carefully considered
when requesting water analysis.
If you have not already done so, please send us a purchase order if this is required by your company.
All analysis is reported on a dry weight basis unless stated otherwise. Results are not surrogate corrected. Samples are dried at 35°C ±5°C unless
otherwise stated. Moisture content for CEN Leachate tests are dried at 105°C ±5°C.
Where Mineral Oil or Fats, Oils and Grease is quoted, this refers to Total Aliphatics C10-C40.
Where a CEN 10:1 ZERO Headspace VOC test has been carried out, a 10:1 ratio of water to wet (as received) soil has been used.
NOTES TO ACCOMPANY ALL SCHEDULES AND REPORTS
Please note we are only MCERTS accredited for sand, loam and clay and any other matrix is outside our scope of accreditation.
Where Mineral Oil or Fats, Oils and Grease is quoted, this refers to Total Aliphatics C10-C40.
14/1884
WATERS
Where an MCERTS report has been requested, you will be notified within 48 hours of any samples that have been identified as being outside our
MCERTS scope. As validation has been performed on clay, sand and loam, only samples that are predominantly these matrices, or combinations
of them will be within our MCERTS scope. If samples are not one of a combination of the above matrices they will not be marked as MCERTS
accredited.
All samples will be discarded one month after the date of reporting, unless we are instructed to the contrary. If we are instructed to keep samples, a
storage charge of £1 (1.5 Euros) per sample per month will be applied until we are asked to dispose of them.
QF-PM 3.1.9 v25Please include all sections of this report if it is reproduced
All solid results are expressed on a dry weight basis unless stated otherwise. 4 of 6

JE Job No.:
#
B
DR
M
NA
NAD
ND
NDP
SS
SV
W
+
++
*
CO
OC
NFD
Analysis subcontracted to a Jones Environmental approved laboratory.
Calibrated against a single substance.
No Determination Possible
ABBREVIATIONS and ACRONYMS USED
No Asbestos Detected.
None Detected (usually refers to VOC and/SVOC TICs).
UKAS accredited.
No Fibres Detected
Result outside calibration range, results should be considered as indicative only and are not accredited.
Results expressed on as received basis.
Surrogate recovery outside performance criteria. This may be due to a matrix effect.
Dilution required.
Indicates analyte found in associated method blank.
Not applicable
MCERTS accredited.
AQC failure, accreditation has been removed from this result, if appropriate, see 'Note' on previous page.
Outside Calibration Range
Suspected carry over
14/1884
QF-PM 3.1.9 v25Please include all sections of this report if it is reproduced
All solid results are expressed on a dry weight basis unless stated otherwise. 5 of 6

JE Job No: 14/1884
Test Method No. Description
Prep Method
No. (if
appropriate)
Description UKAS
MCERTS
(soils
only)
Analysis done
on As Received
(AR) or Air Dried
(AD)
Reported on
dry weight
basis
TM27In-House method based on USEPA 9056. Analysis of samples using a Dionex Ion-
Chromatograph instrument.PM0 No preparation is required.
TM30
Trace Metal elements by ICP-OES (Inductively Coupled Plasma - Optical Emission
Spectrometry) using Thermo iCAP 6000 series instrument. Accredited to ISO 17025 for
soils and waters and MCERTS accredited for Soils. All accreditation is matrix specific.
PM14
In-house method based on USEPA 3005A. Acid digestion of water samples and
analsyis by ICP-OES as per method TM030W.ISO 17025 accredited extraction method.
All accreditation is matrix specific
Yes
TM34 Turbidity by Turbidimeter PM0 No preparation is required.
TM38Ionic analysis using the Thermo Aquakem Photometric Automatic Analyser. Accredited
to ISO17025 and MCERTS for most analytes. All accreditation is matrix specific.PM0 No preparation is required.
TM38Ionic analysis using the Thermo Aquakem Photometric Automatic Analyser. Accredited
to ISO17025 and MCERTS for most analytes. All accreditation is matrix specific.PM0 No preparation is required. Yes
TM75 Alkalinity by Metrohm PM0 No preparation is required.
Subcontracted Subcontracted analysis, sent to an ISO 17025 accredited laboratory where possible.
Jones Environmental Laboratory Method Code Appendix
QF-PM 3.1.10 v13 Please include all sections of this report if it is reproduced 6 of 6

Unit 3 Deeside Point
Zone 3
Deeside Industrial Park
Deeside
URS
Attention :
Date :
Your reference :
Our reference :
Location :
Date samples received :
Status :
Issue :
Bob Millward BSc FRSC
Principal Chemist
2
Jones Environmental Laboratory
CH5 2UA
Tel: +44 (0) 1244 833780
Fax: +44 (0) 1244 833781
Sinead Fitzpatrick
410/411 Q House
76 Furze Road
Sandyford
Dublin 18
Ireland
Registered Address : Unit 3 Deeside Point, Zone 3, Deeside Industrial Park, Deeside, CH5 2UA. UK
Seven samples were received for analysis on 7th February, 2014. Please find attached our Test Report which should be read with notes at the end
of the report and should include all sections if reproduced. Interpretations and opinions are outside the scope of any accreditation, and all results
relate only to samples supplied.
All analysis is carried out on as received samples and reported on a dry weight basis unless stated otherwise. Results are not surrogate corrected.
Paul Lee-Boden BSc
Project Manager
20th February, 2014
47092620
SJG
7th February, 2014
Final report
Compiled By:
Test Report 14/2629 Batch 1
QF-PM 3.1.1 v15Please include all sections of this report if it is reproduced
All solid results are expressed on a dry weight basis unless stated otherwise. 1 of 5

Client Name: Report : Liquid
Reference:
Location:
Contact: Liquids/products: V=40ml vial, G=glass bottle, P=plastic bottle
JE Job No.: 14/2629 H=H2SO4, Z=ZnAc, N=NaOH, HN=HN03
J E Sample No. 1-3 4-6 7-9 10-12 13-15 16-18 19-21
Sample ID CWPT_CRTD1_08:50 CWPT_CRTD1_10:50 CWPT_CRTD1_12:50 CWPT_CRTD1_14:50 CWPT_CRTD1_16:10 CWPT_CRTD1_DUP CWPT_CRTD2_13:20
Depth
COC No / misc
Containers H HN P H HN P H HN P H HN P H HN P H HN P H HN P
Sample Date 05/02/2014 05/02/2014 05/02/2014 05/02/2014 05/02/2014 05/02/2014 06/02/2014
Sample Type Ground Water Ground Water Ground Water Ground Water Ground Water Ground Water Ground Water
Batch Number 1 1 1 1 1 1 1
Date of Receipt 07/02/2014 07/02/2014 07/02/2014 07/02/2014 07/02/2014 07/02/2014 07/02/2014
Dissolved Calcium # 137.4 132.1 134.2 134.6 135.8 132.8 133.0 <0.2 mg/l TM30/PM14
Total Dissolved Iron # <20 <20 <20 <20 <20 <20 <20 <20 ug/l TM30/PM14
Dissolved Magnesium # 17.0 16.7 16.8 16.8 17.0 16.9 17.0 <0.1 mg/l TM30/PM14
Dissolved Manganese # 56 95 108 124 128 123 158 <2 ug/l TM30/PM14
Dissolved Potassium # 8.7 8.6 8.6 8.5 8.8 8.9 8.9 <0.1 mg/l TM30/PM14
Dissolved Sodium # 87.0 89.7 90.5 88.7 90.6 92.3 91.2 <0.1 mg/l TM30/PM14
Total Iron 42 <20 <20 <20 <20 <20 22 <20 ug/l TM30/PM14
Total Manganese 62 96 114 124 132 128 162 <2 ug/l TM30/PM14
Fluoride <0.3 <0.3 <0.3 <0.3 <0.3 <0.3 <0.3 <0.3 mg/l TM27/PM0
Sulphate # 129.68 127.42 129.74 130.28 129.22 129.38 129.81 <0.05 mg/l TM38/PM0
Chloride # 97.7 96.9 96.0 97.0 97.1 97.7 99.1 <0.3 mg/l TM38/PM0
Nitrate as NO3 # 17.8 24.7 35.9 14.7 34.8 35.2 20.9 <0.2 mg/l TM38/PM0
Nitrite as NO2 # <0.02 <0.02 <0.02 <0.02 <0.02 <0.02 <0.02 <0.02 mg/l TM38/PM0
Ortho Phosphate as PO4 0.03 0.06 0.03 0.03 0.05 0.07 0.04 <0.03 mg/l TM38/PM0
Ammoniacal Nitrogen as N # 0.06 0.11 0.12 0.13 0.12 0.13 0.15 <0.03 mg/l TM38/PM0
Carbonate Alkalinity as CaCO3 <1 <1 <1 <1 <1 <1 <1 <1 mg/l TM75/PM0
Bicarbonate Alkalinity as CaCO3 334 309 358 359 330 334 332 <1 mg/l TM75/PM0
Enterococci* <1 9 4 2 2 <1 <1 <1 MPN/100ml Subcontracted
Escherichia Coli* <1 31 8 9 8 11 12 <1 MPN/100ml Subcontracted
Turbidity 0.7 0.4 0.6 1.0 0.6 1.5 0.3 <0.1 NTU TM34/PM0
SJG
Sinead Fitzpatrick
Please see attached notes for all
abbreviations and acronyms
LOD UnitsMethod
No.
Jones Environmental Laboratory
URS
47092620
QF-PM 3.1.2 v10Please include all sections of this report if it is reproduced
All solid results are expressed on a dry weight basis unless stated otherwise. 2 of 5

JE Job No.:
SOILS
DEVIATING SAMPLES
SURROGATES
NOTE
Surrogate compounds are added during the preparation process to monitor recovery of analytes. However low recovery in soils is often due to peat,
clay or other organic rich matrices. For waters this can be due to oxidants, surfactants, organic rich sediments or remediation fluids. Acceptable
limits for most organic methods are 70 - 130% and for VOCs are 50 - 150%. When surrogate recoveries are outside the performance criteria but
the associated AQC passes this is assumed to be due to matrix effect. Results are not surrogate corrected.
Data is only accredited when all the requirements of our Quality System have been met. In certain circumstances where the requirements have not
been met, the laboratory may issue the data in an interim report but will remove the accreditation, in this instance results should be considered
indicative only. Where possible samples will be re-extracted and a final report issued with accredited results. Please do not hesitate to contact the
laboratory if further details are required of the circumstances which have led to the removal of accreditation.
It is assumed that you have taken representative samples on site and require analysis on a representative subsample. Stones will generally be
included unless we are requested to remove them.
UKAS accreditation applies to surface water and groundwater and one other matrix which is analysis specific, any other liquids are outside our
scope of accreditation
As surface waters require different sample preparation to groundwaters the laboratory must be informed of the water type when submitting samples.
Samples must be received in a condition appropriate to the requested analyses. All samples should be submitted to the laboratory in suitable
containers with sufficient ice packs to sustain an appropriate temperature for the requested analysis. If this is not the case you will be informed and
any test results that may be compromised highlighted on your deviating samples report.
Where appropriate please make sure that our detection limits are suitable for your needs, if they are not, please notify us immediately.
Please note we are not a Drinking Water Inspectorate (DWI) Approved Laboratory . It is important that detection limits are carefully considered
when requesting water analysis.
If you have not already done so, please send us a purchase order if this is required by your company.
All analysis is reported on a dry weight basis unless stated otherwise. Results are not surrogate corrected. Samples are dried at 35°C ±5°C unless
otherwise stated. Moisture content for CEN Leachate tests are dried at 105°C ±5°C.
Where Mineral Oil or Fats, Oils and Grease is quoted, this refers to Total Aliphatics C10-C40.
Where a CEN 10:1 ZERO Headspace VOC test has been carried out, a 10:1 ratio of water to wet (as received) soil has been used.
NOTES TO ACCOMPANY ALL SCHEDULES AND REPORTS
Please note we are only MCERTS accredited for sand, loam and clay and any other matrix is outside our scope of accreditation.
Where Mineral Oil or Fats, Oils and Grease is quoted, this refers to Total Aliphatics C10-C40.
14/2629
WATERS
Where an MCERTS report has been requested, you will be notified within 48 hours of any samples that have been identified as being outside our
MCERTS scope. As validation has been performed on clay, sand and loam, only samples that are predominantly these matrices, or combinations
of them will be within our MCERTS scope. If samples are not one of a combination of the above matrices they will not be marked as MCERTS
accredited.
All samples will be discarded one month after the date of reporting, unless we are instructed to the contrary. If we are instructed to keep samples, a
storage charge of £1 (1.5 Euros) per sample per month will be applied until we are asked to dispose of them.
QF-PM 3.1.9 v25Please include all sections of this report if it is reproduced
All solid results are expressed on a dry weight basis unless stated otherwise. 3 of 5

JE Job No.:
#
B
DR
M
NA
NAD
ND
NDP
SS
SV
W
+
++
*
CO
OC
NFD
Analysis subcontracted to a Jones Environmental approved laboratory.
Calibrated against a single substance.
No Determination Possible
ABBREVIATIONS and ACRONYMS USED
No Asbestos Detected.
None Detected (usually refers to VOC and/SVOC TICs).
UKAS accredited.
No Fibres Detected
Result outside calibration range, results should be considered as indicative only and are not accredited.
Results expressed on as received basis.
Surrogate recovery outside performance criteria. This may be due to a matrix effect.
Dilution required.
Indicates analyte found in associated method blank.
Not applicable
MCERTS accredited.
AQC failure, accreditation has been removed from this result, if appropriate, see 'Note' on previous page.
Outside Calibration Range
Suspected carry over
14/2629
QF-PM 3.1.9 v25Please include all sections of this report if it is reproduced
All solid results are expressed on a dry weight basis unless stated otherwise. 4 of 5

JE Job No: 14/2629
Test Method No. Description
Prep Method
No. (if
appropriate)
Description UKAS
MCERTS
(soils
only)
Analysis done
on As Received
(AR) or Air Dried
(AD)
Reported on
dry weight
basis
TM27In-House method based on USEPA 9056. Analysis of samples using a Dionex Ion-
Chromatograph instrument.PM0 No preparation is required.
TM30
Trace Metal elements by ICP-OES (Inductively Coupled Plasma - Optical Emission
Spectrometry) using Thermo iCAP 6000 series instrument. Accredited to ISO 17025 for
soils and waters and MCERTS accredited for Soils. All accreditation is matrix specific.
PM14
In-house method based on USEPA 3005A. Acid digestion of water samples and
analsyis by ICP-OES as per method TM030W.ISO 17025 accredited extraction method.
All accreditation is matrix specific
TM30
Trace Metal elements by ICP-OES (Inductively Coupled Plasma - Optical Emission
Spectrometry) using Thermo iCAP 6000 series instrument. Accredited to ISO 17025 for
soils and waters and MCERTS accredited for Soils. All accreditation is matrix specific.
PM14
In-house method based on USEPA 3005A. Acid digestion of water samples and
analsyis by ICP-OES as per method TM030W.ISO 17025 accredited extraction method.
All accreditation is matrix specific
Yes
TM34 Turbidity by Turbidimeter PM0 No preparation is required.
TM38Ionic analysis using the Thermo Aquakem Photometric Automatic Analyser. Accredited
to ISO17025 and MCERTS for most analytes. All accreditation is matrix specific.PM0 No preparation is required.
TM38Ionic analysis using the Thermo Aquakem Photometric Automatic Analyser. Accredited
to ISO17025 and MCERTS for most analytes. All accreditation is matrix specific.PM0 No preparation is required. Yes
TM75 Alkalinity by Metrohm PM0 No preparation is required.
Subcontracted Subcontracted analysis, sent to an ISO 17025 accredited laboratory where possible.
Jones Environmental Laboratory Method Code Appendix
QF-PM 3.1.10 v13 Please include all sections of this report if it is reproduced 5 of 5

Unit 3 Deeside Point
Zone 3
Deeside Industrial Park
Deeside
URS
Attention :
Date :
Your reference :
Our reference :
Location :
Date samples received :
Status :
Issue :
Bob Millward BSc FRSC
Principal Chemist
Three samples were received for analysis on 12th February, 2014. Please find attached our Test Report which should be read with notes at the end
of the report and should include all sections if reproduced. Interpretations and opinions are outside the scope of any accreditation, and all results
relate only to samples supplied.
All analysis is carried out on as received samples and reported on a dry weight basis unless stated otherwise. Results are not surrogate corrected.
Kim Mills
Project Co-ordinator
24th February, 2014
47092660
SJG
12th February, 2014
Final report
Compiled By:
Test Report 14/2791 Batch 1 Schedule B
1
Jones Environmental Laboratory
CH5 2UA
Tel: +44 (0) 1244 833780
Fax: +44 (0) 1244 833781
Sinead Fitzpatrick
410/411 Q House
76 Furze Road
Sandyford
Dublin 18
Ireland
Registered Address : Unit 3 Deeside Point, Zone 3, Deeside Industrial Park, Deeside, CH5 2UA. UK
QF-PM 3.1.1 v15Please include all sections of this report if it is reproduced
All solid results are expressed on a dry weight basis unless stated otherwise. 1 of 6

Client Name: Report : Liquid
Reference:
Location:
Contact: Liquids/products: V=40ml vial, G=glass bottle, P=plastic bottle
JE Job No.: 14/2791 H=H2SO4, Z=ZnAc, N=NaOH, HN=HN03
J E Sample No. 7-9
Sample ID CWPT_CRT_QAQC
Depth
COC No / misc
Containers H HN P
Sample Date 10/02/2014
Sample Type Ground Water
Batch Number 1
Date of Receipt 12/02/2014
Dissolved Calcium # 124.1 <0.2 mg/l TM30/PM14
Total Dissolved Iron # <20 <20 ug/l TM30/PM14
Dissolved Magnesium # 16.8 <0.1 mg/l TM30/PM14
Dissolved Manganese # 238 <2 ug/l TM30/PM14
Dissolved Potassium # 8.0 <0.1 mg/l TM30/PM14
Dissolved Sodium # 89.5 <0.1 mg/l TM30/PM14
Total Iron <20 <20 ug/l TM30/PM14
Total Manganese 253 <2 ug/l TM30/PM14
Fluoride <0.3 <0.3 mg/l TM27/PM0
Sulphate # 116.28 <0.05 mg/l TM38/PM0
Chloride # 94.5 <0.3 mg/l TM38/PM0
Nitrate as NO3 # 26.1 <0.2 mg/l TM38/PM0
Nitrite as NO2 # <0.02 <0.02 mg/l TM38/PM0
Ortho Phosphate as PO4 0.04 <0.03 mg/l TM38/PM0
Ammoniacal Nitrogen as N # 0.19 <0.03 mg/l TM38/PM0
Carbonate Alkalinity as CaCO3 <1 <1 mg/l TM75/PM0
Bicarbonate Alkalinity as CaCO3 307 <1 mg/l TM75/PM0
Enterococci* <0.1 <0.1 CFU/100ml Subcontracted
Escherichia Coli* <0.1 <0.1 CFU/100ml Subcontracted
Turbidity 0.8 <0.1 NTU TM34/PM0
Jones Environmental Laboratory
URS
47092660
SJG
Sinead Fitzpatrick
Please see attached notes for all
abbreviations and acronyms
LOD UnitsMethod
No.
QF-PM 3.1.2 v10Please include all sections of this report if it is reproduced
All solid results are expressed on a dry weight basis unless stated otherwise. 2 of 6

Notification of Deviating Samples
Matrix : Liquid
J E
Job
No.
Batch Depth J E Sample
No.Analysis Reason
Please note that only samples that are deviating are mentioned in this report. If no samples are listed it is because none were deviating.
Only analyses which are accredited are recorded as deviating if set criteria are not met.
Jones Environmental Laboratory
Client Name: URS
Reference: 47092660
Location: SJG
Contact: Sinead Fitzpatrick
Sample ID
QF-PM 3.1.11 v3 Please include all sections of this report if it is reproduced 3 of 6

JE Job No.:
SOILS
DEVIATING SAMPLES
SURROGATES
NOTE
NOTES TO ACCOMPANY ALL SCHEDULES AND REPORTS
Please note we are only MCERTS accredited for sand, loam and clay and any other matrix is outside our scope of accreditation.
Where Mineral Oil or Fats, Oils and Grease is quoted, this refers to Total Aliphatics C10-C40.
14/2791
WATERS
Where an MCERTS report has been requested, you will be notified within 48 hours of any samples that have been identified as being outside our
MCERTS scope. As validation has been performed on clay, sand and loam, only samples that are predominantly these matrices, or combinations
of them will be within our MCERTS scope. If samples are not one of a combination of the above matrices they will not be marked as MCERTS
accredited.
All samples will be discarded one month after the date of reporting, unless we are instructed to the contrary. If we are instructed to keep samples, a
storage charge of £1 (1.5 Euros) per sample per month will be applied until we are asked to dispose of them.
It is assumed that you have taken representative samples on site and require analysis on a representative subsample. Stones will generally be
included unless we are requested to remove them.
UKAS accreditation applies to surface water and groundwater and one other matrix which is analysis specific, any other liquids are outside our
scope of accreditation
As surface waters require different sample preparation to groundwaters the laboratory must be informed of the water type when submitting samples.
Samples must be received in a condition appropriate to the requested analyses. All samples should be submitted to the laboratory in suitable
containers with sufficient ice packs to sustain an appropriate temperature for the requested analysis. If this is not the case you will be informed and
any test results that may be compromised highlighted on your deviating samples report.
Where appropriate please make sure that our detection limits are suitable for your needs, if they are not, please notify us immediately.
Please note we are not a Drinking Water Inspectorate (DWI) Approved Laboratory . It is important that detection limits are carefully considered
when requesting water analysis.
If you have not already done so, please send us a purchase order if this is required by your company.
All analysis is reported on a dry weight basis unless stated otherwise. Results are not surrogate corrected. Samples are dried at 35°C ±5°C unless
otherwise stated. Moisture content for CEN Leachate tests are dried at 105°C ±5°C.
Where Mineral Oil or Fats, Oils and Grease is quoted, this refers to Total Aliphatics C10-C40.
Where a CEN 10:1 ZERO Headspace VOC test has been carried out, a 10:1 ratio of water to wet (as received) soil has been used.
Data is only accredited when all the requirements of our Quality System have been met. In certain circumstances where the requirements have not
been met, the laboratory may issue the data in an interim report but will remove the accreditation, in this instance results should be considered
indicative only. Where possible samples will be re-extracted and a final report issued with accredited results. Please do not hesitate to contact the
laboratory if further details are required of the circumstances which have led to the removal of accreditation.
Surrogate compounds are added during the preparation process to monitor recovery of analytes. However low recovery in soils is often due to peat,
clay or other organic rich matrices. For waters this can be due to oxidants, surfactants, organic rich sediments or remediation fluids. Acceptable
limits for most organic methods are 70 - 130% and for VOCs are 50 - 150%. When surrogate recoveries are outside the performance criteria but
the associated AQC passes this is assumed to be due to matrix effect. Results are not surrogate corrected.
QF-PM 3.1.9 v25Please include all sections of this report if it is reproduced
All solid results are expressed on a dry weight basis unless stated otherwise. 4 of 6

JE Job No.:
#
B
DR
M
NA
NAD
ND
NDP
SS
SV
W
+
++
*
CO
OC
NFD No Fibres Detected
Result outside calibration range, results should be considered as indicative only and are not accredited.
Results expressed on as received basis.
Surrogate recovery outside performance criteria. This may be due to a matrix effect.
Dilution required.
Indicates analyte found in associated method blank.
Not applicable
MCERTS accredited.
AQC failure, accreditation has been removed from this result, if appropriate, see 'Note' on previous page.
Outside Calibration Range
Suspected carry over
14/2791
Analysis subcontracted to a Jones Environmental approved laboratory.
Calibrated against a single substance.
No Determination Possible
ABBREVIATIONS and ACRONYMS USED
No Asbestos Detected.
None Detected (usually refers to VOC and/SVOC TICs).
UKAS accredited.
QF-PM 3.1.9 v25Please include all sections of this report if it is reproduced
All solid results are expressed on a dry weight basis unless stated otherwise. 5 of 6

JE Job No: 14/2791
Test Method No. Description
Prep Method
No. (if
appropriate)
Description UKAS
MCERTS
(soils
only)
Analysis done
on As Received
(AR) or Air Dried
(AD)
Reported on
dry weight
basis
TM27In-House method based on USEPA 9056. Analysis of samples using a Dionex Ion-
Chromatograph instrument.PM0 No preparation is required.
TM30
Trace Metal elements by ICP-OES (Inductively Coupled Plasma - Optical Emission
Spectrometry) using Thermo iCAP 6000 series instrument. Accredited to ISO 17025 for
soils and waters and MCERTS accredited for Soils. All accreditation is matrix specific.
PM14
In-house method based on USEPA 3005A. Acid digestion of water samples and
analsyis by ICP-OES as per method TM030W.ISO 17025 accredited extraction method.
All accreditation is matrix specific
TM30
Trace Metal elements by ICP-OES (Inductively Coupled Plasma - Optical Emission
Spectrometry) using Thermo iCAP 6000 series instrument. Accredited to ISO 17025 for
soils and waters and MCERTS accredited for Soils. All accreditation is matrix specific.
PM14
In-house method based on USEPA 3005A. Acid digestion of water samples and
analsyis by ICP-OES as per method TM030W.ISO 17025 accredited extraction method.
All accreditation is matrix specific
Yes
TM34 Turbidity by Turbidimeter PM0 No preparation is required.
TM38Ionic analysis using the Thermo Aquakem Photometric Automatic Analyser. Accredited
to ISO17025 and MCERTS for most analytes. All accreditation is matrix specific.PM0 No preparation is required.
TM38Ionic analysis using the Thermo Aquakem Photometric Automatic Analyser. Accredited
to ISO17025 and MCERTS for most analytes. All accreditation is matrix specific.PM0 No preparation is required. Yes
TM75 Alkalinity by Metrohm PM0 No preparation is required.
Subcontracted Subcontracted analysis, sent to an ISO 17025 accredited laboratory where possible.
Jones Environmental Laboratory Method Code Appendix
QF-PM 3.1.10 v13 Please include all sections of this report if it is reproduced 6 of 6

Unit 3 Deeside Point
Zone 3
Deeside Industrial Park
Deeside
URS
Attention :
Date :
Your reference :
Our reference :
Location :
Date samples received :
Status :
Issue :
Bob Millward BSc FRSC
Principal Chemist
Three samples were received for analysis on 18th February, 2014. Please find attached our Test Report which should be read with notes at the end
of the report and should include all sections if reproduced. Interpretations and opinions are outside the scope of any accreditation, and all results
relate only to samples supplied.
All analysis is carried out on as received samples and reported on a dry weight basis unless stated otherwise. Results are not surrogate corrected.
Kim Mills
Project Co-ordinator
24th February, 2014
47092660
SJG
18th February, 2014
Final report
Compiled By:
Test Report 14/2996 Batch 1
1
Jones Environmental Laboratory
CH5 2UA
Tel: +44 (0) 1244 833780
Fax: +44 (0) 1244 833781
Sinead Fitzpatrick
410/411 Q House
76 Furze Road
Sandyford
Dublin 18
Ireland
Registered Address : Unit 3 Deeside Point, Zone 3, Deeside Industrial Park, Deeside, CH5 2UA. UK
QF-PM 3.1.1 v15Please include all sections of this report if it is reproduced
All solid results are expressed on a dry weight basis unless stated otherwise. 1 of 6

Client Name: Report : Liquid
Reference:
Location:
Contact: Liquids/products: V=40ml vial, G=glass bottle, P=plastic bottle
JE Job No.: 14/2996 H=H2SO4, Z=ZnAc, N=NaOH, HN=HN03
J E Sample No. 1-3 4-6 7-9
Sample ID CWPT_CRTD8_16:40 CWPT_CRTD10_10:30 CWPT_CRTD13_12:20
Depth
COC No / misc
Containers H HN P H HN P H HN P
Sample Date 12/02/2014 12/02/2014 12/02/2014
Sample Type Ground Water Ground Water Ground Water
Batch Number 1 1 1
Date of Receipt 18/02/2014 18/02/2014 18/02/2014
Dissolved Calcium # 123.3 120.6 116.9 <0.2 mg/l TM30/PM14
Total Dissolved Iron # <20 <20 <20 <20 ug/l TM30/PM14
Dissolved Magnesium # 17.0 16.8 17.3 <0.1 mg/l TM30/PM14
Dissolved Manganese # 295 301 309 <2 ug/l TM30/PM14
Dissolved Potassium # 8.2 7.9 7.9 <0.1 mg/l TM30/PM14
Dissolved Sodium # 91.1 96.0 96.2 <0.1 mg/l TM30/PM14
Total Iron <20 <20 <20 <20 ug/l TM30/PM14
Total Manganese 297 307 316 <2 ug/l TM30/PM14
Fluoride <0.3 <0.3 <0.3 <0.3 mg/l TM27/PM0
Sulphate # 112.31 109.40 106.12 <0.05 mg/l TM38/PM0
Chloride # 93.9 93.5 93.9 <0.3 mg/l TM38/PM0
Nitrate as NO3 # 25.4 24.6 23.6 <0.2 mg/l TM38/PM0
Nitrite as NO2 # <0.02 <0.02 <0.02 <0.02 mg/l TM38/PM0
Ortho Phosphate as PO4 <0.03 <0.03 <0.03 <0.03 mg/l TM38/PM0
Ammoniacal Nitrogen as N # 0.20 0.22 0.24 <0.03 mg/l TM38/PM0
Carbonate Alkalinity as CaCO3 <1 <1 <1 <1 mg/l TM75/PM0
Bicarbonate Alkalinity as CaCO3 306 300 309 <1 mg/l TM75/PM0
Enterococci* <0.1 <0.1 <0.1 <0.1 CFU/100ml Subcontracted
Escherichia Coli* <0.1 <0.1 <0.1 <0.1 CFU/100ml Subcontracted
Turbidity 0.7 0.9 0.9 <0.1 NTU TM34/PM0
Jones Environmental Laboratory
URS
47092660
SJG
Sinead Fitzpatrick
Please see attached notes for all
abbreviations and acronyms
LOD UnitsMethod
No.
QF-PM 3.1.2 v10Please include all sections of this report if it is reproduced
All solid results are expressed on a dry weight basis unless stated otherwise. 2 of 6

Notification of Deviating Samples
Matrix : Liquid
J E
Job
No.
Batch Depth J E Sample
No.Analysis Reason
Please note that only samples that are deviating are mentioned in this report. If no samples are listed it is because none were deviating.
Only analyses which are accredited are recorded as deviating if set criteria are not met.
Jones Environmental Laboratory
Client Name: URS
Reference: 47092660
Location: SJG
Contact: Sinead Fitzpatrick
Sample ID
QF-PM 3.1.11 v3 Please include all sections of this report if it is reproduced 3 of 6

JE Job No.:
SOILS
DEVIATING SAMPLES
SURROGATES
NOTE
NOTES TO ACCOMPANY ALL SCHEDULES AND REPORTS
Please note we are only MCERTS accredited for sand, loam and clay and any other matrix is outside our scope of accreditation.
Where Mineral Oil or Fats, Oils and Grease is quoted, this refers to Total Aliphatics C10-C40.
14/2996
WATERS
Where an MCERTS report has been requested, you will be notified within 48 hours of any samples that have been identified as being outside our
MCERTS scope. As validation has been performed on clay, sand and loam, only samples that are predominantly these matrices, or combinations
of them will be within our MCERTS scope. If samples are not one of a combination of the above matrices they will not be marked as MCERTS
accredited.
All samples will be discarded one month after the date of reporting, unless we are instructed to the contrary. If we are instructed to keep samples, a
storage charge of £1 (1.5 Euros) per sample per month will be applied until we are asked to dispose of them.
It is assumed that you have taken representative samples on site and require analysis on a representative subsample. Stones will generally be
included unless we are requested to remove them.
UKAS accreditation applies to surface water and groundwater and one other matrix which is analysis specific, any other liquids are outside our
scope of accreditation
As surface waters require different sample preparation to groundwaters the laboratory must be informed of the water type when submitting samples.
Samples must be received in a condition appropriate to the requested analyses. All samples should be submitted to the laboratory in suitable
containers with sufficient ice packs to sustain an appropriate temperature for the requested analysis. If this is not the case you will be informed and
any test results that may be compromised highlighted on your deviating samples report.
Where appropriate please make sure that our detection limits are suitable for your needs, if they are not, please notify us immediately.
Please note we are not a Drinking Water Inspectorate (DWI) Approved Laboratory . It is important that detection limits are carefully considered
when requesting water analysis.
If you have not already done so, please send us a purchase order if this is required by your company.
All analysis is reported on a dry weight basis unless stated otherwise. Results are not surrogate corrected. Samples are dried at 35°C ±5°C unless
otherwise stated. Moisture content for CEN Leachate tests are dried at 105°C ±5°C.
Where Mineral Oil or Fats, Oils and Grease is quoted, this refers to Total Aliphatics C10-C40.
Where a CEN 10:1 ZERO Headspace VOC test has been carried out, a 10:1 ratio of water to wet (as received) soil has been used.
Data is only accredited when all the requirements of our Quality System have been met. In certain circumstances where the requirements have not
been met, the laboratory may issue the data in an interim report but will remove the accreditation, in this instance results should be considered
indicative only. Where possible samples will be re-extracted and a final report issued with accredited results. Please do not hesitate to contact the
laboratory if further details are required of the circumstances which have led to the removal of accreditation.
Surrogate compounds are added during the preparation process to monitor recovery of analytes. However low recovery in soils is often due to peat,
clay or other organic rich matrices. For waters this can be due to oxidants, surfactants, organic rich sediments or remediation fluids. Acceptable
limits for most organic methods are 70 - 130% and for VOCs are 50 - 150%. When surrogate recoveries are outside the performance criteria but
the associated AQC passes this is assumed to be due to matrix effect. Results are not surrogate corrected.
QF-PM 3.1.9 v25Please include all sections of this report if it is reproduced
All solid results are expressed on a dry weight basis unless stated otherwise. 4 of 6

JE Job No.:
#
B
DR
M
NA
NAD
ND
NDP
SS
SV
W
+
++
*
CO
OC
NFD No Fibres Detected
Result outside calibration range, results should be considered as indicative only and are not accredited.
Results expressed on as received basis.
Surrogate recovery outside performance criteria. This may be due to a matrix effect.
Dilution required.
Indicates analyte found in associated method blank.
Not applicable
MCERTS accredited.
AQC failure, accreditation has been removed from this result, if appropriate, see 'Note' on previous page.
Outside Calibration Range
Suspected carry over
14/2996
Analysis subcontracted to a Jones Environmental approved laboratory.
Calibrated against a single substance.
No Determination Possible
ABBREVIATIONS and ACRONYMS USED
No Asbestos Detected.
None Detected (usually refers to VOC and/SVOC TICs).
UKAS accredited.
QF-PM 3.1.9 v25Please include all sections of this report if it is reproduced
All solid results are expressed on a dry weight basis unless stated otherwise. 5 of 6

JE Job No: 14/2996
Test Method No. Description
Prep Method
No. (if
appropriate)
Description UKAS
MCERTS
(soils
only)
Analysis done
on As Received
(AR) or Air Dried
(AD)
Reported on
dry weight
basis
TM27In-House method based on USEPA 9056. Analysis of samples using a Dionex Ion-
Chromatograph instrument.PM0 No preparation is required.
TM30
Trace Metal elements by ICP-OES (Inductively Coupled Plasma - Optical Emission
Spectrometry) using Thermo iCAP 6000 series instrument. Accredited to ISO 17025 for
soils and waters and MCERTS accredited for Soils. All accreditation is matrix specific.
PM14
In-house method based on USEPA 3005A. Acid digestion of water samples and
analsyis by ICP-OES as per method TM030W.ISO 17025 accredited extraction method.
All accreditation is matrix specific
TM30
Trace Metal elements by ICP-OES (Inductively Coupled Plasma - Optical Emission
Spectrometry) using Thermo iCAP 6000 series instrument. Accredited to ISO 17025 for
soils and waters and MCERTS accredited for Soils. All accreditation is matrix specific.
PM14
In-house method based on USEPA 3005A. Acid digestion of water samples and
analsyis by ICP-OES as per method TM030W.ISO 17025 accredited extraction method.
All accreditation is matrix specific
Yes
TM34 Turbidity by Turbidimeter PM0 No preparation is required.
TM38Ionic analysis using the Thermo Aquakem Photometric Automatic Analyser. Accredited
to ISO17025 and MCERTS for most analytes. All accreditation is matrix specific.PM0 No preparation is required.
TM38Ionic analysis using the Thermo Aquakem Photometric Automatic Analyser. Accredited
to ISO17025 and MCERTS for most analytes. All accreditation is matrix specific.PM0 No preparation is required. Yes
TM75 Alkalinity by Metrohm PM0 No preparation is required.
Subcontracted Subcontracted analysis, sent to an ISO 17025 accredited laboratory where possible.
Jones Environmental Laboratory Method Code Appendix
QF-PM 3.1.10 v13 Please include all sections of this report if it is reproduced 6 of 6

Unit 3 Deeside Point
Zone 3
Deeside Industrial Park
Deeside
URS
Attention :
Date :
Your reference :
Our reference :
Location :
Date samples received :
Status :
Issue :
Bob Millward BSc FRSC
Principal Chemist
1
Jones Environmental Laboratory
CH5 2UA
Tel: +44 (0) 1244 833780
Fax: +44 (0) 1244 833781
Sinead Fitzpatrick
410/411 Q House
76 Furze Road
Sandyford
Dublin 18
Ireland
Registered Address : Unit 3 Deeside Point, Zone 3, Deeside Industrial Park, Deeside, CH5 2UA. UK
Two samples were received for analysis on 20th February, 2014. Please find attached our Test Report which should be read with notes at the end
of the report and should include all sections if reproduced. Interpretations and opinions are outside the scope of any accreditation, and all results
relate only to samples supplied.
All analysis is carried out on as received samples and reported on a dry weight basis unless stated otherwise. Results are not surrogate corrected.
Kim Mills
Project Co-ordinator
5th March, 2014
47092660
SJG
20th February, 2014
Final report
Compiled By:
Test Report 14/3063 Batch 1
QF-PM 3.1.1 v15Please include all sections of this report if it is reproduced
All solid results are expressed on a dry weight basis unless stated otherwise. 1 of 10

Client Name: Report : Liquid
Reference:
Location:
Contact: Liquids/products: V=40ml vial, G=glass bottle, P=plastic bottle
JE Job No.: 14/3063 H=H2SO4, Z=ZnAc, N=NaOH, HN=HN03
J E Sample No. 1-9
Sample ID CWPT-CRT-FS-A
Depth
COC No / misc
Containers V H HN N P G
Sample Date 18/02/2014
Sample Type Ground Water
Batch Number 1
Date of Receipt 20/02/2014
Dissolved Aluminium # <20 <20 ug/l TM30/PM14
Dissolved Antimony # <2 <2 ug/l TM30/PM14
Dissolved Arsenic # <0.9 <0.9 ug/l TM30/PM14
Dissolved Boron 80 <12 ug/l TM30/PM14
Dissolved Cadmium # <0.5 <0.5 ug/l TM30/PM14
Dissolved Calcium # 108.9 <0.2 mg/l TM30/PM14
Total Dissolved Chromium # <1.5 <1.5 ug/l TM30/PM14
Dissolved Copper # <7 <7 ug/l TM30/PM14
Total Dissolved Iron # <20 <20 ug/l TM30/PM14
Dissolved Lead # <5 <5 ug/l TM30/PM14
Dissolved Magnesium # 17.0 <0.1 mg/l TM30/PM14
Dissolved Manganese # 297 <2 ug/l TM30/PM14
Dissolved Mercury # <1 <1 ug/l TM30/PM14
Dissolved Nickel # 19 <2 ug/l TM30/PM14
Dissolved Potassium # 8.0 <0.1 mg/l TM30/PM14
Dissolved Selenium # <3 <3 ug/l TM30/PM14
Dissolved Sodium # 96.4 <0.1 mg/l TM30/PM14
Dissolved Zinc # 7 <3 ug/l TM30/PM14
Total Hardness Dissolved (as CaCO3) 344 <1 mg/l TM30/PM14
PAH MS
Naphthalene 0.04 <0.01 ug/l TM4/PM30
Acenaphthylene <0.01 <0.01 ug/l TM4/PM30
Acenaphthene <0.01 <0.01 ug/l TM4/PM30
Fluorene <0.01 <0.01 ug/l TM4/PM30
Phenanthrene <0.01 <0.01 ug/l TM4/PM30
Anthracene 0.02 <0.01 ug/l TM4/PM30
Fluoranthene <0.01 <0.01 ug/l TM4/PM30
Pyrene <0.01 <0.01 ug/l TM4/PM30
Benzo(a)anthracene <0.01 <0.01 ug/l TM4/PM30
Chrysene <0.01 <0.01 ug/l TM4/PM30
Benzo(bk)fluoranthene <0.01 <0.01 ug/l TM4/PM30
Benzo(a)pyrene <0.01 <0.01 ug/l TM4/PM30
Indeno(123cd)pyrene <0.01 <0.01 ug/l TM4/PM30
Dibenzo(ah)anthracene <0.01 <0.01 ug/l TM4/PM30
Benzo(ghi)perylene <0.01 <0.01 ug/l TM4/PM30
PAH 16 Total <0.1 <0.1 ug/l TM4/PM30
Benzo(b)fluoranthene <0.01 <0.01 ug/l TM4/PM30
Benzo(k)fluoranthene <0.01 <0.01 ug/l TM4/PM30
PAH Surrogate % Recovery 94 <0 % TM4/PM30
Epichlorohydrin ND <0.1 ug/l
VOC TICs ND None TM15/PM10
Methyl Tertiary Butyl Ether # <0.1 <0.1 ug/l TM15/PM10
Benzene # <0.5 <0.5 ug/l TM15/PM10
SJG
Sinead Fitzpatrick
Please see attached notes for all
abbreviations and acronyms
LOD UnitsMethod
No.
Jones Environmental Laboratory
URS
47092660
QF-PM 3.1.2 v10Please include all sections of this report if it is reproduced
All solid results are expressed on a dry weight basis unless stated otherwise. 2 of 10

Client Name: Report : Liquid
Reference:
Location:
Contact: Liquids/products: V=40ml vial, G=glass bottle, P=plastic bottle
JE Job No.: 14/3063 H=H2SO4, Z=ZnAc, N=NaOH, HN=HN03
J E Sample No. 1-9
Sample ID CWPT-CRT-FS-A
Depth
COC No / misc
Containers V H HN N P G
Sample Date 18/02/2014
Sample Type Ground Water
Batch Number 1
Date of Receipt 20/02/2014
Toluene # <0.5 <0.5 ug/l TM15/PM10
Ethylbenzene # <0.5 <0.5 ug/l TM15/PM10
p/m-Xylene # <1 <1 ug/l TM15/PM10
o-Xylene # <0.5 <0.5 ug/l TM15/PM10
Surrogate Recovery Toluene D8 86 <0 % TM15/PM10
Surrogate Recovery 4-Bromofluorobenzene 98 <0 % TM15/PM10
Pesticides MS
Organochlorine Pesticides
Aldrin <0.01 <0.01 ug/l TM42/PM30
Alpha-BHC <0.01 <0.01 ug/l TM42/PM30
Beta-BHC <0.01 <0.01 ug/l TM42/PM30
Dieldrin <0.01 <0.01 ug/l TM42/PM30
Endosulphan I <0.01 <0.01 ug/l TM42/PM30
Endosulphan II <0.01 <0.01 ug/l TM42/PM30
Endosulphan sulphate <0.01 <0.01 ug/l TM42/PM30
Endrin <0.01 <0.01 ug/l TM42/PM30
Gamma-BHC <0.01 <0.01 ug/l TM42/PM30
Heptachlor <0.01 <0.01 ug/l TM42/PM30
Heptachlor Epoxide <0.01 <0.01 ug/l TM42/PM30
p,p'-DDE <0.01 <0.01 ug/l TM42/PM30
p,p'-DDT <0.01 <0.01 ug/l TM42/PM30
p,p'-TDE <0.01 <0.01 ug/l TM42/PM30
Total Methoxychlor <0.01 <0.01 ug/l TM42/PM30
Organophosphorus Pesticides
Azinphos methyl <0.01 <0.01 ug/l TM42/PM30
Diazinon <0.01 <0.01 ug/l TM42/PM30
Dichlorvos <0.01 <0.01 ug/l TM42/PM30
Disulfoton <0.01 <0.01 ug/l TM42/PM30
Ethion <0.01 <0.01 ug/l TM42/PM30
Ethyl Parathion (Parathion) <0.01 <0.01 ug/l TM42/PM30
Fenitrothion <0.01 <0.01 ug/l TM42/PM30
Malathion <0.01 <0.01 ug/l TM42/PM30
Methyl Parathion <0.01 <0.01 ug/l TM42/PM30
Mevinphos <0.01 <0.01 ug/l TM42/PM30
Fluoride <0.3 <0.3 mg/l TM27/PM0
Bromide 0.55 <0.05 mg/l TM27/PM0
Sulphate # 100.57 <0.05 mg/l TM38/PM0
Chloride # 96.8 <0.3 mg/l TM38/PM0
Nitrate as NO3 # 24.2 <0.2 mg/l TM38/PM0
Nitrite as NO2 # <0.02 <0.02 mg/l TM38/PM0
LOD UnitsMethod
No.
Jones Environmental Laboratory
URS
47092660
SJG
Sinead Fitzpatrick
Please see attached notes for all
abbreviations and acronyms
QF-PM 3.1.2 v10Please include all sections of this report if it is reproduced
All solid results are expressed on a dry weight basis unless stated otherwise. 3 of 10

Client Name: Report : Liquid
Reference:
Location:
Contact: Liquids/products: V=40ml vial, G=glass bottle, P=plastic bottle
JE Job No.: 14/3063 H=H2SO4, Z=ZnAc, N=NaOH, HN=HN03
J E Sample No. 1-9
Sample ID CWPT-CRT-FS-A
Depth
COC No / misc
Containers V H HN N P G
Sample Date 18/02/2014
Sample Type Ground Water
Batch Number 1
Date of Receipt 20/02/2014
Total Cyanide # <0.01 <0.01 mg/l TM89/PM0
Total Ammonia as NH4 # 0.31 <0.03 mg/l TM38/PM0
Acrylamide <50 <50 ug/l TM103/PM59
Laurylamine <50 <50 ug/l TM103/PM59
Hydroxyethyl ethylene diamine <50 <50 ug/l TM103/PM59
Myristyl dimethlyamine <50 <50 ug/l TM103/PM59
Octyldimethylamine <50 <50 ug/l TM103/PM59
para phenylene diamine <50 <50 ug/l TM103/PM59
Tetra ethylene pentamine <200 <200 ug/l TM103/PM59
Clostridium perfringens* <1 <1 CFU/100ml Subcontracted
Electrical Conductivity @25C # 1161 <2 uS/cm TM76/PM0
Escherichia Coli* <1 <1 MPN/100ml Subcontracted
pH # 7.43 <0.01 pH units TM73/PM0
Total Organic Carbon # <2 <2 mg/l TM60/PM0
Total Coliforms* <1 <1 MPN/100ml Subcontracted
Total Enterococci* <1 <1 MPN/100ml Subcontracted
True Colour 22 <15 PCU TM35/PM0
Turbidity 0.4 <0.1 NTU TM34/PM0
TVC @22°C 3 day* 14 CFU/ml Subcontracted
SJG
Sinead Fitzpatrick
Please see attached notes for all
abbreviations and acronyms
LOD UnitsMethod
No.
Jones Environmental Laboratory
URS
47092660
QF-PM 3.1.2 v10Please include all sections of this report if it is reproduced
All solid results are expressed on a dry weight basis unless stated otherwise. 4 of 10

Client Name: VOC Report : Liquid
Reference:
Location:
Contact:
JE Job No.: 14/3063
J E Sample No. 1-9
Sample ID CWPT-CRT-FS-A
Depth
COC No / misc
Containers V H HN N P G
Sample Date 18/02/2014
Sample Type Ground Water
Batch Number 1
Date of Receipt 20/02/2014
VOC MS
Dichlorodifluoromethane <2 <2 ug/l TM15/PM10
Methyl Tertiary Butyl Ether # <0.1 <0.1 ug/l TM15/PM10
Chloromethane # <3 <3 ug/l TM15/PM10
Vinyl Chloride <0.1 <0.1 ug/l TM15/PM10
Bromomethane <1 <1 ug/l TM15/PM10
Chloroethane # <3 <3 ug/l TM15/PM10
Trichlorofluoromethane # <3 <3 ug/l TM15/PM10
1,1-Dichloroethene (1,1 DCE) # <3 <3 ug/l TM15/PM10
Dichloromethane (DCM) # <3 <3 ug/l TM15/PM10
trans-1-2-Dichloroethene # <3 <3 ug/l TM15/PM10
1,1-Dichloroethane # <3 <3 ug/l TM15/PM10
cis-1-2-Dichloroethene # <3 <3 ug/l TM15/PM10
2,2-Dichloropropane <1 <1 ug/l TM15/PM10
Bromochloromethane # <2 <2 ug/l TM15/PM10
Chloroform # <2 <2 ug/l TM15/PM10
1,1,1-Trichloroethane # <2 <2 ug/l TM15/PM10
1,1-Dichloropropene # <3 <3 ug/l TM15/PM10
Carbon tetrachloride # <2 <2 ug/l TM15/PM10
1,2-Dichloroethane # <2 <2 ug/l TM15/PM10
Benzene # <0.5 <0.5 ug/l TM15/PM10
Trichloroethene (TCE) # <3 <3 ug/l TM15/PM10
1,2-Dichloropropane # <2 <2 ug/l TM15/PM10
Dibromomethane # <3 <3 ug/l TM15/PM10
Bromodichloromethane # <2 <2 ug/l TM15/PM10
cis-1-3-Dichloropropene <2 <2 ug/l TM15/PM10
Toluene # <0.5 <0.5 ug/l TM15/PM10
trans-1-3-Dichloropropene <2 <2 ug/l TM15/PM10
1,1,2-Trichloroethane # <2 <2 ug/l TM15/PM10
Tetrachloroethene (PCE) # <3 <3 ug/l TM15/PM10
1,3-Dichloropropane # <2 <2 ug/l TM15/PM10
Dibromochloromethane # <2 <2 ug/l TM15/PM10
1,2-Dibromoethane # <2 <2 ug/l TM15/PM10
Chlorobenzene # <2 <2 ug/l TM15/PM10
1,1,1,2-Tetrachloroethane # <2 <2 ug/l TM15/PM10
Ethylbenzene # <0.5 <0.5 ug/l TM15/PM10
p/m-Xylene # <1 <1 ug/l TM15/PM10
o-Xylene # <0.5 <0.5 ug/l TM15/PM10
Styrene <2 <2 ug/l TM15/PM10
Bromoform # <2 <2 ug/l TM15/PM10
Isopropylbenzene # <3 <3 ug/l TM15/PM10
1,1,2,2-Tetrachloroethane <4 <4 ug/l TM15/PM10
Bromobenzene # <2 <2 ug/l TM15/PM10
1,2,3-Trichloropropane # <3 <3 ug/l TM15/PM10
Propylbenzene # <3 <3 ug/l TM15/PM10
2-Chlorotoluene # <3 <3 ug/l TM15/PM10
1,3,5-Trimethylbenzene # <3 <3 ug/l TM15/PM10
4-Chlorotoluene # <3 <3 ug/l TM15/PM10
tert-Butylbenzene # <3 <3 ug/l TM15/PM10
1,2,4-Trimethylbenzene # <3 <3 ug/l TM15/PM10
sec-Butylbenzene # <3 <3 ug/l TM15/PM10
4-Isopropyltoluene # <3 <3 ug/l TM15/PM10
1,3-Dichlorobenzene # <3 <3 ug/l TM15/PM10
1,4-Dichlorobenzene # <3 <3 ug/l TM15/PM10
n-Butylbenzene # <3 <3 ug/l TM15/PM10
1,2-Dichlorobenzene # <3 <3 ug/l TM15/PM10
1,2-Dibromo-3-chloropropane <2 <2 ug/l TM15/PM10
1,2,4-Trichlorobenzene <3 <3 ug/l TM15/PM10
Hexachlorobutadiene <3 <3 ug/l TM15/PM10
Naphthalene <2 <2 ug/l TM15/PM10
1,2,3-Trichlorobenzene <3 <3 ug/l TM15/PM10
Surrogate Recovery Toluene D8 86 <0 % TM15/PM10
Surrogate Recovery 4-Bromofluorobenzene 98 <0 % TM15/PM10
SJG
Sinead Fitzpatrick
Please see attached notes for all
abbreviations and acronyms
LOD UnitsMethod
No.
Jones Environmental Laboratory
URS
47092660
QF-PM 3.1.4 v10Please include all sections of this report if it is reproduced
All solid results are expressed on a dry weight basis unless stated otherwise. 5 of 10

Notification of Deviating Samples
J E
Job
No.
Batch Depth J E Sample
No.Analysis Reason
Please note that only samples that are deviating are mentioned in this report. If no samples are listed it is because none were deviating.
Only analyses which are accredited are recorded as deviating if set criteria are not met.
Jones Environmental Laboratory
47092660
SJG
Sinead FitzpatrickContact:
Sample ID
Client Name: URS
Reference:
Location:
No deviating sample report results for job 14/3063
QF-PM 3.1.11 v3 Please include all sections of this report if it is reproduced 6 of 10

JE Job No.:
SOILS
DEVIATING SAMPLES
SURROGATES
NOTE
Surrogate compounds are added during the preparation process to monitor recovery of analytes. However low recovery in soils is often due to peat,
clay or other organic rich matrices. For waters this can be due to oxidants, surfactants, organic rich sediments or remediation fluids. Acceptable
limits for most organic methods are 70 - 130% and for VOCs are 50 - 150%. When surrogate recoveries are outside the performance criteria but
the associated AQC passes this is assumed to be due to matrix effect. Results are not surrogate corrected.
Data is only accredited when all the requirements of our Quality System have been met. In certain circumstances where the requirements have not
been met, the laboratory may issue the data in an interim report but will remove the accreditation, in this instance results should be considered
indicative only. Where possible samples will be re-extracted and a final report issued with accredited results. Please do not hesitate to contact the
laboratory if further details are required of the circumstances which have led to the removal of accreditation.
It is assumed that you have taken representative samples on site and require analysis on a representative subsample. Stones will generally be
included unless we are requested to remove them.
UKAS accreditation applies to surface water and groundwater and one other matrix which is analysis specific, any other liquids are outside our
scope of accreditation
As surface waters require different sample preparation to groundwaters the laboratory must be informed of the water type when submitting samples.
Samples must be received in a condition appropriate to the requested analyses. All samples should be submitted to the laboratory in suitable
containers with sufficient ice packs to sustain an appropriate temperature for the requested analysis. If this is not the case you will be informed and
any test results that may be compromised highlighted on your deviating samples report.
Where appropriate please make sure that our detection limits are suitable for your needs, if they are not, please notify us immediately.
Please note we are not a Drinking Water Inspectorate (DWI) Approved Laboratory . It is important that detection limits are carefully considered
when requesting water analysis.
If you have not already done so, please send us a purchase order if this is required by your company.
All analysis is reported on a dry weight basis unless stated otherwise. Results are not surrogate corrected. Samples are dried at 35°C ±5°C unless
otherwise stated. Moisture content for CEN Leachate tests are dried at 105°C ±5°C.
Where Mineral Oil or Fats, Oils and Grease is quoted, this refers to Total Aliphatics C10-C40.
Where a CEN 10:1 ZERO Headspace VOC test has been carried out, a 10:1 ratio of water to wet (as received) soil has been used.
NOTES TO ACCOMPANY ALL SCHEDULES AND REPORTS
Please note we are only MCERTS accredited for sand, loam and clay and any other matrix is outside our scope of accreditation.
Where Mineral Oil or Fats, Oils and Grease is quoted, this refers to Total Aliphatics C10-C40.
14/3063
WATERS
Where an MCERTS report has been requested, you will be notified within 48 hours of any samples that have been identified as being outside our
MCERTS scope. As validation has been performed on clay, sand and loam, only samples that are predominantly these matrices, or combinations
of them will be within our MCERTS scope. If samples are not one of a combination of the above matrices they will not be marked as MCERTS
accredited.
All samples will be discarded one month after the date of reporting, unless we are instructed to the contrary. If we are instructed to keep samples, a
storage charge of £1 (1.5 Euros) per sample per month will be applied until we are asked to dispose of them.
QF-PM 3.1.9 v25Please include all sections of this report if it is reproduced
All solid results are expressed on a dry weight basis unless stated otherwise. 7 of 10

JE Job No.:
#
B
DR
M
NA
NAD
ND
NDP
SS
SV
W
+
++
*
CO
OC
NFD
Analysis subcontracted to a Jones Environmental approved laboratory.
Calibrated against a single substance.
No Determination Possible
ABBREVIATIONS and ACRONYMS USED
No Asbestos Detected.
None Detected (usually refers to VOC and/SVOC TICs).
UKAS accredited.
No Fibres Detected
Result outside calibration range, results should be considered as indicative only and are not accredited.
Results expressed on as received basis.
Surrogate recovery outside performance criteria. This may be due to a matrix effect.
Dilution required.
Indicates analyte found in associated method blank.
Not applicable
MCERTS accredited.
AQC failure, accreditation has been removed from this result, if appropriate, see 'Note' on previous page.
Outside Calibration Range
Suspected carry over
14/3063
QF-PM 3.1.9 v25Please include all sections of this report if it is reproduced
All solid results are expressed on a dry weight basis unless stated otherwise. 8 of 10

JE Job No: 14/3063
Test Method No. Description
Prep Method
No. (if
appropriate)
Description UKAS
MCERTS
(soils
only)
Analysis done
on As Received
(AR) or Air Dried
(AD)
Reported on
dry weight
basis
TM4 16 PAH by GC-MS, modified USEPA 8270 PM30
In-house method based on USEPA 3510. Liquid samples are mixed with solvent and
agitated with an automatic magnetic stirrer with a stir bar for 15 minutes to extract
organic molecules. ISO 17025 accredited extraction method. All accreditation is matrix
specific
TM15
In-House method based on USEPA 8260. Determination of Volatile Organic compounds
(VOCs) by Headspace GC-MS. Accredited to ISO 17025 for soils and waters and
MCERTS for Soils. All accreditation is matrix specific. Quantification by Internal Standard
method.
PM10
In-house method based on USEPA 5021. Preparation of solid and liquid samples for
headspace analysis. Samples are spiked with surrogates to facilitate quantification. ISO
17025 accredited extraction method. All accreditation is matrix specific
Yes
TM27In-House method based on USEPA 9056. Analysis of samples using a Dionex Ion-
Chromatograph instrument.PM0 No preparation is required.
TM30
Trace Metal elements by ICP-OES (Inductively Coupled Plasma - Optical Emission
Spectrometry) using Thermo iCAP 6000 series instrument. Accredited to ISO 17025 for
soils and waters and MCERTS accredited for Soils. All accreditation is matrix specific.
PM14
In-house method based on USEPA 3005A. Acid digestion of water samples and
analsyis by ICP-OES as per method TM030W.ISO 17025 accredited extraction method.
All accreditation is matrix specific
TM30
Trace Metal elements by ICP-OES (Inductively Coupled Plasma - Optical Emission
Spectrometry) using Thermo iCAP 6000 series instrument. Accredited to ISO 17025 for
soils and waters and MCERTS accredited for Soils. All accreditation is matrix specific.
PM14
In-house method based on USEPA 3005A. Acid digestion of water samples and
analsyis by ICP-OES as per method TM030W.ISO 17025 accredited extraction method.
All accreditation is matrix specific
Yes
TM34 Turbidity by Turbidimeter PM0 No preparation is required.
TM35 Colour by Spectrophotometer PM0 No preparation is required.
TM38Ionic analysis using the Thermo Aquakem Photometric Automatic Analyser. Accredited
to ISO17025 and MCERTS for most analytes. All accreditation is matrix specific.PM0 No preparation is required. Yes
TM42
In-House method based on USEPA 8270. Determination of Semi-Volatile Organic
compounds (SVOCs) including Organochlorine Pesticides and Organophosphorus
Pesticides by GC-MS.
PM30
In-house method based on USEPA 3510. Liquid samples are mixed with solvent and
agitated with an automatic magnetic stirrer with a stir bar for 15 minutes to extract
organic molecules. ISO 17025 accredited extraction method. All accreditation is matrix
specific
Jones Environmental Laboratory Method Code Appendix
QF-PM 3.1.10 v13 Please include all sections of this report if it is reproduced 9 of 10

JE Job No: 14/3063
Test Method No. Description
Prep Method
No. (if
appropriate)
Description UKAS
MCERTS
(soils
only)
Analysis done
on As Received
(AR) or Air Dried
(AD)
Reported on
dry weight
basis
TM60 TOC/DOC by NDIR PM0 No preparation is required. Yes
TM73 pH in by Metrohm PM0 No preparation is required. Yes
TM76 Electrical Conductivity by Metrohm PM0 No preparation is required. Yes
TM89
In-house method based on USEPA method OIA-1667. Determination of cyanide by Flow
Injection Analyser. ISO17025 accredited method for soils and waters and MCERTS on
soils. Accreditation is matrix specific.
PM0 No preparation is required. Yes
TM103 Amines by LC-MS PM59 Preparation of sample for Amines by LC-MS
Subcontracted Subcontracted analysis, sent to an ISO 17025 accredited laboratory where possible.
Jones Environmental Laboratory Method Code Appendix
QF-PM 3.1.10 v13 Please include all sections of this report if it is reproduced 10 of 10