APPENDIX 10.6 Geotechnical Foundation Analysis Energy Introduction 136469 1-1 1.0 Introduction This...
98
APPENDIX 10.6 Geotechnical Foundation Analysis
Transcript of APPENDIX 10.6 Geotechnical Foundation Analysis Energy Introduction 136469 1-1 1.0 Introduction This...

APPENDIX 10.6
Geotechnical Foundation Analysis

Duke Energy
South Bay Energy Facility
Geotechnical Foundation Analysis
Revision 0
April 2006

Duke Energy Contents
136469 TC-1
Contents 1.0 Introduction.......................................................................................................... 1-1 2.0 Summary.............................................................................................................. 2-1 3.0 Site Conditions..................................................................................................... 3-1
3.1 Site Location ............................................................................................ 3-1 3.2 Site Description........................................................................................ 3-1
4.0 Subsurface Investigations .................................................................................... 4-1
4.1 Geotechnical Investigation....................................................................... 4-1 4.2 Previous Environmental Assessment....................................................... 4-1
5.0 Subsurface Conditions ......................................................................................... 5-1
5.1 Regional Geology .................................................................................... 5-1 5.1.1 Near Site Regional Geology...................................................... 5-1 5.1.2 Seismicity .................................................................................. 5-2
5.2 Geologic Hazards..................................................................................... 5-3 5.2.1 Seismic Activity ........................................................................ 5-3 5.2.2 Flooding..................................................................................... 5-3 5.2.3 Tsunamis.................................................................................... 5-4
5.3 Site-Specific Geologic Conditions........................................................... 5-4 6.0 Preliminary Design Parameters............................................................................ 6-1
6.1 Soil Parameters ........................................................................................ 6-1 6.2 Ground Motion Parameters...................................................................... 6-1
6.2.1 Uniform Building Code (UBC 1997) ........................................ 6-3 6.2.2 International Building Code (IBC 2003)................................... 6-3 6.2.3 DMG Standardized Ground Motion Maps ................................ 6-5 6.2.4 Campbell�s Attenuation Relationship........................................ 6-5
7.0 Preliminary Foundation Evaluation ..................................................................... 7-1
7.1 Shallow Foundations................................................................................ 7-1 7.1.1 Settlement .................................................................................. 7-1 7.1.2 Liquefaction............................................................................... 7-1
7.2 Deep Foundations .................................................................................... 7-4 8.0 Conclusions.......................................................................................................... 8-1 9.0 References............................................................................................................ 9-1

Duke Energy Contents
136469 TC-2
Contents (Continued) Appendix A Cone Penetrometer Data--Logs of Cone Penetrometer Test (CPT)
Soundings, Shear Wave Velocity Measurements, and Pore Water Pressure Dissipation Tests
Appendix B Settlement Evaluation Method
Tables Table 5-1 Contribution of Various Faults to Total Seismic Hazard for a
Nearby Site............................................................................................... 5-3 Table 5-2 Possible Locally Generated Tsunamis Along the Southern
California Coast ....................................................................................... 5-5 Table 6-1 Preliminary Soil Engineering Measurements/Properties ......................... 6-2 Table 6-2 Uniform Building Code Seismic Parameters........................................... 6-4 Table 6-3 International Building Code Seismic Parameters .................................... 6-4 Table 7-1 Estimated Settlement ............................................................................... 7-2 Table 7-2 Peak Accelerations and Magnitudes Used for Determination of
Liquefaction Potential .............................................................................. 7-2 Table 7-3 Minimum Factors of Safety Against Liquefaction .................................. 7-3 Table 7-4 Pile Capacity--100 foot long, 14 inch Square Prestressed Precast
Concrete Pile............................................................................................ 7-4
Figures Figure 3-1 Site Vicinity Map Figure 3-2 Subsurface Investigation Location Plan Figure 5-1 Regional San Diego Area Fault Systems (Modified from Artim
and Mills, 1983) Figure 5-2 Local San Diego Area Fault Systems (Modified from WCC,
1992) Figure 5-3 Fault Zones Offshore of the San Diego Area Showing
Restraining Bends Figure 6-1 Design Response Spectra for South Bay Site Figure 6-2 California Division of Mines and Geology Standardized Ground
Motion Parameters Map

Duke Energy Introduction
136469 1-1
1.0 Introduction
This Geotechnical Foundation Analysis presents a summary of the subsurface site conditions, geotechnical data, and preliminary foundation recommendations for the proposed South Bay Energy Facility to be located in Chula Vista, California. The proposed plant will be gas fired and will consist of two combustion turbines, one steam turbine, one cooling tower, and associated ancillary facilities. A geotechnical investigation program was conducted at the site in May and June of 2005. The investigation consisted of 11 cone penetrometer soundings, with depths ranging from 58 to 100 feet. At two locations, the down-hole shear wave velocity was measured using a seismic cone penetrometer. A site investigation was performed in 2000 by Duke Engineering and Services to evaluate the site�s environmental aspects. This 2000 investigation included electromagnetic surveys and cone penetrometer soundings to a maximum depth of approximately 25 feet. This report includes the following information:
• Site location and description.
• Project description.
• Discussion of geotechnical investigation program.
• Subsurface characterization, including cone penetrometer sounding logs.
• Foundation recommendations.
The data, analysis, conclusions, and recommendations in this report are based on available literature at the time of the report, the site conditions existing at the time of the subsurface investigations, and the assumption that information obtained from the investigation�s cone penetrometer soundings is representative of the subsurface conditions throughout the site. Unanticipated conditions may be encountered during construction because of variations that were not detected during the investigation program. The construction process may also alter ground conditions. Therefore, experienced geological engineering personnel are required to observe and document the conditions encountered and ensure that proper construction procedures are used. If, during construction, conditions differ because of natural or manmade causes, this report should be reviewed by qualified geotechnical engineers to determine the applicability of the conclusions and recommendations concerning the differences in conditions. This report was prepared solely for the benefit of Duke Energy Corporation (�the Client�) by Black & Veatch Corporation under the terms and conditions of a written agreement dated March 31, 2004 (�the Agreement�), between Duke Energy Corporation and Black & Veatch Corporation, and is based on information not within the control of Duke Energy Corporation or Black & Veatch Corporation. Neither Duke Energy Corporation

Duke Energy Introduction
136469 1-2
nor Black & Veatch Corporation has performed an analysis, verified data, or rendered an independent judgment of the validity of the information provided by others. WHILE IT IS BELIEVED THAT THE INFORMATION, DATA, AND OPINIONS CONTAINED HEREIN WILL BE RELIABLE UNDER THE CONDITIONS AND SUBJECT TO THE LIMITATIONS SET FORTH HEREIN, THE CLIENT AND BLACK & VEATCH CORPORATION DO NOT GUARANTEE THE ACCURACY THEREOF. EXCEPT AS OTHERWISE ALLOWED BY THE AGREEMENT, THIS REPORT MAY NOT BE RELIED ON OR USED BY ANYONE WITHOUT THE EXPRESS WRITTEN AUTHORIZATION OF BLACK & VEATCH CORPORATION, AND SUCH USE SHALL CONSTITUTE AGREEMENT BY THE USER THAT ITS RIGHTS, IF ANY, ARISING FROM THIS REPORT SHALL BE SUBJECT TO THE TERMS OF THE BLACK & VEATCH CORPORATION AUTHORIZATION, AND IN NO EVENT SHALL USER�S RIGHTS, IF ANY, EXCEED THOSE OF THE CLIENT UNDER THE AGREEMENT.

Duke Energy Summary
136469 2-1
2.0 Summary
Conclusions and recommendations based on the information obtained during the current investigation are summarized below:
• The project area is suitable for the planned development from a geotechnical standpoint, provided that the recommendations of this report are followed.
• The groundwater elevation is at approximately at +11 mean sea level (msl), which is approximately 0.5 to 4 feet below the existing site grade.
• The subsurface profile consists of a zone of interbedded fine-grained soils overlying a zone of interbedded coarser-grained soils. Bedrock was not encountered within the 100 foot depth of the investigation.
• Preliminary liquefaction analyses indicate the potential for liquefaction at the proposed site.
• The preliminary foundation evaluation indicates that shallow foundations are not an acceptable foundation alternative for heavily loaded and settlement-sensitive structures at the South Bay Energy Facility.
• Piles driven to an estimated depth of 100 feet should be used to support heavily loaded and settlement-sensitive structures.
• Fourteen inch square prestressed precast concrete piles driven to a 100 ft depth were evaluated and are estimated to have an allowable compression capacity of 70 tons.
• To proceed with final design, detailed additional geotechnical investigation is required at the site.

Duke Energy Site Conditions
136469 3-1
3.0 Site Conditions
3.1 Site Location The proposed South Bay Energy Facility site is located in Chula Vista, California, which is south of San Diego, California. A site vicinity map is shown on Figure 3-1. 3.2 Site Description The proposed South Bay Power Plant is situated on Bay Boulevard, west of Interstate 5 along the southeast coast of San Diego Bay (32N 36� 34.12�, -117W 05� 37.68�). Topographic relief across the 33 acre site ranges from a low elevation of approximately 11 feet above msl adjacent to San Diego Bay to a high of approximately 25 feet above msl along the eastern edge of the property. Immediately to the north and adjoining the property is Duke Energy Corporation�s existing South Bay power plant. To the west and southwest lies a salt mining operation. The eastern 300 feet is a transmission line easement that is not part of the power plant site. The proposed site previously held a liquefied natural gas terminal, which was demolished in 1989. Because of the terminal, existing foundations are present across the site. The foundations for the liquefied natural gas storage tanks were supported on piles, which are not expected to be useful for the proposed power plant. The South Bay Power Plant will consist of two combustion turbines and one steam turbine. The related substation south of the power plant site is to be provided by San Diego Gas and Electric and permitted as a separate project. A proposed plant layout is shown on Figure 3-2.

Duke Energy Subsurface Investigations
136469 4-1
4.0 Subsurface Investigations
The site subsurface investigations consisted of a geotechnical investigation and an environmental assessment. 4.1 Geotechnical Investigation In May and June of 2005, Black & Veatch performed a preliminary site investigation consisting of 11 cone penetrometer test (CPT) soundings with depths ranging from 58 to 100 feet. The locations of the CPT soundings are shown on Figure 3-2. The soundings were completed by Gregg Drilling and Testing, Inc. of Signal Hill, California. The CPT soundings were conducted using a 20 ton capacity cone with a tip area of 15 cm2 and a friction sleeve area of 225 cm2. The cone is designed with an equal-end area friction sleeve and a tip-end area ratio of 0.85. The cone was used to take measurements of cone bearing, sleeve friction, and dynamic pore water pressure at 5 cm intervals during penetration to provide a nearly continuous log. At CPT-2 and 4, down-hole shear wave velocity measurements were performed using a seismometer built into the cone penetrometer. Down-hole seismic testing was performed at approximate 5 foot intervals. Pore pressure dissipation tests were conducted using the CPT at various locations and depths to measure hydrostatic water pressures. Logs of the CPT soundings, shear wave velocity measurements, and pore pressure dissipation test results are presented in Appendix A. 4.2 Previous Environmental Assessment The environmental assessment was performed by Duke Engineering & Services (DE&S) in 2000 to evaluate the environmental aspects of the site. The investigation consisted of performing electromagnetic surveys and cone penetrometer soundings to a maximum depth of approximately 25 feet. The results of the investigation are presented in a report prepared by DE&S entitled �Environmental Assessment Report for the Port of San Diego Former Liquefied Natural Gas Facility,� dated August 8, 2001. The DE&S report provides the following overall conclusion:
�Based on the results of the November 2000 field effort, a second targeted investigation is not proposed. Several contaminants were detected at low concentrations, and these appear typical of a former industrial site. Arsenic was found above the drinking water standard in a concrete catch basin from the location of the former cooling tower. Selenium was detected above the drinking water standard in all three groundwater samples tested for metals, suggesting that this may be representative of background conditions. No further
Duke Energy Subsurface Investigations
136469 4-2
investigation of the LNG site is recommended at this time. Should the site be developed in the future, DE&S recommends that an environmental professional be present during all excavation and grading activities to inspect for the presence of any previously undisclosed environmental conditions.�
Duke Energy Subsurface Conditions
136469 5-1
5.0 Subsurface Conditions
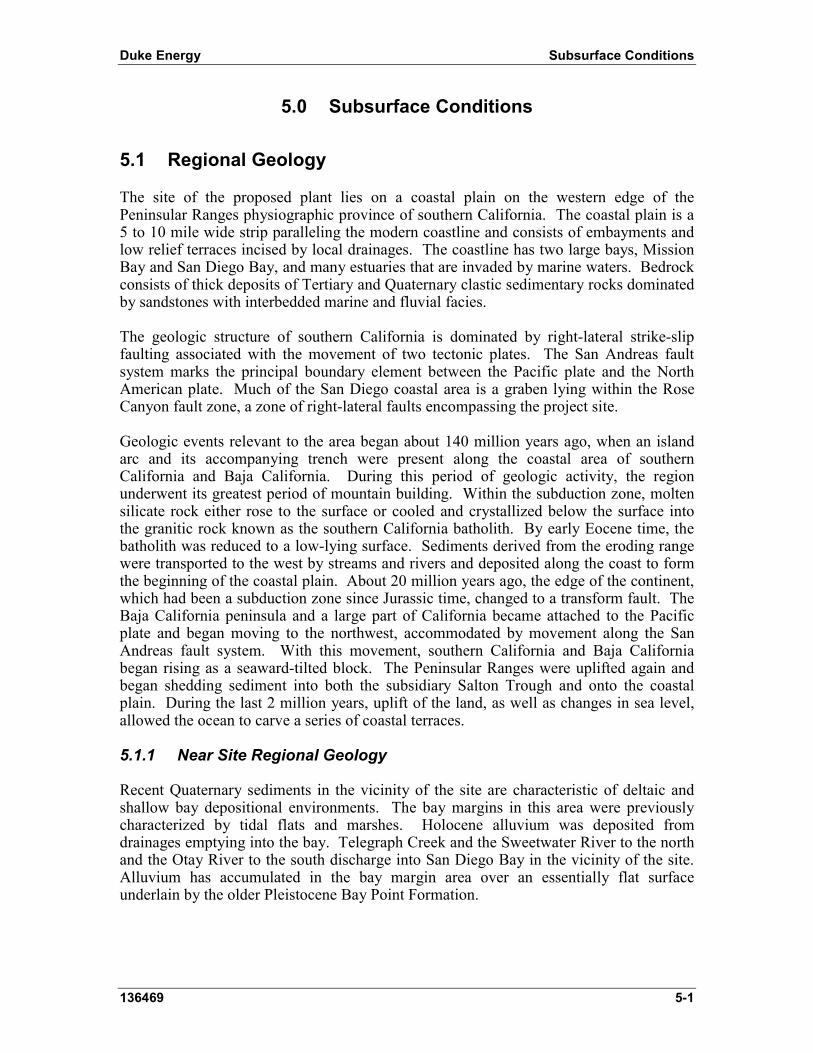
5.1 Regional Geology The site of the proposed plant lies on a coastal plain on the western edge of the Peninsular Ranges physiographic province of southern California. The coastal plain is a 5 to 10 mile wide strip paralleling the modern coastline and consists of embayments and low relief terraces incised by local drainages. The coastline has two large bays, Mission Bay and San Diego Bay, and many estuaries that are invaded by marine waters. Bedrock consists of thick deposits of Tertiary and Quaternary clastic sedimentary rocks dominated by sandstones with interbedded marine and fluvial facies. The geologic structure of southern California is dominated by right-lateral strike-slip faulting associated with the movement of two tectonic plates. The San Andreas fault system marks the principal boundary element between the Pacific plate and the North American plate. Much of the San Diego coastal area is a graben lying within the Rose Canyon fault zone, a zone of right-lateral faults encompassing the project site. Geologic events relevant to the area began about 140 million years ago, when an island arc and its accompanying trench were present along the coastal area of southern California and Baja California. During this period of geologic activity, the region underwent its greatest period of mountain building. Within the subduction zone, molten silicate rock either rose to the surface or cooled and crystallized below the surface into the granitic rock known as the southern California batholith. By early Eocene time, the batholith was reduced to a low-lying surface. Sediments derived from the eroding range were transported to the west by streams and rivers and deposited along the coast to form the beginning of the coastal plain. About 20 million years ago, the edge of the continent, which had been a subduction zone since Jurassic time, changed to a transform fault. The Baja California peninsula and a large part of California became attached to the Pacific plate and began moving to the northwest, accommodated by movement along the San Andreas fault system. With this movement, southern California and Baja California began rising as a seaward-tilted block. The Peninsular Ranges were uplifted again and began shedding sediment into both the subsidiary Salton Trough and onto the coastal plain. During the last 2 million years, uplift of the land, as well as changes in sea level, allowed the ocean to carve a series of coastal terraces. 5.1.1 Near Site Regional Geology Recent Quaternary sediments in the vicinity of the site are characteristic of deltaic and shallow bay depositional environments. The bay margins in this area were previously characterized by tidal flats and marshes. Holocene alluvium was deposited from drainages emptying into the bay. Telegraph Creek and the Sweetwater River to the north and the Otay River to the south discharge into San Diego Bay in the vicinity of the site. Alluvium has accumulated in the bay margin area over an essentially flat surface underlain by the older Pleistocene Bay Point Formation.

Duke Energy Subsurface Conditions
136469 5-2
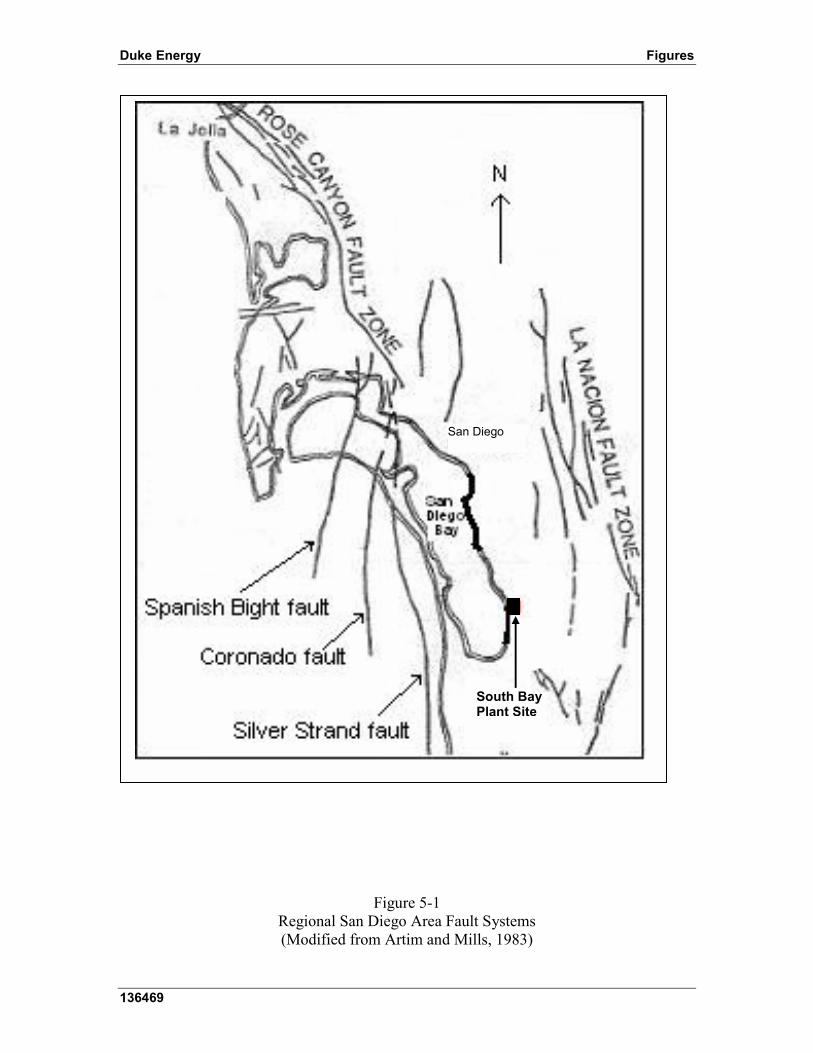
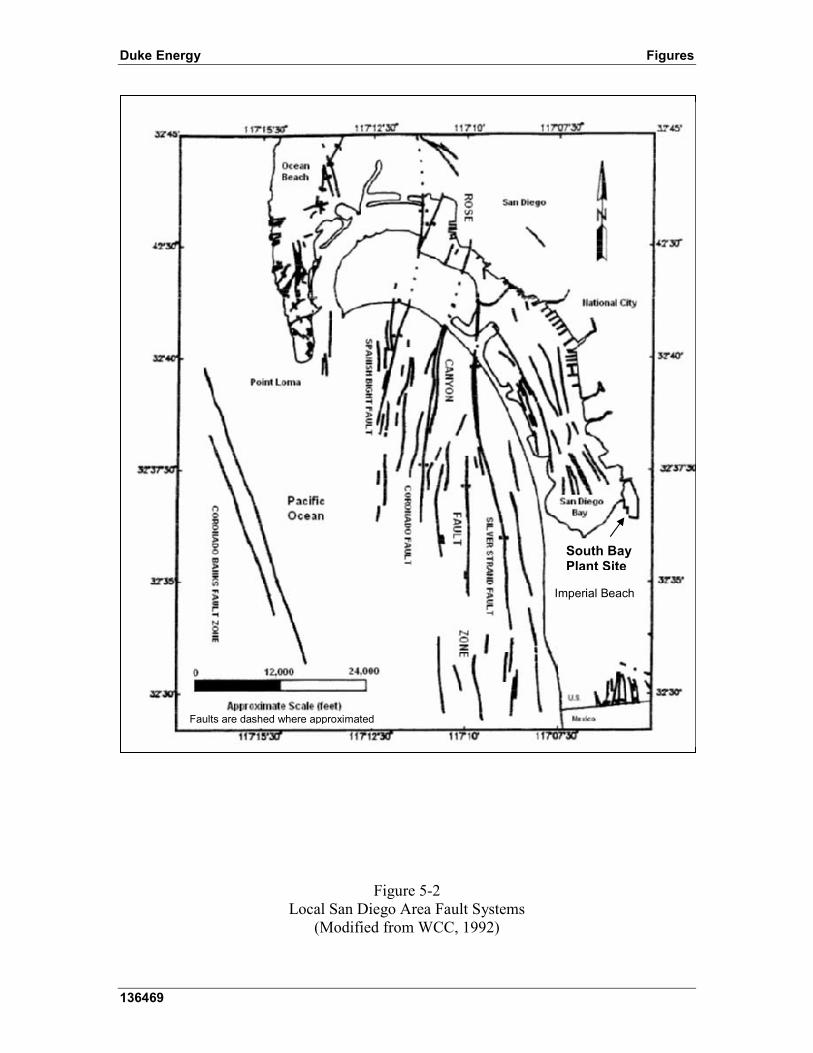
The site is located in a shallow bay and deltaic depositional environment; therefore, continuous horizontal soil layers are not likely to exist. Instead, pockets and lenses are common. These alluvial sediments consist of loose-to-medium dense silty and clayey sand, silty clay, and clayey silt. The alluvial deposits are underlain by stiff-to-very stiff sandy clay and dense silty and clayey sand of the Bay Point Formation. These sands are, in turn, underlain by the Pliocene San Diego Formation, which consists predominantly of silty, fine- to coarse-grained sand with minor claystone and gravel interbeds. The San Diego Formation is underlain at a depth of approximately 300 feet by Oligocene and Eocene sedimentary rock that extends to depths of approximately 3,800 feet. These well-consolidated sedimentary bedrock units include the Otay and Sweetwater Formations and the Poway and La Jolla Groups. Below about 3,800 feet and down to a depth of about 6,500 feet, the area is underlain by sedimentary bedrock of the Cretaceous Rosario Group. Metamorphic and granitic bedrock underlies the site below an estimated depth of approximately 6,500 feet. 5.1.2 Seismicity Since the advent of seismographs in the 1930s, the historical pattern of seismic activity in coastal San Diego has generally been characterized as a broad scattering of small-to-moderate magnitude earthquakes. The surrounding regions of southern California, northern Baja California, and the nearby offshore regions where many moderate-to-large magnitude earthquakes have occurred during the past 50 years are characterized by a higher rate of seismicity. Continued study of the Rose Canyon and offshore fault zones indicates that large, though infrequent earthquakes have repeatedly affected the San Diego area. The Rose Canyon fault zone is one of the main controlling structural features of the San Diego area (Petersen et al., 1996). A releasing bend in the fault zone produced the subsidence responsible for the formation of San Diego Bay. Though no faults are known to run through or project onto the project site, it is surrounded by strands of the Rose Canyon fault zone and other similar fault zones, including the related La Nacion fault zone to the east (Figures 5-1 and 5-2). Also to the east of the project site are the San Andreas, San Jacinto, and Elsinore fault zones, and to the west are the offshore Coronado Bank, San Diego Trough, and San Clemente fault zones. The Silver Strand fault, a strand of the Rose Canyon fault zone 2.5 miles away on the west side of San Diego Bay, is the nearest known major fault. A number of small, discontinuous faults are known to exist nearby underneath San Diego Bay; the closest to the site is approximately 0.5 mile from the site. Deaggregation of seismic hazards studies indicate that the Rose Canyon and Coronado Bank fault zones are expected to produce the majority of the total number of seismic events affecting the plant site. For events with peak ground accelerations greater than 0.3g, the Rose Canyon fault zone is the primary contributor (Table 5-1), contributing 94 percent of the total seismic hazard. The contribution from more distant faults is substantial only for events with peak ground accelerations of 0.1g and lower. Figures 5-1 and 5-2 indicate the location of the Rose Canyon Fault Zone. Within the Rose Canyon

Duke Energy Subsurface Conditions
136469 5-3
Fault Zone, the closest major fault to the site is the Silver Strand fault, which is showed on Figures 5-1 and 5-2. For the Silver Strand fault, the maximum magnitude earthquake is 6.9 (Petersen et al., 1996).
Table 5-1 Contribution of Various Faults to
Total Seismic Hazard for a Nearby Site
Percent Contribution for Acceleration Fault Name >0.1g ≥ 0.3g ≥ 0.4g
Rose Canyon La Nacion Coronado Banks San Diego Trough Elsinore Total
28 1
54 6
11 100
86 0
12 1
1 100
94 0 5 1
0 100
Data considers sites in coastal San Diego located within approximately 5 km from the Rose Canyon fault zone (from SDG&E, 1993). (Woodward-Clyde Consultants, 1992).
5.2 Geologic Hazards Potential geologic hazards at the site include seismic activity, flooding, and tsunamis. The following subsections address these aspects. 5.2.1 Seismic Activity The site is located in Southern California, which is commonly known to have seismically active areas. Sections 5.1.2, 6.2, and 7.1.2 address seismic hazards at the proposed South Bay site. 5.2.2 Flooding The plant site is located in two designations of Flood Zone X as determined by the FEMA Flood Insurance Rate Map, effective June 19, 1997. The majority of the site is located in Flood Zone X, designated as �areas determined to be outside the 500 year floodplain,� with an annual probability of flooding of less than 0.2 percent. Small portions of the site are located in Flood Zone X designated as �Areas of 500 year flood plain; area of 100 year flood with average depths of less than 1 foot or with drainage areas less than 1 square mile; and areas protected by levees from 100 year flood,� with an

Duke Energy Subsurface Conditions
136469 5-4
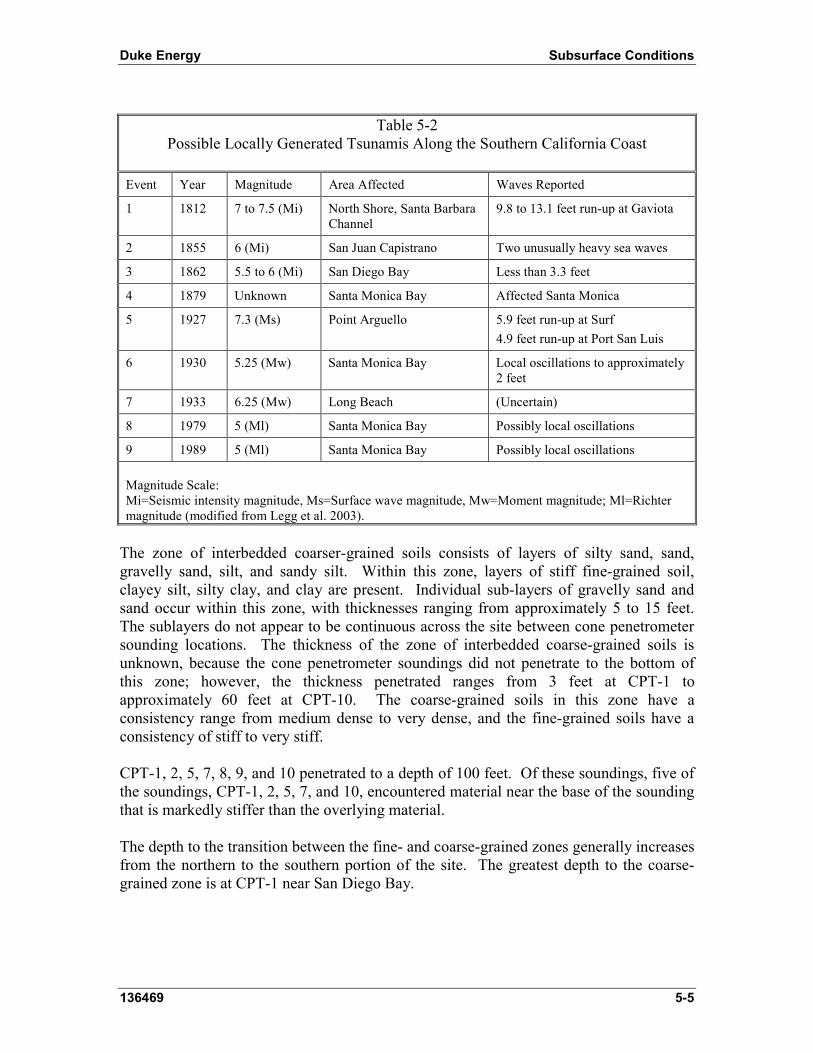
annual flooding probability of 0.2 to 1 percent. According to the FEMA Flood Insurance Rate Map, no base flood elevation has been established for Zone X; however, for Zone AE, which is adjacent to the proposed site, the base flood elevation is 6 feet. The present low elevation of the site is planned to be approximately 11.0 feet in the area adjacent to San Diego Bay. 5.2.3 Tsunamis Tsunamis are seismically induced ocean waves with very long periods. Tsunami waves may be manifested in the form of wave bores or a gradual upwelling of sea level and can be caused by landslides or undersea earthquakes. Bathymetric studies of the ocean floor off San Diego have revealed numerous Holocene fault scarps, suggesting repeated seismic activity capable of tsunami production. Restraining bends in the San Diego Trough fault zone at Santa Catalina Island and southwest of the city in the San Clemente fault zone (the �bend region� as shown on Figure 5-3) may be capable of producing sudden seafloor uplift and are the two known areas of potential tsunami generation most likely to affect coastal San Diego (Legg et al., 2003). Based on documented research (Houston and Garcia, 1974; Joy, 1968; Legg et al. 2003), statistical probabilities of tsunamis along the southern California coast indicate that large, seismically induced sea waves are uncommon or rare. Table 5-2 summarizes the known wave run-ups along the southern California coast. Probabilistic models (Houston and Garcia, 1974; Legg and Goldfinger, 2002) based on source characteristics, orientation, and location predict maximum sea level rises of 3.8 to 4.2 feet and 6.6 to 7.6 feet in the vicinity of the site for the 100- and 500-year return periods, respectively. These estimates have a statistical error of approximately ±40 percent. It should be noted that these calculated tsunami heights do not account for tidal fluctuations; high tides in the San Diego area can rise up to 8 feet. Furthermore, until the last decade, there have been only limited studies of offshore fault zones, and the potential for tsunamis may not be adequately realized. Because of the lack of a clearly identified danger, shore protection structures along the coastline in and around San Diego are not normally designed for tsunami conditions. 5.3 Site-Specific Geologic Conditions The results of the 11 cone penetrometer soundings indicate that, within the depth investigated, the subsurface profile consists of a zone of interbedded fine-grained soils overlying a zone of interbedded coarser-grained soils. Bedrock was not encountered within the 100 foot depth of the investigation. The zone of interbedded fine grained soils consists primarily of layers of clay, silty clay, clayey silt, and silt. Within this zone, there are occasional thin layers of silty sand and sand. The zone of interbedded fine-grained soils ranges in thickness from 97 feet or more at CPT-1 to approximately 35 feet at CPT-4, 10, and 11, with an average thickness of 60 to 65 feet. At CPT-1, it is possible that the coarser soils observed at the bottom of the sounding represent a thin layer within the fine-grained zone rather than the top of the coarse-grained zone. The upper 5 to 10 feet of this zone is weaker material with a soft to firm consistency and may be fill material. Below the weaker material, this zone has a stiff-to-hard consistency.
Duke Energy Subsurface Conditions
136469 5-5
Table 5-2
Possible Locally Generated Tsunamis Along the Southern California Coast
Event Year Magnitude Area Affected Waves Reported
1 1812 7 to 7.5 (Mi) North Shore, Santa Barbara Channel
9.8 to 13.1 feet run-up at Gaviota
2 1855 6 (Mi) San Juan Capistrano Two unusually heavy sea waves
3 1862 5.5 to 6 (Mi) San Diego Bay Less than 3.3 feet
4 1879 Unknown Santa Monica Bay Affected Santa Monica
5 1927 7.3 (Ms) Point Arguello 5.9 feet run-up at Surf 4.9 feet run-up at Port San Luis
6 1930 5.25 (Mw) Santa Monica Bay Local oscillations to approximately 2 feet
7 1933 6.25 (Mw) Long Beach (Uncertain)
8 1979 5 (Ml) Santa Monica Bay Possibly local oscillations
9 1989 5 (Ml) Santa Monica Bay Possibly local oscillations Magnitude Scale: Mi=Seismic intensity magnitude, Ms=Surface wave magnitude, Mw=Moment magnitude; Ml=Richter magnitude (modified from Legg et al. 2003).
The zone of interbedded coarser-grained soils consists of layers of silty sand, sand, gravelly sand, silt, and sandy silt. Within this zone, layers of stiff fine-grained soil, clayey silt, silty clay, and clay are present. Individual sub-layers of gravelly sand and sand occur within this zone, with thicknesses ranging from approximately 5 to 15 feet. The sublayers do not appear to be continuous across the site between cone penetrometer sounding locations. The thickness of the zone of interbedded coarse-grained soils is unknown, because the cone penetrometer soundings did not penetrate to the bottom of this zone; however, the thickness penetrated ranges from 3 feet at CPT-1 to approximately 60 feet at CPT-10. The coarse-grained soils in this zone have a consistency range from medium dense to very dense, and the fine-grained soils have a consistency of stiff to very stiff. CPT-1, 2, 5, 7, 8, 9, and 10 penetrated to a depth of 100 feet. Of these soundings, five of the soundings, CPT-1, 2, 5, 7, and 10, encountered material near the base of the sounding that is markedly stiffer than the overlying material. The depth to the transition between the fine- and coarse-grained zones generally increases from the northern to the southern portion of the site. The greatest depth to the coarse-grained zone is at CPT-1 near San Diego Bay.
Duke Energy Subsurface Conditions
136469 5-6
Groundwater elevations estimated from pore pressure measurements at two of the cone penetrometer sounding locations indicate groundwater at approximately elevation +11 msl at the time of this investigation, which is approximately 0.5 to 4 feet below the existing site grade. The shear wave velocities measured at CPT-2 and 4 ranged from 647 to 1,403 feet per second. The average shear wave velocity for both locations combined was 1,061 feet per second. The average shear wave velocity at CPT-2 was 973 feet per second, while the average shear wave velocity at CPT-4 was 1,189 feet per second, indicating slightly stiffer soils in the vicinity of CPT-4.

Duke Energy Preliminary Design Parameters
136469 6-1
6.0 Preliminary Design Parameters
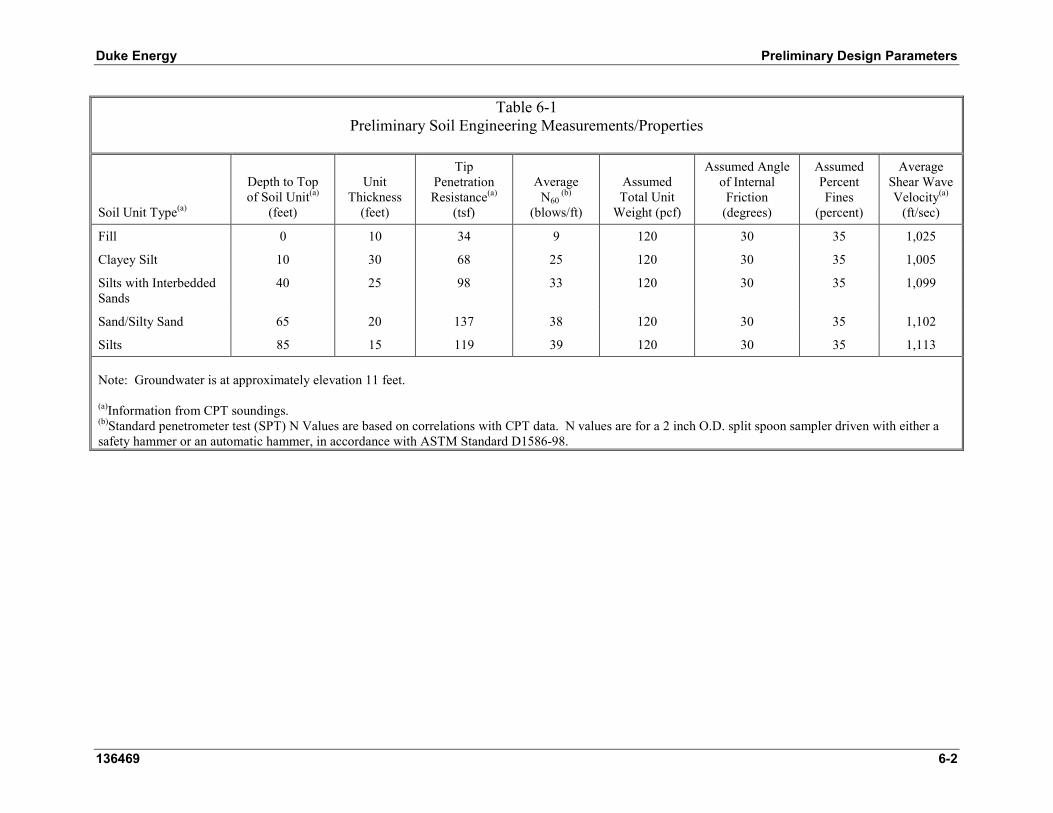
6.1 Soil Parameters Information from CPT soundings was used to establish preliminary design parameters for foundation evaluation, as shown in Table 6-1. Soil unit types are based on descriptions of soil behavior type (SBT) from cone penetration data. Assumed values for total unit weight, angle of internal friction, and percent fines were used for preliminary analyses. Pore pressure dissipation tests performed during the CPT soundings were used to estimate the groundwater level. It is estimated that the ground water table is approximately 0.5 to 4 feet below grade, which corresponds to approximately elevation 11 feet. 6.2 Ground Motion Parameters The approach for estimating ground motion parameters is established by the applicable building code. The current California Building Code is based on the Uniform Building Code (UBC). Under the UBC, the ground motion parameters are based on earthquakes producing ground motions with a 10 percent probability of exceedance in 50 years. However, the California Building Code is scheduled to be revised in 2007. At that time, indications are that the International Building Code (IBC) will be used as the basis for a new 2007 building code for the State of California. Using the IBC, the design ground motion parameters are estimated based on earthquakes producing ground motions with a 2 percent probability of exceedance in 50 years. To include evaluation of the two potentially applicable building code criteria, the peak ground acceleration based on both the UBC and the IBC have been estimated. From the USGS (http://eqint.cr.sugs.gov/eq/cgi-bin/find-11-2002-interp.cgi), the peak ground accelerations at the bedrock surface for earthquakes producing ground motions with potentials of 2 and 10 percent of being exceeded in 50 years are 0.25g and 0.54g, respectively. The estimation of the ground motion that will occur at the ground surface requires application of the building codes, as is done herein. The California Division of Mines and Geology (DMG) allows the use standardized ground motion maps to estimate ground motions for liquefaction analyses (Martin and Lew, 1999). These maps are based on the UBC and are therefore, based on earthquakes producing ground motions with a 10 percent probability of exceedance in 50 years. The DMG provides estimated peak ground accelerations for three soil types, firm rock, soft rock, and alluvium. The advantage of using the DMG maps versus simply applying maps in the UBC is that the DMG maps are based on more area-specific information, while the UBC addresses ground motion on a more regional basis. Therefore, the UBC maps apply the worst case within a region to areas that may not be subject to the worst case conditions.
Duke Energy Preliminary Design Parameters
136469 6-2
Table 6-1 Preliminary Soil Engineering Measurements/Properties
Soil Unit Type(a)
Depth to Top of Soil Unit(a)
(feet)
Unit Thickness
(feet)
Tip Penetration Resistance(a)
(tsf)
Average N60
(b)
(blows/ft)
Assumed Total Unit
Weight (pcf)
Assumed Angle of Internal
Friction (degrees)
Assumed Percent Fines
(percent)
Average Shear Wave Velocity(a)
(ft/sec)
Fill 0 10 34 9 120 30 35 1,025
Clayey Silt 10 30 68 25 120 30 35 1,005
Silts with Interbedded Sands
40 25 98 33 120 30 35 1,099
Sand/Silty Sand 65 20 137 38 120 30 35 1,102
Silts 85 15 119 39 120 30 35 1,113 Note: Groundwater is at approximately elevation 11 feet. (a)Information from CPT soundings. (b)Standard penetrometer test (SPT) N Values are based on correlations with CPT data. N values are for a 2 inch O.D. split spoon sampler driven with either a safety hammer or an automatic hammer, in accordance with ASTM Standard D1586-98.

Duke Energy Preliminary Design Parameters
136469 6-3
The estimated ground motion parameters presented herein will be used to evaluate the liquefaction potential at the site. The following four different methods were used to estimate the ground motion parameters:
• UBC 1997.
• IBC 2003.
• DMG standardized ground motion maps.
• Campbell�s attenuation relationship.
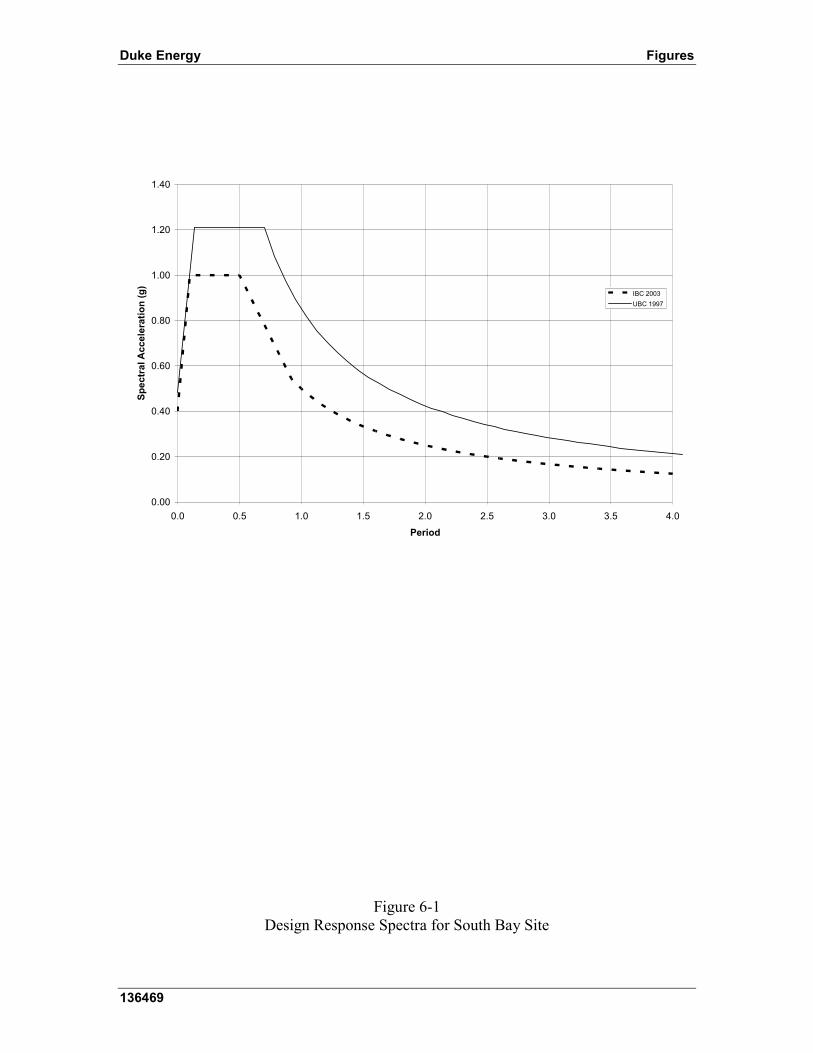
Section 7.1.2 presents the results of the liquefaction analyses based on peak ground accelerations and earthquake magnitudes estimated in Sections 6.2.1, 6.2.2, 6.2.3, and 6.2.4. 6.2.1 Uniform Building Code (UBC 1997) The proposed site is located in Seismic Zone 4, based on the seismic zone map of the United States (UBC Figure 16-2, p. 2-37). Using the UBC and shear wave velocities measured using down-hole seismic techniques at two (CPT) soundings, the site preliminarily classifies as a Site Class SD. The most likely seismic source for ground accelerations larger than 0.4g is the Rose Canyon Fault zone. This fault zone has a slip rate of less than 2 mm/year and a 6.9 maximum earthquake magnitude (Petersen, 1996), which is classified as a Seismic Source Type B in the UBC. Table 6-2 provides the UBC near source factors Na and Nv used to determine the seismic coefficient at 0 period (Ca) and at larger periods (Cv), respectively. The design response spectrum for the site is presented in Figure 6-1. The peak acceleration at the ground surface is 0.48g, which is the spectral acceleration for a period of 0. It was assumed that this acceleration would occur during an earthquake with magnitude of 6.9. 6.2.2 International Building Code (IBC 2003) Based on the IBC (2003) using the measured shear wave velocities, the proposed site classifies as a Site Class D. The maximum spectral response acceleration at periods of 0.2 second (Ss) and 1 second (S1) with 5 percent critical damping were determined to be 1.5g and 0.5g, as shown in Table 6-3. The site adjusted spectral response accelerations (Sms and Sm1) and the design spectral response acceleration parameters (SDS and SD1) are also presented in Table 6-3. The design response spectrum based on the IBC code is presented on Figure 6-1. The peak acceleration at the ground surface is 0.4g, which is the spectral acceleration for a period of 0. Again, it was assumed that this acceleration would occur during an earthquake with magnitude 6.9.

Duke Energy Preliminary Design Parameters
136469 6-4
Table 6-2
Uniform Building Code Seismic Parameters
Parameter Value
Seismic Zone/Zone Factor 4/0.4
Site Class SD*
Closest Distance to Known Seismic Source (km)
4
Near source factor Na 1.1
Near source factor Nv 1.3
Seismic coefficient Ca 0.48
Seismic coefficient Cv 0.85 *Initial classification, based on Shear wave velocity
Table 6-3 International Building Code Seismic Parameters
Parameter Values
Short period spectral acceleration, Ss 1.5
1-second period spectral acceleration, S1 0.5
Short period site coefficient, Fa 1.0
1-second period site coefficient, Fv 1.5
Adjusted short period spectral acceleration, Sms 1.5
Adjusted 1-sec period spectra acceleration, Sm1 0.75
Short period design spectral acceleration, SDS 1
1-sec period design spectral acceleration, SD1 0.5
Duke Energy Preliminary Design Parameters
136469 6-5
6.2.3 DMG Standardized Ground Motion Maps Using the UBC and the measured shear wave velocities in the top 100 feet of soil, the proposed site is a Site Class SD, which corresponds to a site with alluvium (http://www.consrv.ca.gov/cgs/rghm/pshamap/pshamap.asp?Longitude=-117.11&Latitude=32.6 ). This soil type corresponds to the near site regional information and the soils encountered during the subsurface investigation. Based on the DMG map, as shown on Figure 6-2, the peak acceleration at the ground surface for the site is 0.315g, and it is assumed that this acceleration will be produced by a 6.9 magnitude earthquake. 6.2.4 Campbell�s Attenuation Relationship Using Campbell�s attenuation relationship (Kramer 1996), the peak acceleration at the site is a function of the distance from the causing fault and the maximum magnitude earthquake observed for the causing fault. Based on this attenuation relationship, an earthquake of magnitude 6.9 at a fault 4 kilometers from the proposed site in the Rose Canyon Fault zone can create a peak ground surface acceleration of 0.44g.

Duke Energy Preliminary Foundation Evaluation
136469 7-1
7.0 Preliminary Foundation Evaluation
This foundation evaluation considers data available from the site specific investigation to provide a preliminary foundation recommendation for the plant site. 7.1 Shallow Foundations The suitability of supporting structures on shallow foundations at the South Bay plant is evaluated herein. 7.1.1 Settlement Criteria established to evaluate the acceptability of shallow foundations based on settlement are as follows:
• Total settlement less than 1.5 inches.
• Differential settlement less than 0.1 percent.
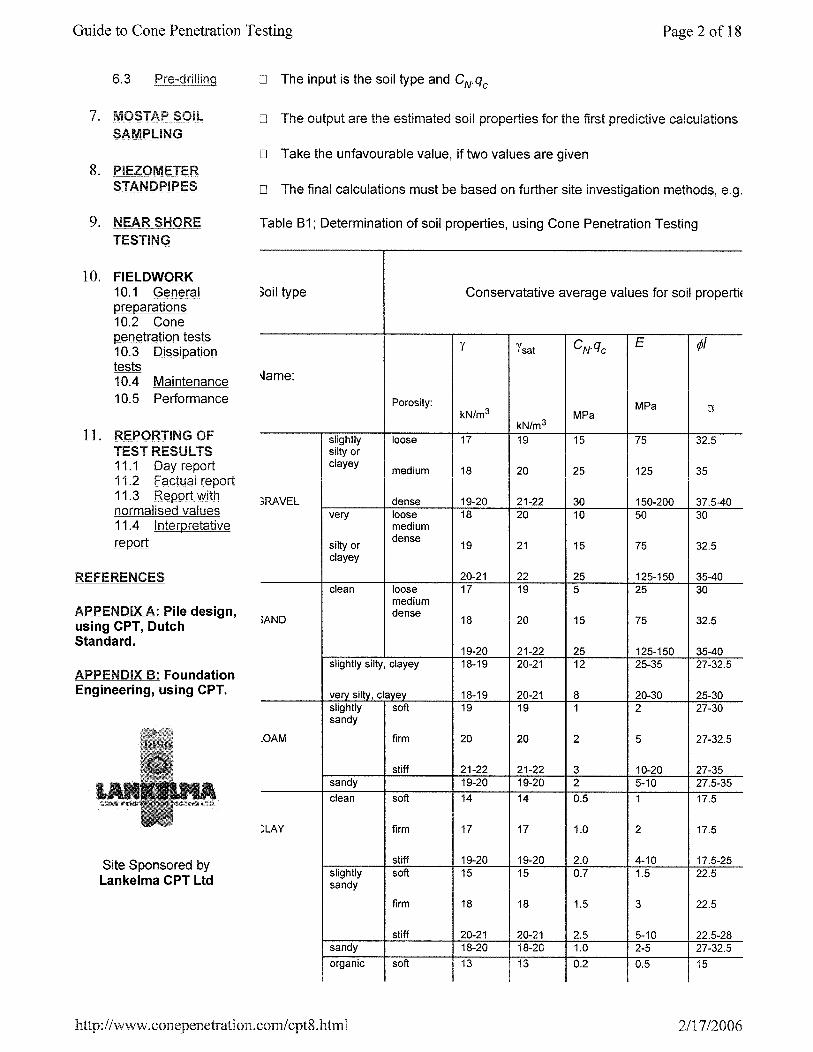
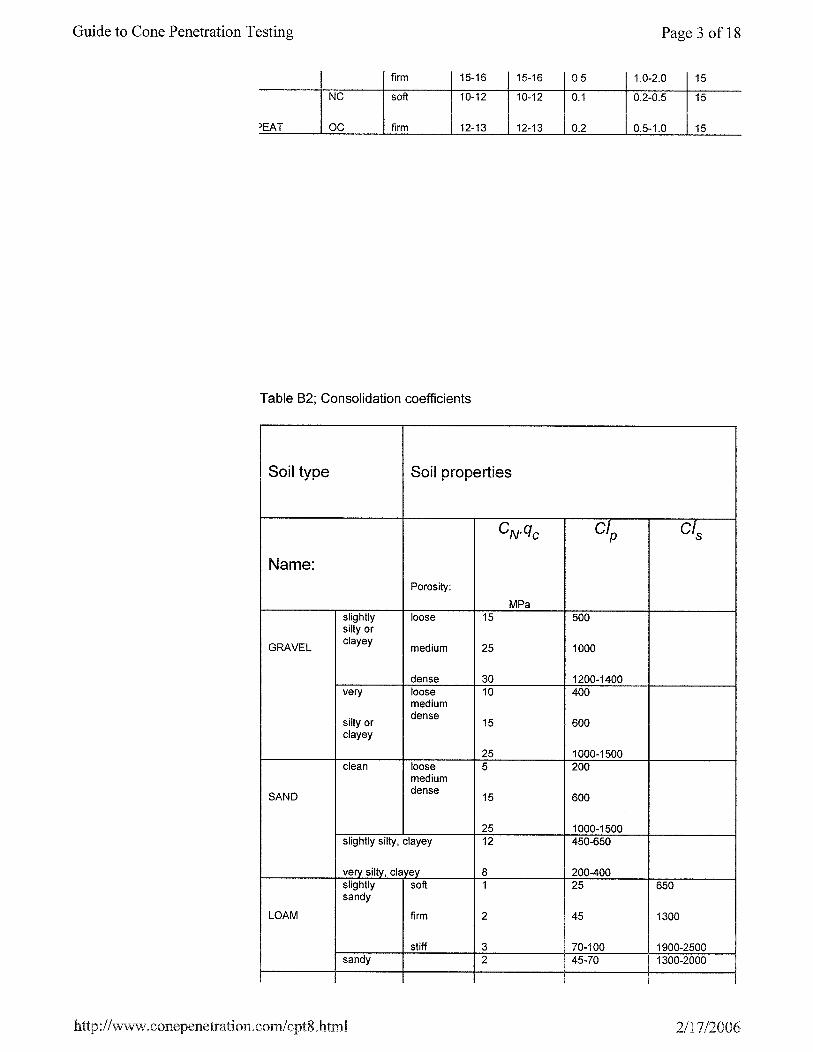
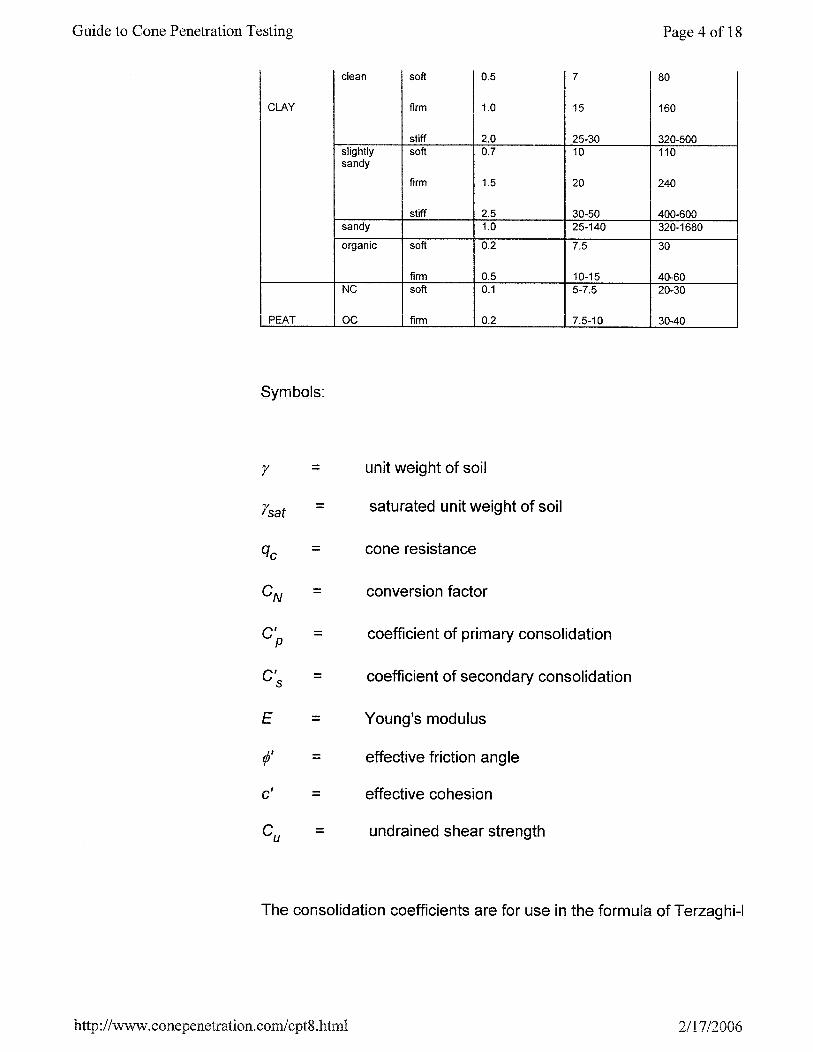
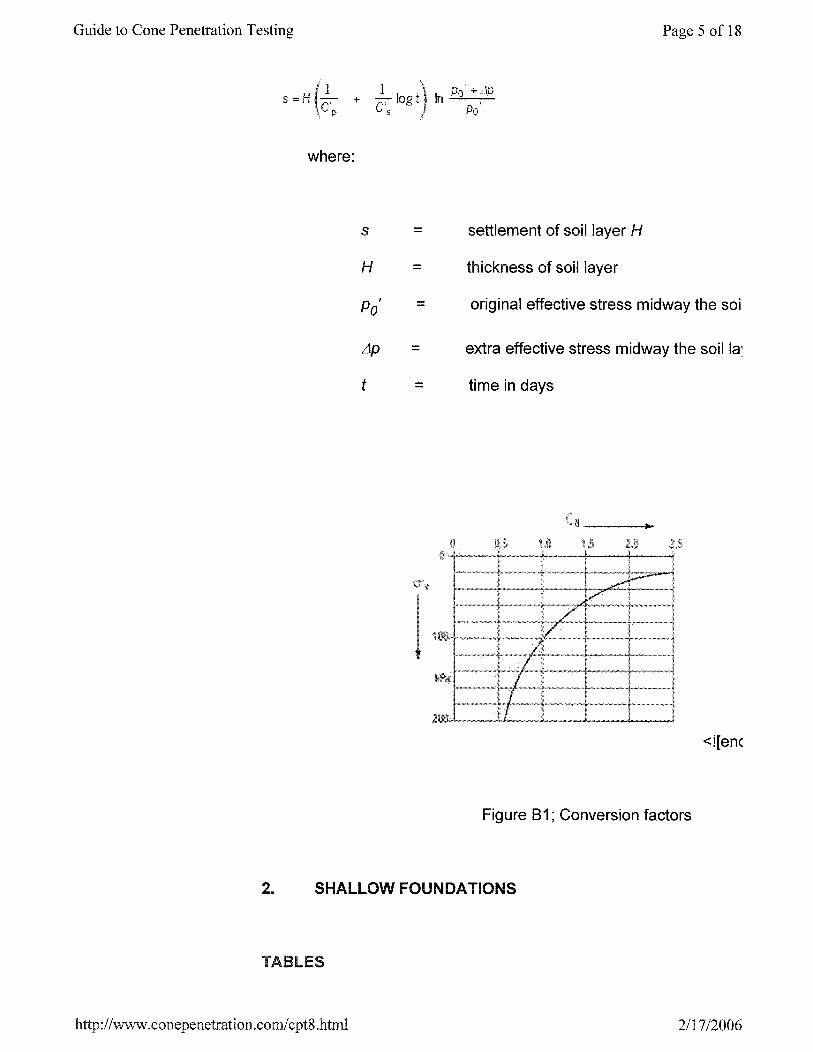
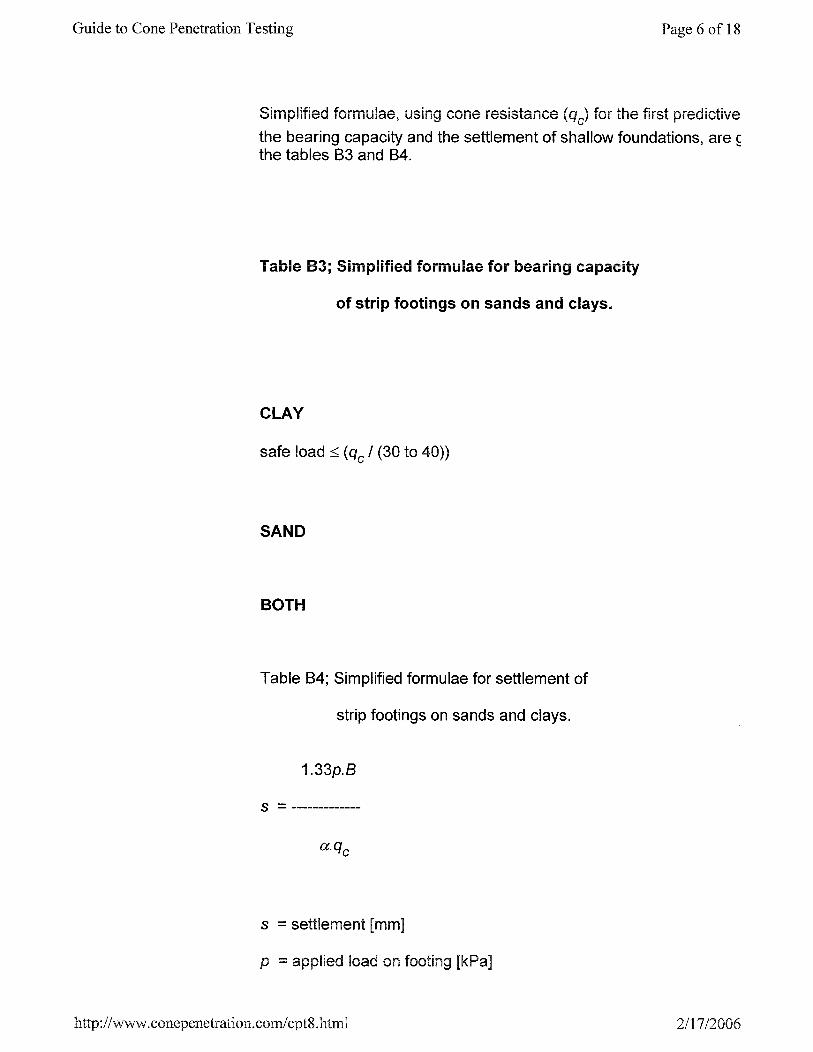
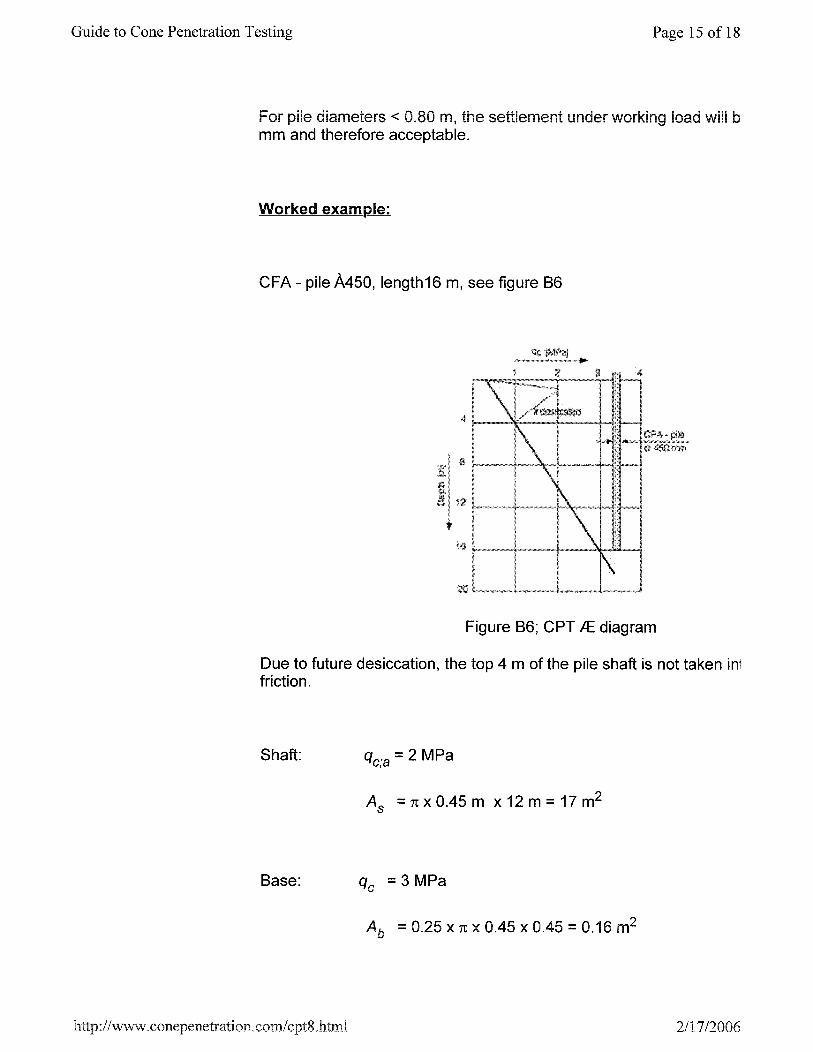
Settlement was evaluated using a method presented by LANKELMA Cone Penetration Testing, Ltd. This approach uses correlations with cone tip resistance to estimate parameters that can be used to estimate the settlement. The procedure is discussed in Appendix B. Settlements were estimated considering the following two conditions:
• Unimproved natural soil profile.
• Ground improvement applied to the upper 10 feet of the soil profile. Ground improvement would consist of overexcavating 10 feet and backfilling the area with a controlled structural fill.
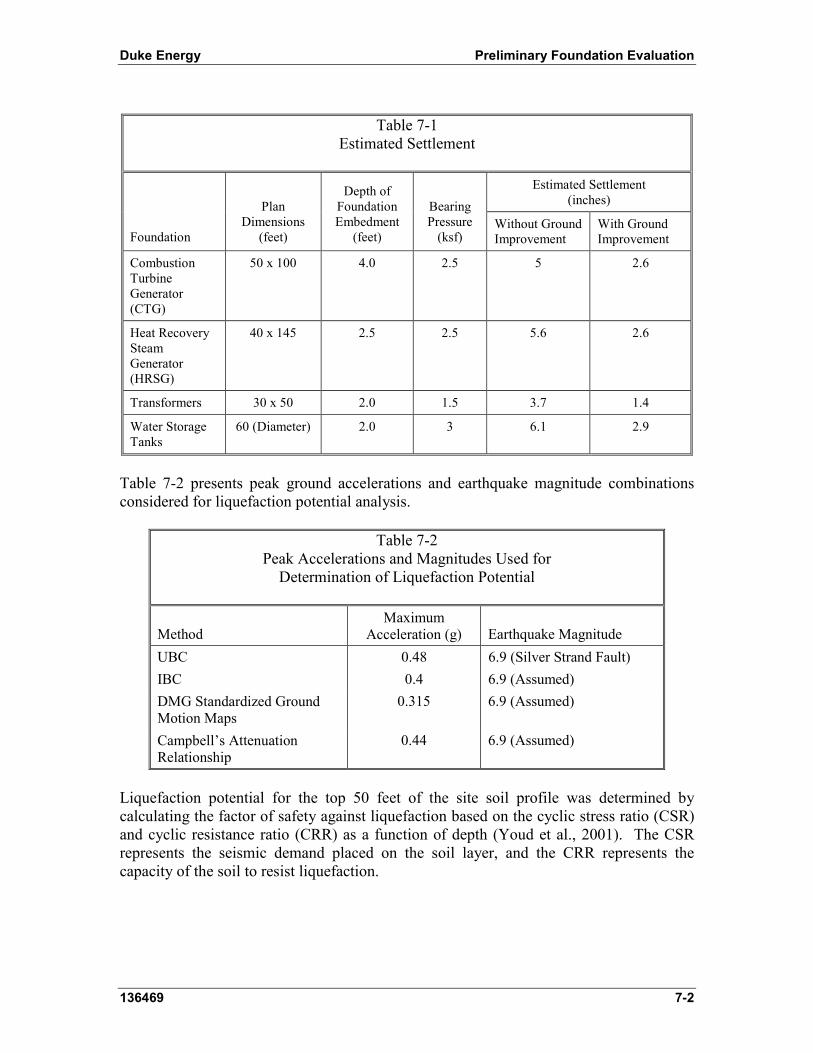
The estimated settlements for the above two subsurface conditions are presented in Table 7-1. All calculated settlements (except in one case) are in excess of the maximum settlement criteria of 1.5 inches. 7.1.2 Liquefaction CPT results at the site indicate the presence of a zone of interbedded fine-grained soils consisting primarily of layers of clay, silty clay, clayey silt, and silt within the top 50 feet of the soil profile. Within this zone there are occasional thin layers of silty sand and sand. Granular materials might liquefy during an earthquake event; therefore, liquefaction potential analyses were performed to determine if liquefaction is a concern for this site.
Duke Energy Preliminary Foundation Evaluation
136469 7-2
Table 7-1
Estimated Settlement
Estimated Settlement (inches)
Foundation
Plan Dimensions
(feet)
Depth of Foundation Embedment
(feet)
Bearing Pressure
(ksf) Without Ground Improvement
With Ground Improvement
Combustion Turbine Generator (CTG)
50 x 100 4.0 2.5 5 2.6
Heat Recovery Steam Generator (HRSG)
40 x 145 2.5 2.5 5.6 2.6
Transformers 30 x 50 2.0 1.5 3.7 1.4
Water Storage Tanks
60 (Diameter) 2.0 3 6.1 2.9
Table 7-2 presents peak ground accelerations and earthquake magnitude combinations considered for liquefaction potential analysis.
Table 7-2 Peak Accelerations and Magnitudes Used for
Determination of Liquefaction Potential
Method Maximum
Acceleration (g) Earthquake Magnitude UBC 0.48 6.9 (Silver Strand Fault) IBC 0.4 6.9 (Assumed) DMG Standardized Ground Motion Maps
0.315 6.9 (Assumed)
Campbell�s Attenuation Relationship
0.44 6.9 (Assumed)
Liquefaction potential for the top 50 feet of the site soil profile was determined by calculating the factor of safety against liquefaction based on the cyclic stress ratio (CSR) and cyclic resistance ratio (CRR) as a function of depth (Youd et al., 2001). The CSR represents the seismic demand placed on the soil layer, and the CRR represents the capacity of the soil to resist liquefaction.

Duke Energy Preliminary Foundation Evaluation
136469 7-3
CRRs were determined on the basis of the cone penetration resistance (qt) values from the 11 CPT soundings performed at the site. The down-hole seismic shear wave velocities measured in two cone penetration soundings were also used to determine the CRR. Because of the higher amount of granular soils encountered in the upper 50 feet of CPT-5 (compared to other CPT�s), the liquefaction potential for this location was also evaluated using SPT �N� values as estimated from correlations with the CPT data. It was assumed that the fines content throughout the soil profile is 35 percent, providing the highest fines correction factor for determining the CRR. Using the highest fines correction factor increases the value of the CRR, resulting in soil that is less likely to liquefy, which is considered a conservative approach for this preliminary analysis. The total unit weight was assumed to be 120 pounds per cubic foot, and the groundwater depth was assumed to be 4 feet throughout the site. For the analysis performed using the SPT �N� values, an earthquake magnitude of 6.9 and a peak acceleration of 0.4g were assumed. The minimum factors of safety for the methods listed in Table 7-2 considering cone penetration tip resistance, shear wave velocity, and SPT �N� values are presented in Table 7-3.
Table 7-3 Minimum Factors of Safety Against Liquefaction
Method
Minimum Factor of Safety Based on
CPT
Minimum Factor of Safety Based on Shear
Wave Velocity
Minimum Factor of Safety Based on SPT
N Value UBC 0.2 1* Not evaluated IBC 0.2 1* 0.6 DMG Standardized Ground Motion Maps
0.3 1* Not evaluated
Campbell�s Attenuation Relationship
0.2 1* Not evaluated
* This is the minimum factor of safety based on shear wave velocity, the actual magnitude of the factor of safety is unknown. It is known that the minimum factor of safety is 1, because literature indicates that the shear wave velocities measured at the South Bay site are larger than maximum shear wave velocities at sites where no liquefaction was observed during earthquakes with magnitudes ranging between 5.9 and 8.3 (Youd et al., 2001)
As shown by the factors of safety in Table 7-3, there is a potential for liquefaction even for the lowest peak acceleration determined using the DMG standardized ground motion maps. Because of the presence of soil with the potential for liquefaction, under the UBC, the site will be characterized as a Class SF Site. If IBC provisions apply, the site will characterize as a Class F site. For both the UBC and IBC, a site-specific dynamic site response analysis is required during design to confirm the potential for liquefaction at the site.
Duke Energy Preliminary Foundation Evaluation
136469 7-4
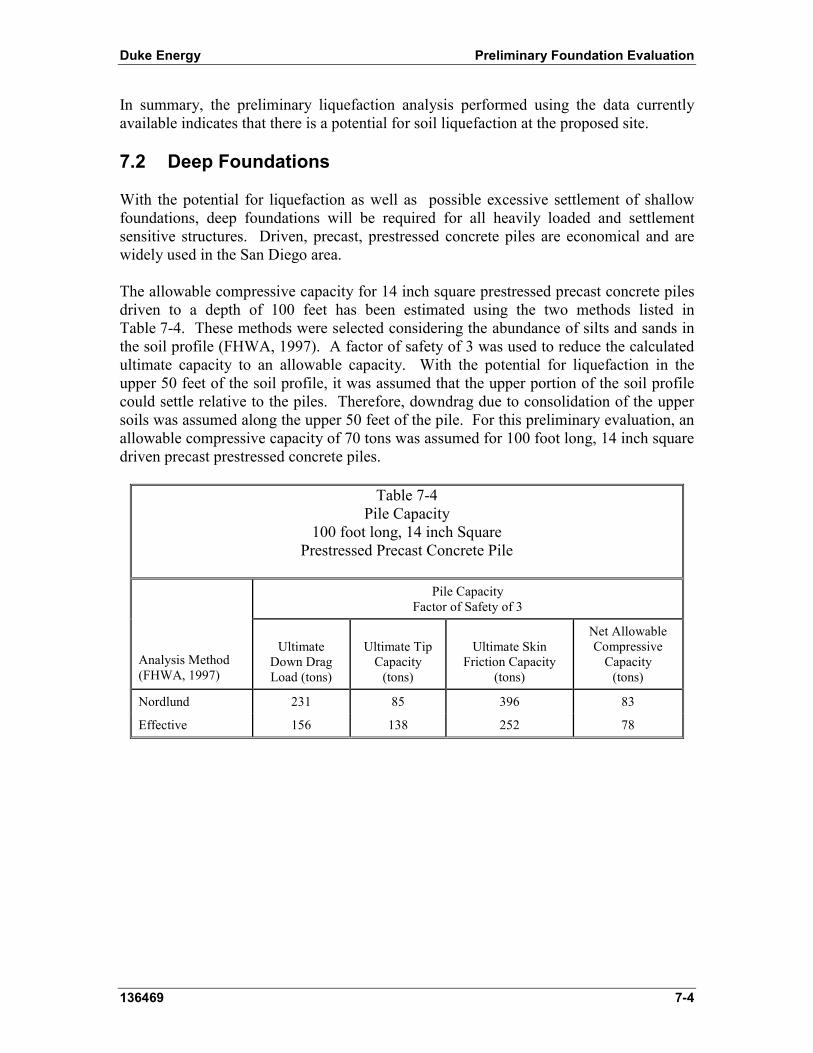
In summary, the preliminary liquefaction analysis performed using the data currently available indicates that there is a potential for soil liquefaction at the proposed site. 7.2 Deep Foundations With the potential for liquefaction as well as possible excessive settlement of shallow foundations, deep foundations will be required for all heavily loaded and settlement sensitive structures. Driven, precast, prestressed concrete piles are economical and are widely used in the San Diego area. The allowable compressive capacity for 14 inch square prestressed precast concrete piles driven to a depth of 100 feet has been estimated using the two methods listed in Table 7-4. These methods were selected considering the abundance of silts and sands in the soil profile (FHWA, 1997). A factor of safety of 3 was used to reduce the calculated ultimate capacity to an allowable capacity. With the potential for liquefaction in the upper 50 feet of the soil profile, it was assumed that the upper portion of the soil profile could settle relative to the piles. Therefore, downdrag due to consolidation of the upper soils was assumed along the upper 50 feet of the pile. For this preliminary evaluation, an allowable compressive capacity of 70 tons was assumed for 100 foot long, 14 inch square driven precast prestressed concrete piles.
Table 7-4 Pile Capacity
100 foot long, 14 inch Square Prestressed Precast Concrete Pile
Pile Capacity
Factor of Safety of 3
Analysis Method (FHWA, 1997)
Ultimate Down Drag Load (tons)
Ultimate Tip Capacity
(tons)
Ultimate Skin Friction Capacity
(tons)
Net Allowable Compressive
Capacity (tons)
Nordlund 231 85 396 83
Effective 156 138 252 78

Duke Energy Conclusions
136469 8-1
8.0 Conclusions
This preliminary foundation evaluation indicates that shallow foundations are not an acceptable foundation alternative for heavily loaded and settlement-sensitive structures at the proposed site because of the potential for excessive settlements and potential soil liquefaction at the site. Deep foundations should be used to support major structures at the site. Piles driven to an approximate depth of 100 feet should be used to support heavily loaded and settlement-sensitive structures. Fourteen inch square prestressed precast concrete piles have been evaluated and are estimated to have an allowable capacity of 70 tons. To proceed with final detailed design, additional investigations are required at the site. Borings should be drilled and recovered soil samples should be tested to establish more reliable design parameters. Several borings should be extended to a depth of at least 150 feet to investigate the subsurface conditions 50 feet below the anticipated tip elevation for piles. Since there is a potential for liquefaction at the site, a site-specific dynamic site response analysis should be performed. The results of the site-specific dynamic site response analysis should then be used to reevaluate the liquefaction potential. These results can be used to estimate settlement and lateral spreading associated with liquefaction.
Duke Energy References
136469 9-1
9.0 References
Artim, Ernest R. and Dorian Elder Mills, 1983, The Rose Canyon Fault, in Guidebook to Selected Geologic Features, Coastal Area of Southern San Diego County, Association of Engineering Geologists, Gregory Farrand, editor, p. 8-24. California Building Code 2001 Triennial Edition of CCR, Title 24, Part 2 Volume 2, 33 p. FHWA Publication HI 97-013, Design and Construction of Driven Pile Foundations, Volume 1. Houston, J. R. and Garcia, A. W., 1974, Tsunami runup predictions for southern California coastal communities, USA: US Army Corps of Engineers, Waterways Experimental Station, 17 p. International Building Code, 2003, Section 16. Joy, J.W. 1968. Tsunami and Their Occurrence Along the San Diego County Coast. Prepared for the Unified San Diego County Civil Defense and Disaster Organization; Westinghouse Ocean Research Laboratory. Kramer, S.L., 1996, Geotechnical Earthquake Engineering, Prentice Hall, 1st edition. Legg, Mark R., Jose C. Borrero, and Costas E. Synolakis, 2003, Evaluation of Tsunami Risk to Southern California Coastal Cities, unpublished report, 43 p. Legg, Mark R. and Chris Goldfinger, 2002, Earthquake Potential of Major Faults Offshore Southern California: Collaborative Research with Oregon State University and Legg Geophysical, 23 p. Martin, G.R. and M. Lew, editors, 1999, Recommended Procedures for Implementation of DMG Special Publication 117 Guidelines for Analyzing and Mitigating Liquefaction Hazards in California: Organized through the Southern California Earthquake Center, University of Southern California, 63 pp. Petersen, M.D., W.A. Bryant, C.H. Cramer, T. Cao, and M.S. Reichle (California Department of Conservation, Division of Mines and Geology), A.D. Frankel, J.J. Lienkaemper, P.A. McCrory, and D.P. Schwartz (U.S. Geological Survey), 1996, Probabilistic Seismic Hazard Assessment for the State of California, DMG Open-File Report 96-08 and USGS Open-File Report 96-706, 64 p. Woodward-Clyde Consultants, 1992, Geotechnical Investigation for the Proposed San Diego Gas and Electric South Bay Unit 3 Repowering Project, Chula Vista, California prepared for: San Diego Gas & Electric Company.

Duke Energy References
136469 9-2
Youd, T.L., I.M. Idriss, R.D. Andrus, I. Arango, G. Castro, J.T. Christian, R. Dobry, W.D. Liam Finn, L.F. Harder Jr., M.E. Hynes, K. Ishihara, J.P. Koester, S.S.C. Liao, W.F. Marcuson III, G.R. Martin, J.K. Mitchell, Y Moriwaki, M.S. Power, P.K. Robertson, R.B. Seed, and K.H. Stokoe II (2001) Liquefaction Resistance of Soils: Summary Report from the 1996 NCEER and 1998 NCEER/NSF Workshops on Evaluation of Liquefaction Resistance of Soils, Journal of Geotechnical and Geoenvironmental Engineering, Vol. 127, No. 10.

Duke Energy Figures
136469
Figures

Duke Energy Figures
136469
Figure 3-1 Site Vicinity Map
South Bay Site

Duke Energy Figures
136469
Figure 5-1 Regional San Diego Area Fault Systems (Modified from Artim and Mills, 1983)
San Diego
South Bay Plant Site
Duke Energy Figures
136469
Figure 5-2 Local San Diego Area Fault Systems
(Modified from WCC, 1992)
South Bay Plant Site
Imperial Beach
Faults are dashed where approximated

Duke Energy Figures
136469
Figure 5-3 Fault Zones Offshore of the San Diego Area Showing Restraining Bends
(From Legg and others, 2003)
Duke Energy Figures
136469
0.00
0.20
0.40
0.60
0.80
1.00
1.20
1.40
0.0 0.5 1.0 1.5 2.0 2.5 3.0 3.5 4.0
Period
Spec
tral
Acc
eler
atio
n (g
)
IBC 2003UBC 1997
Figure 6-1 Design Response Spectra for South Bay Site

Duke Energy Figures
136469
Ground Motion Firm Rock Soft Rock AlluviumPga 0.255 0.276 0.315 Sa 0.2 sec 0.597 0.651 0.75 Sa 1.0 sec 0.22 0.278 0.361
Figure 6-2 California Division of Mines and Geology
Standardized Ground Motion Parameters Map
Site

Duke Energy Appendix A
136469 A-1
Appendix A
Cone Penetrometer Data Logs of Cone Penetrometer Test (CPT) Soundings, Shear Wave
Velocity Measurements, and Pore Water Pressure Dissipation Tests
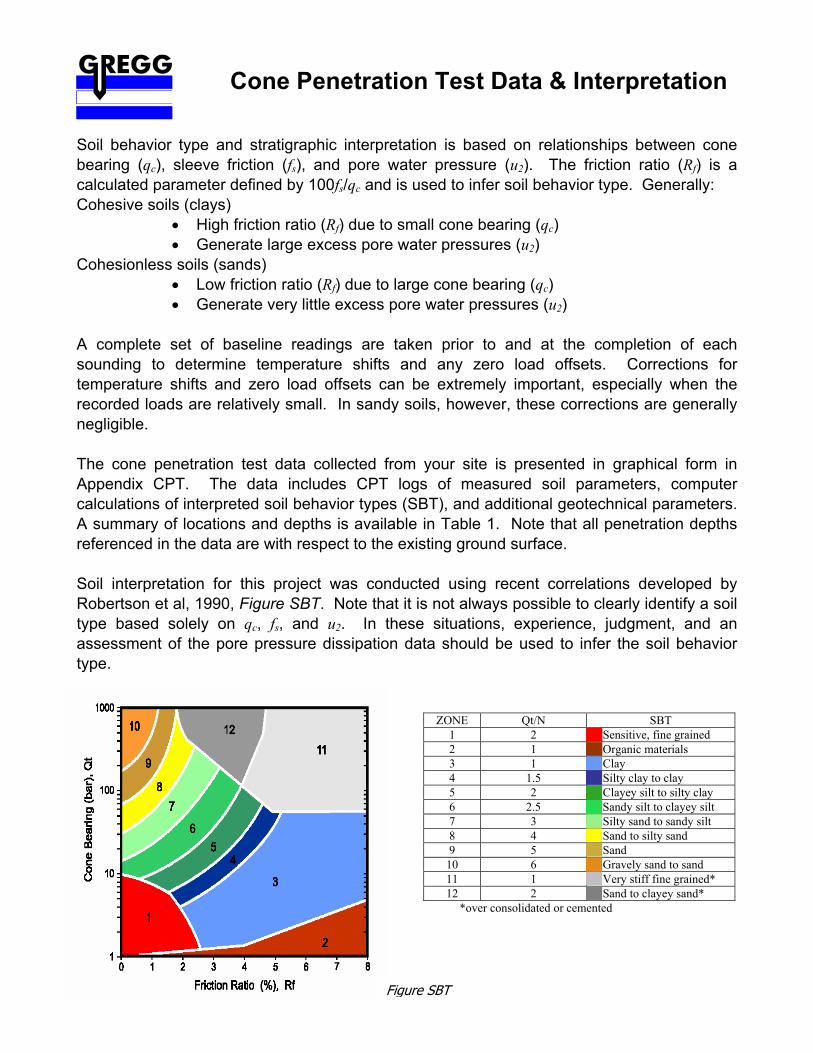
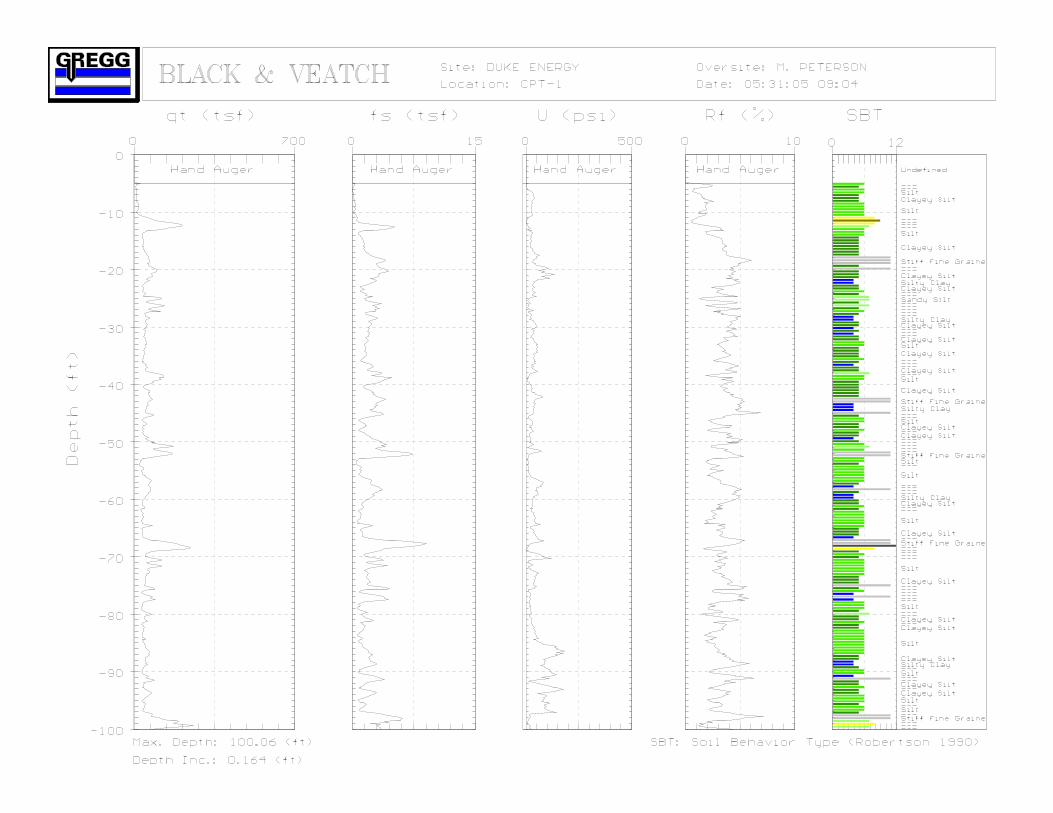
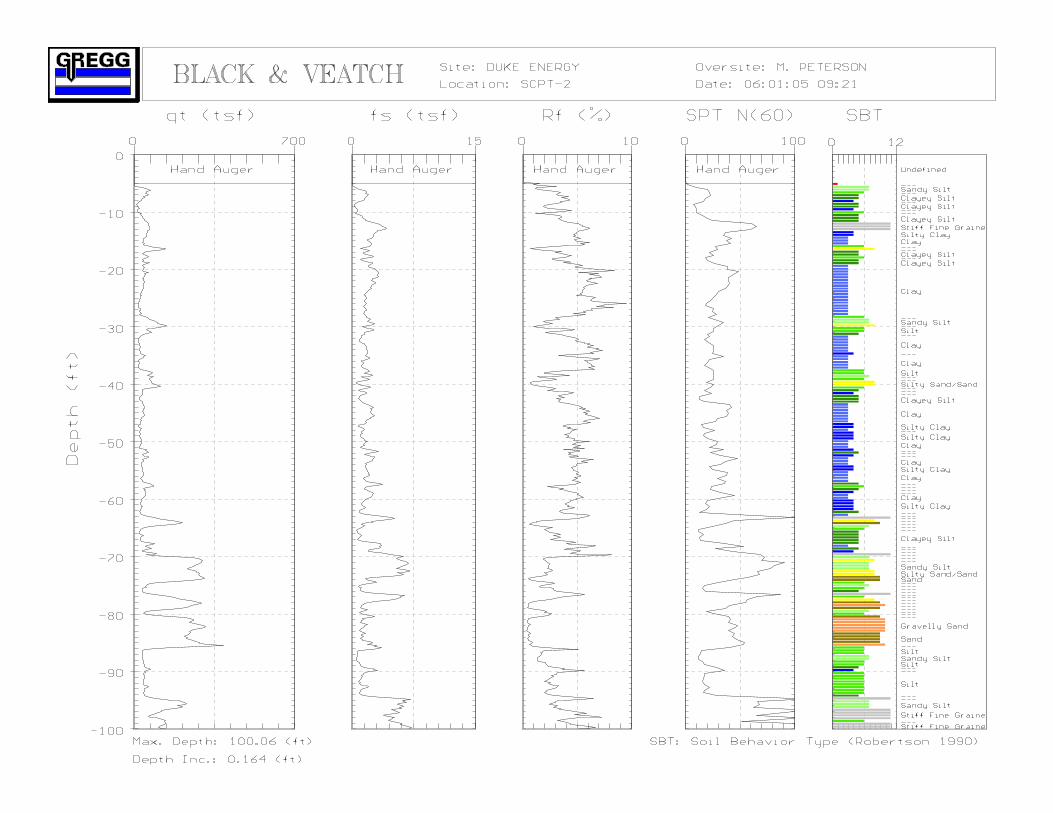
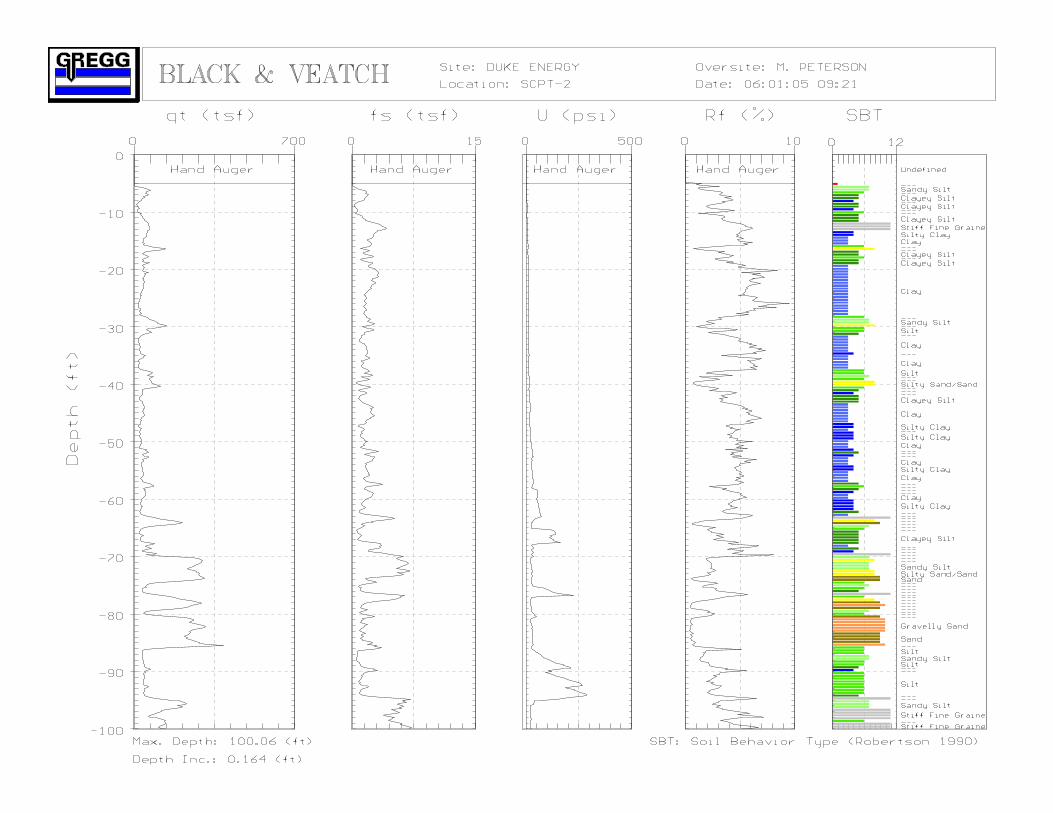
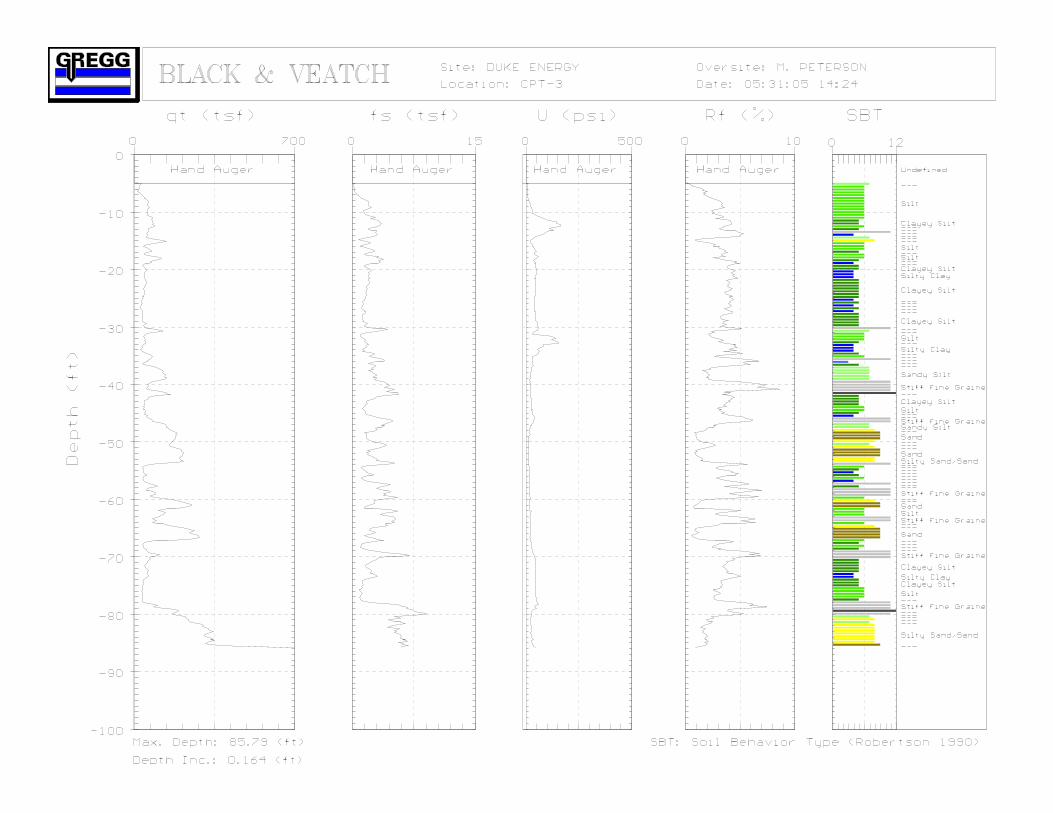
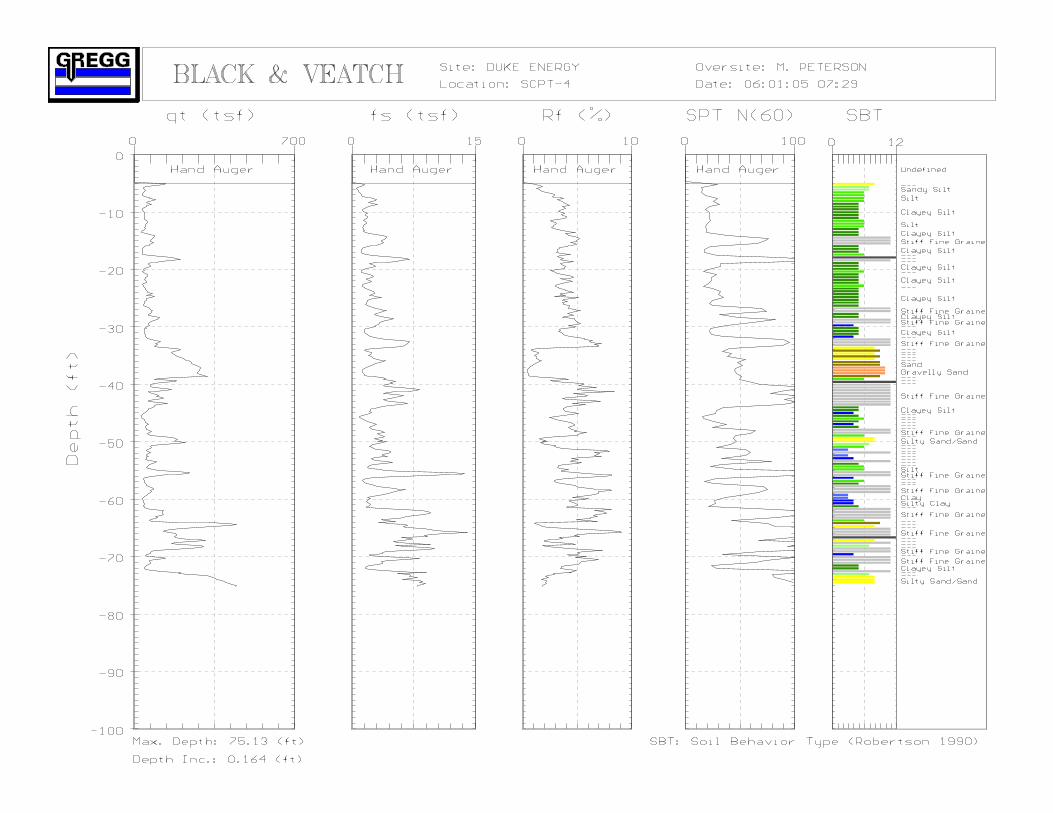
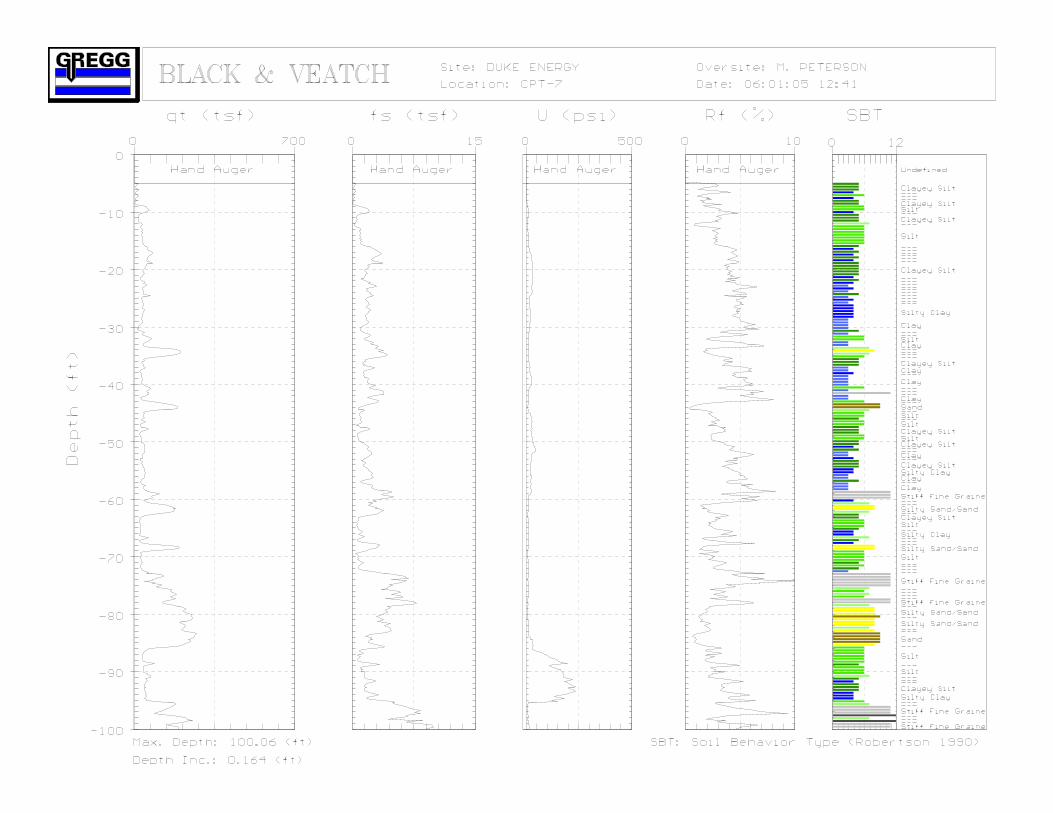
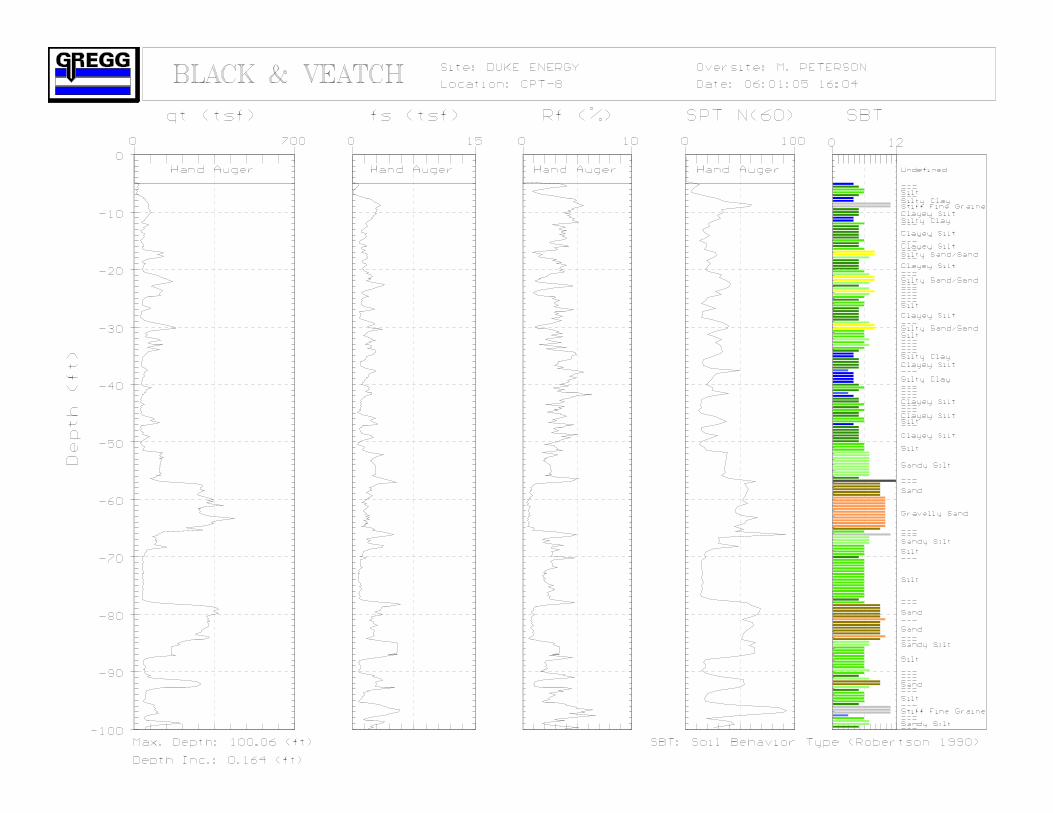
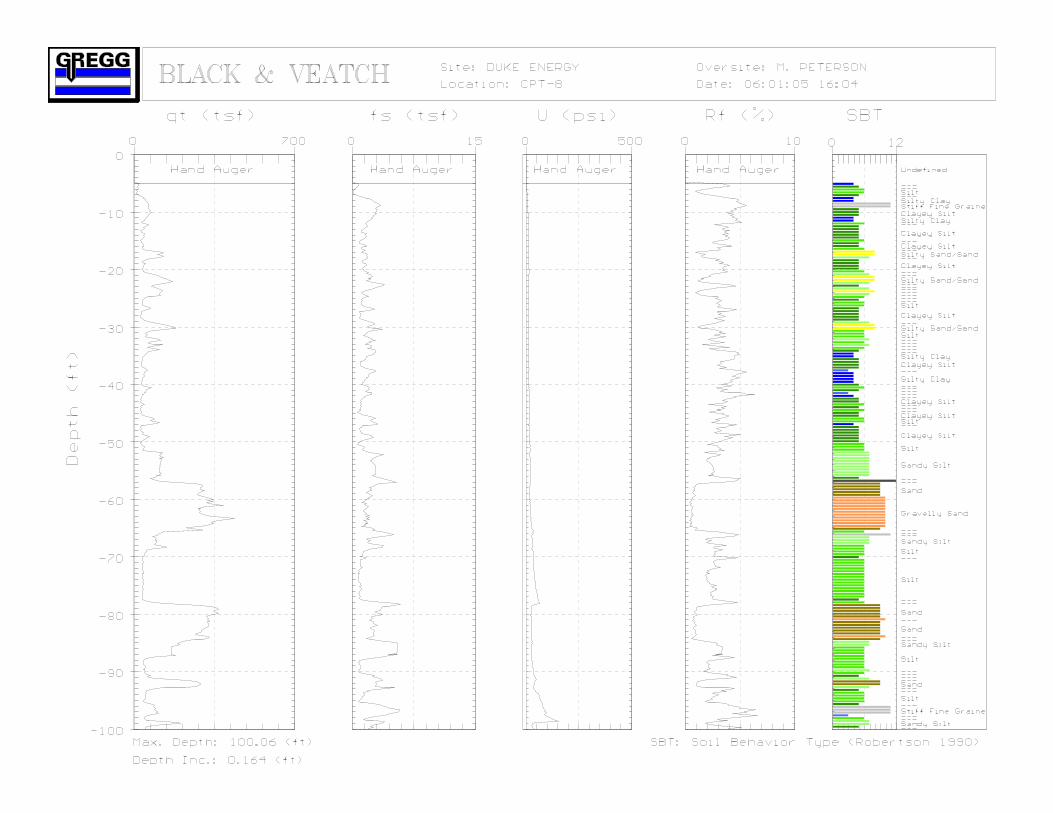
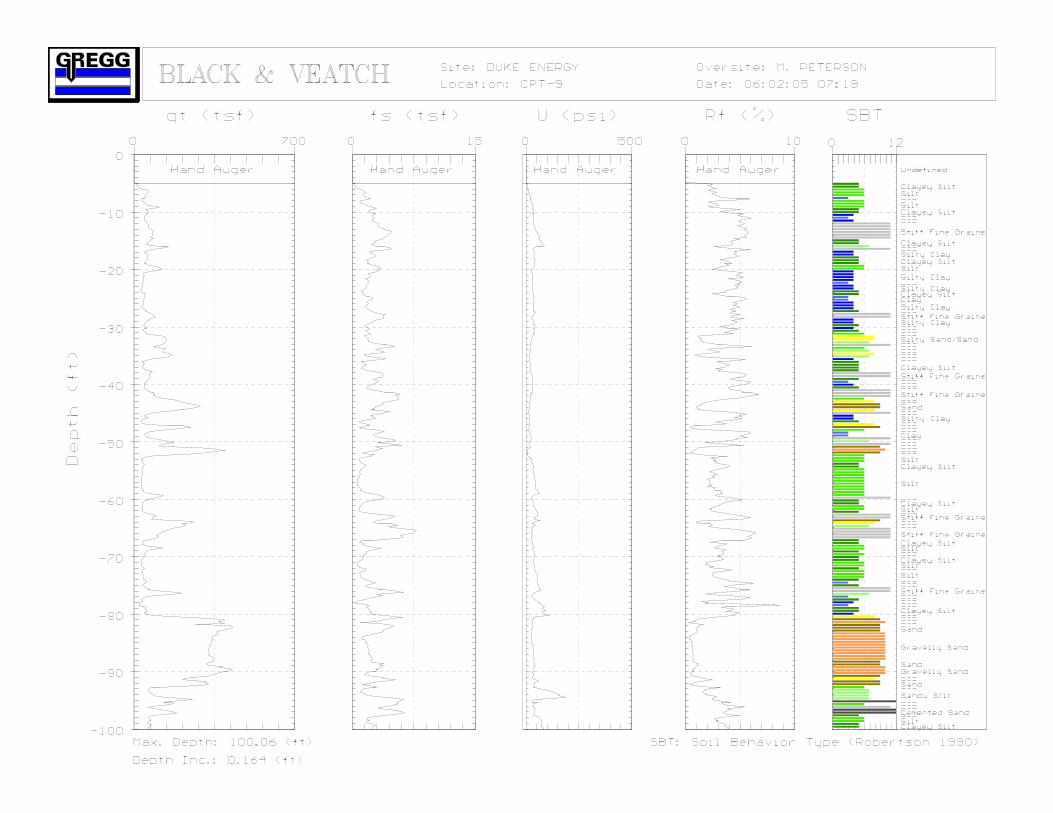
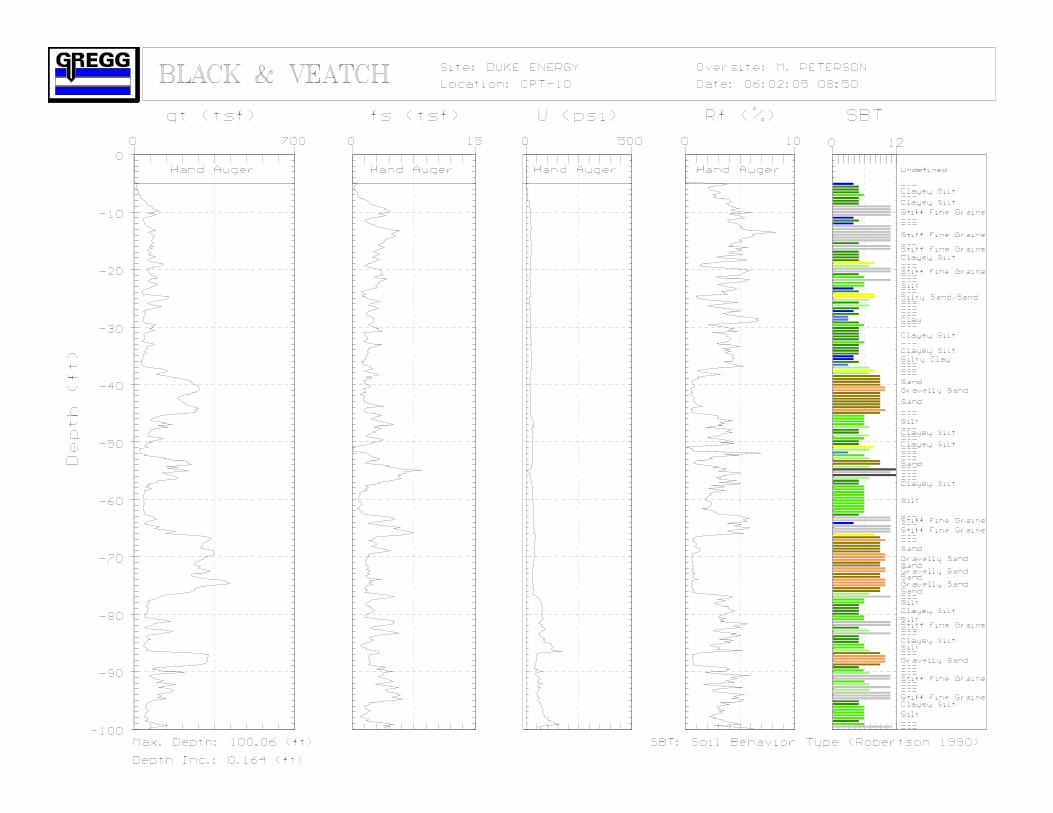
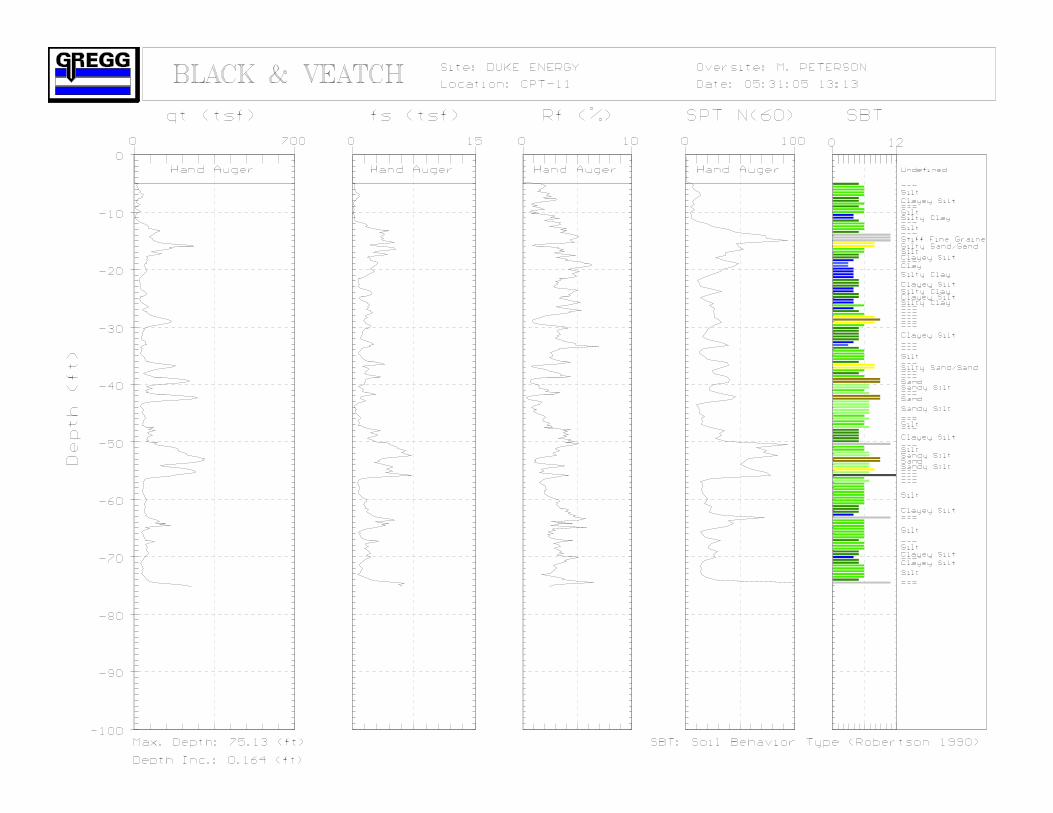
Cone Penetration Test Data & Interpretation Soil behavior type and stratigraphic interpretation is based on relationships between cone bearing (qc), sleeve friction (fs), and pore water pressure (u2). The friction ratio (Rf) is a calculated parameter defined by 100fs/qc and is used to infer soil behavior type. Generally: Cohesive soils (clays)
• High friction ratio (Rf) due to small cone bearing (qc) • Generate large excess pore water pressures (u2)
Cohesionless soils (sands) • Low friction ratio (Rf) due to large cone bearing (qc) • Generate very little excess pore water pressures (u2)
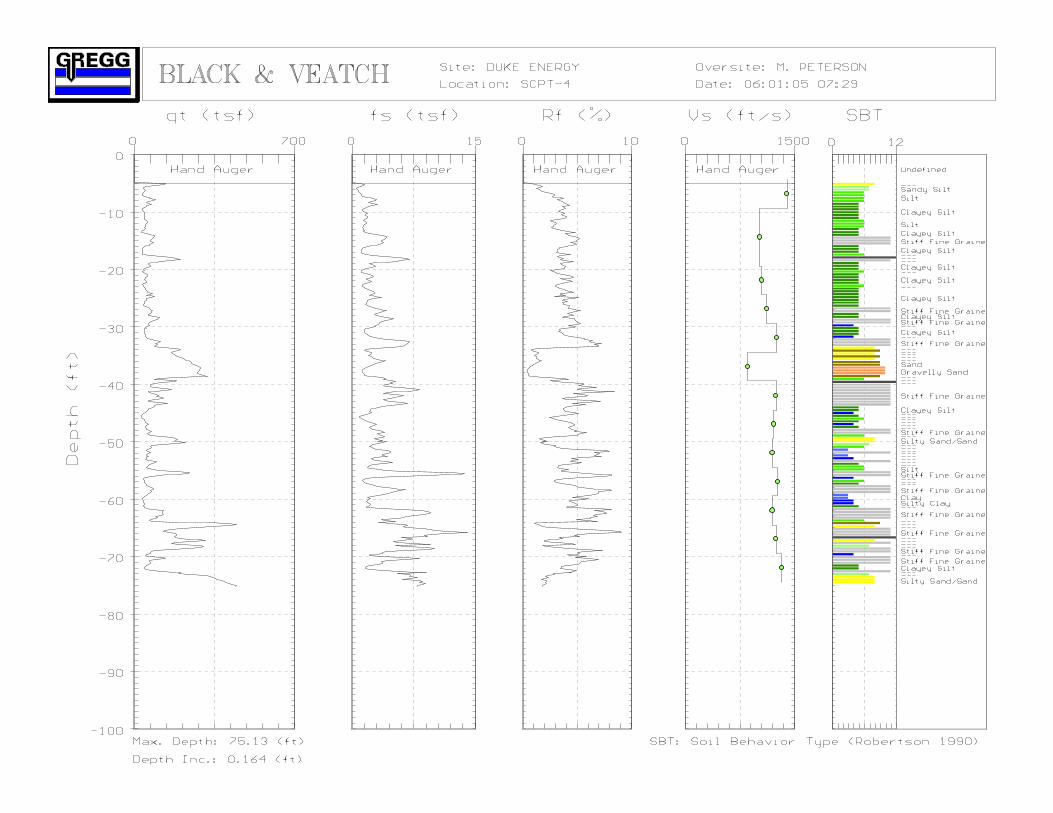
A complete set of baseline readings are taken prior to and at the completion of each sounding to determine temperature shifts and any zero load offsets. Corrections for temperature shifts and zero load offsets can be extremely important, especially when the recorded loads are relatively small. In sandy soils, however, these corrections are generally negligible. The cone penetration test data collected from your site is presented in graphical form in Appendix CPT. The data includes CPT logs of measured soil parameters, computer calculations of interpreted soil behavior types (SBT), and additional geotechnical parameters. A summary of locations and depths is available in Table 1. Note that all penetration depths referenced in the data are with respect to the existing ground surface. Soil interpretation for this project was conducted using recent correlations developed by Robertson et al, 1990, Figure SBT. Note that it is not always possible to clearly identify a soil type based solely on qc, fs, and u2. In these situations, experience, judgment, and an assessment of the pore pressure dissipation data should be used to infer the soil behavior type.
ZONE Qt/N SBT 1 2 Sensitive, fine grained 2 1 Organic materials 3 1 Clay 4 1.5 Silty clay to clay 5 2 Clayey silt to silty clay 6 2.5 Sandy silt to clayey silt 7 3 Silty sand to sandy silt 8 4 Sand to silty sand 9 5 Sand
10 6 Gravely sand to sand 11 1 Very stiff fine grained* 12 2 Sand to clayey sand*
*over consolidated or cemented
Figure SBT


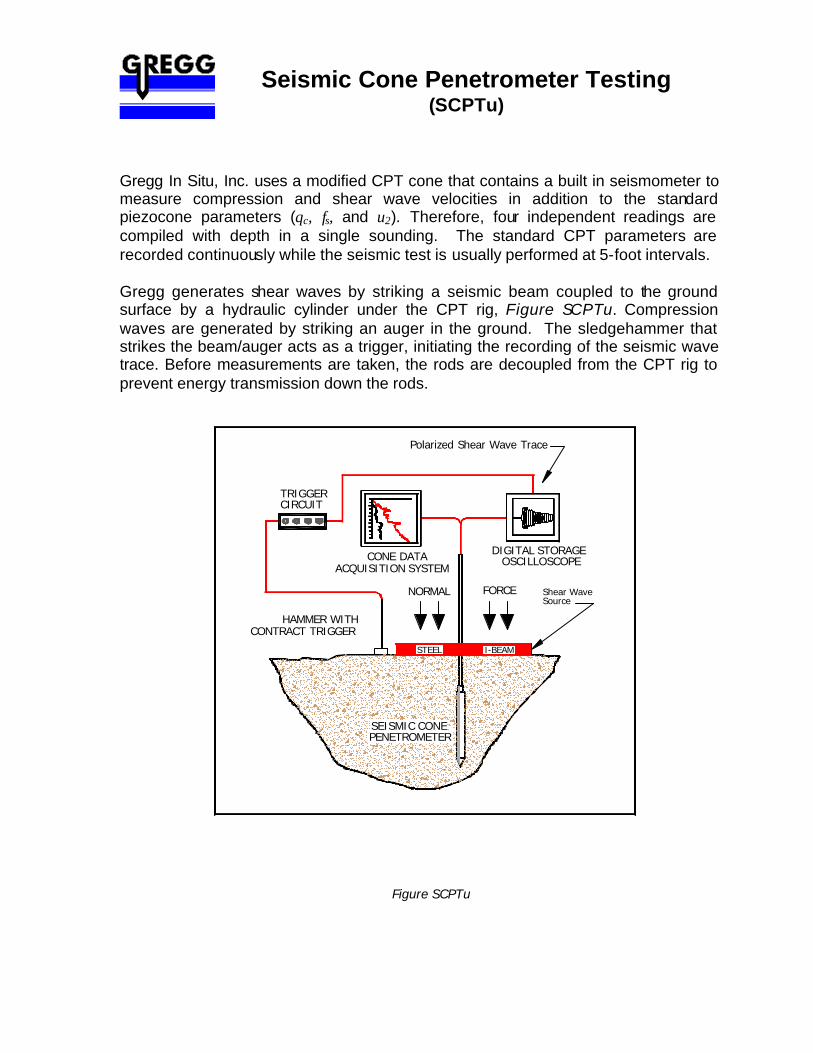
Seismic Cone Penetrometer Testing (SCPTu)
Gregg In Situ, Inc. uses a modified CPT cone that contains a built in seismometer to measure compression and shear wave velocities in addition to the standard piezocone parameters (qc, fs, and u2). Therefore, four independent readings are compiled with depth in a single sounding. The standard CPT parameters are recorded continuously while the seismic test is usually performed at 5-foot intervals.
Gregg generates shear waves by striking a seismic beam coupled to the ground surface by a hydraulic cylinder under the CPT rig, Figure SCPTu. Compression waves are generated by striking an auger in the ground. The sledgehammer that strikes the beam/auger acts as a trigger, initiating the recording of the seismic wave trace. Before measurements are taken, the rods are decoupled from the CPT rig to prevent energy transmission down the rods.
Figure SCPTu
Polarized Shear Wave Trace
CIRCUITTRIGGER
CONE DATAACQUISITION SYSTEM
DIGITAL STORAGEOSCILLOSCOPE
HAMMER WITHCONTRACT TRIGGER
NORMAL FORCE
STEEL I-BEAM
Shear WaveSource
SEISMIC CONEPENETROMETER
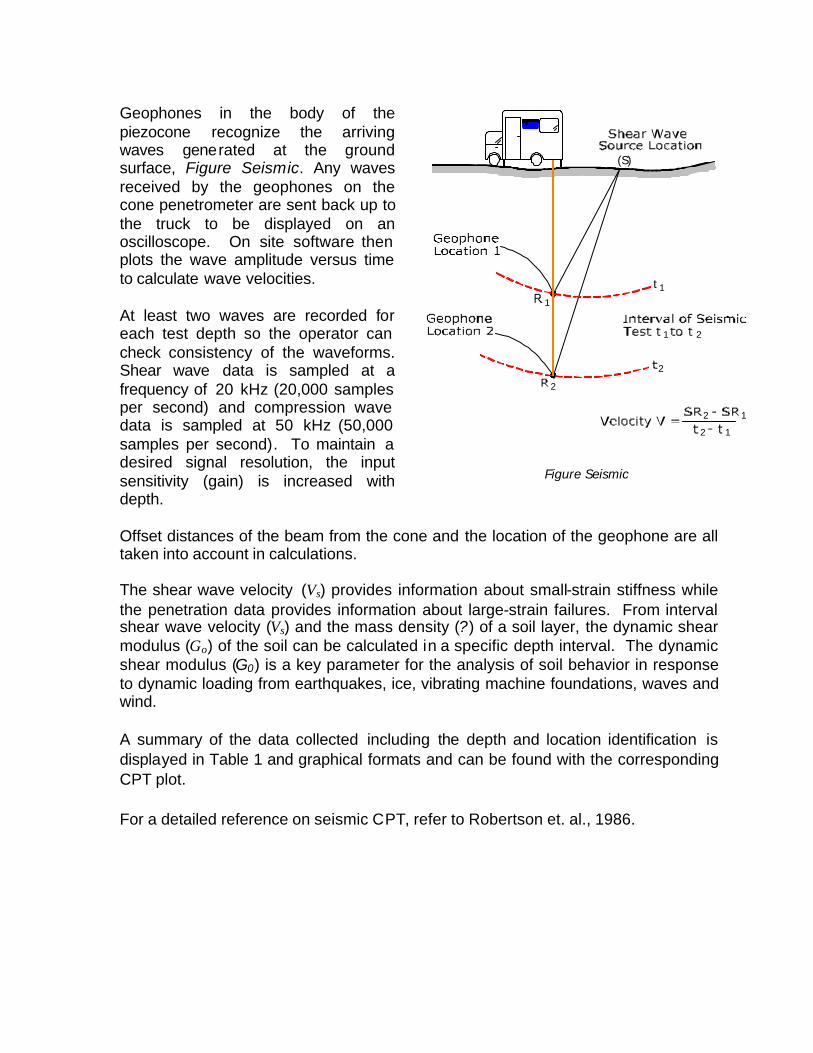
Geophones in the body of the piezocone recognize the arriving waves generated at the ground surface, Figure Seismic. Any waves received by the geophones on the cone penetrometer are sent back up to the truck to be displayed on an oscilloscope. On site software then plots the wave amplitude versus time to calculate wave velocities.
At least two waves are recorded for each test depth so the operator can check consistency of the waveforms. Shear wave data is sampled at a frequency of 20 kHz (20,000 samples per second) and compression wave data is sampled at 50 kHz (50,000 samples per second). To maintain a desired signal resolution, the input sensitivity (gain) is increased with depth.
Offset distances of the beam from the cone and the location of the geophone are all taken into account in calculations.
The shear wave velocity (Vs) provides information about small-strain stiffness while the penetration data provides information about large-strain failures. From interval shear wave velocity (Vs) and the mass density (?) of a soil layer, the dynamic shear modulus (Go) of the soil can be calculated in a specific depth interval. The dynamic shear modulus (G0) is a key parameter for the analysis of soil behavior in response to dynamic loading from earthquakes, ice, vibrating machine foundations, waves and wind.
A summary of the data collected including the depth and location identification is displayed in Table 1 and graphical formats and can be found with the corresponding CPT plot. For a detailed reference on seismic CPT, refer to Robertson et. al., 1986.
Figure Seismic
(S)
1
2
t 1
2
1 2
12
12


0.66 Feet Sounding: SCPT-2
5.75 Feet Date: 1/0/00
Test Geophone Waveform Incremental Characteristic Incremental Interval Interval
Depth Depth Ray Path Distance Arrival Time Time Interval Velocity Mid-Depth
(feet) (feet) (feet) (feet) (ms) (ms) (ft/s) (feet)
5.09 4.43 7.26 7.26 15.52
10.01 9.35 10.98 3.72 21.27 5.75 646.8 6.89
15.26 14.60 15.70 4.72 25.87 4.60 1025.0 11.98
20.01 19.35 20.19 4.49 30.32 4.45 1010.1 16.98
25.06 24.40 25.07 4.88 35.57 5.25 929.9 21.88
30.02 29.36 29.92 4.85 41.62 6.05 801.6 26.88
35.10 34.44 34.92 5.00 47.77 6.15 812.8 31.90
40.03 39.37 39.79 4.87 53.16 5.39 903.7 36.91
45.11 44.45 44.82 5.03 58.46 5.30 949.6 41.91
50.03 49.37 49.71 4.88 63.81 5.35 912.8 46.91
55.61 54.95 55.25 5.55 69.87 6.06 915.2 52.16
60.04 59.38 59.66 4.41 74.17 4.30 1025.1 57.17
65.12 64.46 64.72 5.06 79.04 4.87 1038.6 61.92
70.05 69.39 69.63 4.91 84.14 5.10 963.1 66.93
75.13 74.47 74.70 5.06 88.79 4.65 1089.0 71.93
80.05 79.39 79.60 4.91 93.34 4.55 1078.3 76.93
85.14 84.48 84.68 5.08 98.19 4.85 1046.9 81.94
90.06 89.40 89.59 4.91 102.50 4.31 1139.0 86.94
95.14 94.48 94.66 5.07 107.30 4.80 1056.3 91.94
100.07 99.41 99.58 4.92 111.60 4.30 1144.5 96.95
Geophone Offset:
Source Offset:
Shear Wave Velocity Calculations

Job No: 05-141sh Client: Black & Veatch Hole: SCPT-2 Site: Duke Energy Date: 06:01:05 Oversite: M. Peterson
0 10 20 30 40 50 60 70 80 90 100 110 120 130 140 1500
10
20
30
40
50
60
70
80
90
100
110
120
TIME (ms)
DE
PT
H (
ft)

0.66 Feet Sounding: SCPT-4
5.75 Feet Date: 6/1/05
Test Geophone Waveform Incremental Characteristic Incremental Interval Interval
Depth Depth Ray Path Distance Arrival Time Time Interval Velocity Mid-Depth
(feet) (feet) (feet) (feet) (ms) (ms) (ft/s) (feet)
5.09 4.43 7.26 7.26 13.70
10.01 9.35 10.98 3.72 16.35 2.65 1403.4 6.89
20.01 19.35 20.19 9.21 25.35 9.00 1023.3 14.35
25.10 24.44 25.11 4.92 30.03 4.68 1051.5 21.90
30.02 29.36 29.92 4.81 34.30 4.27 1126.6 26.90
35.10 34.44 34.92 5.00 38.30 4.00 1249.7 31.90
40.03 39.37 39.79 4.87 43.95 5.65 862.1 36.91
45.11 44.45 44.82 5.03 47.95 4.00 1258.2 41.91
50.03 49.37 49.71 4.88 51.95 4.00 1220.8 46.91
55.12 54.46 54.77 5.06 56.20 4.25 1190.4 51.92
60.04 59.38 59.66 4.90 60.05 3.85 1271.4 56.92
65.12 64.46 64.72 5.06 64.25 4.20 1204.3 61.92
70.05 69.39 69.63 4.91 68.15 3.90 1259.5 66.93
75.13 74.47 74.70 5.06 71.95 3.80 1332.6 71.93
Geophone Offset:
Source Offset:
Shear Wave Velocity Calculations

Job No: 05-141sh Client: Black & Veatch Hole: SCPT-4 Site: Duke Energy Date: 06:01:05 Oversite: M. Peterson
0 10 20 30 40 50 60 70 80 90 100 110 120 130 140 1500
10
20
30
40
50
60
70
80
TIME (ms)
DE
PT
H (
ft)
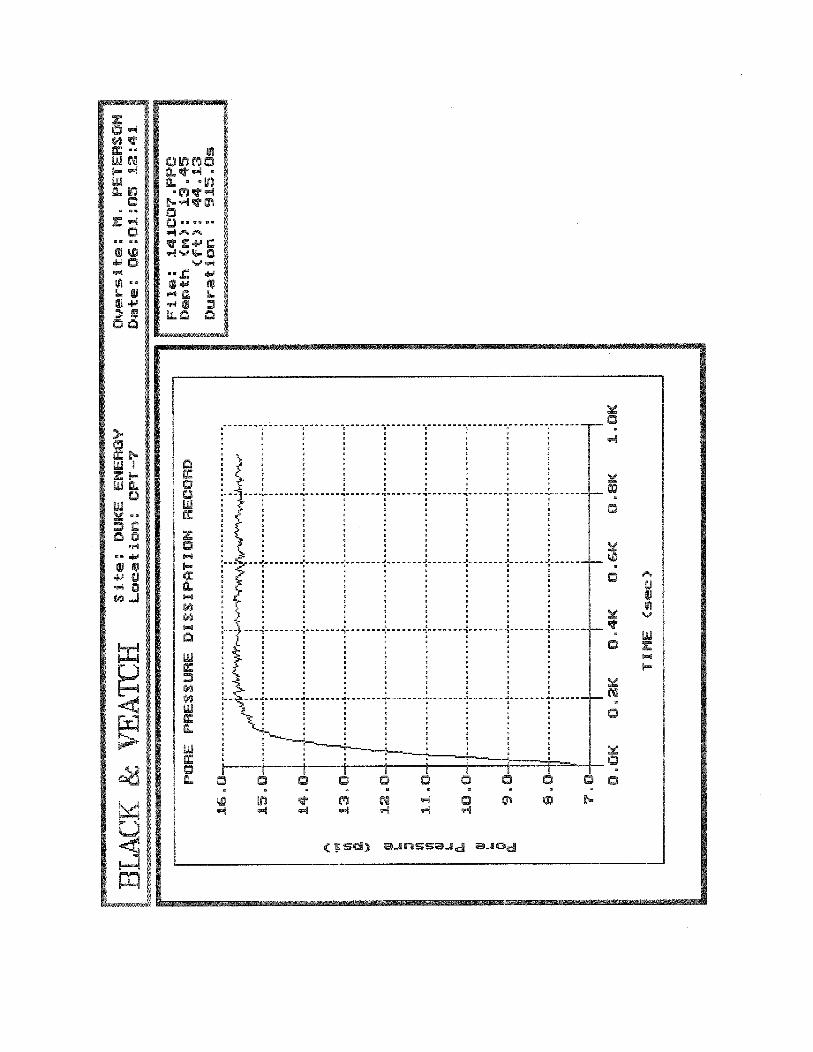
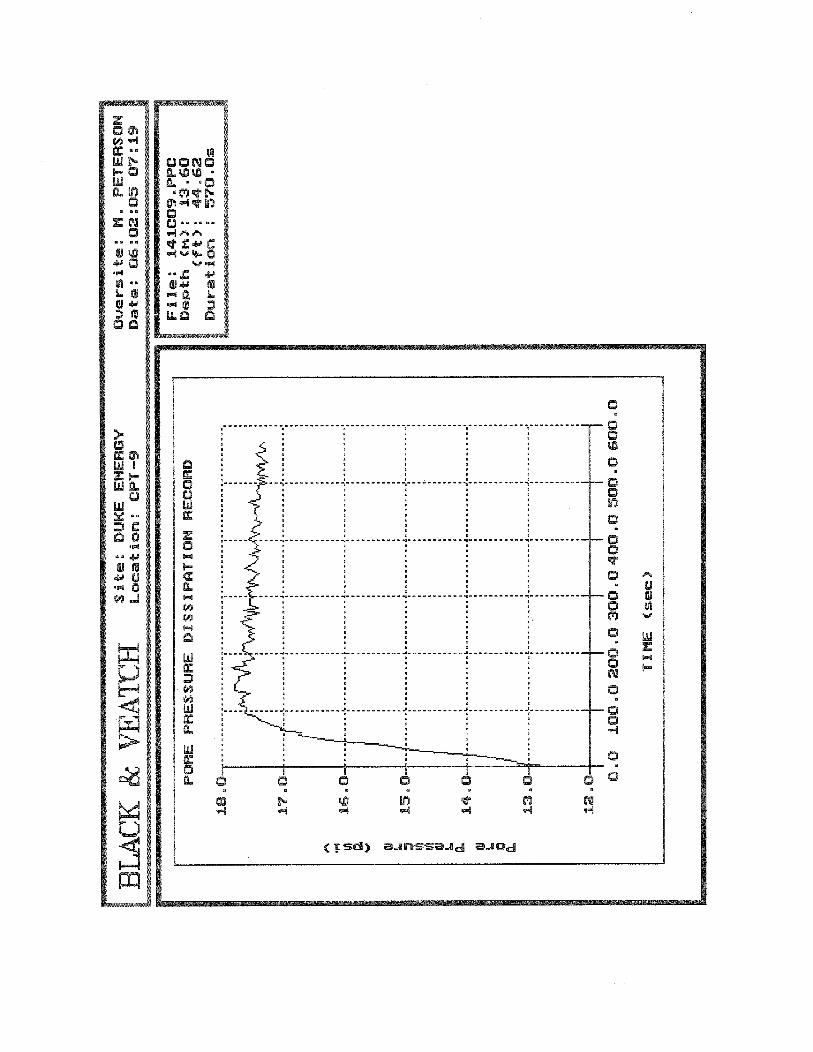
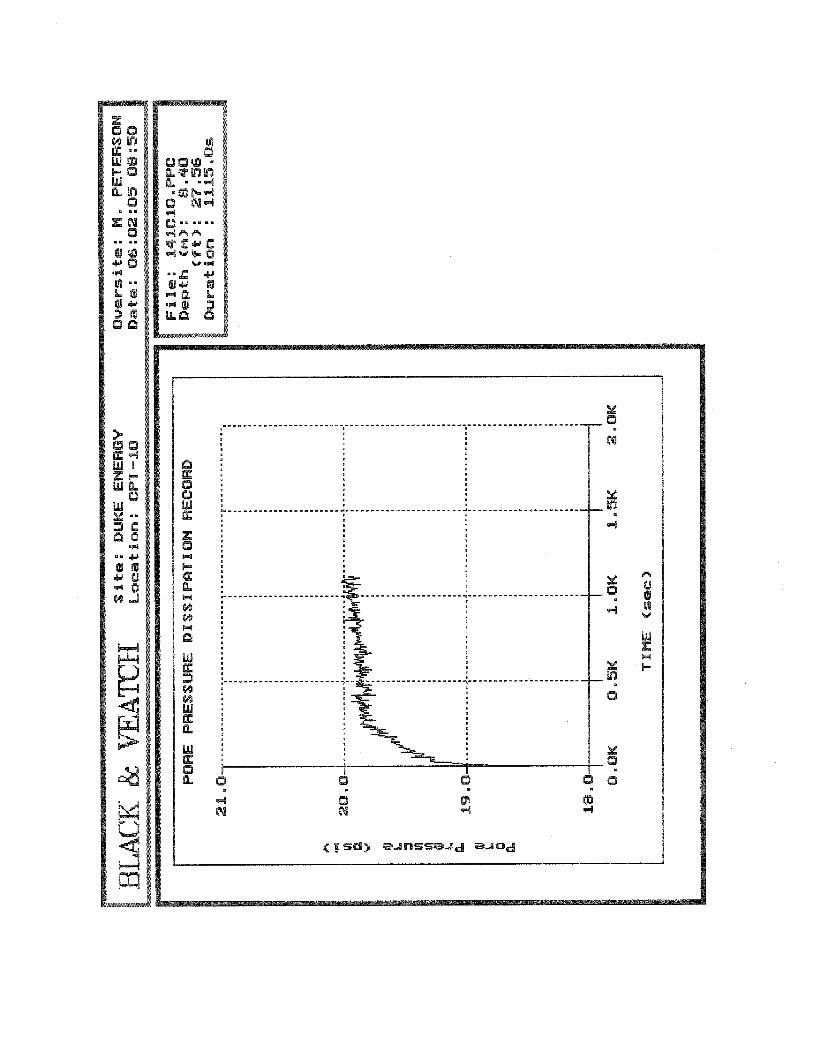
Pore Pressure Dissipation Tests
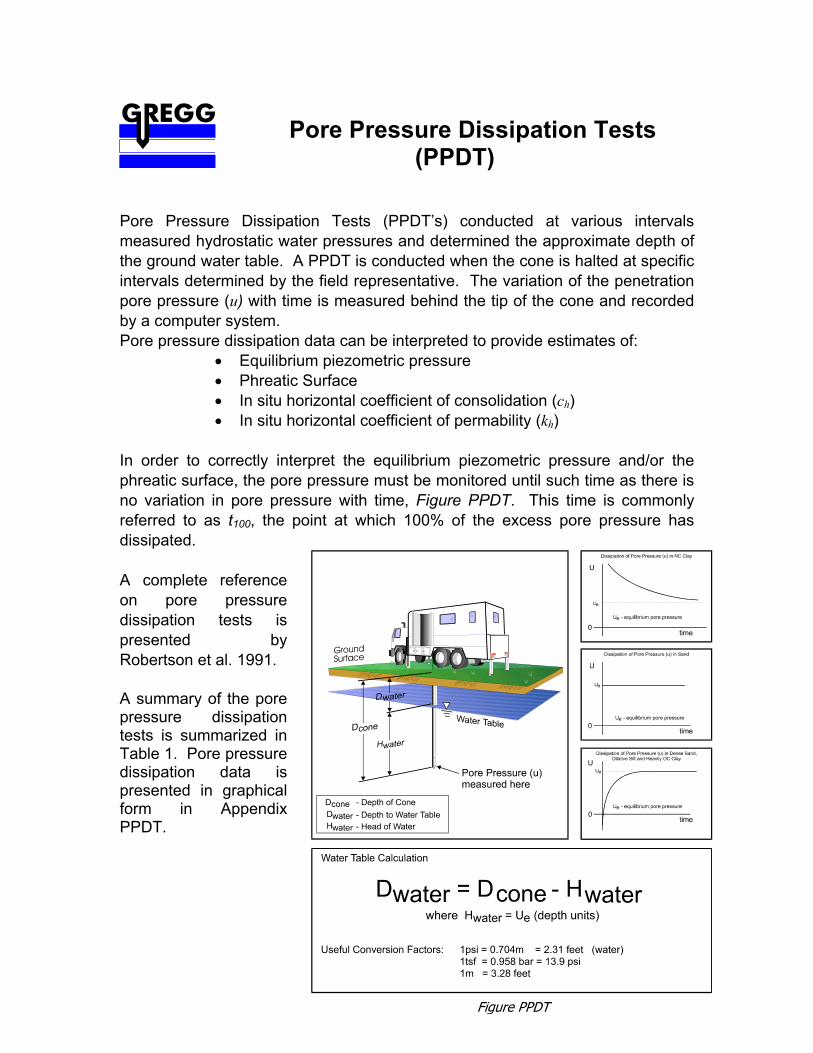
(PPDT) Pore Pressure Dissipation Tests (PPDT’s) conducted at various intervals measured hydrostatic water pressures and determined the approximate depth of the ground water table. A PPDT is conducted when the cone is halted at specific intervals determined by the field representative. The variation of the penetration pore pressure (u) with time is measured behind the tip of the cone and recorded by a computer system. Pore pressure dissipation data can be interpreted to provide estimates of:
• Equilibrium piezometric pressure • Phreatic Surface • In situ horizontal coefficient of consolidation (ch) • In situ horizontal coefficient of permability (kh)
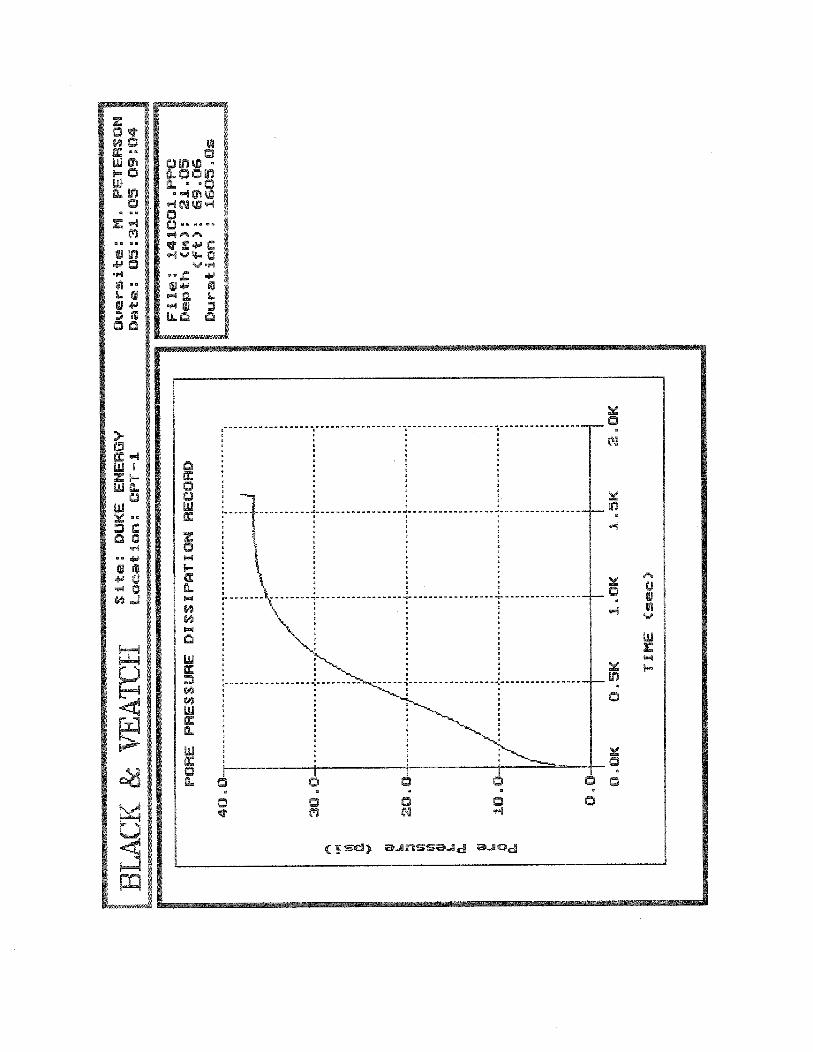
In order to correctly interpret the equilibrium piezometric pressure and/or the phreatic surface, the pore pressure must be monitored until such time as there is no variation in pore pressure with time, Figure PPDT. This time is commonly referred to as t100, the point at which 100% of the excess pore pressure has dissipated. A complete reference on pore pressure dissipation tests is presented by Robertson et al. 1991. A summary of the pore pressure dissipation tests is summarized in Table 1. Pore pressure dissipation data is presented in graphical form in Appendix PPDT.
Figure PPDT


Duke Energy Appendix B
136469 B-1
Appendix B
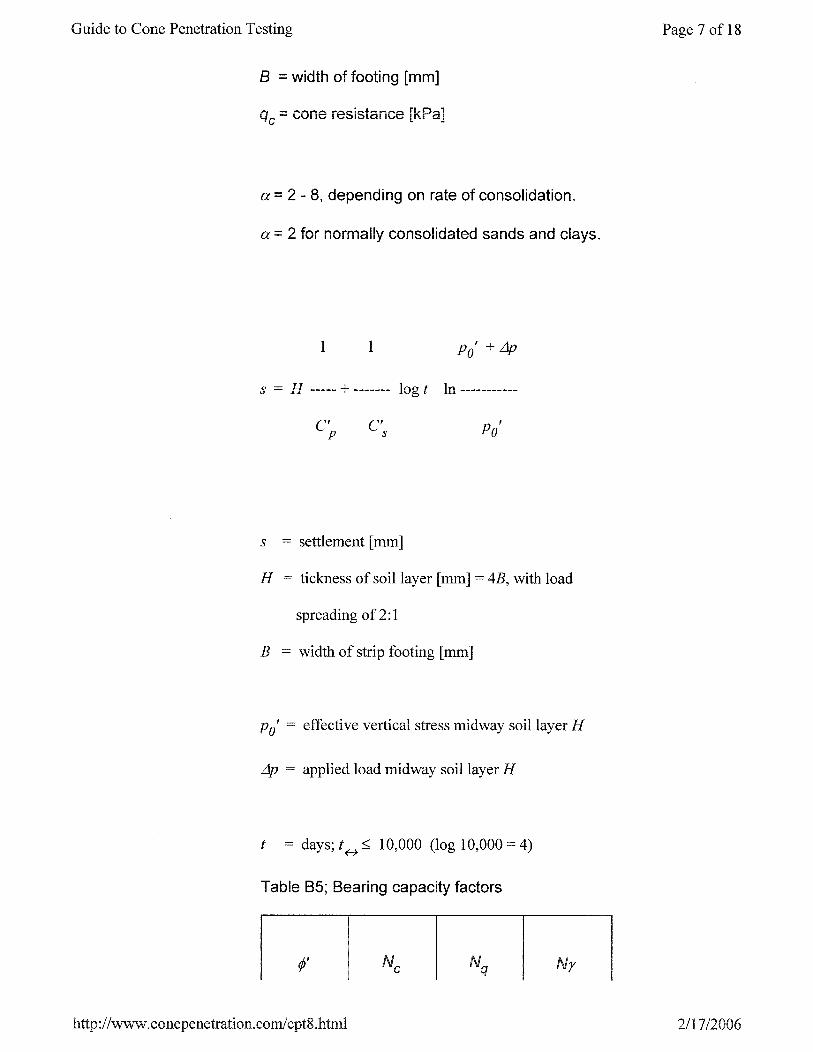
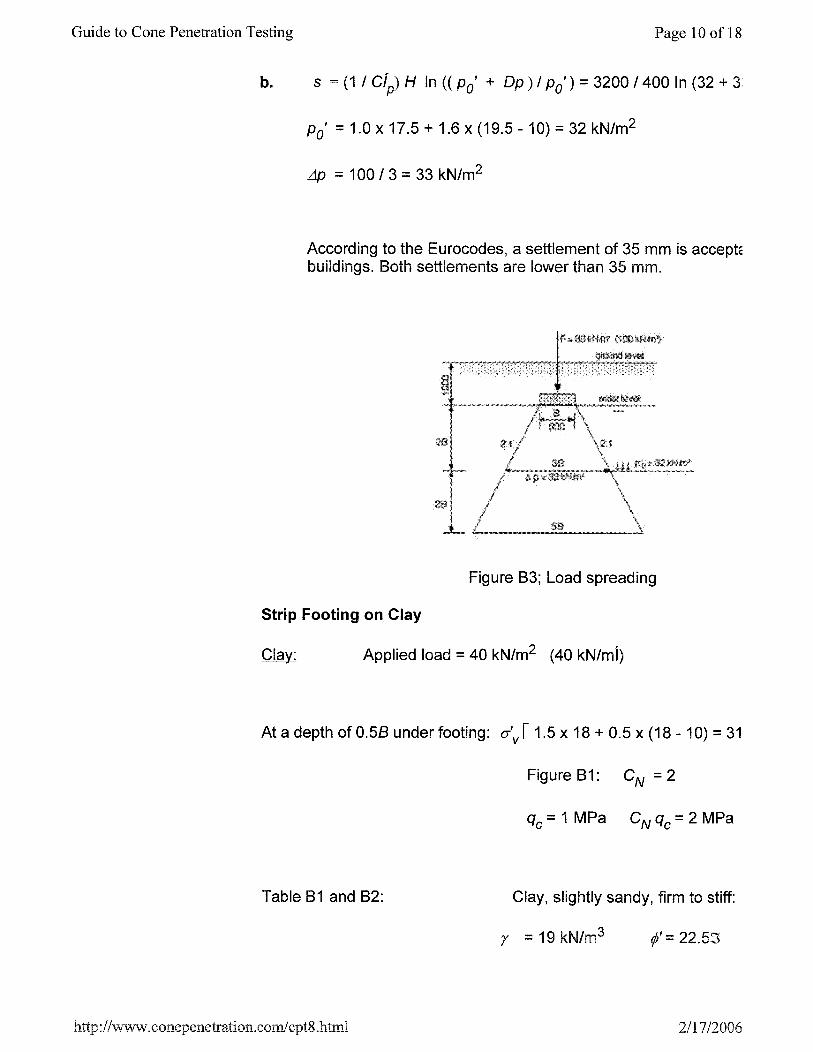
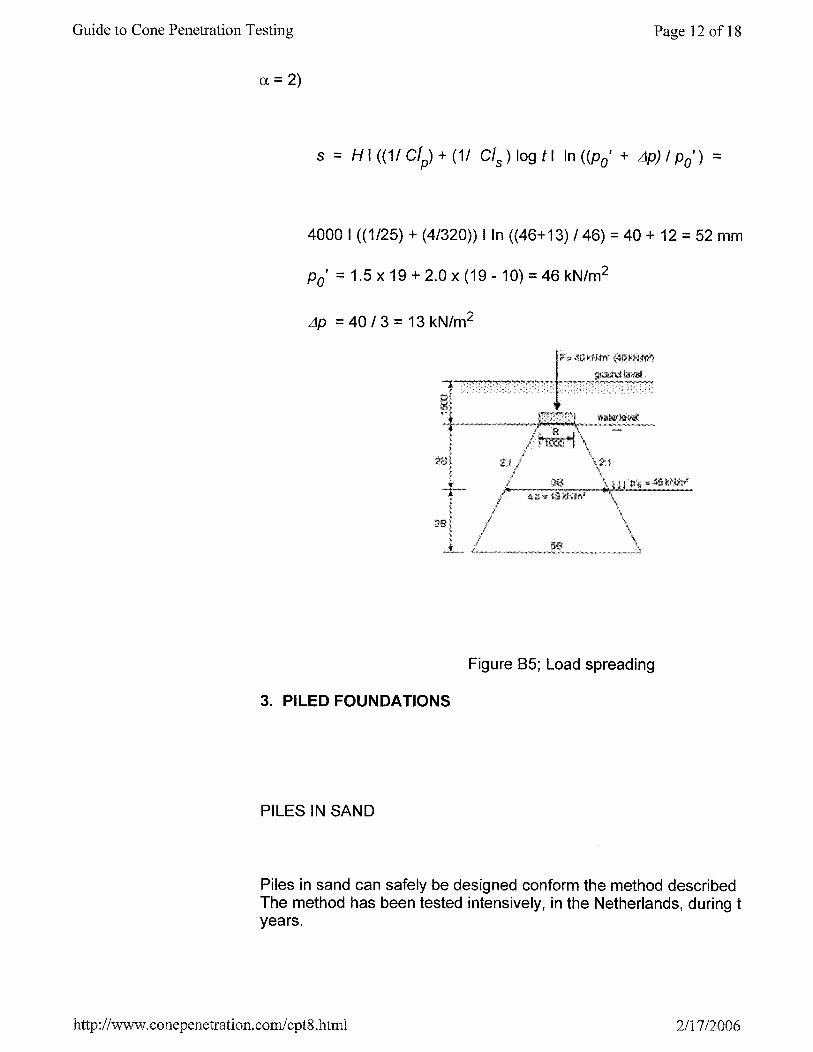
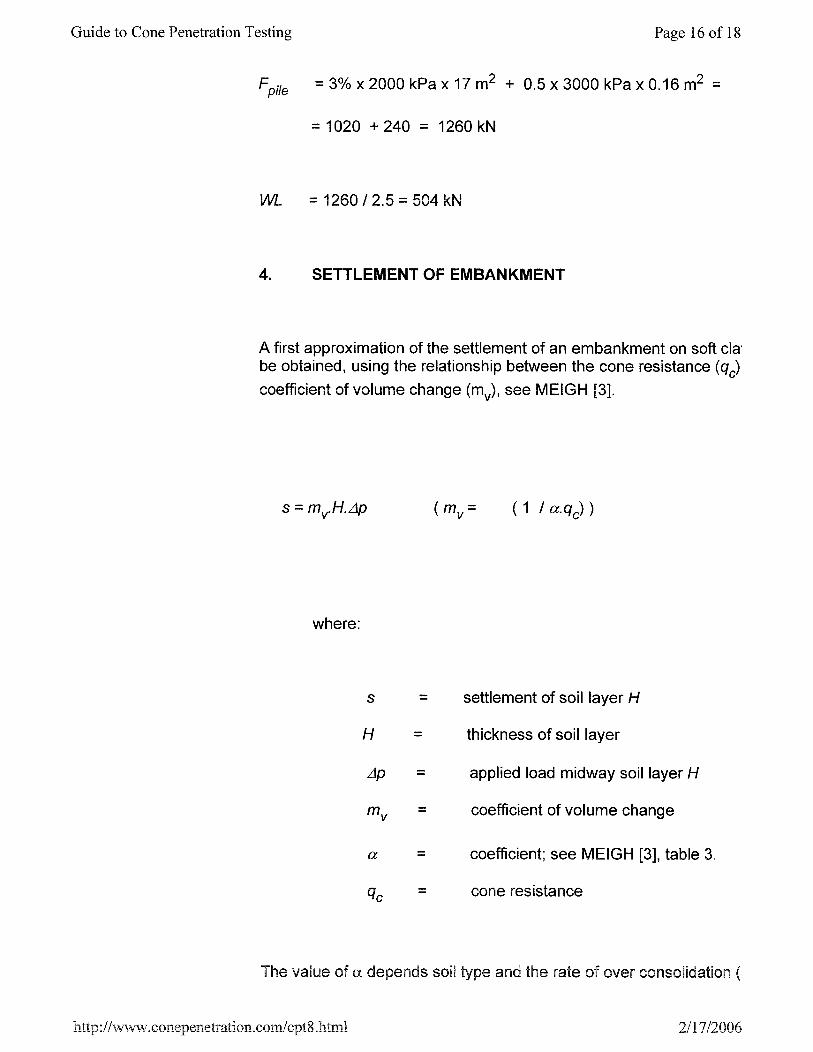
Settlement Evaluation Method