
Appendix 1 Transportation Surveys - JICAopen_jicareport.jica.go.jp/pdf/11926052_07.pdf · Appendix...
89
Appendix 1 Transportation Surveys A - 1 Appendix 1 Transportation Surveys Situation regarding the usage of railways and other modes by both passengers and freight transport in the Central Java region was investigated by implementing the Railway Traffic Survey, Road Traffic Survey, Travel Speed Survey, Stated Preference Survey on Railway Use and Weigh Bridge Interview Survey. 1.1 Railway Traffic Survey Railway Passenger Count Survey, Railway OD Survey, and Free Ridership Survey were implemented to understand situation regarding railway usage in the Central Java region. (1) Railway Passenger Count Survey 1) Survey Objective Although ticket sales data is available, railway passenger count survey was conducted to acquire accurate passenger count data and this data can be used not only for basic information to understand the railway usage situation in the Central Java region but also for calibrating origin destination table. 2) Survey Contents a. Survey Station The survey was conducted at 15 stations in the Central Java region. Stations are selected based on number of passengers, whether it is a branch station or terminal station of major line, or located in a major city. (See the following table and figure) Table 1.1.1 Railway Passenger Count Survey Stations Survey Station Names Tegal Brumbung Kutoarjo Purwosari Pekalongan Gundih Yogyakarta Solo Balapan Semarang Poncol Purwokerto Lempuyangan Solo Jebres Semarang Tawang Kroya Klaten
Transcript of Appendix 1 Transportation Surveys - JICAopen_jicareport.jica.go.jp/pdf/11926052_07.pdf · Appendix...

Appendix 1 Transportation Surveys
A - 1
Appendix 1 Transportation Surveys
Situation regarding the usage of railways and other modes by both passengers and freight
transport in the Central Java region was investigated by implementing the Railway Traffic Survey, Road Traffic Survey, Travel Speed Survey, Stated Preference Survey on Railway Use
and Weigh Bridge Interview Survey.
1.1 Railway Traffic Survey Railway Passenger Count Survey, Railway OD Survey, and Free Ridership Survey were
implemented to understand situation regarding railway usage in the Central Java region.
(1) Railway Passenger Count Survey
1) Survey Objective
Although ticket sales data is available, railway passenger count survey was conducted to
acquire accurate passenger count data and this data can be used not only for basic information
to understand the railway usage situation in the Central Java region but also for calibrating origin destination table.
2) Survey Contents
a. Survey Station
The survey was conducted at 15 stations in the Central Java region. Stations are selected based
on number of passengers, whether it is a branch station or terminal station of major line, or
located in a major city. (See the following table and figure)
Table 1.1.1 Railway Passenger Count Survey Stations
Survey Station Names Tegal Brumbung Kutoarjo Purwosari
Pekalongan Gundih Yogyakarta Solo Balapan Semarang Poncol Purwokerto Lempuyangan Solo Jebres Semarang Tawang Kroya Klaten

The Study on Development of Regional Railway System of Central Java Region Final Report
A - 2
Figure 1.1.1 Stations Covered by Railway Traffic Survey
b. Survey Method
Survey Method is counting all passengers getting on or off each train at the station. The
following figure shows an example of passenger count at Solo Balapan station on March 4,
2008.
Source: CJRR Study Team, Railway Traffic Survey, 2008
Figure 1.1.2 Railway Passenger Count Survey Situation at Solo Balapan Station

Appendix 1 Transportation Surveys
A - 3
c. Survey Schedule
The survey was conducted from 3rd to 18th March, 2008.
3) Survey Result
a. Passenger volume by station
Railway passenger count survey result by station is shown as follows. Semarang Yogyakarta station is the largest with 5,063 boarding and alighting passengers per day. Passenger
volumes of Semarang Poncol, Solo Balapan, Solo Jebres, and Lempuyangan exceeds 3,000
boarding and alighting passengers per day.
Table 1.1.2 Passenger Volume by Station
BoardingPassengers
BoardingPassengers Total
(pax/day) (pax/day) (pax/day)Tegal 1,182 1,097 2,279Pekalongan 504 367 871Semarangponcol 1,835 2,565 4,400Semarangtawang 1,430 1,210 2,640Brumbung 95 15 110Gundih 107 152 259Purwokerto 857 836 1,693Kroya 928 869 1,797Kutoarjo 992 1,553 2,545Yogyakarta 2,567 2,496 5,063Lempuyangan 2,055 2,105 4,160Klaten 778 757 1,535Purwosari 976 1,069 2,045Solobalapan 1,684 1,658 3,342Solojebres 699 853 1,552
Stationname
Source: CJRR Study Team,. Railway Traffic Survey, 2008
Figure 1.1.3 Passenger Volume by Station

The Study on Development of Regional Railway System of Central Java Region Final Report
A - 4
b. Passenger volume by train type by station
There are three classes; executive, business and economy, for long distance train and there are
two classes; business and economy for short distance train in the Central Java region. Railway
passenger by these train types is shown as follows. Total Passenger volume by train types are
4,609 for long distance executive train, 6,435 for long distance business train, 10,877 for long distance economy class train, 9,967 for local business train and 2,403 for local economy train
respectively. Approximately 64 percent is long distance train passengers and 39 percent is
economy class passengers.
Table 1.1.3 Boarding and Alighting Passenger Volume by Train Type by Station
Long Dist.Executive
Long Dist.Business
Long Dist.Economy
LocalBusiness
LocalEconomy
(pax/day) (pax/day) (pax/day) (pax/day) (pax/day)Tegal 262 412 341 874 390Pekalongan 252 106 257 125 131Semarangponcol 0 0 1,025 1,733 1,642Semarangtawang 1,533 886 9 212 0Brumbung 0 83 0 2 25Gundih 0 0 77 0 182Purwokerto 205 844 644 0 0Kroya 124 266 1,407 0 0Kutoarjo 0 331 2,071 143 0Yogyakarta 1,480 1,844 0 1,739 0Lempuyangan 0 0 2,421 1,739 0Klaten 122 312 842 259 0Purwosari 0 92 682 1,271 0Solobalapan 631 1,090 0 1,621 0Solojebres 0 169 1,101 249 33Total 4,609 6,435 10,877 9,967 2,403
Stationname
Source: CJRR Study Team,. Railway Traffic Survey, 2008

Appendix 1 Transportation Surveys
A - 5
262
1,533
205
124
0
1,480
122
631
412
886
83
844
266
331
1,844
312
92
1,090
169
341
1,025
9
0
77
644
1,407
2,071
2,421
842
682
1,101
874
1,733
2
143
1,739
1,739
259
1,271
1,621
249
390
1,642
25
182
33
252106257125
212
131
0 1,000 2,000 3,000 4,000 5,000 6,000
Tegal
Pekalongan
Semarangponcol
Semarangtawang
Brumbung
Gundih
Purwokerto
Kroya
Kutoarjo
Yogyakarta
Lempuyangan
Klaten
Purwosari
Solobalapan
Solojebres
Long Executive Long Business Long Economy Local Business Local Economy
Source: CJRR Study Team,. Railway Traffic Survey, 2008
Figure 1.1.4 Passenger Volume by Train Type by Station
c. Hourly Boarding Passenger volume of local train by station
Hourly passenger volumes of Yogyakarta and Solo Balapan station are shown as follows.
Although hourly passenger volumes are generally shows its peak in the morning and evening in
case of local commuter train, hourly volumes in the Central Java region do not shows clear
peak.

The Study on Development of Regional Railway System of Central Java Region Final Report
A - 6
0
196
0
25
0
186
0
0
136
0
56
220
89
68
0
0 100 200 300 400 500 600
4
5
6
7
8
9
10
11
12
13
14
15
16
17
18
Local Business
0
105
0
76
122
44
0
114
0
0
101
38
0
115
0
0 100 200 300 400 500 600
4
5
6
7
8
9
10
11
12
13
14
15
16
17
18
Local Business
Source: CJRR Study Team,. Railway Traffic Survey, 2008
Figure 1.1.5 Hourly Passenger Volume of Local Train at Yogyakarta Station
0
382
0
97
0
0
0
0
0
0
245
0
0
0
0
0
137
0
86
0
0
0
0
339
0
0
233
71
0
0
0 100 200 300 400 500 600
4
5
6
7
8
9
10
11
12
13
14
15
16
17
18
Local Business Local Economy
0
0
298
0
144
0
0
0
0
0
166
0
379
0
0
0
0
0
337
0
0
210
0
0
0
0
204
0
0
0
0 100 200 300 400 500 600
4
5
6
7
8
9
10
11
12
13
14
15
16
17
18
Local Business Local Economy
Source: CJRR Study Team,. Railway Traffic Survey, 2008
Figure 1.1.6 Hourly Passenger Volume of Local Train at Semarangponcol Station
Boarding Alighting
Boarding Alighting

Appendix 1 Transportation Surveys
A - 7
d. Delay of Trains
The delay of train is also recorded during the passenger count survey (Source: CJRR Study Team,. Railway Traffic Survey, 2008
Figure 1.1.7). The results are shown as follows. Almost 45 percent of the train delays. The average delay is approximately 20 minutes for arrival and 18 minutes for departure and
maximum delay was 10 hours.
Departure Delay
0
50
100
150
200
0-5 5-10 10-20 20-40 40-60 60-80 80-100 100-120
120-603
Long Dist.Local
(min)
(No. of Train) Arrival Delay
0
50
100
150
200
0-5 5-10 10-20 20-40 40-60 60-80 80-100 100-120
120-603
Long Dist.Local
(min)
(No. of Train)
Source: CJRR Study Team,. Railway Traffic Survey, 2008
Figure 1.1.7 Train Delay during Railway Passenger Count Survey
(2) Railway OD Survey
1) Survey Objective
A Railway OD Survey is indispensable to this Study for understanding the OD of railway users.
A Railway OD Survey was most recently conducted in 2005 but Yogyakarta was not part of the study area. Furthermore, since almost 6 years have passed since the 2001 survey, a Railway OD
Survey was carried out to find out the changes in usage and to make an appropriate forecast of
traffic demand.
2) Survey Contents
a. Survey Station
The same 15 stations in the Central Java region selected for the Railway Passenger Count
Survey (See Figure 1.1.1).
b. Survey Subject:
10% of boarding passengers were targeted.

The Study on Development of Regional Railway System of Central Java Region Final Report
A - 8
c. Survey Method
Obtain OD and OD station data through interviews conducted in waiting rooms and concourse
area of the selected stations. The following figure shows an example of passenger count at Solo
Balapan station on March 4, 2008.
Source: CJRR Study Team,. Railway Traffic Survey, 2008
Figure 1.1.8 Railway OD Survey Situation at Solo Balapan Station
d. Survey Schedule
The survey was conducted from 3rd to 18th March, 2008.
e. Survey Questions
Train name, class, origin location, origin station, destination location, destination station,
transfer station, access transportation mode, egress transportation mode, trip purpose, alternative transportation mode, the reasons why they use railway.
3) Origin and Destination Table Calibration
a. Sampling Ratios
Sampling Ratios of Railway OD Survey is shown in Table 1.1.4. Average sampling ratio was 23 %. Even the smallest sampling ratio, 13.3 % at Lempuyangan station, is more than
expected sampling ration of 10%. This will increase data reliability of tabulated OD table.

Appendix 1 Transportation Surveys
A - 9
Table 1.1.4 Sampling Ratios of Railway OD Interview Survey
Station Name BoardingPassengers
No. ofRespondents
SamplingRatios
Tegal 1,182 326 27.6%Pekalongan 504 176 34.9%Semarangponcol 1,835 252 13.7%Semarangtawang 1,430 334 23.4%Brumbung 95 20 21.1%Gundih 107 22 20.6%Purwokerto 857 367 42.8%Kroya 928 199 21.4%Kutoarjo 992 301 30.3%Yogyakarta 2,567 550 21.4%Lempuyangan 2,055 273 13.3%Klaten 778 225 28.9%Purwosari 976 206 21.1%Solobalapan 1,684 365 21.7%Solojebres 699 224 32.0%Total 16,689 3,840 23.0%
Source: CJRR Study Team,. Railway Traffic Survey, 2008
b. Origin Destination Table Calibration Methodology
Origin and destination table of railway users in the Central Java region was calibrated by
railway passenger count survey and railway OD survey results. Expansion factor by train by
survey station were calculated by dividing boarding passengers of the train by the number of
OD survey respondents. Since the passengers who will alight at non-surveyed stations can
represent boarding passengers at non-surveyed stations, these samples with opposite OD were added for OD table.
4) Survey Results
a. Origin Destination Table by Major Stations
Daily passenger flow between major stations were surveyed in Railway Traffic Survey (Table
1.1.5). Passenger volumes from / to Jakarta is the largest amongst all stations except Yogyakarta and Solo station. In the Central Java region, Yogyakarta – Solo, Semarang – Tegal, Semarang – Cepu, Kutoarjo – Yogyakarta, Semarang – Pekalongan have larger number
of passengers in order.

The Study on Development of Regional Railway System of Central Java Region Final Report
A - 10
Table 1.1.5 Daily Passenger Flow between Major Stations
The Central Java Region External Zone
From/To C
epu
Kla
ten
Kro
ya
Kut
oarjo
Peka
long
a
Purw
oker
t
Sem
aran
g
Solo
Tega
l
Yog
yaka
rt
aJa
karta
Ban
dung
Sura
baya
Total
Cepu - - - - 15 - 332 - - - - - - 346
Klaten - - 5 1 - 4 - 66 - 81 420 39 39 656
Kroya - 5 - 12 - 15 3 55 - 60 313 99 41 604
Kutoarjo - 4 12 - - 93 - 42 - 257 848 186 96 1,537
Pekalongan 15 - - - - - 100 - 63 - 239 14 52 482
Purwokerto - - 15 34 - - - 10 - 22 455 - 50 587
Semarang 332 - - - 116 - - 92 508 24 1,746 39 280 3,137
Solo - 43 26 11 5 69 39 - 9 1,514 670 251 215 2,852
Tegal - - - - - - 685 6 - - 588 7 37 1,323
Yogyakarta - 22 19 184 - 97 - 1,307 - - 1,251 390 281 3,551
Jakarta - 424 313 848 239 455 1,747 711 588 1,251 - - - 6,576
Bandung - 39 99 186 14 - 39 251 7 390 - - - 1,024
Surabaya - 39 41 96 52 50 283 215 37 281 - - - 1,093
Total 346 575 531 1,372 440 784 3,228 2,753 1,211 3,881 6,531 1,024 1,090 23,766 Note: Semarang, Solo, Yogyakarta, Jakarta, Bandung, Surabaya include all the stations in each city. Source: CJRR Study Team,. Railway Traffic Survey, 2008
b. Desire Line of the Central Java Region
Railway passenger boarding and alighting in the Central Java region is shown in Source: CJRR Study Team,. Railway Traffic Survey, 2008 Figure 1.1.9. Passenger volume from / to Jakarta is larger than other OD pairs such as intra the Central Java region and passenger from / Surabaya, Bandung. Passenger volume of intra the Central Java region is also shown in Source: CJRR Study Team,. Railway Traffic Survey, 2008
Figure 1.1.10. Although railway passenger volume of OD pairs connecting large cities in the Central Java region such as Semarang – Tegal, Semarang – Blora, Surakarta – Yogyakarta,
Surakarta – Sleman exceeds 600 passengers per day (both directions), Semarang – Surakarta
pair is only about 40 passengers per day for both directions.

Appendix 1 Transportation Surveys
A - 11
Source: CJRR Study Team,. Railway Traffic Survey, 2008
Figure 1.1.9 Desire Line of Railway Passengers Boarding and Alighting in the Central Java Region
Source: CJRR Study Team,. Railway Traffic Survey, 2008
Figure 1.1.10 Desire Line of Railway Passengers intra Central Java Region
c. Trip Purpose
Trip purpose of railway passenger is show in Source: CJRR Study Team,. Railway Traffic Survey, 2008
Figure 1.1.10. Commuters (trip from / to work and school) shares approximately 45 % of total trips. Private purposes including shopping, trip and hospital has share of 26.1 %.

The Study on Development of Regional Railway System of Central Java Region Final Report
A - 12
26.1% 11.0% 3.9%3.7% 9.6% 17.1% 28.6%
0% 10% 20% 30% 40% 50% 60% 70% 80% 90% 100%
Purpose
Go to work Go back from workGo to school Go back from schoolGo to shopping, trip and hospital etc Go back from shopping, trip and hospital etcOther
Source: CJRR Study Team,. Railway Traffic Survey, 2008
Figure 1.1.11 Trip Purpose of Railway Passengers
d. Access and Egress Transportation Mode
Access and egress transportation mode to a railway station was surveyed in Railway Traffic Survey (Source: CJRR Study Team,. Railway Traffic Survey, 2008
Figure 1.1.12). Since the survey was conducted for boarding passengers, the shares for access transportation mode of motorcycle and bus including Angkutan Kota (small intra-city bus) are
the largest, approximately 30% each. The share for egress transportation of bus and Angkutan
Kota is approximately 37%. The share for egress transportation of taxi and bajaj (small taxi), walking, bus, becak (cycle rickshaw) and ojek (motorcycle taxi) is larger than their shares of
access transportation mode.
4.3%
6.2%
30.9%
15.0%
29.4%
36.8%
9.7%
10.8%
7.9%
14.1%
15.6%
14.4%
2.3%
2.8%
0% 10% 20% 30% 40% 50% 60% 70% 80% 90% 100%
Access
Egress
Walk Motorcycle Bus, Angkutan Kota Becak, Ojek Taxi, Bajaj Car Other
Source: CJRR Study Team,. Railway Traffic Survey, 2008
Figure 1.1.12 Access and Egress Transportation Mode to a Railway Station
e. Transfer Behavior of Railway Passengers
Train transfer behaviors were surveyed in Railway Traffic Survey (Source: CJRR Study Team,. Railway Traffic Survey, 2008
Figure 1.1.13). More than 90% of passengers do not transfer when they use railway in the Central Java region. In fact, approximately 98% of passengers do not transfer when they

Appendix 1 Transportation Surveys
A - 13
travel within the Central Java region.
97.8%
94.5%
2.2%
5.5%
0% 10% 20% 30% 40% 50% 60% 70% 80% 90% 100%
Intra-Central JavaTravel
Central Java - ExternalTravel
With Transfer Without Transfer
Source: CJRR Study Team,. Railway Traffic Survey, 2008
Figure 1.1.13 Transfer Behavior of Railway Passengers
f. Alternative Transport Mode
Alternative transportation mode for railway user was also surveyed in Railway Traffic Survey (Source: CJRR Study Team,. Railway Traffic Survey, 2008
Figure 1.1.14). Although share of bus is the largest for all classes, shares of car, railway and plane are relatively higher for executive and business class. More than 65% of economy class
passenger answered they would use bus if railway is not available.
40.8%
51.7%
67.7%
20.7%
6.0%
1.2%
3.2%
2.7%
0.5%
14.4%
11.4%
8.4%
2.2%
12.9%
3.7%
18.8%
15.4%
18.6%
0% 10% 20% 30% 40% 50% 60% 70% 80% 90% 100%
Executive
Business
Economy
Bus Plane Taxi, Bajaj Car Motorcycle Other
Source: CJRR Study Team,. Railway Traffic Survey, 2008
Figure 1.1.14 Alternative Transportation Mode for Railway
g. Reasons for Railway Use
Reasons for railway use were asked to railway users (Source: CJRR Study Team,. Railway Traffic Survey, 2008
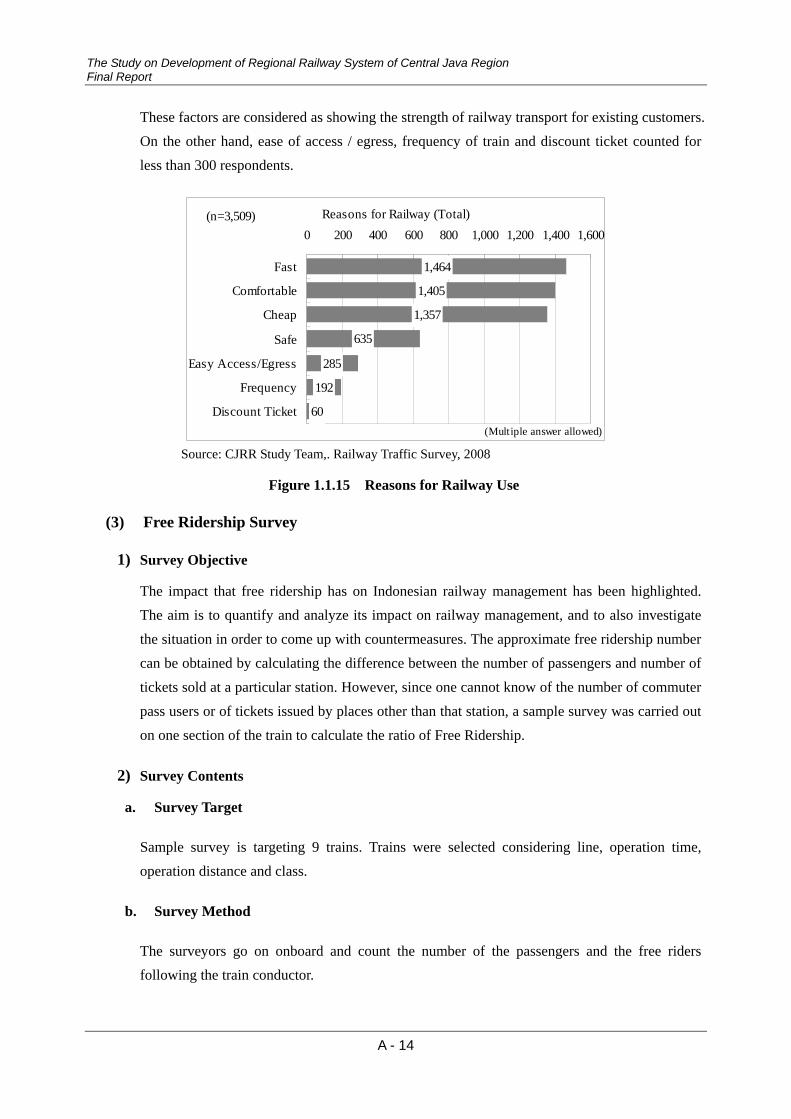
Figure 1.1.15). Speed, comfort and price are the three major reasons why they choose railway for more than 1,350 respondents. Another major reason is safety with about 600 respondents.
The Study on Development of Regional Railway System of Central Java Region Final Report
A - 14
These factors are considered as showing the strength of railway transport for existing customers.
On the other hand, ease of access / egress, frequency of train and discount ticket counted for
less than 300 respondents.
Reasons for Railway (Total)
1,464
1,405
1,357
635
285
192
60
0 200 400 600 800 1,000 1,200 1,400 1,600
Fast
Comfortable
Cheap
Safe
Easy Access/Egress
Frequency
Discount Ticket
(n=3,509)
(Multiple answer allowed)
Source: CJRR Study Team,. Railway Traffic Survey, 2008
Figure 1.1.15 Reasons for Railway Use
(3) Free Ridership Survey
1) Survey Objective
The impact that free ridership has on Indonesian railway management has been highlighted. The aim is to quantify and analyze its impact on railway management, and to also investigate
the situation in order to come up with countermeasures. The approximate free ridership number
can be obtained by calculating the difference between the number of passengers and number of
tickets sold at a particular station. However, since one cannot know of the number of commuter
pass users or of tickets issued by places other than that station, a sample survey was carried out
on one section of the train to calculate the ratio of Free Ridership.
2) Survey Contents
a. Survey Target
Sample survey is targeting 9 trains. Trains were selected considering line, operation time,
operation distance and class.
b. Survey Method
The surveyors go on onboard and count the number of the passengers and the free riders following the train conductor.

Appendix 1 Transportation Surveys
A - 15
c. Survey Schedule
Survey schedule of free ridership survey is abovementioned in. The survey was conducted from
10th to 15th March, 2008.
3) Survey Results
a. Free Riders by Train Type
The impact that free ridership has on Indonesian railway management has been highlighted.
For the purpose of understanding impact of free riders on railway management, free ridership
survey was conducted at 9 major trains in the Central Java region. The number of Free Riders
by train type is shown in Table 1.1.6. The average ratio of train free rider in the Central Java region is 5.2%. Free rider ratio is comparatively high for local train, longitudinal line, day
train and business and economy class train. Pandanwangi, a local train connecting Surakarta and Semarang, had the highest ratio of 23.6%.
Table 1.1.6 Free Riders by Train Type
Train Type# of
SurveyTrains
# of Pax # ofFree Rider
Free RiderRatio
Long Distance 5 1,392 49 3.5%Local Train 4 996 75 7.5%
North Corridor 6 1,737 51 2.9%South Corridor 2 469 30 6.4%Longitudinal 1 182 43 23.6%
Day Train 8 2,157 124 5.7%Night Traing 1 231 0 0.0%
Executive Class 3 520 13 2.5%Business Class 4 1,205 90 7.5%Economy Class 2 663 21 3.2%
Total 9 2,388 124 5.2% Source: CJRR Study Team,. Railway Traffic Survey, 2008 Note: Free Rider Survey Data of DAOP IV and V
1.2 Road Traffic Survey Road Traffic Survey was conducted for the purpose of acquiring information on the characteristics of road users in the Central Java region. The data is used to develop and
examine the current OD matrices especially in this area.
The Study on Development of Regional Railway System of Central Java Region Final Report
A - 16
(1) Classified Hourly Traffic Count Survey
1) Survey Objective
For the purpose of obtaining the classified traffic count and road usage status of roads the classified traffic count survey was conducted. The results are compared with previously
implemented surveys to understand the change in usage over the years.
2) Survey Contents
a. Survey Location
Since the Yogyakarta – Surakarta – Semarang corridor is considered as Case Study area at the
survey commencement point in time, the survey was conducted at 18 locations along the
corridor. (See Figure 1.2.5)
b. Survey Method
Conduct a manual count at each survey location.
c. Vehicle Classification
In keeping with the standard used in Indonesia, the vehicle categories to be used are 10
classifications; motorbikes, passenger cars, small buses, middle buses, large buses, pickup and small 2 axles truck, large 2 axles truck, 3 axles truck, 4 axles truck and more than 5 axles truck.
d. Survey Period
In keeping with the working hours in regional cities, it was from 6:00 to 20:00, a total of 14
hours on Tuesday, Wednesday or Thursday. The survey was conducted from June to July, 2008.
3) Survey Results Traffic volumes of major road around Semarang, Surakarta and Yogyakarta city are shown in Source: CJRR Study Team,. Road Traffic Survey, 2008 Figure 1.2.1, Source: CJRR Study Team,. Road Traffic Survey, 2008 Figure 1.2.2 and Source: CJRR Study Team,. Road Traffic Survey, 2008
Figure 1.2.3 respectively. Traffic volumes of motorcycle exceed more than 35,000 in 14 hours at locations close to Semarang. Traffic volumes of truck are relatively higher,
approximately 10,000 vehicles in 14 hours, at national road survey locations surrounding
Semarang city. Although traffic volume around Surakarta city is relatively lower than that of
Semarang, more than 10,000 vehicles (excluding motorcycle) pass national roads toward Semarang, East Java and Yogyakarta. Focusing on Yogyakarta city, traffic volumes of
national roads toward northern, eastern and western direction from Yogyakarta city are

Appendix 1 Transportation Surveys
A - 17
relatively higher compared with other provincial roads.
Source: CJRR Study Team,. Road Traffic Survey, 2008
Figure 1.2.1 Traffic Volume of Major Roads around Semarang City
41.8
8.94.2
12.1
0.0
10.0
20.0
30.0
40.0
50.0
60.0
1. Tugu
38.0
5.8 4.29.0
0.0
10.0
20.0
30.0
40.0
50.0
60.0
2. Kaligawe
44.6
15.9
4.810.5
0.0
10.0
20.0
30.0
40.0
50.0
60.0
3. Ungaran
12.5
2.0 0.6 2.9
0.0
10.0
20.0
30.0
40.0
50.0
60.0
5. Godong
61.9
3.8 1.94.8
0.0
10.0
20.0
30.0
40.0
50.0
60.0
15. Jl. Raya Bdn R.
MotorcycleCarBusTruck
5.4 3.50.7
3.3
0.0
10.0
20.0
30.0
40.0
50.0
60.0
4. Soropadan
[Unit: 1,000 vehicles per 14 hours]

The Study on Development of Regional Railway System of Central Java Region Final Report
A - 18
Source: CJRR Study Team,. Road Traffic Survey, 2008
Figure 1.2.2 Traffic Volume of Major Roads around Surakarta City
MotorcycleCarBusTruck
23.9
9.2
1.75.8
0.0
10.0
20.0
30.0
40.0
50.0
60.0
11. Tegal Gondo
11.2
4.51.3
5.9
0.0
10.0
20.0
30.0
40.0
50.0
60.0
12. Ampel
5.81.4 0.3 1.8
0.0
10.0
20.0
30.0
40.0
50.0
60.0
13. Geyer
21.1
6.71.5
5.4
0.0
10.0
20.0
30.0
40.0
50.0
60.0
14. Masaran
25.4
6.51.9
5.8
0.0
10.0
20.0
30.0
40.0
50.0
60.0
16. Bangak
9.6
1.3 0.5 1.80.0
10.0
20.0
30.0
40.0
50.0
60.0
17. Tulung
[Unit: 1,000 vehicles per 14 hours]

Appendix 1 Transportation Surveys
A - 19
Source: CJRR Study Team,. Road Traffic Survey, 2008
Figure 1.2.3 Traffic Volume of Major Roads around Yogyakarta City
MotorcycleCarBusTruck
6.51.6 0.8 1.7
0.0
10.0
20.0
30.0
40.0
50.0
60.0
6. Kaliboto
4.4 2.8 0.7 1.70.0
10.0
20.0
30.0
40.0
50.0
60.0
7. Dadirejo
18.3
5.01.2 3.0
0.0
10.0
20.0
30.0
40.0
50.0
60.0
8. Sedayu
25.4
9.5
1.84.4
0.0
10.0
20.0
30.0
40.0
50.0
60.0
9. Tempel
16.8
2.2 0.5 2.7
0.0
10.0
20.0
30.0
40.0
50.0
60.0
18. Pathuk Wonosari
40.9
13.3
1.55.0
0.0
10.0
20.0
30.0
40.0
50.0
60.0
10. Prambanan
[Unit: 1,000 vehicles per 14 hours]

The Study on Development of Regional Railway System of Central Java Region Final Report
A - 20
12
34
56
78
910
1-2
3-5
6-10
2-10
1-10
From
ToM
otor
Cyc
le
Seda
n,Je
ep,
Kija
ng,
Taks
i
Smal
l Bus
Med
ium
Bus
Larg
e B
usPi
ck-u
p,Tr
uck
2Ax
le
Truc
k 2
Axl
esTr
uck
3A
xles
Truc
k 4
Axl
es
Truc
k 5
Axle
s an
dM
ore
Priv
ate
Car
Publ
icTr
ansp
ort
Car
goVe
hicl
eFo
urw
heel
Vehi
cle
Tota
lVe
hicl
e
AS
emar
ang
Ken
dal
21,9
004,
277
880
835
547
3,29
782
094
935
418
326
,177
2,26
25,
603
12,1
4234
,042
BK
enda
lS
emar
ang
19,8
974,
670
695
864
363
3,96
081
898
249
719
824
,567
1,92
26,
455
13,0
4732
,944
41,7
978,
947
1,57
51,
699
910
7,25
71,
638
1,93
185
138
150
,744
4,18
412
,058
25,1
8966
,986
62.4
0%13
.36%
2.35
%2.
54%
1.36
%10
.83%
2.45
%2.
88%
1.27
%0.
57%
75.7
5%6.
25%
18.0
0%37
.60%
100.
00%
AS
emar
ang
Dem
ak18
,508
2,97
81,
440
236
274
2,47
755
379
149
116
821
,486
1,95
04,
480
9,40
827
,916
BD
emak
Sem
aran
g19
,491
2,86
41,
355
366
524
2,27
876
879
245
122
522
,355
2,24
54,
514
9,62
329
,114
37,9
995,
842
2,79
560
279
84,
755
1,32
11,
583
942
393
43,8
414,
195
8,99
419
,031
57,0
3066
.63%
10.2
4%4.
90%
1.06
%1.
40%
8.34
%2.
32%
2.78
%1.
65%
0.69
%76
.87%
7.36
%15
.77%
33.3
7%10
0.00
%A
Sem
aran
gB
awen
17,5
859,
011
1,16
231
759
63,
371
406
488
181
5126
,596
2,07
54,
497
15,5
8333
,168
BB
awen
Sem
aran
g27
,028
6,85
31,
670
257
816
4,84
349
141
821
560
33,8
812,
743
6,02
715
,623
42,6
5144
,613
15,8
642,
832
574
1,41
28,
214
897
906
396
111
60,4
774,
818
10,5
2431
,206
75,8
1958
.84%
20.9
2%3.
74%
0.76
%1.
86%
10.8
3%1.
18%
1.19
%0.
52%
0.15
%79
.76%
6.35
%13
.88%
41.1
6%10
0.00
%A
Sem
aran
gM
agel
ang
2,54
11,
819
4428
299
1,31
411
318
335
144,
360
371
1,65
93,
849
6,39
0B
Mag
elan
gS
emar
ang
2,89
41,
655
4042
241
1,29
213
215
442
94,
549
323
1,62
93,
607
6,50
15,
435
3,47
484
7054
02,
606
245
337
7723
8,90
969
43,
288
7,45
612
,891
42.1
6%26
.95%
0.65
%0.
54%
4.19
%20
.22%
1.90
%2.
61%
0.60
%0.
18%
69.1
1%5.
38%
25.5
1%57
.84%
100.
00%
AS
emar
ang
Pur
wod
adi
6,22
01,
025
110
115
104
1,32
553
119
22
7,24
532
91,
501
2,85
59,
075
BP
urw
odad
iS
emar
ang
6,24
199
772
122
125
1,19
968
826
57,
238
319
1,36
02,
676
8,91
712
,461
2,02
218
223
722
92,
524
121
201
87
14,4
8364
82,
861
5,53
117
,992
69.2
6%11
.24%
1.01
%1.
32%
1.27
%14
.03%
0.67
%1.
12%
0.04
%0.
04%
80.5
0%3.
60%
15.9
0%30
.74%
100.
00%
AM
agel
ang
Pur
wor
ejo
3,19
980
822
874
106
682
3310
07
74,
007
408
829
2,04
55,
244
BP
urw
orej
oM
agel
ang
3,30
980
322
883
6977
129
4410
94,
112
380
863
2,04
65,
355
6,50
81,
611
456
157
175
1,45
362
144
1716
8,11
978
81,
692
4,09
110
,599
61.4
0%15
.20%
4.30
%1.
48%
1.65
%13
.71%
0.58
%1.
36%
0.16
%0.
15%
76.6
0%7.
43%
15.9
6%38
.60%
100.
00%
AW
ates
Pur
wor
ejo
2,07
01,
403
9425
270
650
7213
544
83,
473
389
909
2,70
14,
771
BP
urw
orej
oW
ates
2,28
81,
384
9515
212
594
7797
525
3,67
232
282
52,
531
4,81
94,
358
2,78
718
940
482
1,24
414
923
296
137,
145
711
1,73
45,
232
9,59
045
.44%
29.0
6%1.
97%
0.42
%5.
03%
12.9
7%1.
55%
2.42
%1.
00%
0.14
%74
.50%
7.41
%18
.08%
54.5
6%10
0.00
%A
Jogj
aW
ates
8,43
22,
440
196
190
298
1,20
211
516
049
1010
,872
684
1,53
64,
660
13,0
92B
Wat
esJo
gja
9,84
02,
595
201
9324
51,
201
8911
043
912
,435
539
1,45
24,
586
14,4
2618
,272
5,03
539
728
354
32,
403
204
270
9219
23,3
071,
223
2,98
89,
246
27,5
1866
.40%
18.3
0%1.
44%
1.03
%1.
97%
8.73
%0.
74%
0.98
%0.
33%
0.07
%84
.70%
4.44
%10
.86%
33.6
0%10
0.00
%A
Mag
elan
gS
lem
an10
,574
4,36
134
818
842
01,
705
9892
486
14,9
3595
61,
949
7,26
617
,840
BS
lem
anM
agel
ang
14,8
665,
125
308
147
431
2,24
310
310
338
819
,991
886
2,49
58,
506
23,3
7225
,440
9,48
665
633
585
13,
948
201
195
8614
34,9
261,
842
4,44
415
,772
41,2
1261
.73%
23.0
2%1.
59%
0.81
%2.
06%
9.58
%0.
49%
0.47
%0.
21%
0.03
%84
.75%
4.47
%10
.78%
38.2
7%10
0.00
%A
Jogj
aK
late
n20
,249
6,78
115
948
534
1,97
210
416
096
1427
,030
741
2,34
69,
868
30,1
17B
Kla
ten
Jogj
a20
,694
6,51
617
769
486
2,16
117
915
879
2927
,210
732
2,60
69,
854
30,5
4840
,943
13,2
9733
611
71,
020
4,13
328
331
817
543
54,2
401,
473
4,95
219
,722
60,6
6567
.49%
21.9
2%0.
55%
0.19
%1.
68%
6.81
%0.
47%
0.52
%0.
29%
0.07
%89
.41%
2.43
%8.
16%
32.5
1%10
0.00
%
Car
go V
ehic
le
Cod
eLo
catio
nSu
rvey
Perio
d
Priv
ate
Car
Dat
e
June
17t
h, 2
008
June
19t
h, 2
008
June
24t
h, 2
008
June
19t
h, 2
008
R-5
God
ong
14 H
ours
June
24t
h, 2
008
Dire
ctio
n Pu
blic
Tra
nspo
rt
R-3
Ung
aran
14 H
ours
14 H
ours
Tota
l
R-1
Tugu
14 H
ours
R-2
Kal
igaw
e14
Hou
rs
R-7
Dad
irejo
14 H
ours
R-4
Sor
opad
an
R-9
R-6
Kal
ibot
o14
Hou
rsJu
ne 2
6th,
200
8
Jul
y 1s
t, 20
08
R-8
Sed
ayu
Jul
y 1s
t, 20
0814
Hou
rs
R-1
0 P
ram
bana
n J
uly
3rd,
200
814
Hou
rs
Tem
pel
June
26t
h, 2
008
14 H
ours
Tabl
e 1.
2.1
Cla
ssifi
ed H
ourl
y Tr
affic
Cou
nt S
urve
y R
esul
ts (1
/2)
Sour
ce: C
JRR
Stu
dy T
eam
,. R
oad
Traf
fic S
urve
y, 2
008

Appendix 1 Transportation Surveys
A - 21
12
34
56
78
910
1-2
3-5
6-10
2-10
1-10
From
ToM
otor
Cyc
le
Seda
n,Je
ep,
Kija
ng,
Taks
i
Smal
l Bus
Med
ium
Bus
Larg
e B
usPi
ck-u
p,Tr
uck
2Ax
le
Truc
k 2
Axl
esTr
uck
3A
xles
Truc
k 4
Axl
es
Truc
k 5
Axle
s an
dM
ore
Priv
ate
Car
Publ
icTr
ansp
ort
Car
goVe
hicl
eFo
urw
heel
Vehi
cle
Tota
lVe
hicl
e
AK
arto
suro
Kla
ten
11,3
194,
406
305
7748
12,
467
138
248
7816
15,7
2586
32,
947
8,21
619
,535
BK
late
nK
arto
suro
12,6
084,
812
311
8945
52,
203
287
236
999
17,4
2085
52,
834
8,50
121
,109
23,9
279,
218
616
166
936
4,67
042
548
417
725
33,1
451,
718
5,78
116
,717
40,6
4458
.87%
22.6
8%1.
52%
0.41
%2.
30%
11.4
9%1.
05%
1.19
%0.
44%
0.06
%81
.55%
4.23
%14
.22%
41.1
3%10
0.00
%A
Sem
aran
gS
olo
5,77
52,
326
146
178
307
2,52
717
823
312
616
8,10
163
13,
080
6,03
711
,812
BS
olo
Sem
aran
g5,
433
2,21
413
312
643
92,
087
236
309
113
257,
647
698
2,77
05,
682
11,1
1511
,208
4,54
027
930
474
64,
614
414
542
239
4115
,748
1,32
95,
850
11,7
1922
,927
48.8
9%19
.80%
1.22
%1.
33%
3.25
%20
.12%
1.81
%2.
36%
1.04
%0.
18%
68.6
9%5.
80%
25.5
2%51
.11%
100.
00%
AS
rage
nP
urw
odad
i2,
935
680
4318
8778
438
480
03,
615
148
870
1,69
84,
633
BP
urw
odad
iS
rage
n2,
846
674
4513
106
847
4147
00
3,52
016
493
51,
773
4,61
95,
781
1,35
488
3119
31,
631
7995
00
7,13
531
21,
805
3,47
19,
252
62.4
8%14
.63%
0.95
%0.
34%
2.09
%17
.63%
0.85
%1.
03%
0.00
%0.
00%
77.1
2%3.
37%
19.5
1%37
.52%
100.
00%
AS
rage
nK
aran
gany
ar11
,732
4,02
223
695
440
2,21
819
231
210
617
15,7
5477
12,
845
7,63
819
,370
BK
aran
gany
arS
rage
n9,
400
2,72
019
981
410
1,89
319
331
213
318
12,1
2069
02,
549
5,95
915
,359
21,1
326,
742
435
176
850
4,11
138
562
423
935
27,8
741,
461
5,39
413
,597
34,7
2960
.85%
19.4
1%1.
25%
0.51
%2.
45%
11.8
4%1.
11%
1.80
%0.
69%
0.10
%80
.26%
4.21
%15
.53%
39.1
5%10
0.00
%A
Pur
wod
adi
Sem
aran
g33
,941
1,82
782
114
112
12,
109
8111
137
1035
,768
1,08
32,
348
5,25
839
,199
BS
emar
ang
Pur
wod
adi
27,9
102,
017
594
153
981,
582
649
109
5537
29,9
2784
52,
432
5,29
433
,204
61,8
513,
844
1,41
529
421
93,
691
730
220
9247
65,6
951,
928
4,78
010
,552
72,4
0385
.43%
5.31
%1.
95%
0.41
%0.
30%
5.10
%1.
01%
0.30
%0.
13%
0.06
%90
.74%
2.66
%6.
60%
14.5
7%10
0.00
%A
Kar
tosu
roBo
yola
li12
,440
3,36
734
727
049
92,
137
222
371
145
3615
,807
1,11
62,
911
7,39
419
,834
BB
oyol
ali
Kar
tosu
ro12
,932
3,09
626
022
829
82,
152
260
279
148
2116
,028
786
2,86
06,
742
19,6
7425
,372
6,46
360
749
879
74,
289
482
650
293
5731
,835
1,90
25,
771
14,1
3639
,508
64.2
2%16
.36%
1.54
%1.
26%
2.02
%10
.86%
1.22
%1.
65%
0.74
%0.
14%
80.5
8%4.
81%
14.6
1%35
.78%
100.
00%
AB
oyol
ali
Kla
ten
4,74
562
914
848
883
945
270
15,
374
204
912
1,74
56,
490
BK
late
nB
oyol
ali
4,81
662
518
561
479
935
176
35,
441
250
860
1,73
56,
551
9,56
11,
254
333
109
121,
638
8044
64
10,8
1545
41,
772
3,48
013
,041
73.3
1%9.
62%
2.55
%0.
84%
0.09
%12
.56%
0.61
%0.
34%
0.05
%0.
03%
82.9
3%3.
48%
13.5
9%26
.69%
100.
00%
AB
antu
lK
idul
8,21
11,
070
117
3678
1,45
023
251
09,
281
231
1,49
92,
800
11,0
11B
Kid
ulB
antu
l8,
638
1,12
013
242
991,
159
2528
10
9,75
827
31,
213
2,60
611
,244
16,8
492,
190
249
7817
72,
609
4853
20
19,0
3950
42,
712
5,40
622
,255
75.7
1%9.
84%
1.12
%0.
35%
0.80
%11
.72%
0.22
%0.
24%
0.01
%0.
00%
85.5
5%2.
26%
12.1
9%24
.29%
100.
00%
AW
ates
Pur
wor
ejo
00
00
027
340
6725
00
040
540
540
5B
Pur
wor
ejo
Wat
es0
00
00
178
4153
350
00
307
307
307
00
00
045
181
120
600
00
712
712
712
0.00
%0.
00%
0.00
%0.
00%
0.00
%63
.34%
11.3
8%16
.85%
8.43
%0.
00%
0.00
%0.
00%
100.
00%
100.
00%
100.
00%
AJo
gja
Kla
ten
00
00
034
935
5230
00
046
646
646
6B
Kla
ten
Jogj
a0
00
00
713
6411
437
50
093
393
393
30
00
00
1,06
299
166
675
00
1,39
91,
399
1,39
90.
00%
0.00
%0.
00%
0.00
%0.
00%
75.9
1%7.
08%
11.8
7%4.
79%
0.36
%0.
00%
0.00
%10
0.00
%10
0.00
%10
0.00
%
Car
go V
ehic
le
Cod
eLo
catio
nSu
rvey
Perio
d
Priv
ate
Car
Dat
e
Dire
ctio
n Pu
blic
Tra
nspo
rtTo
tal
R-1
1 T
egal
Gon
do J
uly
8th,
200
814
Hou
rs
R-1
2Am
pel
June
17t
h, 2
008
14 H
ours
June
10t
h, 2
008
14 H
ours
R-1
3G
eyer
July
e 8t
h, 2
008
14 H
ours
R-1
4M
asar
an J
uly
3rd,
200
814
Hou
rs
R-1
6Ba
ngak
June
12t
h, 2
008
14 H
ours
R-1
5Jl
. Ray
a B
andu
ng R
ejo
KM
.12
R-1
7Tu
lung
June
11t
h, 2
008
14 H
ours
R-1
8P
athu
k W
onos
ari
June
10t
h, 2
008
14 H
ours
R-7
-JT
Tim
bang
Kul
war
u J
uly
1st,
2008
14 H
ours
R-1
0-JT
Jem
bata
n Ti
mba
ng J
uly
3rd,
200
814
Hou
rs
Tabl
e 1.
2.2
Cla
ssifi
ed H
ourl
y Tr
affic
Cou
nt S
urve
y R
esul
ts (2
/2)
Sour
ce: C
JRR
Stu
dy T
eam
,. R
oad
Traf
fic S
urve
y, 2
008

The Study on Development of Regional Railway System of Central Java Region Final Report
A - 22
(2) Roadside OD Interview Survey
1) Survey Objective
To understand the traffic flow between cities and create an OD table of automobile users for
use as basic data for forecasting traffic demand.
2) Survey Contents
a. Survey Location
This Survey is carried out at 14 locations along Yogyakarta – Surakarta – Semarang corridor at
trunk road locations at kabupaten/kota boundaries. The Traffic Count Survey was also be
conducted at the same locations as the Roadside OD Interview Survey to obtain total volume
data as well. (See Figure 1.2.5) Cargo traffic was surveyed at Weight Bridge Station (or Jembatan timbang) in case of Location No. 7 and No. 10.
b. Survey Method
Interviewer made vehicles traveling along the Survey points stop by the road side with the
cooperation of a police officer to ask the drivers about trip purpose, OD, etc. The
approximate number of bus passenger by bus sizes were also counted for the purpose of
grasping the number of passengers who pass through kabupaten/kota boundaries.
Source: CJRR Study Team,. Road Traffic Survey, 2008
Figure 1.2.4 Roadside OD Interview Survey Situation

Appendix 1 Transportation Surveys
A - 23
c. Vehicle Classification
In keeping with the standard used in Indonesia, the vehicle categories to be used are 7
classifications; motorbikes, passenger cars, pickup and small 2 axles truck, large 2 axles truck,
3 axles truck, 4 axles truck and more than 5 axles truck. Since bus passenger OD data can be
obtained from Bus Passenger OD Interview Survey, bus was not a target of this survey
d. Survey Period
Survey period was the same as the Traffic Count Survey; 6:00 to 20:00, a total of 14 hours on
Tuesday, Wednesday or Thursday. The survey was conducted from June to July, 2008.

The Study on Development of Regional Railway System of Central Java Region Final Report
A - 24
Figure 1.2.5 Map of Road Traffic Survey Locations
3) Origin Destination Table Calibration and Analyses for Passenger Transport
a. Sampling Ratios
Since traveling vehicles are forced to pull over and stop for the Roadside OD Interview Survey,
it is necessary to minimize the impact on traffic flow. The hourly sampling is shown as follows.
((11)) ((22))
((33))
((44))
((55))
((66))
((77)) ((88))
((99))
((1100))
((1111))
((1122))
((1133))
((1144))
((1155))
((1166)) ((1177))
((1188))

Appendix 1 Transportation Surveys
A - 25
Table 1.2.3 Sampling Ratios of Road Side Interview Survey (Pax. Car and Motorcycle)
[Unit: Number of vehicles / 14h]
From To RSI TC Sample R. RSI TC Sample R.R-1a Tugu Semarang Kendal 380 4,277 9% 537 21,900 2%R-1b Tugu Kendal Semarang 341 4,670 7% 396 19,897 2%R-2a Kaligawe Semarang Demak 594 2,978 20% 707 18,508 4%R-2b Kaligawe Demak Semarang 525 2,864 18% 1,020 19,491 5%R-3a Ungaran Semarang Bawen 480 9,011 5% 788 17,585 4%R-3b Ungaran Bawen Semarang 488 6,853 7% 1,533 27,028 6%R-4a Soropadan Semarang Magelang 460 1,819 25% 626 2,541 25%R-4b Soropadan Magelang Semarang 496 1,655 30% 780 2,894 27%R-5a Godong Semarang Purwodadi 314 1,025 31% 845 6,220 14%R-5b Godong Purwodadi Semarang 275 997 28% 686 6,241 11%R-6a Kaliboto Magelang Purworejo 381 808 47% 592 3,199 19%R-6b Kaliboto Purworejo Magelang 415 803 52% 789 3,309 24%R-7a Dadirejo Wates Purworejo 709 1,403 51% 907 2,070 44%R-7b Dadirejo Purworejo Wates 602 1,384 43% 893 2,288 39%R-8a Sedayu Jogja Wates 462 2,440 19% 1,604 8,432 19%R-8b Sedayu Wates Jogja 467 2,595 18% 1,802 9,840 18%R-9a Tempel Magelang Sleman 932 4,361 21% 1,011 10,574 10%R-9b Tempel Sleman Magelang 705 5,125 14% 1,305 14,866 9%R-10a Prambanan Jogja Klaten 458 6,781 7% 1,883 20,249 9%R-10b Prambanan Klaten Jogja 321 6,516 5% 1,884 20,694 9%R-11a Tegal Gond Kartosuro Klaten 979 4,406 22% 1,335 11,319 12%R-11b Tegal Gond Klaten Kartosuro 842 4,812 17% 1,754 12,608 14%R-12a Ampel Semarang Solo 383 2,326 16% 408 5,775 7%R-12b Ampel Solo Semarang 427 2,214 19% 506 5,433 9%R-13a Geyer Sragen Purwodadi 247 680 36% 919 2,935 31%R-13b Geyer Purwodadi Sragen 344 674 51% 771 2,846 27%R-14a Masaran Sragen Karanganyar 692 4,022 17% 841 11,732 7%R-14b Masaran Karanganyar Sragen 561 2,720 21% 1,076 9,400 11%Note: RSI: The number of Roadside Interview Survey samples, TC: The number of vehicle counting survey result Sample R.: Sampling Ratios
Code Passenger Car MotorcycleDirectionLocation
Source: CJRR Study Team,. Road Traffic Survey, 2008
b. Methodology
Origin and destination table of vehicles in Central Java region was calibrated by classified
hourly traffic count survey and roadside OD interview survey results. Expansion factor by
vehicle type for each survey location were calculated by dividing the number of vehicle by the number of OD survey respondents, and vehicle OD tables for each survey location were
manipulated. Vehicle OD table was manipulated by summing up vehicle OD table of each
locations avoiding duplication. Since the roadside OD interview survey was conducted during
14 hours, vehicle OD tables were expanded by multiplying a 24h/14h factor which was
estimated based on the survey results conducted in “Study of Economic Partnership Projects in
Developing Countries in FY2006”. 24h/14h factors by vehicle type are shown below.
Table 1.2.4 24 Hours / 14 Hours Expansion Ratio by Vehicle Type
Motorcycle Passenger Car Small Bus Medium Bus Large Bus
1.15 1.22 1.17 1.17 1.34

The Study on Development of Regional Railway System of Central Java Region Final Report
A - 26
Pick Up 2 Axles Truck 3 Axles Truck 4 Axles Truck 5+ Axles Truck
1.22 1.39 1.51 1.58 2.19 Source: CJRR estimation based on road traffic survey of “Study of Economic Partnership Projects in Developing Countries in FY2006” (JETRO)
Finally vehicle OD tables were converted by multiplying average passengers. According to
the roadside interview survey, average passengers of motorcycle is 1.39 per vehicle and 3.24
for passenger cars.
c. Origin and Destination Table by Analysis Zone
The OD tables of passenger car and motorcycle are shown below.
Table 1.2.5 Passenger OD Table of Passenger Car in the Central Java Region by Analysis Zone
[Unit: passengers per day] Bo De Es Kl Ku Ma Pu Sa Sm Sr Su Ws Yo Total
Bo 79 263 677 19 121 164 1,540 1,160 115 89 395 748 5,370
De 93 18 22 181 343 3,413 28 137 750 311 5,296
Es 241 31 778 173 653 102 646 4,825 194 4,118 4,842 5,377 21,981
Kl 679 29 850 283 613 33 286 996 311 6,449 1,471 9,565 21,564
Ku 117 22 272 198 86 13 0 155 22 117 522 5,237 6,761
Ma 71 33 702 525 64 37 713 2,005 64 647 2,317 9,867 17,045
Pu 93 244 136 77 98 186 1,177 163 418 237 402 3,231
Sa 1,780 334 879 457 8 673 297 7,062 32 1,371 1,187 1,447 15,526
Sm 1,078 3,057 5,074 903 119 2,606 1,099 8,474 396 3,857 9,550 4,145 40,358
Sr 161 65 207 248 23 52 142 23 179 6,674 464 578 8,816
Su 86 162 2,630 4,651 131 1,102 502 1,560 3,288 4,896 2,546 6,963 28,517
Ws 505 368 5,551 1,378 616 2,587 301 1,942 9,731 261 3,381 7,886 34,508
Yo 879 189 3,691 9,321 4,099 10,472 293 996 3,653 428 8,020 7,473 49,514
Total 5,689 4,612 20,348 19,232 5,534 19,086 3,163 16,710 37,644 6,910 35,278 31,753 52,527 258,486
Analysis Zone: Bo = Kab. Boyolali, De = Kab. Demak, Es = Eastern Area of the Semarang-Solo-Yogyakarta Corridor (external zone), Kl = Kab. Klaten, Ku = Kab. Kulon Progo, Ma = Kab. Magelang and Kota Magelang, Pu = Kab. Grobogan, Sa = Kab. Salatiga and Kota Salatiga, Sm = Kota Semarang, Sr = Sragen, Su = Kota Solo (Sulakarta) and Kab. Kranganyar, Ws = Western Area of the Semarang-Solo-Yogyakarta Corridor (external zone), Yo = Kab. Sleman, Kab. Bantul and Kota Yogyakarta Source: CJRR Study Team,. Road Traffic Survey, 2008

Appendix 1 Transportation Surveys
A - 27
Table 1.2.6 Passenger OD Table of Motorcycle in the Central Java Region by Analysis Zone
[Unit: passengers per day] Bo De Es Kl Ku Ma Pu Sa Sm Sr Su Ws Yo Total
Bo 79 128 1,923 14 79 283 3,447 1,521 153 168 279 742 8,817
De 57 147 29 42 1,152 209 15,261 35 134 630 119 17,815
Es 41 155 490 149 267 224 350 3,553 235 1,498 887 1,405 9,257
Kl 2,193 26 515 228 448 89 309 713 299 10,264 460 23,755 39,299
Ku 17 154 129 169 18 92 28 78 771 11,679 13,134
Ma 97 52 233 280 102 29 788 1,289 11 177 3,375 10,070 16,504
Pu 188 1,337 277 58 13 187 1,569 643 707 90 169 5,237
Sa 3,685 740 544 407 17 635 546 14,249 12 1,040 1,073 519 23,466
Sm 624 16,600 4,691 467 32 914 1,540 7,236 212 1,110 11,177 1,194 45,797
Sr 201 46 228 407 22 480 62 514 13,887 42 580 16,466
Su 274 111 1,452 8,410 193 252 607 823 1,313 10,150 629 4,027 28,242
Ws 146 564 871 383 946 3,478 153 1,070 12,207 91 440 4,810 25,159
Yo 671 93 1,254 17,279 10,260 14,165 119 543 1,133 567 4,077 4,439 54,600
Total 8,193 19,802 10,494 30,263 11,941 20,485 5,223 15,041 53,415 12,437 33,580 23,851 59,068 303,792
Analysis Zone: Bo = Kab. Boyolali, De = Kab. Demak, Es = Eastern Area of the Semarang-Solo-Yogyakarta Corridor (external zone), Kl = Kab. Klaten, Ku = Kab. Kulon Progo, Ma = Kab. Magelang and Kota Magelang, Pu = Kab. Grobogan, Sa = Kab. Salatiga and Kota Salatiga, Sm = Kota Semarang, Sr = Sragen, Su = Kota Solo (Sulakarta) and Kab. Kranganyar, Ws = Western Area of the Semarang-Solo-Yogyakarta Corridor (external zone), Yo = Kab. Sleman, Kab. Bantul and Kota Yogyakarta Source: CJRR Study Team,. Road Traffic Survey, 2008
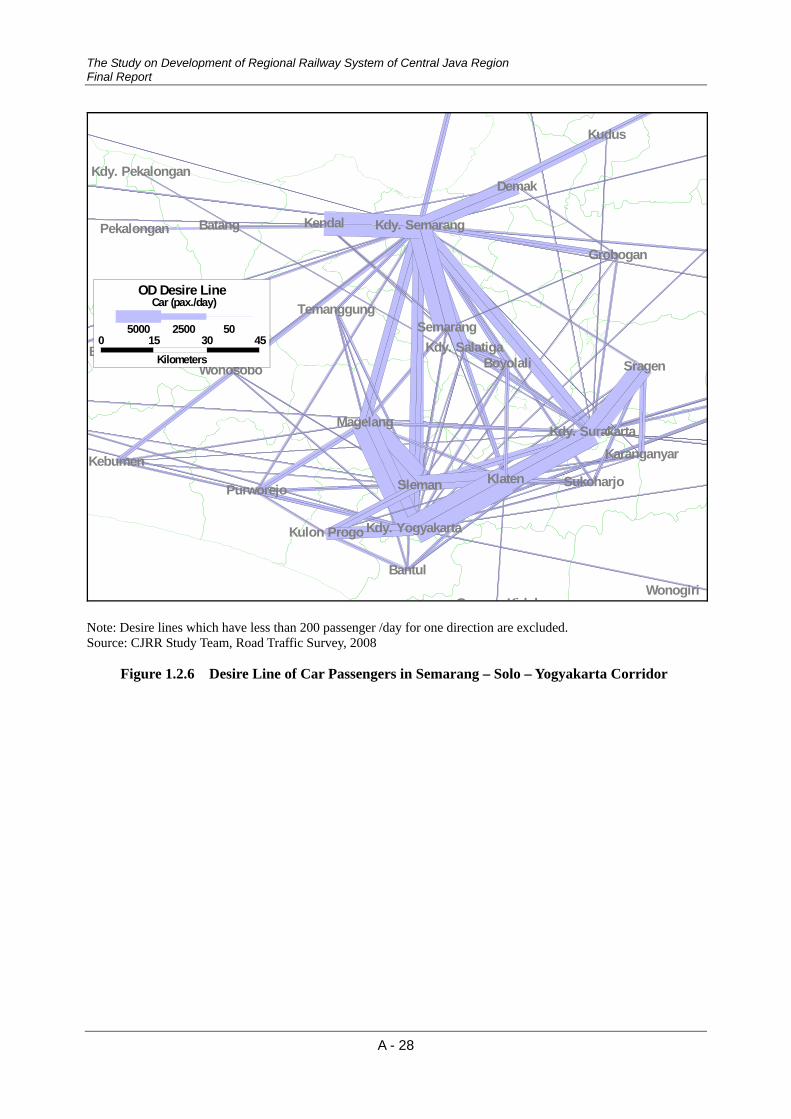
d. Desire Line by Kabupaten
Based on the road traffic survey conducted by the study team in 2008, desire line of car passengers in Semarang – Solo – Yogyakarta corridor is depicted in Source: CJRR Study Team, Road Traffic Survey, 2008
Figure 1.2.6. There is a number of car passenger trips such as Kota Yogyakarta – Klaten, Sleman – Magelang, Kota Surakarta – Kota Yogyakarta, Kota Yogyakarta – Magelang, Kota
Semarang – Kendal, Kota Semarang – Kabupaten Semarang. Middle distance trips, trips with
zonal distance is approximately 50 – 100 km, such as Kota Semarang – Kota Surakarta, Kota
Semarang – Kota Yogyakarta, Kota Semarang – Magelang are major traffic flow along the corridor.
The Study on Development of Regional Railway System of Central Java Region Final Report
A - 28
Kdy. Yogyakarta
Sleman
G Kid l
Bantul
Kulon Progo
Kdy. SurakartaMagelang
Kdy. Pekalongan
Kdy. Semarang
Kdy. Salatiga
Wonogiri
Pekalongan Batang Kendal
Wonosobo
TemanggungSemarang
Boyolali
Demak
Kudus
Grobogan
Sragen
Karanganyar
SukoharjoKlatenPurworejo
Kebumen
Banjarnegara
OD Desire Line
0 15 30 45Kilometers
Car (pax./day)
5000 2500 50
Note: Desire lines which have less than 200 passenger /day for one direction are excluded. Source: CJRR Study Team, Road Traffic Survey, 2008
Figure 1.2.6 Desire Line of Car Passengers in Semarang – Solo – Yogyakarta Corridor

Appendix 1 Transportation Surveys
A - 29
Based on the road traffic survey conducted by the study team in 2008, desire line of motorcycle
passengers in Semarang – Solo – Yogyakarta corridor is depicted in Figure 1.2.7. In contrast with car passengers, The number of the middle distance travel is relatively limited while trips to
adjacent kabupaten/kota such as Kota Semaran – Demak, Kota Semarang – Kendal, Kota
Semarang – Kabupaten Semaran, Kota Yogyakarta – Klaten, Sleman – Magelang, Kota Surakarta – Sragen is approximately twice or triple of car passengers.
It is not negligible that some passengers choose motor cycle as transportation mode for the
middle distance travel. For instance, the number of trips between Kota Semarang – Kota
Surakarta, Kota Semarang – Kota Yogyakarta, Kota Semarang – Magelang are more than 1,000
passengers per day while the number of passengers are smaller than cars.
Kdy. Yogyakarta
Sleman
G Kid l
Bantul
Kulon Progo
Kdy. SurakartaMagelang
Kdy. Pekalongan
Kdy. Semarang
Kdy. Salatiga
Wonogiri
Pekalongan Batang Kendal
Wonosobo
TemanggungSemarang
Boyolali
Demak
Kudus
Grobogan
Sragen
Karanganyar
SukoharjoKlatenPurworejo
Kebumen
Banjarnegara
OD Desire Line
0 15 30 45Kilometers
Motorcycle (pax/day)
15000 7500 27
Note: Desire lines which have less than 500 passenger /day for one direction are excluded. Source: CJRR Study Team, Road Traffic Survey, 2008
Figure 1.2.7 Desire Line of Motorcycle Passengers in Semarang – Solo – Yogyakarta Corridor

The Study on Development of Regional Railway System of Central Java Region Final Report
A - 30
4) Origin Destination Table Calibration and Analyses for Freight Transport
a. Sampling Ratios
Since traveling vehicles are forced to pull over and stop for the Roadside OD Interview Survey,
it is necessary to minimize the impact on traffic flow. The hourly sampling is shown as follows.
Table 1.2.7 Sampling Ratios of Road Side Interview Survey (Trucks)
[Unit: Number of vehicles / 14h]
From To RSI TC Sample R. RSI TC Sample R. RSI TC Sample R.R-1a Tugu Semarang Kendal 568 4,117 14% 152 949 16% 52 537 10%R-1b Tugu Kendal Semarang 639 4,778 13% 75 982 8% 57 695 8%R-2a Kaligawe Semarang Demak 827 3,030 27% 113 791 14% 127 659 19%R-2b Kaligawe Demak Semarang 657 3,046 22% 137 792 17% 73 676 11%R-3a Ungaran Semarang Bawen 677 3,777 18% 76 488 16% 32 232 14%R-3b Ungaran Bawen Semarang 474 5,334 9% 34 418 8% 22 275 8%R-4a Soropadan Semarang Magelang 598 1,427 42% 96 183 52% 23 49 47%R-4b Soropadan Magelang Semarang 551 1,424 39% 43 154 28% 41 51 80%R-5a Godong Semarang Purwodadi 682 1,378 49% 56 119 47% - 4 0%R-5b Godong Purwodadi Semarang 471 1,267 37% 30 82 37% 1 11 9%R-6a Kaliboto Magelang Purworejo 428 715 60% 66 100 66% 13 14 93%R-6b Kaliboto Purworejo Magelang 408 800 51% 14 44 32% 3 19 16%R-7a Dadirejo Wates Purworejo - 722 - - 135 - - 52 - R-7b Dadirejo Purworejo Wates - 671 - - 97 - - 57 - R-8a Sedayu Jogja Wates 404 1,317 31% 37 160 23% 11 59 19%R-8b Sedayu Wates Jogja 343 1,290 27% 29 110 26% 17 52 33%R-9a Tempel Magelang Sleman 559 1,803 31% 51 92 55% 17 54 31%R-9b Tempel Sleman Magelang 654 2,346 28% 23 103 22% 14 46 30%R-10a Prambanan Jogja Klaten - 2,076 - - 160 - - 110 - R-10b Prambanan Klaten Jogja - 2,340 - - 158 - - 108 - R-11a Tegal Gondo Kartosuro Klaten 816 2,605 31% 59 248 24% 37 94 39%R-11b Tegal Gondo Klaten Kartosuro 517 2,490 21% 70 236 30% 18 108 17%R-12a Ampel Semarang Solo 595 2,705 22% 37 233 16% 36 142 25%R-12b Ampel Solo Semarang 557 2,323 24% 67 309 22% 18 138 13%R-13a Geyer Sragen Purwodadi 343 822 42% 15 48 31% - - - R-13b Geyer Purwodadi Sragen 526 888 59% 14 47 30% - - - R-14a Masaran Sragen Karanganyar 783 2,410 32% 96 312 31% 78 123 63%R-14b Masaran Karanganyar Sragen 616 2,086 30% 106 312 34% 56 151 37%R-7-JTa Kulon Progo Wates Purworejo 140 313 45% 38 67 57% 13 25 52%R-7-JTb Kulon Progo Purworejo Wates 111 219 51% 37 53 70% 24 35 69%R-10-JTa Depok Jogja Klaten 260 384 68% 28 52 54% 16 30 53%R-10-JTb Depok Klaten Jogja 331 777 43% 48 114 42% 25 42 60%Note: RSI: The number of Roadside Interview Survey samples, TC: The number of vehicle counting survey result, Sample R.: Sampling Ratios
Code 2 Axles Truck Truck with More than 4 AxlesDirectionLocation 3 Axles Truck
Source: CJRR Study Team, Road Traffic Survey, 2008
b. Methodology
Methodology is almost as same as passenger vehicles (a car and a motorcycle) except the point
that final output for freight transportation is cargo weight OD tables instead of passenger OD
tables. Cargo weight of each truck was used to manipulate cargo weight OD table by
commodity types.
c. Weight Origin Destination Table and Desire Line by Analysis Zone
The following figure depicts the desire lines of commodity flow along Semarang – Solo – Yogyakarta corridor. East-West commodity flow, which connects west and east Java through
North Java Corridor (or Pantura), is the major traffic corridor within the region. Radial
commodity flows from / to Kota Semarang are also massive such as Kabupaten Semarang,
Magelang and Surakarta. Since the flow pattern varies by commodity type, the flow patterns

Appendix 1 Transportation Surveys
A - 31
by commodity type are discussed individually in the following subsection.
Kdy. Yogyakarta
Sleman
G Kid l
Bantul
Kulon Progo
Kdy. SurakartaMagelang
Kdy. Pekalongan
Kdy. Semarang
Kdy. Salatiga
Wonogiri
Pekalongan Batang Kendal
Wonosobo
TemanggungSemarang
Boyolali
Demak
Kudus
Grobogan
Sragen
Karanganyar
SukoharjoKlatenPurworejo
Kebumen
Banjarnegara
OD Desire Line
0 10 20 30
Kilometers
All Commodity (ton/day)
5000 2500 2
Source: CJRR Study Team, Road Traffic Survey, 2008
Figure 1.2.8 Desire Lines of Freight Transport in Semarang – Solo – Yogyakarta Corridor
d. Freight Traffic Weight Desire Line by Commodity Type
Cement
Based on the Road Traffic Survey conducted during the Study in 2008, daily flow of cement which departs, arrives and passes through Semarang – Solo – Yogyakarta corridor is depicted in
the following figure. Cement flows originate in cities such as Gresik, Tuban and Cirebon
where major cement plants are located, and are destined for major cities such as Jakarta,
Surabaya, Semarang and Solo.
While cement is a bulky cargo, it is transported by truck for long distances which exceed 500
km. Examples include Gresik – Jakarta, Tuban – Jakarta, Jakarta – Surabaya and Cilacap - Surabaya.

The Study on Development of Regional Railway System of Central Java Region Final Report
A - 32
Brebes
CiamisKdy. Surabaya
Kodya ProbolingKodya PasuruanSidoarjo
NganjukMagetan
NgawiBojonegoro
Tuban
Gresik
Bangkalan
JemLumajangMalang
Kodya MalangBlitarTrenggalek
PonorogoKediriKdy. Yogyakarta
Sleman
Gunung Kidul
Magelang
Kdy. TegalKdy. Semarang
Kdy. Salatiga
Kudus
Jepara
Pati Rembang
Blora
Kebumen
BanjarnegaraCilacap
Jakarta Utara
Jakarta BaratJakarta Timur
ang
Kdy. Bogor
Bandung
SubangPurwakarta
Sumedang Cirebon
Garut
Sukabumi
ebak
OD Desire Line
0 50 100 150
Kilometers
Cement (ton/day)
1000 500 250
Note: Only trips departing, arriving and passing through Semarang – Solo – Yogyakarta corridor was surveyed. Source: CJRR Study Team, Road Traffic Survey, 2008
Figure 1.2.9 Desire Lines of Cement in Semarang – Solo – Yogyakarta Corridor
Quartz Sand (Silica)
Since sand, important raw material for cement, is mined in the Central Java region, its transport
flow is within the region. The following figure depicts the flow of sand in Semarang – Solo –
Yogyakarta corridor. In contrast with steel and cement, vertical flow is massive such as
Magelang – Kota Semarang, Magelang – Kabupaten Semarang, Boyolali – Kota Semarang,
Klaten – Kota Surakarta. Transported sand from Magelang to Kabupaten Semarang exceeds
more than 2,000 tons / day.

Appendix 1 Transportation Surveys
A - 33
Kdy. Yogyakarta
Sleman
G Kid l
Bantul
Kulon Progo
Kdy. SurakartaMagelang
Kdy. Pekalongan
Kdy. Semarang
Kdy. Salatiga
Wonogiri
Pekalongan Batang Kendal
Wonosobo
TemanggungSemarang
Boyolali
Demak
Kudus
Grobogan
Sragen
Karanganyar
SukoharjoKlatenPurworejo
Kebumen
Banjarnegara
OD Desire Line
0 10 20 30
Kilometers
Sand (ton/day)
2500 1500 2
Source: CJRR, Road Traffic Survey, 2008
Figure 1.2.10 Desire Lines of Sand in Semarang – Solo – Yogyakarta Corridor

The Study on Development of Regional Railway System of Central Java Region Final Report
A - 34
Fuel
While major traffic flow of fuel originates in Yogyakarta, Semarang and Boyolali where fuel
depot / terminal of PT. Pertamina is located to adjacent Kabupaten, interregional flow was also
observed during road traffic survey including Tangelang – Surabaya and Cilacap – Tuban.
Kdy. Yogyakarta
Sleman
G Kid l
Bantul
Kulon Progo
Kdy. SurakartaMagelang
Kdy. Pekalongan
Kdy. Semarang
Kdy. Salatiga
Wonogiri
Pekalongan Batang Kendal
Wonosobo
TemanggungSemarang
Boyolali
Demak
Kudus
Grobogan
Sragen
Karanganyar
SukoharjoKlatenPurworejo
Kebumen
Banjarnegara
OD Desire Line
0 10 20 30
Kilometers
Fuel (ton/day)
500 250 125
Source: CJRR Study Team, Road Traffic Survey, 2008
Figure 1.2.11 Desire Lines of Fuel in Semarang – Solo – Yogyakarta Corridor

Appendix 1 Transportation Surveys
A - 35
(3) Bus Passenger OD Interview Survey
1) Survey Objective
To understand the traffic flow between cities and create an OD table of bus passenger for use as
basic data for forecasting traffic demand.
2) Survey Contents
a. Survey Location
Survey was conducted at 15 intercity bus terminals within the Case Study region of Yogyakarta
- Solo - Semarang and it’s surroundings. (See Figure 1.2.12 and Table 1.2.8)
Figure 1.2.12 Bus Passenger OD Interview Survey Locations
The Study on Development of Regional Railway System of Central Java Region Final Report
A - 36
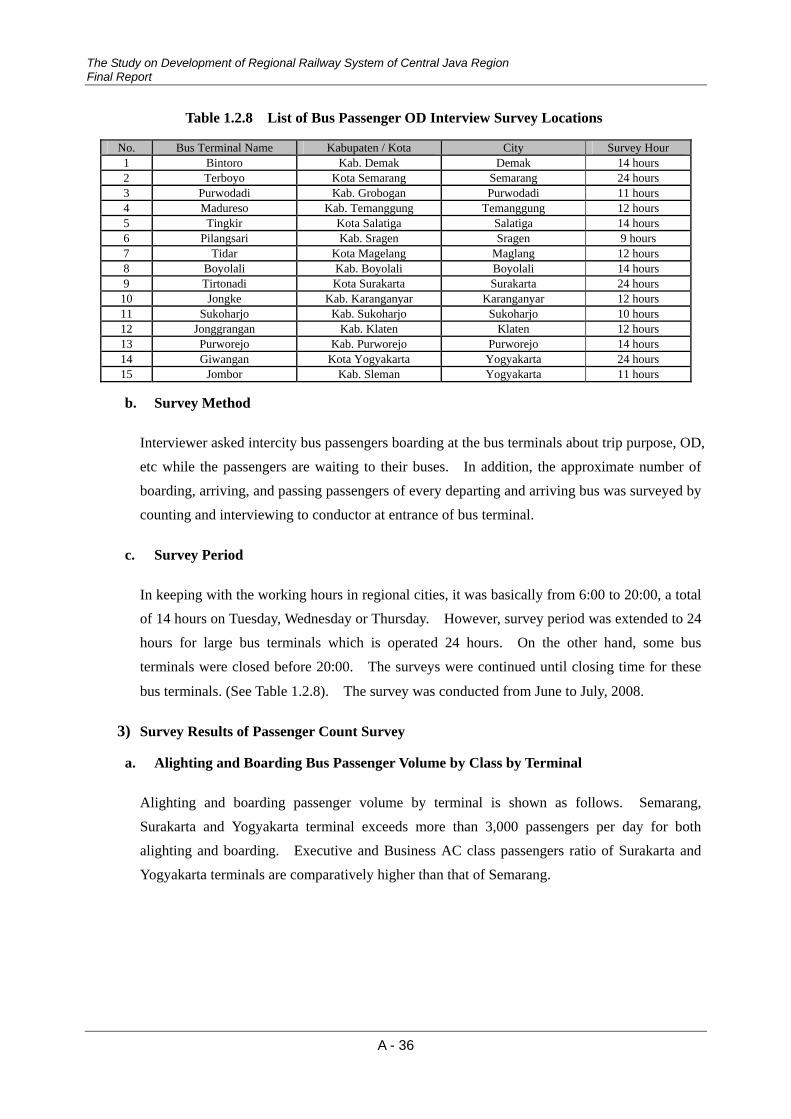
Table 1.2.8 List of Bus Passenger OD Interview Survey Locations
No. Bus Terminal Name Kabupaten / Kota City Survey Hour 1 Bintoro Kab. Demak Demak 14 hours 2 Terboyo Kota Semarang Semarang 24 hours 3 Purwodadi Kab. Grobogan Purwodadi 11 hours 4 Madureso Kab. Temanggung Temanggung 12 hours 5 Tingkir Kota Salatiga Salatiga 14 hours 6 Pilangsari Kab. Sragen Sragen 9 hours 7 Tidar Kota Magelang Maglang 12 hours 8 Boyolali Kab. Boyolali Boyolali 14 hours 9 Tirtonadi Kota Surakarta Surakarta 24 hours 10 Jongke Kab. Karanganyar Karanganyar 12 hours 11 Sukoharjo Kab. Sukoharjo Sukoharjo 10 hours 12 Jonggrangan Kab. Klaten Klaten 12 hours 13 Purworejo Kab. Purworejo Purworejo 14 hours 14 Giwangan Kota Yogyakarta Yogyakarta 24 hours 15 Jombor Kab. Sleman Yogyakarta 11 hours
b. Survey Method
Interviewer asked intercity bus passengers boarding at the bus terminals about trip purpose, OD,
etc while the passengers are waiting to their buses. In addition, the approximate number of
boarding, arriving, and passing passengers of every departing and arriving bus was surveyed by
counting and interviewing to conductor at entrance of bus terminal.
c. Survey Period
In keeping with the working hours in regional cities, it was basically from 6:00 to 20:00, a total of 14 hours on Tuesday, Wednesday or Thursday. However, survey period was extended to 24
hours for large bus terminals which is operated 24 hours. On the other hand, some bus
terminals were closed before 20:00. The surveys were continued until closing time for these
bus terminals. (See Table 1.2.8). The survey was conducted from June to July, 2008.
3) Survey Results of Passenger Count Survey
a. Alighting and Boarding Bus Passenger Volume by Class by Terminal
Alighting and boarding passenger volume by terminal is shown as follows. Semarang,
Surakarta and Yogyakarta terminal exceeds more than 3,000 passengers per day for both
alighting and boarding. Executive and Business AC class passengers ratio of Surakarta and
Yogyakarta terminals are comparatively higher than that of Semarang.

Appendix 1 Transportation Surveys
A - 37
- 1,000 2,000 3,000 4,000 5,000 6,000
01.Demak
02.Semarang
03.Purwodadi
04.Temanggung
05.Salatiga
06.Sragen
07.Maglang
08.Boyolali
09.Surakarta
10.Karanganyar
11.Sukoharjo
12.Klaten
13.Purworejo
14.Yogyakarta
15.Sleman
Executive Business AC Economy Unknown
(Pax) - 1,000 2,000 3,000 4,000 5,000
01.Demak
02.Semarang
03.Purwodadi
04.Temanggung
05.Salatiga
06.Sragen
07.Maglang
08.Boyolali
09.Surakarta
10.Karanganyar
11.Sukoharjo
12.Klaten
13.Purworejo
14.Yogyakarta
15.Sleman
Executive Business AC Economy Unknown
(Pax)
Source: CJRR Study Team, Road Traffic Survey, 2008
Figure 1.2.13 Bus Passenger Volume by Class by Terminal
(Right: Departure, Left: Arrival)
b. Hourly Bus Passenger Volume by Class by Terminal
Departure passenger volume is large from 2 PM to 4 PM while arrival passenger volume shows moderate peak from 8 AM to 3 PM at Semarang bus terminal. Hourly passenger volume
Surakarta bus terminal shows similar pattern. On the other hand, Yogyakarta bus terminal
shows moderate peak from 8 AM to 16 PM for both departing and arriving passengers.

The Study on Development of Regional Railway System of Central Java Region Final Report
A - 38
- 100 200 300 400 500 600 700
1
2
3
4
5
6
7
8
9
10
11
12
13
14
15
16
17
18
19
20
21
22
23
Executive Business AC Economy Unknown
(Time\Pax)- 100 200 300 400 500 600 700
1
2
3
4
5
6
7
8
9
10
11
12
13
14
15
16
17
18
19
20
21
22
23
Executive Business AC Economy
(Time\Pax)
Source: CJRR Study Team, Road Traffic Survey, 2008
Figure 1.2.14 Hourly Bus Passenger Volume by Class at Terboyo (Semarang) Bus Terminal
(Right: Departure, Left: Arrival)

Appendix 1 Transportation Surveys
A - 39
- 100 200 300 400 500 600 700
1
2
3
4
5
6
7
8
9
10
11
12
13
14
15
16
17
18
19
20
21
22
23
Executive Business AC Economy Unknown
(Time\Pax)- 100 200 300 400 500 600 700
1
2
3
4
5
6
7
8
9
10
11
12
13
14
15
16
17
18
19
20
21
22
23
Executive Business AC Economy Unknown
(Time\Pax)
Source: CJRR Study Team, Road Traffic Survey, 2008
Figure 1.2.15 Hourly Bus Passenger Volume by Class at Tirtonadi (Solo) Bus Terminal
(Right: Departure, Left: Arrival)

The Study on Development of Regional Railway System of Central Java Region Final Report
A - 40
- 100 200 300 400 500 600 700
1
2
3
4
5
6
7
8
9
10
11
12
13
14
15
16
17
18
19
20
21
22
23
Executive Business AC Economy
(Time\Pax)- 100 200 300 400 500 600 700
1
2
3
4
5
6
7
8
9
10
11
12
13
14
15
16
17
18
19
20
21
22
23
Executive Business AC Economy
(Time\Pax)
Source: CJRR Study Team, Road Traffic Survey, 2008
Figure 1.2.16 Hourly Bus Passenger Volume by Class at Giwangan (Yogyakarta) Bus Terminal
Right: Departure, Left: Arrival

Appendix 1 Transportation Surveys
A - 41
4) Descriptive Survey Results of Interview Survey
a. Access and Egress Transportation Mode by Bus Terminal
Access and egress transportation mode by bus terminals are shown below. Bus was the largest
share and motorcycle is the second largest share is motorcycle for most bus terminals.
6%
3%
3%
7%
15%
0%
5%
6%
5%
29%
17%
7%
1%
2%
5%
7%
9%
5%
13%
3%
6%
5%
1%
1%
5%
0%
1%
9%
1%
3%
3%
4%
62%
73%
61%
67%
53%
56%
83%
53%
64%
40%
42%
34%
70%
74%
61%
63%
0%
3%
0%
0%
1%
0%
0%
0%
2%
0%
0%
0%
1%
1%
1%
1%
1%
4%
1%
2%
5%
4%
3%
2%
6%
1%
12%
0%
5%
2%
7%
4%
21%
12%
21%
21%
19%
33%
6%
37%
18%
26%
25%
49%
21%
18%
22%
20%
1%
1%
0%
0%
1%
1%
1%
1%
0%
4%
3%
1%
1%
2%
0%
1%
0% 10% 20% 30% 40% 50% 60% 70% 80% 90% 100%
01.Demak(n=328)
02.Semarang(n=667)
03.Purwodadi(n=276)
04.Temanggung(n=221)
05.Salatiga(n=355)
06.Sragen(n=73)
07.Maglang(n=327)
08.Boyolali(n=193)
09.Surakarta(n=754)
10.Karanganyar(n=257)
11.Sukoharjo(n=264)
12.Klaten(n=223)
13.Purworejo(n=165)
14.Yogyakarta(n=702)
15.Sleman(n=223)
Total
Walking Becak, Ojek Bus Taxi, Bajaj Car Motorcycle Others
(n=5,028)
Source: CJRR Study Team, Road Traffic Survey, 2008
Figure 1.2.17 Access Mode to Bus Terminals
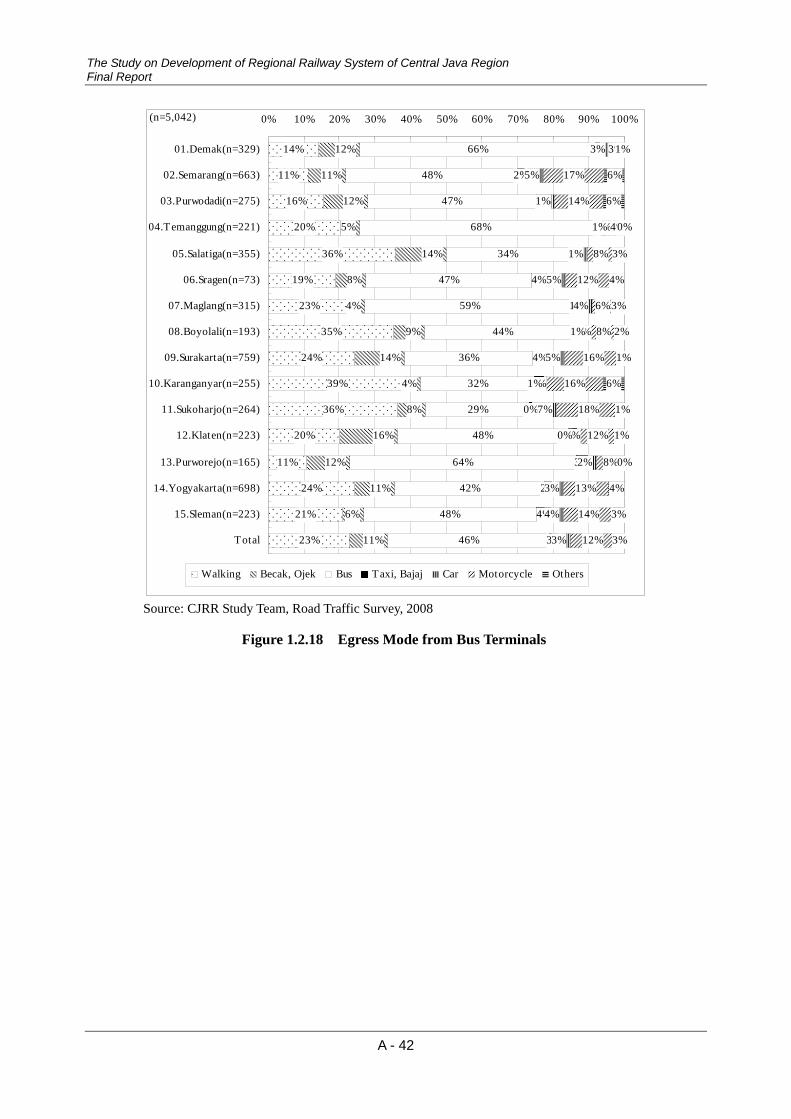
The Study on Development of Regional Railway System of Central Java Region Final Report
A - 42
14%
11%
16%
20%
36%
19%
23%
35%
24%
39%
36%
20%
11%
24%
21%
23%
12%
11%
12%
5%
14%
8%
4%
9%
14%
4%
8%
16%
12%
11%
6%
11%
66%
48%
47%
68%
34%
47%
59%
44%
36%
32%
29%
48%
64%
42%
48%
46%
1%
2%
4%
1%
4%
4%
1%
2%
4%
2%
0%
2%
3%
2%
4%
3%
3%
5%
1%
1%
1%
5%
4%
1%
5%
1%
7%
0%
2%
3%
4%
3%
3%
17%
14%
4%
8%
12%
6%
8%
16%
16%
18%
12%
8%
13%
14%
12%
1%
6%
6%
0%
3%
4%
3%
2%
1%
6%
1%
1%
0%
4%
3%
3%
0% 10% 20% 30% 40% 50% 60% 70% 80% 90% 100%
01.Demak(n=329)
02.Semarang(n=663)
03.Purwodadi(n=275)
04.Temanggung(n=221)
05.Salatiga(n=355)
06.Sragen(n=73)
07.Maglang(n=315)
08.Boyolali(n=193)
09.Surakarta(n=759)
10.Karanganyar(n=255)
11.Sukoharjo(n=264)
12.Klaten(n=223)
13.Purworejo(n=165)
14.Yogyakarta(n=698)
15.Sleman(n=223)
Total
Walking Becak, Ojek Bus Taxi, Bajaj Car Motorcycle Others
(n=5,042)
Source: CJRR Study Team, Road Traffic Survey, 2008
Figure 1.2.18 Egress Mode from Bus Terminals

Appendix 1 Transportation Surveys
A - 43
b. Bus Alighting Location
It is observed that some bus passenger boarding/alighting at roadside while all intercity bus
passengers are obliged to board/alight at bus terminals. Types of alighting locations by bus
terminals were shown below. Approximately half of bus passengers board from bus terminals
do not alight at bus terminals.
71%
55%
64%
65%
49%
45%
55%
35%
52%
47%
34%
42%
59%
44%
23%
50%
26%
31%
32%
34%
47%
55%
42%
65%
47%
53%
66%
58%
41%
53%
77%
46%
2%
15%
4%
1%
4%
0%
4%
0%
1%
0%
0%
0%
0%
3%
0%
3%
0% 10% 20% 30% 40% 50% 60% 70% 80% 90% 100%
01.Demak(n=329)
02.Semarang(n=669)
03.Purwodadi(n=276)
04.Temanggung(n=221)
05.Salatiga(n=355)
06.Sragen(n=73)
07.Maglang(n=332)
08.Boyolali(n=193)
09.Surakarta(n=760)
10.Karanganyar(n=257)
11.Sukoharjo(n=264)
12.Klaten(n=223)
13.Purworejo(n=165)
14.Yogyakarta(n=702)
15.Sleman(n=223)
Total
Terminal Roadside Unknown
(n=5,042)
Source: CJRR Study Team, Bus Passenger OD Interview Survey
Figure 1.2.19 Egress Mode from Bus Terminals

The Study on Development of Regional Railway System of Central Java Region Final Report
A - 44
c. Trip Purpose by Bus Terminal
Trip purpose by bus terminals are shown below. Trip purpose by bus terminals are shown
below. The share of “To work” is larger than other purposes.
31%
12%
31%
19%
40%
53%
22%
25%
18%
40%
43%
41%
28%
13%
26%
25%
16%
10%
14%
6%
7%
12%
20%
19%
19%
16%
17%
14%
8%
18%
17%
15%
14%
3%
3%
6%
5%
1%
3%
10%
2%
8%
6%
8%
12%
4%
15%
6%
4%
10%
5%
1%
5%
0%
2%
3%
4%
11%
17%
1%
0%
8%
4%
6%
10%
4%
2%
25%
7%
7%
9%
4%
5%
12%
3%
9%
13%
9%
12%
8%
2%
14%
3%
4%
3%
8%
11%
9%
15%
6%
3%
4%
10%
12%
7%
9%
22%
45%
41%
38%
32%
18%
25%
30%
37%
6%
11%
22%
30%
34%
20%
31%
2%
2%
0%
0%
0%
0%
8%
0%
0%
0%
0%
0%
0%
2%
0%
1%
0% 10% 20% 30% 40% 50% 60% 70% 80% 90% 100%
01.Demak(n=329)
02.Semarang(n=669)
03.Purwodadi(n=276)
04.Temanggung(n=221)
05.Salatiga(n=355)
06.Sragen(n=73)
07.Maglang(n=332)
08.Boyolali(n=193)
09.Surakarta(n=760)
10.Karanganyar(n=257)
11.Sukoharjo(n=264)
12.Klaten(n=223)
13.Purworejo(n=165)
14.Yogyakarta(n=702)
15.Sleman(n=223)
Total
To Work From Workplace To SchoolFrom School To Shopping, Travel From Shopping, TravelOthers Unknown
(n=5,042)
Source: CJRR Study Team, Road Traffic Survey, 2008
Figure 1.2.20 Trip Purpose by Bus Terminals

Appendix 1 Transportation Surveys
A - 45
d. Travel Time
Travel time by bus terminals are shown below. Since bus terminals serve for intercity and
inter-regency transport, approximately 80 % of passengers travel more than 1 hour.
0%
0%
1%
1%
4%
0%
1%
1%
1%
29%
11%
4%
0%
2%
4%
3%
9%
2%
3%
11%
21%
1%
5%
15%
5%
26%
20%
22%
1%
3%
11%
9%
24%
6%
4%
22%
9%
11%
10%
24%
7%
8%
17%
29%
7%
14%
20%
13%
18%
6%
15%
7%
14%
1%
11%
2%
4%
2%
14%
16%
8%
5%
5%
8%
22%
25%
31%
27%
11%
7%
22%
28%
18%
0%
14%
10%
19%
12%
9%
18%
6%
20%
9%
9%
3%
3%
14%
12%
11%
1%
4%
1%
16%
7%
17%
10%
5%
28%
8%
8%
2%
3%
8%
9%
25%
0%
2%
2%
22%
33%
11%
16%
11%
6%
22%
10%
29%
64%
10%
10%
22%
33%
13%
10%
24%
15%
9%
17%
0% 10% 20% 30% 40% 50% 60% 70% 80% 90% 100%
01.Demak(n=329)
02.Semarang(n=669)
03.Purwodadi(n=276)
04.Temanggung(n=221)
05.Salatiga(n=355)
06.Sragen(n=73)
07.Maglang(n=332)
08.Boyolali(n=193)
09.Surakarta(n=760)
10.Karanganyar(n=257)
11.Sukoharjo(n=264)
12.Klaten(n=223)
13.Purworejo(n=165)
14.Yogyakarta(n=702)
15.Sleman(n=223)
Total
-29 min. 30-60 min. 60-59 min. 90-119 min.2 hrs. 3 hrs. 4 - 8 hrs. 8- hrs.
(n=4,680)
Source: CJRR Study Team, Road Traffic Survey, 2008
Figure 1.2.21 Travel Time by Bus Terminals

The Study on Development of Regional Railway System of Central Java Region Final Report
A - 46
e. Transportation Cost
Travel cost by bus terminals are shown below. Since bus terminals serve for intercity and
inter-regency transport, approximately 64 % of passengers’ travel cost exceeds Rp. 100,000.
17%
5%
4%
5%
16%
1%
6%
13%
6%
53%
31%
23%
0%
5%
11%
12%
40%
15%
15%
34%
27%
11%
21%
29%
13%
8%
33%
45%
5%
19%
30%
22%
22%
37%
43%
34%
18%
10%
42%
35%
23%
3%
19%
15%
39%
19%
20%
26%
3%
15%
9%
11%
2%
4%
9%
8%
16%
1%
1%
1%
21%
9%
14%
9%
1%
11%
2%
1%
1%
0%
4%
3%
11%
0%
0%
0%
4%
8%
12%
5%
1%
6%
2%
1%
0%
1%
0%
1%
5%
0%
0%
0%
3%
14%
3%
4%
8%
7%
18%
10%
6%
27%
7%
7%
14%
30%
2%
4%
16%
20%
3%
12%
5%
1%
2%
3%
22%
25%
5%
3%
7%
3%
11%
7%
7%
3%
4%
6%
1%
0%
1%
0%
3%
21%
0%
1%
2%
1%
1%
0%
4%
2%
4%
2%
0% 10% 20% 30% 40% 50% 60% 70% 80% 90% 100%
01.Demak(n=329)
02.Semarang(n=669)
03.Purwodadi(n=276)
04.Temanggung(n=221)
05.Salatiga(n=355)
06.Sragen(n=73)
07.Maglang(n=332)
08.Boyolali(n=193)
09.Surakarta(n=760)
10.Karanganyar(n=257)
11.Sukoharjo(n=264)
12.Klaten(n=223)
13.Purworejo(n=165)
14.Yogyakarta(n=702)
15.Sleman(n=223)
Total
Rp. 4,999 Rp. 5-9 k Rp. 10-19 k Rp. 20-29 k Rp. 30-39 kRp. 40-49 k Rp. 50-99 k Rp. 100-199 k Rp. 200- k
(n=4,910)
Source: CJRR Study Team, Road Traffic Survey, 2008
Figure 1.2.22 Travel Cost by Bus Terminals

Appendix 1 Transportation Surveys
A - 47
f. Alternative Transport Mode
Alternative transportation mode of bus by class is shown below. For executive class, the share
of Plane and is comparatively larger than economy and business class.
12.4%
14.5%
6.2%
1.3%
0.5%
1.2%
0.9%
24.9%
20.4%
13.0%
37.8%
44.7%
63.1%
17.4%
18.3%
17.9%4.6% 0.9%
0% 10% 20% 30% 40% 50% 60% 70% 80% 90% 100%
Executive
Business AC
Economy
Railway Plane Taxi Car Motorcycle Other
Source: CJRR Study Team, Road Traffic Survey, 2008
Figure 1.2.23 Alternative Transportation Mode by Class
g. Reason for Bus Use
313 respondents answered their alternative transport mode is railway. Figure 1.2.24 shows their reasons for bus use. Regardless of class, most respondents answered that comfort is the
reason for bus use instead of railway. Other major reasons were speed, safety, price and
frequency, in that order. These passengers could potentially be railway users with
improvement of these factors.
115
82
69
64
60
30
10
9
0 20 40 60 80 100 120 140
Comfortable
Fast
Safe
Cheap
Frequency
Easy Access/Egress
Other
Discount Ticket
Reasons for Bus Use Compared with Railway (Total)
(n=313)
(Multiple answer allowed)
Source: CJRR Study Team, Road Traffic Survey, 2008
Figure 1.2.24 Reasons for Bus Use

The Study on Development of Regional Railway System of Central Java Region Final Report
A - 48
5) Origin Destination Table Calibration and Analyses
a. Sampling Ratios
Sampling ratios by bus terminal by direction is shown below. 9,142 valid interview samples
were surveyed and average sampling ration was 19.1%.
Table 1.2.9 Sampling Ratios by Bus Terminals
City Terminal DirectionNumber of Departure Passengers
No. of Valid
Samples
Sampling Ratios
01.Demak Bintoro West 895 197 22.0% 01.Demak Bintoro East 977 85 8.7% 01.Demak Bintoro Unknown 82 8 01.Demak Bintoro Total 1,954 290 14.8% 02.Semarang Terboyo West 426 77 18.1% 02.Semarang Terboyo South 1,385 177 12.8% 02.Semarang Terboyo East 2,708 290 10.7% 02.Semarang Terboyo Unknown 18 97 02.Semarang Terboyo Total 4,537 641 14.1% 03.Purwodadi Purwodadi West 821 62 7.6% 03.Purwodadi Purwodadi East 282 125 44.3% 03.Purwodadi Purwodadi South 246 48 19.5% 03.Purwodadi Purwodadi Unknown 18 12 03.Purwodadi Purwodadi Total 1,367 247 18.1% 04.Temanggung Madureso North 91 47 51.6% 04.Temanggung Madureso Southeast 203 163 80.3% 04.Temanggung Madureso Unknown - 1 04.Temanggung Madureso Total 294 211 71.8% 05.Salatiga Tingkir North 868 304 35.0% 05.Salatiga Tingkir Unknown 1 05.Salatiga Tingkir Total 869 304 35.0% 06.Sragen Pilangsari West 216 63 29.2% 06.Sragen Pilangsari East 11 4 36.4% 06.Sragen Pilangsari Unknown - 3 06.Sragen Pilangsari Total 227 70 30.8% 07.Maglang Tidar South 881 148 16.8% 07.Maglang Tidar North 975 116 11.9% 07.Maglang Tidar Unknown 4 16 07.Maglang Tidar Total 1,860 280 15.1% 08.Boyolali Boyolali Southeast 410 85 20.7% 08.Boyolali Boyolali North 420 93 22.1% 08.Boyolali Boyolali Unknown - 13 08.Boyolali Boyolali Total 830 191 23.0% 09.Surakarta Tirtonadi North 181 48 26.5% 09.Surakarta Tirtonadi West 1,441 247 17.1% 09.Surakarta Tirtonadi South 391 59 15.1% 09.Surakarta Tirtonadi East 1,004 222 22.1% 09.Surakarta Tirtonadi Southwest 1,106 90 8.1% 09.Surakarta Tirtonadi Unknown 424 54 09.Surakarta Tirtonadi Total 4,547 720 15.8% 10.Karanganyar Jongke West 640 168 26.3% 10.Karanganyar Jongke Unknown - 10.Karanganyar Jongke Total 640 168 26.3% 11.Sukoharjo Sukoharjo South 258 142 55.0% 11.Sukoharjo Sukoharjo North 114 58 50.9% 11.Sukoharjo Sukoharjo Unknown 6 18 11.Sukoharjo Sukoharjo Total 378 218 57.7% 12.Klaten Jongrangan West 454 89 19.6%

Appendix 1 Transportation Surveys
A - 49
12.Klaten Jongrangan East 370 117 31.6% 12.Klaten Jongrangan Unknown 7 1 12.Klaten Jongrangan Total 831 207 24.9% 13.Purworejo Purworejo West 192 59 30.7% 13.Purworejo Purworejo East 239 92 38.5% 13.Purworejo Purworejo Unknown - 7 13.Purworejo Purworejo Total 431 158 36.7% 14.Yogyakarta Giwangan West 654 171 26.1% 14.Yogyakarta Giwangan South 469 104 22.2% 14.Yogyakarta Giwangan East 1,472 176 12.0% 14.Yogyakarta Giwangan North 1,038 182 17.5% 14.Yogyakarta Giwangan Unknown 7 25 14.Yogyakarta Giwangan Total 3,640 658 18.1% 15.Sleman Jombor South 287 102 35.5% 15.Sleman Jombor North 1,222 91 7.4% 15.Sleman Jombor Unknown 1 14 15.Sleman Jombor Total 1,510 207 13.7% Total 47,830 9.140 19.1%
Source: CJRR Study Team, Road Traffic Survey, 2008
b. Methodology
Origin and destination table of bus users in the Central Java region was calibrated by bus passenger count survey and bus OD interview survey results. Expansion factor by train by
survey station were calculated by dividing boarding passengers of the bus by the number of OD
survey respondents. Since the passengers who will alight at non-surveyed terminals can
represent boarding passengers at non-surveyed terminals, these samples with opposite OD were
added for OD table. The number of passenger of survey locations which surveyed less than
24 hours, expansion factors for 24 hours are multiplied.
Table 1.2.10 Expansion Factors for 24 Hours
Survey Hours Expansion
Factors
9 1.892
10 1.625
11 1.415
12 1.289
13 1.241
14 1.205
24 1.000 Source: CJRR Study Team, Estimates based on Road Traffic Survey, 2008
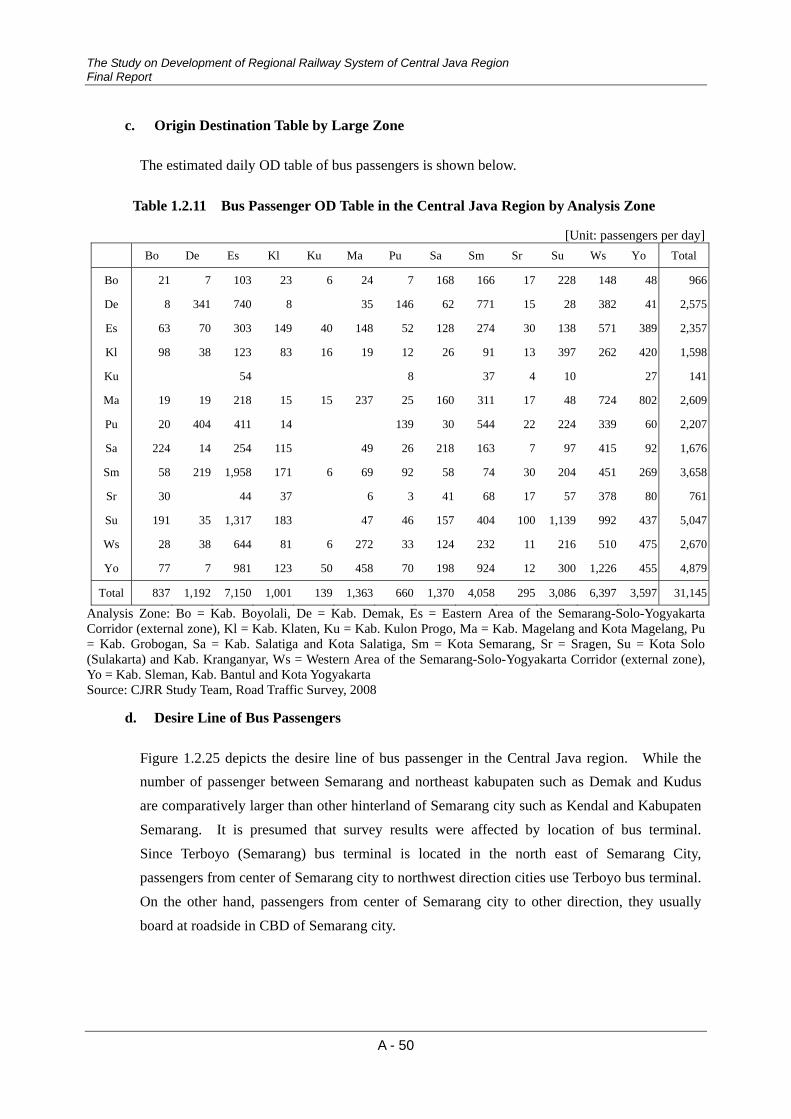
The Study on Development of Regional Railway System of Central Java Region Final Report
A - 50
c. Origin Destination Table by Large Zone
The estimated daily OD table of bus passengers is shown below.
Table 1.2.11 Bus Passenger OD Table in the Central Java Region by Analysis Zone
[Unit: passengers per day] Bo De Es Kl Ku Ma Pu Sa Sm Sr Su Ws Yo Total
Bo 21 7 103 23 6 24 7 168 166 17 228 148 48 966
De 8 341 740 8 35 146 62 771 15 28 382 41 2,575
Es 63 70 303 149 40 148 52 128 274 30 138 571 389 2,357
Kl 98 38 123 83 16 19 12 26 91 13 397 262 420 1,598
Ku 54 8 37 4 10 27 141
Ma 19 19 218 15 15 237 25 160 311 17 48 724 802 2,609
Pu 20 404 411 14 139 30 544 22 224 339 60 2,207
Sa 224 14 254 115 49 26 218 163 7 97 415 92 1,676
Sm 58 219 1,958 171 6 69 92 58 74 30 204 451 269 3,658
Sr 30 44 37 6 3 41 68 17 57 378 80 761
Su 191 35 1,317 183 47 46 157 404 100 1,139 992 437 5,047
Ws 28 38 644 81 6 272 33 124 232 11 216 510 475 2,670
Yo 77 7 981 123 50 458 70 198 924 12 300 1,226 455 4,879
Total 837 1,192 7,150 1,001 139 1,363 660 1,370 4,058 295 3,086 6,397 3,597 31,145
Analysis Zone: Bo = Kab. Boyolali, De = Kab. Demak, Es = Eastern Area of the Semarang-Solo-Yogyakarta Corridor (external zone), Kl = Kab. Klaten, Ku = Kab. Kulon Progo, Ma = Kab. Magelang and Kota Magelang, Pu = Kab. Grobogan, Sa = Kab. Salatiga and Kota Salatiga, Sm = Kota Semarang, Sr = Sragen, Su = Kota Solo (Sulakarta) and Kab. Kranganyar, Ws = Western Area of the Semarang-Solo-Yogyakarta Corridor (external zone), Yo = Kab. Sleman, Kab. Bantul and Kota Yogyakarta Source: CJRR Study Team, Road Traffic Survey, 2008
d. Desire Line of Bus Passengers
Figure 1.2.25 depicts the desire line of bus passenger in the Central Java region. While the number of passenger between Semarang and northeast kabupaten such as Demak and Kudus
are comparatively larger than other hinterland of Semarang city such as Kendal and Kabupaten
Semarang. It is presumed that survey results were affected by location of bus terminal.
Since Terboyo (Semarang) bus terminal is located in the north east of Semarang City, passengers from center of Semarang city to northwest direction cities use Terboyo bus terminal.
On the other hand, passengers from center of Semarang city to other direction, they usually
board at roadside in CBD of Semarang city.

Appendix 1 Transportation Surveys
A - 51
Kdy. Yogyakarta
Sleman
G Kid l
Bantul
Kulon Progo
Kdy. SurakartaMagelang
Kdy. Pekalongan
Kdy. Semarang
Kdy. Salatiga
Wonogiri
Pekalongan Batang Kendal
Wonosobo
TemanggungSemarang
Boyolali
Demak
Kudus
Grobogan
Sragen
Karanganyar
SukoharjoKlatenPurworejo
Kebumen
Banjarnegara
OD Desire Line
0 15 30 45Kilometers
Bus (Pax./day)
750 300 3
Note: Desire lines which have less than ??? passenger /day for one direction are excluded. Source: CJRR Study Team, Road Traffic Survey, 2008
Figure 1.2.25 Desire Line of Bus Passengers in Semarang – Solo – Yogyakarta Corridor
1.3 Travel Speed Survey
1) Survey Objective
In order to compare the travel time for automobiles and buses with that of trains, the variation
in automobile travel time is analyzed to obtain its competitiveness in relation to trains.
Furthermore, congestion bottlenecks and its causes were also investigated.
2) Survey Contents
a. Survey Routes
Survey the 7 main trunk road routes in the Yogyakarta - Solo - Semarang sector that are
believed to be in competition with the railways. (See Figure 1.3.1) Each route was divided into sections by city, intersection of arterial road, border of kabupaten/kota, large river and other
geographical features.

The Study on Development of Regional Railway System of Central Java Region Final Report
A - 52
Figure 1.3.1 Route covered by Travel Speed Survey
b. Survey Method
A survey vehicle equipped with a GPS (Global Positioning System) device, which could transmit positional data at every 30 seconds via GPRS (General Packet Radio Service) were utilized and travel speed were calculated. A set of devices were installed on the survey vehicle (See Source: CJRR Study Team, Travel Speed Survey, 2008
Figure 1.3.2).
c. Survey Period and Duration
Travel speed data of two directions 3 times a day (morning, lunch, evening) at each route were surveyed. The survey was conducted on weekday of Tuesday, Wednesday and Thursday, 3rd -
5th and 18th in June.
(1)
(2)
(3)
(4)
(5)
(6)
(7)

Appendix 1 Transportation Surveys
A - 53
Source: CJRR Study Team, Travel Speed Survey, 2008
Figure 1.3.2 GPS device for Travel Speed Survey
3) Survey Results
Travel Speed Survey results are shown below. Each route is divided by several sections and colored by travel speed categories.

The Study on Development of Regional Railway System of Central Java Region Final Report
A - 54
a. Semarang - Purwodadi
Source: CJRR Study Team, Travel Speed Survey, 2008
Figure 1.3.3 Travel Speed of Semarang – Purwodadi Route
Semarang - Purwodadi Purwodadi - Semarang Morning
Noon
Evening

Appendix 1 Transportation Surveys
A - 55
b. Solo – Purwodadi
Source: CJRR Study Team, Travel Speed Survey, 2008
Figure 1.3.4 Travel Speed of Semarang – Purwodadi Route
Solo - Purwodadi Purwodadi - Solo Morning
Noon
Evening

The Study on Development of Regional Railway System of Central Java Region Final Report
A - 56
c. Semarang - Magelang
Source: CJRR Study Team, Travel Speed Survey, 2008
Figure 1.3.5 Travel Speed of Semarang – Magelang Route
Semarang - Magelang Magelang - Semarang Morning
Noon
Evening

Appendix 1 Transportation Surveys
A - 57
d. Solo - Salatiga
Source: CJRR Study Team, Travel Speed Survey, 2008
Figure 1.3.6 Travel Speed of Solo – Salatiga Route
Solo - Salatiga Salatiga - Solo Morning
Noon
Evening

The Study on Development of Regional Railway System of Central Java Region Final Report
A - 58
e. Yogyakarta – Solo
Source: CJRR Study Team, Travel Speed Survey, 2008
Figure 1.3.7 Travel Speed of Yogyakarta – Solo Route
Yogyakarta - Solo Solo - Yogyakarta Morning
Noon
Evening

Appendix 1 Transportation Surveys
A - 59
f. Yogyakarta - Magelang
Source: CJRR Study Team, Travel Speed Survey, 2008
Figure 1.3.8 Travel Speed of Yogyakarta – Magelang Route
Yogyakarta - Magelang Magelang - Yogyakarta Morning
Noon
Evening

The Study on Development of Regional Railway System of Central Java Region Final Report
A - 60
g. Yogyakarta Purworejo
Source: CJRR Study Team, Travel Speed Survey, 2008
Figure 1.3.9 Travel Speed of Yogyakarta – Purworejo Route
Yogyakarta - Purworejo Purworejo - Yogyakarta Morning
Noon
Evening

Appendix 1 Transportation Surveys
A - 61
1.4 Stated Preference Survey
1) Survey Objective
This survey was aimed at investigating the characteristics of travel taken by the community within the scope of commuter train service plan. The travel characteristics include travel origin
and destination, transportation mode being used, departure time, travel time, and travel
frequency. In addition, the survey was aimed at investigating the responses of the community
regarding the plan of commuter train passing through their living area and looking at their
desire to use the transportation service. From the survey, it is expected that the enthusiasm of
the community to use commuter train can be investigated and the ability of the community to use the commuter train can be assessed.
2) Survey Method
In the survey, surveyor interviewed communities living in the scope of the commuter train area.
Surveyor came to the residents’ houses, door to door, located in plan area of commuter train. In
order to get reliable data, surveyor prioritized residents living near the station.
Firstly, the surveyor asked personal and family data of the respondent. During this interview, the surveyor recorded the travel characteristics of the respondent. Subsequently, surveyor
explained the plan of commuter train, including the concept and service plan. After the
information the surveyor gave was seemed sufficient, the surveyor asked for respondent’s
response to the presence of commuter train.
3) Survey Location and Samples
The survey was conducted in Central Java region, which had high potential of travel demand for commuter train. In Central Java, furthermore, there are three cities of business centers and
play as the center of economical activity and study. The cities are Semarang, Surakarta and
Yogyakarta. The scope of this commuter train investigated in this survey included the three
regions and their buffer areas, including Wates, Yogyakarta, Klaten, Solo, Sragen, Semarang,
Purwodadi, Demak, and Kendal. Furthermore, the survey area was divided into several zones,
i.e. Wates – Yogyakarta segment, Yogyakarta – Klaten segment, Adi Sucipto Yogyakarta Airport, Klaten – Solo segment, Solo-Sragen segment, Semarang – Brumbung segment,
Semarang – Kendal segment and Semarang – Demak segment. The sample of the survey
included citizens living around the corridors potential to use train. The detail of survey location
and number of sample is presented in the following table.

The Study on Development of Regional Railway System of Central Java Region Final Report
A - 62
Table 1.4.1 Survey Location and Number of Sample
No Survey Location Number of Sample 1. Wates – Yogyakarta Segment 300 2. Yogyakarta – Klaten Segment 300 3. Adi Sucipto Yogyakarta Airport 200 4. Klaten – Solo Segment 300 5. Solo – Sragen Segment 301 6. Semarang – Brumbung Segment 300 7. Semarang – Kendal Segment 302 8. Semarang – Demak Segment 293 Total 2,296
4) Survey Time Period
This survey was conducted in 25 August 2008 – 2 September 2008.
5) Summary of Questions
The following is the list of survey questions.
Table 1.4.2 List of Survey Questions
ID Group Group of Question Detail Information 1 Vehicle ownership 2 Income (Rupiahs) 3 Number of Family Member 4 Number of Adult Family Member 5 Number of Adult & Working Family Member
A Information of Household
6 Time needed to go to train station by walk 1 Gender 2 Social Status 3 Driving License 4 Car Availability
B Information of Personal Data
5 Motorcycle Availability 1 Trip Purpose 2 Departure time 3 Total Travel Time 4 Transportation Mode 5 Travel Type 6 Weekly Travel Intensity 7 Monthly Travel Intensity 8 Public Transport Cost 9 Taxi Cost 10 Car Operation Cost (Monthly)
C Travel Detail
11 Motorcycle Operation Cost (Monthly) 1 Tariff of Rp 2,500 2 Tariff of Rp 5,000 3 Tariff of Rp 7,500 4 Tariff of Rp 10,000
D Willingness & Ability to pay
5 Reason of Not Using Train Service Source: CJRR Study Team, Stated Preference Survey, 2008
6) Result of Survey
In the implementation of the survey, there are several problems encountered. The largest
problem is on the process of data input. The followings are problems found in the preparation

Appendix 1 Transportation Surveys
A - 63
and implementation of the survey.
The first problem is related to bureaucracy. It takes too long time to issue the license to enter the passenger waiting room in Adisutjipto airport (until one week), while it takes only three days to complete the survey.
The second problem is the difficulty to meet respondents, particularly for those living in elite settlement area, because most of them have no time to be interviewed. Consequently, the survey was conducted at night in order to increase the possibility to meet the appropriate respondents.
The greatest problem is found during the data inputting process, in which most respondents have no sufficient information regarding names of village or sub-district of their travel destination. Information which can be acquired includes names of street or landmark of the areas. Therefore, the data input person needs to trace the location in accordance to additional information from the complete regional map. It surely takes much time.
A. Household Information
A.1) Vehicle ownership
In accordance to the data on motor vehicle ownership, majority of respondents owned motorcycle, consisted of 804, 922 and 147 respondents owning 2 motorcycles, 1 motorcycle
and more than 2 motorcycles, respectively. Furthermore, respondents who owned car amount
for 370 respondents, consisted of 358 respondents owning one car and 12 respondents owning
two cars for each respondent. The detail of number of respondents by vehicle ownership is
presented in figure 1.
Vehicle ownership
358
12
922
804
133
140
100200300400500600700800900
1000
1 Car 2 Cars 1 motorcycle 2 motorcycles 3 motorcycles 4< motorcycles
Freq
uenc
ies
Source: CJRR Study Team, Stated Preference Survey, 2008
Figure 1.4.1 Number of Respondents by Vehicle Ownership

The Study on Development of Regional Railway System of Central Java Region Final Report
A - 64
A.2) Income
The result of the survey data shows that 50% respondents have income rate between 1 and 4
million rupiah per month. Respondents who have income rate less than 1 million per month
amount for 46% of all respondents. Furthermore, respondents who have income rate more than
4 million per month amount for 4%. The detail of number of respondents by income is presented in figure 2.
Less than 1 Million
45%1 - 4 Million50%
More than 4 Million
5%
INCOME (Rupiahs)
Less than 1 Million
1 - 4 Million
More than 4 Million
Source: CJRR Study Team, Stated Preference Survey, 2008
Figure 1.4.2 Number of Respondents by Income
A.3) Number of Family Member
The result of the survey showed that 1304 respondents have family member of less than 4
persons while 661 respondents have family member between 4 and 6 persons. Furthermore,
respondents who have family member between 6 and 8 persons and more than 8 persons
amount for 88 and 29 respondents, respectively. The detail of number of respondents by number of family member is presented in figure 3.
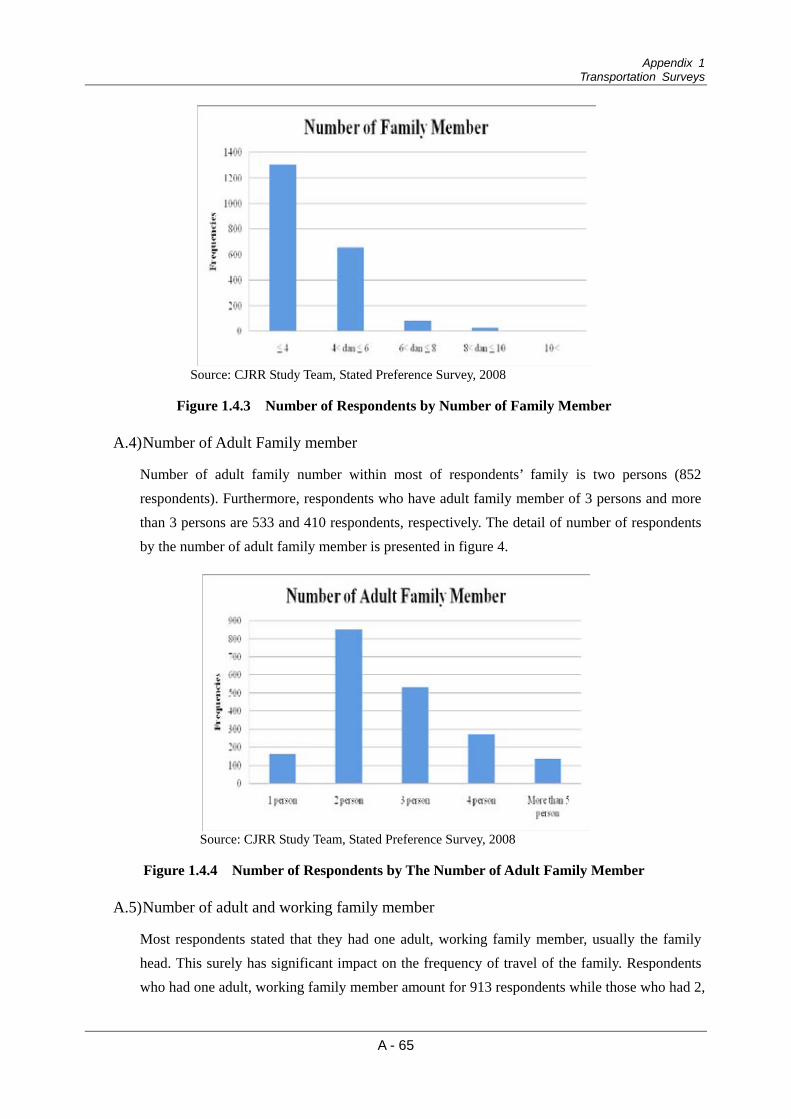
Appendix 1 Transportation Surveys
A - 65
Source: CJRR Study Team, Stated Preference Survey, 2008
Figure 1.4.3 Number of Respondents by Number of Family Member
A.4) Number of Adult Family member
Number of adult family number within most of respondents’ family is two persons (852
respondents). Furthermore, respondents who have adult family member of 3 persons and more
than 3 persons are 533 and 410 respondents, respectively. The detail of number of respondents
by the number of adult family member is presented in figure 4.
Source: CJRR Study Team, Stated Preference Survey, 2008
Figure 1.4.4 Number of Respondents by The Number of Adult Family Member
A.5) Number of adult and working family member
Most respondents stated that they had one adult, working family member, usually the family
head. This surely has significant impact on the frequency of travel of the family. Respondents who had one adult, working family member amount for 913 respondents while those who had 2,

The Study on Development of Regional Railway System of Central Java Region Final Report
A - 66
3 or more and no adult, working family member amount for 654, 259 and 196 respondents. The
more the number of working family number is, the greater the number of travel demand. The
detail of number of respondents by the number of adult, working family member is presented in
figure 5.
Source: CJRR Study Team, Stated Preference Survey, 2008
Figure 1.4.5 Number of Respondents by The Number of Adult, Working Family Member
A.6) Time needed to go to train station by walk
Most of respondents, 612 respondents, stated that they needed 10 to 20 minutes to arrive at the
station by foot. Furthermore, respondents who needed less than 5 minutes, 5 to 10 minutes and
more than 20 minutes to arrive at the station by foot amounted for 433, 488 and 585
respondents. The detail of number of respondents by time need to go to train station by walk is presented in figure 6.
Source: CJRR Study Team, Stated Preference Survey, 2008
Figure 1.4.6 Number of Respondents by Time Need to Go to Train Station by Walk

Appendix 1 Transportation Surveys
A - 67
B. Personal Information
B.1) Gender
The sample of this survey consisted of 1286 males (62%) and 791 females (38%).
Male62%
Female38%
Gender
Male
Female
Source: CJRR Study Team, Stated Preference Survey, 2008
Figure 1.4.7 Percentage Of Respondents By Gender
B.2) Social status
Regarding the social status, respondents of the survey were permanent employee, non
permanent employee, housewife, students, unemployment, retired and others. The percentage
of respondents by social status is presented in the following figure.
Source: CJRR Study Team, Stated Preference Survey, 2008
Figure 1.4.8 Percentage Of Respondents By Social Status

The Study on Development of Regional Railway System of Central Java Region Final Report
A - 68
B.3) Driving Licenses
As for driver’s license, about 2% of respondents only hold car license, about 58% of
respondents only hold motorcycle license, 10% of respondents hold both licenses, and 30% of
respondents do not have a driver’s license. The detail of number of respondents by possession
of driving license is presented in figure 9.
Source: CJRR Study Team, Stated Preference Survey, 2008
Figure 1.4.9 Number Of Respondents By Possession Of Driving License
B.4) Car Availability
In terms of car availability, 77% respondents said that they had no car available. Only did 13%
respondents say that they had car available and 10% respondents say that they sometimes had
car available.
Source: CJRR Study Team, Stated Preference Survey, 2008
Figure 1.4.10 Percentage Of Respondents Which Have Car Availability

Appendix 1 Transportation Surveys
A - 69
B.5) Motorcycle Availability
For motorcycle availability, 57% respondents said that they had motorcycle available.
Furthermore, 27% respondents said that they sometimes had motorcycle available and 15%
respondents said that they had no motorcycle available.
Source: CJRR Study Team, Stated Preference Survey, 2008
Figure 1.4.11 Percentage Of Respondents Which Have Motorcycle Availability
C. Detail of Respondents’ Trip
C.1) Trip Purpose
Most respondents stated that they traveled for work (761 respondents or 37%). Other trip
purposes included study, shopping, personal affair, pick up/leads and recreation. The detailed number of respondents by trip purposes is presented in figure 12.
Source: CJRR Study Team, Stated Preference Survey, 2008
Figure 1.4.12 Percentage Of Respondents By Trip Purpose

The Study on Development of Regional Railway System of Central Java Region Final Report
A - 70
C.2) Departure time
Most respondents who traveled for work and school usually leave between 6.00 and 7.00 am.
Furthermore, the numbers of respondents who traveled for work and school on the time span
were 364 and 133 respondents, respectively.
Respondents who traveled for purpose other than work and school tended to have various departure time characteristics. Respondents traveling between 7.00 and 8.00 am amounted for
209 respondents and those traveling between 6.00 and 7.00 amounted for 199 respondents.
Other favorable departure time was between 2.00 and 3.00 pm (45 respondents). The detail of
number of respondents by departure time is presented in figure 13.
Source: CJRR Study Team, Stated Preference Survey, 2008
Figure 1.4.13 Number Of Respondents By Departure Time
C.3) Total Travel Time
For respondents traveling for work, most of them (230 respondents) usually need 10 to 20
minutes to arrive at their workplace. For those traveling for school (90 respondents), it usually
takes 10 to 20 minutes to arrive at school or university. For other trip purposes, it usually takes
10 to 30 minutes from the origin to the destination which can be further categorized into two
time spans, i.e. 10 to 20 minutes (304 respondents) and 20 to 30 minutes (307 respondents).
The detail of number of respondents by total travel time is presented in figure 14.

Appendix 1 Transportation Surveys
A - 71
120
230197
35 6682
2321
9058
10 16 248
124
304 307
31
75 11760
050
100150200250300350
less than 10 minutes
10 ‐ 20 minutes 20 ‐ 30 minutes 30 ‐ 40 minutes 40 ‐ 50 minutes 50 ‐ 60 minutes more than 60 minutes
Frequencies
Total Travel Time
Working School other purposes
Source: CJRR Study Team, Stated Preference Survey, 2008
Figure 1.4.14 Number Of Respondents By Total Travel Time
C.4) Transportation Mode
In conducting travel, respondents traveling for work used several transportation modes. Most of
them used motorcycle (53%) and other respondents got a ride on motorcycle (7%). Other
respondents used private car (14%), got ride on car (3%), inter-city bus (7%), city bus (6%) and
trains (2%). The detail of number of respondents (traveling for work) by transportation mode is
presented in figure 15.
Source: CJRR Study Team, Stated Preference Survey, 2008
Figure 1.4.15 Number Of Respondents (Traveling For Work) By Transportation Mode
For respondents traveling for school, most respondents (53%) rode motorcycle and 15%
respondents got ride. For public transportation mode, inter-city bus and city bus are the most
common transportation mode. The detail of number of respondent traveling for school by
transportation mode is presented in figure 16.

The Study on Development of Regional Railway System of Central Java Region Final Report
A - 72
Source: CJRR Study Team, Stated Preference Survey, 2008
Figure 1.4.16 Number Of Respondent Traveling For School By Transportation Mode
For respondents traveling for purpose other than work and school, most of them used
motorcycle, amounting for 41%, and 18% respondents got a ride. For public transportation mode, respondents using inter-city bus and city bus amounted for 7% and 10%, respectively.
The detail of number of respondents traveling for purpose other than work and school by
transportation mode is presented in figure 17.
Source: CJRR Study Team, Stated Preference Survey, 2008
Figure 1.4.17 Number Of Respondents Traveling For Purpose Other Than Work And School By Transportation Mode
C.5) Travel Type
Most respondents stated that they conducted daily travel. Respondents conducting daily travel
for work purpose amounted for 603 respondents. In addition, respondents conducting travel for

Appendix 1 Transportation Surveys
A - 73
school commonly preferred daily travel, amounting for 164 respondents. Meanwhile,
respondents traveling for purposes other than work and school commonly preferred weekly
travel, amounting for 400 respondents. The detail of number of respondents by travel type is
presented in the following figure.
603
92
48
164
28
30
209
400
386
0 200 400 600 800 1000 1200
Daily
Weekly
MonthlyTravel Type
Working School Other Purposes
Source: CJRR Study Team, Stated Preference Survey, 2008
Figure 1.4.18 Number Of Respondents By Travel Type
C.6) Weekly Travel Intensity
Respondents who frequently conduct weekly travel are those traveling for purposes other than
work and school. As an comparison, for respondents traveling once a week, those traveling for school and work amount for 3 and 17 respondents, respectively, while those traveling for
purpose other than school and work amount for 124 respondents. Another comparison, for
respondents traveling twice a week, those traveling for school and work amount for 2 and 17
respondents, respectively, while those traveling for purpose other than school and work amount
for 124 respondents.
For three-time-a-week travel intensity, there are 31, 2 and 98 respondents stating that they travel for work, school and other purpose, respectively. Furthermore, for four-time-a-week
travel intensity, there are 24, 21 and 37 respondent stating that they travel for work, school and
other purposes, respectively. The detail of number of respondents by weekly travel intensity is
presented in figure 19.

The Study on Development of Regional Railway System of Central Java Region Final Report
A - 74
Weekly Travel Intensity
17
17
24
3
2
21
135
124
98
37
312
0 20 40 60 80 100 120 140 160 180
Once a week
Twice a week
Three times a week
Four times a weeks
Working School Other Purposes
Source: CJRR Study Team, Stated Preference Survey, 2008
Figure 1.4.19 Number Of Respondents By Weekly Travel Intensity
C.7) Monthly Travel Intensity
In terms of monthly travel intensity, most respondents conducting this type of travel are those traveling for purposes other than work and school. Most respondents traveling less than 10
times a month, consisted of 33 respondents traveling for work, 21 respondents traveling for
school and 364 respondents traveling for purposes other than work and school. The detail of
number of respondents by monthly travel intensity is presented in the following figure.
Monthly Travel Intensity
33
2
21
0
364
9
4710
0 50 100 150 200 250 300 350 400 450
Less then 10 times
10 until 15 times
15 until 20 times
Working School Other Purposes
Source: CJRR Study Team, Stated Preference Survey, 2008
Figure 1.4.20 Number Of Respondents By Monthly Travel Intensity

Appendix 1 Transportation Surveys
A - 75
C.8) Public Transport Cost
In terms of public transportation cost, seventeen percents or 342 respondents said that they
spent Rp 2,500 to Rp 5,000 for the public transportation cost while 10% respondents said that
they spent less than Rp 2,500 for the public transportation cost. Fifteen percents of respondents
spent more than Rp 5,000 for the public transportation cost while 31% respondents did not use public transportation and 27% respondents did not know the amount the spent for public
transportation cost. The detail of number of respondents by amount spent for public
transportation cost is presented in figure 21.
Public Transport Cost
10%
17%
10%
4%32%
27% < Rp. 2,500
Rp. 2,500 s/d Rp. 5,000
Rp. 5,000 s/d Rp. 10,000
> Rp. 10,000
Don't Use
Don't Know
Source: CJRR Study Team, Stated Preference Survey, 2008
Figure 1.4.21 Number Of Respondents By Amount Spent For Public Transportation Cost
C.9) Taxi Cost
Most respondents rarely used taxi. Only did 4% respondents spend cost for traveling using taxi.
The detail of number of respondents by the amount spent for taxi cost is presented in the
following figure.
Taxi Cost
52%
44%
1%1%
1%1%
< Rp. 10,000
Rp. 10,000 s/d Rp. 20,000
Rp. 20,000 s/d Rp. 30,000
> Rp. 30,000
Don't Use
Don't Know
Source: CJRR Study Team, Stated Preference Survey, 2008
Figure 1.4.22 Number Of Respondents By The Amount Spent For Taxi Cost

The Study on Development of Regional Railway System of Central Java Region Final Report
A - 76
C.10) Car Operation Cost (monthly)
In terms of car operation cost, most respondents did know the amount since they did not use
private car. However, 2%, 3%, 3% and 4% respondents said that they spent less than Rp
100,000; Rp 100,000 – Rp 300,000; Rp 300,000 – Rp 600,000 and more than Rp 600,000 for
the private car operation cost. The detail of number of respondents by the amount of monthly car operation cost is presented in figure 23.
Car Operation Cost (Monthly)
42%
45%
2% 3% 3%5%
< Rp. 100,000 Rp. 100,000 s/d Rp. 300,000Rp. 300,000 s/d Rp. 600,000 > Rp. 600,000
Don't Use Don't Know
Source: CJRR Study Team, Stated Preference Survey, 2008
Figure 1.4.23 Number Of Respondents By The Amount Of Monthly Car Operation Cost
C.11) Motorcycle Operation Cost ( monthly )
Most respondents (894 or 44%) said that they spent Rp 50,000 per month for motorcycle
operation cost. Furthermore, 396 (20%) respondents said that they spent Rp 50,000 – Rp
150,000 per month for the motorcycle operation cost while 24 (1%) respondents said that they
spent Rp 150,000 – Rp 300,000 per month for the cost. The rest of respondents did know the
amount of motorcycle operation cost and did not use motorcycle. The detail of number of respondents by the amount of monthly motorcycle operation cost is presented in figure 24.

Appendix 1 Transportation Surveys
A - 77
Motorcycle Operation Cost (Monthly)
9%
26%45%
19%1%
< Rp. 50,000 Rp. 50,000 s/d Rp. 150,000Rp. 150,000 s/d Rp. 300,000 > Rp. 300,000
Don't Use Don't Know
Source: CJRR Study Team, Stated Preference Survey, 2008
Figure 1.4.24 Number Of Respondents By The Amount Of Monthly Motorcycle Operation Cost
D. Willingness and ability to pay
D.1) Working Purpose
Respondents with working purpose have the capability and ability in paying more than
respondents with other purposes. 91.13% respondents with working purposes agree if the
established tariff is Rp 2,500.00. Respondents with working purposes who agree if the tariff is
Rp 5,000.00 are 52.67% and the rest 47.33% did not agree. For the tariff of Rp 7,500.00 and Rp
10,000.00 the respondents who agree are 12.72% and 2.77%, respectively. The detail of number of respondents traveling for work by willingness and ability to pay is presented in
figure 25 below.
Willing nes s and Ability to pay (Working )
91,13%
52,67%
12,71%
8,87%
47,33%
87,29%
97,23%2,77%
0% 20% 40% 60% 80% 100%
Tarif Rp. 2,500
Tarif Rp. 5,000
Tarif Rp. 7,500
Tarif Rp. 10,000
Agree Dis agree Source: CJRR Study Team, Stated Preference Survey, 2008
Figure 1.4.25 Number Of Respondents Traveling For Work By Willingness And Ability To Pay

The Study on Development of Regional Railway System of Central Java Region Final Report
A - 78
D.2) School Purpose
Respondents traveling for school purpose have the capability and ability in paying in the least
price than respondents with other purposes. 87.95% respondents with school purpose agree if
the tariff is Rp 2,500.00. For the tariff of Rp 5,000.00 respondents with school purpose who
agree with the tariff are 37.21% respondents and the rest 62.79% respondents did not agree with the tariff. For tariff of Rp 7,500.00 and Rp 10,000.00 respondents who agree are 8.37%
respondents and 0.93% respondents, respectively. The detail of number of respondents
traveling for school purpose by willingness and ability to pay is presented in figure 26 below.
Willing nes s and Ability to pay (S chool)
87,95%
37,21%
8,37%
12,05%
62,79%
91,63%
99,07%0,93%
0% 20% 40% 60% 80% 100%
Tarif Rp. 2,500
Tarif Rp. 5,000
Tarif Rp. 7,500
Tarif Rp. 10,000
Agree Dis agree Source: CJRR Study Team, Stated Preference Survey, 2008
Figure 1.4.26 Number Of Respondents Traveling For School Purpose By Willingness And Ability To Pay
D.3) Other Purposes
Respondents with purposes other than school and work have the average capability and ability
in paying compared to respondents with school and working purposes. 91.19% respondents
with purposes other than school and working agree with the tariff of Rp 2,500.00. It can be said that almost most of them agree with the tariff of 2,500.00. For the tariff of Rp,5 000.00, 44.61%
respondents with working purpose agree with the tariff and the rest 55.39% respondents did not
agree. For the tariff of Rp 7,500.00 and Rp 10,000.00, respondents who agree with the tariff are
7.87% and 1.88% respondents, respectively. The detail of number of respondent traveling for
purpose other than school and work is presented in figure 27.

Appendix 1 Transportation Surveys
A - 79
Willing nes s and Ability to pay (Other Purposes )
91,19%
44,61%
7,87%
8,81%
55,39%
92,13%
98,12%1,88%
0% 20% 40% 60% 80% 100%
Tarif Rp. 2,500
Tarif Rp. 5,000
Tarif Rp. 7,500
Tarif Rp. 10,000
Agree Dis agree Source: CJRR Study Team, Stated Preference Survey, 2008
Figure 1.4.27 Number Of Respondent Traveling For Purpose Other Than School And Work
D.4) Respondent’s reason of not using commuter train
Most of respondents with working purposes did not use train with the reason that using private
vehicle are faster and easier. Respondents who said using private vehicle is faster are 265
respondents and respondents who considered that using private vehicle is easier are 24%
respondents. The detail of number of respondents traveling for work by their reason of not using commuter train is presented in figure 28.
Responden't Reason of Not Using Commuter Train (Working)
27%
25%
6%
5%
8%
5%
9%
1%
3%
2%0%
9%
It may be faster to go by car/motorcycle/taxi than by Commuter Rail.
It may be easier to go by car/motorcycle/taxi than by Commuter Rail.
I want to use car/motorcycle to go around the City.
The gas and parking fee for car/motorcycle seems reasonable to me.
The taxi fare seems reasonable to me.
Walking and taking public transport seem dangerous to me.
Walking and taking public transport seem tiresome to me.
Current public transport seems to be more convenient for me than byCommuter Rail.Non-AC public transport is fine for me.
My destination is far from the Commuter Rail station.
Source: CJRR Study Team, Stated Preference Survey, 2008
Figure 1.4.28 Number Of Respondents Traveling For Work By Their Reason Of Not Using Commuter Train

The Study on Development of Regional Railway System of Central Java Region Final Report
A - 80
Furthermore, for respondents with school purpose have almost the similar reason to
respondents with working purpose for not using commuter train. Most of the respondents with
school purposes did not use commuter train with the reason that using private vehicles is faster
and easier. There are 23% respondents who said that using private vehicles is faster.
Respondents who said that using private vehicles is easier are 30% respondents. Other reasons, which quite many, are the fuel and parking costs are still very reachable for them. The detail of
number of respondents traveling for school by their reason of not using commuter train is
presented in figure 29.
Responden't Reason of Not Using Commuter Train (School)
22%
31%
5%
10%
3% 5%
9%6%
1%1%
6%
1%
It may be faster to go by car/motorcycle/taxi than by Commuter Rail.
It may be easier to go by car/motorcycle/taxi than by Commuter Rail.
I want to use car/motorcycle to go around the City.
The gas and parking fee for car/motorcycle seems reasonable to me.
The taxi fare seems reasonable to me.
Walking and taking public transport seem dangerous to me.
Walking and taking public transport seem tiresome to me.
Current public transport seems to be more convenient for me than byCommuter Rail.Non-AC public transport is fine for me.
My destination is far from the Commuter Rail station.
Source: CJRR Study Team, Stated Preference Survey, 2008
Figure 1.4.29 Number Of Respondents Traveling For School By Their Reason Of Not Using Commuter Train
Most of respondents with purposes other than school and working did not use train because it is
faster and easier using private vehicles for them. Respondents who said that using private vehicle is faster are 21% respondents. And respondents who considered that using private
vehicle is easier are 26% respondents. Other reason that quite many is that they thought using
public transportation is quite dangerous. There are 10% respondents with this reason from all
respondents with trip purposes other than school and working. The detail of number of
respondents traveling for purpose other than school and work by their reason of not using
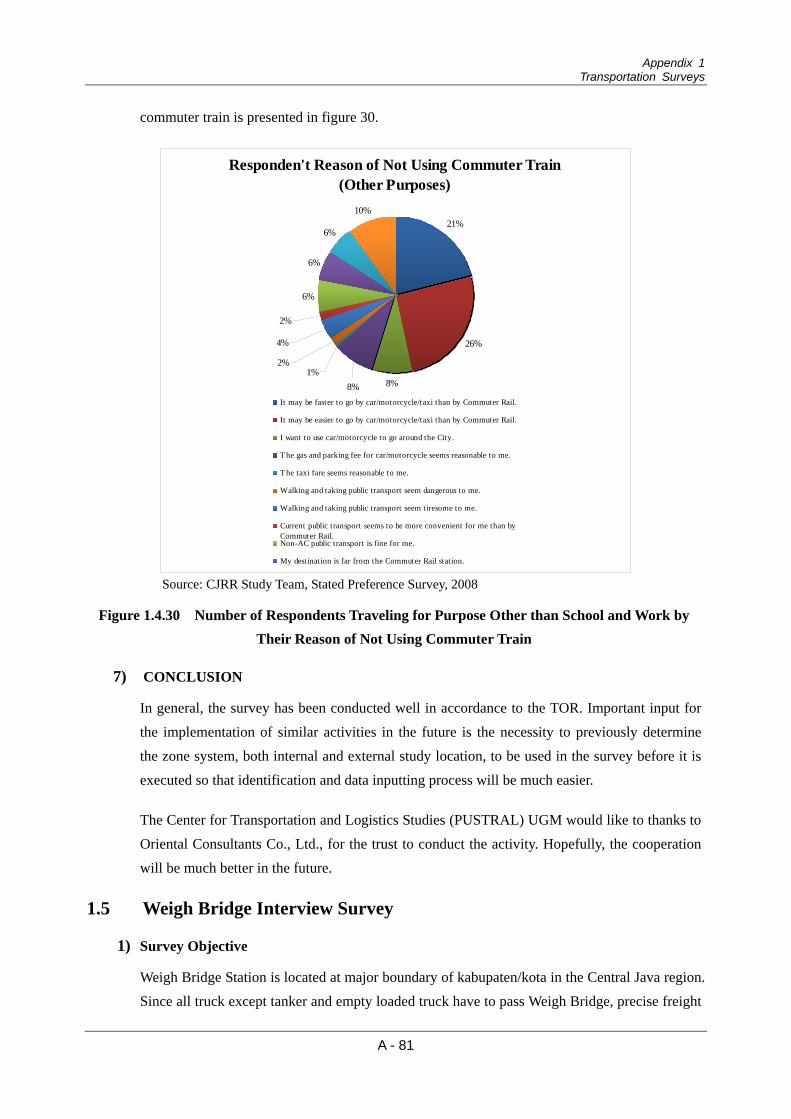
Appendix 1 Transportation Surveys
A - 81
commuter train is presented in figure 30.
Responden't Reason of Not Using Commuter Train (Other Purposes)
21%
26%
8%
6%
6%
6%
10%
8%1%
2%
4%
2%
It may be faster to go by car/motorcycle/taxi than by Commuter Rail.
It may be easier to go by car/motorcycle/taxi than by Commuter Rail.
I want to use car/motorcycle to go around the City.
The gas and parking fee for car/motorcycle seems reasonable to me.
The taxi fare seems reasonable to me.
Walking and taking public transport seem dangerous to me.
Walking and taking public transport seem tiresome to me.
Current public transport seems to be more convenient for me than byCommuter Rail.Non-AC public transport is fine for me.
My destination is far from the Commuter Rail station.
Source: CJRR Study Team, Stated Preference Survey, 2008
Figure 1.4.30 Number of Respondents Traveling for Purpose Other than School and Work by Their Reason of Not Using Commuter Train
7) CONCLUSION
In general, the survey has been conducted well in accordance to the TOR. Important input for
the implementation of similar activities in the future is the necessity to previously determine
the zone system, both internal and external study location, to be used in the survey before it is
executed so that identification and data inputting process will be much easier.
The Center for Transportation and Logistics Studies (PUSTRAL) UGM would like to thanks to
Oriental Consultants Co., Ltd., for the trust to conduct the activity. Hopefully, the cooperation
will be much better in the future.
1.5 Weigh Bridge Interview Survey
1) Survey Objective
Weigh Bridge Station is located at major boundary of kabupaten/kota in the Central Java region.
Since all truck except tanker and empty loaded truck have to pass Weigh Bridge, precise freight

The Study on Development of Regional Railway System of Central Java Region Final Report
A - 82
transport data can be obtained by conducting interview survey at weigh bridge stations. Freight
transport weight, origin, destination, and commodity type were surveyed for both intra
provincial and inter provincial transport.
2) Survey Contents
a. Survey Method
Interviewer made vehicles entering Weigh Bridge Stations stop with the cooperation of a traffic
officer to ask the drivers about trip purpose, OD, commodity type. Interviewer also record total
weight by reading weigh bridge indicator and vehicle weight and capacity by reading vehicle
registration information labeled on each vehicle. A manual hourly traffic count also was
conducted at each survey location by vehicle type.
Source: CJRR Study Team, Weigh Bridge Survey, 2008
Figure 1.5.1 Weight Bridge Interview Survey Situation
b. Survey Period
The survey shall be conducted on 15, 17 of July for 24 hours.
c. Survey Location
Interview survey and traffic count shall be conducted at the following 8 Weigh Bridge Stations
(Jembatan timbang) out of 17 Weigh Bridge Stations in Central Java Province considering
traffic flow in survey area. Since Roadside OD Interview Survey was conducted at Weigh
Bridge Station in Yogyakarta Special Province (DIY), Weigh Bridge Station Survey was not conducted at DIY.

Appendix 1 Transportation Surveys
A - 83
Table 1.5.1 Weigh Bridge Stations in Central Java Province
Annual Daily Estimated Selected Weight Average Peak-day Survey 2007 Weight Average Stations
1 Ajibarang 174,337 478 5742 Banyudono 119,598 328 394 * to be surveyed3 Gubung 204,925 561 6734 Katonsari 398,941 1,093 1,312 * to be surveyed5 Butuh 304,982 836 1,0036 Klepu 443,839 1,216 1,459 * to be surveyed7 Lebuawu 233,538 640 7688 Pringsurat 222,678 610 732 * to be surveyed9 Salam 261,864 717 860 * to be surveyed10 Sambong 136,333 374 44911 Sarang 370,255 1,014 1,217 * to be surveyed12 Selogiri 111,097 304 36513 Subah 475,014 1,301 1,56114 Tanjung 442,586 1,213 1,456 * to be surveyed15 Toyoga 234,400 642 77016 Tugu 571,896 1,567 1,880 * to be surveyed17 Wanareja 143,472 393 472
Source: CJRR Study Team, Weigh Bridge Survey, 2008
Source: CJRR Study Team, Weigh Bridge Survey, 2008
Figure 1.5.2 Weigh Bridge Stations in Central Java Province

The Study on Development of Regional Railway System of Central Java Region Final Report
A - 84
3) Descriptive Survey Results
In spite of government policy to reduce over loaded trucks by fine, the majority of trucks load
over their capacity. The following figure depicts distribution of load / capacity ratio of trucks
in Central Java region based on Weigh Bridge Survey conducted at 9 weigh bridge stations in
Central Java Region. Load / capacity ratio and average axle load are also depicted by
commodity type in Figure 1.5.4 and Figure 1.5.5.
Roughly half of the trucks carry cargo more than their capacities, and even some trucks carry
cargo with 2.5 times of its capacity. By commodity types, bulky cargo including sand, cement,
coal, stone, fertilizer and steel is relatively high in both load / capacity ratio and average axle
weight.
0
100
200
300
400
500
600
700
0-0.
1
0.1-
0.2
0.2-
0.3
0.3-
0.4
0.4-
0.5
0.5-
0.6
0.6-
0.7
0.7-
0.8
0.8-
0.9
0.9-
1
1-1.
1
1.1-
1.2
1.2-
1.3
1.3-
1.4
1.4-
1.5
1.5-
1.6
1.6-
1.7
1.7-
1.8
1.8-
1.9
1.9-
2
2-2.
1
2.1-
2.2
2.2-
2.3
2.3-
2.4
2.4-
2.5
2.5+
Load / Capacity Ratio
Freq
uenc
y
0%
10%
20%
30%
40%
50%
60%
70%
80%
90%
100%FrequencyAccumulation
(n = 4,214)
Note: Load capacity ratio is calculated by dividing cargo weight (excluding vehicle weight) by cargo weight capacity. Source: CJRR Study Team, Weigh Bridge Survey, 2008
Figure 1.5.3 Load / Capacity Ratio Distribution of Trucks at Weigh Bridges

Appendix 1 Transportation Surveys
A - 85
1.711.39
1.27
1.251.221.221.20
1.171.131.131.11
1.101.081.08
1.051.02
0.950.950.93
0.90
0.890.80
0.00 0.20 0.40 0.60 0.80 1.00 1.20 1.40 1.60 1.80
Sand
Cement
Coal
Stone
Steel
Fertilizer
Wood
Mineral Products (excluding Sand, Stone and Coal)
Building Materials (excluding Cement, Wood, Ceramics and Steel)
Woolen Products
Food
Ceramics
Chemical Products (excluding Medicine and Fertilizer)
Agricultural Products
Textile
Paper
Mineral Products (excluding Sand, Stone, Coal and Fuel)
Others
Grocery
Scrap
Funiture
Medicine(n = 4,214)
Note: Load capacity ratio is calculated by dividing cargo weight (excluding vehicle weight) by cargo weight capacity. Source: CJRR Study Team, Weigh Bridge Survey, 2008
Figure 1.5.4 Load / Capacity Ratio by Commodity Type at Weigh Bridges

The Study on Development of Regional Railway System of Central Java Region Final Report
A - 86
9.18.9
8.47.4
7.26.7
6.56.26.2
6.0
5.55.3
5.0
5.04.94.8
4.4
4.34.3
4.13.5
2.8
0.0 1.0 2.0 3.0 4.0 5.0 6.0 7.0 8.0 9.0 10.0
Mineral Products (excluding Sand, Stone and Coal)
Coal
Cement
Steel
Fertilizer
Sand
Chemical Products (excluding Medicine and Fertilizer)
Stone
Ceramics
Woolen Products
Paper
Wood
Building Materials (excluding Cement, Wood, Ceramics and Steel)
Food
Grocery
Medicine
Others
Mineral Products (excluding Sand, Stone, Coal and Fuel)
Textile
Scrap
Agricultural Products
Funiture(n = 4,214)
[Unit: ton/axle]
Note: Average axle weight is calculated by dividing gross weight including vehicle and cargo .by number of axles. Vehicles with more than five axles are assumed to be 5.5 axles.
Source: CJRR Study Team, Weigh Bridge Survey, 2008
Figure 1.5.5 Average Axle Weight by Commodity Type at Weigh Bridges (ton / axle)
4) Origin Destination Table Calibration and Analyses
a. Sampling Ratios
Sampling ratio for each weigh bridge station is shown as follows. Sampling ratios was set not
to cause traffic congestion.

Appendix 1 Transportation Surveys
A - 87
Table 1.5.2 Sampling Ration of Weigh Bridge Stations
2 Axles Truck 3 Axles Truck Truck with More than 4 AxlesLocation Direction
(to) No. of Samples TC Sample
Ratio No. of
Samples TC Sample Ratio
No. of Samples TC Sample
Ratio
Banyudono Semarang 290 857 33.8% 44 120 37% 5 278 1.8%
Katonsari Surabaya 282 939 30.0% 78 235 33% 72 202 35.6%
Klepu Semarang 367 1,768 20.8% 78 260 30% - 10 0.0%
Pringsurat Magelang 360 2,206 16.3% 44 261 17% - - 0.0%
Salam Semarang 211 481 43.9% 40 45 89% - 61 0.0%
Salam Yogyakarta 338 661 51.1% 39 61 64% 2 20 10.0%
Sarang Semarang 105 354 29.7% 101 319 32% 110 295 37.3%
Tanjung Semarang 170 715 23.8% 173 681 25% 42 326 12.9%Yogyakarta (Tugu) Jakarta 327 1,458 22.4% 27 183 15% 11 146 7.5%
Kulonprogo Wates 106 274 38.7% 37 80 46% 23 55 41.6%
Kulonprogo Purworejo 127 388 32.8% 37 101 37% 11 39 27.9%
Depok Klaten 198 473 41.8% 19 78 24% 12 47 25.3%
Depok Yogyakarta 265 956 27.7% 44 172 26% 20 69 28.9%Source: CJRR Study Team, Weigh Bridge Survey, 2008
b. Methodology
OD matrix formulation procedure is as same as freight transport of roadside OD interview
survey.
c. Weight Desire Line by Major Commodity Type
Steel is one of the major commodity types on the Northern Java Corridor. Traffic flow of steel
was surveyed at two major weigh bridges, Tanjung and Sarang. Tanjung weigh bridge, located
on the border of Central and West Java provinces, monitors almost all east bound freight
vehicle on the Northern Java Freight, and Sarang weigh bridge, located on the border of Central
and East Java provinces, monitors west bound freight on the corridor. Desire lines of both weigh bridges are shown in the figures below. It is noteworthy that approximately 1,000 tons
of steel is transported more than 500 km for both east and west bound traffic on a daily basis
such as Jakarta – Surabaya, while short distance flow is relatively smaller.

The Study on Development of Regional Railway System of Central Java Region Final Report
A - 88
OD Desire Line
0 50 100 150
Kilometers
(ton/day)Tanjung Weigh Bridge
Steel at Tanjung WB
1000 500 5
Note: Only east bound traffic was surveyed. Source: CJRR Study Team, Weigh Bridge Survey, 2008
Figure 1.5.6 Desire Lines of Steel at Tanjung Weigh Bridge
OD Desire Line
0 50 100 150
Kilometers
(ton/day)Sarang Weigh Bridge
Steel at Sarang WB
1000 500 50
Note: Only west bound traffic was surveyed. Source: CJRR Study Team, Weigh Bridge Survey, 2008
Figure 1.5.7 Desire Lines of Steel at Sarang Weigh Bridge

Appendix 1 Transportation Surveys
A - 89
Fertilizer
Although transported weight of fertilizer across the Central Java region is relatively smaller
than cement, sand, steel and fuel, approximately 200 tons / day of fertilizer is transported from
Gresik to Semarang according to the weigh bridge survey at Saragn weight bridge. According
to Road traffic survey by the study team, approximately 200 tons / day of fertilizer is also transported from Kabupaten Semarang to Kota Semarang and Grobogan.
OD Desire Line
0 50 100 150
Kilometers
(ton/day)Sarang Weigh Bridge
Fertilizer at Sarang WB
200 100 50
Source: CJRR Study Team, Weigh Bridge Survey, 2008
Figure 1.5.8 Desire Lines of Fertilizer at Sarang Weigh Bridge


