Appendix 1: Supplementary tables [posted as supplied … · Kokubo Y. Updates on stroke...
80
Appendix 1: Supplementary tables [posted as supplied by author] Table S1. Search strategy in PubMed and Embase 1. fruits 2. vegetables 3. fruit 4. vegetable 5. berry 6. berries 7. citrus 8. “citrus fruits” 9. cruciferae 10. “cruciferous vegetables” 11. cabbages 12. “allium vegetables” 13. strawberry 14. strawberries 15. tomato 16. tomatoes 17. cereal 18. cereals 19. “breakfast cereal” 20. grain 21. grains 22. “whole grain” 23. “whole grains” 24. rice 25. bread 26. nut 27. seed 28. peanut 29. peanuts 30. legumes 31. soy 32. soya 33. chickpeas 34. chickpea 35. bean 36. beans 37. lentil 38. legume 39. legumes 40. fiber 41. “dietary fiber” 42. “fruit fiber” 43. “vegetable fiber” 44. “legume fiber” 45. “cereal fiber” 46. fibre 47. “dietary fibre”
Transcript of Appendix 1: Supplementary tables [posted as supplied … · Kokubo Y. Updates on stroke...

Appendix 1: Supplementary tables [posted as supplied by author]
Table S1. Search strategy in PubMed and Embase
1. fruits
2. vegetables
3. fruit
4. vegetable
5. berry
6. berries
7. citrus
8. “citrus fruits”
9. cruciferae
10. “cruciferous vegetables”
11. cabbages
12. “allium vegetables”
13. strawberry
14. strawberries
15. tomato
16. tomatoes
17. cereal
18. cereals
19. “breakfast cereal”
20. grain
21. grains
22. “whole grain”
23. “whole grains”
24. rice
25. bread
26. nut
27. seed
28. peanut
29. peanuts
30. legumes
31. soy
32. soya
33. chickpeas
34. chickpea
35. bean
36. beans
37. lentil
38. legume
39. legumes
40. fiber
41. “dietary fiber”
42. “fruit fiber”
43. “vegetable fiber”
44. “legume fiber”
45. “cereal fiber”
46. fibre
47. “dietary fibre”

48. “fruit fibre”
49. “vegetable fibre”
50. “cereal fibre”
51. “DASH diet”
52. diet
53. foods
54. “dietary patterns”
55. “dietary pattern”
56. “dietary score”
57. “diet score”
58. “diet index”
59. “food index”
60. “nutrient index”
61. “Mediterranean diet”
62. “vitamin C”
63 “ascorbic acid”
64. “vitamin E”
65. carotenoids
66. carotenoid
67. flavonoid
68. flavonoids
69. (1 OR 2 OR 3 OR 4 OR 5 OR 6 OR 7 OR 8 OR 9 OR 10 OR 11 OR 12 OR 13 OR
14 OR 15 OR 16 OR 17 OR 18 OR 19 OR 20 OR 21 OR 22 OR 23 OR 24 OR 25 OR
26 OR 27 OR 28 OR 29 OR 30 OR 31 OR 32 OR 33 OR 34 OR 35 OR 36 OR 37 OR
38 OR 39 OR 40 OR 41 OR 42 OR 43 OR 44 OR 45 OR 46 OR 47 OR 48 OR 49 OR
50 OR 51 OR 52 OR 53 OR 54 OR 55 OR 56 OR 57 OR 58 OR 59 OR 60 OR 61 OR
62 OR 63 OR 64 OR 65 OR 66 OR 67 OR 68)
70. “coronary heart disease”
71. “heart disease”
72. “ischemic heart disease”
73. “ischaemic heart disease”
74. CHD
75. “coronary artery disease”
76. “myocardial infarction”
77. stroke
78. “ischemic stroke”
79. “haemorrhagic stroke”
80. “cardiovascular disease”
81. CVD
82. cancer
83. “total cancer”
84. mortality
85. “all-cause mortality”
86. “total mortality”
87. survival
88. (70 OR 71 OR 72 OR 73 OR 74 OR 75 OR 76 OR 77 OR 78 OR 79 OR 80 OR 81
OR 82 OR 83 OR 84 OR 85 OR 86 OR 87)
89. “case-control”
90. cohort
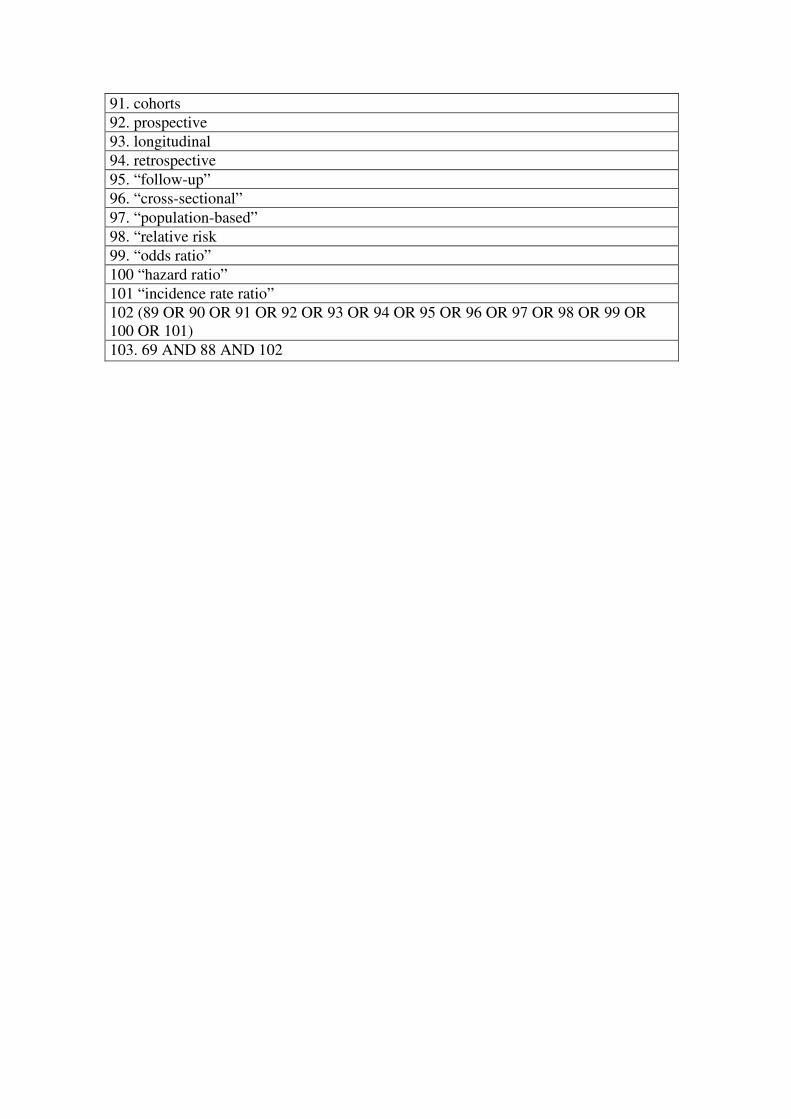
91. cohorts
92. prospective
93. longitudinal
94. retrospective
95. “follow-up”
96. “cross-sectional”
97. “population-based”
98. “relative risk
99. “odds ratio”
100 “hazard ratio”
101 “incidence rate ratio”
102 (89 OR 90 OR 91 OR 92 OR 93 OR 94 OR 95 OR 96 OR 97 OR 98 OR 99 OR
100 OR 101)
103. 69 AND 88 AND 102

Table S2. List of excluded studies and reason for exclusion Exclusion reason Reference number
Abstract only publication (1-10)
Case-control study (11-24)
Cross-sectional study (25)
Crude dietary assessment (26)
Diabetes patient population (27;28)
Duplicates (29-34)
Ecological study (35)
Meta-analysis (36-44)
No confidence intervals (45;46)
No risk estimates (47)
Not original data (48)
Not usable result (49)
Not relevant exposure (50;51)
Not relevant outcome (52-58)
Patients with heart disease (59)
Qualitative assessment (whole grain vs. refined grains) (60;61)
Quantity not provided (62)
Review (63-80)
Total disease mortality as outcome (not all-cause mortality), quantity not provided (81)
Unadjusted risk estimates (82)
Reference List
1. Wengreen H, Quach A, Cutler A, Munger R, Corcoran C. Whole-grain intake and risk of all-
cause mortality among elderly men and women: The Cache, County Study on Memory, Health
and Aging. FASEB Journal 2012;26:119.2.
2. Sonestedt E, Hellstrand S, Orho-Melander M. Carbohydrate-rich foods and risk of
cardiovascular disease in the Malmo diet and cancer cohort. European Journal of Epidemiology
2013;28 (1 Suppl):S184: P-302.
3. Yu D, Shu X-O, Li H et al. High intakes of dietary carbohydrate and rice were associated with
increased risk of coronary heart disease in chinese men and women. Circulation
2013;127:AMP24.
4. Qi L, Xu M, Lee A, Cho S. Ready to eat cereal consumption with total and cause-specific
mortality: Prospective analysis of 367,442 individuals. FASEB Journal 2014;28:810.20.
5. Qi L, Xu M, Huang T, Lee A, Cho S. Consumption of whole grain and cereal fiber with total
and cause-specific mortality: Prospective analysis of 367,442 individuals. FASEB Journal
2014;28:628.17.
6. Kokubo Y. Updates on stroke epidemiology in Japan. Neuroepidemiology 2014;43:80: PS10-4.
7. McKeown NM, Hruby A, Landberg R, Herrington DM, Lichtenstein AH. Plasma
alkylresorcinol, a biomarker of whole-grain intake, is not associated with progression of
coronary artery atherosclerosis in postmenopausal women with coronary artery disease.
Circulation 2014;129:AP408.
8. Wu H, Flint AJ, Van DR et al. Whole grain intake and risk of all-cause and cause-specific
mortality in us men and women. Circulation 2014;129:A18.

9. Bongard V, Arveiler D, Dallongeville J et al. Food groups associated with a reduced risk of
15year all-cause death. FASEB Journal 2015;29:736.32.
10. Krittanawong C, Tunhasiriwet A, Bisanz KJ et al. Is white rice consumption a risk for
cardiovascular disease? A systematic review and meta-analysis. Circulation 2015;132(Suppl. 3):
Abstract 17006.
11. Panagiotakos DB, Rallidis LS, Katsiotis E, Pitsavos C, Stefanadis C, Kremastinos DT.
Background dietary habits are strongly associated with the development of myocardial
infarction at young ages: A case-control study. e-SPEN 2008;3:e328-e334.
12. Gramenzi A, Gentile A, Fasoli M, Negri E, Parazzini F, La VC. Association between certain
foods and risk of acute myocardial infarction in women. BMJ 1990;300:771-3.
13. Genchev GD, Georgieva LM, Weijenberg MP, Powles JW. Does alcohol protect against
ischaemic heart disease in Bulgaria? A case-control study of non-fatal myocardial infarction in
Sofia. Cent Eur J Public Health 2001;9:83-6.
14. Sasazuki S. Case-control study of nonfatal myocardial infarction in relation to selected foods in
Japanese men and women. Jpn Circ J 2001;65:200-6.
15. Martinez-Gonzalez MA, Fernandez-Jarne E, Serrano-Martinez M, Marti A, Martinez JA,
Martin-Moreno JM. Mediterranean diet and reduction in the risk of a first acute myocardial
infarction: an operational healthy dietary score. Eur J Nutr 2002;41:153-60.
16. Martinez-Gonzalez MA, Fernandez-Jarne E, Martinez-Losa E, Prado-Santamaria M,
Brugarolas-Brufau C, Serrano-Martinez M. Role of fibre and fruit in the Mediterranean diet to
protect against myocardial infarction: a case-control study in Spain. Eur J Clin Nutr
2002;56:715-22.
17. Rastogi T, Reddy KS, Vaz M et al. Diet and risk of ischemic heart disease in India. Am J Clin
Nutr 2004;79:582-92.
18. Tavani A, Bertuzzi M, Gallus S, Negri E, La VC. Risk factors for non-fatal acute myocardial
infarction in Italian women. Prev Med 2004;39:128-34.
19. Lockheart MS, Steffen LM, Rebnord HM et al. Dietary patterns, food groups and myocardial
infarction: a case-control study. Br J Nutr 2007;98:380-7.
20. Iqbal R, Anand S, Ounpuu S et al. Dietary patterns and the risk of acute myocardial infarction in
52 countries: results of the INTERHEART study. Circulation 2008;118:1929-37.
21. Liang W, Lee AH, Binns CW. White rice-based food consumption and ischemic stroke risk: a
case-control study in southern China. J Stroke Cerebrovasc Dis 2010;19:480-4.
22. Guo J, Li W, Wang Y et al. Influence of dietary patterns on the risk of acute myocardial
infarction in China population: the INTERHEART China study. Chin Med J (Engl )
2013;126:464-70.
23. Turati F, Pelucchi C, Galeone C, Praud D, Tavani A, La VC. Mediterranean diet and non-fatal
acute myocardial infarction: a case-control study from Italy. Public Health Nutr 2015;18:713-
20.
24. Lipoeto NI, Agus Z, Oenzil F, Wahlqvist M, Wattanapenpaiboon N. Dietary intake and the risk
of coronary heart disease among the coconut-consuming Minangkabau in West Sumatra,
Indonesia. Asia Pac J Clin Nutr 2004;13:377-84.

25. Magnanti SM, Fernandes J, Hirshberg SE, Lofgren I. Whole grain intake and coronary heart
disease risk in young adults. FASEB Journal 2011;25:339.7.
26. Vormund K, Braun J, Rohrmann S, Bopp M, Ballmer P, Faeh D. Mediterranean diet and
mortality in Switzerland: an alpine paradox? Eur J Nutr 2015;54:139-48.
27. Trichopoulou A, Psaltopoulou T, Orfanos P, Trichopoulos D. Diet and physical activity in
relation to overall mortality amongst adult diabetics in a general population cohort. J Intern Med
2006;259:583-91.
28. He M, van Dam RM, Rimm E, Hu FB, Qi L. Whole-grain, cereal fiber, bran, and germ intake
and the risks of all-cause and cardiovascular disease-specific mortality among women with type
2 diabetes mellitus. Circulation 2010;121:2162-8.
29. Jacobs DR, Jr., Meyer KA, Kushi LH, Folsom AR. Is whole grain intake associated with
reduced total and cause-specific death rates in older women? The Iowa Women's Health Study.
Am J Public Health 1999;89:322-9.
30. Trichopoulou A, Costacou T, Bamia C, Trichopoulos D. Adherence to a Mediterranean diet and
survival in a Greek population. N Engl J Med 2003;348:2599-608.
31. Benetou V, Trichopoulou A, Orfanos P et al. Conformity to traditional Mediterranean diet and
cancer incidence: the Greek EPIC cohort. Br J Cancer 2008;99:191-5.
32. Burger KN, Beulens JW, van der Schouw YT et al. Dietary fiber, carbohydrate quality and
quantity, and mortality risk of individuals with diabetes mellitus. PLoS One 2012;7:e43127.
33. Schroder H, Salas-Salvado J, Martinez-Gonzalez MA et al. Baseline adherence to the
Mediterranean diet and major cardiovascular events: Prevencion con Dieta Mediterranea trial.
JAMA Intern Med 2014;174:1690-2.
34. Key TJ, Thorogood M, Appleby PN, Burr ML. Dietary habits and mortality in 11,000
vegetarians and health conscious people: results of a 17 year follow up. BMJ 1996;313:775-9.
35. Armstrong BK, Mann JI, Adelstein AM, Eskin F. Commodity consumption and ischemic heart
disease mortality, with special reference to dietary practices. J Chronic Dis 1975;28:455-69.
36. Jacobs DR, Jr., Marquart L, Slavin J, Kushi LH. Whole-grain intake and cancer: an expanded
review and meta-analysis. Nutr Cancer 1998;30:85-96.
37. Mellen PB, Walsh TF, Herrington DM. Whole grain intake and cardiovascular disease: a meta-
analysis. Nutr Metab Cardiovasc Dis 2008;18:283-90.
38. Mente A, de KL, Shannon HS, Anand SS. A systematic review of the evidence supporting a
causal link between dietary factors and coronary heart disease. Arch Intern Med 2009;169:659-
69.
39. Chacko S, Ye EQ, Chou EL, Kugizaki M, Liu S. Relation of whole grain intake to risk of type 2
diabetes, cardiovascular disease and weight gain: A systematic review and meta-analysis.
FASEB Journal 2012; 26(Suppl. 1):239.1
40. Ye EQ, Chacko SA, Chou EL, Kugizaki M, Liu S. Greater whole-grain intake is associated with
lower risk of type 2 diabetes, cardiovascular disease, and weight gain. Journal of Nutrition
2012;142:1304-13.

41. Tang G, Wang D, Long J, Yang F, Si L. Meta-analysis of the association between whole grain
intake and coronary heart disease risk. Am J Cardiol 2015;115:625-9.
42. Jacobs J, Marquart L, Slavin J, Kushi LH. Whole-grain intake and cancer: An expanded review
and meta-analysis. Nutrition and Cancer 1998;30:1998.
43. Wu D, Guan Y, Lv S, Wang H, Li J. No Evidence of Increased Risk of Stroke with
Consumption of Refined Grains: A Meta-analysis of Prospective Cohort Studies. J Stroke
Cerebrovasc Dis 2015;24:2738-46.
44. Fang L, Li W, Zhang W, Wang Y, Fu S. Association between whole grain intake and stroke
risk: evidence from a meta-analysis. Int J Clin Exp Med 2015;8:16978-83.
45. Burr ML, Sweetnam PM. Vegetarianism, dietary fiber, and mortality. Am J Clin Nutr
1982;36:873-7.
46. Tanaka H, Date C, Hayashi M et al. Trends in death and consultation rates of ischemic heart
disease in Japan and the risk factors in a rural community. Jpn Circ J 1987;51:306-13.
47. Nube M, Kok FJ, Vandenbroucke JP, van dH-W, van der Heide RM. Scoring of prudent dietary
habits and its relation to 25-year survival. J Am Diet Assoc 1987;87:171-5.
48. de Oliveira Otto MC, Afshin A, Micha R et al. The Impact of Dietary and Metabolic Risk
Factors on Cardiovascular Diseases and Type 2 Diabetes Mortality in Brazil. PLoS One
2016;11:e0151503.
49. Reedy J, Krebs-Smith SM, Miller PE et al. Higher diet quality is associated with decreased risk
of all-cause, cardiovascular disease, and cancer mortality among older adults. J Nutr
2014;144:881-9.
50. Ishihara T, Kobayashi E, Okubo Y et al. Association between cadmium concentration in rice
and mortality in the Jinzu River basin, Japan. Toxicology 2001;163:28.
51. Nakamura Y, Ueshima H, Okamura T et al. A Japanese diet and 19-year mortality: national
integrated project for prospective observation of non-communicable diseases and its trends in
the aged, 1980. Br J Nutr 2009;101:1696-705.
52. Erkkila AT, Herrington DM, Mozaffarian D, Lichtenstein AH. Cereal fiber and whole-grain
intake are associated with reduced progression of coronary-artery atherosclerosis in
postmenopausal women with coronary artery disease. American Heart Journal 2005;150:94-
101.
53. McCullough ML, Feskanich D, Rimm EB et al. Adherence to the Dietary Guidelines for
Americans and risk of major chronic disease in men. Am J Clin Nutr 2000;72:1223-31.
54. McCullough ML, Feskanich D, Stampfer MJ et al. Adherence to the Dietary Guidelines for
Americans and risk of major chronic disease in women. Am J Clin Nutr 2000;72:1214-22.
55. La Vecchia C, Chatenoud L, Negri E, Franceschi S. Session: Whole cereal grains, fibre and
human cancer wholegrain cereals and cancer in Italy. Proceedings of the Nutrition Society
2003;62:45-9.
56. Djousse L, Gaziano JM. Breakfast cereals and risk of heart failure in the physicians' health study
I. Arch Intern Med 2007;167:2080-5.

57. Nettleton JA, Steffen LM, Loehr LR, Rosamond WD, Folsom AR. Incident heart failure is
associated with lower whole-grain intake and greater high-fat dairy and egg intake in the
Atherosclerosis Risk in Communities (ARIC) study. J Am Diet Assoc 2008;108:1881-7.
58. Flint AJ, Hu FB, Glynn RJ et al. Whole grains and incident hypertension in men. Am J Clin Nutr
2009;90:493-8.
59. Karim MA, Majumder AA, Islam KQ et al. Risk factors and in-hospital outcome of acute ST
segment elevation myocardial infarction in young Bangladeshi adults. BMC Cardiovasc Disord
2015;15:73.
60. Fraser GE, Sabate J, Beeson WL, Strahan TM. A possible protective effect of nut consumption
on risk of coronary heart disease. The Adventist Health Study. Arch Intern Med 1992;152:1416-
24.
61. Whiteman D, Muir J, Jones L, Murphy M, Key T. Dietary questions as determinants of
mortality: the OXCHECK experience. Public Health Nutr 1999;2:477-87.
62. Yu D, Zhang X, Xiang YB et al. Adherence to dietary guidelines and mortality: a report from
prospective cohort studies of 134,000 Chinese adults in urban Shanghai. Am J Clin Nutr
2014;100:693-700.
63. Kushi LH, Meyer KA, Jacobs DR, Jr. Cereals, legumes, and chronic disease risk reduction:
evidence from epidemiologic studies. Am J Clin Nutr 1999;70:451S-8S.
64. Liu S, Manson JE. Dietary carbohydrates, physical inactivity, obesity, and the "metabolic
syndrome" as predictors of coronary heart disease. Current Opinion in Lipidology 2001;12:395-
404.
65. McKeown NM, Jacques P. Whole grain intake and risk of ischemic stroke in women. Nutr Rev
2001;59:149-52.
66. Hu FB, Willett WC. Optimal diets for prevention of coronary heart disease. JAMA
2002;288:2569-78.
67. Truswell AS. Cereal grains and coronary heart disease. Eur J Clin Nutr 2002;56:1-14.
68. Hu FB. Plant-based foods and prevention of cardiovascular disease: an overview. Am J Clin
Nutr 2003;78:544S-51S.
69. Jacobs DR, Jr., Meyer HE, Solvoll K. [Consumption of whole grain foods and chronic disease].
Tidsskr Nor Laegeforen 2004;124:1399-401.
70. Slavin J. Whole grains and human health. Nutr Res Rev 2004;17:99-110.
71. Jacobs J, Gallaher DD. Whole grain intake and cardiovascular disease: A review. Current
Atherosclerosis Reports 2004;6:415-23.
72. Seal CJ. Whole grains and CVD risk. Proc Nutr Soc 2006;65:24-34.
73. Sherzai A, Heim LT, Boothby C, Sherzai AD. Stroke, food groups, and dietary patterns: A
systematic review. Nutrition Reviews 2012;70:423-35.
74. Williams PG. Evaluation of the evidence between consumption of refined grains and health
outcomes. Nutrition Reviews 2012;70:80-99.
75. Akesson A, Andersen LF, Kristjansdottir AG et al. Health effects associated with foods
characteristic of the Nordic diet: a systematic literature review. Food Nutr Res 2013;57.
76. Lillioja S, Neal AL, Tapsell L, Jacobs DR, Jr. Whole grains, type 2 diabetes, coronary heart
disease, and hypertension: links to the aleurone preferred over indigestible fiber. Biofactors
2013;39:242-58.
77. Frolich W, Aman P, Tetens I. Whole grain foods and health - A Scandinavian perspective. Food
and Nutrition Research 2013;57.
78. Cho SS, Qi L, Fahey GC, Jr., Klurfeld DM. Consumption of cereal fiber, mixtures of whole
grains and bran, and whole grains and risk reduction in type 2 diabetes, obesity, and
cardiovascular disease. Am J Clin Nutr 2013;98:594-619.
79. Boffetta P, Thies F, Kris-Etherton P. Epidemiological studies of oats consumption and risk of
cancer and overall mortality. Br J Nutr 2014;112 Suppl 2:S14-S18.
80. Flight I, Clifton P. Cereal grains and legumes in the prevention of coronary heart disease and
stroke: a review of the literature. Eur J Clin Nutr 2006;60:1145-59.
81. Yu D, Sonderman J, Buchowski MS et al. Healthy Eating and Risks of Total and Cause-Specific
Death among Low-Income Populations of African-Americans and Other Adults in the
Southeastern United States: A Prospective Cohort Study. PLoS Med 2015;12:e1001830.
82. Holmberg S, Thelin A, Stiernstrom E-L. Food choices and coronary heart disease: A population
based cohort study of rural Swedish men with 12 years of follow-up. International Journal of
Environmental Research and Public Health 2009;6:2626-38.

Table S3. Whole grains and refined grains and coronary heart disease Author,
publication year,
country
Study name Study
period
Number of
participants,
gender, age,
number of
cases/deaths
CHD
incidence
or
mortality
Dietary
assessment
Exposure and
subgroup
Whole grain
consumption
frequency or
amount
Relative risks
(95%
confidence
intervals)
Adjustment for confounding
factors
Pietinen P et al,
1996, Finland
Alpha-Tocopherol
Beta-Carotene
Cancer Prevention
Study
1986-1987
-1993, 6.1
years
follow-up
21930 smoking
men, age 50-69
years: 635 CHD
deaths
Mortality Validated
FFQ, 276
food items
Rye products
Other cereal products
16 g/day
54.9
82.0
115.0
172.2
47.0
83.3
114.8
150.6
214.5
1.00
0.87 (0.68-1.10)
0.86 (0.68-1.10)
0.79 (0.61-1.01)
0.75 (0.58-0.98)
1.00
0.94 (0.73-1.21)
0.93 (0.72-1.21)
1.03 (0.79-1.34)
1.05 (0.79-1.40)
Age, treatment group, smoking,
BMI, blood pressure, intake of
energy, alcohol, SFA,
education, physical activity
Gartside PS et al,
1998, USA
National Health
and Nutrition
Examination
Follow-up Study
1
1971-
1987, 16
years
follow-up
5811 men and
women, age 40-
74 years: 1976
CHD cases
Incidence NA Bread H vs l 1.16, p=0.05 Age, sex, race, geographic
region, serum cholesterol,
education, physical exercise,
physical activity, smoking,
BMI, alcohol, fish, dessert,
cheese
Jacobs DR Jr et
al, 1998, USA
Iowa Women’s
Health Study
1986-
1995, 8.64
years of
follow-up
34492 women,
age 55-69 years:
438 ischemic
heart disease
cases
Incidence FFQ, 127
food items
Dark bread
Whole-grain
breakfast cereal
Other whole grains
White bread
0-0.5 serv/wk
1.0-3.0
5.5-7.0
17.5-42.0
0 serv/wk
0.5-1.0
3.0
5.5-7.0
0 serv/wk
0.5-1.0
1.5-5.0
5.5-91.0
0 serv/wk
0.5-1.0
3.0-5.5
7.0-42.0
1.00
0.81 (0.62-1.06)
0.62 (0.46-0.82)
0.67 (0.49-0.91)
1.00
0.82 (0.62-1.08)
0.78 (0.58-1.06)
0.77 (0.56-1.04)
1.00
1.43 (1.01-2.02)
1.17 (0.81-1.68)
1.26 (0.81-1.95)
1.00
0.90 (0.64-1.27)
1.43 (1.08-1.89)
1.24 (0.94-1.64)
Age, total energy, education,
marital status, high blood
pressure, diabetes, BMI, waist-
to-hip ratio, physical activity,
pack-years, alcohol, use of
vitamin supplements, oral
contraceptive use, HRT, Keys
score, fruit and vegetable intake
(except juice), red meat, fish
and seafood, sucrose

Refined-grain
breakfast cereal
Sweets or desserts
Other refined grains
Crackers
0 serv/wk
0.5-1.0
3.0
5.5-7.0
0-2.0 serv/wk
2.5-5.0
5.5-7.0
7.5-11.0
11.5-143.0
0-1.5 serv/wk
2.0-3.0
3.5-5.0
5.5-50.0
0 serv/wk
0.5
1.0
3.0
5.5-42.0
1.00
1.11 (0.81-1.53)
0.82 (0.52-1.28)
1.45 (0.99-2.13)
1.00
0.94 (0.70-1.26)
1.13 (0.78-1.64)
1.17 (0.81-1.67)
0.86 (0.56-1.31)
1.00
0.94 (0.74-1.20)
0.90 (0.65-1.25)
0.79 (0.52-1.21)
1.00
0.91 (0.66-1.25)
0.99 (0.71-1.40)
0.87 (0.63-1.22)
0.81 (0.57-1.14)

Liu S et al, 1999,
USA
Nurses’ Health
Study
1984-
1994, 10
years
follow-up
75521 women,
age 38-63 years:
761 CHD cases
Incidence Validated
FFQ, 126
food items
Whole grain
Dark bread
Whole-grain
breakfast cereal
Popcorn
Cooked oatmeal
Brown rice
Wheat germ
Bran
Other grains
0.13 serv/day
0.43
0.85
1.31
2.70
0 serv/day
0.07
0.43
0.71
1.30
0 serv/day
0.07
0.22
0.43
0.93
0 serv/day
0.07
0.33
0.62
1.00
0 serv/day
0.07
0.33
0.67
1.00
0 serv/day
0.07
0.31
0.79
0 serv/day
0.07
0.36
0.93
0 serv/day
0.07
0.36
1.00
0 serv/day
0.07
1.00
0.92 (0.75-1.14)
0.93 (0.75-1.15)
0.83 (0.66-1.05)
0.75 (0.59-0.95)
1.00
1.13 (0.89-1.43)
0.92 (0.72-1.18)
0.97 (0.74-1.29)
0.98 (0.77-1.25)
1.00
0.89 (0.72-1.10)
0.72 (0.56-0.92)
0.82 (0.66-1.02)
0.76 (0.57-1.00)
1.00
0.86 (0.74-1.01)
0.88 (0.66-1.18)
0.42 (0.18-0.92)
0.92 (0.45-1.87)
1.00
0.92 (0.79-1.08)
0.70 (0.49-0.98)
1.41 (0.75-2.26)
1.10 (0.45-2.68)
1.00
0.86 (0.72-1.02)
0.77 (0.45-1.32)
0.45 (0.06-3.20)
1.00
0.55 (0.37-0.81)
1.11 (0.64-1.93)
0.41 (0.15-1.10)
1.00
0.76 (0.59-0.98)
0.68 (0.44-1.03)
0.63 (0.42-0.95)
1.00
0.79 (0.57-1.08)
Age, BMI, cigarette smoking,
alcohol, parental or family
history of myocardial infarction
before age 60, hypertension,
hypercholesterolemia,
menopausal status, HRT,
protein intake, aspirin use,
multiple/vitamin E use,
vigorous activity, total energy,
SFA, PUFA, MUFA, trans-FA

Jacobs DR et al,
2001, Norway
Norwegian
County Study
1977-1983
– 1994,
14.4 years
follow-up
33848 men and
women, age 35-
56 years: 553
CHD deaths
Mortality FFQ, 66
food items
Whole grain bread
score
0.05-0.60
0.83-0.83
0.90-1.13
1.35-1.80
2.25-5.40
1.00
0.99 (0.75-1.31)
0.94 (0.73-1.22)
0.88 (0.67-1.16)
0.76 (0.56-1.02)
Age, energy intake, sex,
smoking status, physical activity
during leisure, physical activity
during work, cod liver oil,
multivitamin use, SFA, SBP,
serum total cholesterol, BMI
Appleby PN et al,
2002, UK
The Health Food
Shoppers Study
1973-1979
– 1997,
19.8 years
follow-up
10741 men and
women, age 16-
89 years: 605
ischemic heart
disease deaths
Mortality FFQ Wholemeal bread
Bran cereals
Daily vs less
Daily vs less
0.86 (0.72-1.03)
1.13 (0.94-1.35)
Age at recruitment, sex,
smoking, fresh fruit, nuts/dried
fruit, raw vegetables salads,
mutual adjustment: wholemeal
bread and bran cereals
Liu S et al, 2003,
USA
Physicians’
Health Study
1982-
1988, 5.5
years
follow-up
86190 men, age
40-84 years: 488
MI cases
Incidence Validated
FFQ
Whole grain
breakfast cereals
Refined grain
breakfast cereals
Total breakfast
cereals
Rarely
1 serv/wk
2-6/wk
≥1/day
Rarely
1 serv/wk
2-6/wk
≥1/day
Rarely
1 serv/wk
2-6/wk
≥1/day
1.00
0.83 (0.56-1.23)
0.79 (0.56-1.10)
0.71 (0.51-0.98)
1.00
1.08 (0.81-144)
1.05 (0.76-1.44)
0.96 (0.68-1.36)
1.00
0.87 (0.67-1.14)
0.84 (0.62-1.07)
0.76 (0.54-0.94)
Age, cigarette smoking, alcohol
intake, physical activity, BMI,
history of type 2 diabetes, high
cholesterol, hypertension, use of
multivitamins
Steffen LM et al,
2003, USA
Atherosclerosis
Risk in
Communities
Study
1987-1989
- 1999, 11
years
follow-up
11940 men and
women, age 45-
64 years: 535
fatal or nonfatal
coronary artery
disease cases
Incidence Validated
FFQ, 61
food items
Whole grain
Refined grain
0.1 serv/day
0.5
1.0
1.5
3.0
0.5 serv/day
1.5
2.0
3.0
5.0
1.00
0.76 (0.58-0.99)
0.93 (0.72-1.21)
0.73 (0.55-0.98)
0.72 (0.53-0.97)
1.00
0.91 (0.65-1.27)
1.14 (0.83-1.56)
1.28 (0.93-1.75)
1.17 (0.82-1.66)
Age, race, sex, time-dependent
energy intake, education,
smoking status, pack-years of
smoking, physical activity,
alcohol intake, HRT (women),
BMI, waist-to-hip ratio, SBP,
antihypertensive medication
use, HDL-cholesterol, LDL-
cholesterol
Jensen MK et al,
2004, USA
Health
Professionals
Follow-up Study
1986-
2000, 14
years
follow-up
42850 men, age
40-75 years:
1818 CHD cases
Incidence Validated
FFQ, 131
food items
Whole grains
Added bran
3.5 g/d
9.6
16.0
24.7
42.4
0 g/d
1.00
0.96 (0.83-1.10)
0.94 (0.81-1.09)
0.86 (0.74-1.01)
0.84 (0.71-0.98)
1.00
Age, energy, smoking, alcohol,
physical activity, family history
of MI, use of vitamin E
supplements, SFA, PUFA, trans
FA, fruit, vegetables, fish, BMI,
mutual adjustment between

Germ
0.30
1.40
4.23
11.10
0 g/d
0.20
0.83
0.81 (0.70-0.95)
0.79 (0.67-0.92)
0.80 (0.68-0.93)
0.72 (0.61-0.84)
1.00
0.93 (0.81-1.07)
0.98 (0.85-1.12)
whole grains, added bran, and
added germ
Mink PJ et al,
2007, USA
Iowa Women’s
Health Study
1986-
2002, 16
years
follow-up
34489 women,
age 55-69 years:
1329 CHD
deaths
Mortality FFQ, 127
food items
Bran, added to food
0 serv/wk 0
1.00
0.91 (0.78-1.06)
Age, energy intake, marital
status, education, blood
pressure, diabetes, BMI, waist-
to-hip ratio, physical activity,
smoking, HRT
Jacobs DR, 2007,
USA
Iowa Women’s
Health Study
1986 –
2003, 17
years
follow-up
27312 women,
age 55-69 years:
1034 CHD
deaths
Mortality FFQ, 127
food items
Whole grains
Refined grains
1.8 serv/wk
5.6
8.8
14.5
25.6
0-5.75 serv/wk
6-9.5
9.6-13.5
14-22
≥22.5
1.00
1.01 (0.84-1.22)
0.85 (0.70-1.04)
0.79 (0.64-0.97)
0.72 (0.57-0.90)
1.00
0.96 (0.79-1.16)
0.90 (0.74-1.11)
0.80 (0.64-0.99)
0.89 (0.70-1.14)
Age, energy intake, BMI, waist-
to-hip ratio, smoking, education,
physical activity, estrogen use,
multivitamin supplement use,
intake of alcohol, alcohol2,
coffee, red meat, fish and
seafood, total fruit and
vegetables, mutual adjustment
between whole grains and
refined grains
Buckland G et al,
2009, Spain
European
Prospective
Investigation into
Cancer and
Nutrition – Spain
1992-1996
– 2004,
10.4 years
follow-up
41078 men and
women, age 29-
69 years: 609
CHD cases
Incidence Dietary
history
interview,
validated
FFQ, ~600
foods
Cereals 0-72.5 g/d
>72.5-102.6
>102.6-501.3
1.00
1.01 (0.83-1.24)
1.12 (0.92-1.38)
Age, sex, center, education,
physical activity, BMI, smoking
status, diabetes, hypertension,
hyperlipidemia, total calories
Eshak ES et al,
2011, Japan
Japan
Collaborative
Cohort Study
1988-1990
– 2003,
14.1 years
follow-up
83752 men and
women, age 40-
79 years: 707
CHD deaths
Mortality Validated
FFQ, 40
food items
Rice, men
Rice, women
280 g/d
420
449
583
711
279 g/d
359
420
453
560
1.00
1.04 (0.79-1.37)
0.73 (0.51-1.05)
0.85 (0.60-1.19)
0.70 (0.49-0.99)
1.00
1.01 (0.64-1.59)
0.83 (0.57-1.21)
1.25 (0.74-2.10)
1.08 (0.66-1.77)
Age, history of hypertension,
history of diabetes, BMI,
alcohol, smoking status,
exercise, walking, education,
perceived mental stress, sleep
duration, fish, meat, fruit, dairy
products, soy, total energy,
sodium, Key’s dietary score

Rautiainen S et al,
2012, Sweden
Swedish
Mammmography
Cohort
1997-
2007, 9.9
years
follow-up
32561 women,
age 49-83 years:
1114 MI cases
Incidence Validated
FFQ, 96
food items
Whole grains ≤2.3 serv/d
2.4-3.4
3.4-4.7
≥4.7
1.00
0.95 (0.81-1.13)
0.88 (0.74-1.04)
0.89 (0.74-1.07)
Age, education, smoking, BMI,
physical activity, hypertension,
hypercholesterolemia, family
history – MI, aspirin use, HRT,
dietary supplement use, total
energy, alcohol
Simila ME et al,
2013, Finland
Alpha-Tocopherol
Beta-Carotene
Cancer Prevention
Study
1985-1988
– 2004, 19
years
follow-up
21995 male
smokers, age
50-69 years:
4379 CHD cases
Incidence Validated
FFQ, 276
food items
Rye Per 100 g/d 0.99 (0.94-1.03) Age, intervention group
Yu D et al, 2013,
China
Shanghai
Women’s Health
Study
1997-2000
– 2009, 9.8
years
follow-up
64854 women,
age 40-70 years:
120 CHD cases
Incidence Validated
FFQ, 77
food items
White rice and
refined wheat
products
250 g/d
274
290
311
1.00
0.97 (0.49-1.93)
1.41 (0.69-2.90)
1.53 (0.64-3.68)
Age, birth cohort, education,
income, smoking status,
alcohol, physical activity, waist-
to-hip ratio, hypertension, total
energy, SFA, protein
Yu D et al, 2013,
China
Shanghai Men’s
Health Study
2002-2006
– 2009, 5.4
years
follow-up
52512 men, age
40-74 years: 189
CHD cases
Incidence Validated
FFQ, 81
food items
White rice and
refined wheat
products
253 g/d
290
327
367
1.00
1.15 (0.69-1.90)
1.38 (0.76-2.51)
2.01 (0.96-4.23)
Age, birth cohort, education,
income, smoking status,
alcohol, physical activity, waist-
to-hip ratio, hypertension, total
energy, SFA, protein
Eshak ES et al,
2014, Japan
Japan Public
Health Center-
based Prospective
Study
1990/1993
–
2007/2009,
15.2 years
follow-up
91223 men and
women, age 40-
69 years: 1088
IHD cases
605 IHD deaths
Incidence
and
mortality
Validated
FFQ,
44/52 food
items
Rice, CHD incidence
Rice, CHD mortality
251 g/d
326
377
430
542
251 g/d
326
377
430
542
1.00
0.93 (0.76-1.14)
0.99 (0.80-1.22)
0.95 (0.77-1.19)
1.08 (0.84-1.38)
1.00
0.81 (0.61-1.06)
0.93 (0.70-1.23)
0.85 (0.64-1.12)
0.93 (0.68-1.27)
Age, sex, public health center
area, hypertension, diabetes, use
of lipid-lowering drugs, BMI,
smoking status, ethanol intake,
leisure-time sports activity,
occupation, seafood, meat, fruit,
vegetables, soy, SFAs, sodium,
total energy, women: HRT,
menopausal status
Rebello SA et al,
2014, Singapore
Singapore
Chinese Health
Study
1993-1998
– 2011, 15
years
follow-up
53469 men and
women, age 45-
74 years: 1660
IHD deaths
Mortality Validated
FFQ, 165
food items
Whole-wheat bread,
men
Whole-wheat bread,
women
White bread, men
0.00 slices/d
0.33
1.00
Per serv/d
0.00 slices/d
0.33
1.00
Per serv/d
0.00 slices/d
1.00
0.93 (0.77-1.12)
0.94 (0.66-1.33)
0.99 (0.78-1.27)
1.00
0.93 (0.74-1.17)
0.51 (0.30-0.89)
0.58 (0.38-0.89)
1.00
Age, year of interview, father’s
dialect, total energy intake,
cigarette smoking, alcohol,
physical activity, sleep duration,
education, BMI, hypertension,
PUFA/SFA ratio, rice, noodles,
vegetables, fruit, fish, red meat,
poultry, eggs, legumes, soy
protein, white bread and whole-

White bread, women
Rice, men
Rice, women
Noodles, men
Noodles, women
0.33
1.00
Per serv/d
0.00 slices/d
0.33
1.00
Per serv/d
2.35 serv/d
3.40
4.10
4.80
6.74
Per serv/d
2.40 serv/d
3.39
4.08
4.80
5.77
Per serv/d
0.11 serv/d
0.31
0.47
0.66
1.08
Per serv/d
0.15 serv/d
0.32
0.46
0.65
1.07
Per serv/d
1.09 (0.92-1.29)
1.12 (0.90-1.39)
0.91 (0.79-1.05)
1.00
0.91 (0.74-1.11)
0.79 (0.60-1.04)
0.84 (0.68-1.04)
1.00
0.96 (0.76-1.20)
0.95 (0.75-1.20)
0.98 (0.77-1.25)
1.02 (0.79-1.31)
1.00 (0.95-1.06)
1.00
1.07 (0.79-1.45)
1.20 (0.88-1.63)
1.07 (0.77-1.48)
1.10 (0.77-1.58)
1.00 (0.92-1.08)
1.00
0.96 (0.79-1.18)
1.07 (0.87-1.31)
1.19 (0.96-1.46)
1.32 (1.07-1.62)
1.30 (1.11-1.53)
1.00
1.01 (0.77-1.33)
0.95 (0.71-1.27)
1.14 (0.86-1.53)
1.38 (1.02-1.85)
1.38 (1.09-1.75)
wheat bread mutually adjusted,
women: menopausal status,
HRT use
Muraki I et al,
2014, USA
Nurses’ Health
Study
Nurses’ Health
Study 2
1984-
2010, 26
years
follow-up
1991-
2011, 20
years
73228 women,
age 38-63 years:
3060 CAD cases
92158 women,
age 27-44 years:
534 CAD cases
Incidence Validated
FFQ, 118-
166 food
items
White rice
Brown rice
<1 serv/wk
1
2-4
≥5
Per 3 serv/wk
<1 serv/wk
1
2-4
1.00
1.04 (0.98-1.09)
1.05 (0.98-1.12)
0.84 (0.69-1.02)
1.01 (0.94-1.07)
1.00
0.99 (0.92-1.06)
1.05 (0.95-1.16)
Age, sex, cohort, ethnicity,
BMI, smoking status, cigarettes
per day, alcohol, physical
activity, family history – MI,
multivitamin use, current aspirin
use, prevalent hypertension,
prevalent hypercholesterolemia,
prevalent diabetes, total energy

Health
Professionals
Follow-up Study
follow-up
1986-
2010, 24
years
follow-up
42170 men, age
40-75 years:
4125 CAD cases
Total rice
≥5
Per 3 serv/wk
<1 serv/wk
1
2-4
≥5
Per 3 serv/wk
0.80 (0.57-1.12)
1.00 (0.91-1.11)
1.00
1.03 (0.98-1.09)
1.03 (0.97-1.09)
0.97 (0.86-1.08)
0.99 (0.94-1.05)
intake, modified alternate
Healthy Eating Index score,
women: menopausal status, oral
contraceptive use (NHS2),
postmenopausal hormone use
Tognon G et al,
2014, Denmark
The 1982-83
Danish
Monitoring trends
and determinants
of Cardiovascular
disease study
(MONICA)
1982-1983
– 2007, 14
years
follow-up
948 women and
901 men, age
NA: 161 MI
cases
64 MI deaths
Incidence
and
mortality
Validated
7 day food
record, 100
food items
Cereals, MI incidence
Cereals, MI death
>median vs.
<median
>median vs.
<median
0.90 (0.66-1.24)
0.69 (0.41-1.16)
Age, sex, BMI, education,
physical activity, cigarette
smoking
Atkins JL et al,
2014, United
Kingdom
British Regional
Heart Study
1998-2000
– 2010,
11.3 years
follow-up
3328 men, age
60-79 years: 307
CHD cases
Incidence Validated
FFQ, 86
food items
Cereals
Bread
Daily vs. <1 day/wk
Whole grain vs.
none
1.19 (0.73-1.93)
0.76 (0.18-3.15)
Age, smoking, alcohol, physical
activity, social class, BMI,
energy intake, diet score without
respective components
Johnsen NF et al,
2015, Norway,
Sweden, Denmark
HELGA Cohort
(Norwegian
Women and
Cancer Study,
Northern Sweden
Health and
Disease Study,
Danish Diet,
Cancer and Health
Study – part of the
EPIC study)
1992-1998
– 2008-
2009, 11.1
(Norway),
14.2
(Sweden),
11.9 years
(Denmark)
follow-up
120010 men and
women, age 30-
64 years:
858/298 CHD
deaths
Mortality Validated
FFQ, 88
food items
(Norway),
98 food
items
(Sweden)
173 food
items
(Denmark)
Whole grain
breakfast cereals,
women
Non-white bread
Crisp bread
Total whole grain
products
Oat
0 g/d
0.8
12
50
25 g/d
80
113
180
0.6 g/d
2
6
31
56 g/d
100
131
201
0 g/d
0.4
4
19
8 g/d
1.00
0.71 (0.43-1.16)
0.64 (0.47-0.87)
0.53 (0.37-0.77)
1.00
0.72 (0.52-0.99)
0.54 (0.37-0.79)
0.72 (0.47-1.09)
1.00
0.81 (0.56-1.18)
0.95 (0.68-1.33)
0.94 (0.66-1.34)
1.00
0.72 (0.54-0.97)
0.64 (0.46-0.89)
0.56 (0.40-0.78)
1.00
0.74 (0.52-1.05)
0.85 (0.59-1.21)
0.66 (0.45-0.96)
1.00
Age, follow-up time, education,
smoking status/years since quit/
cigarettes per day, alcohol,
BMI, total energy

Rye
Wheat
Total whole grain
types
Whole grain
breakfast cereals,
men
Non-white bread
Crisp bread
Total whole grain
products
Oat
Rye
Wheat
18
22
41
0.4 g/d
3
10
37
20 g/d
33
49
74
0 g/d
0.8
7
50
13 g/d
66
118
201
1 g/d
2
4
34
64 g/d
107
156
222
0 g/d
0.4
3
30
7 g/d
21
38
56
0.1 g/d
1
5
10
0.79 (0.57-1.11)
1.02 (0.75-1.38)
0.69 (0.46-1.05)
1.00
0.83 (0.57-1.21)
0.87 (0.60-1.27)
0.67 (0.45-1.00)
1.00
0.83 (0.60-1.14)
0.59 (0.42-0.82)
0.65 (0.46-0.91)
1.00
0.88 (0.69-1.11)
0.87 (0.72-1.05)
0.75 (0.61-0.91)
1.00
1.13 (0.89-1.42)
0.95 (0.74-1.22)
0.87 (0.65-1.17)
1.00
0.98 (0.81-1.19)
0.95 (0.78-1.16)
1.23 (0.88-1.71)
1.00
0.94 (0.78-1.15)
0.80 (0.66-0.97)
0.85 (0.70-1.04)
1.00
1.01 (0.83-1.23)
1.01 (0.80-1.28)
0.82 (0.65-1.03)
1.00
0.77 (0.62-0.95)
0.81 (0.67-0.97)
0.88 (0.73-1.07)
1.00
0.80 (0.66-0.97)
0.70 (0.55-0.88)
0.84 (0.65-1.08)

Total whole grain
types
21 g/d
37
54
80
1.00
0.79 (0.65-0.96)
0.80 (0.66-0.97)
0.74 (0.61-0.91)
Helnæs A et al,
2016, Denmark
Danish Diet,
Cancer and Health
Cohort
1993-1997
- 2009,
13.6 years
follow-up
54871 men and
women, age 50-
64 years: 2329
MI cases
Incidence Validated
FFQ, 192
food items
Total whole grain
products, men
Total whole grains
Total whole grain
products, women
Total whole grains
Rye bread, men
Whole grain bread
Oatmeal
Crispbread
Wheat
Rye
Oats
Rye bread, women
Whole grain bread
Oatmeal
Crispbread
66 g/d
116
163
224
Per 50 g/d
22 g/d
38
52
74
Per 25 g/d
63 g/d
103
135
201
Per 50 g/d
20 g/d
29
42
63
Per 25 g/d
Per 25 g/d
Per 25 g/d
Per 25 g/d
Per 25 g/d
Per 10 g/d
Per 10 g/d
Per 10 g/d
Per 25 g/d
Per 25 g/d
Per 25 g/d
Per 25 g/d
1.00
0.83 (0.73-0.95)
0.81 (0.71-0.93)
0.77 (0.67-0.89)
0.94 (0.91-0.97)
1.00
0.84 (0.73-0.95)
0.86 (0.76-0.99)
0.75 (0.65-0.86)
0.88 (0.83-0.93)
1.00
0.83 (0.67-1.02)
0.78 (0.63-0.96)
0.71 (0.56-0.89)
0.90 (0.84-0.97)
1.00
0.86 (0.70-1.06)
0.77 (0.62-0.95)
0.73 (0.58-0.91)
0.87 (0.78-0.96)
0.96 (0.94-0.99)
0.99 (0.97-1.02)
0.84 (0.78-0.91)
0.97 (0.81-1.17)
0.96 (0.84-1.09)
0.96 (0.93-0.99)
0.93 (0.88-0.97)
0.93 (0.88-0.98)
0.98 (0.93-1.03)
0.89 (0.77-1.02)
1.12 (0.92-1.36)
Age, education, smoking status,
pack-years, alcohol from beer
and spirits, alcohol from wine,
sports, menopausal status, HRT,
fruit, vegetables, fish, red meat,
processed meat
+ BMI, waist circumference,
SBP, hypertension, serum
cholesterol,
hypercholesterolemia

Wheat
Rye
Oats
Total whole grain
products, men
Total whole grains
Total whole grain
products, women
Total whole grains
Rye bread, men
Whole grain bread
Oatmeal
Crispbread
Wheat
Rye
Oats
Rye bread, women
Whole grain bread
Oatmeal
Crispbread
Wheat
Rye
Oats
Per 10 g/d
Per 10 g/d
Per 10 g/d
66 g/d
116
163
224
Per 50 g/d
22 g/d
38
52
74
Per 25 g/d
63 g/d
103
135
201
Per 50 g/d
20 g/d
29
42
63
Per 25 g/d
Per 25 g/d
Per 25 g/d
Per 25 g/d
Per 25 g/d
Per 10 g/d
Per 10 g/d
Per 10 g/d
Per 25 g/d
Per 25 g/d
Per 25 g/d
Per 25 g/d
Per 10 g/d
Per 10 g/d
Per 10 g/d
0.89 (0.70-1.13)
0.96 (0.90-1.01)
0.94 (0.86-1.02)
1.00
0.85 (0.75-0.98)
0.85 (0.74-0.98)
0.89 (0.77-1.02)
0.97 (0.94-1.01)
1.00
0.87 (0.76-0.99)
0.93 (0.82-1.07)
0.88 (0.76-1.02)
0.94 (0.88-0.99)
1.00
0.82 (0.66-1.02)
0.80 (0.64-0.98)
0.72 (0.57-0.91)
0.91 (0.85-0.98)
1.00
0.84 (0.68-1.04)
0.79 (0.64-0.98)
0.76 (0.61-0.96)
0.89 (0.80-0.99)
0.98 (0.96-1.01)
1.01 (0.98-1.03)
0.89 (0.82-0.96)
0.93 (0.77-1.11)
1.03 (0.90-1.17)
0.98 (0.95-1.00)
0.96 (0.91-1.00)
0.93 (0.88-0.98)
0.98 (0.93-1.02)
0.92 (0.80-1.05)
1.12 (0.92-1.36)
0.90 (0.71-1.14)
0.96 (0.91-1.01)
0.96 (0.88-1.05)
Wang JB et al,
2016, China
Linxian Nutrition
Intervention Trial
1984-1991
- 2010, 19-
2445 men and
women, age 40-
Mortality FFQ, 64
food items
All grains
Non-whole grains
Per 1 time/day
Per 1 time/day
1.00 (0.92-1.09)
1.05 (0.94-1.16)
Age, sex, commune, smoking,
drinking, season, BMI
cohort 26 years
follow-up
69 years: 355
heart disease
deaths
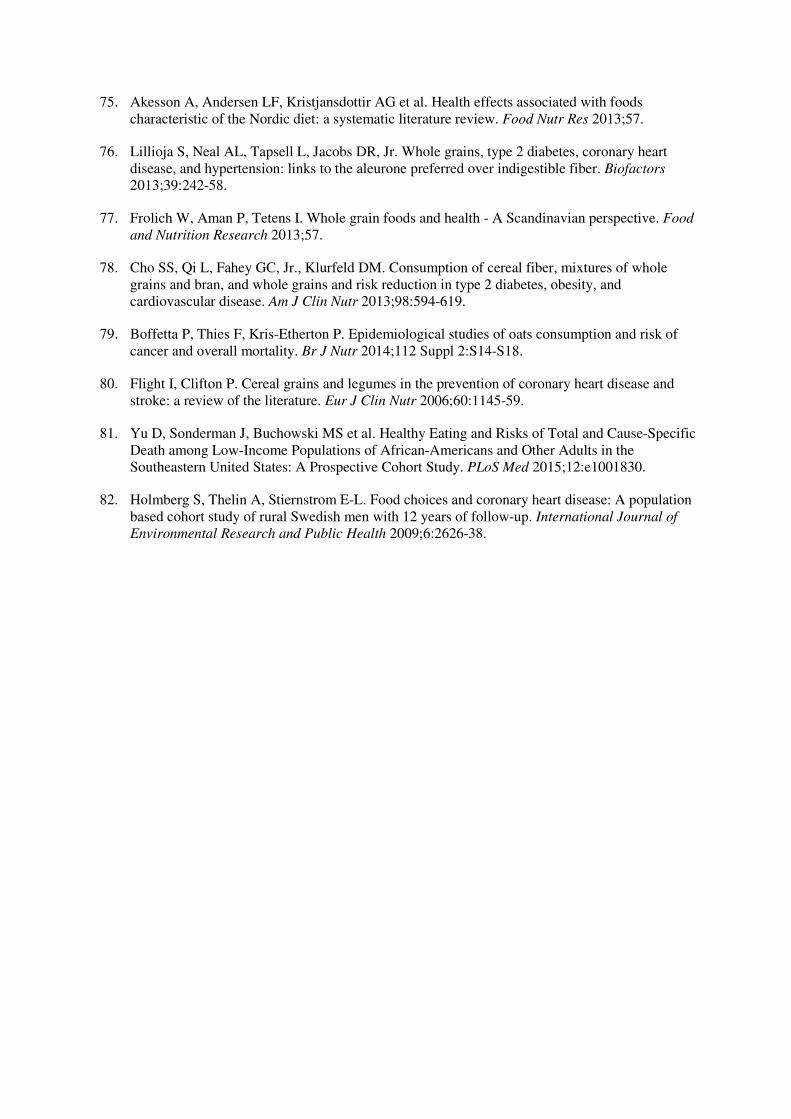
Whole grains Per 1 time/day 0.94 (0.83-1.07)
BMI; body mass index, CHD; coronary heart disease, FFQ; food frequency questionnaire, H vs l; High vs low, HDL-cholesterol; high-density
lipoprotein cholesterol, HRT; hormone replacement therapy, IHD; ischemic heart disease, LDL; low density lipoprotein cholesterol, MI;
myocardial infarction, MUFA; monounsaturated fatty acids, NHS2; Nurses’ Health Study 2, PUFA; polyunsaturated fatty acids, SBP; systolic
blood pressure, SFA; saturated fatty acids, trans-FA: trans fatty acids

Table S4. Whole grains and refined grains and stroke Author,
publication year,
country
Study name Study period Number of
participants,
gender, age,
number of
cases/deaths
Stroke
incidence
or
mortality
Dietary
assessment
Exposure and
subgroup
Whole grain
consumption
frequency or
amount
Relative risks
(95%
confidence
intervals)
Adjustment for confounding
factors
Liu S et al, 2000,
USA
Nurses’ Health
Study
1984-1996,
12 years
follow-up
75521 women,
age 38-63 years:
352 ischemic
stroke cases
Incidence Validated
FFQ, 126
food items
Whole grains
Refined grains
Total grains
0.13 serv/day
0.43
0.85
1.31
2.70
1
2
3
4
5
1
2
3
4
5
1.00
0.72 (0.53-1.00)
0.78 (0.58-1.08)
0.60 (0.43-0.86)
0.69 (0.50-0.98)
1.00
1.11 (0.81-1.52)
1.18 (0.85-1.64)
0.94 (0.66-1.35)
0.97 (0.67-1.42)
1.00
0.83 (0.60-1.15)
0.82 (0.59-1.16)
0.62 (0.43-0.92)
0.79 (0.54-1.18)
Age, BMI, physical activity,
cigarette smoking, alcohol,
parental history of MI before
age 60 years, aspirin use,
menopausal status, HRT,
hypertension, high blood
cholesterol, use of
multivitamins and vitamin E
supplements, SFA, Trans FA,
total energy
Appleby PN et al,
2002, UK
The Health
Food Shoppers
Study
1973-1979 –
1997, 19.8
years
follow-up
10741 men and
women, age 16-
89 years: 356
cerebro-
vascular disease
deaths
Mortality FFQ Wholemeal bread
Bran cereals
Daily vs less
Daily vs less
0.89 (0.70-1.13)
0.92 (0.73-1.17)
Age, sex, smoking, fresh fruit,
nuts/dried fruit, raw vegetables
salads, mutual adjustment
between wholemeal bread and
bran cereals
Liu S et al, 2003,
USA
Physicians’
Health Study
1982-1988,
5.5 years
follow-up
86190 men, age
40-84 years:
146 stroke cases
Incidence Validated
FFQ
Whole grain
breakfast cereals
Refined-grain
breakfast cereals
Total breakfast
cereals
Rarely
1 serv/wk
2-6/wk
≥1/day
Rarely
1 serv/wk
2-6/wk
≥1/day
Rarely
1 serv/wk
2-6/wk
≥1/day
1.00
0.92 (0.42-1.99)
1.68 (1.00-2.80)
1.41 (0.85-2.34)
1.00
0.79 (0.43-1.45)
0.79 (0.42-1.49)
1.22 (0.71-2.11)
1.00
0.98 (0.56-1.74)
1.40 (0.84-2.32)
1.54 (0.94-2.52)
Age, cigarette smoking, alcohol
intake, physical activity, BMI,
history of type 2 diabetes
mellitus, high cholesterol,
hypertension, use of
multivitamins

Steffen LM et al,
2003, USA
Atherosclerosis
Risk in
Communities
Study
1987-1989 -
1999, 11
years
follow-up
15792 men and
women, age 45-
64 years: 214
fatal or incident
ischemic stroke
Incidence Validated
FFQ, 61
food items
Whole grain
Refined grain
0.1 serv/day
0.5
1.0
1.5
3.0
0.5 serv/day
1.5
2.0
3.0
5.0
1.00
1.11 (0.75-1.64)
0.79 (0.50-1.21)
0.89 (0.57-1.39)
0.75 (0.46-1.22)
1.00
1.10 (0.71-1.73)
1.00 (0.63-1.58)
0.68 (0.41-1.13)
0.82 (0.48-1.40)
Age at baseline, race, sex, time-
dependent energy intake,
education, smoking status, pack-
years of smoking, physical
activity, alcohol intake, HRT
(women), BMI, waist-to-hip
ratio, SBP, antihypertensive
medication use
Jacobs DR, 2007,
USA
Iowa Women’s
Health Study
1986 – 2003,
17 years
follow-up
27312 women,
age 55-69
years:
414 stroke
deaths
113 intracranial
hemorrhagic
stroke deaths
251 non-
hemorrhagic
stroke deaths
Mortality Validated
FFQ, 127
food items
Whole grains, all
Whole grains,
hemorrhagic strokes
Whole grains, non-
hemorrhagic strokes
Refined grains, all
Refined grains,
hemorrhagic strokes
Refined grains, non-
hemorrhagic strokes
1.8 serv/wk
5.6
8.8
14.5
25.6
1.8 serv/wk
5.6
8.8
14.5
25.6
1.8 serv/wk
5.6
8.8
14.5
25.6
0-5.75 serv/wk
6-9.5
9.6-13.5
14-22
≥22.5
0-5.75 serv/wk
6-9.5
9.6-13.5
14-22
≥22.5
0-5.75 serv/wk
6-9.5
9.6-13.5
14-22
1.00
0.91 (0.67-1.24)
0.84 (0.61-1.15)
0.88 (0.64-1.22)
0.85 (0.60-1.21)
1.00
1.28 (0.68-2.42)
1.33 (0.71-2.49)
1.01 (0.51-1.99)
1.28 (0.64-2.56)
1.00
0.79 (0.53-1.18)
0.74 (0.49-1.11)
0.87 (0.58-1.31)
0.88 (0.57-1.36)
1.00
1.15 (0.85-1.56)
1.09 (0.78-1.51)
0.86 (0.60-1.22)
1.30 (0.88-1.91)
1.00
0.84 (0.48-1.47)
0.82 (0.45-1.50)
0.61 (0.31-1.20)
1.10 (0.54-2.23)
1.00
1.22 (0.82-1.80)
1.16 (0.76-1.76)
0.87 (0.55-1.38)
Age, energy intake, BMI, waist-
to-hip ratio, smoking, education,
physical activity, HRT,
multivitamin supplement use,
intake of alcohol, alcohol2,
coffee, red meat, fish and
seafood, total fruit and
vegetables, mutual adjustment
between whole grains and
refined grains

≥22.5 1.19 (0.72-1.97)
Mizrahi A et al,
2009, Finland
Finnish Mobile
Clinic Health
Examination
Survey
1968-1972 -
1994, 24
years
follow-up
3932 men and
women, age 40-
74 years: 625
stroke cases
Incidence Dietary
history
interview
Cereals,
cerebrovascular
disease
Whole grains
Refined grains
Cereals, ischemic
stroke
Whole grains
Refined grains
Cereals, intracerebral
stroke
Whole grains
Refined grains
10-223/20-156 g/d
224-295/157-210
296-390/211-285
391-1535/286-1092
0-139/0-89 g/d
140-201/90-134
202-279/135-194
280-1321/195-963
0-50/0-43 g/d
51-82/44-68
83-124/69-99
125-567/100-457
10-223/20-156 g/d
224-295/157-210
296-390/211-285
391-1535/286-1092
0-139/0-89 g/d
140-201/90-134
202-279/135-194
280-1321/195-963
0-50/0-43 g/d
51-82/44-68
83-124/69-99
125-567/100-457
10-223/20-156 g/d
224-295/157-210
296-390/211-285
391-1535/286-1092
0-139/0-89 g/d
140-201/90-134
202-279/135-194
280-1321/195-963
0-50/0-43 g/d
51-82/44-68
83-124/69-99
125-567/100-457
1.00
1.09 (0.87-1.36)
1.09 (0.86-1.39)
1.09 (0.82-1.45)
1.00
0.98 (0.78-1.23)
1.18 (0.93-1.48)
1.12 (0.87-1.45)
1.00
0.93 (0.74-1.15)
0.88 (0.70-1.10)
0.88 (0.69-1.14)
1.00
0.96 (0.71-1.31)
1.12 (0.81-1.53)
0.97 (0.66-1.43)
1.00
0.95 (0.70-1.29)
1.11 (0.81-1.51)
1.06 (0.75-1.50)
1.00
0.81 (0.60-1.10)
0.95 (0.71-1.28)
0.85 (0.61-1.19)
1.00
1.72 (0.88-3.36)
0.64 (0.27-1.53)
1.14 (0.47-2.78)
1.00
1.01 (0.49-2.08)
1.31 (0.64-2.68)
1.19 (0.53-2.67)
1.00
0.70 (0.36-1.36)
0.66 (0.33-1.33)
0.66 (0.31-1.42)
Age, sex, BMI, smoking,
physical activity, serum
cholesterol, blood pressure,
energy

Larsson SC et al,
2009, Finland
Alpha-
Tocopherol,
Beta-Carotene
Cancer
Prevention
Study
1985-1988 -
2004, 13.6
years
follow-up
26556 male
smokers, age
50-69 years:
2702 cerebral
infarctions
383
intracerebral
hemorrhages
196
subarachnoid
hemorrhages
Incidence Validated
FFQ, 276
food items
Cereals, cerebral
infarction
Cereals, intracerebral
hemorrhage
Cereals, subarachnoid
hemorrhage
116.4 g/d
165.6
205.2
249.9
327.4
116.4 g/d
165.6
205.2
249.9
327.4
116.4 g/d
165.6
205.2
249.9
327.4
1.00
0.98 (0.87-1.10)
0.97 (0.85-1.10)
0.93 (0.81-1.07)
0.87 (0.74-1.03)
1.00
0.85 (0.63-1.16)
0.88 (0.64-1.22)
0.70 (0.48-1.01)
0.64 (0.41-1.01)
1.00
1.12 (0.69-1.81)
0.84 (0.50-1.42)
1.24 (0.74-2.07)
1.00 (0.54-1.84)
Age, supplementation group,
cigarettes per day, BMI, SBP,
DBP, serum total cholesterol,
serum HDL-cholesterol,
diabetes, coronary heart disease,
leisure-time physical activity,
alcohol, total energy
Oba S et al, 2010,
Japan
Takayama
Study
1992 – 1999,
7 years
follow-up
12561 men and
15301 women,
age ≥35 years:
247 stroke
deaths
126 ischemic
stroke deaths
94 hemorrhagic
stroke deaths
Mortality Validated
FFQ, 169
food items
Rice, men, total
stroke
Rice, women
Rice, men, ischemic
stroke
Rice, women
Rice, men,
hemorrhagic stroke
Rice, women
2.3 serv/d (67.6 g)
3.2
3.7
4.0
1.9 serv/d
2.3
2.7
3.2
2.3 serv/d (67.6 g)
3.2
3.7
4.0
1.9 serv/d
2.3
2.7
3.2
2.3 serv/d (67.6 g)
3.2
3.7
4.0
1.9 serv/d
2.3
2.7
3.2
1.00
0.95 (0.59-1.52)
0.53 (0.26-1.04)
0.84 (0.43-1.62)
1.00
1.47 (0.78-2.79)
1.22 (0.62-2.37)
1.37 (0.64-2.94)
1.00
0.97 (0.51-1.82)
0.52 (0.19-1.41)
1.21 (0.61-2.37)
1.00
1.53 (0.64-3.68)
1.14 (0.49-2.67)
1.67 (0.69-4.07)
1.00
0.73 (0.35-1.50)
0.39 (0.15-1.00)
0.71 (0.34-1.49)
1.00
0.98 (0.33-2.91)
1.81 (0.71-4.66)
2.36 (0.92-6.03)
Age, BMI, smoking status,
physical activity, hypertension,
education, total energy, alcohol,
dietary fiber, salt, total fat

Eshak ES et al,
2011, Japan
Japan
Collaborative
Cohort Study
1988-1990 –
2003, 14.1
years
follow-up
83752 men and
women, age 40-
79 years: 1640
stroke deaths
Mortality Validated
FFQ, 40
food items
Rice, men
Rice, women
280 g/d
420
449
583
711
279 g/d
359
420
453
560
1.00
0.96 (0.79-1.17)
0.96 (0.76-1.22)
0.78 (0.61-1.00)
1.02 (0.82-1.31)
1.00
0.85 (0.64-1.12)
0.89 (0.72-1.11)
0.89 (0.64-1.26)
0.99 (0.75-1.31)
Age, history of hypertension,
history of diabetes, BMI,
alcohol, smoking status,
exercise, walking, education,
perceived mental stress, sleep
duration, fish, meat, fruit, dairy
products, soy, total energy
Misirili G et al,
2012, Greece
European
Prospective
Investigation
into Cancer and
Nutrition -
Greece
1994-1999 –
2009, 10.6
years
follow-up
23601 men and
women, age 25-
67 years: 395
incidence cases
196 deaths
cerebro-
vascular disease
Incidence
and
mortality
FFQ, 150
food items
Cereals, incidence
Cereals, mortality
Per 70 g/d
Per 70 g/d
1.02 (0.89-1.16)
0.97 (0.79-1.19)
Age, education, smoking status,
BMI, physical activity,
hypertension, diabetes, total
energy intake
Eshak E et al,
2014, Japan
Japan Public
Health Center-
based
Prospective
Study
1990/1993 –
2007/2009,
15.2 years
follow-up
91223 men and
women, age 40-
69 years: 4395
total strokes
1777
hemorrhagic
strokes
2590 ischemic
strokes
1153 stroke
deaths
Incidence Validated
FFQ,
44/52 food
items
Rice, stroke
incidence
Rice, hemorrhagic
stroke incidence
Rice, ischemic stroke
incidence
Rice, stroke mortality
251 g/d
326
377
430
542
251 g/d
326
377
430
542
251 g/d
326
377
430
542
251 g/d
326
377
430
542
1.00
1.07 (0.93-1.17)
0.94 (0.85-1.08)
0.93 (0.84-1.13)
1.01 (0.90-1.14)
1.00
1.05 (0.90-1.22)
0.95 (0.81-1.12)
0.95 (0.81-1.11)
0.96 (0.79-1.15)
1.00
1.07 (0.92-1.23)
0.99 (0.81-
1.07)?
0.99 (0.81-1.16)
1.05 (0.90-1.22)
1.00
1.07 (0.88-1.30)
1.07 (0.88-1.32)
1.00 (0.82-1.23)
1.03 (0.82-1.30)
Age, sex, public health center
area, hypertension, diabetes, use
of lipid-lowering drugs, BMI,
smoking status, ethanol intake,
leisure-time sports activity,
occupation, seafood, meat, fruit,
vegetables, soy, SFA, sodium,
total energy, menopausal status,
HRT

Muraki I et al,
2014, USA
Nurses’ Health
Study
Nurses’ Health
Study 2
Health
Professionals
Follow-up
Study
1984-2010,
26 years
follow-up
1991-2011,
20 years
follow-up
1986-2010,
24 years
follow-up
73228 women,
age 38-63
years: 2703
stroke cases
92158 women,
age 27-44
years: 494
stroke cases
42170 men, age
40-75 years:
1475 stroke
cases
Incidence Validated
FFQ, 118-
166 food
items
White rice
Brown rice
Total rice
<1 serv/wk
1
2-4
≥5
Per 3 serv/wk
<1 serv/wk
1
2-4
≥5
Per 3 serv/wk
<1 serv/wk
1
2-4
≥5
Per 3 serv/wk
1.00
0.97 (0.90-1.03)
0.97 (0.89-1.05)
1.25 (0.99-1.57)
1.02 (0.94-1.11)
1.00
1.03 (0.94-1.14)
1.05 (0.92-1.19)
1.39 (0.99-1.96)
1.11 (0.98-1.26)
1.00
0.94 (0.87-1.01)
0.98 (0.91-1.06)
1.04 (0.89-1.21)
1.02 (0.95-1.10)
Age, ethnicity, BMI, smoking
status, alcohol, physical activity,
family history of MI,
menopausal status, OC use
(NHS2), HRT, multivitamin
use, current aspirin use,
prevalent hypertension,
prevalent hypercholesterolemia,
prevalent diabetes, total energy
intake, alternate Healthy Eating
Index score
Tognon G et al,
2014, Denmark
The 1982-83
Danish
Monitoring
trends and
determinants of
Cardiovascular
disease study
(MONICA)
1982-1983 –
2007, 14
years
follow-up
948 women and
901 men, age
NA: 167 stroke
cases
40 stroke deaths
Incidence
and
mortality
7 day food
record
Cereals, incidence
Cereals, mortality
>median vs.
<median
>median vs.
<median
0.82 (0.60-1.11)
1.00 (0.53-1.89)
Age, sex, BMI, education,
physical activity, cigarette
smoking
Johnsen NF et al,
2015, Norway,
Sweden, Denmark
HELGA Cohort
(Norwegian
Women and
Cancer Study,
Northern
Sweden Health
and Disease
Study, Danish
Diet, Cancer
and Health
Study – part of
the EPIC study)
1992-1998 –
2008-2009,
11.1
(Norway),
14.2
(Sweden),
11.9 years
(Denmark)
follow-up
120010 men
and women,
age 30-64
years: 137/143
stroke deaths
Mortality Validated
FFQ, 88
food items
(Norway),
98 food
items
(Sweden)
173 food
items
(Denmark)
Whole grain
breakfast cereals,
women
Non-white bread
Crisp bread
Total whole grain
products
0 g/d
0.8
12
50
25 g/d
80
113
180
0.6 g/d
2
6
31
56 g/d
100
131
201
1.00
0.70 (0.33-1.47)
0.73 (0.43-1.23)
0.66 (0.43-1.02)
1.00
0.86 (0.48-1.54)
1.02 (0.55-1.87)
0.75 (0.41-1.37)
1.00
1.03 (0.62-1.74)
0.91 (0.54-1.56)
1.22 (0.68-2.18)
1.00
0.78 (0.50-1.22)
0.57 (0.35-0.94)
0.85 (0.53-1.37)
Age, follow-up time, education,
smoking status/years since quit/
cigarettes per day, alcohol,
BMI, total energy

Oat
Rye
Wheat
Total whole grain
types
Whole grain
breakfast cereals,
men
Non-white bread
Crisp bread
Total whole grain
products
Oat
Rye
0 g/d
0.4
4
19
8 g/d
18
22
41
0.4 g/d
3
10
37
20 g/d
33
49
74
0 g/d
0.8
7
50
13 g/d
66
118
201
1 g/d
2
4
34
64 g/d
107
156
222
0 g/d
0.4
3
30
7 g/d
21
38
1.00
1.03 (0.64-1.67)
0.66 (0.38-1.16)
0.63 (0.34-1.15)
1.00
0.71 (0.41-1.22)
0.81 (0.47-1.37)
0.91 (0.53-1.57)
1.00
0.72 (0.44-1.18)
0.83 (0.50-1.38)
0.55 (0.23-1.30)
1.00
0.55 (0.34-0.88)
0.50 (0.31-0.82)
0.80 (0.48-1.33)
1.00
0.92 (0.59-1.45)
0.86 (0.56-1.32)
0.87 (0.47-1.28)
1.00
0.74 (0.44-1.22)
0.56 (0.35-0.91)
0.86 (0.50-1.46)
1.00
1.10 (0.67-1.79)
0.97 (0.60-1.57)
1.30 (0.71-2.39)
1.00
1.01 (0.66-1.56)
0.55 (0.35-0.87)
0.86 (0.54-1.37)
1.00
0.67 (0.42-1.07)
1.03 (0.60-1.76)
0.71 (0.41-1.21)
1.00
0.77 (0.48-1.23)
0.72 (0.39-1.31)

Wheat
Total whole grain
types
56
0.1 g/d
1
5
10
21 g/d
37
54
80
0.61 (0.36-1.05)
1.00
0.59 (0.35-0.99)
0.72 (0.41-1.27)
0.74 (0.41-1.32)
1.00
0.70 (0.44-1.10)
0.69 (0.43-1.11)
0.71 (0.44-1.15)
Wang JB et al,
2016, China
Linxian
Nutrition
Intervention
Trial cohort
1984-1991 -
2010, 19-26
years
follow-up
2445 men and
women, age 40-
69 years: 452
stroke deaths
Mortality FFQ, 64
food items
All grains
Non-whole grains
Whole grains
Per 1 time/day
Per 1 time/day
Per 1 time/day
0.90 (0.83-0.97)
0.90 (0.82-0.98)
0.93 (0.83-1.04)
Age, sex, commune, smoking,
drinking, season, BMI
BMI; body mass index, DBP; diastolic blood pressure, FFQ; food frequency questionnaire, HDL-cholesterol; high-density lipoprotein
cholesterol, HRT; hormone replacement therapy, MI; myocardial infarction, SBP; systolic blood pressure, SFA; saturated fatty acids, trans-FA:
trans fatty acids

Table S5. Whole grains and refined grains and cardiovascular disease Author,
publication year,
country
Study name Study period Number of
participants,
gender, age,
number of
cases/deaths
CVD
incidence
or
mortality
Dietary
assessment
Exposure and
subgroup
Whole grain
consumption
frequency or
amount
Relative risks
(95%
confidence
intervals)
Adjustment for confounding
factors
Jacobs DR et al,
2001, Norway
Norwegian
County Study
1977-1983 –
1994, 14.4
years
follow-up
33848 men and
women, age 35-
56 years: 758
CVD deaths
Mortality FFQ, 66
food items
Whole grain bread
score
0.05-0.60
0.83-0.83
0.90-1.13
1.35-1.80
2.25-5.40
1.00
0.93 (0.73-1.18)
0.84 (0.68-1.05)
0.84 (0.66-1.05)
0.77 (0.60-0.98)
Age, energy intake, sex,
smoking status, physical activity
during leisure, physical activity
during work, cod liver oil,
multivitamin use, SFA, SBP,
serum total cholesterol, BMI
Appleby PN et al,
2002, UK
The Health
Food Shoppers
Study
1973-1979 –
1997, 19.8
years
follow-up
10741 men and
women, age 16-
89 years: 1202
circulatory
disease deaths
Mortality FFQ Wholemeal bread
Bran cereals
Daily vs less
Daily vs less
0.86 (0.76-0.98)
1.04 (0.92-1.18)
Age at recruitment, sex,
smoking, fresh fruit, nuts/dried
fruit, raw vegetables salads,
mutual adjustment between
wholemeal bread and bran
cereals
Liu S et al, 2003,
USA
Physicians’
Health Study
1982-1988,
5.5 years
follow-up
86190 men,
mean age 40-84
years: 1381
CVD deaths
Mortality Validated
FFQ
Whole grain
breakfast cereals
Refined-grain
breakfast cereals
Total breakfast
cereals
Rarely
1 serv/wk
2-6/wk
≥1/day
Rarely
1 serv/wk
2-6/wk
≥1/day
Rarely
1 serv/wk
2-6/wk
≥1/day
1.00
0.93 (0.75-1.17)
0.82 (0.68-0.98)
0.80 (0.66-0.97)
1.00
1.18 (0.99-1.40)
1.08 (0.89-1.31)
1.04 (0.84-1.27)
1.00
1.04 (0.89-1.22)
0.93 (0.79-1.10)
0.87 (0.74-1.03)
Age, cigarette smoking, alcohol
intake, physical activity, BMI,
type 2 diabetes, high
cholesterol, hypertension, use of
multivitamins
Sahyoun NR et al,
2006, USA
NA 1981-1984 –
1995, 12-15
years
follow-up
535 men and
women, age ≥60
years: 89 CVD
deaths
Mortality 3-day food
record
Whole grain
0.31 serv/d
0.86
1.49
2.90
1.00
0.77 (0.41-1.43)
0.76 (0.41-1.41)
0.48 (0.25-0.96)
Age, sex, race, education,
marital status, smoking, alcohol
intake, exercise, BMI, energy
intake, SFA, antihypertensive or
lipid-lowering therapy
Mink PJ et al,
2007, USA
Iowa Women’s
Health Study
1986-2002,
16 years
follow-up
34489 women,
age 55-69 years:
2316 CVD
Mortality Validated
FFQ, 127
food items
Bran, added to food
0 serv/wk 0
1.00
0.86 (0.76-0.97)
Age, energy intake, marital
status, education, blood
pressure, diabetes, BMI, waist-

deaths to-hip ratio, physical activity,
smoking, HRT
Jacobs DR, 2007,
USA
Iowa Women’s
Health Study
1986-2003,
17 years
follow-up
27312 women,
age 55-69 years:
1900 CVD
deaths
Mortality Validated
FFQ, 127
food items
Whole grains
Refined grains
1.8 serv/wk
5.6
8.8
14.5
25.6
0-5.75 serv/wk
6-9.5
9.6-13.5
14-22
≥22.5
1.00
0.96 (0.84-1.10)
0.83 (0.72-0.96)
0.83 (0.71-0.96)
0.73 (0.62-0.86)
1.00
0.94 (0.82-1.08)
0.89 (0.76-1.03)
0.75 (0.64-0.88)
0.94 (0.78-1.12)
Age, energy intake, BMI, waist-
to-hip ratio, smoking, education,
physical activity, HRT,
multivitamin supplement use,
intake of alcohol, coffee, red
meat, fish and seafood, total
fruit and vegetables, mutual
adjustment between whole
grains and refined grains
Gardener H et al,
2011, USA
The Northern
Manhattan
Study
NA – NA,
9 years
follow-up
2568 men and
women, age >40
years: 314
vascular deaths
Mortality FFQ Cereals ≥61 vs. <61 g/d
0.98 (0.79-1.23) Age, sex, race-ethnicity,
education, moderate to heavy
physical activity, energy,
cigarette smoking
Eshak ES et al,
2011, Japan
Japan
Collaborative
Cohort Study
1988-1990 –
2003, 14.1
years
follow-up
83752 men and
women, age 40-
79 years: 3514
CVD deaths
Mortality Validated
FFQ, 40
food items
Rice, men
Rice, women
280 g/d
420
449
583
711
279 g/d
359
420
453
560
1.00
0.90 (0.79-1.03)
0.87 (0.74-1.02)
0.79 (0.67-0.93)
0.82 (0.70-0.97)
1.00
0.94 (0.78-1.14)
0.90 (0.77-1.05)
1.20 (0.94-1.51)
1.07 (0.88-1.34)
Age, history of hypertension,
history of diabetes, BMI,
alcohol, smoking status,
exercise, walking, education,
perceived mental stress, sleep
duration, fish, meat, fruit, dairy
products, soy, total energy
Fitzgerald KC et
al, 2012, USA
Women’s
Health Study
1992-1994 –
2004, 14.6
years
follow-up
34827 women,
age ≥45 years:
1094 CVD
cases
Incidence Validated
FFQ, 133
food items
Whole grains <0.50 serv/d
0.50-0.93
0.94-1.36
1.40-2.20
≥2.21
1.00
1.01 (0.84-1.21)
1.03 (0.86-1.24)
0.86 (0.71-1.05)
0.96 (0.79-1.17)
Age, randomization status,
smoking, postmenopausal
status, HRT, alcohol intake,
energy, physical activity,
cigarettes per day, highest
education level
Von Ruesten A
et al, 2013,
Germany
European
Prospective
Investigation
into Cancer
and Nutrition–
Potsdam
study
1994/1998–
NA,
8 years
follow-up
23531 men and
women,
age 35–65
years: 363 CVD
cases
Incidence Validated
FFQ,
148 food
items
Whole grain bread
Other bread
Grain flakes, muesli
Cornflakes, crisps
Pasta, rice
Per 50 g/d
Per 50 g/d
Per 50 g/d
Per 50 g/d
Per 100 g/d
0.96 (0.81-1.14)
0.99 (0.85-1.16)
0.54 (0.28-1.01)
1.89 (0.79-4.51)
1.01 (0.44-2.34)
Age, sex, smoking status, pack-
years of smoking, alcohol,
leisure-time physical activity,
BMI, waist-to-hip ratio,
prevalent hypertension, high
blood lipid levels, education,
vitamin supplementation, total

energy, non-consumption of the
food group, other food groups
Eshak E et al,
2014, Japan
Japan Public
Health Center-
based
Prospective
Study
1990/1993 –
2007/2009,
15.2 years
follow-up
91223 men and
women, age 40-
69 years: 2705
CVD deaths
Mortality Validated
FFQ,
44/52 food
items
Rice 251 g/d
326
377
430
542
1.00
0.96 (0.85-1.09)
1.00 (0.88-1.15)
0.81 (0.80-1.11)
0.97 (0.84-1.13)
Age, sex, public health center
area, hypertension, diabetes, use
of lipid-lowering drugs, BMI,
smoking status, ethanol intake,
leisure-time sports activity,
occupation, seafood, meat, fruit,
vegetables, soy, SFAs, sodium,
total energy, and for women:
menopausal status, HRT
Buil-Cosiales P et
al, 2014, Spain
Prevencion con
DietaMediterran
ea
(PREDIMED)
study
2003-2009 –
2012, 5.9
years
follow-up
7216 men and
women, age 55-
75 years: 103
CVD deaths
Mortality Validated
FFQ, 137
food items
Whole grains 0 g/d
1
7
33
89
1.00
0.79 (0.39-1.59)
0.76 (0.33-1.76)
0.81 (0.35-1.90)
0.73 (0.34-1.58)
Age, sex, smoking status,
diabetes, BMI, SBP, DBP,
recruitment center, statins,
alcohol, education, physical
activity, total energy,
vegetables, fruits
Atkins JL et al,
2014, United
Kingdom
British Regional
Heart Study
1998-2000 –
2010, 11.3
years
follow-up
3328 men, age
60-79 years:
582 CVD cases
327 CVD deaths
Incidence
and
mortality
Validated
FFQ, 86
food items
Cereals, incidence
Bread
Cereals, mortality
Bread
Daily vs. <1 day/wk
Whole grain vs.
none
Daily vs. <1 day/wk
Whole grain vs.
none
1.13 (0.79-1.62)
0.60 (0.22-1.65)
1.37 (0.83-2.25)
0.57 (0.14-2.40)
Age, smoking, alcohol, physical
activity, social class, BMI,
energy intake, diet score without
respective components
Muraki I et al,
2014, USA
Nurses’ Health
Study
Nurses’ Health
Study 2
Health
Professionals
Follow-up
Study
1984-2010,
26 years
follow-up
1991-2011,
20 years
follow-up
1986-2010,
24 years
follow-up
73228 women,
age 38-63 years:
5763 CVD
cases
92158 women,
age 27-44 years:
1028 CVD
cases
42170 men, age
40-75 years:
5600 CVD
cases
Incidence Validated
FFQ, 118-
166 food
items
White rice
Brown rice
Total rice
<1 serv/wk
1
2-4
≥5
Per 3 serv/wk
<1 serv/wk
1
2-4
≥5
Per 3 serv/wk
<1 serv/wk
1
2-4
≥5
Per 3 serv/wk
1.00
1.01 (0.97-1.05)
1.02 (0.97-1.07)
0.98 (0.84-1.14)
1.01 (0.96-1.06)
1.00
1.01 (0.95-1.07)
1.05 (0.97-1.13)
1.01 (0.79-1.28)
1.04 (0.96-1.13)
1.00
1.00 (0.95-1.04)
1.01 (0.96-1.06)
0.99 (0.90-1.08)
1.00 (0.96-1.05)
Age, ethnicity, BMI, smoking
status, alcohol, physical activity,
family history of MI,
menopausal status, oral
contraceptive use (NHS2),
HRT, multivitamin use, current
aspirin use, prevalent
hypertension, prevalent
hypercholesterolemia, prevalent
diabetes, total energy intake,
alternate Healthy Eating Index
score

Tognon G et al,
2014, Denmark
The 1982-83
Danish
Monitoring
trends and
determinants of
Cardiovascular
disease study
(MONICA)
1982-1983 –
2007, 14
years
follow-up
948 women and
901 men, age
NA: 755 CVD
cases
223 CVD
deaths
Incidence
and
mortality
Validated
7 day food
record
Cereals, incidence
Cereals, mortality
>median vs.
<median
>median vs.
<median
0.90 (0.78-1.04)
0.76 (0.58-1.00)
Age, sex, BMI, education,
physical activity, cigarette
smoking
Wu H et al, 2015,
USA
Nurses’ Health
Study
1984-2010,
26 years
follow-up
74341 women,
age 38-63
years: 2989
CVD deaths
Mortality Validated
FFQ, 126
food items
Whole grains
Total bran
Total germ
4.2 g/d
9.7
14.7
21.1
33.0
0.7 g/d
2.0
3.5
5.7
10.4
0.2 g/d
0.4
0.6
0.9
1.6
1.00
0.97 (0.87-1.08)
0.96 (0.86-1.08)
0.82 (0.73-0.92)
0.86 (0.76-0.96)
1.00
0.89 (0.79-0.99)
0.94 (0.83-1.07)
0.80 (0.70-0.92)
0.80 (0.70-0.91)
1.00
1.07 (0.95-1.20)
1.01 (0.89-1.15)
1.04 (0.91-1.19)
1.11 (0.97-1.27)
Age, ethnicity, BMI, smoking
status, cigarettes per day, pack-
years smoked, years since
quitting smoking, alcohol,
physical activity, family history
of diabetes, cancer and heart
disease, multivitamin use,
aspirin use, hypertension, high
cholesterol, diabetes, total
energy, healthy eating index
(excluding whole grains),
postmenopausal status, HRT
Wu H et al, 2015,
USA
Health
Professionals
Follow-up
Study
1986-2010,
24 years
follow-up
43744 men, age
32-87 years:
3621 CVD
deaths
Mortality Validated
FFQ, 131
food items
Whole grains
Total bran
Total germ
5.9 g/d
14.4
22.1
31.3
47.8
0.7 g/d
2.6
5.0
8.2
15.0
0.2 g/d
0.6
0.9
1.3
2.3
1.00
0.92 (0.84-1.02)
0.92 (0.83-1.02)
0.91 (0.82-1.01)
0.84 (0.75-0.93)
1.00
0.93 (0.84-1.04)
0.93 (0.83-1.05)
0.86 (0.77-0.97)
0.80 (0.71-0.90)
1.00
1.03 (0.93-1.14)
0.94 (0.84-1.05)
1.03 (0.92-1.16)
1.03 (0.92-1.16)
Age, ethnicity, BMI, smoking
status, cigarettes per day, pack-
years smoked, years since
quitting smoking, alcohol,
physical activity, family history
of diabetes, cancer and heart
disease, multivitamin use,
aspirin use, hypertension, high
cholesterol, diabetes, total
energy, healthy eating index
(excluding whole grains)
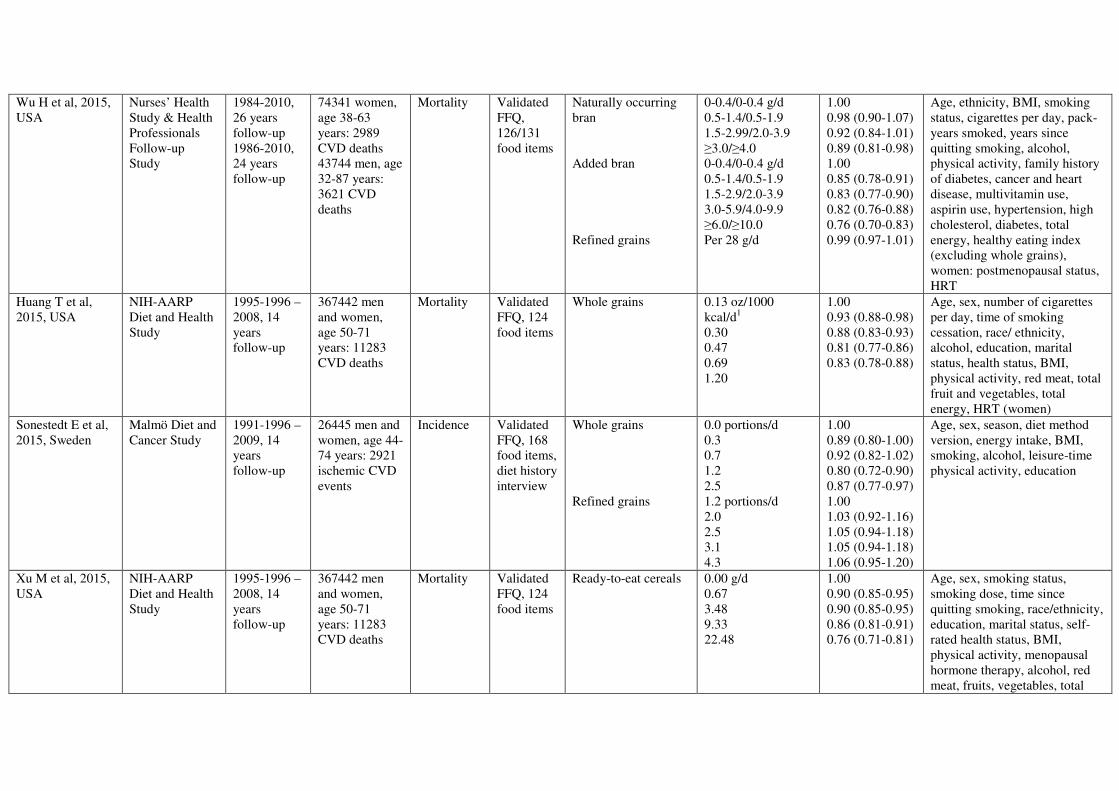
Wu H et al, 2015,
USA
Nurses’ Health
Study & Health
Professionals
Follow-up
Study
1984-2010,
26 years
follow-up
1986-2010,
24 years
follow-up
74341 women,
age 38-63
years: 2989
CVD deaths
43744 men, age
32-87 years:
3621 CVD
deaths
Mortality Validated
FFQ,
126/131
food items
Naturally occurring
bran
Added bran
Refined grains
0-0.4/0-0.4 g/d
0.5-1.4/0.5-1.9
1.5-2.99/2.0-3.9
≥3.0/≥4.0
0-0.4/0-0.4 g/d
0.5-1.4/0.5-1.9
1.5-2.9/2.0-3.9
3.0-5.9/4.0-9.9
≥6.0/≥10.0
Per 28 g/d
1.00
0.98 (0.90-1.07)
0.92 (0.84-1.01)
0.89 (0.81-0.98)
1.00
0.85 (0.78-0.91)
0.83 (0.77-0.90)
0.82 (0.76-0.88)
0.76 (0.70-0.83)
0.99 (0.97-1.01)
Age, ethnicity, BMI, smoking
status, cigarettes per day, pack-
years smoked, years since
quitting smoking, alcohol,
physical activity, family history
of diabetes, cancer and heart
disease, multivitamin use,
aspirin use, hypertension, high
cholesterol, diabetes, total
energy, healthy eating index
(excluding whole grains),
women: postmenopausal status,
HRT
Huang T et al,
2015, USA
NIH-AARP
Diet and Health
Study
1995-1996 –
2008, 14
years
follow-up
367442 men
and women,
age 50-71
years: 11283
CVD deaths
Mortality Validated
FFQ, 124
food items
Whole grains 0.13 oz/1000
kcal/d1
0.30
0.47
0.69
1.20
1.00
0.93 (0.88-0.98)
0.88 (0.83-0.93)
0.81 (0.77-0.86)
0.83 (0.78-0.88)
Age, sex, number of cigarettes
per day, time of smoking
cessation, race/ ethnicity,
alcohol, education, marital
status, health status, BMI,
physical activity, red meat, total
fruit and vegetables, total
energy, HRT (women)
Sonestedt E et al,
2015, Sweden
Malmö Diet and
Cancer Study
1991-1996 –
2009, 14
years
follow-up
26445 men and
women, age 44-
74 years: 2921
ischemic CVD
events
Incidence Validated
FFQ, 168
food items,
diet history
interview
Whole grains
Refined grains
0.0 portions/d
0.3
0.7
1.2
2.5
1.2 portions/d
2.0
2.5
3.1
4.3
1.00
0.89 (0.80-1.00)
0.92 (0.82-1.02)
0.80 (0.72-0.90)
0.87 (0.77-0.97)
1.00
1.03 (0.92-1.16)
1.05 (0.94-1.18)
1.05 (0.94-1.18)
1.06 (0.95-1.20)
Age, sex, season, diet method
version, energy intake, BMI,
smoking, alcohol, leisure-time
physical activity, education
Xu M et al, 2015,
USA
NIH-AARP
Diet and Health
Study
1995-1996 –
2008, 14
years
follow-up
367442 men
and women,
age 50-71
years: 11283
CVD deaths
Mortality Validated
FFQ, 124
food items
Ready-to-eat cereals 0.00 g/d
0.67
3.48
9.33
22.48
1.00
0.90 (0.85-0.95)
0.90 (0.85-0.95)
0.86 (0.81-0.91)
0.76 (0.71-0.81)
Age, sex, smoking status,
smoking dose, time since
quitting smoking, race/ethnicity,
education, marital status, self-
rated health status, BMI,
physical activity, menopausal
hormone therapy, alcohol, red
meat, fruits, vegetables, total

energy
Wang JB et al,
2016, China2
Linxian
Nutrition
Intervention
Trial cohort
1984-1991 -
2010, 19-26
years
follow-up
2445 men and
women, age 40-
69 years: 807
CVD deaths
Mortality FFQ, 64
food items
All grains
Non-whole grains
Whole grains
Per 1 time/day
Per 1 time/day
Per 1 time/day
0.94 (0.89-1.00)
0.96 (0.90-1.03)
0.93 (0.86-1.02)
Age, sex, commune, smoking,
drinking, season, BMI
BMI; body mass index, CVD; cardiovascular disease, DBP; diastolic blood pressure, FFQ; food frequency questionnaire, HRT; hormone
replacement therapy, SBP; systolic blood pressure, SFA; saturated fatty acids
1 The original paper reports in ounces/d, after contact with the authors it was confirmed that ounces/1000 kcal/d is correct.
2 Data for heart disease and stroke deaths were pooled using a fixed effects model.

Table S6. Whole grains and refined grains and total cancer Author,
publication year,
country
Study name Study period Number of
participants,
gender, age,
number of
cases/deaths
Total cancer
incidence or
mortality
Dietary
assessment
Exposure and
subgroup
Whole grain
consumption
frequency or
amount
Relative risks
(95%
confidence
intervals)
Adjustment for confounding
factors
Jacobs DR et al,
2001, Norway
Norwegian
County Study
1977-1983 –
1994, 14.4
years follow-
up
33848 men and
women, age
35-56 years:
870 cancer
deaths
Mortality FFQ, 66
food items
Whole grain bread
score
0.05-0.60
0.83-0.83
0.90-1.13
1.35-1.80
2.25-5.40
1.00
0.96 (0.76-1.20)
0.89 (0.73-1.08)
0.90 (0.73-1.11)
0.79 (0.62-1.02)
Age, energy, sex, smoking
status, leisure-time physical
activity, occupational physical
activity, cod liver oil use,
multivitamins, SFA, SBP,
serum total cholesterol, BMI
Appleby PN et al,
2002, UK
The Health
Food Shoppers
Study
1973-1979 –
1997, 19.8
years follow-
up
11000 men and
women, age
16-89 years:
680 cancer
deaths
Mortality FFQ Wholemeal bread
Bran cereals
Daily vs less
Daily vs less
1.01 (0.85-1.20)
0.93 (0.78-1.11)
Age at recruitment, sex,
smoking, fresh fruit, nuts/dried
fruit, raw vegetables salads,
mutual adjustment wholemeal
bread bran cereals
Khan MMH et al,
2004, Japan
The Hokkaido
Study
1984-1985 –
2002, 14.3
years follow-
up
1524 men and
1634 women,
age ≥40 years:
155/89 cancer
deaths
Mortality FFQ, 37
food items
Bread, men
Instant noodles
Noodles
Bread, women
Instant noodles
Noodles
2/wk vs 1mo 2/wk vs 1mo 2/wk vs 1mo 2/wk vs 1mo 2/wk vs 1mo 2/wk vs 1mo
0.8 (0.5-1.2)
0.9 (0.6-1.5)
1.0 (0.7-1.3)
0.9 (0.5-1.5)
0.6 (0.2-1.4)
1.2 (0.8-1.8)
Age, smoking
Age, health status, health
education, health screening,
smoking
Jacobs DR, 2007,
USA
Iowa Women’s
Health Study
1986-2003,
17 years
follow-up
27312 women,
age 55-69
years: 2099
cancer deaths
Mortality Validated
FFQ, 127
food items
Whole grains
Refined grains
1.8 serv/wk
5.6
8.8
14.5
25.6
0-5.75 serv/wk
6-9.5
9.6-13.5
14-22
≥22.5
1.00
0.86 (0.75-0.99)
0.95 (0.83-1.09)
0.83 (0.72-0.96)
0.89 (0.77-1.04)
1.00
1.00 (0.88-1.15)
0.96 (0.83-1.11)
0.98 (0.85-1.14)
0.98 (0.82-1.16)
Age, energy intake, BMI, waist-
to-hip ratio, smoking, education,
physical activity, HRT,
multivitamin supplement use,
intake of alcohol, coffee, red
meat, fish and seafood, total
fruit and vegetables, mutual
adjustment between whole
grains and refined grains

Iso H et al, 2007,
Japan
Japan
Collaborative
Cohort Study
1988-1990-
2003, ~12.8
years
follow-up
42513 men and
57777 women,
age 40-79
years: 3579/
2138 cancer
deaths
Mortality FFQ Rice, men
Rice, women
<3/d
3-4
≥5
<3/d
3-4
≥5
1.00
0.99 (0.91-1.07)
0.87 (0.80-0.96)
1.00
0.95 (0.86-1.05)
1.04 (0.91-1.18)
Age, area of study
Couto E et al,
2011, Europe
European
Prospective
Investigation
into Cancer and
Nutrition
1992-2000 –
2002-2005,
8.7 years
follow-up
142605 men
and 335873
women, age
25-70 years:
9669/21062
cancer cases
Incidence Validated
FFQs, 7-
day or 14-
day record
diaries,
diet history
Cereals Per 110 g/d 0.97 (0.95-0.98) Age, sex, centre, duration of
smoking, smoking status,
education, height, BMI, total
energy intake, physical activity,
women: age at menarche, parity,
menopausal status, oral
contraceptive use, HRT
Von Ruesten A
et al, 2013,
Germany
European
Prospective
Investigation
into Cancer
and
Nutrition–
Potsdam
study
1994/1998–
NA,
8 years
follow-up
23,531 m & w,
age 35–65
years: 844
cancer cases
Incidence Validated
FFQ,
148 food
items
Whole grain bread
Other bread
Grain flakes, muesli
Cornflakes, crisps
Pasta, rice
Per 50 g/d
Per 50 g/d
Per 50 g/d
Per 50 g/d
Per 100 g/d
0.94 (0.84-1.05)
0.98 (0.88-1.09)
0.98 (0.73-1.30)
1.10 (0.57-2.11)
0.84 (0.48-1.48)
Age, sex, smoking status, pack-
years of smoking, alcohol,
leisure-time physical activity,
BMI, waist-to-hip ratio,
prevalent hypertension, high
blood lipid levels, education,
vitamin supplementation, total
energy, non-consumption of the
food group, other food groups
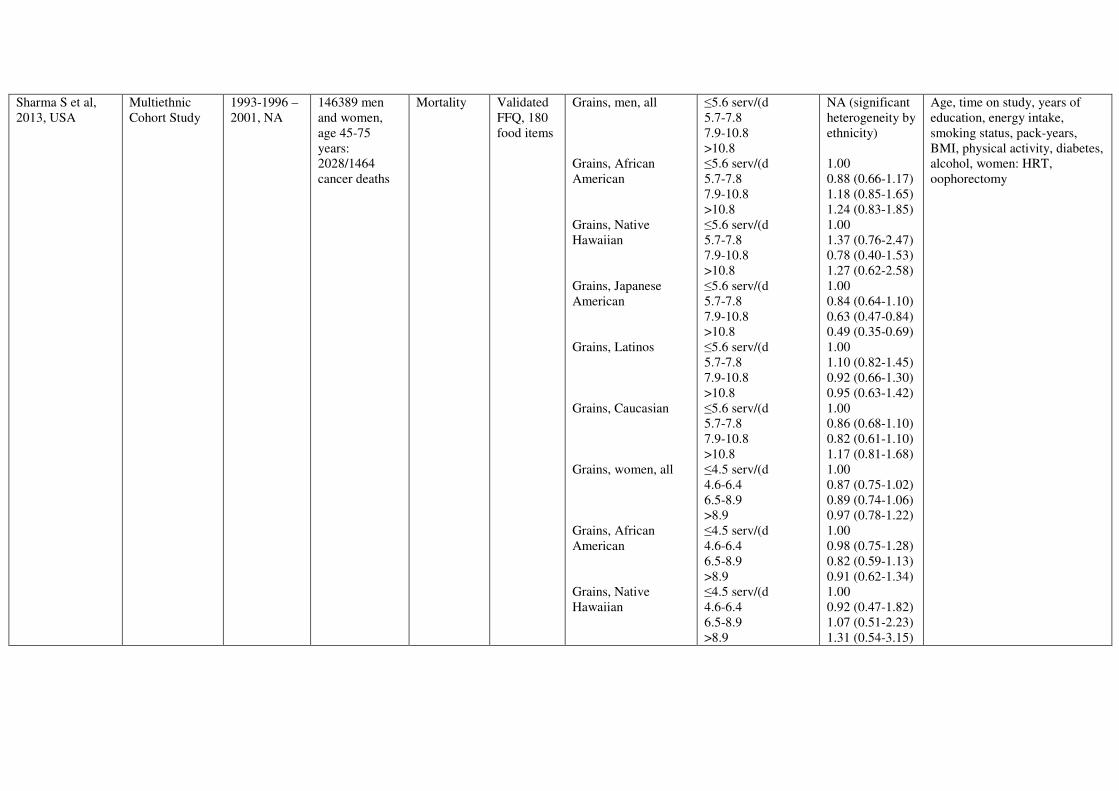
Sharma S et al,
2013, USA
Multiethnic
Cohort Study
1993-1996 –
2001, NA
146389 men
and women,
age 45-75
years:
2028/1464
cancer deaths
Mortality Validated
FFQ, 180
food items
Grains, men, all
Grains, African
American
Grains, Native
Hawaiian
Grains, Japanese
American
Grains, Latinos
Grains, Caucasian
Grains, women, all
Grains, African
American
Grains, Native
Hawaiian
≤5.6 serv/(d
5.7-7.8
7.9-10.8
>10.8
≤5.6 serv/(d
5.7-7.8
7.9-10.8
>10.8
≤5.6 serv/(d
5.7-7.8
7.9-10.8
>10.8
≤5.6 serv/(d
5.7-7.8
7.9-10.8
>10.8
≤5.6 serv/(d
5.7-7.8
7.9-10.8
>10.8
≤5.6 serv/(d
5.7-7.8
7.9-10.8
>10.8
≤4.5 serv/(d
4.6-6.4
6.5-8.9
>8.9
≤4.5 serv/(d
4.6-6.4
6.5-8.9
>8.9
≤4.5 serv/(d
4.6-6.4
6.5-8.9
>8.9
NA (significant
heterogeneity by
ethnicity)
1.00
0.88 (0.66-1.17)
1.18 (0.85-1.65)
1.24 (0.83-1.85)
1.00
1.37 (0.76-2.47)
0.78 (0.40-1.53)
1.27 (0.62-2.58)
1.00
0.84 (0.64-1.10)
0.63 (0.47-0.84)
0.49 (0.35-0.69)
1.00
1.10 (0.82-1.45)
0.92 (0.66-1.30)
0.95 (0.63-1.42)
1.00
0.86 (0.68-1.10)
0.82 (0.61-1.10)
1.17 (0.81-1.68)
1.00
0.87 (0.75-1.02)
0.89 (0.74-1.06)
0.97 (0.78-1.22)
1.00
0.98 (0.75-1.28)
0.82 (0.59-1.13)
0.91 (0.62-1.34)
1.00
0.92 (0.47-1.82)
1.07 (0.51-2.23)
1.31 (0.54-3.15)
Age, time on study, years of
education, energy intake,
smoking status, pack-years,
BMI, physical activity, diabetes,
alcohol, women: HRT,
oophorectomy

Grains, Japanes5
American
Grains, Latinos
Grains, Caucasian
≤4.5 serv/(d
4.6-6.4
6.5-8.9
>8.9
≤4.5 serv/(d
4.6-6.4
6.5-8.9
>8.9
≤4.5 serv/(d
4.6-6.4
6.5-8.9
>8.9
1.00
0.62 (0.41-0.92)
0.86 (0.56-1.32)
1.03 (0.60-1.77)
1.00
1.02 (0.68-1.52)
1.17 (0.74-1.84)
1.33 (0.77-2.28)
1.00
0.84 (0.63-1.12)
0.79 (0.56-1.12)
0.92 (0.59-1.43)
Buil-Cosiales P et
al, 2014, Spain
Prevencion con
DietaMediterran
ea
(PREDIMED)
study
2003-2009 –
2012, 5.9
years
follow-up
7216 men and
women, age
55-75 years:
169 cancer
deaths
Mortality Validated
FFQ, 137
food items
Whole grains 0 g/d
1
7
33
89
1.00
0.94 (0.55-1.62)
0.91 (0.48-1.73)
0.83 (0.40-1.69)
0.75 (0.40-1.41)
Age, sex, smoking status,
diabetes, BMI, SBP, DBP,
recruitment center, statins,
alcohol, education, physical
activity, total energy,
vegetables, fruits
Wu H et al, 2015,
USA
Nurses’ Health
Study
1984-2010,
26 years
follow-up
74341 women,
age 38-63
years: 5964
cancer deaths
Mortality Validated
FFQ, 126
food items
Whole grains
4.2 g/d
9.7
14.7
21.1
33.0
1.00
1.02 (0.94-1.10)
1.10 (1.02-1.19)
1.06 (0.98-1.15)
0.99 (0.91-1.07)
Age, ethnicity, BMI, smoking
status, cigarettes per day, pack-
years smoked, years since
quitting smoking, alcohol,
physical activity, family history
of diabetes, cancer and heart
disease, multivitamin use,
aspirin use, hypertension, high
cholesterol, diabetes, total
energy, healthy eating index
(excluding whole grains):
women: postmenopausal status,
HRT

Wu H et al, 2015,
USA
Health
Professionals
Follow-up
Study
1986-2010,
24 years
follow-up
43744 men,
age 32-87
years: 3921
cancer deaths
Mortality Validated
FFQ, 131
food items
Whole grains
5.9 g/d
14.4
22.1
31.3
47.8
1.00
1.01 (0.92-1.11)
0.98 (0.88-1.08)
1.01 (0.91-1.12)
0.95 (0.86-1.05)
Age, ethnicity, BMI, smoking
status, cigarettes per day, pack-
years smoked, years since
quitting smoking, alcohol,
physical activity, family history
of diabetes, cancer and heart
disease, multivitamin use,
aspirin use, hypertension, high
cholesterol, diabetes, total
energy, healthy eating index
(excluding whole grains)
Wu H et al, 2015,
USA
Nurses’ Health
Study & Health
Professionals
Follow-up
Study
1984-2010,
26 years
follow-up
1986-2010,
24 years
follow-up
74341 women,
age 38-63
years: 5964
cancer deaths
43744 men,
age 32-87
years: 3921
cancer deaths
Mortality Validated
FFQ,
126/131
food items
Total bran
Total germ
Naturally occurring
bran
Added bran
Refined grains
1
2
3
4
5
1
2
3
4
5
0-0.4/0-0.4 g/d
0.5-1.4/0.5-1.9
1.5-2.99/2.0-3.9
≥3.0/≥4.0
0-0.4/0-0.4 g/d
0.5-1.4/0.5-1.9
1.5-2.9/2.0-3.9
3.0-5.9/4.0-9.9
≥6.0/≥10.0
Per 28 g/d
1.00
1.06 (0.99-1.13)
1.07 (1.00-1.15)
1.11 (1.03-1.20)
1.04 (0.97-1.13)
1.00
1.04 (0.98-1.11)
1.01 (0.95-1.08)
0.96 (0.89-1.03)
0.98 (0.91-1.06)
1.00
1.02 (0.94-1.10)
1.06 (0.98-1.14)
1.02 (0.94-1.10)
1.00
1.09 (1.03-1.16)
1.09 (1.03-1.17)
1.12 (1.06-1.20)
1.04 (0.97-1.12)
0.98 (0.97-1.00)
Age, ethnicity, BMI, smoking
status, cigarettes per day, pack-
years smoked, years since
quitting smoking, alcohol,
physical activity, family history
of diabetes, cancer and heart
disease, multivitamin use,
aspirin use, hypertension, high
cholesterol, diabetes, total
energy, healthy eating index
(excluding whole grains),
women: postmenopausal status,
HRT
Huang T et al,
2015, USA
NIH-AARP
Diet and Health
Study
1995-1996 –
2009, 14
years
follow-up
367442 men
and women,
age 50-71
years: 19043
cancer deaths
Mortality Validated
FFQ, 124
food items
Whole grains 0.13 oz/1000
kcal/d1
0.30
0.47
0.69
1.20
1.00
0.94 (0.90-0.98)
0.91 (0.87-0.95)
0.88 (0.84-0.92)
0.85 (0.81-0.89)
Age, sex, number of cigarettes
per day, time of smoking
cessation, race/ ethnicity,
alcohol, education, marital
status, health status, BMI,
physical activity, red meat, total
fruit and vegetables, total
energy, HRT (women)

Xu M et al, 2015,
USA
NIH-AARP
Diet and Health
Study
1995-1996 –
2008, 14
years
follow-up
367442 men
and women,
age 50-71
years: 19043
cancer deaths
Mortality Validated
FFQ, 124
food items
Ready-to-eat cereals 0.00 g/d
0.67
3.48
9.33
22.48
1.00
0.98 (0.94-1.03)
0.95 (0.90-0.99)
0.92 (0.88-0.97)
0.90 (0.86-0.95)
Age, sex, smoking status,
smoking dose, time since
quitting smoking, race/ethnicity,
education, marital status, self-
rated health status, BMI,
physical activity, menopausal
hormone therapy, alcohol, red
meat, fruits, vegetables, total
energy

Johnsen NF et al,
2015, Norway,
Sweden, Denmark
HELGA Cohort
(Norwegian
Women and
Cancer Study,
Northern
Sweden Health
and Disease
Study, Danish
Diet, Cancer
and Health
Study – part of
the EPIC study)
1992-1998 –
2008-2009,
11.1
(Norway),
14.2
(Sweden),
11.9 years
(Denmark)
follow-up
120010 men
and women,
age 30-64
years:
1375/1775
cancer deaths
Mortality Validated
FFQ, 88
food items
(Norway),
98 food
items
(Sweden)
173 food
items
(Denmark)
Whole grain
breakfast cereals,
women
Non-white bread
Crisp bread
Total whole grain
products
Oat
Rye
Wheat
Total whole grain
types
0 g/d
0.8
12
50
25 g/d
80
113
180
0.6 g/d
2
6
31
56 g/d
100
131
201
0 g/d
0.4
4
19
8 g/d
18
22
41
0.4 g/d
3
10
37
20 g/d
33
49
74
1.00
0.98 (0.83-1.15)
0.84 (0.74-0.95)
0.85 (0.74-0.98)
1.00
1.01 (0.86-1.18)
0.93 (0.79-1.08)
0.89 (0.75-1.05)
1.00
0.89 (0.77-1.03)
0.84 (0.75-0.95)
0.87 (0.74-1.02)
1.00
0.86 (0.76-0.98)
0.85 (0.75-0.97)
0.86 (0.74-0.99)
1.00
0.89 (0.78-1.01)
0.77 (0.67-0.90)
0.84 (0.71-0.99)
1.00
0.98 (0.87-1.11)
1.00 (0.86-1.17)
0.99 (0.79-1.25)
1.00
0.76 (0.65-0.88)
0.74 (0.63-0.87)
0.74 (0.61-0.89)
1.00
0.99 (0.87-1.13)
0.94 (0.82-1.07)
0.88 (0.77-1.02)
Age, follow-up time, education,
smoking status/years since quit/
cigarettes per day, alcohol,
BMI, total energy

Whole grain
breakfast cereals,
men
Non-white bread
Crisp bread
Total whole grain
products
Oat
Rye
Wheat
Total whole grain
types
0 g/d
0.8
7
50
13 g/d
66
118
201
1 g/d
2
4
34
64 g/d
107
156
222
0 g/d
0.4
3
30
7 g/d
21
38
56
0.1 g/d
1
5
10
21 g/d
37
54
80
1.00
0.99 (0.81-1.21)
0.73 (0.63-0.85)
0.75 (0.64-0.87)
1.00
0.92 (0.76-1.12)
0.97 (0.79-1.19)
0.79 (0.64-0.97)
1.00
0.99 (0.85-1.15)
0.92 (0.79-1.07)
0.83 (0.67-1.03)
1.00
0.84 (0.72-0.98)
0.74 (0.64-0.86)
0.70 (0.60-0.81)
1.00
0.80 (0.69-0.94)
0.75 (0.64-0.89)
0.75 (0.64-0.89)
1.00
0.97 (0.82-1.14)
0.80 (0.65-0.98)
0.93 (0.78-1.11)
1.00
0.84 (0.72-0.98)
0.69 (0.58-0.82)
0.58 (0.49-0.69)
1.00
0.85 (0.73-0.99)
0.68 (0.58-0.79)
0.74 (0.63-0.87)

Zhang R et al,
2016, USA
Nurses’ Health
Study
1984-2010,
26 years
follow-up
70603
women, age
38-63 years:
15673 cancer
cases
Incidence Validated
FFQ, 126
food items
Total rice
White rice
Brown rice
<1 serv/wk
1
2-4
≥5
<1 serv/wk
1
2-4
≥5
<1 serv/wk
1
2-4
≥5
1.00
1.01 (0.97-1.05)
1.00 (0.96-1.04)
1.02 (0.93-1.12)
1.00
1.01 (0.96-1.05)
1.02 (0.97-1.06)
0.96 (0.81-1.14)
1.00
1.02 (0.95-1.10)
1.00 (0.93-1.09)
1.07 (0.84-1.38)
Age, ethnicity, BMI, smoking
status, cigarettes per day,
physical activity, family history
of cancer, multivitamin
supplement use, total energy
intake, alcohol, fruit, vegetables,
red meat, fish, nuts, whole grain
(except brown rice), sugar-
sweetened beverages, HRT
Zhang R et al,
2016, USA
Nurses’ Health
Study 2
1991-2009,
18 years
follow-up
90264
women, age
27-44 years:
5149 cancer
cases
Incidence Validated
FFQ, 133
food items
Total rice
White rice
Brown rice
<1 serv/wk
1
2-4
≥5
<1 serv/wk
1
2-4
≥5
<1 serv/wk
1
2-4
≥5
1.00
0.93 (0.86-1.00)
0.93 (0.86-0.99)
0.83 (0.73-0.94)
1.00
0.96 (0.89-1.03)
0.96 (0.90-1.03)
0.73 (0.59-0.90)
1.00
1.02 (0.93-1.13)
0.95 (0.85-1.06)
1.28 (0.96-1.70)
Age, ethnicity, BMI, smoking
status, cigarettes per day,
physical activity, family history
of cancer, multivitamin
supplement use, total energy
intake, alcohol, fruit, vegetables,
red meat, fish, nuts, whole grain
(except brown rice), sugar-
sweetened beverages, HRT
Zhang R et al,
2016, USA
Health
Professionals
Follow-up
Study
1986-2008,
22 years
follow-up
45382 men,
age 40-75
years: 10833
cancer cases
Incidence Validated
FFQ, 131
food items
Total rice
White rice
Brown rice
<1 serv/wk
1
2-4
≥5
<1 serv/wk
1
2-4
≥5
<1 serv/wk
1
2-4
≥5
1.00
0.99 (0.94-1.04)
1.00 (0.95-1.05)
1.00 (0.93-1.10)
1.00
1.02 (0.97-1.07)
1.03 (0.98-1.08)
0.91 (0.79-1.05)
1.00
1.00 (0.94-1.07)
0.96 (0.91-1.05)
0.95 (0.77-1.17)
Age, ethnicity, BMI, smoking
status, cigarettes per day,
physical activity, family history
of cancer, multivitamin
supplement use, total energy
intake, alcohol, fruit, vegetables,
red meat, fish, nuts, whole grain
(except brown rice), sugar-
sweetened beverages
BMI; body mass index, DBP; diastolic blood pressure, FFQ; food frequency questionnaire, HRT; hormone replacement therapy, SBP; systolic
blood pressure, SFA; saturated fatty acids

1 The original paper reports in ounces/d, after contact with the authors it was confirmed that ounces/1000 kcal/d is correct.
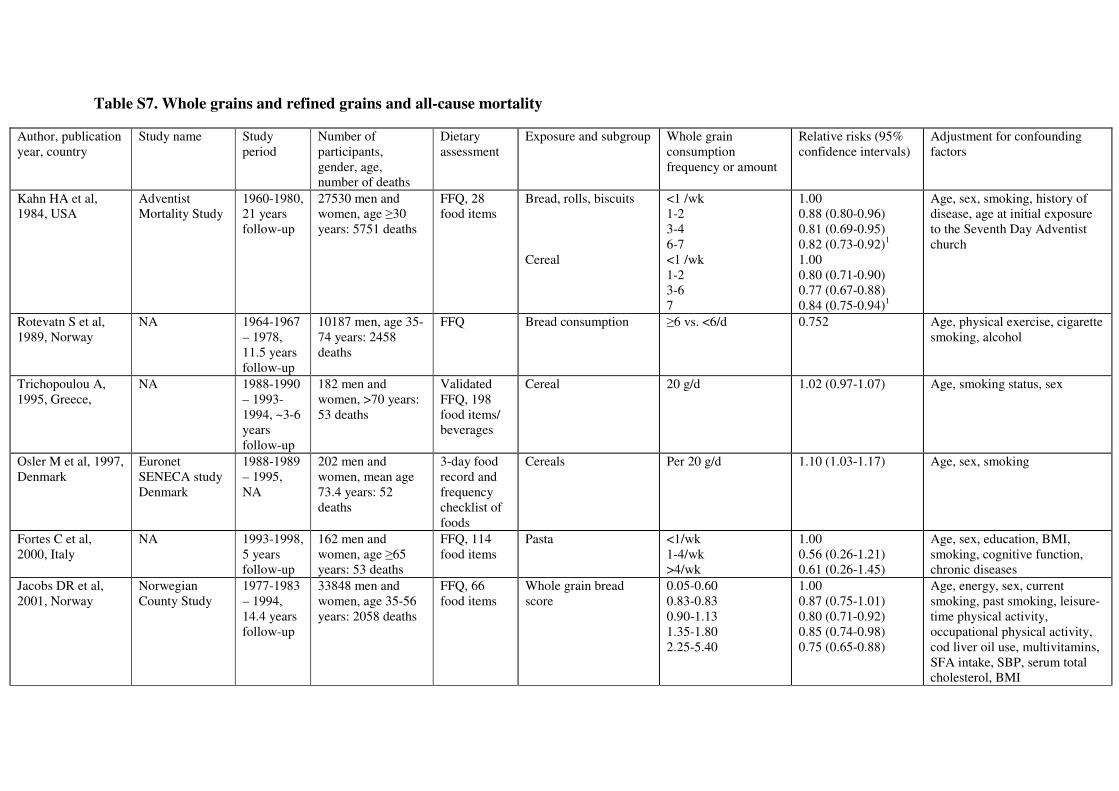
Table S7. Whole grains and refined grains and all-cause mortality
Author, publication
year, country
Study name Study
period
Number of
participants,
gender, age,
number of deaths
Dietary
assessment
Exposure and subgroup Whole grain
consumption
frequency or amount
Relative risks (95%
confidence intervals)
Adjustment for confounding
factors
Kahn HA et al,
1984, USA
Adventist
Mortality Study
1960-1980,
21 years
follow-up
27530 men and
women, age ≥30
years: 5751 deaths
FFQ, 28
food items
Bread, rolls, biscuits
Cereal
<1 /wk
1-2
3-4
6-7
<1 /wk
1-2
3-6
7
1.00
0.88 (0.80-0.96)
0.81 (0.69-0.95)
0.82 (0.73-0.92)1
1.00
0.80 (0.71-0.90)
0.77 (0.67-0.88)
0.84 (0.75-0.94)1
Age, sex, smoking, history of
disease, age at initial exposure
to the Seventh Day Adventist
church
Rotevatn S et al,
1989, Norway
NA 1964-1967
– 1978,
11.5 years
follow-up
10187 men, age 35-
74 years: 2458
deaths
FFQ Bread consumption
≥6 vs. <6/d
0.752
Age, physical exercise, cigarette
smoking, alcohol
Trichopoulou A,
1995, Greece,
NA 1988-1990
– 1993-
1994, ~3-6
years
follow-up
182 men and
women, >70 years:
53 deaths
Validated
FFQ, 198
food items/
beverages
Cereal
20 g/d
1.02 (0.97-1.07)
Age, smoking status, sex
Osler M et al, 1997,
Denmark
Euronet
SENECA study
Denmark
1988-1989
– 1995,
NA
202 men and
women, mean age
73.4 years: 52
deaths
3-day food
record and
frequency
checklist of
foods
Cereals
Per 20 g/d
1.10 (1.03-1.17)
Age, sex, smoking
Fortes C et al,
2000, Italy
NA 1993-1998,
5 years
follow-up
162 men and
women, age ≥65
years: 53 deaths
FFQ, 114
food items
Pasta
<1/wk
1-4/wk
>4/wk
1.00
0.56 (0.26-1.21)
0.61 (0.26-1.45)
Age, sex, education, BMI,
smoking, cognitive function,
chronic diseases
Jacobs DR et al,
2001, Norway
Norwegian
County Study
1977-1983
– 1994,
14.4 years
follow-up
33848 men and
women, age 35-56
years: 2058 deaths
FFQ, 66
food items
Whole grain bread
score
0.05-0.60
0.83-0.83
0.90-1.13
1.35-1.80
2.25-5.40
1.00
0.87 (0.75-1.01)
0.80 (0.71-0.92)
0.85 (0.74-0.98)
0.75 (0.65-0.88)
Age, energy, sex, current
smoking, past smoking, leisure-
time physical activity,
occupational physical activity,
cod liver oil use, multivitamins,
SFA intake, SBP, serum total
cholesterol, BMI

Appleby PN et al,
2002, UK
The Health
Food Shoppers
Study
1973-1979
– 1997,
19.8 years
follow-up
11000 men and
women, age 16-89
years: 2529 deaths
FFQ Wholemeal bread
Bran cereals
Daily vs less
Daily vs less
0.89 (0.82-0.98)
1.02 (0.94-1.12)
Age at recruitment, sex,
smoking, fresh fruit, nuts/dried
fruit, raw vegetables salads,
mutual adjustment between
wholemeal bread and
bran cereals
Liu S et al, 2003,
USA
Physicians’
Health Study
1982-1988,
5.5 years
follow-up
86190 men, age 40-
84 years: 3114
deaths
Validated
FFQ
Whole grain breakfast
cereals
Refined-grain breakfast
cereals
Total breakfast cereals
Rarely
1 serv/wk
2-6/wk
≥1/day
Rarely
1 serv/wk
2-6/wk
≥1/day
Rarely
1 serv/wk
2-6/wk
≥1/day
1.00
0.88 (0.76-1.01)
0.85 (0.74-0.97)
0.83 (0.73-0.94)
1.00
1.15 (1.02-1.29)
1.08 (0.95-1.24)
1.09 (0.95-1.25)
1.00
1.02 (0.92-1.14)
0.94 (0.84-1.05)
0.92 (0.82-1.02)
Age, cigarette smoking, alcohol
intake, physical activity, BMI,
diabetes mellitus, high
cholesterol, hypertension,
multivitamin use
Steffen LM et al,
2003, USA
Atherosclerosis
Risk in
Communities
Study
1987-1989
- 1999, 11
years
follow-up
11940 men and
women, age 45-64
years: 867 deaths
Validated
FFQ, 61
food items
Whole grain
Refined grain
0.1 serv./day
0.5
1.0
1.5
3.0
0.5
1.0
2.0
3.0
5.0
1.00
0.96 (0.79-1.17)
0.80 (0.65-0.99)
0.87 (0.70-1.08)
0.77 (0.61-0.97)
1.00
0.96 (0.75-1.23)
1.03 (0.81-1.31)
0.97 (0.76-1.23)
1.08 (0.83-1.40)
Age at baseline, race, sex, time-
dependent energy intake,
education, smoking status, pack-
years of smoking, physical
activity, alcohol intake, HRT-
women, BMI, waist-to-hip ratio,
SBP, antihypertensive
medication use
Trichopoulou A et
al, 2005, Greece
European
Prospective
Investigation
into Cancer and
Nutrition –
Elderly Study
1992-2000
– 1999-
2003, 7.4
years
follow-up
74607 men and
women, age 60
years: 4047 deaths
Validated
FFQs, food
records
Cereals Per 104 g/d
0.94 (0.91-0.98) Age, sex, country, diabetes,
waist-to-hip ratio, BMI,
education, smoking status,
occupational physical activity,
leisure-time physical activity,
alcohol, total energy
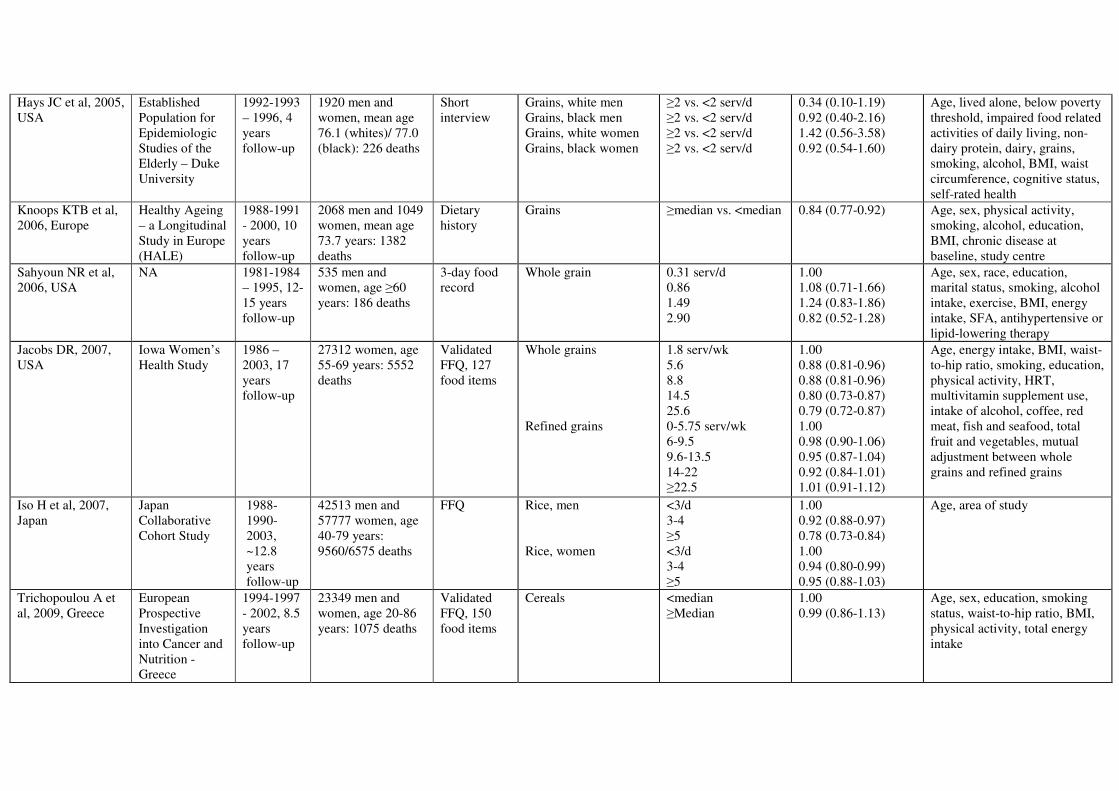
Hays JC et al, 2005,
USA
Established
Population for
Epidemiologic
Studies of the
Elderly – Duke
University
1992-1993
– 1996, 4
years
follow-up
1920 men and
women, mean age
76.1 (whites)/ 77.0
(black): 226 deaths
Short
interview
Grains, white men
Grains, black men
Grains, white women
Grains, black women
≥2 vs. <2 serv/d
≥2 vs. <2 serv/d
≥2 vs. <2 serv/d
≥2 vs. <2 serv/d
0.34 (0.10-1.19)
0.92 (0.40-2.16)
1.42 (0.56-3.58)
0.92 (0.54-1.60)
Age, lived alone, below poverty
threshold, impaired food related
activities of daily living, non-
dairy protein, dairy, grains,
smoking, alcohol, BMI, waist
circumference, cognitive status,
self-rated health
Knoops KTB et al,
2006, Europe
Healthy Ageing
– a Longitudinal
Study in Europe
(HALE)
1988-1991
- 2000, 10
years
follow-up
2068 men and 1049
women, mean age
73.7 years: 1382
deaths
Dietary
history
Grains ≥median vs. <median
0.84 (0.77-0.92) Age, sex, physical activity,
smoking, alcohol, education,
BMI, chronic disease at
baseline, study centre
Sahyoun NR et al,
2006, USA
NA 1981-1984
– 1995, 12-
15 years
follow-up
535 men and
women, age ≥60
years: 186 deaths
3-day food
record
Whole grain
0.31 serv/d
0.86
1.49
2.90
1.00
1.08 (0.71-1.66)
1.24 (0.83-1.86)
0.82 (0.52-1.28)
Age, sex, race, education,
marital status, smoking, alcohol
intake, exercise, BMI, energy
intake, SFA, antihypertensive or
lipid-lowering therapy
Jacobs DR, 2007,
USA
Iowa Women’s
Health Study
1986 –
2003, 17
years
follow-up
27312 women, age
55-69 years: 5552
deaths
Validated
FFQ, 127
food items
Whole grains
Refined grains
1.8 serv/wk
5.6
8.8
14.5
25.6
0-5.75 serv/wk
6-9.5
9.6-13.5
14-22
≥22.5
1.00
0.88 (0.81-0.96)
0.88 (0.81-0.96)
0.80 (0.73-0.87)
0.79 (0.72-0.87)
1.00
0.98 (0.90-1.06)
0.95 (0.87-1.04)
0.92 (0.84-1.01)
1.01 (0.91-1.12)
Age, energy intake, BMI, waist-
to-hip ratio, smoking, education,
physical activity, HRT,
multivitamin supplement use,
intake of alcohol, coffee, red
meat, fish and seafood, total
fruit and vegetables, mutual
adjustment between whole
grains and refined grains
Iso H et al, 2007,
Japan
Japan
Collaborative
Cohort Study
1988-
1990-
2003,
~12.8
years
follow-up
42513 men and
57777 women, age
40-79 years:
9560/6575 deaths
FFQ Rice, men
Rice, women
<3/d
3-4
≥5
<3/d
3-4
≥5
1.00
0.92 (0.88-0.97)
0.78 (0.73-0.84)
1.00
0.94 (0.80-0.99)
0.95 (0.88-1.03)
Age, area of study
Trichopoulou A et
al, 2009, Greece
European
Prospective
Investigation
into Cancer and
Nutrition -
Greece
1994-1997
- 2002, 8.5
years
follow-up
23349 men and
women, age 20-86
years: 1075 deaths
Validated
FFQ, 150
food items
Cereals <median
≥Median
1.00
0.99 (0.86-1.13)
Age, sex, education, smoking
status, waist-to-hip ratio, BMI,
physical activity, total energy
intake

Buckland G et al,
2011, Spain
European
Prospective
Investigation
into Cancer and
Nutrition –
Spain cohort
1992/1996
- 2008,
13.4 years
follow-up
40622 men and
women, age 26-69
years: 1855 deaths
Validated
DHQ, 600
food items
Cereals
<151.8 g/d
151.8-<214.0
≥214.0
1.00
0.92 (0.82-1.03)
0.91 (0.81-1.03)
Age, sex, centre, BMI, waist
circumference, education level,
physical activity, smoking status
and intensity, total energy intake
Olsen A et al, 2011,
Denmark
Diet, Cancer,
and Health
Study
1993-1997
– 2008, 12
years
follow-up
50290 men and
women, age 50-64
years: 4126 deaths
Validated
FFQ, 192
food items
Rye bread, men
Oatmeal
Rye bread, women
Oatmeal
<63 g/d
≥63
<21 g/d
≥21
<63 g/d
≥63
<21 g/d
≥21
1.00
0.84 (0.75-0.94)
1.00
0.91 (0.82-1.02)
1.00
0.90 (0.80-1.01)
1.00
0.97 (0.84-1.11)
Age, time under study, smoking
status, smoking duration,
current tobacco consumption,
time since cessation, alcohol,
education, participation in
sports, time spent in sports per
week, BMI, red meat, processed
meat, total energy, fish,
cabbages, apples and pears, root
vegetables
Van den Brandt PA
et al, 2011,
Netherlands
Netherlands
Cohort Study
1986-1996,
~11 years
follow-up
120852 men and
women, age 55-69
years: 9691 deaths
3576 subcohort
members
Validated
FFQ, 150
food items
Whole grains, men
Whole grains, women
Per 10.6 g/d
Per 13.5 g/d
1.01 (0.99-1.02)
1.00 (0.98-1.03)
Age, cigarette smoking,
cigarettes per day, years of
smoking, BMI, nonoccupational
physical activity, hypertension,
education, energy intake
Tognon G et al,
2011, Sweden
Gerontological
and Geriatric
Population
Studies in
Gothenburg
1971,
1981,
1992, 2000
– 2009, 8.5
years
follow-up
1037 men and
women, age 70
years: 630 deaths
Dietary
history
Whole grains cereals
Cereals
H vs. l
H vs. l
0.85 (0.73-1.00)
1.01 (0.86-1.19)
Age, sex, baseline BMI, waist
circumference, physical activity,
marital status, smoking status,
birth cohort, education
Martinez-Gonzalez
MA et al, 2012,
Spain
Seguimiento
Universidad de
Navarra Project
1999 –
2009, 6.8
years
follow-up
15535 men and
women, mean age
38 years: 185
deaths
Validated
FFQ, 136
food items
Cereals
≥median vs. <median 0.83 (0.54-1.27) Age, years of university
education, BMI, smoking,
physical activity, hours spent
watching television, history of
depression, hypertension,
hypercholesterolemia, total
energy, egg intake, potato,
adoption of special diets,
MUFA/SFA ratio, fruits/nuts,
vegetables, legumes, fish,
meat/meat products, dairy,
alcohol

Sluik D et al, 2014,
Europe
European
Prospective
Investigation
into Cancer and
Nutrition
1992-2000
- NA, 9.9
years
follow-up
265295 men and
women, age 30-70
years: 830/12135
deaths (diabetes/no
diabetes)
Validated
FFQs, food
records and
question-
naires
Pasta, diabetes
Rice
Bread
Breakfast cereals
Pasta, no diabetes
Rice
Bread
Breakfast cereals
Per 10 g/d
Per 10 g/d
Per 100 g/d2
Per 10 g/d
Per 10 g/d
Per 10 g/d
Per 100 g/d2
Per 10 g/d
0.93 (0.90-0.96)
0.93 (0.86-1.00)
0.87 (0.71-1.07)
1.00 (0.97-1.02)
0.99 (0.98-1.00)
0.96 (0.94-0.98)
0.81 (0.76-0.82)
0.97 (0.97-0.98)
Age, centre, sex, prevalence of
heart disease, cancer, stroke,
education, diabetes medication
use, alcohol, smoking behavior,
physical activity, underlying
dietary patterns
Li K et al, 2014,
Germany
European
Prospective
Investigation
into Cancer and
Nutrition -
Heidelberg
Cohort
1994-1998
– 2009, 11
years
follow-up
10235 men and
12234 women, age
≥40 years: 1599
deaths
Validated
FFQ, 148
food items
Cereals, men
Cereals, women
Low vs. high
Low vs. high
1.08 (0.96-1.23)
1.04 (0.86-1.26)
Age, smoking status, duration
and cigarettes per day, BMI,
alcohol, leisure-time physical
activity, red and processed
meat, vegetables and fruits, fish,
dairy products
Tognon G et al,
2014, Denmark
The 1982-83
Danish
Monitoring
trends and
determinants of
Cardiovascular
disease study
(MONICA)
1982-1983
– 2007, 14
years
follow-up
948 women and
901 men, age NA:
553 deaths
7 day food
record
Cereals
>median vs. <median 0.97 (0.82-1.15)
Age, sex, BMI, education,
physical activity, cigarette
smoking
Atkins JL et al,
2014, United
Kingdom
British Regional
Heart Study
1998-2000
– 2010,
11.3 years
follow-up
3328 men, age 60-
79 years: 933
deaths
Validated
FFQ, 86
food items
Cereals
Bread
Daily vs. <1 day/wk
Whole grain vs. none
1.15 (0.87-1.52)
0.77 (0.32-1.90)
Age, smoking, alcohol, physical
activity, social class, BMI,
energy intake, diet score without
respective components
Buil-Cosiales P et
al, 2014, Spain
Prevencion con
DietaMediterran
ea
(PREDIMED)
study
2003-2009
– 2012, 5.9
years
follow-up
7216 men and
women, age 55-75
years: 425 deaths
Validated
FFQ, 137
food items
Whole grains, baseline
Whole grains, updated
0 g/d
5
19
84
0 g/d
1
7
33
89
1.00
0.78 (0.52-1.17)
0.67 (0.43-1.04)
0.92 (0.64-1.33)
1.00
0.90 (0.65-1.26)
0.81 (0.55-1.19)
0.90 (0.63-1.30)
0.93 (0.65-1.31)
Age, sex, smoking status,
diabetes, BMI, SBP, DBP,
intervention group, recruitment
center, statins, alcohol,
education, physical activity,
total energy, vegetables, fruits
Wu H et al, 2015,
USA
Nurses’ Health
Study
1984-2010,
26 years
follow-up
74341 women, age
38-63 years: 15106
deaths
Validated
FFQ, 126
food items
Whole grains
4.2 g/d
9.7
14.7
1.00
0.98 (0.93-1.03)
1.00 (0.95-1.05)
Age, ethnicity, BMI, smoking
status, cigarettes per day, pack-
years smoked, years since

21.1
33.0
0.94 (0.89-0.99)
0.88 (0.84-0.93)
quitting smoking, alcohol,
physical activity, family history
of diabetes, cancer and heart
disease, multivitamin use,
aspirin use, hypertension, high
cholesterol, diabetes, total
energy, healthy eating index
(including fruits, vegetables,
nuts and legumes, red or
processed meat, sugar-
sweetened beverages, alcohol,
sodium, trans fat, long-chain n-3
FA, other PUFAs, but excluding
whole grains), postmenopausal
status, HRT
Wu H et al, 2015,
USA
Health
Professionals
Follow-up
Study
1986-2010,
24 years
follow-up
43744 men, age 32-
87 years: 11814
deaths
Validated
FFQ, 133
food items
Whole grains
5.9 g/d
14.4
22.1
31.3
47.8
1.00
1.00 (0.94-1.05)
0.97 (0.91-1.02)
1.01 (0.95-1.07)
0.95 (0.89-1.00)
Age, ethnicity, BMI, smoking
status, cigarettes per day, pack-
years smoked, years since
quitting smoking, alcohol,
physical activity, family history
of diabetes, cancer and heart
disease, multivitamin use,
aspirin use, hypertension, high
cholesterol, diabetes, total
energy, healthy eating index
(including fruits, vegetables,
nuts and legumes, red or
processed meat, sugar-
sweetened beverages, alcohol,
sodium, trans fat, long-chain n-3
FA, other PUFAs, but excluding
whole grains)
Wu H et al, 2015,
USA
Nurses’ Health
Study & Health
Professionals
Follow-up
Study
1984-2010,
26 years
follow-up
1986-2010,
24 years
follow-up
74341 women, age
38-63 years: 15106
deaths
43744 men, age 32-
87 years: 11814
deaths
Validated
FFQ,
Total bran
Total germ
1
2
3
4
5
1
2
1.00
1.00 (0.96-1.04)
0.99 (0.95-1.04)
1.00 (0.95-1.04)
0.94 (0.90-0.99)
1.00
1.02 (0.98-1.06)
Age, ethnicity, BMI, smoking
status, cigarettes per day, pack-
years smoked, years since
quitting smoking, alcohol,
physical activity, family history
of diabetes, cancer and heart
disease, multivitamin use,

Naturally occurring
bran
Added bran
Refined grains
3
4
5
0-0.4/0-0.4 g/d
0.5-1.4/0.5-1.9
1.5-2.99/2.0-3.9
≥3.0/≥4.0
0-0.4/0-0.4 g/d
0.5-1.4/0.5-1.9
1.5-2.9/2.0-3.9
3.0-5.9/4.0-9.9
≥6.0/≥10.0
Per 28 g/d
0.98 (0.94-1.03)
0.97 (0.93-1.02)
1.00 (0.96-1.05)
1.00
0.99 (0.94-1.03)
0.98 (0.93-1.02)
0.93 (0.89-0.98)
1.00
0.99 (0.95-1.02)
0.99 (0.95-1.03)
1.00 (0.97-1.04)
0.93 (0.89-0.97)
0.98 (0.97-0.99)
aspirin use, hypertension, high
cholesterol, diabetes, total
energy, healthy eating index
(including fruits, vegetables,
nuts and legumes, red or
processed meat, sugar-
sweetened beverages, alcohol,
sodium, trans fat, long-chain n-3
FA, other PUFAs, but excluding
whole grains), women:
postmenopausal status, HRT
Boggs DA et al,
2015, USA
Black Women’s
Health Study
1995-2001
– 2011, 16
years
follow-up
37001 women, age
30-69 years: 1678
deaths
Validated
FFQ, 68
food items
Whole grains 0.01 serv/d
0.11
0.32
0.62
1.44
1.00
0.96 (0.83-1.12)
0.82 (0.70-0.97)
0.85 (0.73-0.99)
0.75 (0.64-0.89)
Age, total energy intake,
education, marital status,
vigorous exercise, TV watching,
smoking, alcohol, vegetables,
fruits, nuts/legumes, low-fat
dairy, red or processed meat,
sugar-sweetened beverages,
sodium
Huang T et al,
2015, USA
NIH-AARP
Diet and Health
Study
1995-1996
– 2009, 14
years
follow-up
367442 men and
women, age 50-71
years: 46067 deaths
Validated
FFQ, 124
food items
Whole grains 0.13 oz/1000 kcal/d3
0.30
0.47
0.69
1.20
1.00
0.93 (0.90-0.95)
0.89 (0.87-0.92)
0.85 (0.82-0.87)
0.83 (0.81-0.86)
Age, sex, number of cigarettes
per day, time of smoking
cessation, race/ ethnicity,
alcohol, education, marital
status, health status, BMI,
physical activity, red meat, total
fruit and vegetables, total
energy, HRT (women)
Xu M et al, 2015,
USA
NIH-AARP
Diet and Health
Study
1995-1996
– 2008, 14
years
follow-up
367442 men and
women, age 50-71
years: 46067 deaths
Validated
FFQ, 124
food items
Ready-to-eat cereals 0.00 g/d
0.67
3.48
9.33
22.48
1.00
0.94 (0.92-0.97)
0.92 (0.89-0.95)
0.88 (0.86-0.91)
0.85 (0.83-0.88)
Age, sex, smoking status,
smoking dose, time since
quitting smoking, race/ethnicity,
education, marital status, self-
rated health status, BMI,
physical activity, menopausal
hormone therapy, alcohol, red
meat, fruits, vegetables, total
energy

Prinelli F et al,
2015, Italy
NA 1991-1995
– 2012,
17.4 years
follow-up
974 men and
women, age 40-74
years: 193 deaths
FFQ, 158
food items
Cereals >median vs. ≤median 0.91 (0.66-1.26) Age, sex, education, BMI,
physical activity, smoking
status, time spent watching TV,
energy intake, vegetables,
legumes, fruits, potatoes, fish
and seafood, dairy products, red
meat and meat products,
poultry, olive oil, ethanol
Roswall N et al,
2015, Sweden
Swedish
Women’s
Lifestyle and
Health Cohort
1991-1992
- 2012,
21.3 years
follow-up
44961 women, age
29-49 years: 1855
deaths
Validated
FFQ, ~80
food items
Whole grain bread
Oatmeal
<median
≥median
<median
≥median
1.00
0.83 (0.76-0.92)
1.00
0.99 (0.90-1.09)
Age, smoking status, duration,
current tobacco consumption,
time since smoking cessation,
education, BMI, alcohol, red
meat, processed meat, energy
intake
Johnsen NF et al,
2015, Norway,
Sweden, Denmark
HELGA Cohort
(Norwegian
Women and
Cancer Study,
Northern
Sweden Health
and Disease
Study, Danish
Diet, Cancer
and Health
Study – part of
the EPIC study)
1992-1998
– 2008-
2009, 11.1
(Norway),
14.2
(Sweden),
11.9 years
(Denmark)
follow-up
120010 men and
women, age 30-64
years: 4181/3658
deaths
Validated
FFQ, 88
food items
(Norway),
98 food
items
(Sweden)
173 food
items
(Denmark)
Whole grain breakfast
cereals, women
Non-white bread
Crisp bread
Total whole grain
products
Oat
Rye
Wheat
0 g/d
0.8
12
50
25 g/d
80
113
180
0.6 g/d
2
6
31
56 g/d
100
131
201
0 g/d
0.4
4
19
8 g/d
18
22
41
0.4 g/d
1.00
0.77 (0.67-0.89)
0.79 (0.71-0.88)
0.75 (0.69-0.82)
1.00
0.84 (0.76-0.93)
0.74 (0.65-0.84)
0.72 (0.65-0.81)
1.00
0.90 (0.82-0.99)
0.86 (0.78-0.94)
0.91 (0.81-1.01)
1.00
0.78 (0.71-0.86)
0.77 (0.71-0.85)
0.68 (0.62-0.75)
1.00
0.85 (0.78-0.93)
0.74 (0.67-0.82)
0.78 (0.70-0.87)
1.00
0.92 (0.84-1.01)
0.81 (0.73-0.90)
0.93 (0.83-1.03)
1.00
Age, follow-up time, education,
smoking status/years since quit/
cigarettes per day, alcohol,
BMI, total energy
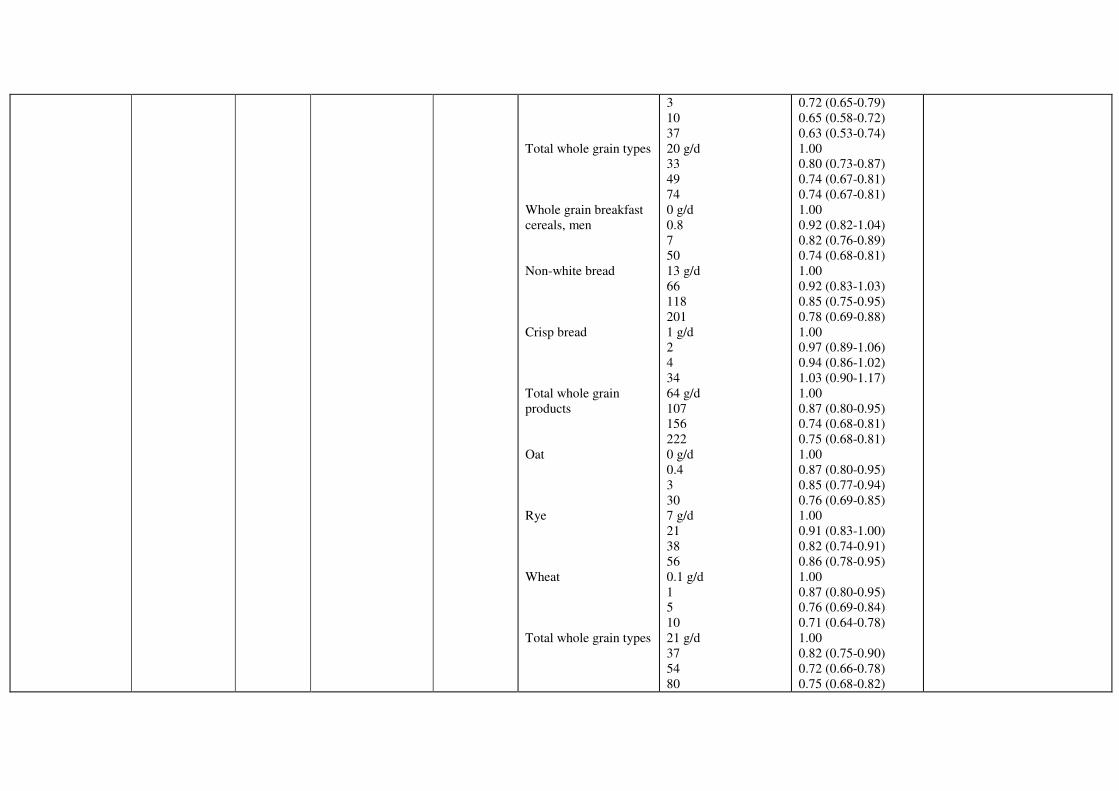
Total whole grain types
Whole grain breakfast
cereals, men
Non-white bread
Crisp bread
Total whole grain
products
Oat
Rye
Wheat
Total whole grain types
3
10
37
20 g/d
33
49
74
0 g/d
0.8
7
50
13 g/d
66
118
201
1 g/d
2
4
34
64 g/d
107
156
222
0 g/d
0.4
3
30
7 g/d
21
38
56
0.1 g/d
1
5
10
21 g/d
37
54
80
0.72 (0.65-0.79)
0.65 (0.58-0.72)
0.63 (0.53-0.74)
1.00
0.80 (0.73-0.87)
0.74 (0.67-0.81)
0.74 (0.67-0.81)
1.00
0.92 (0.82-1.04)
0.82 (0.76-0.89)
0.74 (0.68-0.81)
1.00
0.92 (0.83-1.03)
0.85 (0.75-0.95)
0.78 (0.69-0.88)
1.00
0.97 (0.89-1.06)
0.94 (0.86-1.02)
1.03 (0.90-1.17)
1.00
0.87 (0.80-0.95)
0.74 (0.68-0.81)
0.75 (0.68-0.81)
1.00
0.87 (0.80-0.95)
0.85 (0.77-0.94)
0.76 (0.69-0.85)
1.00
0.91 (0.83-1.00)
0.82 (0.74-0.91)
0.86 (0.78-0.95)
1.00
0.87 (0.80-0.95)
0.76 (0.69-0.84)
0.71 (0.64-0.78)
1.00
0.82 (0.75-0.90)
0.72 (0.66-0.78)
0.75 (0.68-0.82)

Shi Z et al, 2015,
China
Chinese
Longitudinal
Health
Longevity
Survey
1998-1999
- 2011, 4.3
years
follow-up
8959 men and
women, age ≥80
years: 6626 deaths
FFQ, 10
items
Staple food (total
grains: rice, corn,
wheat, other)
≤200 g/d
250-300
350-400
≥450
1.00
0.92 (0.86-0.98)
0.92 (0.85-0.99)
0.91 (0.84-0.98)
Age, sex, job before 60 years
age, residence, smoking,
alcohol, physical activity,
number of chronic diseases,
fruit and vegetables
Wang JB et al,
2016, China2
Linxian
Nutrition
Intervention
Trial cohort
1984-1991
- 2010, 19-
26 years
follow-up
2445 men and
women, age 40-69
years: 1501 deaths
FFQ, 64
food items
All grains
Non-whole grains
Whole grains
Per 1 time/day
Per 1 time/day
Per 1 time/day
0.96 (0.93-1.00)
0.96 (0.92-1.01)
0.98 (0.93-1.05)
Age, sex, commune, smoking,
drinking, season, BMI
Bongard V et al,
2016, France
MONitoring of
trends and
determinants in
CArdiovascular
disease
(MONICA)
Project
1995-1997
- 2010,
14.8 years
follow-up
960 men, age 45-64
years: 150 deaths
3-day food
record
Cereals
Bread
<21 g/d
21-<47
47-<78
≥78
<80 g/d
80-<120
120-<170
≥170
1.00
0.60 (0.39-0.92)
0.50 (0.31-0.81)
0.76 (0.48-1.19)
1.00
0.69 (0.45-1.07)
0.43 (0.26-0.70)
0.80 (0.51-1.26)
Age, center, payment of income
tax, obesity, alcohol, smoking
status, physical activity,
presence of a serious chronic
condition, diet quality score
BMI; body mass index, DBP; diastolic blood pressure, FA; fatty acids, FFQ; food frequency questionnaire, HRT; hormone replacement therapy,
MUFA; monounsaturated fatty acids, PUFA; polyunsaturated fatty acids, SBP; systolic blood pressure, SFA; saturated fatty acids, TV; television 1 The study reported 99% confidence intervals which have been recalculated to 95% confidence intervals.
2 The original paper reports per 10 g/d for bread, but after contact with authors it was confirmed that 100 g/d is correct.
3 The original paper reports in ounces/d, after contact with the authors it was confirmed that ounces/1000 kcal/d is correct.

Table S8. Whole grains and refined grains and respiratory disease mortality Author,
publication year,
country
Study name Study period Number of
participants,
gender, age,
number of
cases/deaths
Dietary
assessment
Exposure and subgroup Whole grain
consumption
frequency or amount
Relative risks (95%
confidence intervals)
Adjustment for confounding
factors
Jacobs DR, 2007,
USA
Iowa Women’s
Health Study
1986 – 2003,
17 years
follow-up
27312 women, age
55-69 years: 569
respiratory disease
deaths
Validated
FFQ, 127
food items
Whole grains
1.8 serv/wk
5.6
8.8
14.5
25.6
1.00
0.65 (0.51-0.83)
0.65 (0.50-0.84)
0.58 (0.44-0.76)
0.60 (0.46-0.80)
Age, energy intake, BMI, waist-
to-hip ratio, smoking, education,
physical activity, HRT,
multivitamin supplement use,
intake of alcohol, coffee, red
meat, fish and seafood, total
fruit and vegetables, mutual
adjustment between whole
grains and refined grains
Wu H et al, 2015,
USA
Nurses’ Health
Study & Health
Professionals
Follow-up
Study
1984-2010,
26 years
follow-up
1986-2010,
24 years
follow-up
74341 women, age
38-63 years and
43744 men, age 32-
87 years: 2016
respiratory disease
deaths
Validated
FFQ,
126/133
food items
Whole grains 4.2/5.9 g/d (w/m)
9.7/14.4
14.7/22.1
21.1/31.1
33.0/47.8
1.00
0.96 (0.84-1.08)
1.00 (0.87-1.14)
0.88 (0.76-1.02)
0.89 (0.77-1.03)
Age, ethnicity, BMI, smoking
status, cigarettes per day, pack-
years smoked, years since
quitting smoking, alcohol,
physical activity, family history
of diabetes, cancer and heart
disease, multivitamin use,
aspirin use, hypertension, high
cholesterol, diabetes, total
energy, healthy eating index
(including fruits, vegetables,
nuts and legumes, red or
processed meat, sugar-
sweetened beverages, alcohol,
sodium, trans fat, long-chain n-3
FA, other PUFAs, but excluding
whole grains), women:
postmenopausal status, HRT

Huang T et al,
2015, USA
NIH-AARP
Diet and Health
Study
1995-1996 –
2009, 14
years
follow-up
367442 men and
women, age 50-71
years: 3796
respiratory disease
deaths
Validated
FFQ, 124
food items
Whole grains 0.13 oz/1000 kcal/d1
0.30
0.47
0.69
1.20
1.00
0.99 (0.90-1.09)
0.94 (0.85-1.03)
0.91 (0.82-1.01)
0.89 (0.80-0.98)
Age, sex, number of cigarettes
per day, time of smoking
cessation, race/ ethnicity,
alcohol, education, marital
status, health status, BMI,
physical activity, red meat, total
fruit and vegetables, total
energy, HRT (women)
Xu M et al, 2015,
USA
NIH-AARP
Diet and Health
Study
1995-1996 –
2008, 14
years
follow-up
367442 men and
women, age 50-71
years: 3796
respiratory disease
deaths
Validated
FFQ, 124
food items
Ready-to-eat cereals 0.00 g/d
0.67
3.48
9.33
22.48
1.00
0.95 (0.88-1.03)
0.94 (0.87-1.02)
0.91 (0.84-0.99)
0.91 (0.83-0.99)
Age, sex, smoking status,
smoking dose, time since
quitting smoking, race/ethnicity,
education, marital status, self-
rated health status, BMI,
physical activity, menopausal
hormone therapy, alcohol, red
meat, fruits, vegetables, total
energy

Johnsen NF et al,
2015, Norway,
Sweden, Denmark
HELGA Cohort
(Norwegian
Women and
Cancer Study,
Northern
Sweden Health
and Disease
Study, Danish
Diet, Cancer
and Health
Study – part of
the EPIC study)
1992-1998 –
2008-2009,
11.1
(Norway),
14.2
(Sweden),
11.9 years
(Denmark)
follow-up
120010 men and
women, age 30-64
years: 111/125
respiratory disease
deaths
Validated
FFQ, 88
food items
(Norway),
98 food
items
(Sweden)
173 food
items
(Denmark)
Whole grain breakfast
cereals, women
Non-white bread
Crisp bread
Total whole grain
products
Oat
Rye
Wheat
Total whole grain types
Whole grain breakfast
cereals, men
0 g/d
0.8
12
50
25 g/d
80
113
180
0.6 g/d
2
6
31
56 g/d
100
131
201
0 g/d
0.4
4
19
8 g/d
18
22
41
0.4 g/d
3
10
37
20 g/d
33
49
74
0 g/d
0.8
7
50
1.00
0.28 (0.11-0.69)
0.48 (0.28-0.83)
0.39 (0.23-0.65)
1.00
0.87 (0.50-1.53)
0.47 (0.24-0.93)
0.74 (0.41-1.35)
1.00
0.80 (0.51-1.25)
0.59 (0.32-1.07)
1.03 (0.59-1.79)
1.00
0.56 (0.35-0.89)
0.53 (0.33-0.86)
0.82 (0.49-1.37)
1.00
0.56 (0.36-0.88)
0.48 (0.27-0.85)
0.51 (0.28-0.93)
1.00
1.62 (0.86-3.04)
1.12 (0.61-2.05)
1.12 (0.60-2.10)
1.00
0.63 (0.41-0.99)
0.57 (0.34-0.94)
0.44 (0.09-2.05)
1.00
0.65 (0.40-1.08)
0.64 (0.39-1.04)
0.47 (0.28-0.77)
1.00
1.50 (0.79-2.82)
1.23 (0.76-1.98)
0.66 (0.37-1.16)
Age, follow-up time, education,
smoking status/years since quit/
cigarettes per day, alcohol,
BMI, total energy

Non-white bread
Crisp bread
Total whole grain
products
Oat
Rye
Wheat
Total whole grain types
13 g/d
66
118
201
1 g/d
2
4
34
64 g/d
107
156
222
0 g/d
0.4
3
30
7 g/d
21
38
56
0.1 g/d
1
5
10
21 g/d
37
54
80
1.00
1.04 (0.52-2.08)
0.62 (0.28-1.35)
0.94 (0.46-1.94)
1.00
0.77 (0.45-1.32)
0.98 (0.59-1.62)
1.00 (0.50-2.01)
1.00
1.03 (0.61-1.76)
1.05 (0.63-1.77)
0.60 (0.33-1.07)
1.00
0.99 (0.59-1.68)
0.87 (0.50-1.51)
0.52 (0.28-0.97)
1.00
1.16 (0.65-2.10)
0.70 (0.32-1.57)
1.02 (0.53-1.97)
1.00
1.46 (0.83-2.55)
1.40 (0.76-2.56)
1.06 (0.57-1.95)
1.00
0.96 (0.58-1.61)
0.65 (0.38-1.11)
0.74 (0.42-1.30)
BMI; body mass index, FA; fatty acids, FFQ; food frequency questionnaire, HRT; hormone replacement therapy, PUFA; polyunsaturated fatty
acids 1 The original paper reports in ounces/d, but after contact with the authors it was confirmed that ounces/1000 kcal/d is correct.

Table S9. Whole grains and refined grains and infectious disease mortality Author,
publication year,
country
Study name Study period Number of
participants,
gender, age,
number of
cases/deaths
Dietary
assessment
Exposure and subgroup Whole grain
consumption
frequency or amount
Relative risks (95%
confidence intervals)
Adjustment for confounding
factors
Jacobs DR, 2007,
USA
Iowa Women’s
Health Study
1986 – 2003,
17 years
follow-up
27312 women, age
55-69 years: 59
infectious disease
deaths
Validated
FFQ, 127
food items
Whole grains
1.8 serv/wk
5.6
8.8
14.5
25.6
1.00
0.89 (0.39-2.02)
0.92 (0.41-2.09)
1.03 (0.46-2.33)
0.68 (0.26-1.75)
Age, energy intake, BMI, waist-
to-hip ratio, smoking, education,
physical activity, HRT,
multivitamin supplement use,
intake of alcohol, coffee, red
meat, fish and seafood, total
fruit and vegetables, mutual
adjustment between whole
grains and refined grains
Wu H et al, 2015,
USA
Nurses’ Health
Study & Health
Professionals
Follow-up
Study
1984-2010,
26 years
follow-up
1986-2010,
24 years
follow-up
74341 women, age
38-63 years and
43744 men, age 32-
87 years: 405
infectious disease
deaths
Validated
FFQ,
126/133
food items
Whole grains 4.2/5.9 g/d (w/m)
9.7/14.4
14.7/22.1
21.1/31.1
33.0/47.8
1.00
0.88 (0.65-1.18)
0.76 (0.55-1.05)
1.01 (0.75-1.38)
0.90 (0.66-1.23)
Age, ethnicity, BMI, smoking
status, cigarettes per day, pack-
years smoked, years since
quitting smoking, alcohol,
physical activity, family history
of diabetes, cancer and heart
disease, multivitamin use,
aspirin use, hypertension, high
cholesterol, diabetes, total
energy, healthy eating index
(including fruits, vegetables,
nuts and legumes, red or
processed meat, sugar-
sweetened beverages, alcohol,
sodium, trans fat, long-chain n-3
FA, other PUFAs, but excluding
whole grains), women:
postmenopausal status, HRT

Huang T et al,
2015, USA
NIH-AARP
Diet and Health
Study
1995-1996 –
2009, 14
years
follow-up
367442 men and
women, age 50-71
years: 922
infectious disease
deaths
Validated
FFQ, 124
food items
Whole grains 0.13 oz/1000 kcal/d1
0.30
0.47
0.69
1.20
1.00
0.84 (0.70-1.02)
0.78 (0.64-0.96)
0.79 (0.65-0.97)
0.77 (0.62-0.95)
Age, sex, number of cigarettes
per day, time of smoking
cessation, race/ ethnicity,
alcohol, education, marital
status, health status, BMI,
physical activity, red meat, total
fruit and vegetables, total
energy, HRT (women)
Xu M et al, 2015,
USA
NIH-AARP
Diet and Health
Study
1995-1996 –
2008, 14
years
follow-up
367442 men and
women, age 50-71
years: 922
infectious disease
deaths
Validated
FFQ, 124
food items
Ready-to-eat cereals 0.00 g/d
0.67
3.48
9.33
22.48
1.00
0.97 (0.79-1.20)
0.85 (0.68-1.06)
0.84 (0.68-1.05)
0.97 (0.78-1.21)
Age, sex, smoking status,
smoking dose, time since
quitting smoking, race/ethnicity,
education, marital status, self-
rated health status, BMI,
physical activity, menopausal
hormone therapy, alcohol, red
meat, fruits, vegetables, total
energy
BMI; body mass index, FA; fatty acids, FFQ; food frequency questionnaire, HRT; hormone replacement therapy, PUFA; polyunsaturated fatty
acids 1 The original paper reports in ounces/d, but after contact with the authors it was confirmed that ounces/1000 kcal/d is correct.

Table S10. Whole grains and refined grains and diabetes mortality Author,
publication year,
country
Study name Study period Number of
participants,
gender, age,
number of
cases/deaths
Dietary
assessment
Exposure and subgroup Whole grain
consumption
frequency or amount
Relative risks (95%
confidence intervals)
Adjustment for confounding
factors
Jacobs DR, 2007,
USA
Iowa Women’s
Health Study
1986 – 2003,
17 years
follow-up
27312 women, age
55-69 years: 60
deaths due to
endocrine,
nutritional and
metabolic disorders
(mainly diabetes)
Validated
FFQ, 127
food items
Whole grains
1.8 serv/wk
5.6
8.8
14.5
25.6
1.00
0.44 (0.19-1.02)
0.65 (0.31-1.37)
0.46 (0.20-1.08)
0.55 (0.24-1.28)
Age, energy intake, BMI, waist-
to-hip ratio, smoking, education,
physical activity, HRT,
multivitamin supplement use,
intake of alcohol, coffee, red
meat, fish and seafood, total
fruit and vegetables, mutual
adjustment between whole
grains and refined grains
Wu H et al, 2015,
USA
Nurses’ Health
Study & Health
Professionals
Follow-up
Study
1984-2010,
26 years
follow-up
1986-2010,
24 years
follow-up
74341 women, age
38-63 years and
43744 men, age 32-
87 years: 283
diabetes deaths
Validated
FFQ
Whole grains 4.2/5.9 g/d (w/m)
9.7/14.4
14.7/22.1
21.1/31.1
33.0/47.8
1.00
0.59 (0.42-0.83)
0.52 (0.35-0.77)
0.52 (0.34-0.79)
0.50 (0.34-0.75)
Age, ethnicity, BMI, smoking
status, cigarettes per day, pack-
years smoked, years since
quitting smoking, alcohol,
physical activity, family history
of diabetes, cancer and heart
disease, multivitamin use,
aspirin use, hypertension, high
cholesterol, diabetes, total
energy, healthy eating index
(including fruits, vegetables,
nuts and legumes, red or
processed meat, sugar-
sweetened beverages, alcohol,
sodium, trans fat, long-chain n-3
FA, other PUFAs, but excluding
whole grains), women:
postmenopausal status, HRT

Huang T et al,
2015, USA
NIH-AARP
Diet and Health
Study
1995-1996 –
2009, 14
years
follow-up
367442 men and
women, age 50-71
years: 371 diabetes
deaths
Validated
FFQ, 124
food items
Whole grains 0.13 oz/1000 kcal/d1
0.30
0.47
0.69
1.20
1.00
0.71 (0.53-0.96)
0.76 (0.56-1.03)
0.72 (0.53-0.99)
0.52 (0.37-0.75)
Age, sex, number of cigarettes
per day, time of smoking
cessation, race/ ethnicity,
alcohol, education, marital
status, health status, BMI,
physical activity, red meat, total
fruit and vegetables, total
energy, HRT (women)
Xu M et al, 2015,
USA
NIH-AARP
Diet and Health
Study
1995-1996 –
2008, 14
years
follow-up
367442 men and
women, age 50-71
years: 371 diabetes
deaths
Validated
FFQ, 124
food items
Ready-to-eat cereals 0.00 g/d
0.67
3.48
9.33
22.48
1.00
0.96 (0.68-1.36)
1.22 (0.87-1.69)
1.14 (0.81-1.61)
0.70 (0.47-1.03)
Age, sex, smoking status,
smoking dose, time since
quitting smoking, race/ethnicity,
education, marital status, self-
rated health status, BMI,
physical activity, menopausal
hormone therapy, alcohol, red
meat, fruits, vegetables, total
energy

Johnsen NF et al,
2015, Norway,
Sweden, Denmark
HELGA Cohort
(Norwegian
Women and
Cancer Study,
Northern
Sweden Health
and Disease
Study, Danish
Diet, Cancer
and Health
Study – part of
the EPIC study)
1992-1998 –
2008-2009,
11.1
(Norway),
14.2
(Sweden),
11.9 years
(Denmark)
follow-up
120010 men and
women, age 30-64
years: 70/24
diabetes deaths
Validated
FFQ, 88
food items
(Norway),
98 food
items
(Sweden)
173 food
items
(Denmark)
Whole grain breakfast
cereals, women
Non-white bread
Crisp bread
Total whole grain
products
Oat
Rye
Wheat
Total whole grain types
Whole grain breakfast
cereals, men
0 g/d
0.8
12
50
25 g/d
80
113
180
0.6 g/d
2
6
31
56 g/d
100
131
201
0 g/d
0.4
4
19
8 g/d
18
22
41
0.4 g/d
3
10
37
20 g/d
33
49
74
0 g/d
0.8
7
50
1.00
0.80 (0.23-2.77)
0.45 (0.13-1.59)
0.28 (0.07-1.04)
1.00
0.47 (0.15-1.48)
0.40 (0.11-1.50)
0.55 (0.17-1.73)
1.00
1.21 (0.41-3.54)
1.25 (0.36-4.35)
1.09 (0.27-4.43)
1.00
0.41 (0.13-1.29)
0.41 (0.13-1.29)
0.90 (0.31-2.62)
1.00
0.88 (0.34-2.27)
0.36 (0.09-1.51)
0.25 (0.05-1.31)
1.00
0.93 (0.28-3.09)
0.46 (0.14-1.53)
0.70 (0.22-2.25)
1.00
0.69 (0.26-1.85)
0.61 (0.20-1.88)
3.17 (0.27-37.59)
1.00
0.77 (0.25-2.41)
0.44 (0.14-1.38)
0.64 (0.20-2.04)
1.00
0.59 (0.24-1.50)
0.31 (0.14-0.68)
0.45 (0.23-0.90)
Age, follow-up time, education,
smoking status/years since quit/
cigarettes per day, alcohol,
BMI, total energy
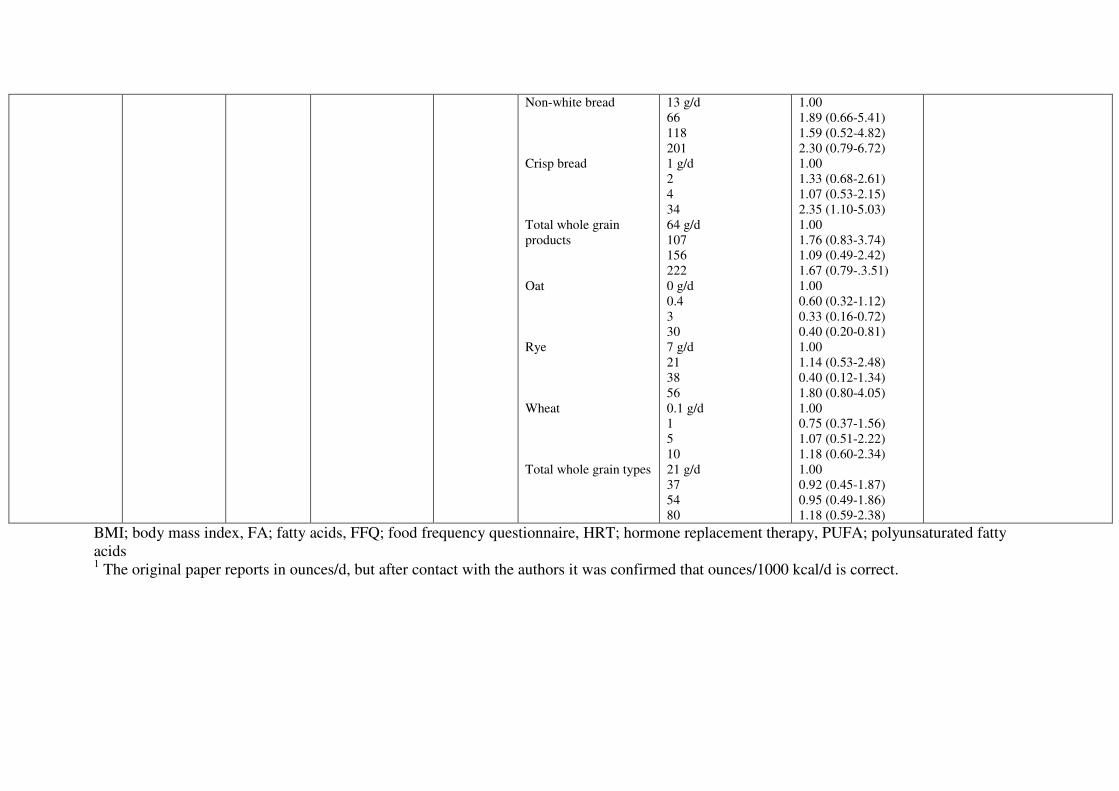
Non-white bread
Crisp bread
Total whole grain
products
Oat
Rye
Wheat
Total whole grain types
13 g/d
66
118
201
1 g/d
2
4
34
64 g/d
107
156
222
0 g/d
0.4
3
30
7 g/d
21
38
56
0.1 g/d
1
5
10
21 g/d
37
54
80
1.00
1.89 (0.66-5.41)
1.59 (0.52-4.82)
2.30 (0.79-6.72)
1.00
1.33 (0.68-2.61)
1.07 (0.53-2.15)
2.35 (1.10-5.03)
1.00
1.76 (0.83-3.74)
1.09 (0.49-2.42)
1.67 (0.79-.3.51)
1.00
0.60 (0.32-1.12)
0.33 (0.16-0.72)
0.40 (0.20-0.81)
1.00
1.14 (0.53-2.48)
0.40 (0.12-1.34)
1.80 (0.80-4.05)
1.00
0.75 (0.37-1.56)
1.07 (0.51-2.22)
1.18 (0.60-2.34)
1.00
0.92 (0.45-1.87)
0.95 (0.49-1.86)
1.18 (0.59-2.38)
BMI; body mass index, FA; fatty acids, FFQ; food frequency questionnaire, HRT; hormone replacement therapy, PUFA; polyunsaturated fatty
acids 1 The original paper reports in ounces/d, but after contact with the authors it was confirmed that ounces/1000 kcal/d is correct.

Table S11. Whole grains and refined grains and nervous system disease mortality Author,
publication year,
country
Study name Study period Number of
participants,
gender, age,
number of
cases/deaths
Dietary
assessment
Exposure and subgroup Whole grain
consumption
frequency or amount
Relative risks (95%
confidence intervals)
Adjustment for confounding
factors
Jacobs DR, 2007,
USA
Iowa Women’s
Health Study
1986 – 2003,
17 years
follow-up
27312 women, age
55-69 years: 241
nervous system
deaths
Validated
FFQ, 127
food items
Whole grains
1.8 serv/wk
5.6
8.8
14.5
25.6
1.00
0.84 (0.53-1.32)
1.33 (0.88-1.99)
0.83 (0.53-1.31)
0.89 (0.55-1.42)
Age, energy intake, BMI, waist-
to-hip ratio, smoking, education,
physical activity, HRT,
multivitamin supplement use,
intake of alcohol, coffee, red
meat, fish and seafood, total
fruit and vegetables, mutual
adjustment between whole
grains and refined grains
Wu H et al, 2015,
USA
Nurses’ Health
Study & Health
Professionals
Follow-up
Study
1984-2010,
26 years
follow-up
1986-2010,
24 years
follow-up
74341 women, age
38-63 years and
43744 men, age 32-
87 years: 2044
neurodegenerative
disease deaths
Validated
FFQ
Whole grains 4.2/5.9 g/d (w/m)
9.7/14.4
14.7/22.1
21.1/31.1
33.0/47.8
1.00
1.24 (1.08-1.42)
1.25 (1.09-1.44)
1.35 (1.17-1.55)
1.20 (1.04-1.38)
Age, ethnicity, BMI, smoking
status, cigarettes per day, pack-
years smoked, years since
quitting smoking, alcohol,
physical activity, family history
of diabetes, cancer and heart
disease, multivitamin use,
aspirin use, hypertension, high
cholesterol, diabetes, total
energy, healthy eating index
(including fruits, vegetables,
nuts and legumes, red or
processed meat, sugar-
sweetened beverages, alcohol,
sodium, trans fat, long-chain n-3
FA, other PUFAs, but excluding
whole grains), women:
postmenopausal status, HRT
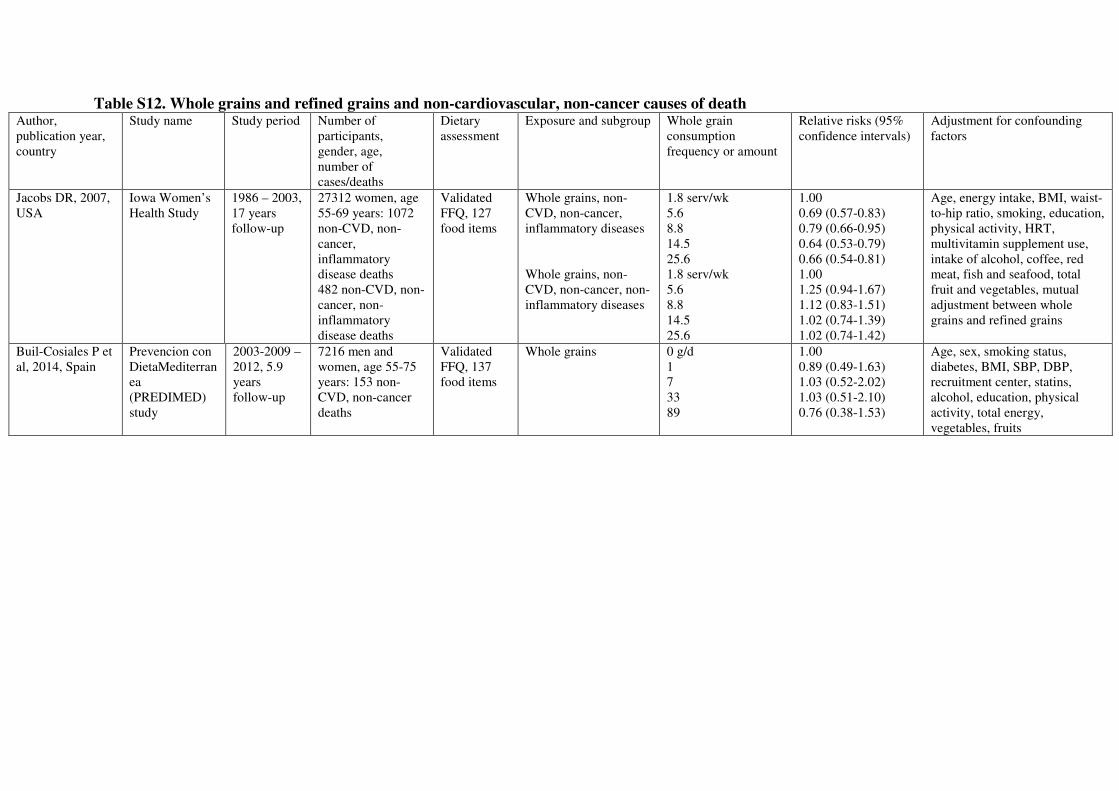
Table S12. Whole grains and refined grains and non-cardiovascular, non-cancer causes of death Author,
publication year,
country
Study name Study period Number of
participants,
gender, age,
number of
cases/deaths
Dietary
assessment
Exposure and subgroup Whole grain
consumption
frequency or amount
Relative risks (95%
confidence intervals)
Adjustment for confounding
factors
Jacobs DR, 2007,
USA
Iowa Women’s
Health Study
1986 – 2003,
17 years
follow-up
27312 women, age
55-69 years: 1072
non-CVD, non-
cancer,
inflammatory
disease deaths
482 non-CVD, non-
cancer, non-
inflammatory
disease deaths
Validated
FFQ, 127
food items
Whole grains, non-
CVD, non-cancer,
inflammatory diseases
Whole grains, non-
CVD, non-cancer, non-
inflammatory diseases
1.8 serv/wk
5.6
8.8
14.5
25.6
1.8 serv/wk
5.6
8.8
14.5
25.6
1.00
0.69 (0.57-0.83)
0.79 (0.66-0.95)
0.64 (0.53-0.79)
0.66 (0.54-0.81)
1.00
1.25 (0.94-1.67)
1.12 (0.83-1.51)
1.02 (0.74-1.39)
1.02 (0.74-1.42)
Age, energy intake, BMI, waist-
to-hip ratio, smoking, education,
physical activity, HRT,
multivitamin supplement use,
intake of alcohol, coffee, red
meat, fish and seafood, total
fruit and vegetables, mutual
adjustment between whole
grains and refined grains
Buil-Cosiales P et
al, 2014, Spain
Prevencion con
DietaMediterran
ea
(PREDIMED)
study
2003-2009 –
2012, 5.9
years
follow-up
7216 men and
women, age 55-75
years: 153 non-
CVD, non-cancer
deaths
Validated
FFQ, 137
food items
Whole grains 0 g/d
1
7
33
89
1.00
0.89 (0.49-1.63)
1.03 (0.52-2.02)
1.03 (0.51-2.10)
0.76 (0.38-1.53)
Age, sex, smoking status,
diabetes, BMI, SBP, DBP,
recruitment center, statins,
alcohol, education, physical
activity, total energy,
vegetables, fruits

Wu H et al, 2015,
USA
Nurses’ Health
Study & Health
Professionals
Follow-up
Study
1984-2010,
26 years
follow-up
1986-2010,
24 years
follow-up
74341 women, age
38-63 years and
43744 men, age 32-
87 years: 10425
non-CVD, non-
cancer deaths1
Validated
FFQ
Whole grains 4.2/5.9 g/d (w/m)
9.7/14.4
14.7/22.1
21.1/31.1
33.0/47.8
1.00
0.98 (0.93-1.04)
0.95 (0.89-1.01)
0.97 (0.91-1.03)
0.91 (0.86-0.97) 1
Age, ethnicity, BMI, smoking
status, cigarettes per day, pack-
years smoked, years since
quitting smoking, alcohol,
physical activity, family history
of diabetes, cancer and heart
disease, multivitamin use,
aspirin use, hypertension, high
cholesterol, diabetes, total
energy, healthy eating index
(including fruits, vegetables,
nuts and legumes, red or
processed meat, sugar-
sweetened beverages, alcohol,
sodium, trans fat, long-chain n-3
FA, other PUFAs, but excluding
whole grains), women:
postmenopausal status, HRT
Huang T et al,
2015, USA
NIH-AARP
Diet and Health
Study
1995-1996 –
2009, 14
years
follow-up
367442 men and
women, age 50-71
years: 10312 non-
CVD, non-cancer
deaths1
Validated
FFQ, 124
food items
Whole grains 0.13 oz/1000 kcal/d2
0.30
0.47
0.69
1.20
1.00
0.97 (0.88-1.06)
0.97 (0.89-1.06)
0.87 (0.79-0.96)
0.86 (0.78-0.94) 1
Age, sex, number of cigarettes
per day, time of smoking
cessation, race/ ethnicity,
alcohol, education, marital
status, health status, BMI,
physical activity, red meat, total
fruit and vegetables, total
energy, HRT (women)
BMI; body mass index, DBP; diastolic blood pressure, FA; fatty acids, FFQ; food frequency questionnaire, HRT; hormone replacement therapy,
PUFA; polyunsaturated fatty acids, SBP; systolic blood pressure
1 For the Nurses’ Health Study, Health Professionals Follow-up Study, and NIH-AARP Diet and Health Study data were pooled for all non-CVD,
non-cancer causes of death (NHS&HPFS: deaths from respiratory disease, neurodegenerative disease, infectious disease, kidney disease,
diabetes, and other causes, and NIH-AARP Diet and Health Study: deaths from diabetes, respiratory disease, infections and other/unknown
causes) using a fixed effects model.
2 The original paper reports in ounces/d, but after contact with the authors it was confirmed that ounces/1000 kcal/d is correct.

Table S13. Relative risks from nonlinear dose-response analysis of whole grains and coronary heart disease, stroke, cardiovascular
disease, total cancer, and all-cause mortality
Coronary heart disease Stroke Cardiovascular disease Total cancer All-cause mortality
g/d RR (95% CI) g/d RR (95% CI) g/d RR (95% CI) g/d RR (95% CI) g/d RR (95% CI)
0 1.00 0 1.00 0 1.00 0 1.00 0 1.00
15 0.93 (0.92-0.95) 15 0.94 (0.92-0.95) 15 0.93 (0.91-0.94) 15 0.97 (0.96-0.98) 15 0.95 (0.94-0.96)
30 0.87 (0.85-0.90) 30 0.88 (0.85-0.91) 30 0.87 (0.85-0.89) 30 0.95 (0.93-0.97) 30 0.90 (0.89-0.92)
45 0.82 (0.79-0.85) 45 0.83 (0.78-0.87) 45 0.83 (0.81-0.86) 45 0.93 (0.90-0.95) 45 0.87 (0.85-0.89)
60 0.78 (0.75-0.82) 60 0.78 (0.73-0.84) 60 0.81 (0.79-0.84) 60 0.91 (0.88-0.94) 60 0.85 (0.82-0.87)
75 0.75 (0.71-0.79) 75 0.75 (0.69-0.81) 75 0.80 (0.77-0.82) 75 0.89 (0.86-0.92) 75 0.83 (0.80-0.85)
90 0.72 (0.69-0.76) 90 0.73 (0.66-0.79) 90 0.79 (0.76-0.82) 90 0.87 (0.84-0.91) 90 0.81 (0.79-0.83)
105 0.70 (0.66-0.74) 105 0.71 (0.64-0.78) 105 0.78 (0.75-0.82) 105 0.86 (0.83-0.90) 105 0.80 (0.78-0.82)
120 0.69 (0.65-0.73) 120 0.70 (0.63-0.77) 120 0.78 (0.74-0.82) 120 0.85 (0.81-0.89) 120 0.78 (0.76-0.81)
135 0.67 (0.63-0.71) 135 0.69 (0.62-0.77) 135 0.77 (0.72-0.82) 135 0.83 (0.80-0.87) 135 0.77 (0.75-0.80)
150 0.66 (0.62-0.70) 150 0.69 (0.62-0.77) 150 0.76 (0.71-0.82) 150 0.82 (0.78-0.86) 150 0.76 (0.73-0.79)
165 0.65 (0.61-0.69) 165 0.69 (0.62-0.77) 165 0.75 (0.70-0.82) 165 0.81 (0.77-0.86) 165 0.75 (0.71-0.78)
180 0.64 (0.59-0.68) 180 0.69 (0.62-0.77) 180 0.75 (0.68-0.82) 180 0.80 (0.75-0.85) 180 0.73 (0.70-0.77)
195 0.63 (0.58-0.68) 195 0.69 (0.62-0.77) 195 0.74 (0.67-0.82) 195 0.78 (0.73-0.84) 195 0.72 (0.68-0.76)
210 0.62 (0.57-0.67) 210 0.70 (0.62-0.78) 210 0.73 (0.66-0.82) 210 0.77 (0.72-0.83) 210 0.71 (0.67-0.75)
225 0.61 (0.56-0.66) 225 0.70 (0.63-0.78) 225 225 0.76 (0.71-0.82) 225 0.70 (0.65-0.75)
240 240 0.70 (0.63-0.79) 240 240 240
Pnonlinearity <0.0001 <0.0001 <0.0001 0.15 <0.0001

Table S14. Relative risks from nonlinear dose-response analysis of whole grains and
Respiratory disease mortality Diabetes mortality Infectious disease
mortality
Nervous system disease
mortality
All noncardiovascular,
noncancer causes of
death
g/d RR (95% CI) g/d RR (95% CI) g/d RR (95% CI) g/d RR (95% CI) g/d RR (95% CI)
4.8 1.00 4.8 1.00 4.8 1.00 4.8 1.00 0 1.00
15 0.93 (0.91-0.96) 15 0.80 (0.77-0.83) 15 0.89 (0.85-0.93) 15 1.14 (1.11-1.18) 15 0.96 (0.95-0.97)
30 0.88 (0.84-0.92) 30 0.65 (0.61-0.70) 30 0.81 (0.75-0.88) 30 1.26 (1.19-1.33) 30 0.92 (0.90-0.94)
45 0.83 (0.78-0.88) 45 0.55 (0.50-0.60) 45 0.78 (0.72-0.85) 45 1.28 (1.20-1.37) 45 0.88 (0.86-0.91)
60 0.79 (0.73-0.85) 60 0.48 (0.43-0.54) 60 0.77 (0.71-0.84) 60 1.23 (1.15-1.33) 60 0.85 (0.83-0.88)
75 0.76 (0.69-0.82) 75 0.44 (0.39-0.50) 75 0.76 (0.70-0.84) 75 1.14 (1.05-1.25) 75 0.82 (0.79-0.85)
90 0.73 (0.67-0.80) 90 0.42 (0.37-0.48) 90 0.76 (0.68-0.85) 90 1.05 (0.93-1.17) 90 0.79 (0.77-0.82)
105 0.71 (0.65-0.78) 105 0.41 (0.35-0.48) 105 0.76 (0.66-0.87) 105 0.95 (0.83-1.10) 105 0.77 (0.74-0.80)
120 0.70 (0.63-0.77) 120 0.41 (0.35-0.48) 120 120 120 0.75 (0.72-0.78)
135 0.68 (0.61-0.76) 135 0.41 (0.35-0.49) 135 135 135 0.72 (0.69-0.75)
150 0.67 (0.60-0.75) 150 0.42 (0.35-0.50) 150 150 150 0.70 (0.67-0.73)
165 0.66 (0.59-0.74) 165 0.43 (0.36-0.52) 165 165 165 0.68 (0.65-0.71)
180 0.65 (0.57-0.73) 180 0.44 (0.36-0.54) 180 180 180 0.66 (0.62-0.69)
195 0.63 (0.56-0.72) 195 0.45 (0.36-0.56) 195 195 195 0.64 (0.60-0.67)
210 0.62 (0.54-0.72) 210 0.46 (0.37-0.58) 210 210 210 0.62 (0.58-0.66)
225 0.62 (0.53-0.71) 225 0.47 (0.37-0.59) 225 225 225 0.60 (0.57-0.64)
240 240 240 240 240
Pnonlinearity 0.001 <0.0001 0.003 <0.0001 0.06
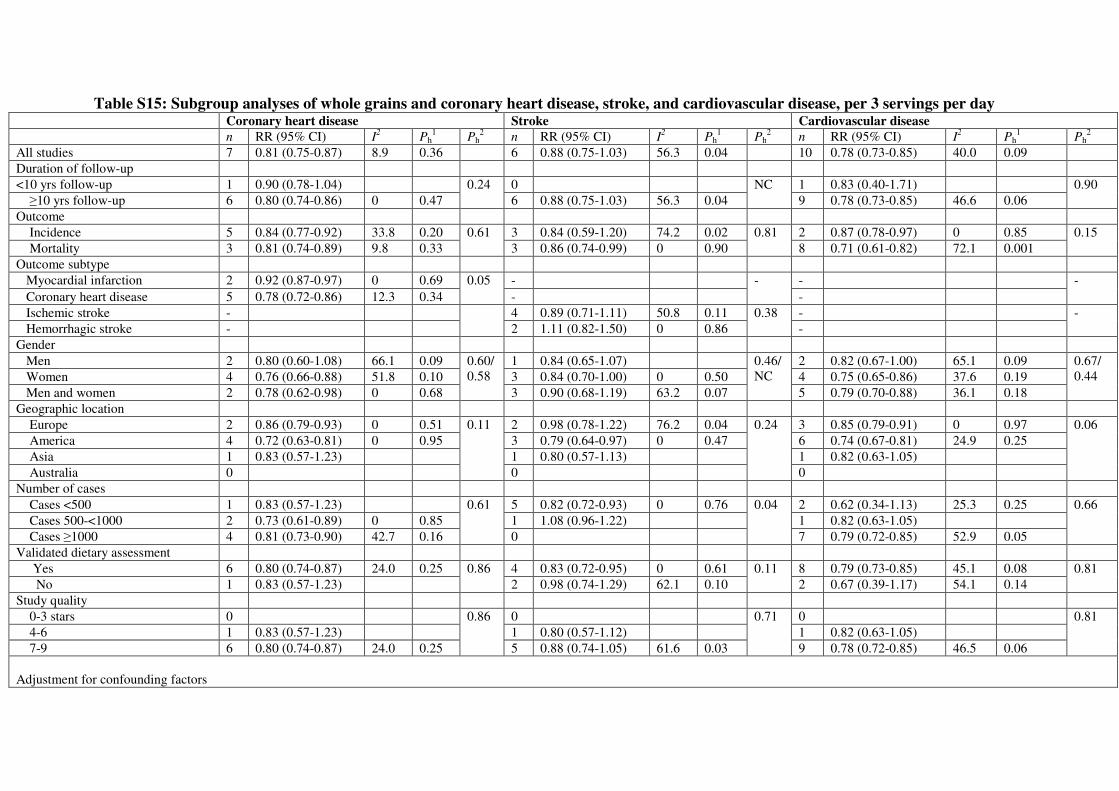
Table S15: Subgroup analyses of whole grains and coronary heart disease, stroke, and cardiovascular disease, per 3 servings per day Coronary heart disease Stroke Cardiovascular disease
n RR (95% CI) I2 Ph
1 Ph
2 n RR (95% CI) I
2 Ph
1 Ph
2 n RR (95% CI) I
2 Ph
1 Ph
2
All studies 7 0.81 (0.75-0.87) 8.9 0.36 6 0.88 (0.75-1.03) 56.3 0.04 10 0.78 (0.73-0.85) 40.0 0.09
Duration of follow-up
<10 yrs follow-up 1 0.90 (0.78-1.04) 0.24 0 NC 1 0.83 (0.40-1.71) 0.90
≥10 yrs follow-up 6 0.80 (0.74-0.86) 0 0.47 6 0.88 (0.75-1.03) 56.3 0.04 9 0.78 (0.73-0.85) 46.6 0.06
Outcome
Incidence 5 0.84 (0.77-0.92) 33.8 0.20 0.61 3 0.84 (0.59-1.20) 74.2 0.02 0.81 2 0.87 (0.78-0.97) 0 0.85 0.15
Mortality 3 0.81 (0.74-0.89) 9.8 0.33 3 0.86 (0.74-0.99) 0 0.90 8 0.71 (0.61-0.82) 72.1 0.001
Outcome subtype
Myocardial infarction 2 0.92 (0.87-0.97) 0 0.69 0.05 - - - -
Coronary heart disease 5 0.78 (0.72-0.86) 12.3 0.34 - -
Ischemic stroke - 4 0.89 (0.71-1.11) 50.8 0.11 0.38 - -
Hemorrhagic stroke - 2 1.11 (0.82-1.50) 0 0.86 -
Gender
Men 2 0.80 (0.60-1.08) 66.1 0.09 0.60/
0.58
1 0.84 (0.65-1.07) 0.46/
NC
2 0.82 (0.67-1.00) 65.1 0.09 0.67/
0.44 Women 4 0.76 (0.66-0.88) 51.8 0.10 3 0.84 (0.70-1.00) 0 0.50 4 0.75 (0.65-0.86) 37.6 0.19
Men and women 2 0.78 (0.62-0.98) 0 0.68 3 0.90 (0.68-1.19) 63.2 0.07 5 0.79 (0.70-0.88) 36.1 0.18
Geographic location
Europe 2 0.86 (0.79-0.93) 0 0.51 0.11 2 0.98 (0.78-1.22) 76.2 0.04 0.24 3 0.85 (0.79-0.91) 0 0.97 0.06
America 4 0.72 (0.63-0.81) 0 0.95 3 0.79 (0.64-0.97) 0 0.47 6 0.74 (0.67-0.81) 24.9 0.25
Asia 1 0.83 (0.57-1.23) 1 0.80 (0.57-1.13) 1 0.82 (0.63-1.05)
Australia 0 0 0
Number of cases
Cases <500 1 0.83 (0.57-1.23) 0.61 5 0.82 (0.72-0.93) 0 0.76 0.04 2 0.62 (0.34-1.13) 25.3 0.25 0.66
Cases 500-<1000 2 0.73 (0.61-0.89) 0 0.85 1 1.08 (0.96-1.22) 1 0.82 (0.63-1.05)
Cases ≥1000 4 0.81 (0.73-0.90) 42.7 0.16 0 7 0.79 (0.72-0.85) 52.9 0.05
Validated dietary assessment
Yes 6 0.80 (0.74-0.87) 24.0 0.25 0.86 4 0.83 (0.72-0.95) 0 0.61 0.11 8 0.79 (0.73-0.85) 45.1 0.08 0.81
No 1 0.83 (0.57-1.23) 2 0.98 (0.74-1.29) 62.1 0.10 2 0.67 (0.39-1.17) 54.1 0.14
Study quality
0-3 stars 0 0.86 0 0.71 0 0.81
4-6 1 0.83 (0.57-1.23) 1 0.80 (0.57-1.12) 1 0.82 (0.63-1.05)
7-9 6 0.80 (0.74-0.87) 24.0 0.25 5 0.88 (0.74-1.05) 61.6 0.03 9 0.78 (0.72-0.85) 46.5 0.06
Adjustment for confounding factors
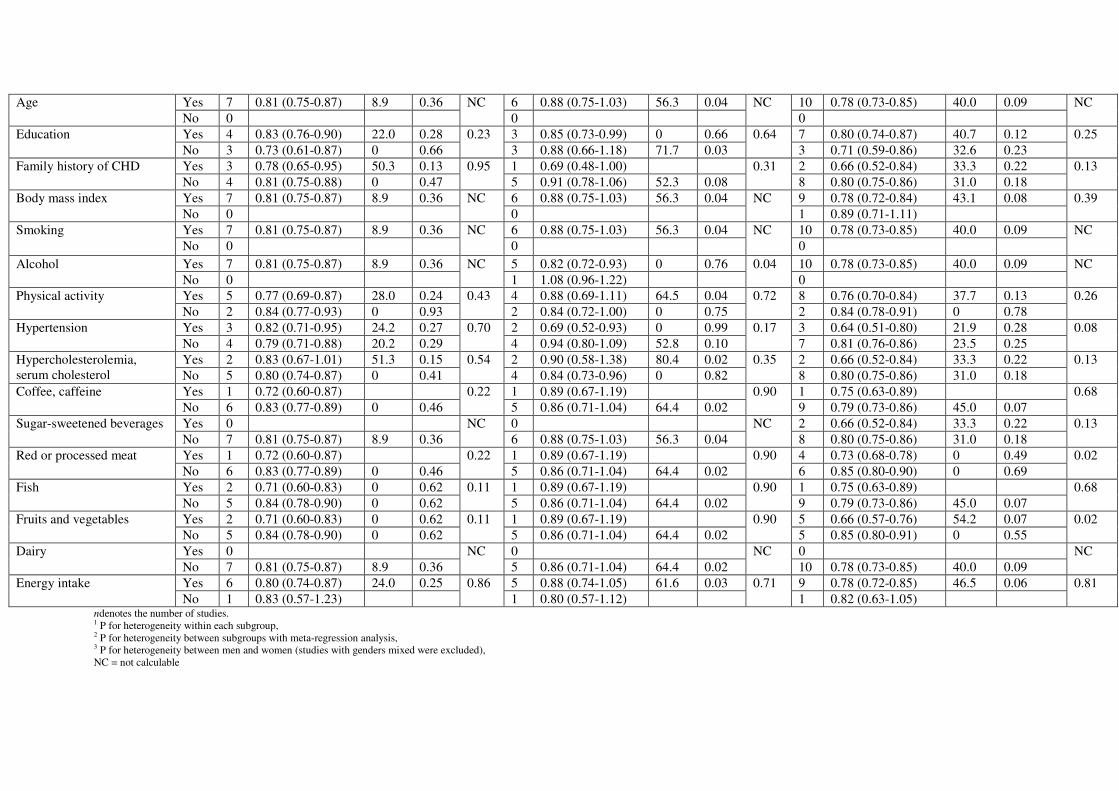
Age Yes 7 0.81 (0.75-0.87) 8.9 0.36 NC 6 0.88 (0.75-1.03) 56.3 0.04 NC 10 0.78 (0.73-0.85) 40.0 0.09 NC
No 0 0 0
Education Yes 4 0.83 (0.76-0.90) 22.0 0.28 0.23 3 0.85 (0.73-0.99) 0 0.66 0.64 7 0.80 (0.74-0.87) 40.7 0.12 0.25
No 3 0.73 (0.61-0.87) 0 0.66 3 0.88 (0.66-1.18) 71.7 0.03 3 0.71 (0.59-0.86) 32.6 0.23
Family history of CHD Yes 3 0.78 (0.65-0.95) 50.3 0.13 0.95 1 0.69 (0.48-1.00) 0.31 2 0.66 (0.52-0.84) 33.3 0.22 0.13
No 4 0.81 (0.75-0.88) 0 0.47 5 0.91 (0.78-1.06) 52.3 0.08 8 0.80 (0.75-0.86) 31.0 0.18
Body mass index Yes 7 0.81 (0.75-0.87) 8.9 0.36 NC 6 0.88 (0.75-1.03) 56.3 0.04 NC 9 0.78 (0.72-0.84) 43.1 0.08 0.39
No 0 0 1 0.89 (0.71-1.11)
Smoking
Yes 7 0.81 (0.75-0.87) 8.9 0.36 NC 6 0.88 (0.75-1.03) 56.3 0.04 NC 10 0.78 (0.73-0.85) 40.0 0.09 NC
No 0 0 0
Alcohol Yes 7 0.81 (0.75-0.87) 8.9 0.36 NC 5 0.82 (0.72-0.93) 0 0.76 0.04 10 0.78 (0.73-0.85) 40.0 0.09 NC
No 0 1 1.08 (0.96-1.22) 0
Physical activity Yes 5 0.77 (0.69-0.87) 28.0 0.24 0.43 4 0.88 (0.69-1.11) 64.5 0.04 0.72 8 0.76 (0.70-0.84) 37.7 0.13 0.26
No 2 0.84 (0.77-0.93) 0 0.93 2 0.84 (0.72-1.00) 0 0.75 2 0.84 (0.78-0.91) 0 0.78
Hypertension Yes 3 0.82 (0.71-0.95) 24.2 0.27 0.70 2 0.69 (0.52-0.93) 0 0.99 0.17 3 0.64 (0.51-0.80) 21.9 0.28 0.08
No 4 0.79 (0.71-0.88) 20.2 0.29 4 0.94 (0.80-1.09) 52.8 0.10 7 0.81 (0.76-0.86) 23.5 0.25
Hypercholesterolemia,
serum cholesterol
Yes 2 0.83 (0.67-1.01) 51.3 0.15 0.54 2 0.90 (0.58-1.38) 80.4 0.02 0.35 2 0.66 (0.52-0.84) 33.3 0.22 0.13
No 5 0.80 (0.74-0.87) 0 0.41 4 0.84 (0.73-0.96) 0 0.82 8 0.80 (0.75-0.86) 31.0 0.18
Coffee, caffeine Yes 1 0.72 (0.60-0.87) 0.22 1 0.89 (0.67-1.19) 0.90 1 0.75 (0.63-0.89) 0.68
No 6 0.83 (0.77-0.89) 0 0.46 5 0.86 (0.71-1.04) 64.4 0.02 9 0.79 (0.73-0.86) 45.0 0.07
Sugar-sweetened beverages Yes 0 NC 0 NC 2 0.66 (0.52-0.84) 33.3 0.22 0.13
No 7 0.81 (0.75-0.87) 8.9 0.36 6 0.88 (0.75-1.03) 56.3 0.04 8 0.80 (0.75-0.86) 31.0 0.18
Red or processed meat Yes 1 0.72 (0.60-0.87) 0.22 1 0.89 (0.67-1.19) 0.90 4 0.73 (0.68-0.78) 0 0.49 0.02
No 6 0.83 (0.77-0.89) 0 0.46 5 0.86 (0.71-1.04) 64.4 0.02 6 0.85 (0.80-0.90) 0 0.69
Fish Yes 2 0.71 (0.60-0.83) 0 0.62 0.11 1 0.89 (0.67-1.19) 0.90 1 0.75 (0.63-0.89) 0.68
No 5 0.84 (0.78-0.90) 0 0.62 5 0.86 (0.71-1.04) 64.4 0.02 9 0.79 (0.73-0.86) 45.0 0.07
Fruits and vegetables Yes 2 0.71 (0.60-0.83) 0 0.62 0.11 1 0.89 (0.67-1.19) 0.90 5 0.66 (0.57-0.76) 54.2 0.07 0.02
No 5 0.84 (0.78-0.90) 0 0.62 5 0.86 (0.71-1.04) 64.4 0.02 5 0.85 (0.80-0.91) 0 0.55
Dairy Yes 0 NC 0 NC 0 NC
No 7 0.81 (0.75-0.87) 8.9 0.36 5 0.86 (0.71-1.04) 64.4 0.02 10 0.78 (0.73-0.85) 40.0 0.09
Energy intake Yes 6 0.80 (0.74-0.87) 24.0 0.25 0.86 5 0.88 (0.74-1.05) 61.6 0.03 0.71 9 0.78 (0.72-0.85) 46.5 0.06 0.81
No 1 0.83 (0.57-1.23) 1 0.80 (0.57-1.12) 1 0.82 (0.63-1.05) ndenotes the number of studies. 1 P for heterogeneity within each subgroup, 2 P for heterogeneity between subgroups with meta-regression analysis, 3 P for heterogeneity between men and women (studies with genders mixed were excluded),
NC = not calculable

Table S16: Subgroup analyses of whole grains and total cancer and all-cause mortality, per 3 servings per day Total cancer All-cause mortality
n RR (95% CI) I2 Ph
1 Ph
2 n RR (95% CI) I
2 Ph
1 Ph
2
All studies 6 0.85 (0.80-0.91) 37.0 0.16 11 0.83 (0.77-0.90) 82.9 <0.0001
Duration of follow-up
<10 yrs follow-up 1 0.77 (0.43-1.38) 0.74 1 0.98 (0.67-1.44) 0.55
≥10 yrs follow-up 5 0.86 (0.80-0.92) 49.0 0.10 10 0.82 (0.76-0.89) 84.3 <0.0001
Outcome
Incidence 0 NC - NC
Mortality 6 0.87 (0.81-0.93) 51.2 0.07 10 0.82 (0.75-0.89) 83.9 <0.0001
Gender
Men 2 0.83 (0.77-0.89) 0 0.36 0.63/
0.13
3 0.93 (0.80-1.08) 86.2 0.001 0.39/
0.27 Women 3 0.92 (0.86-0.98) 0 0.92 5 0.78 (0.68-0.88) 80.5 <0.0001
Men and women 2 0.79 (0.74-0.84) 0 0.94 5 0.81 (0.73-0.91) 41.1 0.15
Geographic location
Europe 2 0.86 (0.81-0.91) 0 0.72 0.87 3 0.94 (0.76-1.16) 90.7 <0.0001 0.53
America 4 0.87 (0.78-0.97) 58.5 0.07 7 0.77 (0.70-0.85) 72.6 0.001
Asia 0 1 0.94 (0.80-1.16)
Australia 0 0
Number of cases
Cases <500 1 0.77 (0.43-1.38) 0.74 2 0.91 (0.67-1.23) 0 0.52 0.82
Cases 500-<1000 0 1 0.77 (0.61-0.96)
Cases ≥1000 5 0.86 (0.80-0.92) 49.0 0.10 8 0.83 (0.76-0.90) 87.8 <0.0001
Validated dietary assessment
Yes 6 0.85 (0.80-0.91) 37.0 0.16 NC 9 0.82 (0.75-0.89) 85.7 <0.0001 0.60
No 0 2 0.92 (0.78-1.10) 0 0.55
Study quality
0-3 stars 0 NC 0 0.51
4-6 0 1 0.94 (0.80-1.16)
7-9 6 0.85 (0.80-0.91) 37.0 0.16 10 0.82 (0.76-0.89) 83.9 <0.0001
Adjustment for confounding factors
Age Yes 6 0.85 (0.80-0.91) 37.0 0.16 NC 11 0.83 (0.77-0.90) 82.9 <0.0001 NC
No 0 0
Education Yes 4 0.84 (0.78-0.90) 51.1 0.11 0.36 8 0.83 (0.76-0.91) 84.5 <0.0001 0.97
No 2 0.93 (0.80-1.08) 0 0.66 3 0.83 (0.67-1.03) 84.4 0.002
Family history of CHD Yes 2 0.93 (0.80-1.08) 0 0.66 0.36 2 0.78 (0.57-1.06) 90.6 0.001 0.67

No 4 0.84 (0.78-0.90) 51.1 0.11 9 0.84 (0.77-0.92) 83.3 <0.0001
Body mass index Yes 6 0.85 (0.80-0.91) 37.0 0.16 NC 10 0.84 (0.78-0.91) 82.2 <0.0001 0.02
No 0 1 0.30 (0.15-0.60)
Smoking
Yes 6 0.85 (0.80-0.91) 37.0 0.16 NC 11 0.83 (0.77-0.90) 82.9 <0.0001 NC
No 0 0
Alcohol Yes 6 0.85 (0.80-0.91) 37.0 0.16 NC 10 0.80 (0.75-0.86) 71.0 <0.0001 0.07
No 0 1 1.05 (0.95-1.17)
Physical activity Yes 5 0.86 (0.78-0.95) 45.2 0.12 0.95 9 0.81 (0.72-0.91) 85.5 <0.0001 0.67
No 1 0.86 (0.81-0.91) 2 0.85 (0.76-0.96) 51.9 0.15
Hypertension Yes 2 0.93 (0.80-1.08) 0 0.66 0.36 5 0.84 (0.69-1.02) 85.6 <0.0001 0.74
No 4 0.84 (0.78-0.90) 51.1 0.11 6 0.81 (0.75-0.87) 75.4 0.001
Hypercholesterolemia Yes 2 0.93 (0.80-1.08) 0 0.66 0.36 2 0.78 (0.57-1.06) 90.6 0.001 0.67
No 4 0.84 (0.78-0.90) 51.1 0.11 9 0.84 (0.77-0.92) 83.3 <0.0001
Coffee Yes 1 0.92 (0.81-1.04) 0.36 1 0.80 (0.73-0.87) 0.99
No 5 0.84 (0.79-0.89) 30.2 0.22 10 0.83 (0.76-0.91) 84.6 <0.0001
Sugar-sweetened
beverages
Yes 2 0.93 (0.80-1.08) 0 0.66 0.36 3 0.67 (0.47-0.95) 89.0 <0.0001 0.25
No 4 0.84 (0.78-0.90) 51.1 0.11 8 0.85 (0.79-0.93) 82.4 <0.0001
Red or processed meat Yes 4 0.87 (0.78-0.97) 58.5 0.07 0.87 5 0.77 (0.69-0.86) 81.7 <0.0001 0.17
No 2 0.86 (0.81-0.91) 0 0.72 6 0.90 (0.78-1.03) 78.9 <0.0001
Fish Yes 1 0.92 (0.81-1.04) 0.36 1 0.80 (0.73-0.87) 0.99
No 5 0.84 (0.79-0.89) 30.2 0.22 10 0.83 (0.76-0.91) 84.6 <0.0001
Fruit and vegetables Yes 5 0.86 (0.78-0.95) 45.2 0.12 0.95 6 0.78 (0.70-0.87) 78.6 <0.0001 0.27
No 1 0.86 (0.81-0.91) 5 0.89 (0.77-1.03) 82.7 <0.0001
Dairy Yes 0 NC 1 0.30 (0.15-0.60) 0.02
No 6 0.85 (0.80-0.91) 37.0 0.16 10 0.84 (0.78-0.91) 82.2 <0.0001
Energy intake Yes 6 0.85 (0.80-0.91) 37.0 0.16 NC 10 0.82 (0.76-0.89) 83.9 <0.0001 0.51
No 0 1 0.94 (0.80-1.16)
ndenotes the number of studies. 1 P for heterogeneity within each subgroup, 2 P for heterogeneity between subgroups with meta-regression analysis, 3 P for heterogeneity between men and women (studies with genders mixed were excluded),
NC = not calculable

Table S17: Study quality of studies included in the analysis of whole grains and coronary heart disease
Author,
publication year
Represen-
tativeness
Selection
of non-
exposed
cohort
Exposure-
ascertainment1
Demonstration
of outcome not
present at start
Adjustment
for age
Adjustment
for any
other factor
Assess-
ment of
outcome
Long
enough
follow-
up
Adequacy
of follow-
up2
Total score
Helnæs, 2016 1 1 1 1 1 1 1 1 1 9
Wang, 2016 0 1 0 0 1 1 1 1 0 5
Johnsen, 2015 1 1 1 0 1 1 1 1 1 8
Rautiainen, 2012 1 1 1 1 1 1 1 1 1 9
Jacobs, 2007 1 1 1 1 1 1 1 1 0 8
Jensen, 2004 0 1 1 1 1 1 1 1 1 8
Steffen, 2003 1 1 1 1 1 1 1 1 1 9
Liu, 1999 0 1 1 1 1 1 1 1 1 8
1 1 point for validated self-reported questionnairesor interview
2 1 point for loss-to-follow-up less than 10%
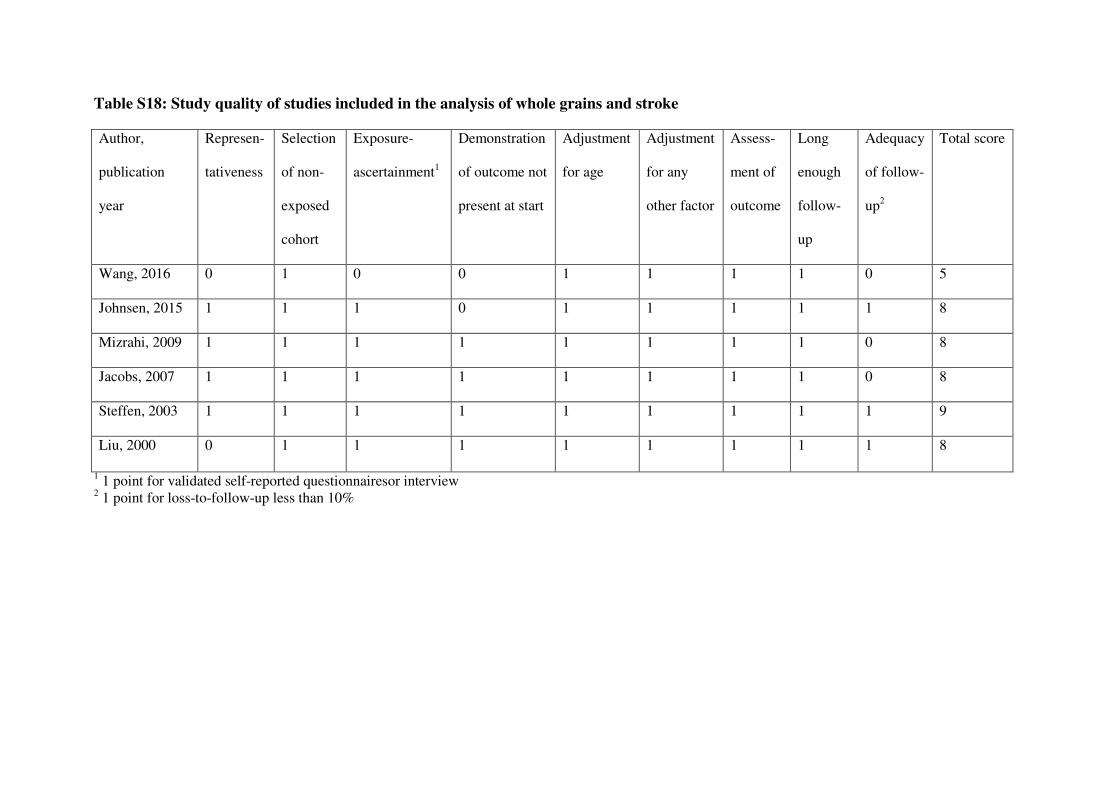
Table S18: Study quality of studies included in the analysis of whole grains and stroke
Author,
publication
year
Represen-
tativeness
Selection
of non-
exposed
cohort
Exposure-
ascertainment1
Demonstration
of outcome not
present at start
Adjustment
for age
Adjustment
for any
other factor
Assess-
ment of
outcome
Long
enough
follow-
up
Adequacy
of follow-
up2
Total score
Wang, 2016 0 1 0 0 1 1 1 1 0 5
Johnsen, 2015 1 1 1 0 1 1 1 1 1 8
Mizrahi, 2009 1 1 1 1 1 1 1 1 0 8
Jacobs, 2007 1 1 1 1 1 1 1 1 0 8
Steffen, 2003 1 1 1 1 1 1 1 1 1 9
Liu, 2000 0 1 1 1 1 1 1 1 1 8
1 1 point for validated self-reported questionnairesor interview
2 1 point for loss-to-follow-up less than 10%

Table S19: Study quality of studies included in the analysis of whole grains and cardiovascular disease
Author, publication
year
Represen-
tativeness
Selection
of non-
exposed
cohort
Exposure-
ascertainment1
Demonstration
of outcome not
present at start
Adjustment
for age
Adjustment
for any
other factor
Assess-
ment of
outcome
Long
enough
follow-
up
Adequacy
of follow-
up2
Total score
Wang, 2016 0 1 0 0 1 1 1 1 0 5
Huang, 2015 1 1 1 1 1 1 1 1 0 8
Johnsen, 2015 1 1 1 0 1 1 1 1 1 8
Sonestedt, 2015 1 1 1 1 1 1 1 1 0 8
Wu, 2015, HPFS 0 1 1 1 1 1 1 1 1 8
Wu, 2015, NHS 0 1 1 1 1 1 1 1 1 8
Buil-Cosiales, 2014 0 1 1 1 1 1 1 1 0 7
Fitzgerald, 2012 1 1 1 1 1 1 1 1 1 9
Jacobs, 2007 1 1 1 1 1 1 1 1 0 8
Sahyoun, 2006 1 1 1 1 1 1 1 1 0 8
1 1 point for validated self-reported questionnairesor interview
2 1 point for loss-to-follow-up less than 10%

Table S20: Study quality of studies included in the analysis of whole grains and total cancer
Author, publication
year
Represen-
tativeness
Selection
of non-
exposed
cohort
Exposure-
ascertainment1
Demonstration
of outcome not
present at start
Adjustment
for age
Adjustment
for any
other factor
Assess-
ment of
outcome
Long
enough
follow-
up
Adequacy
of follow-
up2
Total score
Huang, 2015 1 1 1 1 1 1 1 1 0 8
Johnsen, 2015 1 1 1 0 1 1 1 1 1 8
Wu, 2015, HPFS 0 1 1 1 1 1 1 1 1 8
Wu, 2015, NHS 0 1 1 1 1 1 1 1 1 8
Buil-Cosiales, 2014 0 1 1 1 1 1 1 1 0 7
Jacobs, 2007 1 1 1 1 1 1 1 1 0 8
1 1 point for validated self-reported questionnaires or interview
2 1 point for loss-to-follow-up less than 10%

Table S21: Study quality of studies included in the analysis of whole grains and all-cause mortality
Author, publication
year
Represen-
tativeness
Selection
of non-
exposed
cohort
Exposure-
ascertainment1
Demonstration
of outcome not
present at
start2
Adjustment
for age
Adjustment
for any
other factor
Assess-
ment of
outcome
Long
enough
follow-
up
Adequacy
of follow-
up3
Total score
Wang, 2016 0 1 0 0 1 1 1 1 0 5
Huang, 2015 1 1 1 1 1 1 1 1 0 8
Johnsen, 2015 1 1 1 0 1 1 1 1 1 8
Wu, 2015, HPFS 0 1 1 1 1 1 1 1 1 8
Wu, 2015, NHS 0 1 1 1 1 1 1 1 1 8
Boggs, 2014 1 1 1 1 1 1 1 1 1 9
Buil-Cosiales, 2014 0 1 1 1 1 1 1 1 0 7
van den Brandt, 2011 1 1 1 1 1 1 1 1 1 9
Jacobs, 2007 1 1 1 1 1 1 1 1 0 8
Sahyoun, 2006 1 1 1 1 1 1 1 1 0 8
Steffen, 2003 1 1 1 1 1 1 1 1 1 9
1 1 point for validated self-reported questionnaires or interview
2 1 point for exclusion of prevalent cardiovascular disease or cancer cases
3 1 point for loss-to-follow-up less than 10%