Appendices to Phase I Eagle Conservation Plan, … and Sierra Madre Wind Energy Project . ... Wind...
297
Appendix A
Transcript of Appendices to Phase I Eagle Conservation Plan, … and Sierra Madre Wind Energy Project . ... Wind...

Appendix A

This page intentionally left blank


This page intentionally left blank

Appendix B

This page intentionally left blank

Avian and Bat Monitoring Protocols for the
Chokecherry and Sierra Madre Wind Energy Project
Prepared for:
Power Company of Wyoming, LLC 555 17th Street, Suite 2400
Denver, CO 80202
Prepared by:
SWCA Environmental Consultants 295 Interlocken Blvd, Suite 300
Broomfield, CO 80021 303.487.1183 Fax: 303.487.1245
www.swca.com
March 2011

This page intentionally left blank

Avian Monitoring Protocols 2 Chokecherry and Sierra Madre Wind Energy Project
Review of Agency Recommendations The following protocols have been developed in accordance with the following agency recommendations: U.S. Fish and Wildlife Service (USFWS) Wind Turbine Guidelines Advisory Committee Recommendations on Developing Effective
Measures to Mitigate Impacts to Wildlife and Their Habitats Related to Land-Based Wind Energy Facilities (USFWS 2010)
USFWS Draft Land-Based Wind Energy Guidelines (USFWS 2011a) Draft Eagle Conservation Plan Guidance (USFWS 2011b) Wyoming Department of Game and Fish (WGFD) Wildlife Protection Recommendations for Wind Energy Development in Wyoming (WGFD 2010) Bureau of Land Management (BLM) Rawlins Field Office Wildlife Survey Protocols for Wind Energy Development, Generally, UFWS survey recommendations (USFWS 2010, 2011a, and 2011b) include using standard sampling methods to determine avian use of a project area, fatality risk in a project area, the presence of sensitive species and other species of interest, and to provide a baseline for assessing displacement effects and habitat loss. USFWS recommends that sampling frequency, type, and duration be sufficient to account for variability of avian use between and within sampling periods. When more precise estimates of density are required for a special status species, other methods, including radar or nocturnal surveys have been recommended when risks for collision are expected.
Similarly, the Bureau of Land Management (BLM) Rawlins Field Office Wildlife Survey Protocols for Wind Energy Development recommends that surveys be sufficient to detect temporal and spatial use patterns within the project area. Special emphasis is placed on surveys for raptors and sensitive avian species. BLM survey protocols recommend weekly, 20-minute point counts to record avian use of a project area. Survey times are recommended to be varied weekly to ensure that avian use during daylight hours is adequately documented. In addition to weekly surveys, marine radar is recommended to better define avian foraging, dispersal, and migration paths.
Wyoming Game and Fish Department’s (WGFD) Wildlife Protections Recommendations for Wind Energy Development in Wyoming recommend sufficient numbers of weekly point count surveys during spring and fall migration periods following similar protocols as specific by BLM with survey periods of twenty minutes at each point. WGFD recommends that four surveys be conducted during winter months to capture overwintering avian species. For raptor species, WGFD recommends nest surveys and weekly day-long surveys during spring and fall migration periods.

Avian Monitoring Protocols 3 Chokecherry and Sierra Madre Wind Energy Project
Review of Existing Data In compliance with its obligations under the National Environmental Policy Act of 1969 (NEPA), BLM is preparing an environmental impact statement (EIS) analyzing the potential impacts of the Chokecherry and Sierra Madre Wind Energy Project (Project) on lands and resources within the Project area. Between June 2008 and June 2009, avian use data were collected for much of the Project area as part of the BLM NEPA process [Johnson et al. 2008]. Data were collected using standard point count methods at 19 locations in all months except January and February when much of the Project area was inaccessible due to adverse weather conditions. All sites except for three were visited 31 times during the survey period. WEST, Inc. (WEST) conducted avian point surveys of the Project area between June 26, 2008 and June 15, 2009. A portion of these data are analyzed in WEST’s report, “Baseline Avian Use Studies for the Chokecherry and Sierra Madre Wind Resource Areas, Carbon County, Wyoming: Final Summer and Fall Interim Report, June 26-October 14, 2008” (Johnson et al. 2008). WEST also prepared a report summarizing bat surveys conducted between July 13 through October 13, 2008 titled, “Bat Surveys for the Chokecherry and Sierra Madre Wind Resource Areas, Carbon County, Wyoming: Final Report” (Solick et al. 2008). SWCA has completed additional analyses of all data collected in 2008 and 2009 to determine compliance with various agency monitoring recommendations.
Data collected during the 2008 and 2009 surveys are sufficient to provide estimates of avian use of the Project area as well as to provide initial estimates of the frequency of each species at rotor-swept heights. Horned lark (Eremophila alpestris) was predominantly the most common avian species detected in the 2008 and 2009 surveys, having over 800 individual detections. The next most common species were the common raven (Corvus corax) with less than 200 detections, and vesper sparrow (Pooecetes gramineus) with less than 150 detections. Golden eagle (Aquila chrysaetos), red-tailed hawk (Buteo jamaicensis), and common raven were most commonly observed within the rotary height of the turbines.
Data collected during 2008 and 2009 comply with the agency wind energy survey recommendations described in the previous section and serve as one year of suggested pre-construction monitoring data. Data collected for purposes of NEPA compliance provide estimates of collision and fatality risk and enable determination of avian use of the Project area, the presence of sensitive species and other species of interest, as well as providing a baseline for assessing displacement effects and habitat loss.
Project-Specific Protocols
To supplement the 2008-2009 dataset and to better identify concentrated avian use areas for development of a Project-specific Avian Protection Plan (APP) and an Eagle Conservation Plan (ECP), an intensive one-year survey will be used to better identify avian use areas in the Project area. Protocols have been developed following the various agency recommendations discussed above and in coordination with local USFS, BLM, and WGFD biologists. The protocols are consistent with agency recommendations and will provide more detailed site-specific use data than the protocols individually recommended by any of the agencies.

Avian Monitoring Protocols 4 Chokecherry and Sierra Madre Wind Energy Project
A combination of avian radar, raptor count stations, standard grid sampling, and point count surveys will be used to determine avian use across the Project area with emphasis on large raptors including golden eagles. Avian radar technology has been identified by the BLM and USFWS as a desired method to map areas of high avian use. The sampling design will follow recommendations made by the USFWS, BLM, and WGFD by combining radar surveys with standard point count and breeding bird methodologies. The radar technology will also enable better identification of bat use areas and relative densities of bats in the Project area.
A DeTect Merlin Avian Radar System will be used to map avian use across the Project area. The DeTect Merlin radar system is a trailer-mounted system with a 200-watt horizontal solid-state S-band radar and a 10–kilowatt (kW) vertically operating X-band open array radar. The horizontal radar has a range of 2 to 5 miles in a 360-degree pattern around the unit. The vertical radar has a 24-degree beam width and detects flight paths 0.75 to 2.00 miles above the unit.
The avian radar system requires weekly maintenance and fueling and cannot be moved over extremely rough terrain on a regular basis. Additionally, the system will not differentiate between large raptors such as golden eagles and other large birds including geese, other large raptors, and possibly even ravens and; therefore, will be used in conjunction with field surveys to validate radar recorded data. However, the radar system, when coupled with point count verification of avian use, will allow for accurate horizontal and vertical mapping of avian use in the Project area. The radar system will also enable mapping of high use areas for bat species.
A combination of raptor and point surveys and breeding bird grid surveys will be conducted in concert with the radar survey. This design will provide intensive survey information regarding avian use patterns within the radar survey perimeter for each season. Raptor count stations, point counts, and breeding bird surveys will be used to validate the radar data and provide estimates of species-specific use patterns. Raptor stations and point count surveys will record the location, flight path, approximate height, and time of use for any individual observed from the count location. Raptor count locations will be surveyed for 8-12 hours per day during periods with the highest likelihood for detection of migrating birds and/or large raptors. Standard 20-minute point counts will be completed at each raptor count location. Timing of point count surveys at each location will be varied to determine patterns of avian use during daylight hours.
In addition to the raptor, point count, and radar surveys, breeding bird surveys will be completed at 15 locations across the Project area. Breeding bird surveys will be conducted following the grid monitoring protocols published by the Rocky Mountain Bird Observatory (RMBO) (Hanni et al. 2010). Grid survey locations will be randomly selected using a generalized random tessellation stratified design to ensure a spatially balanced design stratified by major vegetation and habitat types in the Project area. Data collected as part of the grid monitoring efforts will also be used to validate radar data and better determine avian species use. As part of the breeding bird surveys, waterfowl and water bird use surveys will be conducted three times annually (springs, summer, and fall) to identify migrating and resident species.
Locations for placement of the radar and for conducting point count surveys (Figure 1) and breeding bird surveys were determined using a four-tiered approach:
Tier 1 – Survey areas should determine avian use within the Project area.

Avian Monitoring Protocols 5 Chokecherry and Sierra Madre Wind Energy Project
Tier 2 – Survey areas should overlap possible foraging areas for large raptors (winter range areas, prairie dog towns, waterfowl use areas, etc.).
Tier 3 – Survey areas should be in locations to allow for detection of avian movement into and out of the Project area.
Tier 4 – Survey areas should capture variability in habitat and topography.
Locations of radar placement were refined following attendance at DeTect’s radar training courses and during coordination with DeTect’s radar placement specialists. Figure 1 reflects the revised radar locations. Final placement of the radar unit and final point locations for survey will be determine in early spring 2011 following radar unit delivery.

Avian Monitoring Protocols 6 Chokecherry and Sierra Madre Wind Energy Project
Figure 1. Approximation of area surveyed using avian radar and traditional point count methodologies with respect to possible wind turbine locations. Spring, summer, and fall radar installation locations are the center point of the large blue circles. Proposed point count locations are the center points of the small black circles. Potential winter radar locations are the four blue points. Final locations for survey will be determined in coordination with BLM, WGFD, and USFWS.

Avian Monitoring Protocols 7 Chokecherry and Sierra Madre Wind Energy Project
The radar unit will be placed at five locations within the Project area (Figure 1). Point counts will be completed at nine additional locations to map avian use patterns where radar coverage is not possible. Eight of these point counts will be completed at permanent sampling locations. The ninth point count location will be completed at the radar site to validate the data being collected by the radar unit. During winter months, the radar will be placed in a location that has high probability of access on a weekly basis. Much of the project area is covered in snow and large drifts during winter; therefore, radar placement in winter will likely be near the Bolton Ranch headquarters, south of I-80 near the North Platte River, on the Bolton Road east of Teton Reservoir, or on the north side of the Chokecherry project area (Figure 1). Winter point count survey locations will also be adjusted as needed to account for winter weather conditions, access issues, and safety concerns.
Based on a four mile radius for radar surveys and a one mile radius for point count surveys, approximately 90-93% of the turbine locations, depending on winter radar placement, will be directly surveyed. It is likely that this percentage is higher than 90-93% for large raptors including bald and golden eagles as many of the point count locations have visibility of several miles and recent radar advancements may allow for detection of large raptors out to 5+ miles. Point count locations outside of the radar survey perimeters have been placed to allow for detection of raptors moving into the Project area and between radar surveyed zones.
Helicopter flights will be completed in mid-April or early May to document eagle nesting activity as well as nesting activity of other raptors that are incidentally observed. Aerial nest activity surveys will be completed in accordance with the recent draft eagle guidance (USFWS 2011b). Following identification of active eagle nests, follow-up productivity surveys will be completed from the ground above/below the nest to determine nesting and fledging success.
The protocols and schedule outlined below will be followed for monitoring and mapping avian and bat use across the Project area using the marine radar system, point counts, and breeding bird surveys.
1. Winter 2010/2011 – Radar construction, programming, and training. The Draft APP/ECP will be delivered to USFWS, BLM, and WGFD for review in late winter/early spring. Among other descriptive sections, the preliminary plan will contain the detailed sampling protocols, preliminary mitigation and avoidance measures, and detailed adaptive management protocols. Monthly reconnaissance surveys will be completed to document eagle use of the Project area during winter months and to help determine best locations for winter 2011/2012 deployment of the radar system.
2. Spring and Early Summer 2011 – Radar surveys will begin in the southern portion of the Project area. The radar system will be moved once during the spring migration period to capture as much data as possible during this period. During the migration period, weekly migratory bird counts and raptor use surveys will be conducted at the eight point counts identified in Figure 1 as well as at the point where the radar system is placed. Breeding bird surveys will be completed at 15 locations across the Project area. Surveys for waterfowl and other waterbirds will be conducted once during the spring migration at Kindt, Rasmussen, Sage Creek, and Teton reservoirs. Analysis of the radar data will be

Avian Monitoring Protocols 8 Chokecherry and Sierra Madre Wind Energy Project
used to identify areas with high avian and bat use. The following schedule will be used for spring and early summer 2011 surveys:
a. March 15 – May 15, 2011: Radar system will be initialized and debugged prior to main migratory period. Initial installation will occur at the southeastern-most radar survey location identified on Figure 1. This survey location will detect migrating birds in areas adjacent to the Platte River corridor and along the ridgeline north of the Jack Creek road. Weekly point count locations will be completed at the eight point count locations identified in Figure 1 as well as at the radar location.
b. May 15–July 31, 2011: Radar system will be moved to the northeastern survey location (Figure 1). This survey location will detect migrating birds adjacent to and along the Bolten Rim as well as in the basin below the Bolten Rim. Migratory use and raptor soaring locations within and adjacent to the ridgelines in this portion of Chokecherry will also be surveyed using the radar system. Between May 15 and June 30, weekly point surveys will be conducted at the eight locations identified on Figure 1 as well as at the radar location. During the month of July, the point count locations will be visited twice instead of every week in compliance with BLM and WGFD recommendations. Additionally, this time is between migratory periods and typically bird movements are lower because of nesting activities. A point count will be conducted weekly at the radar installation location during this period during routine maintenance activities.
c. May 25–June 30, 2011: Breeding bird surveys will be completed once at each of 15 locations across the Project area to determine relative abundance, species richness, and habitat use patterns. Breeding bird surveys will follow RMBO grid survey protocols (Hanni et al. 2010). Bird flight patterns will be documented to better define risks of wind development activities. All raptors as well as their flight paths and heights will be recorded at all breeding bird locations regardless of whether the raptor falls within the grid survey area.
d. May 1, 2011: An agency meeting will be scheduled to discuss preliminary analyses of radar data from early spring migration to allow for more informed use of the radar and survey data that will be used in the APP/ECP.
3. Late Summer – Fall 2011: The radar system will be moved once during the fall migration period to capture as much data as possible during this period. During the migration period, weekly migratory bird counts and raptor use surveys will be conducted at the eight point counts identified in Figure 1 as well as at the point where the radar system is placed. Waterfowl and wading bird surveys will be conducted once during late summer to detect nesting activity and once during fall migration at Kindt, Rasmussen, Sage Creek, and Teton reservoirs. Analysis of the radar data collected during spring and early summer will be completed to evaluate bird and bat use and to identify appropriate mitigation measures that could be implemented. The following schedule will be used for late summer and fall 2011 surveys:

Avian Monitoring Protocols 9 Chokecherry and Sierra Madre Wind Energy Project
a. August 1: A revised APP/ECP will be delivered to the agencies for review and approval. The revised APPECP will contain the mitigation measures that will be applied to remove or minimize risks to avian species. The revised APP/ECP will also identify the adaptive management process that will be followed to update the APP/ECP and apply additional site-specific mitigation measures as additional data are obtained prior to, during and after construction. An interim report of radar data trends and observations will also be provided with the revised APP/ECP.
b. August 1– September 30, 2011: Radar system will be installed at the western radar location in the Chokecherry project area radar survey location identified on Figure 1. This survey location will detect migrating birds in the western portion of Chokecherry as well as along the rim of Chokecherry and the basin between Chokecherry and Atlantic Rim. During the month of August, the point count locations will be visited twice instead of every week. A point count will be conducted weekly at the radar installation location during August as part of routine maintenance activities. During September, weekly point count locations will be completed at the eight point count locations identified in Figure 1 as well as at the radar location.
c. October 1–November 15, 2011: Radar system will be moved to a location along the rim of Miller Hill in the southwestern portion of the project area (Figure 1). This survey location will detect birds in the Miller Hill area and below the Miller Hill rim in the Sage Creek Basin. Weekly point count surveys will be conducted at the eight locations identified on Figure 1 as well as at the radar location.
4. Winter 2011/2012 (November 16, 2011–March 30, 2012) – A final APP/ECP will be delivered to the agencies for review. The final APP/ECP will identify the avoidance, minimization, and mitigation measures to reduce threats to eagles and other avian species. The radar system will be deployed in a suitable location to ensure weekly maintenance is possible during winter months. Weekly bird observations will be recorded during routine maintenance activities at the radar location. Weather permitting, monthly counts will be conducted at the point count locations in Figure 1.
5. Spring 2012 – PCW and the agencies will initiate the adaptive management process identified and approved in the final APP to incorporate site-specific mitigation and avoidance measures into final project designs and the Final Environmental Impact Statement and Record of Decision. A final report documenting the results of the radar and point count efforts will be provided at least two weeks prior to the initiation of the adaptive management process to ensure adequate review time prior to discussions.

Avian Monitoring Protocols 10 Chokecherry and Sierra Madre Wind Energy Project
LITERATURE CITED
Detmers, R., D.A. Buehler, J.G. Bartlett, and N.A. Klaus. 1999. Influence of point count length and repeated visits on habitat model performance. Journal of Wildlife Management 63:815-823. Gerrodette, T. 1987. A power analysis for detecting trends. Ecology 68:1364–1372. Hester, S.G. and M.B. Grenier. 2005. A conservation plan for bats in Wyoming. Wyoming Game and Fish Department, Nongame Program, Lander, WY. Johnson, G., T. Rintz, M.D. Strickland, and K. Bay. 2008. Baseline avian use studies for the Chokecherry and Sierra Madre Wind Resource Areas, Carbon County, Wyoming: final summer and fall interim report, June 26-October 14, 2008. Submitted to ENSR, Golden, CO by Western Ecosystems Technology, Inc., Cheyenne, Wyoming. Reynolds, R.T., J.M. Scott, and R.A. Nussbaum. 1980. A Variable Circular-Plot Method for Estimating Bird Numbers. Condor 82:309-313. Solick, D., Johnson, G., T. Rintz, and M.D. Strickland. 2008. Bat surveys for the Chokecherry and Sierra Madre Wind Resource Areas, Carbon County, Wyoming. Submitted to ENSR, Golden, CO by Western Ecosystems Technology, Inc., Cheyenne, Wyoming. U.S. Fish and Wildlife Service [USFWS]. 2010. Recommendations on developing effective measures to mitigate impacts to wildlife and their habitats related to land-based wind energy facilities. Submitted to the Secretary of the Interior by the Wind Turbine Guidelines Advisory Committee. USFWS. 2011a. Draft Land-Based Wind Energy Guidelines, Recommendations on measures to avoid, minimize, and compensate for effects to fish, wildlife, and their habitats USFWS. 2011b. Draft eagle conservation plan guidance. January 2011. Wyoming Game and Fish Department [WGFD]. 2010. Wildlife protection recommendations for wind development in Wyoming. Commission approved version (4-23-2010). 70pp.

This page intentionally left blank

2012 – 2013 800-meter Raptor Survey Protocols
Chokecherry and Sierra Madre Wind Energy Project
Prepared for:
Power Company of Wyoming, LLC 555 17th Street, Suite 2400
Denver, CO 80202
Prepared by:
SWCA Environmental Consultants 295 Interlocken Blvd., Suite 300
Broomfield, CO 80021 (303) 487-1183 / Fax (303) 487-1245
August 31, 2012

This page intentionally left blank

1 SWCA
Introduction
The Power Company of Wyoming LLC (PCW) recently initiated revisions to the methodologies currently used to survey for raptors at the Chokecherry and Sierra Madre Wind Energy Project (Project). Based on conversations with U.S. Fish and Wildlife Service (Service) personnel, and in an effort to collect data that are appropriate for use in the Service’s model that predicts the potential fatality rate of eagles for wind energy projects (hereafter, the Service’s model), raptor survey protocols were revised for the fall 2012 season and for future raptor survey efforts. These survey methodology revisions are fully compliant with the recommendations for raptor surveys set forth by the Service in their Draft Eagle Conservation Plan Guidance (Draft ECP Guidance), the Eagle Conservation Plan Guidance Module 1 – Land-based Wind Energy Technical Appendices (Technical Appendices; as received from Kevin Kritz, Service Region 6, on August 4, 2012), and the Land-Based Wind Energy Guidelines, while still maintaining expansive coverage of the Project site.
Year Two and Year Three 4,000-meter-radius long-watch raptor surveys were fully compliant with the recommendations set forth by the Service’s Draft ECP Guidance (Service 2011) and Land-Based Wind Energy Guidelines (Service 2012a), the Bureau of Land Management’s (BLM’s) Wildlife Survey Protocols for Wind Energy Development (BLM 2008), and the Wyoming Game and Fish Department’s (WGFD’s) Wildlife Protection Recommendations for Wind Energy Development (WGFD 2010). These surveys were successful in identifying concentrated raptor use areas across the Project that could be used to design avoidance areas in order to minimize avian impacts. Additionally, 4,000-meter data were instructive in showing the Project site is not a strong migratory corridor for raptors, and the flight paths digitized from these data were used to identify high eagle-use areas as recommended by the Service’s Technical Appendices (Service 2012b).
Because the Service’s model requires data from 800-meter point count survey efforts, the 4,000-meter data were truncated to include only those observations that occurred within 800 meters (Figure 1). However, due to the 4,000-meter raptor count locations being placed on promenades, ridgelines, and in areas where there was an expectation of high raptor use, estimates of use, and therefore risk calculations that were developed for use across the entire Project site, were overstated due to many of these data being collected in identified high-use areas. Because use estimates were being driven upwards for the Project by many of the data being collected in high-use areas, unrealistic projections of eagle risk were being generated by the Service’s model. This in part facilitated the revision to survey protocols.
800-meter Raptor Survey Protocols
The revised raptor count protocols follow the 800-meter radius point count methodology recommended by the Service’s Technical Appendices (Service 2012b), and are also in accordance with the aforementioned guidance documents produced by the Service, BLM, and WGFD. PCW also sought consultation with Dr. Joshua Millspaugh (Professor of Wildlife Management, University of Missouri) to ensure the development of a rigorous sampling design that would result in the collection of data appropriate for the analysis methods and fatality model currently being used by the Service.

2 SWCA
Figure 1. All 800-meter raptor count locations and survey perimeters on the Project site.

3 SWCA
Based upon agency guidance and logistical considerations, the revised protocols were designed to include 40, 800-meter raptor count locations throughout areas of the Project site where turbine development was likely (Figure 1). Locations were selected using a spatially balanced random selection process with the number of 800-meter raptor count locations per area determined by the relative turbine density in the different areas of the Project. Raptor count locations were selected such that no overlap occurs between survey locations or with the avoidance areas that PCW has committed to as part of the Project Eagle Conservation Plan (ECP). Once the initial 800-meter raptor count locations were selected, some minimal micrositing of the locations was conducted to ensure full visibility of the survey areas and safe and consistent accessibility on the part of field personnel. Coordinates for each of the final 800-meter raptor survey locations are listed in Table 1. Landmarks and lathe stakes were located within each survey location perimeter to provide distance references for field personnel completing survey efforts. When the 800-meter radius survey areas of the new 40 point count locations are combined with the 800-meter radius survey areas of the Year Two and Year Three sites, 34.7% of the probable development areas are covered by raptor count surveys, which is greater than the 30% recommendation made by the Service (Service 2012b).
Table 1. Names and Coordinates for 2012 – 2013 800-meter Raptor Count Locations.
Location Easting Northing Location Easting Northing CB1 326414 4597515 MH4 305024 4594675 CB2 321985 4595451 MH5 309573 4590571 CB3 323462 4597428 MH6 306043 4597131 CB4 329306 4599449 PG1 313663 4594801 CC1 316611 4621251 PG2 311358 4598224 CC2 315166 4616447 PG3 307172 4603361 CC3 318351 4619090 PG4 314434 4597259 CC4 314539 4621971 PG5 313730 4599682 CC5 317418 4614741 PG6 312721 4603547 CC6 319335 4621702 PG7 310058 4595825 CC7 313825 4618366 PG8 311832 4594006 CC8 314807 4614119 PG9 311187 4600886 CC9 319294 4617332 SCR1 333505 4598194 CMD1 334482 4612363 SCR2 332597 4596408 CMD2 331648 4614732 SR1 323560 4617658 HB1 323818 4620014 SR2 327318 4618336 HB2 326781 4620243 UH1 328912 4615606 MH1 302291 4600564 UH2 327099 4615081 MH2 305677 4599125 UI1 323987 4612091 MH3 307684 4592030 UI2 327702 4610001
Surveys will be conducted at each raptor count location for two hours per guidance in the Technical Appendices (Service 2012b). Two avian technicians will each survey two locations a day for a total of 20 locations per week. Each location will be surveyed bi-weekly. A schedule for all 40 raptor count locations was designed to provide survey coverage across all daylight hours for each of the 40 sites. The schedule was also designed such that the four

4 SWCA
raptor count surveys conducted on any given day are separated temporally and spatially to provide independence of any observations that are made.
Avian technicians are equipped with binoculars, spotting scopes, laser rangefinders, and aerial maps to assist with accurate detection and documentation of all raptors observed within the 800-meter survey area. Each aerial map is displayed with relevant landforms occurring in the area, locations of lathe stakes, and concentric rings at each 200-meter interval to facilitate accurate distance estimation (Attachment 1). Each raptor flight path is recorded by technicians on the provided aerial maps. Additional data collected include species, number of individuals per observation, age, sex, behavior, bearing to bird, distance to bird, heading of bird, altitude of bird, the beginning and ending time for each observation, and hourly weather data (Attachment 2).
At present, the 800-meter raptor counts are scheduled to continue bi-weekly at each location through the fall migration period (November 15). Surveys are tentatively slated to occur once per month at each location during the winter season (December 2012 through March 2013) due to accessibility and safety concerns. The end of winter surveys in March 2013 will complete three full years of data collection for the Project. Consultations are ongoing with Service personnel to determine the scope of potential survey efforts beyond March 2013.
References
Bureau of Land Management (BLM). 2008. Wildlife Survey Protocols for Wind Energy Development.
U.S. Fish and Wildlife Service (Service). 2011. Draft Eagle Conservation Plan Guidance. Available online at http://www.fws.gov/windenergy/. Accessed December 2011.
———. 2012a. Land Based Wind Energy Guidelines. Wind Turbine Guidelines Advisory Committee. U.S. Fish and Wildlife Service, Department of the Interior, Washington D.C. Available online at http://www.fws.gov/windenergy/docs/WEG_final.pdf. Accessed August 2012.
———. 2012b. Eagle Conservation Plan Guidance Module 1 – Land-based Wind Energy Technical Appendices. Received from Kevin Kritz, Service Region 6, on August 4, 2012.
Wyoming Game and Fish Department (WGFD). 2010. Wildlife Protection Recommendations for Wind Energy Development in Wyoming. Wyoming Game and Fish Commission Approved November 17, 2010. Wyoming Game and Fish Department, Cheyenne, WY.

SWCA
ATTACHMENT 1 Example Aerial Map Used to Map Flight Paths during 800-meter Raptor
Count Surveys

This page intentionally left blank

A1-1 SWCA
Aerial map example.

This page intentionally left blank

SWCA
ATTACHMENT 2 Data Sheets Used to Collect Data during 800-meter Raptor Count Surveys

This page intentionally left blank

A2-1 SWCA
PCW 2011 Raptor Survey
Field Observer:
Survey Location:
Start time:
End time:
Date:
Page: ____ of _____
Target
# Obs
# Species
# Birds
Age Sex Behav Bearing
to Bird (°) Distance
to Bird (m) Angle of Bird (°)
Heading of Bird
0- 30
30-150
150+ Time Begin
Time End

A2-2 SWCA
PCW 2011 Raptor Survey Notes
Field Observer:
Survey Pt:
Date:
Page: _____ of _____
Other species and Notes:
Weather Conditions
Wind
Time Sky Dir Spd Temp (°F)
Incidental Species Observations

Revised 2012-2013 800-meter Raptor Survey Protocols
Chokecherry and Sierra Madre Wind Energy Project
Prepared for:
Power Company of Wyoming, LLC 555 17th Street, Suite 2400
Denver, CO 80202
Prepared by:
SWCA Environmental Consultants 295 Interlocken Blvd., Suite 300
Broomfield, CO 80021 (303) 487-1183 / Fax (303) 487-1245
November 2012

This page intentionally left blank

1 SWCA
The Power Company of Wyoming (PCW) recently initiated revisions to the methodologies currently used to survey for raptors at their Chokecherry and Sierra Madre Wind Energy Project (Project). Based on conversations with U.S. Fish and Wildlife Service (Service) personnel, and in an effort to collect data that are appropriate for use in the Service’s model that predicts the potential fatality rate of eagles for wind energy projects (hereafter, the Service’s model), raptor survey protocols were revised for the fall 2012 season and for future raptor survey efforts. On August 31, 2012, PCW provided the Service with a revised protocol for conducting eagle and raptor surveys at 40 800-meter point count survey sites throughout the Project. PCW began surveying the 40 locations at the beginning of the autumn 2012 survey season and it is anticipated that those survey efforts will continue through October 2012 at which time the revised protocols discussed in this document will be initiated. On September 28, 2012, the Service issued a letter recommending slight modifications to the August 31, 2012 protocols. This revised protocol addresses the comments made by the Service and specific responses to each comment made are provided in Attachment 1.
These survey methodology revisions are fully consistent with the recommendations for raptor surveys set forth by the Service in their Draft Eagle Conservation Plan Guidance (Draft ECP Guidance), the Eagle Conservation Plan Guidance Module 1 – Land-based Wind Energy Technical Appendices (Technical Appendices; as received from Kevin Kritz, Service Region 6, on August 4, 2012), and the Land-Based Wind Energy Guidelines, while still maintaining expansive coverage of the Project Site.
Year Two and Year Three long-watch raptor surveys were fully consistent with the recommendations set forth by the Service’s Draft ECP Guidance (Service 2011) and Land-Based Wind Energy Guidelines (Service 2012a), the Bureau of Land Management’s (BLM’s) Wildlife Survey Protocols for Wind Energy Development (BLM 2008), and the Wyoming Game and Fish Department’s (WGFD’s) Wildlife Protection Recommendations for Wind Energy Development (WGFD 2010). These surveys were very successful in identifying concentrated raptor use areas across the Project that could be used to design avoidance areas to minimize avian impacts. Additionally, long-watch survey data were instructive in showing the Project Site is not a strong migratory corridor for raptors, and the flight paths digitized from these data were used to identify high eagle use areas as recommended by the Service’s Technical Appendices (Service 2012b).
The revised raptor count protocols follow the 800-meter radius point count methodology recommended by the Service’s Technical Appendices (Service 2012b), and are also in accordance with the aforementioned guidance documents produced by the Service, BLM, and WGFD. PCW also sought consultation with Dr. Joshua Millspaugh (Professor of Wildlife Management, University of Missouri) to ensure the development of a rigorous sampling design that would result in the collection of data appropriate for the analysis methods and fatality model currently being used by the Service.
Based upon agency guidance and logistical considerations, the revised protocols were designed to include 60, 800-meter raptor count survey sites throughout the Chokecherry and Sierra Madre Wind Development Areas (WDAs) where turbine development is likely (Figures 1 and 2). Most of the 60 survey sites are identical to the original 40 sites identified in the August 31, 2012 protocols. However, some of those 40 sites were shifted slightly to

2 SWCA
accommodate the placement of the additional 20 survey sites and ensure that no overlap occurs between samples. Seven of the new sites correspond to raptor monitoring locations that were used in 2011 and spring 2012 survey efforts (RM2, RM7, RM9, RM10, RM12, RM14, and RM15). Efforts were made to resample as many of the previous sampling sites as possible. However, because of PCW’s Project re-design efforts identified in the Project Eagle Conservation Plan (ECP), many of the previous sampling locations are outside or on the very edge of the current development area and could not be included without violating the spatially balanced design that is critical to these protocols.
A spatially balanced sampling design was used to capture the variability in habitat conditions, terrain features, and turbine numbers and densities. Minimum convex polygons (MCPs) were placed around each of 10 discrete potential development areas that are separated by Turbine No-Build areas, topography, or other factors (Figures 1 and 2). MCPs were evaluated for differences in habitat characteristics, forage potential, and topography. While differences in habitat characteristics, forage potential, and topography occur among the 10 MCPs, within each MCP, these factors are similar and additional stratification beyond the MCP level was not necessary.
Using the “Create Spatially Balanced Points” tool in ArcGIS Geostatistical Analyst, 250 spatially balanced locations were generated within the MCPs. Using the spatially balanced points, survey sites were selected sequentially in a manner that was consistent with the recommendations made by the Service while ensuring that no overlap occurs between survey areas. Total number of sampling sites per MCP was based on the relative surface area and number of turbines in the MCP. Two primary selection criteria were used to select sampling sites. First, no overlap of sampling areas was permitted (sites had to be separated by more than 1,650 meters). Second, because of logistical considerations, sampling sites were required to be reasonably accessible from the existing road network and in a safe location. If a potential sampling location violated either of the selection criteria it was dropped and the next point was evaluated. Tables 1 and 2 provide the locations of each sampling site in the WDAs as well as information specific to the MCPs and sampling sites.
The first 36 survey sites that were selected correspond to locations that were identified in the August 31, 2012 protocols. These were sequentially selected using the spatially balanced points that were generated as part of the process described above while controlling for site overlap and logistical considerations for survey. Of the remaining 24 sites, 4 correspond with the original 40 sites with locations slightly shifted to avoid overlap with new sites, 7 correspond with the long-watch raptor monitoring sites that were surveyed in 2011 and spring/summer 2012, 3 were selected outside of the current probable turbine footprint, and 10 were selected using the remaining spatially balanced points. Some minimal micrositing of the new locations is anticipated to ensure maximum visibility of the survey areas as well as safe and consistent accessibility on the part of field personnel.
3 SWCA
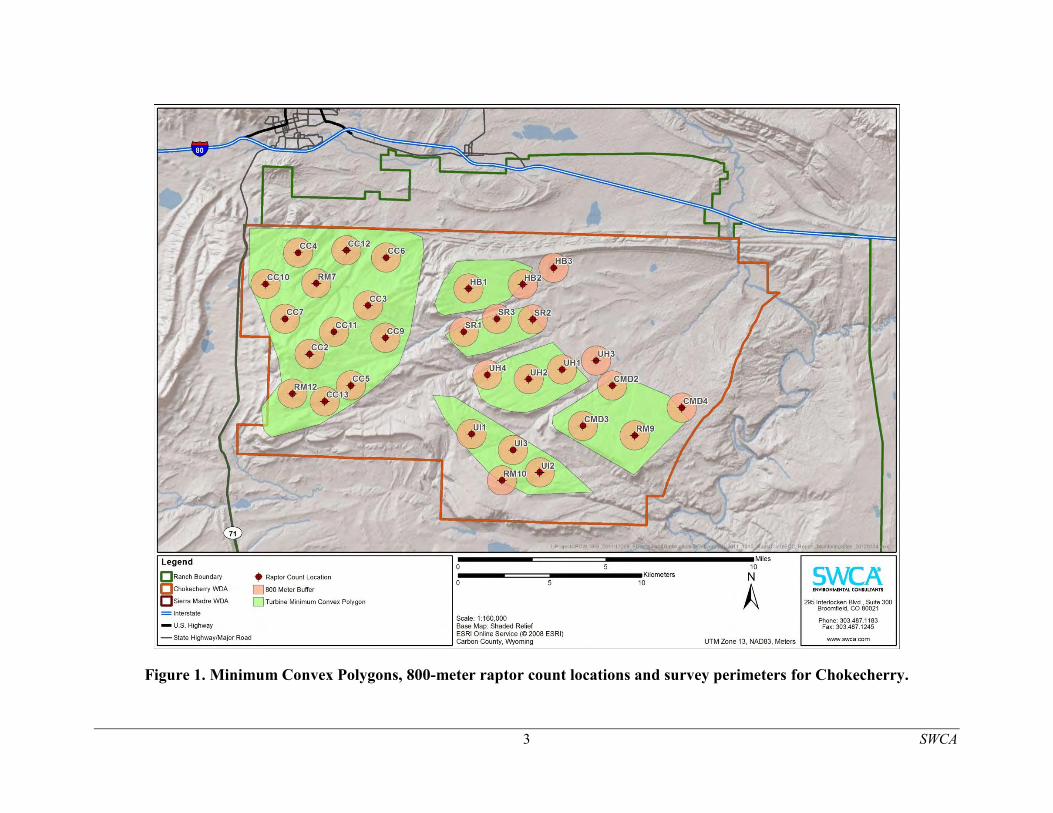
Figure 1. Minimum Convex Polygons, 800-meter raptor count locations and survey perimeters for Chokecherry.

4 SWCA
Figure 2. Minimum Convex Polygons, 800-meter raptor count locations and survey perimeters for Sierra Madre.

5 SWCA
Table 1. Fall 2012-2013 Avian Monitoring Survey Locations for the Chokecherry WDA.
WDA MCP Site Name Survey Site Status Easting* Northing*
Chokecherry
Chokecherry
CC2 Original Fall 2012 Site 315166 4616447
CC3 Original Fall 2012 Site 318351 4619090
CC4 Original Fall 2012 Site 314539 4621971
CC5 Original Fall 2012 Site 317418 4614741
CC6 Original Fall 2012 Site 319335 4621702
CC7 Original Fall 2012 Site 313825 4618366
CC9 Original Fall 2012 Site 319294 4617332
CC10 New 2012 Survey Site 312770 4620262
CC11 New 2012 Survey Site 316501 4617656
CC12
New 2012 Survey Site, original CC1 site shifted north to eliminate overlap with RM7
317170 4622100
CC13
New 2012 Survey Site, original CC8 site shifted southeast to eliminate overlap with RM12
315993 4613871
RM7 2011-2012 Long-watch Site 315531 4620298
RM12 2011-2012 Long-watch Site 314228 4614294
Coal Mine Draw
CMD2 Original Fall 2012 Site 331648 4614732
CMD3 New 2012 Survey Site 330049 4612535
CMD4
New 2012 Survey Site, original CMD1 site shifted east to eliminate overlap with RM9
335437 4613524
RM9 2011-2012 Long-watch Site 332870 4612018
Hogback South
HB1 Original Fall 2012 Site 323818 4620014
HB2 Original Fall 2012 Site 326781 4620243
HB3 New 2012 Survey Site 328457 4621145
Smith Rim
SR1 Original Fall 2012 Site 323560 4617658
SR2 Original Fall 2012 Site 327318 4618336
SR3 New 2012 Survey Site 325362 4618367
Upper Hugus
UH1 Original Fall 2012 Site 328912 4615606
UH2 Original Fall 2012 Site 327099 4615081
UH3 New 2012 Survey Site 330772 4616091
UH4 New 2012 Survey Site 324853 4615321
Upper Iron Springs
UI1 Original Fall 2012 Site 323987 4612091
UI2 Original Fall 2012 Site 327702 4610001
UI3 New 2012 Survey Site 326242 4611221
RM10 2011-2012 Long-watch Site 325646 4609568 *UTM Zone 13, NAD83, Meters

6 SWCA
Table 2. Fall 2012-2013 Avian Monitoring Survey Locations for the Sierra Madre WDA.
WDA MCP Site Name Survey Site Status Easting* Northing*
Sierra Madre
Central Basin
CB1 Original Fall 2012 Site 326414 4597515
CB2 Original Fall 2012 Site 321986 4595452
CB4 Original Fall 2012 Site 329306 4599449
CB5 New 2012 Survey Site 327638 4599529
CB6
New 2012 Survey Site, original CB3 site shifted west to eliminate overlap with RM2
321942 4597660
RM2 2011-2012 Long-watch Site 323776 4597273
Miller Hill
MH1 Original Fall 2012 Site 302291 4600564
MH2 Original Fall 2012 Site 305677 4599125
MH3 Original Fall 2012 Site 307684 4592030
MH4 Original Fall 2012 Site 305024 4594675
MH5 Original Fall 2012 Site 309573 4590571
MH6 Original Fall 2012 Site 306043 4597131
MH7 New 2012 Survey Site 311561 4590443
MH8 New 2012 Survey Site 304412 4600385
Pine Grove
PG1 Original Fall 2012 Site 313663 4594801
PG2 Original Fall 2012 Site 311358 4598224
PG3 Original Fall 2012 Site 307172 4603361
PG4 Original Fall 2012 Site 314434 4597259
PG5 Original Fall 2012 Site 313730 4599682
PG6 Original Fall 2012 Site 312721 4603547
PG7 Original Fall 2012 Site 310058 4595825
PG8 Original Fall 2012 Site 311832 4594006
PG9 Original Fall 2012 Site 311187 4600886
PG10 New 2012 Survey Site 309753 4602508
RM14 2011-2012 Long-watch Site 309884 4599843
RM15 2011-2012 Long-watch Site 315948 4599668
Sage Creek Rim
SCR1 Original Fall 2012 Site 333505 4598194
SCR2 Original Fall 2012 Site 332596 4596407
SCR3 New 2012 Survey Site 330727 4595638 *UTM Zone 13, NAD83, Meters

7 SWCA
Landmarks will be identified and visible stakes will be placed around each survey location perimeter to provide distance references for field personnel completing survey efforts. The 800-meter radius survey areas of the new 60 point count locations provide coverage for approximately 35% of the probable turbine locations, which is greater than the 30% recommendation made by the Service (Service 2012b). Additionally, 46.7% of the raptor monitoring sites that were surveyed in 2011 will be resurveyed as part of the 60 point counts. Resurvey of 50% of all previous survey sites was not possible because many fall outside of the current project layout in Turbine No-Build areas and use of those sites would violate the spatially balanced study design in addition to sampling areas that are already known as high use areas for eagles and other raptors. Additionally, several sites that were only surveyed in spring/summer 2012 do not have a full year of data and would not be appropriate for comparison with ongoing and future data collection efforts. However, many of the 60 new survey sites overlap with areas previously surveyed as part of 2011 and 2012 raptor monitoring efforts. When these areas are included, 50.3% of the area surveyed as part of previous raptor monitoring efforts is within the perimeter of the 60 new point count survey sites.
Surveys will be conducted at each site for one hour per guidance in the ECP Technical Appendices (Service 2012b). Three avian technicians will each survey two locations per day for a total of 6 locations per day and 60 locations in a 10 day period. Each location will be surveyed twice per month. A schedule for all 60 raptor count locations was designed to provide survey coverage across all daylight hours for each of the 60 sites. The schedule was also designed such that the six raptor count surveys conducted on any given day are separated temporally and spatially to ensure independence of any observations that are made.
Avian technicians will be equipped with binoculars, spotting scopes, laser rangefinders, and aerial maps to assist with accurate detection and documentation of all raptors observed within the 800-meter survey area. Each aerial map is displayed with relevant landforms occurring in the area, locations of stakes, and concentric rings at each 200-meter interval to facilitate accurate distance estimation (Attachment 2). Each raptor flight path is recorded by technicians on the provided aerial maps. Additional data collected include species, number of individuals per observation, age, sex, behavior, bearing to bird, distance to bird, heading of bird, altitude of bird, the beginning and ending time for each observation, interactions with other birds, and hourly weather data among other variables (Attachment 3).
Surveys at the 60 800-meter raptor counts will begin in November 2012 and are scheduled to continue bi-weekly at each location through August of 2013. Surveys during winter months will be completed on the same schedule as the remainder of the year and efforts will be made to survey at least 50% of all locations twice per month during winter. However, winter surveys are subject to cancellation or delay based on weather conditions and safety of the field technicians.

8 SWCA
REFERENCES
Bureau of Land Management (BLM). 2008. Wildlife Survey Protocols for Wind Energy Development.
U.S. Fish and Wildlife Service (Service). 2011. Draft Eagle Conservation Plan Guidance. Available online at http://www.fws.gov/windenergy/. Accessed December 2011.
———. 2012a. Land Based Wind Energy Guidelines. Wind Turbine Guidelines Advisory Committee. U.S. Fish and Wildlife Service, Department of the Interior, Washington D.C. Available online at http://www.fws.gov/windenergy/docs/WEG_final.pdf. Accessed August 2012.
———. 2012b. Eagle Conservation Plan Guidance Module 1 – Land-based Wind Energy Technical Appendices. Received from Kevin Kritz, Service Region 6, on August 4, 2012.
Wyoming Game and Fish Department (WGFD). 2010. Wildlife Protection Recommendations for Wind Energy Development in Wyoming. Wyoming Game and Fish Commission Approved November 17, 2010. Wyoming Game and Fish Department, Cheyenne, WY.

SWCA
ATTACHMENT 1 Response to Survey Recommendations Made in the Service’s
September 28, 2012 Letter

This page intentionally left blank

SWCA
The following recommendations were made by the Service in the September 28, 2012 letter to Garry Miller (PCW) regarding Eagle Use Sampling Considerations and Recommendations for the proposed Chokecherry-Sierra Madre Wind Energy Development Project. A response is provided to document how each recommendation has been incorporated into the revised 800-meter point count survey protocols. Recommendations are presented in italics below.
1. We recommend focusing sampling efforts within the most recently proposed project
footprint in order to quantify eagle use in areas where turbines are planned for location. By collecting eagle and raptor use data in areas of likely development, we believe it will be easier to obtain a more reliable estimate of risk to eagles in these areas, from which more informed, site-specific, predictions can be made.
Response: The revised protocols and placement of the 60 point count sites are based on the most recent proposed Project footprint and probable turbine locations. The most recent Project footprint reflects PCW’s commitment to the Turbine No-Build areas identified in the Project ECP.
2. Although we recommend concentrating sampling effort within the project footprint as
stated above, we believe it also would be prudent to establish additional sample points outside of the currently proposed footprint in areas of potential development. Adding points in areas of possible alternative turbine layouts will provide data to assess the impact of those alternatives, which may be necessary if survey results identify areas of high eagle use within areas currently proposed for development. Without eagle use data outside of the proposed footprint, it would be difficult to show that the relocation of turbines outside of the currently proposed project footprint would avoid and minimize impacts to eagles. Without these data, the only likely alternatives would be a reduction in the total number of turbines, or a reduction in the spacing between turbines in areas where avian and raptors surveys were conducted. Response: Three of the 60 point count survey sites (RM15, HB3, and UH3) are placed outside of the most current probable turbine locations. Several additional locations (e.g., CMD2, HB2, RM10, SR2) have a substantial portion of their survey areas that fall outside of the current probable turbine locations. Each of these sites provides survey coverage in areas of the Project Site where turbines could be located if the current probable turbine location footprint changes.
3. We recommend resampling at least fifty percent of the raptor point counts from previous years: this will help distinguish between apparent changes in documented eagle use caused by different point locations and associated differences in detectability, versus actual changes in habitat use. This is an important consideration, because the number of eagles and their location on the landscape is likely to vary across years (e.g., not every nest is active every year), making it difficult to account for inter-annual variability, which might lead to inaccurate conclusions about the risk of eagle fatalities. For example, observing fewer eagles at a second set of survey points could be misinterpreted as an area of lower eagle use, when in fact the number of eagles and eagle use across the landscape decreased due to other factors. In this

SWCA
example, the use (and hence risk) might have been the same for all survey points, but sampling different points across years would lead to the erroneous conclusion. Resampling some points across years can reduce this uncertainty by creating an index or allow for scaling of observations across years.
Response: Nearly 50% (46.7%) of the raptor monitoring sites that were surveyed in 2011 will be resurveyed as part of the 60 point counts. Resurvey of 50% of previous survey sites is not possible because many fall outside of the current project layout in Turbine No-Build areas. Additionally, several sites that were only surveyed in spring/summer 2012 do not have a full year of data and would not be appropriate for comparison with ongoing and future data collection efforts. Many of the 60 new survey sites overlap with areas previously surveyed as part of 2012 raptor monitoring efforts. When those areas are included, 50.3% of the area surveyed as part of 2012 raptor monitoring efforts is within the perimeter of the 60 new point count survey sites.
4. Previous long-watch raptor surveys were based on an unlimited radius, and analysis
of data from these surveys suggests that the detectability of eagles dropped off after 600 to 800 meters. We recommend using a distance of no more than 800 meters for point counts intended to collect data on eagles and other large raptors. This recommendation is found in our draft Eagle Conservation Plan Guidance (Service 2012, Appendix C, p. 18) and in other literature (e.g., Strickland et al. 2011). While it is acceptable to collect data on eagles and other raptors beyond 800 meters (e.g., location, flight height, flight path)—since they may be useful to identify travel corridors and areas of eagle use—the collection of this information should not distract surveyors from collecting data within the 800-meter point count. In addition, because only those data collected within 800 meters will be used in the models to predict eagle fatalities, data collected at distances more than 800 meters should be separated from data collected within 800 meters.
Response: Previous long-watch raptor surveys recorded any eagle observed to help identify high use areas per the protocols developed collaboratively between the Service, BLM, and PCW. The analysis of detectability of eagles presented in the Service’s comments does not consider that the reason eagle use was higher within 800 meters of previously sampled sites is because those sites were placed on ridgelines and terrain features known to attract or concentrate eagle use, making the likelihood of observing an eagle within 800 meters of a survey site higher than if the point was placed randomly in the landscape where varying terrain features may or may not occur. The implementation of the previous surveys was extremely successful and resulted in the development of Turbine No-Build areas that will avoid impacts to eagles and other avian species in the majority of the high use areas that were identified. To be consistent with with the Service’s Draft ECP Guidance, the Service’s eagle risk model, and the recommendation made above, all surveys will be conducted using a distance of 800-meters.

SWCA
5. Based on recommendations in the draft Eagle Conservation Plan Guidance, the sampling goal should provide a “minimal spatial coverage of at least 30% of the project footprint” (i.e., the total area sampled in any given year should be thirty percent of the total project footprint) (Service 2012, Appendix C, p. 1 8). We recognize that even this level of effort will not provide specific information for seventy percent of the project area; however, it may be assumed that the information is representative of the remaining project area, provided the sample points are appropriately located (e.g., stratified and spatially balanced). To achieve the desired goal of at least 30 percent coverage of the Chokecherry Sierra Madre Proposed Project footprint, we calculate up to 70 survey points are needed, depending on how the project footprint is portrayed.
Response: Using the conceptual turbine footprint that PCW provided to the Service, 35% of all turbine locations fall within the 800-meter survey perimeters of the 60 point count sites. As stated above, the entirety of 3 sites and substantial portions of 3 others fall outside of the probable Project footprint in areas where turbines could be placed. These provide adequate coverage of areas outside of the current probable turbine footprint. When combined with the 800-meter radius surveyed areas from previous survey events (2011 and spring/summer 2012), 42% of probable turbine locations are included within the perimeter of 800-meter point count sites.
6. We recommend sample locations be stratified by features of the landscape that may
influence eagle and raptor activity, such as distinct geographic/topographic elements (e.g., escarpments), vegetation (if appropriate), and concentrated prey base. Doing so will allocate sampling points across the project in proportion to their occurrence on the landscape. A common sampling design in use today is the generalized random tessellation stratified sampling design (GRTS). We remain concerned that there is insufficient information about eagle habitat use associated with important eagle use areas including: active nests; concentrated prey base including grouse leks, prairie dog colonies, and reservoirs; as well as topographic features such as Miller Hill. Therefore, we recommend that some sample points be located near these important eagle use areas. Doing so would help with identifying additional avoidance areas or alleviating concerns for increased risk associated with these areas.
Response: The spatially balanced design that is discussed in the revised protocols above is reflective of the variability in habitat conditions, terrain features, and turbine numbers and densities. The revised protocols describe the methods used to select sites and the sampling strata and selection criteria that were used to place sites. The 60 sampling sites described in the revised protocols provide coverage in areas that provide some level of foraging, contain sage-grouse leks, and have variable topography that could influence eagle and raptor behavior. Site placement near active eagle nests is difficult because most nests have been avoided and are within the Turbine No-Build areas along the Bolten Rim or North Platte River corridor and, as seen in the data previously collected for the Project, active nests locations change each year.

SWCA
7. Based on recommendations in the Service’s Eagle Conservation Plan Guidance, count periods should be one to two hours long (Service 2012, Appendix C, p. 18). If longer survey periods are used (e.g., four to six hours), the surveys should be divided into smaller units such as one or two hour blocks (or the actual time of eagle observations recorded), so that the influence of time of day can be evaluated (e.g., in relation to when turbines are inactive). Response: Surveys will be conducted at each site for one hour per guidance in the ECP Technical Appendices (Service 2012b). As stated in the revised protocols, the survey methods follow the 800-meter radius point count methodology recommended by the Service’s Technical Appendices to the Draft ECP Guidance, and are consistent with other guidance documents produced by the Service, BLM, and WGFD.
8. We recommend the protocol include a representative distribution of sampling events across all daylight hours across all point locations and seasons. Collecting data “evenly” across time and space should reduce any potential bias associated with locations, seasons, and time of day. This may also make it possible to evaluate how time of day influences eagle use of the site or when eagles are more likely to use specific topographic features. In addition, surveys should include multiple sampling events in each season per point.
Response: As stated in the revised protocols, the survey methods follow the 800-meter radius point count methodology recommended by the Service’s Technical Appendices to the Draft ECP Guidance, and are consistent with other guidance documents produced by the Service, BLM, and WGFD. The sampling schedule will provide survey coverage across all daylight hours for each of the 60 sites. The schedule also makes certain that the six raptor count surveys conducted on any given day are separated temporally and spatially to ensure independence of any observations that are made.
9. We recommend locating survey sampling points at least 800 meters (0.5 mile) from
active eagle and ferruginous hawk nests to limit disturbance. It may be possible to reduce this distance if topographic features create a visual barrier between observers and the nest.
Response: Should an eagle or ferruginous hawk nest become active within 800 meters of a survey site, PCW will coordinate with the Service and BLM to evaluate the most appropriate methods to take to ensure that survey activities do not disrupt nesting. With PCW’s Turbine No-Build areas and Project re-design efforts, most eagle and raptor nests in the Project Site have been avoided by 800 meters or more. However, some survey sites are located within 800 meters of historically active nests. As stated above, sampling locations have been selected in a spatially balanced, stratified manner using methods recommended by the Service. Maintaining the sites that are located within 800 meters of historically active nests is necessary to maintain this spatially balanced design. Since Project survey efforts began in 2008, no active ferruginous hawk nests have been identified.

SWCA
10. We recommend data collection include identification of eagle species and their flight
minutes within the 800-meter point count. Additional data collection could include, but should not necessarily be limited to (in relative order of importance): age and sex (if possible), flight path, flight behavior (e.g., soaring, kiting), activity (e.g., territory defense, foraging), interactions with other birds, flight height, obvious prey items, time observed outside of the 800-meter point count, and time perched. It is acceptable to record detections beyond 800-meters as these can provide additional information about eagle and raptor use of the project area. However, collecting data beyond 800-meters should not detract from observations made within the 800-meter point count. Response: Only those observations occurring within 800 meters of the survey sites will be recorded. As described in the protocols and illustrated on the data collection forms in Attachment 3, data collection efforts will provide all of the information recommended by the Service.
11. We recommend collecting data on all raptors to the extent feasible; however, collecting data on other raptors should not preclude the collection of data on eagles. Response: Data on all raptors and other species of interest will be collected in a manner identical as that used for eagles unless those efforts interfere with data collection for eagles.
12. Based on eagle use data collected between April of 2011 and April of 2012, eagle activity relative to sampling effort appears to be higher in the winter and summer periods (Table 1). Higher eagle activity in the summer likely corresponds to the time during which adults are actively feeding young and when young are learning to fly. Higher eagle activity in the winter may be related to the presence of migrant eagles, or could be due to the location of survey points. Because data were not collected following the above recommendations during the summer of 2012, we recommend the collection of eagle and raptor use data continue through the 2013 nesting season (at least through August of 2013) to evaluate this potential season of higher use. Response: Data will be collected through August of 2013. Our interpretation of eagle use in winter and summer periods differs from the Service’s interpretation. The Service’s interpretation assumes that each minute of eagle use is independent and evenly distributed across the landscape. Based on the survey data, it is clear that most of the eagle minutes recorded across all seasons are not independent and that the simple statistic of flight minutes per survey minute does not consider that observations are not independent in space or time and therefore mischaracterizes seasonal use and risk. As an example, 72 of the 141 minutes (51%) of winter use observed in the Project Site occurred at two sites on two days. On December 8, 2011, 35 eagle flight minutes were recorded at RM11 and on March 9, 2012 37 minutes of eagle use were recorded at RM14. On both days, field technicians wrote on datasheets that the use was associated with 2-3 individuals who were using the area for a long period of time. If the three eagles at RM14 had not been observed on March 9, no winter use would

SWCA
have been observed within 800 meters of that sampling site. Similarly, if the use at RM11 would not have been observed on December 8, only 3 minutes of eagle use over would have been observed at that site during winter months and use would have been decreased by 95%. The observed activity on December 8 and March 9 is indicative of short duration, concentrated use by a few individuals rather than of high eagle use of the Project throughout the entire winter period. The data also indicate that for most of the Project Site there is no risk or very low risk to eagles during winter. Summer data are very similar to winter data. During summer 2011, only 71 eagle minutes were recorded. Nearly 60% of these minutes were associated with only 3 observations of individual circle soaring birds at RM14 and RM5. This indicates that the high use the Service cites is not from adults feeding young or young learning to fly. Rather, the behavior observed indicates that this is localized use by individual birds utilizing thermals created by warm summer temperatures.
13. In several locations, the document states that it was “fully compliant” with recommendations by the U.S. Fish and Wildlife Service (Service). First, it is important to understand that the draft Eagle Conservation Plan Guidance is voluntary; consequently we prefer to use the term “consistent with” rather than “compliant with” when describing recommendations found within the Eagle Conservation Plan Guidance. Second, we do not believe that the protocol provided by PCW is, in fact, consistent with the Eagle Conservation Plan Guidance for numerous reasons, one key reason being that the limited number of 800-meter survey points do not provide the recommended minimum 30 percent coverage of the project footprint. Additionally, we do not believe it is scientifically justifiable to combine survey points from multiple years in order to meet the minimum recommended standard of 30 percent coverage: the minimum 30 percent coverage should occur within each individual year. Response: The recommended changes have been made. The term “compliant” has been changed to “consistent”. As stated above, 35% of the probable turbine locations will be surveyed using the revised protocols.
14. The document makes a definitive statement about “unrealistic projections” concerning eagle risk. This statement is based on several assumptions, including that previous survey efforts correctly identified areas of high eagle use. One of the reasons for increasing the spatial coverage in 2012-2013 is to increase our confidence in understanding eagle and raptor use across the Project area. Because substantial uncertainty exists as a result of the limited amount of spatial and temporal survey coverage used to document impacts and relative risk to eagles, the Service believes our projections concerning risk to eagles are realistic and clearly demonstrate the need for increased coverage. In addition, our letter of August 10, 2012, identified numerous areas of potential high eagle use that are not currently included in the avoidance areas, such as the golden eagle nest in the southwest corner of Sierra Madre. Our letter also identified the presence of high density prey base, proximity of sage grouse leks and other habitat features that are used by eagles. Because these habitat features (and others) are not included in the proposed avoidance areas, the projections of risk and high eagle fatalities identified by the Service are possible.

SWCA
Response: The comments made above have been addressed in the revised protocols, the prey-base report submitted to the Service, and the Project ECP. We concur that within the context of the Service’s eagle fatality model, the revised protocols will help address uncertainties.
15. The data sheet attached to the protocol provided by PCW does not appear to have a means of recording flight path in data. It should be clear how flight path data will be collected on the existing data sheet, or additional datasheets should be included if there is more than one. Response: Attachment 2 contains an example figure that is used to record flight paths for eagles and other raptors. Additionally, multiple rows of data are recorded for each eagle observed which results in multiple spatial points per individual bird. Fitting a line between each point for each observed eagle provides another mechanism to create flight paths. The methods used to collect data are described in the revised protocols.

This page intentionally left blank

SWCA
ATTACHMENT 2 Example Aerial Map Used to Map Flight Paths during 800-meter Raptor
Count Surveys

This page intentionally left blank

A1-1 SWCA
Aerial map example. Numbers next to site markers indicate distance from raptor monitoring location to the site marker location. Concentric rings around raptor monitoring location indicate 200-meter distance intervals to aid in estimation of distance. Other features on the landscape (roads, rock cairns, etc.) are also noted on each map to aid in distance and location estimation.

This page intentionally left blank

SWCA
ATTACHMENT 3 Data Sheets Used to Collect Data during 800-meter Raptor Count Surveys

This page intentionally left blank

A2-1 SWCA
PCW 2012-2013 Raptor Survey
Field Observer:
Survey Location:
Start time:
End time:
Date:
Page: ____ of _____
Target
# Obs
# Species
# Birds
Age Sex Behav Bearing
to Bird (°) Distance
to Bird (m) Angle of Bird (°)
Heading of Bird
0- 30
30-150
150+ Time Begin
Time End

A2-2 SWCA
PCW 2012-2013 Raptor Survey Notes
Field Observer:
Survey Pt:
Date:
Page: _____ of _____
Other species and Notes.
Weather Conditions
Wind
Time Sky Dir Spd Temp (°F)
Incidental Species Observations for eagles and raptors note distance and bearing

Appendix C

This page intentionally left blank

Avian Baseline Studies for the Chokecherry-Sierra Madre Wind Resource Area
Carbon County, Wyoming
Final Report June 26, 2008 – June 16, 2009
Prepared for:
AECOM 1726 Cole Blvd.
Building 22, Suite 150 Golden, Colorado 80401
Prepared by:
Greg Johnson, Troy Rintz, Dale Strickland, and Kimberly Bay
Western EcoSystems Technology, Inc.
2003 Central Avenue Cheyenne, Wyoming
September 8, 2009

This page intentionally left blank

Chokecherry-Sierra Madre Final Report
Western EcoSystems Technology, Inc. i FINAL – September 8, 2009
EXECUTIVE SUMMARY The Power Company of Wyoming has proposed a wind-energy facility in Carbon County, Wyoming, capable of producing 2,000 megawatts of energy with 1,000 wind turbines. To assist with preparing an Environmental Impact Statement for the proposed facility, AECOM contracted Western Ecosystems Technology, Inc. to conduct surveys and monitor wildlife resources in the Chokecherry-Sierra Madre Wind Resource Area to estimate the impacts of project construction and operations on wildlife. The following document contains results for fixed-point bird use surveys and incidental wildlife observations. The principal objectives of the study were to (1) provide site specific bird use data that would be useful in evaluating potential impacts from the proposed wind-energy facility; (2) provide information that could be used in project planning and design of the facility to minimize impacts to birds; and (3) recommend further studies or potential mitigation measures, if warranted. The proposed wind-energy facility is composed primarily (77%) of scrub-scrub habitat dominated by big sagebrush. The remaining areas are covered by grassland (19.3%), evergreen forest (1.4%) deciduous forest (0.7%), and emergent wetlands (0.6%), with smaller patches of open water, developed space, barren habitat, mixed forest, woody wetlands, and pastures. The study used fixed-point bird use surveys to estimate the seasonal, spatial, and temporal use of the study area by birds, particularly raptors. Fixed-point surveys were conducted from June 26, 2008 through June 16, 2009 at nineteen points established throughout the Chokecherry-Sierra Madre Wind Resource Area. A total of 433 20-minute fixed-point surveys were completed and 50 bird species were identified. A total of 2,005 individual bird observations within 1,301 separate groups were recorded during the fixed-point surveys. The most abundant large bird species recorded was the common raven (175 observations) and the most abundant small bird species was horned lark (805). A total of 230 individual raptors were recorded within the Chokecherry-Sierra Madre Wind Resource Area, representing 12 species. The most abundant raptor observed was golden eagle (69 observations). Use by waterbirds and shorebirds was relatively low (0.10 and 0.01 birds/plot/20-minute survey, respectively) and these bird types were only observed during the spring season. Raptor use was highest during the fall (0.62 birds/plot/20-min survey) and lowest during the winter (0.17). Vultures were only recorded during the fall and spring (0.01 birds/plot/20-minute survey for both seasons). Upland gamebird use, limited to greater sage-grouse, ranged from 0.09 birds/plot/20-minute survey in the winter to zero in the summer. Large corvids had the highest use in the fall (0.73 birds/plot/20-minute survey) and the lowest use in the winter (0.34). Passerine use ranged from 0.02 birds/plot/20-minute survey in winter to 5.00 in spring; however, the focus for small birds was within a 100 meter viewshed and passerine use is not directly comparable to the other bird types, which were recorded out to 800 m. During the study, 311 single or groups of large birds totaling 467 individuals were observed flying during fixed-point bird use surveys. For all large bird species combined, 67.0% of birds were observed flying below the likely zone of risk, 29.3% were within the zone of risk, and 3.6%

Chokecherry-Sierra Madre Final Report
Western EcoSystems Technology, Inc. ii FINAL – September 8, 2009
were observed flying above the zone of risk for typical turbines that could be used in the Chokecherry-Sierra Madre Wind Resource Area. Bird types with at least 20 individuals observed flying most often observed flying within the turbine zone of risk were raptors (30.4%) and large corvids (24.8%). A total of 1,046 passerines and other small birds in 596 groups were recorded flying within 100 meters of the survey plots in the proposed wind resource area, with 99.8% flying below the zone of risk, 0.2% within the zone of risk, and none observed above the zone of risk. For large bird species with at least 25 separate groups of flying birds, golden eagles were observed most often within the zone of risk (45.0%) based on initial observations. Based on the use (measure of abundance) of the study area by each species and the flight characteristics observed for that species, the common raven had the highest probability of turbine exposure, with an exposure index of 0.09. The raptor species with the highest exposure index was the golden eagle, which was ranked second of all species at 0.06. All other raptor species had an exposure index of 0.02 or less. For passerines and other small birds, the species with the highest exposure index was horned lark, though its exposure index was less than 0.01. Levels of bird use varied within the study area by point. For all large bird species combined, use was highest at point 12, with 3.18 birds/20-minute survey. The higher mean use at point 12 was due mostly to high use by large corvids at this point (2.50 birds/20-minute survey). Use at the other points ranged from 0.32 to 2.55 birds/20-minute survey for large bird species. Waterbird use was highest at point 16, with 0.67 birds/20-minute survey, and mean shorebird use was only recorded at point 17, with 0.17 birds/20-minute survey. Raptor use was highest at point four (0.93 birds/20-minute survey), and ranged from 0.10 to 0.83 birds/20-minute survey at other points. Vultures were only seen at points six and eleven (0.03 and 0.04 birds/20-minute survey, respectively) and upland gamebird use was highest at point 13 (0.14 birds/20-minute survey). Passerine use, limited to birds observed within 100 meters of the survey point, was highest at point 13, with 5.10 birds/20-minute survey, and ranged from 1.81 to 4.70 at the other points. No obvious flyways or concentration areas were observed. No strong association with topographic features within the study area was noted for raptors or other large birds. Although some differences in bird use were detected among survey points, the differences are not large enough to suggest that any portions of the Chokecherry-Sierra Madre Wind Resource Area should be avoided when siting turbines due to very high bird use. The objective of incidental wildlife observations was to provide a record of wildlife seen outside of the standardized surveys. There were 12 bird species observed incidentally, totaling 270 individuals within 157 separate groups during the study. The most abundant large bird species recorded incidentally were greater sage-grouse (123 individuals), golden eagle (52 observations), and northern harrier (38 observations). Three bird species were only observed incidentally and were not observed during fixed-point surveys. Four mammal species totaling 3,083 individuals in 304 groups were also observed incidentally at the CSMWRA. The most commonly recorded mammal species was pronghorn antelope with 2,879 observations in 285 groups. Based on fixed-point bird use data collected for the Chokecherry-Sierra Madre Wind Resource Area, mean annual raptor use was 0.46 raptors/plot/20-minute survey. The annual rate was low

Chokecherry-Sierra Madre Final Report
Western EcoSystems Technology, Inc. iii FINAL – September 8, 2009
relative to raptor use at 36 other wind-energy facilities that implemented similar protocols to the present study and had data for three or four different seasons. Mean raptor use in the Chokecherry-Sierra Madre Wind Resource Area was low compared to the other wind resource areas, ranking twenty-second among the 36 studies. A regression analysis of raptor use and mortality for 13 new-generation wind-energy facilities, where similar methods were used to estimate raptor use and mortality, found that there was a significant correlation between use and mortality (R2
= 69.9%; Figure 8). Using this regression to predict raptor collision mortality at the CSMWRA, based on an adjusted mean raptor use of 0.46 raptors/plot/20-min survey, yields an estimated fatality rate of 0.04 fatalities/MW/year, or four raptor fatalities per year for each 100-MW of wind-energy development, which would equate to an estimate of 80 raptors per year for a 2,000-MW development. A 90% prediction interval around this estimate is zero to 0.30 fatalities/MW/year. Based on species composition of the most common raptor fatalities at other western wind-energy facilities and species composition of raptors observed at the Chokecherry-Sierra Madre Wind Resource Area during the surveys, the majority of the fatalities of diurnal raptors will likely consist of red-tailed hawk, American kestrel and golden eagle. Based on the seasonal use estimates, it is expected that risk to raptors would be unequal across seasons, with the lowest risk in the winter, and highest risk during the fall. However, the winter use estimates were only based on three surveys that were completed prior to the area becoming inaccessible due to snow. Therefore, winter use as based on these three surveys may not be representative of actual use throughout the entire winter, but is the best data available for predicting winter use of the study area by raptors. Some species considered to be sensitive or of conservation concern were observed within the Chokecherry-Sierra Madre Wind Resource Area. During all surveys and incidental observations, one petitioned species, the greater sage-grouse, was recorded within the proposed wind resource area. Furthermore, 10 other bird species and one mammal species classified by the Wyoming Game and Fish Department as Native Species Status 2, 3, or 4 were also recorded during fixed-point bird use surveys or as incidental wildlife observations. A total of 538 individual birds in 293 groups, representing 11 sensitive bird species, and five white-tailed prairie dogs in one group were recorded. This is a tally that in some cases may represent repeated observations of the same individual. Some potential exists for wind turbines to displace these species within the study area. Research concerning displacement impacts of wind-energy facilities is limited, but some show the potential for small scale displacement of 180 meters (591 feet) or less for small birds, while impacts to densities of small birds at larger scales have not been shown.

Chokecherry-Sierra Madre Final Report
Western EcoSystems Technology, Inc. iv FINAL – September 8, 2009
TABLE OF CONTENTS
EXECUTIVE SUMMARY ............................................................................................................. i
INTRODUCTION .......................................................................................................................... 1
STUDY AREA ............................................................................................................................... 1
METHODS ..................................................................................................................................... 2
Fixed-Point Bird Use Surveys .................................................................................................... 2 Bird Use Survey Plots............................................................................................................. 2 Bird Survey Methods .............................................................................................................. 2 Observation Schedule ............................................................................................................. 3
Incidental Wildlife Observations ................................................................................................ 3 Statistical Analysis...................................................................................................................... 3
Quality Assurance and Quality Control.................................................................................. 3 Data Compilation and Storage ................................................................................................ 3 Fixed-Point Bird Use Surveys ................................................................................................ 4
Bird Diversity and Species Richness .................................................................................. 4 Bird Use, Composition, and Frequency of Occurrence ...................................................... 4 Bird Flight Height and Behavior......................................................................................... 4 Bird Exposure Index ........................................................................................................... 4 Spatial Use .......................................................................................................................... 5
RESULTS ....................................................................................................................................... 5
Fixed-Point Bird Use Surveys .................................................................................................... 5 Bird Diversity and Species Richness ...................................................................................... 5 Bird Use, Composition, and Frequency of Occurrence by Season......................................... 5
Waterbirds........................................................................................................................... 6 Shorebirds ........................................................................................................................... 6 Raptors ................................................................................................................................ 6 Vultures............................................................................................................................... 6 Upland Gamebirds .............................................................................................................. 6 Large Corvids...................................................................................................................... 6 Passerines............................................................................................................................ 7
Bird Flight Height and Behavior............................................................................................. 7 Bird Exposure Index ............................................................................................................... 7 Spatial Use .............................................................................................................................. 8 Sensitive Species Observations............................................................................................... 8
Incidental Wildlife Observations ................................................................................................ 8 Bird Observations ................................................................................................................... 8 Mammal Observations ............................................................................................................ 9 Sensitive Species Observations............................................................................................... 9
DISCUSSION AND IMPACT ASSESSMENT............................................................................. 9
Bird Impacts................................................................................................................................ 9 Direct Effects .......................................................................................................................... 9
Raptor Use and Exposure Risk ......................................................................................... 10

Chokecherry-Sierra Madre Final Report
Western EcoSystems Technology, Inc. v FINAL – September 8, 2009
Non-Raptor Use and Exposure Risk ................................................................................. 11 Sensitive Species Use and Exposure Risk ........................................................................ 12
Indirect Effects...................................................................................................................... 12 Raptor Displacement......................................................................................................... 13 Displacement of Non-Raptor Bird Species....................................................................... 13
CONCLUSIONS AND RECOMMENDATIONS ....................................................................... 14
REFERENCES ............................................................................................................................. 15
LIST OF TABLES
Table 1. The land cover types, coverage, and composition within the Chokecherry-Sierra Madre Wind Resource Area.............................................................................................. 24
Table 2. Summary of species richness (species/plota/20-min survey), and sample size by season and overall during the fixed-point bird use surveys at the Chokecherry-Sierra Madre Wind Resource Area, June 26, 2008 – June 16, 2009........................................... 25
Table 3. Total number of individuals and groups for each bird type and speciesa, by season and overall, during the fixed-point bird use surveys at the Chokecherry-Sierra Madre Wind Resource Areaa , June 26, 2008 – June 16, 2009. ................................................... 26
Table 4a. Mean bird use (number of birds/800-plot/20-min survey), percent of total composition (%), and frequency of occurrence (%) for each large bird type and species by season during the fixed-point bird use surveys at the Chokecherry-Sierra Madre Wind Resource Area, June 26, 2008 – June 16, 2009........................................... 29
Table 4b. Mean use (number of birds/100-m plot/20-min survey), percent of total composition (%), and frequency of occurrence (%) for each small bird type and species by season during the fixed-point bird use surveys at the Chokecherry-Sierra Madre Wind Resource Area, June 26, 2008 – June 16, 2009........................................... 31
Table 5. Flight height characteristics by bird type during fixed-point bird use surveys at the Chokecherry-Sierra Madre Wind Resource Area, June 26, 2008 – June 16, 2009. Large bird observations were limited to within 800 m and small birds were limited to within 100 m. .................................................................................................................... 33
Table 6a. Relative exposure index and flight characteristics by large bird species during the fixed-point bird use surveys at the Chokecherry-Sierra Madre Wind Resource Area, June 26, 2008 – June 16, 2009.......................................................................................... 34
Table 6b. Relative exposure index and flight characteristics for small birds during the fixed-point bird use surveys at the Chokecherry-Sierra Madre Wind Resource Area, June 26, 2008 – June 16, 2009. ................................................................................................. 35
Table 7. Summary of sensitive species observed at the Chokecherry-Sierra Madre Wind Resource Area during fixed-point bird use surveys (FP) and as incidental wildlife observations (Inc.), June 26, 2008 – June 16, 2009.......................................................... 37

Chokecherry-Sierra Madre Final Report
Western EcoSystems Technology, Inc. vi FINAL – September 8, 2009
Table 8. Incidental wildlife observed while conducting all surveys at the Chokecherry-Sierra Madre Wind Resource Area, June 26, 2008 – June 16, 2009........................................... 38
LIST OF FIGURES Figure 1. Location of the Chokecherry-Sierra Madre Wind Resource Areas............................... 39
Figure 2. Elevation and topography of the Chokecherry-Sierra Madre Wind Resource Areas. .. 40
Figure 3. The land cover types and coverage within the Chokecherry-Sierra Madre Wind Resource Areas (USGS NLCD 2001)............................................................................... 41
Figure 4. Fixed-point bird use survey points at the Chokecherry-Sierra Madre Wind Resource Areas. ................................................................................................................ 42
Figure 5. Mean use (number of birds/20-min survey) at each fixed-point bird use survey point for all birds and major bird types at the Chokecherry-Sierra Madre Wind Resource Area................................................................................................................... 43
Figure 6a. Flight paths of waterbirds at the Chokecherry-Sierra Madre Wind Resource Area.... 51
Figure 6b. Flight paths of accipiters at the Chokecherry-Sierra Madre Wind Resource Area. .... 52
Figure 6c. Flight paths of buteos at the Chokecherry-Sierra Madre Wind Resource Area. ......... 53
Figure 6d. Flight paths of falcons at the Chokecherry-Sierra Madre Wind Resource Area. ........ 54
Figure 6e. Flight paths of eagles, northern harriers, and other raptors at the Chokecherry-Sierra Madre Wind Resource Area. .................................................................................. 55
Figure 6f. Flight paths of vultures at the Chokecherry-Sierra Madre Wind Resource Area. ....... 56
Figure 9. Comparison of annual raptor use between the Chokecherry-Sierra Madre Wind Resource Area and other US wind-energy facilities......................................................... 57
Figure 10. Regression analysis comparing raptor use estimates versus estimated raptor mortality............................................................................................................................ 58

Chokecherry-Sierra Madre Final Report
Western EcoSystems Technology, Inc. 1 FINAL – September 8, 2009
INTRODUCTION The Power Company of Wyoming has proposed a wind-energy facility in Carbon County, Wyoming (Figures 1 and 2), capable of producing 2,000 megawatts (MW) of energy with 1,000 wind turbines. To assist with preparing an Environmental Impact Statement for the proposed facility, AECOM contracted Western Ecosystems Technology, Inc. to conduct surveys and monitor wildlife resources in the Chokecherry-Sierra Madre Wind Resource Area (CSMWRA) to estimate the impacts of project construction and operations on wildlife. The principal objectives of the study were to (1) provide site specific bird use data that would be useful in evaluating potential impacts from the proposed wind-energy facility; (2) provide information that could be used in project planning and design of the facility to minimize impacts to birds; and (3) recommend further studies or potential mitigation measures, if warranted. The protocols for the baseline studies are similar to those used at other wind-energy facilities across the nation, and follow the guidance of the National Wind Coordinating Collaborative (Anderson et al. 1999). The protocols have been developed based on WEST’s experience studying wildlife at proposed wind-energy facilities throughout the US; and were designed to help predict potential impacts to bird species (particularly raptors). Baseline surveys, conducted from June 26, 2008 through June 16, 2009 at the CSMWRA, included fixed-point bird use surveys and incidental observations. Sensitive species of wildlife observed during either the fixed-point surveys or observed incidentally were also recorded. In addition to site-specific data, this report presents existing information and results of studies conducted at other wind-energy facilities. The ability to estimate potential bird mortality at the proposed CSMWRA is greatly enhanced by operational monitoring data collected at existing wind-energy facilities. For several wind-energy facilities, standardized data on fixed-point surveys were collected in association with standardized post-construction (operational) monitoring, allowing comparisons of bird use with bird mortality. Where possible, comparisons with regional and local studies were made. STUDY AREA The proposed CSMWRA is located in Carbon County (Figure 1) approximately four miles (6.4 kilometers [km]) south of Rawlins, Wyoming, within T 16 N – T 18N, R 88 W – R 89W and T 19 N – T21N, R 85 W – R 88W. The CSMWRA is comprised of two portions, the Chokecherry Wind Resource Area (WRA) to the north and the Sierra Madre WRA to the south. Approximately 77% of the study area is covered by scrub-scrub habitat, which is dominated primarily by big sagebrush (Artemisia tridentata). The remaining areas are covered by grassland (19.3%), evergreen forest (1.4%) deciduous forest (0.7%), and emergent wetlands (0.6%), with smaller patches of open water, developed space, barren habitat, mixed forest, woody wetlands, and pastures (Table 1; Figure 3). Topography in the Chokecherry WRA is rolling hills throughout much of the Chokecherry WRA, with topography becoming more varied in the southern portion (Figure 2). A distinct rim
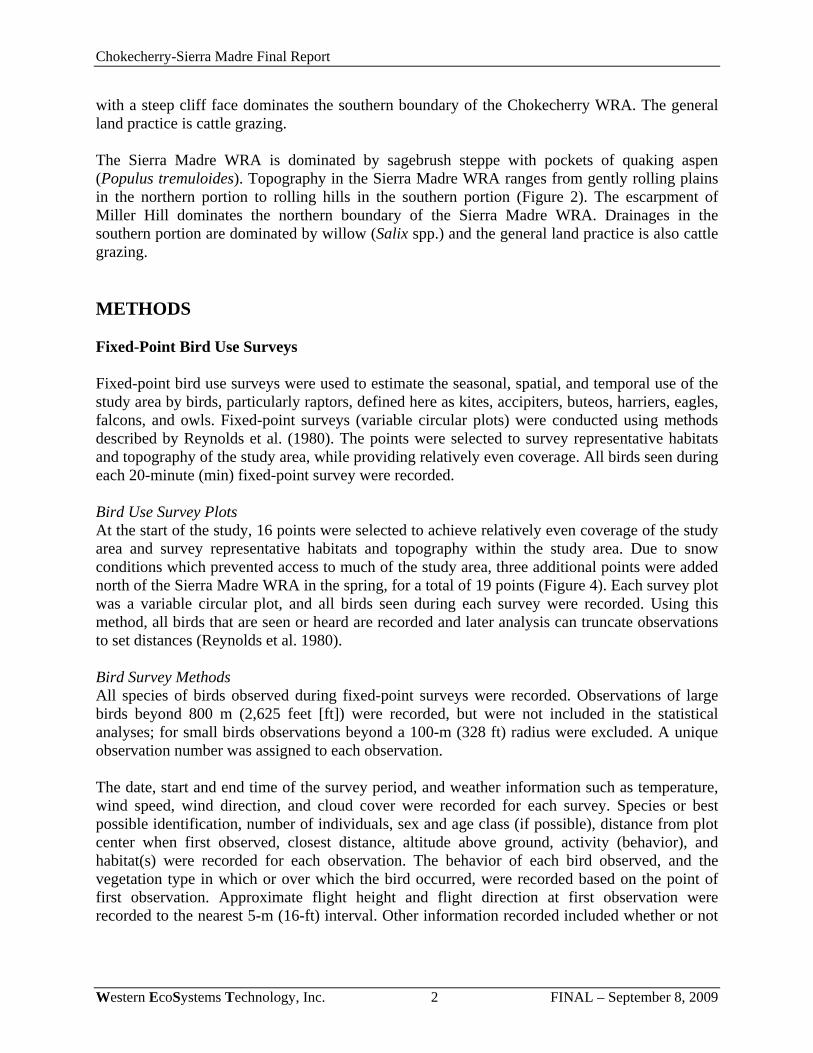
Chokecherry-Sierra Madre Final Report
Western EcoSystems Technology, Inc. 2 FINAL – September 8, 2009
with a steep cliff face dominates the southern boundary of the Chokecherry WRA. The general land practice is cattle grazing. The Sierra Madre WRA is dominated by sagebrush steppe with pockets of quaking aspen (Populus tremuloides). Topography in the Sierra Madre WRA ranges from gently rolling plains in the northern portion to rolling hills in the southern portion (Figure 2). The escarpment of Miller Hill dominates the northern boundary of the Sierra Madre WRA. Drainages in the southern portion are dominated by willow (Salix spp.) and the general land practice is also cattle grazing. METHODS Fixed-Point Bird Use Surveys Fixed-point bird use surveys were used to estimate the seasonal, spatial, and temporal use of the study area by birds, particularly raptors, defined here as kites, accipiters, buteos, harriers, eagles, falcons, and owls. Fixed-point surveys (variable circular plots) were conducted using methods described by Reynolds et al. (1980). The points were selected to survey representative habitats and topography of the study area, while providing relatively even coverage. All birds seen during each 20-minute (min) fixed-point survey were recorded. Bird Use Survey Plots At the start of the study, 16 points were selected to achieve relatively even coverage of the study area and survey representative habitats and topography within the study area. Due to snow conditions which prevented access to much of the study area, three additional points were added north of the Sierra Madre WRA in the spring, for a total of 19 points (Figure 4). Each survey plot was a variable circular plot, and all birds seen during each survey were recorded. Using this method, all birds that are seen or heard are recorded and later analysis can truncate observations to set distances (Reynolds et al. 1980). Bird Survey Methods All species of birds observed during fixed-point surveys were recorded. Observations of large birds beyond 800 m (2,625 feet [ft]) were recorded, but were not included in the statistical analyses; for small birds observations beyond a 100-m (328 ft) radius were excluded. A unique observation number was assigned to each observation. The date, start and end time of the survey period, and weather information such as temperature, wind speed, wind direction, and cloud cover were recorded for each survey. Species or best possible identification, number of individuals, sex and age class (if possible), distance from plot center when first observed, closest distance, altitude above ground, activity (behavior), and habitat(s) were recorded for each observation. The behavior of each bird observed, and the vegetation type in which or over which the bird occurred, were recorded based on the point of first observation. Approximate flight height and flight direction at first observation were recorded to the nearest 5-m (16-ft) interval. Other information recorded included whether or not

Chokecherry-Sierra Madre Final Report
Western EcoSystems Technology, Inc. 3 FINAL – September 8, 2009
the observation was auditory only and in which of the two 10-min intervals of the 20-min survey it was first observed. Locations of raptors, other large birds, and species of concern seen during fixed-point bird use surveys were recorded on field maps by observation number. Flight paths and perch locations were digitized using ArcGIS 9.3. Any comments were recorded in the comments section of the data sheet. Any wildlife observations were recorded on the incidental datasheets. Observation Schedule Sampling intensity was designed to document bird use and behavior by habitat and season within the study area. Fixed-point surveys were conducted from June 26, 2008, through June 16, 2009. Surveys were conducted approximately once a week during spring (March 16 to May 31) and fall (September 1 to November 15), once every two weeks during summer (June 1 to August 31), and three times during the winter (November 16 to December 31). Only three surveys were completed in winter before snow conditions made the area inaccessible. Surveys were conducted during daylight hours and survey periods were varied to approximately cover all daylight hours during a season. To the extent practical, each point was surveyed about the same number of times each season. The three additional points (points 17, 18, and 19) were added during spring surveys because winter snows made much of the CCWRA inaccessible. The purpose of surveying at these three points was to capture south to north migration through the study area. Incidental Wildlife Observations Incidental wildlife observations provided a record of wildlife seen outside of the standardized surveys. All raptors, unusual or unique birds, sensitive species, mammals, reptiles, and amphibians were recorded in a similar fashion to standardized surveys. The observation number, date, time, species, number of individuals, sex/age class, distance from observer, activity, height above ground (for bird species), habitat, and, in the case of sensitive species, the Universal Transverse Mercator (UTM) location was recorded with a global positioning system (GPS) unit. Statistical Analysis Quality Assurance and Quality Control Quality assurance and quality control (QA/QC) measures were implemented at all stages of the study, including in the field, during data entry and analysis, and report writing. Following field surveys, observers were responsible for inspecting data forms for completeness, accuracy, and legibility. A sample of records from an electronic database was compared to the raw data forms and any errors detected were corrected. Irregular codes or data suspected as questionable were discussed with the observer and/or project manager. Errors, omissions, or problems identified in later stages of analysis were traced back to the raw data forms, and appropriate changes in all steps were made. Data Compilation and Storage A Microsoft® ACCESS database was used to store, organize, and retrieve survey data. Data were keyed into the electronic database using a pre-defined format to facilitate subsequent QA/QC and

Chokecherry-Sierra Madre Final Report
Western EcoSystems Technology, Inc. 4 FINAL – September 8, 2009
data analysis. All data forms, field notebooks, and electronic data files were retained for reference. Fixed-Point Bird Use Surveys Bird Diversity and Species Richness Bird diversity was illustrated by the total number of unique species observed. Species lists, with the number of observations and the number of groups, were generated by season, including all observations of birds detected regardless of their distance from the observer. Species richness was calculated as the mean number of species observed per survey (i.e., number of species/plot/20-min survey). Bird diversity and species richness were compared between seasons for fixed-point bird use surveys. Bird Use, Composition, and Frequency of Occurrence For the standardized fixed-point bird use estimates, only observations of large birds detected within the 800-m radius plot were used; small bird observations were limited to 100 m. Estimates of mean bird use (i.e., number of birds/plot/20-min survey) were used to compare differences between bird types, seasons, and other wind-energy facilities. Two different viewsheds were utilized when calculating the various statistics such as species richness, use, percent composition, percent frequency, and exposure index; a circle with a radius of 800 m for large birds and 100 m for small birds. The frequency of occurrence was calculated as the percent of surveys in which a particular species or bird type was observed. Percent composition was calculated as the proportion of the overall mean use for a particular species or bird type. Frequency of occurrence and percent composition provide relative estimates of species exposure to the proposed wind-energy facility. For example, a species may have high use estimates for an area based on just a few observations of large groups; however, the frequency of occurrence will indicate that the species occurs during very few of the surveys and therefore, the species may be less likely affected by the wind energy development. Bird Flight Height and Behavior To calculate potential risk to bird species, the first flight height recorded was used to estimate the percentages of birds flying within the likely “zone of risk” (ZOR) for collision with turbine blades of 35 m to 130 m (114 – 427 ft) above ground level (AGL), which is the blade height of typical turbines that could be used at the CSMWRA. Bird Exposure Index A relative index of collision exposure (R) was calculated for bird species observed during the fixed-point bird use surveys using the following formula:
R = A*Pf*Pt Where A equals mean relative use for species i (large bird observations within 800 m of the observer or 100 m for small birds) averaged across all surveys, Pf equals the proportion of all observations of species i where activity was recorded as flying (an index to the approximate

Chokecherry-Sierra Madre Final Report
Western EcoSystems Technology, Inc. 5 FINAL – September 8, 2009
percentage of time species i spends flying during the daylight period), and Pt equals the proportion of all initial flight height observations of species i within the likely ZOR. This index is only based on initial flight height observations and relative abundance (defined as the use estimate) and does not account for other possible collision risk factors such as foraging or courtship behavior. Spatial Use Data were analyzed by comparing use among plots. Mapped flight paths were qualitatively compared to study area features such as topographic features. The objective of mapping observed bird locations and flight paths was to look for areas of concentrated use by raptors and other large birds and/or consistent flight patterns within the study area. This information can be useful in turbine layout design or adjustments of individual turbines for micro-siting. RESULTS Fifty-three bird species and four mammal species were identified during surveys completed at the CSMWRA. Results of the fixed-point surveys and incidental wildlife observations, and the specific numbers of unique species for each survey type, are discussed in the sections below. Fixed-Point Bird Use Surveys Bird Diversity and Species Richness A total of 433 20-minute fixed-point surveys were conducted at the CSMWRA (Table 2). Fifty unique species were observed over the course of all fixed-point bird use surveys. More unique species were observed during the spring (36 species) and summer (32) than in the fall (25) and winter (six). Mean use was 0.63 birds/plot/20-min survey for large bird species and 1.19 birds/100-m plot/20-min survey for small bird species (Table 2). The mean number of species per plot per survey for large birds was higher in the fall (0.81 species/800-m plot/20-min survey) compared to spring (0.61), summer (0.60), and winter (0.40). For small birds, the mean number of species per plot per survey was higher in the summer (2.05 species/100-m plot/20-min survey) and spring (1.62), compared to the fall (0.43) and winter (0.02; Table 2). A total of 2,005 individual bird observations within 1,301 separate groups were recorded during the fixed-point surveys (Table 3). One species, horned lark (Eremophila alpestris), composed 40.1% of all bird observations. All other species comprised less than 10% of the total observations. The most abundant large bird species recorded was the common raven (Corvus corax; 175 observations). A total of 230 individual raptors were recorded within the CSMWRA, representing 12 species (Table 3). The most abundant raptor observed was golden eagle (Aquila chrysaetos; 69 observations). Bird Use, Composition, and Frequency of Occurrence by Season Mean bird use, percent composition, and frequency of occurrence by season were calculated (Tables 4a and 4b). The highest overall large bird use occurred in the fall (1.37 birds/plot/20-min survey), followed by the summer (1.08), spring (0.98), and winter (0.60; Table 4a). For all small

Chokecherry-Sierra Madre Final Report
Western EcoSystems Technology, Inc. 6 FINAL – September 8, 2009
birds, use was highest in the spring (5.00 birds/plot/20-min survey), followed by the summer (4.18), fall (1.57), and winter (0.02; Table 4b). Waterbirds Waterbirds were only observed during the spring season (Table 4a), with a mean use of 0.10 birds/plot/20-min survey. Waterbirds accounted for 10.5% of all bird use during the spring and the frequency of occurrence was relatively low (1.4% of spring surveys; Table 4a). The only waterbird species observed were American white pelican (Pelecanus erythrorhyncos) and great blue heron (Ardea herodias). Shorebirds Shorebirds were also only observed during the spring season (Table 4a), with a use of 0.01 birds/plot/20-min survey. Shorebirds accounted for less than 1% of overall bird composition during the spring, and were recorded during less than 1% of spring surveys (Table 4a). The only shorebird species observed was killdeer (Charadrius vociferous). Raptors Raptor use was highest in the fall (0.62 birds/plot/20-min survey), followed by summer (0.58), spring (0.35) and winter (0.17; Table 4a). Higher use in the summer and spring was primarily due to high use of the area by American kestrels (Falco sparverius; 0.18 and 0.12 birds/plot/20-min survey, respectively). Higher use in the fall and winter was primarily due to use of the area by golden eagles (0.25 and 0.14 birds/plot/20-min survey, respectively). Raptors comprised 53.1% of overall bird use during the summer, 45.2% during the fall, 36.1% during the spring, and 27.9% during the winter. Raptors were observed during 37.2% of summer surveys, 36.8% of fall surveys, 28.6% of spring surveys, and 16.7% of winter surveys (Table 4a). Vultures Vultures, limited to turkey vulture (Cathartes aura), were only recorded during the fall and spring (0.01 birds/plot/20-min survey for both seasons; Table 4a). Vultures accounted for less than 1% of overall bird use and were recorded during less than 1% of all surveys during both seasons (Table 4a). Upland Gamebirds Upland gamebird use, limited to greater sage-grouse (Centrocercus urophasianus) was highest during the winter (0.09 birds/plot/20-min survey) compared to the spring (0.06), fall (0.01), and summer (0; Table 4a). Greater sage-grouse accounted for 15.1% of all bird use during the winter, 5.9% in the spring, and 1.1% in the fall. Greater sage-grouse were recorded during 5.8% of spring surveys, 4.9% winter surveys, and less than 1% of fall surveys (Table 4a). Large Corvids Large corvids, consisting of American crow (Corvus brachyrhynchos), black-billed magpie (Pica pica), and common raven, had the highest use in the fall (0.73 birds/plot/20-min survey), followed by spring (0.45), summer (0.44) and winter (0.34; Table 4a). Large corvids accounted for 57.0% of all bird use during the winter, 53.2% in the fall, 45.9% in the spring, and 40.5% in the summer. Large corvids were recorded during 29.7% of fall surveys, 20.5% of spring surveys, 16.0% of winter surveys, and 7.7% of summer surveys (Table 4a).

Chokecherry-Sierra Madre Final Report
Western EcoSystems Technology, Inc. 7 FINAL – September 8, 2009
Passerines A 100-m radius viewshed was used for small bird data analysis, therefore, results are not directly comparable to the other large bird types, which were recorded out to 800 m. Passerine use was highest in spring (4.97 birds/plot/20-min survey), compared to summer (4.04), winter (1.57), and fall (0.02; Table 4b). Horned lark had the highest use by any one species in all seasons (spring 3.38 birds/plot/20-min survey; summer 1.83; fall 1.15; winter 0.02). Passerines were observed during more than 80% of the surveys in the summer and spring, 29.4% of fall surveys, and only 2.1% of winter surveys (Table 4b). After horned lark (805 observations; Table 3), the most common small passerine species recorded were: vesper sparrow (Pooecetes gramineus; 121), Brewer’s sparrow (Euphagus cyanocephalus: 80), western meadowlark (Sturnella neglecta; 69), and sage thrasher (Oreoscoptes montanus; 65). Bird Flight Height and Behavior Flight height characteristics were estimated for both bird types and bird species (Tables 5 and 6). During the study, 311 single large birds or groups totaling 467 individuals were observed flying within the 800-m radius plot (Table 5). Overall, 29.3% of large birds observed flying were recorded within the ZOR for collision with turbine blades (35 to 135 m AGL), 67.0% were below the ZOR, and 3.6% were flying above the ZOR (Table 5). More than half (61.8%) of flying raptors were observed below the ZOR, 30.4% were within the ZOR, and only 7.7% were above the ZOR. Waterbirds had the highest percentage of flying birds within the ZOR (100%), although this was only based on two groups totaling 16 individuals. Fifty percent of turkey vultures were observed flying within the ZOR, but this percentage was based on only two vultures observed flying. Raptors had the third highest percentage of birds within the ZOR, primarily due to 45.2% of eagle observations and 43.6% of buteo observations recorded at this height. Shorebirds, doves/pigeons, large corvids, and upland gamebirds were typically observed flying below the ZOR (Table 5). The majority of passerines within the 100-m plot were observed below the ZOR (99.8%), while 0.2% were recorded within the ZOR and none were recorded above the ZOR (Table 5). Of all large bird species, five species had at least 25 groups observed flying; golden eagle was the most commonly observed species flying within the likely ZOR based on initial observations (45.0%; Table 6a). Three species were always seen flying within the likely ZOR based on initial; observations; however, these were based on only one or two observations. Of all passerine and small bird species, four species had at least 30 groups observed flying, with only one species, horned lark, recorded flying within the ZOR based on initial observations (Table 6b). Bird Exposure Index A relative exposure index was calculated for each bird species (Tables 6a and 6b). Common raven (0.09) and golden eagle (0.06) had exposure indices higher than any other species. All other raptor species had an exposure index of 0.02 or less (Table 6a). The passerine species with the highest exposure index was horned lark, with an index of less than 0.01 (Table 6b). All identified small birds had exposure indices of zero because they were not observed flying within the ZOR based on initial observations.

Chokecherry-Sierra Madre Final Report
Western EcoSystems Technology, Inc. 8 FINAL – September 8, 2009
Spatial Use For all large bird species combined, use was highest at point 12 (3.18 birds/20-min survey). Bird use at other points ranged from 0.32 to 2.55 birds/20-min survey (Figure 5). The high mean use estimate for point 12 was largely due to high use at this point by large corvids (2.50 birds/20-min survey), and use by large corvids at the remaining points ranged from zero to 1.05 birds/20-min survey. Waterbird use was highest at point 16, with 0.67 birds/20-min survey, and were only observed at one other point (point one; 0.07 birds/20-min survey). Mean shorebird use was only recorded at point 17, with 0.17 birds/20-min survey at this point. Raptor use was highest at point four (0.93 birds/20-min survey), and ranged from 0.10 to 0.83 birds/20-min survey at other points. Vultures were only seen at points six and eleven (0.03 and 0.04 birds/20-min survey, respectively). Upland gamebird use was highest at point 13 (0.14 birds/20-min survey), and ranged from zero to 0.09 bird/20-min survey at other points. Passerine use was highest at point 13 (5.10 birds/20-min survey), and ranged from 1.81 to 4.70 at other points (Figure 5). Flight paths for waterbirds, waterfowl, shorebirds, raptors, and vultures were digitized and mapped (Figures 6a-f). No obvious flyways or concentration areas were observed for any species. The available data do not indicate that any portions of the study area warrant being excluded from development due to very high bird use. Sensitive Species Observations Ten sensitive bird species totaling 269 individuals in 215 groups were observed during fixed-point bird use surveys (Tables 3 and 7). As with all avian surveys, this is a tally that in some cases may represent repeated observations of the same individual. The greater sage-grouse has been petitioned for listing as a federal threatened species (ECOS 2009). A total of 28 greater sage-grouse were recorded during fixed-point bird use surveys within the CSMWRA (Table 7). The greater sage-grouse is also a Wyoming Native Species Status (NSS) 2 species. Nine other NSS2, NSS3, or NSS4 species (WGFD 2005; WYNDD 2009) were also recorded during fixed-point surveys. The most abundant sensitive species recorded during fixed-point surveys were Brewer’s sparrow (80 observations), sage thrasher (65), and sage sparrow (Amphispiza belli; 59). Incidental Wildlife Observations There were 12 bird species observed incidentally, totaling 270 individuals within 157 separate groups during the study (Table 8). Four mammal species totaling 3,083 individuals in 304 groups were also observed incidentally at the CSMWRA. Bird Observations The most abundant bird species recorded as an incidental wildlife observation were greater sage-grouse (123 observations), golden eagle (52 observations), and northern harrier (Circus cyaneus; 38 observations). All other bird species recorded incidentally had less than 20 observations (Table 8). Three bird species, American goldfinch (Carduelis tristis), burrowing owl (Athene cunicularia), and snow bunting (Plectrophenax nivalis), were only observed incidentally and were not observed during fixed-point surveys.

Chokecherry-Sierra Madre Final Report
Western EcoSystems Technology, Inc. 9 FINAL – September 8, 2009
Mammal Observations The most commonly recorded mammal species in the CSMWRA was pronghorn antelope (Antilocapra americana) with 2,879 observations in 285 groups (Table 8). Three additional mammal species were also recorded incidentally: elk (Cervus elephus; 189 observations), mule deer (Odocoileus hemionus; 10), and white-tailed prairie dog (Cynomys leucurus; five). Sensitive Species Observations Six sensitive species totaling 146 individuals in 49 groups were recorded during incidental observations (Table 7; WGFD 2005; ECOS 2009; WYNDD 2009). A total of 123 greater sage-grouse in 29 groups were recorded incidentally within the CSMWRA. All other sensitive bird species, classified as NSS2, NSS3, or NSS4 species, had ten or fewer observations recorded. One sensitive mammal species, the white-tailed prairie dog (NSS4), was also observed incidentally, with a total of five individuals observed in one group. DISCUSSION AND IMPACT ASSESSMENT Bird Impacts Direct Effects The most probable direct impact to birds from wind-energy facilities is direct mortality or injury due to collisions with turbines or guy wires of meteorological (met) towers. Collisions may occur with resident birds foraging and flying within the study area or with migrant birds seasonally moving through the study area. Project construction could affect birds through loss of habitat, or potential fatalities from construction equipment. Impacts from the decommissioning of the facility are anticipated to be similar to construction in terms of noise, disturbance, and equipment. Potential mortality from construction equipment is expected to be very low. Equipment used in wind-energy facility construction generally moves at slow rates or is stationary for long periods (e.g., cranes). The risk of direct mortality to birds from construction is most likely potential destruction of a nest for ground- and shrub-nesting species during initial site clearing. Substantial data on bird mortality at wind-energy facilities are available from studies in California and throughout the West and Midwest. Of 841 bird fatalities reported from California studies (>70% from the Altamont Pass facility in California), about 39% were diurnal raptors, about 19% were passerines (excluding house sparrows [Passer domesticus] and European starlings [Sturnus vulgaris]), and about 12% were owls. Non-protected birds, including house sparrows, European starlings, and rock pigeons (Columba livia) comprised about 15% of the fatalities. Other bird types generally made up less than 10% of the fatalities (Erickson et al. 2002b). During 12 fatality monitoring studies conducted outside of California, diurnal raptor fatalities comprised about 2% of the wind-energy facility-related fatalities and raptor mortality averaged 0.03 fatalities/turbine/year. Passerines (excluding house sparrows and European starlings) were the most common collision victims, comprising about 82% of the 225 fatalities documented. For all bird species combined, estimates of the number of bird fatalities per turbine per year from individual studies ranged from zero at the Searsburg wind-energy facility in Vermont (Kerlinger 1997) and the Algona facility in Iowa (Demastes and Trainer 2000), to 7.7 at

Chokecherry-Sierra Madre Final Report
Western EcoSystems Technology, Inc. 10 FINAL – September 8, 2009
the Buffalo Mountain facility in Tennessee (Nicholson 2003). Using mortality data from a 10-year period from wind-energy facilities throughout the entire United States, the average number of bird collision fatalities is 3.1 fatalities/MW/year, or 2.3 fatalities/turbine/year (NWCC 2004). Raptor Use and Exposure Risk The annual mean raptor use at the CSMWRA (0.46 raptors/plot/20-min survey) was compared with other wind-energy facilities that implemented similar protocols and had data for three or four seasons. Similar studies were conducted at 36 other wind-energy facilities. The annual mean raptor use at these wind-energy facilities ranged from 0.09 to 2.34 raptors/plot/20-min survey (Figure 7). Based on the results from these wind-energy facilities, a ranking of seasonal raptor mean use was developed as: low (0 – 0.5 raptors/plot/20-min survey); low to moderate (0.5 – 1.0); moderate (1.0 – 2.0); high (2.0 – 3.0); and very high (> 3.0). Under this ranking, mean raptor use (number of raptors divided by the number of 800-m plots and the total number of surveys) at the CSMWRA is considered to be low, with the CSMWRA ranking twenty-second when compared with the 36 other wind-energy facilities (Figure 7). Although high numbers of raptor fatalities have been documented at some wind-energy facilities (e.g. Altamont Pass), a review of studies at wind-energy facilities across the United States reported that only 3.2% of casualties were raptors (Erickson et al. 2001a). Indeed, although raptors occur in most areas with the potential for wind-energy development, individual species appear to differ from one another in their susceptibility to collision (NRC 2007). Results from Altamont Pass in California suggest that mortality for some species is not necessarily related to abundance (Orloff and Flannery 1992). American kestrels, red-tailed hawks (Buteo jamaicensis), and golden eagles were killed more often than predicted based on abundance. Thus far, only three northern harrier fatalities at existing wind-energy facilities have been reported in publicly available documents, despite the fact they are commonly observed during point counts at these facilities (Erickson et al. 2001a; Whitfield and Madders 2006). Because northern harriers often forage close to the ground, risk of collision with turbine blades is considered low for this species. Relative use by American kestrels at the High Winds facility is almost six times the use by American kestrels at the Altamont Pass facility (Kerlinger 2005). It is likely that many factors, in addition to abundance, are important in predicting raptor mortality. Exposure indices analysis may also provide insight into what species have a higher likelihood of turbine casualties. The index considers relative probability of exposure based on abundance, proportion of daily activity spent flying, and proportion of flight height of each species within the ZOR for turbines likely to be used at the wind-energy facility. For the CSMWRA, the raptor species with the highest exposure index was the golden eagle, which was ranked second of all species, at 0.06 (Table 6a). The relatively higher exposure index for golden eagle was due to flight height data showing that 45.0% of flying observations were within the ZOR based on initial observations. The exposure index analysis is based on observations of birds during the daylight period and does not take into consideration flight behavior (e.g., during foraging or courtship) or abundance of nocturnal migrants. It also does not take into consideration habitat selection, the ability to detect and avoid turbines, and other factors that may vary among species and influence likelihood for turbine collision. For these reasons, the actual risk for some species may be lower or higher than indicated by this index. Based on species composition of the most common raptor fatalities at other western wind-energy facilities and species composition of

Chokecherry-Sierra Madre Final Report
Western EcoSystems Technology, Inc. 11 FINAL – September 8, 2009
raptors observed at the Chokecherry-Sierra Madre Wind Resource Area during the surveys, the majority of the fatalities of diurnal raptors will likely consist of red-tailed hawk, American kestrel, and golden eagle. Based on the seasonal use estimates, it is expected that risk to raptors would be unequal across seasons, with the lowest risk in the winter and the highest risk during the fall. However, the winter use estimates were only based on three surveys that were completed prior to the area becoming inaccessible due to snow. Therefore, winter use as based on these three surveys may not be representative of actual use throughout the entire winter, but is the best data available for predicting winter use of the study area by raptors. A regression analysis of raptor use and mortality for 13 new-generation wind-energy facilities, where similar methods were used to estimate raptor use and mortality, found that there was a significant correlation between use and mortality (R2
= 69.9%; Figure 8). Using this regression to predict raptor collision mortality at the CSMWRA, based on an adjusted mean raptor use of 0.46 raptors/plot/20-min survey, yields an estimated fatality rate of 0.04 fatalities/MW/year. A 90% prediction interval around this estimate is zero to 0.30 fatalities/MW/year. The estimate of 0.04 raptor fatalities/MW/year would equate to an estimate of 80 raptor fatalities per year for a 2,000-MW development. These fatalities would be spread over several species, seasons, and between resident and migrant birds. Nevertheless, this level of fatality might result in a measurable adverse effect on the demographics of the local population of golden eagles. Non-Raptor Use and Exposure Risk Most bird species in the US are protected by the Migratory Bird Treaty Act (MBTA 1918). Passerines (primarily perching birds) have been the most abundant bird fatality at wind energy facilities outside California (Erickson et al. 2001a, 2002b), often comprising more than 80% of the bird fatalities. Both migrant and resident passerine fatalities have been observed. Given that passerines made up a large proportion of the birds observed during the baseline study, passerines would be expected to make up the largest proportion of fatalities at the CSMWRA. Exposure indices, based on observations within 100 m, indicate that horned lark is the most likely passerine to be exposed to collision from wind turbines at the CSMWRA (Table 6b). Most non-raptors had relatively low exposure indices due to the majority of individuals flying below the likely zone of risk. Due to the low exposure risks at CSMWRA, it is unlikely that non-raptor populations will be adversely affected by direct mortality from the operation of the wind-energy facility. Wind-energy facilities with year-round use by water dependent species have shown the highest mortality, although the levels of waterfowl/waterbird/shorebird mortality appear insignificant compared to the use of the facilities by these groups. Of 1,033 bird carcasses collected at US wind-energy facilities, waterbirds comprised about 2%, waterfowl comprised about 3%, and shorebirds comprised less than 1% (Erickson et al. 2002b). At the Klondike, Oregon wind-energy facility, only two Canada goose (Branta canadensis) fatalities were documented (Johnson et al. 2003) even though 43 groups totaling 4,845 individual Canada geese were observed during pre-construction surveys (Johnson et al. 2002a). The recently constructed Top of Iowa wind-energy facility is located in cropland between three Wildlife Management Areas (WMAs) with historically high bird use, including migrant and resident waterfowl. During a recent study, approximately one million goose-use days and 120,000 duck-use days were recorded in the WMAs during the fall and early winter, and no waterfowl fatalities were documented during

Chokecherry-Sierra Madre Final Report
Western EcoSystems Technology, Inc. 12 FINAL – September 8, 2009
concurrent and standardized wind-energy facility fatality studies (Jain 2005). Similar findings were observed at the Buffalo Ridge wind-energy facility in southwestern Minnesota, which is located in an area with relatively high waterfowl/waterbird use and some shorebird use. Snow geese (Chen caerulescens), Canada geese, and mallards (Anas platyrhynchos) were the most common waterfowl observed. Three of the 55 fatalities observed during the fatality monitoring studies were waterfowl, including two mallards and one blue-winged teal (Anas discors). Two American coots (Fulica americana), one grebe, and one shorebird fatality were also found (Johnson et al. 2002b). Based on available evidence, waterfowl, waterbirds and shorebirds do not seem especially vulnerable to turbine collisions and significant impacts are not likely. Sensitive Species Use and Exposure Risk No federally-listed threatened or endangered species were observed in the CSMWRA during fixed-point bird use surveys (Table 3) or incidentally (Table 8). Thirty-five groups totaling 151 greater sage-grouse were observed (Table 7). This species has been petitioned for listing under the Endangered Species Act (ESA 1973), with a determination expected in February 2010; the greater sage-grouse is also classified by the Wyoming Game and Fish Department (WGFD) as NSS2. Ten other bird species considered sensitive (NSS) by the WGFD were also observed within the CSMWRA. Wyoming sensitive species of most concern are those classified as NSS1 or NSS2. No NSS1 bird species were observed and the only NSS2 species observed was bald eagle (Haliaeetus leucocephalus), with a total of six individuals recorded (Table 7). Due to very low use of the CSMWRA by bald eagle, it is unlikely that significant collision mortality would occur. Of those species classified as NSS3 or NSS4, the most frequently observed bird species were Brewer’s sparrow (80 individuals), sage thrasher (65), and sage sparrow (59). As with all of the avian surveys, these are tallies that in some cases represent repeated observations of the same individuals. Brewer’s sparrows, sage thrashers, and sage sparrows were never observed flying within the turbine ZOR. Therefore, significant risk of collision mortality is not expected for these species. Use of the CSMWRA by the other sensitive species recorded was relatively low and no significant direct impacts are likely to occur. Indirect Effects The presence of wind turbines may alter the landscape so that wildlife use patterns are affected, displacing wildlife away from the project facilities and suitable habitat. Some studies from wind-energy facilities in Europe consider displacement effects to have a greater impact on birds than collision mortality (Gill et al. 1996). However, one study conducted in England to assess displacement of wintering farmland birds by wind turbines located in an agricultural landscape found that only common (ring-necked) pheasants (Phasianus colchicus) apparently avoided turbines. The other species/bird groups examined, including granivores, red-legged partridge (Alectoris rufa), Eurasian skylark (Alauda arvensis), and corvids, showed no displacement from wind turbines. In fact, Eurasian skylarks and corvids showed increased use of areas close to turbines, possibly due to increased food resources associated with disturbed areas (Devereux et al. 2008). The greatest concern with displacement impacts for wind-energy facilities in the US has been where these facilities have been constructed in grassland or other native habitats (Leddy et al. 1999; Mabey and Paul 2007), While Crockford (1992) suggests that disturbance appears to impact feeding, resting, and migrating birds, rather than breeding birds, results from studies at

Chokecherry-Sierra Madre Final Report
Western EcoSystems Technology, Inc. 13 FINAL – September 8, 2009
the Stateline wind-energy facility in Washington and Oregon (Erickson et al. 2004) and the Buffalo Ridge wind-energy facility in Minnesota (Johnson et al. 2000a) suggest that breeding birds are also affected by wind-facility operations. Raptor Displacement In addition to possible direct effects on raptors within the study area (discussed above), indirect effects caused by disturbance-type impacts, such as construction activity near an active nest or primary foraging area, also have a potential impact on raptor species. Birds displaced from wind-energy facilities might move to areas with fewer disturbances, but with lower quality habitat, with an overall effect of reducing breeding success. Most studies on raptor displacement at wind-energy facilities, however, indicate effects to be negligible (Howell and Noone 1992; Johnson et al. 2000a, 2003; Madders and Whitfield 2006). Notable exceptions to this include a study in Scotland that described territorial golden eagles avoiding the entire wind-energy facility area, except when intercepting non-territorial birds (Walker et al. 2005). A study at the Buffalo Ridge wind-energy facility in Minnesota found evidence of northern harriers avoiding turbines on both a small scale (less than 100 m from turbines) and a larger scale in the year following construction (Johnson et al. 2000a). Two years following construction, however, no large-scale displacement of northern harriers was detected. The only published report of avoidance of wind turbines by nesting raptors occurred at Buffalo Ridge, Minnesota, where raptor nest density on 101 square miles (mi2; 262 km2) of land surrounding a wind-energy facility was 5.94 nests/39 mi2 (5.94 nests/101 km2), yet no nests were present in the 12 mi2 (31 km2) facility itself, even though habitat was similar (Usgaard et al. 1997). However, this analysis assumes that raptor nests are uniformly distributed across the landscape, an unlikely event, and even though no nests were found, only two nests would be expected for an area 12 mi2 in size if the nests were distributed uniformly. At a wind-energy facility in eastern Washington, based on extensive monitoring using helicopter flights and ground observations, raptors still nested in the study area at approximately the same levels after construction, and several nests were located within 0.5 miles (0.8 km) of turbines (Erickson et al. 2004). At the Foote Creek Rim Wind-Energy Facility in southern Wyoming, one pair of red-tailed hawks nested within 0.3 miles (0.5 km) of the turbine strings, and seven red-tailed hawk nests, one great horned owl (Bubo virginianus) nest, and one golden eagle nest were located within one mile (1.6 km) of the wind-energy facility successfully fledged young (Johnson et al. 2000b). The golden eagle pair successfully nested 0.5 mile from the facility for three different years after it became operational. A Swainson’s hawk also nested within 0.25 mile (0.4 km) of a turbine string at the Klondike I wind-energy facility in Oregon after the facility was operational (Johnson et al. 2003). These observations suggest that there will be limited nesting displacement of raptors at the CSMWRA, although the creation of a buffer surrounding known nests when siting turbines will further reduce any potential disturbance impact, and perhaps reduce the risk of collisions with turbines. Displacement of Non-Raptor Bird Species Studies concerning displacement of non-raptor species have concentrated on grassland passerines and waterfowl/waterbirds (Winkelman 1990; Larsen and Madsen 2000; Mabey and Paul 2007). Wind-energy facility construction appears to cause small-scale local displacement of grassland passerines and is likely due to the birds avoiding turbine noise and maintenance activities.

Chokecherry-Sierra Madre Final Report
Western EcoSystems Technology, Inc. 14 FINAL – September 8, 2009
Construction also reduces habitat effectiveness because of the presence of access roads and large gravel pads surrounding turbines (Leddy 1996; Johnson et al. 2000a). Leddy et al. (1999) surveyed bird densities in Conservation Reserve Program (CRP) grasslands at the Buffalo Ridge wind-energy facility in Minnesota, and found mean densities of 10 grassland bird species were four times higher at areas located 180 m (591 feet) from turbines than they were at grasslands nearer turbines. Johnson et al. (2000a) found reduced use of habitat by seven of 22 grassland-breeding birds following construction of the Buffalo Ridge wind energy facility in Minnesota. Results from the Stateline wind-energy facility in Oregon and Washington (Erickson et al. 2004), and the Combine Hills wind-energy facility in Oregon (Young et al. 2005), suggest a relatively small impact of the wind-energy facilities on grassland nesting passerines. Transect surveys conducted prior to and after construction of the wind-energy facilities found that grassland passerine use was significantly reduced within approximately 50 m (164 feet) of turbine strings, but areas further away from turbine strings did not have reduced bird use. Displacement effects of wind-energy facilities on waterfowl and shorebirds appear to be mixed. Studies from the Netherlands and Denmark suggest that densities of these types of species near turbines were lower compared to densities in similar habitats away from turbines (Winkelman 1990; Pedersen and Poulsen 1991). However, a study from a facility in England, found no effect of wind turbines on populations of cormorant (Phalacrcorax xarbo), purple sandpipers (Calidris maritima), eiders (Somateria mollissima), or gulls, although the cormorants were temporarily displaced during construction (Lawrence et al. 2007). At the Buffalo Ridge wind-energy facility in Minnesota, the abundance of several bird types, including shorebirds and waterfowl, were found to be significantly lower at survey plots with turbines than at reference plots without turbines (Johnson et al. 2000a). The report concluded that the area of reduced use was limited primarily to those areas within 100 m of the turbines. Disturbance tends to be greatest for migrating birds while feeding and resting (Crockford 1992; NRC 2007). Much debate has occurred recently regarding the potential impacts of wind-energy facilities on prairie grouse, including greater sage-grouse. Under a set of voluntary guidelines, the US Fish and Wildlife Service (USFWS) has taken a precautionary approach and recommends wind turbines be placed at least five miles (eight km) from known prairie grouse lek locations (USFWS 2003). The USFWS argues that because prairie grouse evolved in habitats with little vertical structure, placement of tall man-made structures, such as wind turbines, in occupied prairie grouse habitat may result in a decrease in habitat suitability (USFWS 2004). While the potential exists for wind turbines to displace greater sage-grouse from occupied habitat, well-designed studies examining the potential impacts of wind turbines on prairie grouse are currently lacking. Ongoing research conducted by Kansas State University to examine response of greater prairie-chickens (Tympanuchus cupido) to wind-energy development in Kansas, and by WEST, Inc. to examine response of greater sage-grouse to wind-energy development in Wyoming, will help address the potential for impacts to prairie grouse. CONCLUSIONS AND RECOMMENDATIONS Based on data collected during this study, raptor and all bird use of the CSMWRA is generally similar to most WRAs evaluated throughout the western and midwestern US using similar

Chokecherry-Sierra Madre Final Report
Western EcoSystems Technology, Inc. 15 FINAL – September 8, 2009
methods. Based on the results of the studies to date, bird mortality at the CSMWRA would likely be similar or lower than that documented at other wind-energy facilities located in the western and Midwestern US, where bird collision mortality has been relatively low. Currently, few published studies are available from the western US that compare bird use to bird mortality rates. Based on research conducted at wind-energy facilities throughout the US, raptor use at the CSMWRA is generally lower than levels recorded at other wind-energy facilities. Raptor fatality rates are expected to be within the range of fatality rates observed at other facilities where raptor use levels are lower. To date, no relationships have been observed between overall use by other bird types, and fatality rates of those bird types at wind-energy facilities. However, the flight characteristics and foraging habits of some species may result in increased exposure for these species at the CSMWRA. The surveys conducted for the proposed CSMWRA also do not address the impacts of the proposed facility to nocturnal migrants, such as passerines. To date, overall fatality rates for birds (including nocturnal migrants) at wind-energy facilities have been relatively low and consistent in the West. As more research is conducted at facilities in the West, more information regarding the potential direct impacts of wind-energy facilities to bird species will be obtained. The proposed wind-energy facility is comprised of native habitats such as scrub-shrub and grasslands (Table 1, Figure 3). Several species considered to be sensitive were observed breeding within these habitats at the CSMWRA, and some potential exists for wind turbines to displace breeding birds. Research concerning displacement impacts to passerines, waterfowl, and waterbirds associated with wind-energy facilities is limited, but some studies show the potential for small scale (200 m [656 ft] or less) displacement, while impacts to densities of birds at larger scales have not been shown. REFERENCES Anderson, R., M. Morrison, K. Sinclair, and D. Strickland. 1999. Studying Wind Energy/Bird
Interactions: A Guidance Document. Metrics and Methods for Determining or Monitoring Potential Impacts on Birds at Existing and Proposed Wind Energy Sites. Prepared for the Avian Subcommittee and National Wind Coordinating Committee (NWCC). December 1999. National Wind Coordinating Committee/RESOLVE. Washington, D.C. 87 pp. http://www.nationalwind.org/publications/wildlife/avian99/Avian_booklet.pdf
Cooper, B.A., R.J. Blaha, T.J. Mabee, and J.H. Plissner. 2004. A Radar Study of Nocturnal Bird
Migration at the Proposed Cotterel Mountain Wind Energy Facility, Idaho, Fall 2003. Technical report prepared for Windland, Inc., Boise, Idaho, by ABR, Inc., Forest Grove, Oregon. January 2004.
Crockford, N.J. 1992. A Review of the Possible Impacts of Wind Farms on Birds and Other
Wildlife. Joint Nature Conservancy Committee (JNCC) Report No. 27. JNCC. Peterborough, United Kingdom. 60 pp.

Chokecherry-Sierra Madre Final Report
Western EcoSystems Technology, Inc. 16 FINAL – September 8, 2009
Demastes, J.W. and J.M. Trainer. 2000. Avian Risk, Fatality, and Disturbance at the IDWGP Wind Farm, Algona, Iowa. Final Report Submitted by the University of Northern Iowa, Cedar Falls, Iowa. 21 pp.
Devereux, C.L., M.J.H. Denny, and M.J. Whittingham. 2008. Minimal Effects of Wind Turbines
on the Distribution of Wintering Farmland Birds. Journal of Applied Ecology Windfarms and Farmland Birds: 1365-2664.
Endangered Species Act (ESA). 1973. 16 United States Code § 1531-1544. December 28, 1973. Environmental Conservation Online System (ECOS). 2009. US Fish and Wildlife Service
(USFWS) Threatened and Endangered Species System (TESS). USFWS Endangered Species Program Homepage: http://www.fws.gov/endangered/ ECOS: http://ecos.fws.gov/tess_public
Erickson, W.P., D.P. Young, Jr., G. Johnson, J. Jeffrey, K. Bay, R. Good, and H. Sawyer. 2003a.
Wildlife Baseline Study for the Wild Horse Wind Project. Summary of Results from 2002-2003 Wildlife Surveys May 10, 2002- May 22, 2003. Draft report prepared for Zilkha Renewable Energy, Portland, Oregon. Prepared by Western EcoSystems Technology, Inc. (WEST), Cheyenne, Wyoming. November 2003.
Erickson, W.P., J. Jeffrey, D.P. Young, Jr., K. Bay, R. Good, K. Sernka, and K. Kronner. 2003b.
Wildlife Baseline Study for the Kittitas Valley Wind Project: Summary of Results from 2002 Wildlife Surveys. Final Report February 2002– November 2002. Prepared for Zilkha Renewable Energy, Portland, Oregon, by Western EcoSystems Technology, Inc. (WEST), Cheyenne, Wyoming, and Northwest Wildlife Consultants, Inc. (NWC), Pendleton, Oregon. January 2003.
Erickson, W.P., J. Jeffrey, K. Kronner, and K. Bay. 2004. Stateline Wind Project Wildlife
Monitoring Final Report: July 2001 - December 2003. Technical report for and peer-reviewed by FPL Energy, Stateline Technical Advisory Committee, and the Oregon Energy Facility Siting Council, by Western EcoSystems Technology, Inc. (WEST), Cheyenne, Wyoming, and Walla Walla, Washington, and Northwest Wildlife Consultants (NWC), Pendleton, Oregon. December 2004. http://www.west-inc.com
Erickson, W.P., J. Jeffrey, and V.K. Poulton. 2008. Avian and Bat Monitoring: Year 1 Report.
Puget Sound Energy Wild Horse Wind Project, Kittitas County, Washington. Prepared for Puget Sound Energy, Ellensburg, Washington, by Western EcoSystems Technology, Inc. (WEST), Cheyenne, Wyoming. January 2008.
Erickson, W.P., G.D. Johnson, K. Bay, and K. Kronner. 2002a. Ecological Baseline Study for the
Zintel Canyon Wind Project. Final Report April 2001 – June 2002. Technical report prepared for Energy Northwest. Prepared for Energy Northwest by Western EcoSystems Technology, Inc. (WEST), Cheyenne, Wyoming, and Northwest Wildlife Consultants, Inc. (NWC), Pendleton, Oregon. June 2002.

Chokecherry-Sierra Madre Final Report
Western EcoSystems Technology, Inc. 17 FINAL – September 8, 2009
Erickson, W.P., G.D. Johnson, D.P. Young, Jr., D. Strickland, R. Good, M. Bourassa, K. Bay, and K. Sernka. 2002b. Synthesis and Comparison of Baseline Avian and Bat Use, Raptor Nesting and Mortality Information from Proposed and Existing Wind Developments. Technical report prepared for Bonneville Power Administration, Portland, Oregon by WEST, Inc., Cheyenne, Wyoming. December 2002. http://www.bpa.gov/Power/pgc/wind/Avian_and_Bat_Study_12-2002.pdf
Erickson, W.P., G.D. Johnson, M.D. Strickland, D.P. Young, Jr., K.J. Sernka, and R.E. Good.
2001a. Avian Collisions with Wind Turbines: A Summary of Existing Studies and Comparisons to Other Sources of Bird Collision Mortality in the United States. National Wind Coordinating Committee (NWCC) Publication and Resource Document. Prepared for the NWCC by WEST, Inc., Cheyenne, Wyoming. August 2001. http://www.nationalwind.org/publications/default.htm and http://www.west-inc.com
Erickson, W.P., E. Lack, M. Bourassa, K. Sernka, and K. Kronner. 2001b. Wildlife Baseline
Study for the Nine Canyon Wind Project, Final Report May 2000-October 2001 Technical report prepared for Energy Northwest, Richland, Washington.
Gill, J.P., M. Townsley, and G.P. Mudge. 1996. Review of the Impacts of Wind Farms and Other
Aerial Structures Upon Birds. Scottish Natural Heritage Review No. 21. Scottish Natural Heritage. Battleby, United Kingdom.
Howell, J.A. and J. Noone. 1992. Examination of Avian Use and Mortality at a U.S. Windpower
Wind Energy Development Site, Montezuma Hills, Solano County, California. Final Report to Solano County Department of Environmental Management, Fairfield, California. 41pp.
Jain, A. 2005. Bird and Bat Behavior and Mortality at a Northern Iowa Windfarm. M.S. Thesis.
Iowa State University, Ames, Iowa. Jeffrey, J.D., W.P. Erickson, K.J. Bay, V.K. Poulton, W.L. Tidhar, and J.E. Baker. 2008.
Wildlife Baseline Studies for the Golden Hills Wind Resource Area, Sherman County, Oregon. Final Report May 2006 – October 2007. Prepared for BP Alternative Energy North America Inc., Houston, Texas, by Western EcoSystems Technology, Inc. (WEST), Cheyenne, Wyoming.
Johnson, G.D. 2004. Analysis of Potential Wildlife and Habitat Impacts from the Klondike II
Project, Sherman County, Oregon. Technical report prepared by WEST, Inc., for CH2M HILL and PPM Energy.
Johnson, G.D. and W.P. Erickson. 2004. Analysis of Potential Wildlife/Wind Plant Interactions,
Bighorn Site, Klickitat County, Washington. Prepared for CH2M HILL, Portland, Oregon by WEST, Inc., Cheyenne, Wyoming. August 2004.

Chokecherry-Sierra Madre Final Report
Western EcoSystems Technology, Inc. 18 FINAL – September 8, 2009
Johnson, G.D., W.P. Erickson, K. Bay, and K. Kronner. 2002a. Baseline Ecological Studies for the Klondike Wind Project, Sherman County, Oregon. Final report prepared for Northwestern Wind Power, Goldendale, Washington, by Western EcoSystems Technology, Inc. (WEST) Cheyenne, Wyoming, and Northwest Wildlife Consultants, Inc. (NWC), Pendleton, Oregon. May 29, 2002.
Johnson, G.D., W.P. Erickson, M.D. Strickland, M.F. Shepherd, and D.A. Shepherd. 2000a.
Avian Monitoring Studies at the Buffalo Ridge Wind Resource Area, Minnesota: Results of a 4-Year Study. Final report prepared for Northern States Power Company, Minneapolis, Minnesota, by Western EcoSystems Technology, Inc. (WEST), Cheyenne, Wyoming. September 22, 2000. 212 pp. http://www.west-inc.com
Johnson, G.D., W.P. Erickson, M.D. Strickland, M.F. Shepherd, D.A. Shepherd, and S.A.
Sarappo. 2002b. Collision Mortality of Local and Migrant Birds at a Large-Scale Wind-Power Development on Buffalo Ridge, Minnesota. Wildlife Society Bulletin 30(3): 879-887.
Johnson, G.D., W.P. Erickson, and J. White. 2003. Avian and Bat Mortality During the First
Year of Operation at the Klondike Phase I Wind Project, Sherman County, Oregon. March 2003. Technical report prepared for Northwestern Wind Power, Goldendale, Washington, by Western EcoSystems Technology, Inc. (WEST), Cheyenne, Wyoming. http://www.west-inc.com
Johnson, G.D., J. Jeffrey, J. Baker, and K. Bay. 2007. Baseline Avian Studies for the Windy
Flats Wind Energy Project, Klickitat County, Washington. Prepared for Windy Point Partners, LLC., by Western EcoSystems Technology, Inc. (WEST), Cheyenne, Wyoming. May 29, 2007.
Johnson, G.D., D.P. Young, W.P. Erickson, C.E. Derby, M.D. Strickland, and R.E. Good. 2000b.
Wildlife Monitoring Studies, SeaWest Windpower Plant, Carbon County, Wyoming, 1995-1999. Final report prepared for SeaWest Energy Corporation, San Diego, California, and the Bureau of Land Management, Rawlins, Wyoming, by Western EcoSystems Technology, Inc. (WEST), Cheyenne, Wyoming. August 9, 2000. http://www.west-inc.com and http://www.west-inc.com/reports/fcr_final_baseline.pdf
Kerlinger, P. 1997. A Study of Avian Fatalities at the Green Mountain Power Corporation’s
Searsburg, Vermont Windpower Facility - 1997. Prepared for Vermont Department of Public Service, Green Mountain Power Corporation, National Renewable Energy Laboratory and Vermont Environmental Research Associates. 12 pp.
Kerlinger, P. 2005. Summary of Bird Studies and Collision Rates at Wind Power Projects.
Rebuttal testimony of Paul Kerlinger for the East Haven Windfarm. February 9, 2005. http://easthavenwindfarm.com/filing/feb/ehwf-pk-reb1.pdf

Chokecherry-Sierra Madre Final Report
Western EcoSystems Technology, Inc. 19 FINAL – September 8, 2009
Kerlinger, P., L. Culp, and R. Curry. 2005. Post-Construction Avian Monitoring Study for the High Winds Wind Power Project, Solano County, California. Year One Report. Prepared for High Winds, LLC and FPL Energy.
Kerlinger, P., R. Curry, L. Culp, A. Jain, C. Wilkerson, B. Fischer, and A. Hasch. 2006. Post-
Construction Avian and Bat Fatality Monitoring for the High Winds Wind Power Project, Solano County, California: Two Year Report. Prepared for High Winds LLC, FPL Energy by Curry and Kerlinger, LLC. April 2006.
Kronner, K., B. Gritski, and S. Downes. 2008. Big Horn Wind Power Project Wildlife Fatality
Monitoring Study: 2006−2007. Final report prepared for PPM Energy and the Big Horn Wind Project Technical Advisory Committee by Northwest Wildlife Consultants, Inc. (NWC), Mid-Columbia Field Office, Goldendale, Washington. June 1, 2008.
Larsen, J.K. and J. Madsen. 2000. Effects of Wind Turbines and Other Physical Elements on
Field Utilization by Pink-Footed Geese (Anser brachyrhynchus): A Landscape Perspective. Landscape Ecology 15: 755-764.
Lawrence, E.S., S. Painter, and B. Little. 2007. Responses of Birds to the Windfarm at Blyth
Harbour, Northumberland, UK. In: Birds and Windfarms: Risk Assessment and Mitigation. M. J. de Lucas, G. F. E. Janss, and M. Ferrer, eds. Quercus, Madrid, Spain. Pp. 47-69.
Leddy, K.L. 1996. Effects of Wind Turbines on Nongame Birds in Conservation Reserve
Program Grasslands in Southwestern Minnesota. M.S. Thesis. South Dakota State University, Brookings. 61 pp.
Leddy, K.L., K.F. Higgins, and D.E. Naugle. 1999. Effects of Wind Turbines on Upland Nesting
Birds in Conservation Reserve Program Grasslands. Wilson Bulletin 111(1): 100-104. Mabey, S. and E. Paul. 2007. Impact of Wind Energy and Related Human Activities on
Grassland and Shrub-Steppe Birds. A Critical Literature Review Prepared for the National Wind Coordinating Committee (NWCC) and The Ornithological Council. 183 pp. http://www.nationalwind.org/pdf/IMPACTOFWINDENERGYANDRELATEDHUMANACTIVITIESONGRASSLANDANDSHRUB-STEPPEBIRDS.pdf
Madders, M. and D.P. Whitfield. 2006. Upland Raptors and the Assessment of Wind Farm
Impacts. Ibis 148: 43-56. Migratory Bird Treaty Act (MBTA). 1918. 16 United States Code § 703-712. July 13, 1918. National Research Council (NRC). 2007. Environmental Impacts of Wind-Energy Projects.
National Academies Press. Washington, D.C. www.nap.edu

Chokecherry-Sierra Madre Final Report
Western EcoSystems Technology, Inc. 20 FINAL – September 8, 2009
National Wind Coordinating Committee (NWCC). 2004. Wind Turbine Interactions with Birds and Bats: A Summary of Research Results and Remaining Questions. Fact Sheet. 2nd Edition. November 2004. http://www.nationalwind.org/publications/default.htm
Nicholson, C.P. 2003. Buffalo Mountain Windfarm Bird and Bat Mortality Monitoring Report:
October 2001 - September 2002. Tennessee Valley Authority, Knoxville, Tennessee. February 2003.
Northwest Wildlife Consultants, Inc. (NWC) and Western Ecosystems Technology, Inc.
(WEST). 2004. Ecological Baseline Studies for the Roosevelt Wind Project, Klickitat County, Washington. Final Report. Prepared by NWC, Pendleton, Oregon, and WEST, Inc., Cheyenne, Wyoming. September 2004.
Northwest Wildlife Consultants, Inc. (NWC) and Western Ecosystems Technology, Inc.
(WEST). 2005a. Ecological Baseline Studies and Wildlife Impact Assessment for the White Creek Wind Power Project, Klickitat County, Washington. Prepared for Last Mile Electric Cooperative, Goldendale, Washington, by Northwest Wildlife Consultants, Inc., Goldendale, Washington, and Western EcoSystems Technology, Inc. (WEST), Cheyenne, Wyoming. January 12, 2005.
Northwest Wildlife Consultants, Inc. (NWC) and Western Ecosystems Technology, Inc.
(WEST). 2005b. Wildlife Baseline Study for the Leaning Juniper Wind Power Project, Gilliam County, Oregon. Prepared for PPM Energy, Portland, Oregon and CH2M HILL, Portland, Oregon by NWC, Pendleton, Oregon, and WEST, Inc., Cheyenne, Wyoming. November 3, 2005.
Northwest Wildlife Consultants, Inc. (NWC) and Western EcoSystems Technology, Inc.
(WEST). 2007. Avian and Bat Monitoring Report for the Klondike II Wind Power Project. Sherman County, Oregon. Prepared for PPM Energy, Portland, Oregon. Managed and conducted by NWC, Pendleton, Oregon. Analysis conducted by WEST, Cheyenne, Wyoming. July 17, 2007.
Orloff, S. and A. Flannery. 1992. Wind Turbine Effects on Avian Activity, Habitat Use, and
Mortality in Altamont Pass and Solano County Wind Resource Areas, 1989-1991. Final Report P700-92-001 to Alameda, Contra Costa, and Solano Counties, and the California Energy Commission, Sacramento, California, by Biosystems Analysis, Inc., Tiburon, California. March 1992.
Pedersen, M.B. and E. Poulsen. 1991. Impact of a 90m/2mw Wind Turbine on Birds - Avian
Responses to the Implementation of the Tjaereborg Wind Turbine at the Danish Wadden Sea. Dansek Vildundersogelser 47: 1-44. Miljoministeriet & Danmarks Miljoundersogelser.
Reynolds, R.T., J.M. Scott, and R.A. Nussbaum. 1980. A Variable Circular-Plot Method for
Estimating Bird Numbers. Condor 82(3): 309-313.

Chokecherry-Sierra Madre Final Report
Western EcoSystems Technology, Inc. 21 FINAL – September 8, 2009
URS Corporation, Western EcoSystems Technology, Inc. (WEST), and Northwest Wildlife Consultants, Inc. (NWC). 2001. Avian Baseline Study for the Stateline Project. Prepared for FPL Energy Vansycle, LLC, Juno Beach, Florida.
US Fish and Wildlife Service (USFWS). 2003. Interim Guidelines to Avoid and Minimize
Wildlife Impacts from Wind Turbines. May 13, 2003. USFWS. Washington, D.C. http://www.fws.gov/habitatconservation/wind.pdf
US Fish and Wildlife Service (USFWS). 2004. Prairie Grouse Leks and Wind Turbines: US Fish
and Wildlife Service Justification for a 5-Mile Buffer from Leks; Additional Grassland Songbird Recommendations. An unpublished briefing paper.
US Geological Survey (USGS) National Land Cover Database (NLCD). 2001. Land Use/Land
Cover NLCD Data. USGS Headquarters, USGS National Center. Reston, Virginia. Usgaard, R.E., D.E. Naugle, R.G. Osborn, and K.F. Higgins. 1997. Effects of Wind Turbines on
Nesting Raptors at Buffalo Ridge in Southwestern Minnesota. Proceedings of the South Dakota Academy of Science 76: 113-117.
Walker, D., M. McGrady, A. McCluskie, M. Madders, and D.R.A. McLeod. 2005. Resident
Golden Eagle Ranging Behaviour Before and After Construction of a Windfarm in Argyll. Scottish Birds 25: 24-40. http://www.natural-research.org/projects/documents/SB25-EAGLESDOC.pdf
Western Ecosystems Technology, Inc. (WEST). 2005a. Ecological Baseline Study at the Elkhorn
Wind Power Project. Exhibit A. Final report prepared for Zilkha Renewable Energy, LLC., Portland, Oregon, by WEST, Cheyenne, Wyoming. June 2005.
Western EcoSystems Technology, Inc. (WEST). 2005b. Ecological Baseline Study for the
Proposed Reardon Wind Project, Lincoln County, Washington. Draft Final Report. Prepared for Energy Northwest, Richland, Washington, by Western EcoSystems Technology, Inc. (WEST), Cheyenne, Wyoming. June 2005.
Western EcoSystems Technology, Inc. (WEST). 2005c. Wildlife and Habitat Baseline Study for
the Proposed Biglow Canyon Wind Power Project, Sherman County, Oregon. March 2004 - August 2005. Prepared for Orion Energy LLC., Oakland, California. October, 2005. WEST. Cheyenne, Wyoming.
Western EcoSystems Technology, Inc. (WEST). 2006a. Diablo Winds Wildlife Monitoring
Progress Report, March 2005 - February 2006. Technical report submitted to FPL Energy and Alameda County California. WEST. Cheyenne, Wyoming.
Western EcoSystems Technology, Inc. (WEST). 2006b. Wildlife Baseline Study for the North
Valley County Wind Project: Summary of Results from 2006 Wildlife Surveys. Prepared for POWER Engineers, Boise, Idaho, and Wind Hunter, LLC., Grapevine, Texas. Prepared by Western EcoSystems Technology, Inc. (WEST), Bismarck, North Dakota. December 8, 2006.

Chokecherry-Sierra Madre Final Report
Western EcoSystems Technology, Inc. 22 FINAL – September 8, 2009
Western EcoSystems Technology, Inc. (WEST). 2007. Wildlife and Habitat Baseline Study for
the Vantage Wind Power Project, Kittitas County, Washington. Draft report prepared for Invenergy by Western EcoSystems Technology, Inc. (WEST), Cheyenne Wyoming and Walla Walla, Washington. June 2007.
Western EcoSystems Technology, Inc. (WEST) and Colorado Plateau Research Station (CPRS).
2006. Avian Studies for the Proposed Sunshine Wind Park, Coconino County, Arizona. Prepared for Sunshine Arizona Wind Energy, LLC., Flagstaff, Arizona, by WEST, Cheyenne, Wyoming, and the CPRS, Northern Arizona University, Flagstaff, Arizona. May 2006.
Western EcoSystems Technology, Inc. (WEST), EDAW, Inc., and Bloom Biological, Inc. 2007.
Baseline Avian Use and Risk Assessment for the Homestead Wind Energy Project, Kern County, California. 2005 – 2006. Prepared for Horizon Wind Energy by Western EcoSystems Technology, Inc. (WEST), EDAW, Inc., San Diego, California, and Bloom Biological, Inc., Santa Anna, California. April 19, 2007.
Whitfield, D.P. and M. Madders. 2006. A Review of the Impacts of Wind Farms on Hen Harriers
Circus cyaneus and an Estimation of Collision Avoidance Rates. Natural Research Information Note 1 (revised). Natural Research Ltd., Banchory, United Kingdom.
Winkelman, E. 1990. Impact of the Wind Park near Urk, Netherlands, on Birds: Bird Collision
Victims and Disturbance of Wintering Fowl. International Ornithological Congress 20: 402-403.
Woodward-Clyde International-Americas, (WCIA) and Western EcoSystems Technology, Inc.
(WEST). 1997. Avian Baseline Study for the Vansycle Ridge Project - Vansycle Ridge, Oregon and Wildlife Mortality Studies, Vansycle Wind Project, Washington. Prepared for Esi Vansycle Partners, L.P., North Palm Beach, Florida.
Wyoming Game and Fish Department (WGFD). 2005. Avian Species of Special Concern in
Wyoming. WGFD Nongame Species of Special Concern (SSC)-Native Status Species (NSS). January 2005. WGFD. Cheyenne, Wyoming. http://gf.state.wy.us/wildlife/nongame/SpeciesofSpecialConcern/index.asp
Wyoming Natural Diversity Database (WYNND). 2009. Codes and Definitions. Last updated
January 22, 2009. Homepage: http://uwadmnweb.uwyo.edu/wyndd/ Codes and Definitions: http://uwadmnweb.uwyo.edu/wyndd/infoprint.asp?p=2656
Young, D.P. Jr., W.P. Erickson, K. Bay, J. Jeffrey, E.G. Lack, R.E. Good, and H.H. Sawyer.
2003a. Baseline Avian Studies for the Proposed Hopkins Ridge Wind Project, Columbia County, Washington. Final Report, March 2002 - March 2003. Prepared for RES North America, LLC., Portland, Oregon, by Western EcoSystems Technology, Inc.(WEST), Cheyenne, Wyoming. April 30, 2003.

Chokecherry-Sierra Madre Final Report
Western EcoSystems Technology, Inc. 23 FINAL – September 8, 2009
Young, D.P. Jr., W.P. Erickson, K. Bay, J. Jeffrey, E.G. Lack, and H.H. Sawyer. 2003b. Baseline Avian Studies for the Proposed Desert Claim Wind Power Project, Kittitas County, Washington. Final Report. Prepared for Desert Claim Wind Power, LLC, Ellensburg, Washington, by Western EcoSystems Technology, Inc. (WEST), Cheyenne, Wyoming. July 2003.
Young, D.P. Jr., W.P. Erickson, J. Jeffrey, K. Bay, and M. Bourassa. 2005. Eurus Combine Hills
Turbine Ranch. Phase 1 Post Construction Wildlife Monitoring Final Report February 2004 February 2005. Technical report for Eurus Energy America Corporation and the Combine Hills Technical Advisory Committee, Umatilla County, Oregon. Prepared by Western EcoSystems Technology, Inc. (WEST), Cheyenne, Wyoming, and Northwest Wildlife Consultants, Inc. (NWC), Pendleton, Oregon.
Young, D.P. Jr., W.P. Erickson, J. Jeffrey, K. Bay, R.E. Good, and E.G. Lack. 2003c. Avian and
Sensitive Species Baseline Study Plan and Final Report. Eurus Combine Hills Turbine Ranch, Umatilla County, Oregon. Technical report prepared for Eurus Energy America Corporation, San Diego, California and Aeropower Services, Inc., Portland, Oregon, by Western EcoSystems Technology, Inc. (WEST), Cheyenne, Wyoming. March 10, 2003.
Young, D.P. Jr., W.P. Erickson, J. Jeffrey, and V.K. Poulton. 2007a. Puget Sound Energy,
Hopkins Ridge Wind Project Phase 1, Post-Construction Avian and Bat Monitoring, First Annual Report, January - December 2006. Technical report prepared by Western EcoSystems Technology, Inc. (WEST), Cheyenne, Wyoming, for Puget Sound Energy.
Young, D.P. Jr., G.D. Johnson, V.K. Poulton, and K. Bay. 2007b. Ecological Baseline Studies
for the Hatchet Ridge Wind Energy Project, Shasta County, California. Prepared for Hatchet Ridge Wind, LLC, Portland, Oregon by Western EcoSystems Technology, Inc. (WEST), Cheyenne, Wyoming. August 31, 2007. http://www.co.shasta.ca.us/Departments/Resourcemgmt/drm/Hatchet%20Ridge/DEIR/App_C-1.pdf
Young, D.P. Jr., V.K. Poulton, and K. Bay. 2007c. Ecological Baseline Studies Report. Proposed
Dry Lake Wind Project, Navajo County, Arizona. Prepared for PPM Energy, Portland, Oregon, by Western EcoSystems Technology, Inc. (WEST), Cheyenne, Wyoming. July 1, 2007.

Chokecherry-Sierra Madre Final Report
Western EcoSystems Technology, Inc. 24 FINAL – September 8, 2009
Table 1. The land cover types, coverage, and composition
within the Chokecherry-Sierra Madre Wind Resource Area.
Habitat Acres % Composition Scrub-Shrub 171,092.00 76.9 Grassland 42,948.20 19.3 Evergreen Forest 3,067.66 1.4 Deciduous Forest 1,607.75 0.7 Emergent Wetlands 1,222.09 0.6 Barren 948.87 0.4 Woody Wetlands 386.59 0.2 Developed, Open Space 385.12 0.2 Open Water 383.29 0.2 Pasture/Hay 332.81 0.2 Developed, Low Intensity 154.4 0.1 Mixed Forest 44.33 <0.1 Developed, Medium Intensity 25.25 <0.1 Developed, High Intensity 4.88 <0.1 Total 222,603.24 100 Data from the National Landcover Database (USGS NLCD 2001).

Chokecherry-Sierra Madre Final Report
Western EcoSystems Technology, Inc. 25 FINAL – September 8, 2009
Table 2. Summary of species richness (species/plota/20-min survey), and
sample size by season and overall during the fixed-point bird use surveys at the Chokecherry-Sierra Madre Wind Resource Area, June 26, 2008 – June 16, 2009.
Species Richness Season
Number of Visits
# Surveys Conducted
# Unique Species Large Birds Small Birds
Summer 9 142 32 0.60 2.05 Fall 9 142 25 0.81 0.43 Winter 3 31 6 0.40 0.02 Spring 10 118 36 0.61 1.62 Overall 31 433 50 0.63 1.19
a 800-m radius for large birds and 100-m radius for small birds.

Chokecherry-Sierra Madre Final Report
Western EcoSystems Technology, Inc. 26 FINAL – September 8, 2009
Table 3. Total number of individuals and groups for each bird type and speciesa, by season and overall, during the fixed-point bird use surveys at the Chokecherry-Sierra Madre Wind Resource Areaa , June 26, 2008 – June 16, 2009.
Summer Fall Winter Spring Total
Species/Type Scientific Name #
grps#
obs #
grps #
obs #
grps #
obs #
grps #
obs #
grps #
obs Waterbirds 0 0 0 0 0 0 2 16 2 16 American white pelican Pelecanus erythrorhyncos 0 0 0 0 0 0 1 14 1 14 great blue heron Ardea herodias 0 0 0 0 0 0 1 2 1 2 Shorebirds 0 0 0 0 0 0 1 1 1 1 killdeer Charadrius vociferus 0 0 0 0 0 0 1 1 1 1 Raptors 77 86 80 88 3 3 51 53 211 230 Accipiters 0 0 5 5 0 0 1 1 6 6 Cooper's hawk Accipiter cooperii 0 0 2 2 0 0 0 0 2 2 sharp-shinned hawk Accipter striatus 0 0 1 1 0 0 1 1 2 2 unidentified accipiter 0 0 2 2 0 0 0 0 2 2 Buteos 23 26 20 21 1 1 11 12 55 60 ferruginous hawk Buteo regalis 1 1 2 2 1 1 1 1 5 5 red-tailed hawk Buteo jamaicensis 14 16 6 6 0 0 7 8 27 30 rough-legged hawk Buteo lagopus 0 0 9 9 0 0 2 2 11 11 Swainson's hawk Buteo swainsoni 7 8 0 0 0 0 1 1 8 9 unidentified buteo 1 1 3 4 0 0 0 0 4 5 Northern Harrier 15 15 19 22 0 0 5 5 39 42 northern harrier Circus cyaneus 15 15 19 22 0 0 5 5 39 42 Eagles 17 19 33 37 2 2 13 14 65 72 bald eagle Haliaeetus leucocephalus 0 0 0 0 0 0 2 2 2 2 golden eagle Aquila chrysaetos 17 19 32 36 2 2 11 12 62 69 unidentified eagle 0 0 1 1 0 0 0 0 1 1 Falcons 22 26 3 3 0 0 20 20 45 49 American kestrel Falco sparverius 21 25 2 2 0 0 16 16 39 43 prairie falcon Falco mexicanus 1 1 1 1 0 0 4 4 6 6 Other Raptors 0 0 0 0 0 0 1 1 1 1 osprey Pandion haliaetus 0 0 0 0 0 0 1 1 1 1

Chokecherry-Sierra Madre Final Report
Western EcoSystems Technology, Inc. 27 FINAL – September 8, 2009
Table 3. Total number of individuals and groups for each bird type and speciesa, by season and overall, during the fixed-point bird use surveys at the Chokecherry-Sierra Madre Wind Resource Areaa , June 26, 2008 – June 16, 2009.
Summer Fall Winter Spring Total
Species/Type Scientific Name #
grps#
obs #
grps #
obs #
grps #
obs #
grps #
obs #
grps #
obs Vultures 0 0 1 1 0 0 1 1 2 2 turkey vulture Cathartes aura 0 0 1 1 0 0 1 1 2 2 Upland Gamebirds 0 0 1 2 3 24 2 2 6 28 greater sage grouse Centrocercus urophasianus 0 0 1 2 3 24 2 2 6 28 Doves/Pigeons 8 10 0 0 0 0 0 0 8 10 mourning dove Zenaida macroura 8 10 0 0 0 0 0 0 8 10 Large Corvids 14 65 62 105 9 15 30 60 115 245 American crow Corvus brachyrhynchos 4 49 0 0 0 0 2 16 6 65 black-billed magpie Pica pica 0 0 2 3 2 2 0 0 4 5 common raven Corvus corax 10 16 60 102 7 13 28 44 105 175 Passerines 467 600 95 255 2 4 379 588 943 1,447 American robin Turdus migratorius 1 1 0 0 0 0 0 0 1 1 barn swallow Hirundo rustica 0 0 0 0 0 0 2 2 2 2 Brewer's blackbird Euphagus cyanocephalus 8 9 0 0 0 0 2 26 10 35 Brewer's sparrow Spizella breweri 51 57 5 5 0 0 14 18 70 80 Clark's nutcracker Nucifraga columbiana 1 1 0 0 0 0 0 0 1 1 cliff swallow Petrochelidon pyrrhonota 0 0 0 0 0 0 1 1 1 1 grasshopper sparrow Ammodramus savannarum 0 0 0 0 0 0 4 4 4 4 green-tailed towhee Pipilo chlorurus 1 1 0 0 0 0 0 0 1 1 horned lark Eremophila alpestris 177 264 48 172 1 1 224 368 450 805 house wren Troglodytes aedon 8 13 3 3 0 0 0 0 11 16 lark bunting Calamospiza melanocorys 3 3 0 0 0 0 1 12 4 15 lark sparrow Chondestes grammacus 0 0 2 2 0 0 0 0 2 2 Lincoln's sparrow Melospiza lincolnii 0 0 0 0 0 0 2 2 2 2 loggerhead shrike Lanius ludovicianus 2 2 0 0 0 0 2 2 4 4 mountain bluebird Sialia currucoides 3 4 4 16 0 0 7 14 14 34 rock wren Salpinctes obsoletus 7 7 0 0 0 0 4 6 11 13 sage sparrow Amphispiza belli 7 7 0 0 0 0 48 52 55 59

Chokecherry-Sierra Madre Final Report
Western EcoSystems Technology, Inc. 28 FINAL – September 8, 2009
Table 3. Total number of individuals and groups for each bird type and speciesa, by season and overall, during the fixed-point bird use surveys at the Chokecherry-Sierra Madre Wind Resource Areaa , June 26, 2008 – June 16, 2009.
Summer Fall Winter Spring Total
Species/Type Scientific Name #
grps#
obs #
grps #
obs #
grps #
obs #
grps #
obs #
grps #
obs sage thrasher Oreoscoptes montanus 52 55 2 2 0 0 6 8 60 65 Say's phoebe Sayornis saya 1 1 0 0 0 0 1 1 2 2 song sparrow Melospiza melodia 0 0 2 3 0 0 0 0 2 3 Townsend's solitaire Myadestes townsendi 0 0 1 1 0 0 0 0 1 1 tree swallow Tachycineta bicolor 3 3 0 0 0 0 0 0 3 3 unidentified blackbird 0 0 1 4 0 0 0 0 1 4 unidentified passerine 28 43 16 30 1 3 1 6 46 82 unidentified sparrow 9 9 3 5 0 0 0 0 12 14 unidentified swallow 4 4 0 0 0 0 0 0 4 4 unidentified wren 2 2 0 0 0 0 0 0 2 2 vesper sparrow Pooecetes gramineus 65 79 3 4 0 0 32 38 100 121 western kingbird Tyrannus verticalis 1 1 1 1 0 0 0 0 2 2 western meadowlark Sturnella neglecta 33 34 4 7 0 0 28 28 65 69 Other Birds 10 22 0 0 0 0 3 4 13 26 common nighthawk Chordeiles minor 5 6 0 0 0 0 0 0 5 6 northern flicker Colaptes auratus 1 1 0 0 0 0 1 1 2 2 unidentified hummingbird 2 2 0 0 0 0 0 0 2 2 white-throated swift Aeronautes saxatalis 2 13 0 0 0 0 2 3 4 16 Overall 576 783 239 451 17 46 469 725 1,301 2,005
a Regardless of distance from observer.
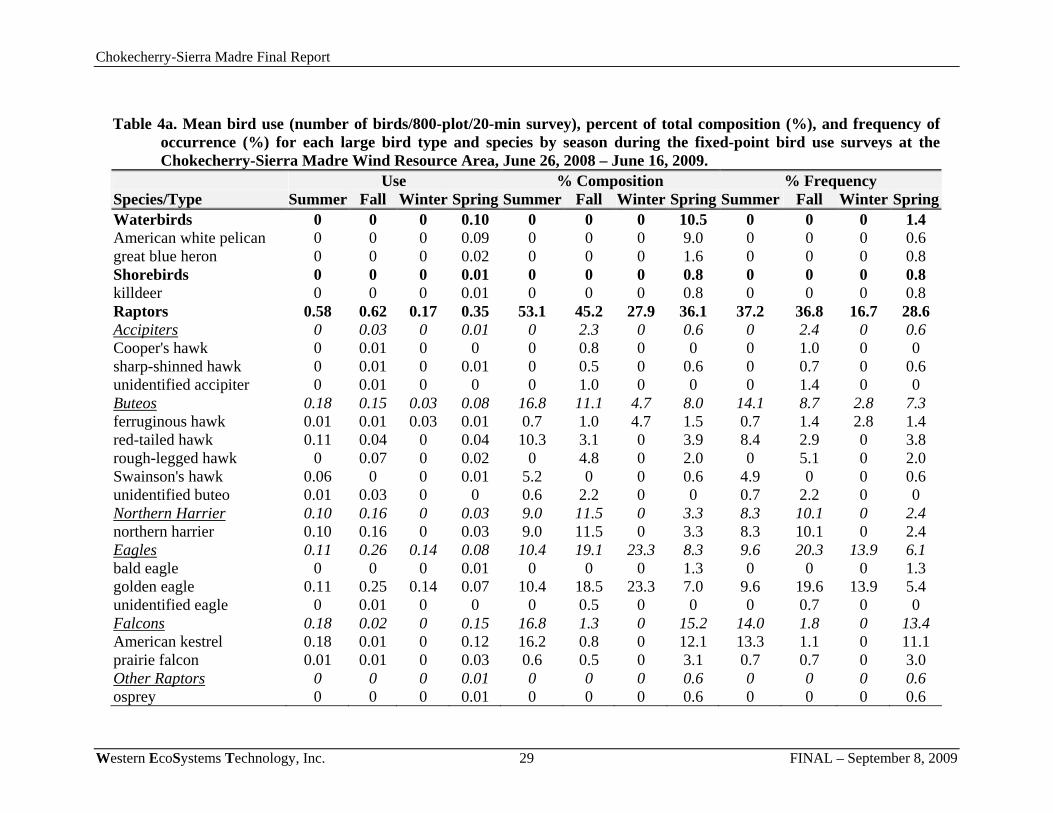
Chokecherry-Sierra Madre Final Report
Western EcoSystems Technology, Inc. 29 FINAL – September 8, 2009
Table 4a. Mean bird use (number of birds/800-plot/20-min survey), percent of total composition (%), and frequency of
occurrence (%) for each large bird type and species by season during the fixed-point bird use surveys at the Chokecherry-Sierra Madre Wind Resource Area, June 26, 2008 – June 16, 2009.
Use % Composition % Frequency Species/Type Summer Fall Winter Spring Summer Fall Winter Spring Summer Fall Winter SpringWaterbirds 0 0 0 0.10 0 0 0 10.5 0 0 0 1.4 American white pelican 0 0 0 0.09 0 0 0 9.0 0 0 0 0.6 great blue heron 0 0 0 0.02 0 0 0 1.6 0 0 0 0.8 Shorebirds 0 0 0 0.01 0 0 0 0.8 0 0 0 0.8 killdeer 0 0 0 0.01 0 0 0 0.8 0 0 0 0.8 Raptors 0.58 0.62 0.17 0.35 53.1 45.2 27.9 36.1 37.2 36.8 16.7 28.6 Accipiters 0 0.03 0 0.01 0 2.3 0 0.6 0 2.4 0 0.6 Cooper's hawk 0 0.01 0 0 0 0.8 0 0 0 1.0 0 0 sharp-shinned hawk 0 0.01 0 0.01 0 0.5 0 0.6 0 0.7 0 0.6 unidentified accipiter 0 0.01 0 0 0 1.0 0 0 0 1.4 0 0 Buteos 0.18 0.15 0.03 0.08 16.8 11.1 4.7 8.0 14.1 8.7 2.8 7.3 ferruginous hawk 0.01 0.01 0.03 0.01 0.7 1.0 4.7 1.5 0.7 1.4 2.8 1.4 red-tailed hawk 0.11 0.04 0 0.04 10.3 3.1 0 3.9 8.4 2.9 0 3.8 rough-legged hawk 0 0.07 0 0.02 0 4.8 0 2.0 0 5.1 0 2.0 Swainson's hawk 0.06 0 0 0.01 5.2 0 0 0.6 4.9 0 0 0.6 unidentified buteo 0.01 0.03 0 0 0.6 2.2 0 0 0.7 2.2 0 0 Northern Harrier 0.10 0.16 0 0.03 9.0 11.5 0 3.3 8.3 10.1 0 2.4 northern harrier 0.10 0.16 0 0.03 9.0 11.5 0 3.3 8.3 10.1 0 2.4 Eagles 0.11 0.26 0.14 0.08 10.4 19.1 23.3 8.3 9.6 20.3 13.9 6.1 bald eagle 0 0 0 0.01 0 0 0 1.3 0 0 0 1.3 golden eagle 0.11 0.25 0.14 0.07 10.4 18.5 23.3 7.0 9.6 19.6 13.9 5.4 unidentified eagle 0 0.01 0 0 0 0.5 0 0 0 0.7 0 0 Falcons 0.18 0.02 0 0.15 16.8 1.3 0 15.2 14.0 1.8 0 13.4 American kestrel 0.18 0.01 0 0.12 16.2 0.8 0 12.1 13.3 1.1 0 11.1 prairie falcon 0.01 0.01 0 0.03 0.6 0.5 0 3.1 0.7 0.7 0 3.0 Other Raptors 0 0 0 0.01 0 0 0 0.6 0 0 0 0.6 osprey 0 0 0 0.01 0 0 0 0.6 0 0 0 0.6

Chokecherry-Sierra Madre Final Report
Western EcoSystems Technology, Inc. 30 FINAL – September 8, 2009
Table 4a. Mean bird use (number of birds/800-plot/20-min survey), percent of total composition (%), and frequency of occurrence (%) for each large bird type and species by season during the fixed-point bird use surveys at the Chokecherry-Sierra Madre Wind Resource Area, June 26, 2008 – June 16, 2009.
Use % Composition % Frequency Species/Type Summer Fall Winter Spring Summer Fall Winter Spring Summer Fall Winter SpringVultures 0 0.01 0 0.01 0 0.5 0 0.8 0 0.7 0 0.8 turkey vulture 0 0.01 0 0.01 0 0.5 0 0.8 0 0.7 0 0.8 Upland Gamebirds 0 0.01 0.09 0.06 0 1.1 15.1 5.9 0 0.7 4.9 5.8 greater sage grouse 0 0.01 0.09 0.06 0 1.1 15.1 5.9 0 0.7 4.9 5.8 Doves/Pigeons 0.07 0 0 0 6.4 0 0 0 4.9 0 0 0 mourning dove 0.07 0 0 0 6.4 0 0 0 4.9 0 0 0 Large Corvids 0.44 0.73 0.34 0.45 40.5 53.2 57.0 45.9 7.7 29.7 16.0 20.5 black-billed magpie 0 0.02 0.05 0 0 1.7 8.1 0 0 1.5 4.9 0 common raven 0.10 0.71 0.29 0.34 9.1 51.5 48.8 35.1 5.7 29.0 13.9 19.1 American crow 0.34 0 0 0.11 31.4 0 0 10.8 2.1 0 0 1.4 Overall 1.08 1.37 0.60 0.98 100 100 100 100

Chokecherry-Sierra Madre Final Report
Western EcoSystems Technology, Inc. 31 FINAL – September 8, 2009
Table 4b. Mean use (number of birds/100-m plot/20-min survey), percent of total composition (%), and frequency of
occurrence (%) for each small bird type and species by season during the fixed-point bird use surveys at the Chokecherry-Sierra Madre Wind Resource Area, June 26, 2008 – June 16, 2009.
Use % Composition % Frequency Species/Type Summer Fall Winter Spring Summer Fall Winter Spring Summer Fall Winter SpringPasserines 4.04 1.57 0.02 4.97 96.8 100.0 100.0 99.5 83.4 29.4 2.1 89.2 American robin 0.01 0 0 0 0.2 0 0 0 0.7 0 0 0 barn swallow 0 0 0 0.02 0 0 0 0.3 0 0 0 1.6 Brewer's blackbird 0.06 0 0 0.14 1.4 0 0 2.7 4.3 0 0 1.1 Brewer's sparrow 0.39 0.03 0 0.12 9.4 1.8 0 2.4 24.1 1.7 0 7.6 Clark's nutcracker 0 0 0 0 0 0 0 0 0 0 0 0 cliff swallow 0 0 0 0.01 0 0 0 0.1 0 0 0 0.5 grasshopper sparrow 0 0 0 0.03 0 0 0 0.5 0 0 0 1.9 green-tailed towhee 0.01 0 0 0 0.2 0 0 0 0.7 0 0 0 horned lark 1.83 1.15 0.02 3.38 43.7 73.1 100.0 67.6 55.6 19.8 2.1 79.2 house wren 0.09 0.02 0 0 2.2 1.3 0 0 4.2 1.4 0 0 lark bunting 0.02 0 0 0.12 0.5 0 0 2.4 2.1 0 0 1.0 lark sparrow 0 0.01 0 0 0 0.9 0 0 0 0.7 0 0 Lincoln's sparrow 0 0 0 0.01 0 0 0 0.3 0 0 0 1.3 loggerhead shrike 0.01 0 0 0.01 0.2 0 0 0.3 0.7 0 0 0.6 mountain bluebird 0.01 0.11 0 0.19 0.4 6.7 0 3.8 1.5 2.5 0 9.4 rock wren 0.05 0 0 0.05 1.2 0 0 1.1 3.6 0 0 2.6 sage sparrow 0.05 0 0 0.37 1.2 0 0 7.5 4.4 0 0 20.6 sage thrasher 0.32 0.01 0 0.06 7.6 0.9 0 1.2 27.0 1.4 0 3.9 Say's phoebe 0.01 0 0 0.01 0.2 0 0 0.2 0.7 0 0 1.0 song sparrow 0 0.02 0 0 0 1.4 0 0 0 1.4 0 0 Townsend's solitaire 0 0.01 0 0 0 0.4 0 0 0 0.7 0 0 tree swallow 0.02 0 0 0 0.5 0 0 0 2.2 0 0 0 unidentified blackbird 0 0 0 0 0 0 0 0 0 0 0 0 unidentified passerine 0.29 0.10 0 0.03 6.8 6.3 0 0.6 14.8 6.4 0 0.5 unidentified sparrow 0.06 0.04 0 0 1.4 2.2 0 0 5.7 2.1 0 0 unidentified swallow 0.03 0 0 0 0.7 0 0 0 2.8 0 0 0

Chokecherry-Sierra Madre Final Report
Western EcoSystems Technology, Inc. 32 FINAL – September 8, 2009
Table 4b. Mean use (number of birds/100-m plot/20-min survey), percent of total composition (%), and frequency of occurrence (%) for each small bird type and species by season during the fixed-point bird use surveys at the Chokecherry-Sierra Madre Wind Resource Area, June 26, 2008 – June 16, 2009.
Use % Composition % Frequency Species/Type Summer Fall Winter Spring Summer Fall Winter Spring Summer Fall Winter Springunidentified wren 0.01 0 0 0 0.2 0 0 0 0.7 0 0 0 vesper sparrow 0.56 0.03 0 0.23 13.4 1.8 0 4.6 26.2 2.1 0 11.5 western kingbird 0.01 0 0 0 0.2 0 0 0 0.7 0 0 0 western meadowlark 0.23 0.05 0 0.19 5.4 3.2 0 3.9 17.5 2.2 0 15.4 Other Birds 0.13 0 0 0.03 3.2 0 0 0.5 4.4 0 0 2.0 common nighthawk 0.01 0 0 0 0.3 0 0 0 1.4 0 0 0 northern flicker 0.01 0 0 0.01 0.2 0 0 0.2 0.8 0 0 0.8 unidentified hummingbird 0.01 0 0 0 0.3 0 0 0 0.7 0 0 0 white-throated swift 0.10 0 0 0.02 2.3 0 0 0.4 1.5 0 0 1.3 Overall 4.18 1.57 0.02 5.00 100 100 100 100

Chokecherry-Sierra Madre Final Report
Western EcoSystems Technology, Inc. 33 FINAL – September 8, 2009
Table 5. Flight height characteristics by bird type during fixed-point bird use surveys at the
Chokecherry-Sierra Madre Wind Resource Area, June 26, 2008 – June 16, 2009. Large bird observations were limited to within 800 m and small birds were limited to within 100 m.
# Groups # Obs Mean Flight % Obs % within Flight Height CategoriesBird Type Flying Flying Height (m) Flying 0-35 m 35-130 m > 130 m Waterbirds 2 16 87.50 100 0 100 0 Shorebirds 1 1 10.00 100 100 0 0 Raptors 192 207 52.65 92.8 61.8 30.4 7.7 Accipiters 6 6 23.33 100 66.7 33.3 0 Buteos 51 55 51.39 94.8 50.9 43.6 5.5 Northern Harrier 37 40 12.97 97.6 90.0 10.0 0 Eagles 57 62 106.75 91.2 35.5 45.2 19.4 Falcons 40 43 19.05 87.8 86.0 11.6 2.3 Other Raptors 1 1 20.00 100 100 0 0 Vultures 2 2 27.50 100 50.0 50.0 0 Upland Gamebirds 4 6 2.25 75.0 100 0 0 Doves/Pigeons 4 5 4.25 50.0 100 0 0 Large Corvids 106 230 23.49 95.8 74.8 24.8 0.4 Large Birds Overall 311 467 41.36 93.4 67.0 29.3 3.6 Passerines 586 1,023 4.25 71.0 99.8 0.2 0 Other Birds 10 23 13.30 95.8 100 0 0 Small Birds Overall 596 1,046 4.40 71.4 99.8 0.2 0 ZOR: The likely “zone of risk” for potential collision with a turbine blade, or 35-130 m above ground level (AGL).

Chokecherry-Sierra Madre Final Report
Western EcoSystems Technology, Inc. 34 FINAL – September 8, 2009
Table 6a. Relative exposure index and flight characteristics by large bird species during the fixed-point bird
use surveys at the Chokecherry-Sierra Madre Wind Resource Area, June 26, 2008 – June 16, 2009.
Species # Groups
Flying Overall
Mean Use%
Flying
% Flying within ZOR based
on initial obs Exposure
Index
% Within ZOR at anytime
common raven 98 0.35 95.9 27.6 0.09 42.9 golden eagle 55 0.14 92.3 45.0 0.06 68.3 American crow 5 0.14 98.5 18.8 0.03 18.8 American white pelican 1 0.02 100 100 0.02 100 red-tailed hawk 25 0.06 96.4 29.6 0.02 55.6 rough-legged hawk 11 0.02 100 72.7 0.02 100 Swainson's hawk 8 0.02 100 66.7 0.01 88.9 northern harrier 37 0.08 97.6 10.0 0.01 22.5 American kestrel 34 0.09 86.0 8.1 0.01 16.2 great blue heron 1 <0.01 100 100 <0.01 100 prairie falcon 6 0.01 100 33.3 <0.01 66.7 unidentified accipiter 2 <0.01 100 100 <0.01 100 ferruginous hawk 5 0.01 100 20.0 <0.01 20.0 unidentified buteo 2 0.01 60.0 33.3 <0.01 100 turkey vulture 2 <0.01 100 50.0 <0.01 50.0 bald eagle 2 <0.01 100 50.0 <0.01 50.0 greater sage grouse 4 0.03 75.0 0 0 0 mourning dove 4 0.02 50.0 0 0 0 black-billed magpie 3 0.01 60.0 0 0 0 sharp-shinned hawk 2 <0.01 100 0 0 0 Cooper's hawk 2 <0.01 100 0 0 0 killdeer 1 <0.01 100 0 0 0 unidentified eagle 0 <0.01 0 0 0 0 osprey 1 <0.01 100 0 0 100 ZOR: The likely “zone of risk” for potential collision with a turbine blade, or 35-130 m above ground level (AGL).

Chokecherry-Sierra Madre Final Report
Western EcoSystems Technology, Inc. 35 FINAL – September 8, 2009
Table 6b. Relative exposure index and flight characteristics for small birds during the fixed-point bird use
surveys at the Chokecherry-Sierra Madre Wind Resource Area, June 26, 2008 – June 16, 2009.
Species # Groups
Flying Overall
Mean Use%
Flying
% Flying within ZOR based
on initial obs Exposure
Index
% Within ZOR at anytime
horned lark 381 1.78 89.1 0.1 <0.01 1.3 unidentified passerine 38 0.12 87.8 1.4 <0.01 1.4 vesper sparrow 39 0.25 38.8 0 0 2.1 Brewer's sparrow 39 0.16 55.0 0 0 0 western meadowlark 8 0.14 13.0 0 0 0 sage thrasher 10 0.12 15.4 0 0 0 sage sparrow 12 0.12 23.7 0 0 0 mountain bluebird 10 0.08 55.9 0 0 0 Brewer's blackbird 10 0.05 100 0 0 0 lark bunting 3 0.04 93.3 0 0 0 white-throated swift 4 0.04 100 0 0 87.5 house wren 2 0.03 31.3 0 0 0 rock wren 3 0.03 30.8 0 0 0 unidentified sparrow 11 0.03 92.9 0 0 0 unidentified swallow 4 0.01 100 0 0 25.0 tree swallow 3 0.01 100 0 0 0 grasshopper sparrow 0 0.01 0 0 0 0 song sparrow 1 0.01 33.3 0 0 0 loggerhead shrike 3 0.01 100 0 0 0 Say's phoebe 2 <0.01 100 0 0 0 northern flicker 1 <0.01 50.0 0 0 0 common nighthawk 3 <0.01 100 0 0 50.0 unidentified hummingbird 2 <0.01 100 0 0 0 barn swallow 2 <0.01 100 0 0 0 lark sparrow 1 <0.01 50.0 0 0 0 Lincoln's sparrow 1 <0.01 50.0 0 0 0 American robin 1 <0.01 100 0 0 0

Chokecherry-Sierra Madre Final Report
Western EcoSystems Technology, Inc. 36 FINAL – September 8, 2009
Table 6b. Relative exposure index and flight characteristics for small birds during the fixed-point bird use surveys at the Chokecherry-Sierra Madre Wind Resource Area, June 26, 2008 – June 16, 2009.
Species # Groups
Flying Overall
Mean Use%
Flying
% Flying within ZOR based
on initial obs Exposure
Index
% Within ZOR at anytime
green-tailed towhee 0 <0.01 0 0 0 0 unidentified wren 0 <0.01 0 0 0 0 western kingbird 1 <0.01 50.0 0 0 0 Townsend's solitaire 0 <0.01 0 0 0 0 cliff swallow 1 <0.01 100 0 0 100 ZOR: The likely “zone of risk” for potential collision with a turbine blade, or 114-427 ft (35-130 m) above ground level (AGL).

Chokecherry-Sierra Madre Final Report
Western EcoSystems Technology, Inc. 37 FINAL – September 8, 2009
Table 7. Summary of sensitive species observed at the Chokecherry-Sierra Madre Wind Resource Area during
fixed-point bird use surveys (FP) and as incidental wildlife observations (Inc.), June 26, 2008 – June 16, 2009.
FP Inc. Total
Species Scientific Name Status # of grps
# of obs
# ofgrps
# ofobs
# of grps
# ofobs
greater sage-grouse Centrocercus urophasianus NSS2, P 6 28 29 123 35 151 Brewer's sparrow Spizella breweri NSS4 70 80 0 0 70 80 sage thrasher Oreoscoptes montanus NSS4 60 65 0 0 60 65 sage sparrow Amphispiza belli NSS4 55 59 0 0 55 59 Swainson's hawk Buteo swainsoni NSS4 8 9 7 10 15 19 lark bunting Calamospiza melanocorys NSS4 4 15 0 0 4 15 ferruginous hawk Buteo regalis NSS3 5 5 8 8 13 13 bald eagle Haliaeetus leucocephalus NSS2 2 2 4 4 6 6 grasshopper sparrow Ammodramus savannarum NSS4 4 4 0 0 4 4 great blue heron Ardea herodias NSS4 1 2 0 0 1 2 burrowing owl Athene cunicularia NSS4 0 0 1 1 1 1 Bird Subtotal 11 species 215 269 49 146 293 538 white-tailed prairie dog Cynomys leucurus NSS4 0 0 1 5 1 5 Total 12 species 215 269 50 151 294 543 P= petitioned for Federal listing. NSS1= Populations greatly restricted or declining, extirpation possible OR ongoing significant loss of habitat. NSS2= Populations declining, extirpation possible; habitat restricted or vulnerable but no recent or ongoing significant loss; species likely sensitive to human
disturbance OR populations declining or restricted in numbers or distribution, extirpation not imminent; ongoing significant loss of habitat. NSS3= Populations greatly restricted or declining, extirpation possible; habitat not restricted, vulnerable but no loss; species not sensitive to human
disturbance OR populations declining or restricted in numbers or distribution, extirpation not imminent; habitat restricted or vulnerable but no recent or ongoing significant loss; species likely sensitive to human disturbance OR species widely distributed; population status or trends unknown but suspected to be stable; on-going significant loss of habitat.
NSS4= Populations greatly restricted or declining, extirpation possible; habitat stable and not restricted OR populations declining or restricted in numbers or distribution, extirpation not imminent; habitat not restricted, vulnerable but no loss; species not sensitive to human disturbance OR species widely distributed, population status or trends unknown but suspected to be stable; habitat restricted or vulnerable but no recent or on-going significant loss; species likely sensitive to human disturbance OR populations stable or increasing and not restricted in numbers or distribution; on-going significant loss of habitat
(From Wyoming Game and Fish Department [WGFD 2005] and Wyoming’s Natural Diversity Database [WYNDD 2009]).

Chokecherry-Sierra Madre Final Report
Western EcoSystems Technology, Inc. 38 FINAL – September 8, 2009
Table 8. Incidental wildlife observed while conducting all surveys at the Chokecherry-
Sierra Madre Wind Resource Area, June 26, 2008 – June 16, 2009. Species Scientific Name #grps # obs American goldfinch Carduelis tristis 1 1 bald eagle Haliaeetus leucocephalus 4 4 burrowing owl Athene cunicularia 1 1 ferruginous hawk Buteo regalis 8 8 golden eagle Aquila chrysaetos 44 52 greater sage-grouse Centrocercus urophasianus 29 123 northern harrier Circus cyaneus 34 38 prairie falcon Falco mexicanus 8 8 red-tailed hawk Buteo jamaicensis 14 18 rough-legged hawk Buteo lagopus 6 6 snow bunting Plectrophenax nivalis 1 1 Swainson's hawk Buteo swainsoni 7 10 Bird Subtotal 12 species 157 270 elk Cervus elephus 14 189 white-tailed prairie dog Cynomys leucurus 1 5 mule deer Odocoileus hemionus 4 10 pronghorn Antilocapra americana 285 2,879 Mammal Subtotal 4 species 304 3,083

Chokecherry-Sierra Madre Final Report
Western EcoSystems Technology, Inc. 39 FINAL– September 8, 2009
Figure 1. Location of the Chokecherry-Sierra Madre Wind Resource Areas.

Chokecherry-Sierra Madre Final Report
Western EcoSystems Technology, Inc. 40 FINAL– September 8, 2009
Figure 2. Elevation and topography of the Chokecherry-Sierra Madre Wind Resource Areas.

Chokecherry-Sierra Madre Final Report
Western EcoSystems Technology, Inc. 41 FINAL– September 8, 2009
Figure 3. The land cover types and coverage within the Chokecherry-Sierra Madre Wind Resource Areas (USGS NLCD 2001).

Chokecherry-Sierra Madre Final Report
Western EcoSystems Technology, Inc. 42 FINAL– September 8, 2009
Figure 4. Fixed-point bird use survey points at the Chokecherry-Sierra Madre Wind Resource Areas.

Chokecherry-Sierra Madre Final Report
Western EcoSystems Technology, Inc. 43 FINAL – September 8, 2009
0.630.32
0.931.89
0.890.59
1.26
0.670.93
1.17 1.43
3.18
0.81 0.951.00
2.55
0.33
1.83
0.50
0
2
4
6
8
10
1 2 3 4 5 6 7 8 9 10 11 12 13 14 15 16 17 18 19
Mea
n us
e
Point
All Large Birds
0.070 0 0 0 0 0 0 0 0 0 0 0 0 0
0.67
0 0 00
1
2
3
1 2 3 4 5 6 7 8 9 10 11 12 13 14 15 16 17 18 19
Mea
n us
e
Point
Waterbirds
Figure 5. Mean use (number of birds/20-min survey) at each fixed-point bird use survey point for all birds and major bird types at the Chokecherry-Sierra Madre Wind Resource Area.

Chokecherry-Sierra Madre Final Report
Western EcoSystems Technology, Inc. 44 FINAL – September 8, 2009
0 0 0 0 0 0 0 0 0 0 0 0 0 0 0 00.17
0 00
1
2
3
1 2 3 4 5 6 7 8 9 10 11 12 13 14 15 16 17 18 19
Mea
n us
e
Point
Shorebirds
0.10 0.140.36
0.93
0.56
0.24
0.78
0.520.38
0.730.78
0.68 0.57 0.48 0.450.69
0.17
0.83
0.33
0
1
2
3
1 2 3 4 5 6 7 8 9 10 11 12 13 14 15 16 17 18 19
Mea
n us
e
Point
Raptors
Figure 5 (continued). Mean use (number of birds/20-min survey) at each fixed-point bird use survey point for all birds and major bird types at the Chokecherry-Sierra Madre Wind Resource Area.

Chokecherry-Sierra Madre Final Report
Western EcoSystems Technology, Inc. 45 FINAL – September 8, 2009
0 0 0 0 0 0 0 0 0 00.09
0.05 00.13
0 0 0 0 00
1
2
3
1 2 3 4 5 6 7 8 9 10 11 12 13 14 15 16 17 18 19
Mea
n us
e
Point
Accipiters
0.070.04 0.040.25
0.07 0.030.26
0.07 0.10 0.130.26
0.320.24
0 0.090.33
0.170 0
0
1
2
3
1 2 3 4 5 6 7 8 9 10 11 12 13 14 15 16 17 18 19
Mea
n us
e
Point
Buteos
Figure 5 (continued). Mean use (number of birds/20-min survey) at each fixed-point bird use survey point for all birds and major bird types at the Chokecherry-Sierra Madre Wind Resource Area.

Chokecherry-Sierra Madre Final Report
Western EcoSystems Technology, Inc. 46 FINAL – September 8, 2009
0 0.070.21 0.18 0.11 0.10
0.33
0 0.100.20 0.26
0.09
0.330.23
0.320.14 0 0 0
0
1
2
3
1 2 3 4 5 6 7 8 9 10 11 12 13 14 15 16 17 18 19
Mea
n us
e
Point
Eagles
0 0 0.07
0.36
0.220.07
0.11 0.11 0.140.23
0.040.09 0 0 0.05
0.170
0.33 0.33
0
1
2
3
1 2 3 4 5 6 7 8 9 10 11 12 13 14 15 16 17 18 19
Mea
n us
e
Point
Falcons
Figure 5 (continued). Mean use (number of birds/20-min survey) at each fixed-point bird use survey point for all birds and major bird types at the Chokecherry-Sierra Madre Wind Resource Area.
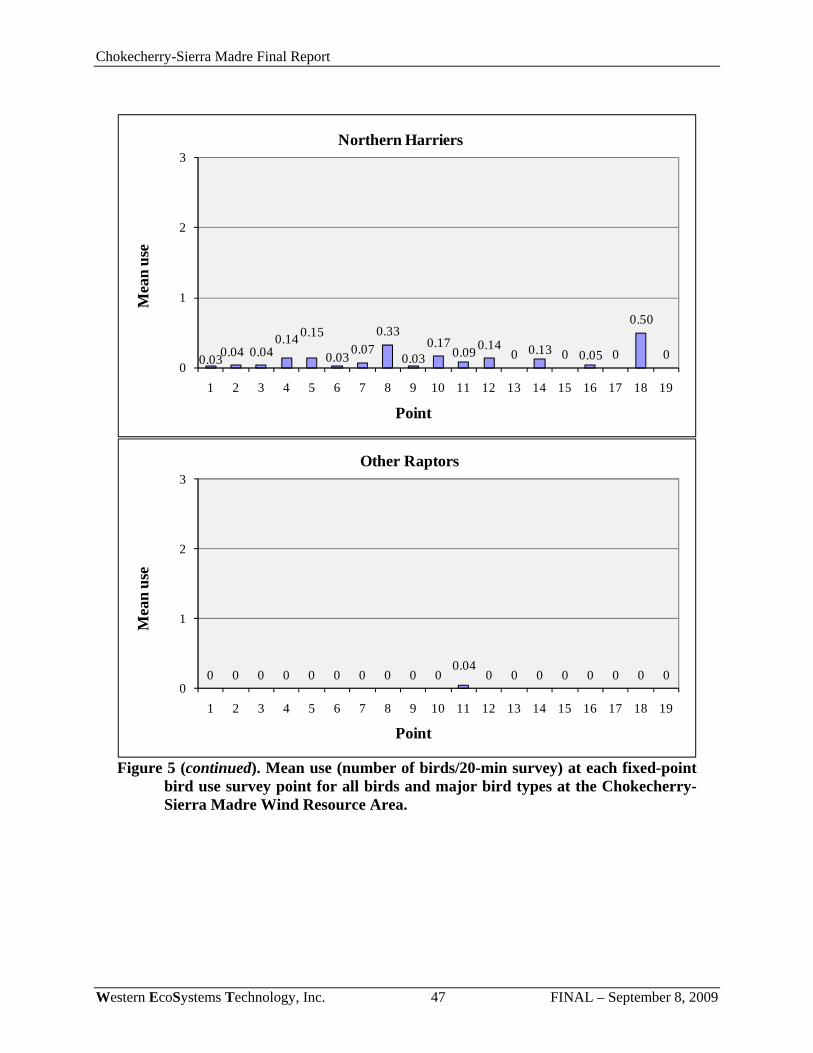
Chokecherry-Sierra Madre Final Report
Western EcoSystems Technology, Inc. 47 FINAL – September 8, 2009
0.030.04 0.040.14 0.15
0.03 0.070.33
0.030.17
0.09 0.140 0.13 0 0.05 0
0.50
00
1
2
3
1 2 3 4 5 6 7 8 9 10 11 12 13 14 15 16 17 18 19
Mea
n us
e
Point
Northern Harriers
0 0 0 0 0 0 0 0 0 00.04
0 0 0 0 0 0 0 00
1
2
3
1 2 3 4 5 6 7 8 9 10 11 12 13 14 15 16 17 18 19
Mea
n us
e
Point
Other Raptors
Figure 5 (continued). Mean use (number of birds/20-min survey) at each fixed-point bird use survey point for all birds and major bird types at the Chokecherry-Sierra Madre Wind Resource Area.

Chokecherry-Sierra Madre Final Report
Western EcoSystems Technology, Inc. 48 FINAL – September 8, 2009
0 0 0 0 00.03
0 0 0 00.04
0 0 0 0 0 0 0 00
1
2
3
1 2 3 4 5 6 7 8 9 10 11 12 13 14 15 16 17 18 19
Mea
n us
e
Point
Vultures
0 0 0 0 0 0 0 0.040.07
00.09
00.14
0 0 0 0 0 00
1
2
3
1 2 3 4 5 6 7 8 9 10 11 12 13 14 15 16 17 18 19
Mea
n us
e
Point
Upland Gamebirds
Figure 5 (continued). Mean use (number of birds/20-min survey) at each fixed-point bird use survey point for all birds and major bird types at the Chokecherry-Sierra Madre Wind Resource Area.

Chokecherry-Sierra Madre Final Report
Western EcoSystems Technology, Inc. 49 FINAL – September 8, 2009
0.030.040 0.04
0.11
0 0 0.04 0 0 0 0 0 0 00.14
0 0 00
1
2
3
1 2 3 4 5 6 7 8 9 10 11 12 13 14 15 16 17 18 19
Mea
n us
e
Point
Doves/Pigeons
0.430.14
0.57
0.93
0.220.3
0.48
0.07
0.48 0.430.52
2.50
0.10
0.480.55
1.05
0
1.00
0.170
1
2
3
1 2 3 4 5 6 7 8 9 10 11 12 13 14 15 16 17 18 19
Mea
n us
e
Point
Large Corvids
Figure 5 (continued). Mean use (number of birds/20-min survey) at each fixed-point
bird use survey point for all birds and major bird types at the Chokecherry-Sierra Madre Wind Resource Area.

Chokecherry-Sierra Madre Final Report
Western EcoSystems Technology, Inc. 50 FINAL – September 8, 2009
4.704.00
3.963.14
2.37
4.66
1.89
2.67
1.83 1.97
3.223.14
5.10
4.40
2.551.81
3.83
2.17
4.00
0
2
4
6
8
10
1 2 3 4 5 6 7 8 9 10 11 12 13 14 15 16 17 18 19
Mea
n us
e
Point
Passerines
0.030.07
0.04
0.50
0 0 0 0 0 0 0 0 0 0 0.090.05 0
0.170
0
1
2
3
1 2 3 4 5 6 7 8 9 10 11 12 13 14 15 16 17 18 19
Mea
n us
e
Point
Other Birds
Figure 5 (continued). Mean use (number of birds/20-min survey) at each fixed-point bird use survey point for all birds and major bird types at the Chokecherry-Sierra Madre Wind Resource Area. Passerine and other bird observations were focused within 100-m viewsheds.

Chokecherry-Sierra Madre Final Report
Western EcoSystems Technology, Inc. 51 FINAL – September 8, 2009
Figure 6a. Flight paths of waterbirds at the Chokecherry-Sierra Madre Wind Resource Area.

Chokecherry-Sierra Madre Final Report
Western EcoSystems Technology, Inc. 52 FINAL – September 8, 2009
Figure 6b. Flight paths of accipiters at the Chokecherry-Sierra Madre Wind Resource Area.

Chokecherry-Sierra Madre Final Report
Western EcoSystems Technology, Inc. 53 FINAL – September 8, 2009
Figure 6c. Flight paths of buteos at the Chokecherry-Sierra Madre Wind Resource Area.

Chokecherry-Sierra Madre Final Report
Western EcoSystems Technology, Inc. 54 FINAL – September 8, 2009
Figure 6d. Flight paths of falcons at the Chokecherry-Sierra Madre Wind Resource Area.

Chokecherry-Sierra Madre Final Report
Western EcoSystems Technology, Inc. 55 FINAL – September 8, 2009
Figure 6e. Flight paths of eagles, northern harriers, and other raptors at the Chokecherry-Sierra Madre Wind Resource Area.

Chokecherry-Sierra Madre Final Report
Western EcoSystems Technology, Inc. 56 FINAL – September 8, 2009
Figure 6f. Flight paths of vultures at the Chokecherry-Sierra Madre Wind Resource Area.

Chokecherry-Sierra Madre Final Report
Western EcoSystems Technology, Inc. 57 FINAL – September 8, 2009
0.000.250.500.751.001.251.501.752.002.252.50
Mea
n us
e (#
bird
s/pl
ot/2
0-m
in su
rvey
)
Wind-Energy Facility
Raptors
Figure 9. Comparison of annual raptor use between the Chokecherry-Sierra Madre Wind Resource Area and other US wind-
energy facilities. Data from the following sources: Chokecherry-Sierra Madre, WY This study. High Winds, CA Kerlinger et al. 2005 Stateline Reference URS et al. 2001 Maiden, WA Erickson et al. 2002b Diablo Winds, CA WEST 2006a Buffalo Ridge, MN Erickson et al. 2002b Hatchet Ridge, CA Young et al. 2007b Altamont Pass, CA Erickson et al. 2002b White Creek, WA NWC and WEST 2005a Biglow Canyon, OR WEST 2005c Elkhorn, OR WEST 2005a Foote Creek Rim, WY Erickson et al. 2002b Wild Horse, WA Erickson et al. 2003a Cotterel Mtn., ID Cooper et al. 2004 Roosevelt, WA NWC and WEST 2004 Biglow Reference, OR WEST 2005c Swauk Ridge, WA Erickson et al. 2003b Leaning Juniper, OR NWC and WEST 2005b Simpson Ridge, WY Johnson et al. 2000b Golden Hills, OR Jeffrey et al. 2008 Klondike, OR Johnson et al. 2002a Invenergy_Vantage, WA WEST 2007 Windy Flats, WA Johnson et al. 2007 Stateline, WA/OR Erickson et al. 2002b North Valley, MT WEST 2006b Combine Hills, OR Young et al. 2003c Condon, OR Erickson et al. 2002b Tehachapi Pass, CA Erickson et al. 2002b Desert Claim, WA Young et al. 2003b Zintel Canyon, WA Erickson et al. 2002a Sunshine, AZ WEST and the CPRS 2006 Hopkin's Ridge, WA Young et al. 2003a Homestead, CA WEST et al. 2007 Dry Lake, AZ Young et al. 2007c Reardon, WA WEST 2005b Nine Canyon, WA Erickson et al. 2001b San Gorgonio, CA Erickson et al. 2002b

Chokecherry-Sierra Madre Final Report
Western EcoSystems Technology, Inc. 58 FINAL– September 8, 2009
Overall Raptor Use 0.46 Predicted Fatality Rate 0.04 fatalities/MW/year
90.0% Prediction Interval (0, 0.30 fatalities/MW/year) Figure 10. Regression analysis comparing raptor use estimates versus estimated raptor
mortality. Data from the following sources:
Study and Location Raptor Use
(birds/plot /20-min survey) Source Raptor Mortality
(fatalities/MW/yr) Source Buffalo Ridge, MN 0.64 Erickson et al. 2002b 0.02 Erickson et al. 2002b Combine Hills, OR 0.75 Young et al. 2003c 0.00 Young et al. 2005 Diablo Winds, CA 2.161 WEST 2006a 0.87 WEST 2006a Foote Creek Rim, WY 0.55 Erickson et al. 2002b 0.04 Erickson et al. 2002b High Winds, CA 2.34 Kerlinger et al. 2005 0.39 Kerlinger et al. 2006 Hopkins Ridge, WA 0.70 Young et al. 2003a 0.14 Young et al. 2007a Klondike II, OR 0.50 Johnson 2004 0.11 NWC and WEST 2007 Klondike, OR 0.50 Johnson et al. 2002a 0.00 Johnson et al. 2003 Stateline, WA/OR 0.48 Erickson et al. 2002b 0.09 Erickson et al. 2002b Vansycle, OR 0.66 WCIA and WEST 1997 0.00 Erickson et al. 2002b Wild Horse, WA 0.29 Erickson et al. 2003a 0.09 Erickson et al. 2008 Zintel, WA 0.43 Erickson et al. 2002a 0.05 Erickson et al. 2002b Bighorn, WA 0.51 Johnson and Erickson 2004 0.15 Kronner et al. 2008

August 20 through November 9, 2012, Eagle Summary Report
Chokecherry and Sierra Madre Wind Energy Project
Prepared for:
Power Company of Wyoming, LLC 555 17th Street, Suite 2400 Denver, Colorado 80202
Prepared by:
SWCA Environmental Consultants 295 Interlocken Blvd., Suite 300
Broomfield, Colorado 80021 (303) 487-1183 / Fax (303) 487-1245
May 2013

This page intentionally left blank

August 20 through November 9, 2012, Eagle Summary Report Chokecherry and Sierra Madre Wind Energy Project
ii SWCA
EXECUTIVE SUMMARY
Between August 20 and November 9, 2012, SWCA Environmental Consultants performed raptor count surveys as part of Power Company of Wyoming, LLC’s (PCW’s) ongoing avian survey program at the Chokecherry and Sierra Madre Wind Energy Project (Project) site. This survey period captures late summer use, fall migration, and early winter use. This report documents use during these eagle use periods.
For this survey period, 64 minutes of golden eagle (Aquila chrysaetos) use were recorded within the Project site during 29,176 survey minutes (486.27 hours) for 0.0022 flight minute per minute of survey. Of the recorded eagle flight minutes, 71.9% were outside the Rotor Swept Zone (RSZ). By altitudinal classification, 23.4% of the golden eagle flight minutes were below the RSZ (0 to 30 meters above ground), 28.1% of the golden eagle flight minutes were within the RSZ (30 to 150 meters), and 48.5% of the golden eagle flight minutes were above the RSZ (above 150 meters).
With respect to bald eagle (Haliaeetus leucocephalus), 2 minutes of use were recorded during 29,176 survey minutes for 0.00007 flight minute per minute of survey. Both of these flight minutes (100%) were recorded between 0 and 30 meters and therefore were below the RSZ.
For the Chokecherry Wind Development Area (WDA), 20 minutes of golden eagle use were recorded during 13,816 survey minutes (230.27 hours) for 0.0015 flight minute per minute of survey. In total, 114 survey sessions were conducted during which eight golden eagle observations were recorded during seven of the sessions. Individual observation times ranged between 1 minute and 6 minutes, rounded up to the nearest whole minute. Of the recorded use in the Chokecherry WDA, 80% occurred outside the RSZ. No bald eagles were recorded in the Chokecherry WDA.
For the Sierra Madre WDA, 44 minutes of golden eagle use and 2 minutes bald eagle use were recorded during 15,360 survey minutes (256 hours) for 0.0029 flight minute per minute of survey and 0.0001 flight minute per minute of survey, respectively. In total, 126 survey sessions were conducted during which 16 golden eagle observations were recorded during 13 of the sessions1, and one bald eagle observation was recorded during one session. Individual observation times ranged between 1 minute and 7 minutes, rounded up to the nearest whole minute. Of the recorded use in the Sierra Madre WDA, 68.2% of golden eagle use and 100% of bald eagle occurred outside the RSZ.
1 Two observations at SCR1 were likely of the same golden eagle as the observations were made within 17
minutes of each other and in the same general location, and two observations at MH1 were possibly of the same golden eagle as the observations were made during the same session within 54 minutes of each other.

August 20 through November 9, 2012, Eagle Summary Report Chokecherry and Sierra Madre Wind Energy Project
iii SWCA
TABLE OF CONTENTS
Page EXECUTIVE SUMMARY ........................................................................................................ ii INTRODUCTION AND PROJECT DESCRIPTION ............................................................... 1 RESULTS AND DISCUSSION ................................................................................................ 4
Discussion of Chokecherry Use Observations ....................................................................... 5 Discussion of Sierra Madre Use Observations ....................................................................... 6
COMPARISON TO PREVIOUS SURVEY RESULTS ........................................................... 7
LIST OF FIGURES
Figure Page 1 Minimum Convex Polygons, 800-meter raptor count locations and survey perimeters
for Chokecherry. .................................................................................................................. 2 2 Minimum Convex Polygons, 800-meter raptor count locations and survey perimeters
for Sierra Madre. .................................................................................................................. 3
LIST OF TABLES
Table Page 1 Number of Survey Minutes, Days, Individuals, Golden Eagle Flight Minutes, and
Height Categories for all Survey Locations in the Chokecherry WDA. ............................. 9 2 Number of Survey Minutes, Days, Individuals, Golden Eagle Flight Minutes, and
Height Categories for all Survey Locations in the Sierra Madre WDA. ........................... 10 3 Summary of Golden Eagle Observations in the Chokecherry WDA. ............................... 11 4 Summary of Golden Eagle Observations in the Sierra Madre WDA. ............................... 12
Appendices
Appendix A: August 20-November 9, 2012, 800-meter Raptor Survey Protocols

August 20 through November 9, 2012, Eagle Summary Report Chokecherry and Sierra Madre Wind Energy Project
1 SWCA
INTRODUCTION AND PROJECT DESCRIPTION
Surveys described in this report are part of the avian survey program directed towards identifying eagle and raptor use across the Chokecherry and Sierra Madre Wind Energy Project (Project) site. The survey data will be used for modeling eagle collision risk and developing avoidance measures and Best Management Practices to reduce potential Project impacts to eagles, to the extent practicable. All protocols and survey methodologies used to assess avian species in the Project site during surveys in 2011 and 2012 were developed in consultation with the U.S. Fish and Wildlife Service (Service), and are in accordance with recommendations made by the Service, the Bureau of Land Management (BLM), and the Wyoming Game and Fish Department (WGFD). Appendix A contains the protocols used to collect eagle use data for the period of this report.
This report summarizes the data from the August 20 through November 9, 2012 raptor counts and captures late summer eagle use, fall migration, and early winter use within the Project site. It is one of four reports covering 12 consecutive calendar months from August 2012 to August 2013. Subsequent reports will roughly correspond to 1) winter use, spring migration, and early nesting activities; 2) incubation, nesting, and chick rearing periods in spring and early summer; and 3) fledging and summer use.
In 2012, based on the extensive avian data that have been collected for the Project, Power Company of Wyoming, LLC (PCW) substantially re-designed the Project and identified Turbine No-Build Areas. These designated Turbine No-Build Areas have relatively higher eagle use than other areas of the Project and PCW has committed to not build turbines in these areas. This will substantially contribute to avoiding and minimizing collision risk to eagles. Next, to assess use by eagles and other raptors in the remaining potential wind development areas (WDAs), surveys were initiated during August 2012 at 40, 800-meter (m) survey locations across the probable turbine footprint outside of the Turbine No-Build Areas (Figures 1 and 2).
Selection of the 40, 800-m survey locations was achieved using a spatially balanced sampling design used to capture the variability in habitat conditions, terrain features, and turbine numbers and densities. Minimum convex polygons2 (MCPs) were placed around potential turbine construction areas in the Project site that are separated by the Turbine No-Build Areas established by PCW (Figures 1 and 2). MCPs were evaluated for differences in habitat characteristics, forage potential, and topography. While differences in habitat characteristics, forage potential, and topography occur among the 10 discrete MCPs, within each MCP these factors are similar and additional stratification beyond the MCP level was not necessary. Using Geostatistical Analyst tools in ArcGIS, spatially balanced survey locations were sequentially selected in a manner that is consistent with the recommendations made by the Service while ensuring that no overlap occurs between survey locations. Total number of sampling locations per MCP was based on the relative surface area, number of turbines, and turbine densities in each MCP.
2 MCPs were generated using the ArcGIS Spatial Analyst minimum bounding geometry function with the minimum convex hull option selected.

August 20 through November 9, 2012, Eagle Summary Report Chokecherry and Sierra Madre Wind Energy Project
2 SWCA
Figure 1. Minimum Convex Polygons, 800-meter raptor count locations and survey perimeters for Chokecherry.

August 20 through November 9, 2012, Eagle Summary Report Chokecherry and Sierra Madre Wind Energy Project
3 SWCA
Figure 2. Minimum Convex Polygons, 800-meter raptor count locations and survey perimeters for Sierra Madre.

August 20 through November 9, 2012, Eagle Summary Report Chokecherry and Sierra Madre Wind Energy Project
4 SWCA
Raptor surveys documented in this report occurred from August 20 through November 9, 2012. Surveys occurred at 40 survey locations across the Project site, with 19 survey locations in the Chokecherry WDA and 21 survey locations in the Sierra Madre WDA (Figures 1 and 2). Surveys were designed to occur at each of the 40 survey locations for 2 hours per survey date in accordance with guidance from the Service. Two avian technicians each surveyed two survey locations per day resulting in surveys of four survey locations per day and 40 survey locations in a 10-day period. The schedule was designed and implemented to provide survey coverage across all daylight hours for each of the 40 survey locations. The schedule was also designed such that the four raptor count surveys conducted on any given day were separated temporally and spatially to increase the likelihood of independence of any observations made.
Surveys were completed across all daylight hours in accordance with the Service’s recommendations. Each raptor flight path was recorded by technicians on aerial maps. Additional data collected included species, number of individuals per observation, age, sex, behavior, azimuth to bird, distance to bird, heading of bird, altitude of bird, the beginning and ending time for each observation, interactions with other birds, and hourly weather data among other variables. Appendix A to this report contains the detailed protocols used to collect the data.
RESULTS AND DISCUSSION
During the August 20 to November 9, 2012 survey period, 240 individual surveys were conducted across both WDAs for a total of 29,176 survey minutes (486.27 hours; Tables 1 and 2). Generally, survey minutes were evenly distributed across the 40 survey locations but varied slightly at some survey locations due to safety and accessibility issues caused by inclement weather.
During the August 20 to November 9, 2012 survey period, golden eagles (Aquila chrysaetos) were observed in flight for 64 total flight minutes (Tables 1 and 2). Overall use for golden eagle during this survey period was 0.0022 flight minute per minute of survey. This use value is the total use without consideration of flight heights and proportion of time in the Rotor Swept Zone (RSZ). Golden eagle use in the Chokecherry WDA during this survey period was 0.0015 flight minute per minute of survey while use in the Sierra Madre WDA was 0.0029 flight minute per minute of survey.
All eagle flight minutes recorded during the August 20 to November 9, 2012 survey period were subdivided into three altitudinal categories as recorded during field surveys (below RSZ = 0–30 m, within RSZ = 30–150 m, above RSZ = above 150 m) to determine the proportion of time eagles flew through the RSZ (30–150 m) and therefore at risk of collision. These altitudinal categories were developed to be reflective of the actual turbine heights that will be used for the Project. Of the 64 total golden eagle flight minutes, 15 minutes (23.4%) were recorded within the 0–30 m bin, 18 minutes (28.1%) were recorded within the 30–150 m bin, and 31 minutes (48.4%) were recorded above 150 m (Tables 1 and 2). When considering observed flight heights, total use across the Project site in the RSZ where collisions could occur was 0.0006 minute of flight time per minute of survey, a decrease of nearly 72% compared to total flight minutes.

August 20 through November 9, 2012, Eagle Summary Report Chokecherry and Sierra Madre Wind Energy Project
5 SWCA
With respect to bald eagle (Haliaeetus leucocephalus), one bald eagle was observed twice on the same day at the same location during the August 20 to November 9, 2012 survey period, which resulted in a total of 2 flight minutes. Overall use for bald eagle during this survey period was 0.00007 flight minute per minute of survey.
Results and Discussion of Chokecherry Use Observations
Surveys in the Chokecherry WDA were conducted at 19 locations for a total of 13,816 minutes during the August 20 to November 9, 2012 survey period. During this survey period, golden eagles were observed in flight at five of the 19 survey locations for a total of 20 minutes (Table 1). Golden eagle use for the Chokecherry WDA during this survey period was calculated as 0.0015 flight minute per survey minute.
Four of the 20 golden eagle flight minutes (20%) occurred within the 0–30 m altitudinal bin, 4 minutes (20%) occurred within the 30–150 m bin, and the remaining 12 minutes (60%) occurred above 150 m (Table 1). In the Chokecherry WDA, 80% of all use occurred outside of the RSZ where eagles are not at risk for collision. No bald eagles were observed in the Chokecherry WDA during fall 2012 surveys.
The five sites in the Chokecherry WDA with golden eagle observations occurred within two of the MCPs, Nevins Ridge and Smith Rim (Figure 1). Survey locations within the Coal Mine Draw, Hogback, Upper Hugus Draw, and Upper Iron Springs MCPs all had zero eagle observations during the August 20 to November 9, 2012 survey period. Within the Nevins Ridge MCP, golden eagles were observed at CC3, CC4, CC6, and CC8. Within the Smith Rim MCP, a golden eagle was observed at SR1.
Within the Nevins Ridge MCP, at CC3 one golden eagle was observed on one survey date for a total of 2 flight minutes. One of the flight minutes occurred in the 0–30 m height category, and one occurred in the 30–150 m height category. Over the course of the 2 flight minutes, this individual’s behavior was recorded as gliding and powered flight. At CC4, two golden eagle observations were made on two separate days for a total of 4 flight minutes. Two of the flight minutes occurred in the 0–30 m height category, and two occurred in the 30–150 m height category. One eagle observation was recorded as gliding for 3 minutes, while the other observation was recorded as both gliding and powered flight during the 1 minute it was observed. At CC6, two golden eagle observations were made on two separate days for a total of 4 flight minutes. One flight minute occurred in the 0–30 m height category, 1 flight minute occurred in the 30–150 m height category, and 2 flight minutes occurred above 150 m. One eagle observation was recorded as soaring for 2 minutes, while the other observation was recorded as gliding for 1 minute and soaring for 1 minute. At CC8, two golden eagle observations were made on a single day for a total of 8 flight minutes. All 8 flight minutes occurred above 150 m. One eagle observation was recorded as soaring for 2 minutes, while the other observation was recorded as soaring for 4 minutes, gliding for 1 minute, and displaying for 1 minute (Table 3).
Within the Smith Rim MCP, at SR1 one golden eagle was observed on a single day for 2 flight minutes. Both flight minutes for this eagle observation occurred above 150 m, and the behavior for both flight minutes was recorded as soaring (Table 3).

August 20 through November 9, 2012, Eagle Summary Report Chokecherry and Sierra Madre Wind Energy Project
6 SWCA
Results and Discussion of Sierra Madre Use Observations
In the Sierra Madre WDA, surveys were conducted for 15,360 minutes during the August 20 to November 9, 2012 survey period. During this survey period, golden eagles were observed in flight at eight of 21 survey locations for a total of 44 minutes (Table 2). Golden eagle use for the Sierra Madre WDA during this period was 0.0029 flight minute per survey minute.
Eleven of the 44 golden eagle flight minutes (25%) occurred in the 0–30 m height category, 14 minutes (31.8%) occurred within 30–150 m, and the remaining 19 minutes (43.2%) occurred above 150 m (Table 2). In the Sierra Madre WDA, nearly 70% of all use occurred outside of the RSZ where eagles are not at risk for collision.
The eight sites with eagle observations in the Sierra Madre WDA occurred within three of the MCPs: Upper Miller Hill, Lower Miller Hill, and Sage Creek Rim (Figure 2). Survey locations within the Sage Creek Basin MCP all had zero eagle observations during the August 20 to November 9, 2012 survey period. Within the Upper Miller Hill MCP, golden eagles were observed at MH1 and MH6. Within the Lower Miller Hill MCP, golden eagles were observed at PG1, PG2, PG3, and PG5. One bald eagle was also observed for 2 total flight minutes at PG3. Within the Sage Creek Rim MCP, golden eagles were observed at SCR1 and SCR2.
Within the Upper Miller Hill MCP, at MH1 two eagle observations of single individuals occurred on the same survey day for a total of 7 flight minutes. It is possible that these observations are of the same individual as the observations occurred in the same general location within the 800-m survey perimeter within 1 hour of each other. One of the flight minutes occurred in the 0–30 m height category, 4 minutes occurred in the 30–150 m height category, and 2 minutes occurred above 150 m. One eagle observation was recorded as soaring for 2 minutes and circle soaring for 2 minutes. The second observation was recorded as powered flight for 1 minute and circle soaring for 2 minutes. At MH6, one golden eagle was observed on one survey day for a total of 4 flight minutes. Two of the flight minutes were recorded within the 0–30 m height category and 2 flight minutes were recorded within 30–150 m. Two of these flight minutes were recorded as gliding, 1 minute was recorded as powered flight, and 1 minute was recorded as hovering (Table 4).
Within the Lower Miller Hill MCP, at PG1 one golden eagle was observed on one survey day for a total of 2 flight minutes. Both flight minutes occurred in the 0–30 m height category. Both minutes of this observation were recorded as powered flight. At PG2, two golden eagle observations were made on two separate days for a total of 8 flight minutes. One of these flight minutes occurred within the 0–30 m height category, one occurred within 30–150 m, and six flight minutes were above 150 m. One observation was recorded as soaring for 5 minutes and circle soaring for 2 minutes; the second observation was recorded as powered flight for 1 minute. At PG3, one golden eagle was observed in flight on one survey day for a total of 4 flight minutes, and one bald eagle was observed on a different survey day for 2 minutes. For the golden eagle observation, all of the 4 flight minutes occurred above 150 m. For the bald eagle observation both flight minutes occurred within the 0–30 m height category. The golden eagle was recorded as circle soaring for all 4 minutes, and the bald eagle was recorded as powered flight for 2 flight minutes. At PG5, two golden eagle observations

August 20 through November 9, 2012, Eagle Summary Report Chokecherry and Sierra Madre Wind Energy Project
7 SWCA
were made on two separate days for a total of 8 flight minutes. Two of these flight minutes occurred within the 30–150 m height category, while 6 minutes occurred above 150 m. One golden eagle observation was recorded as circle soaring for 4 minutes and soaring for 2 minutes; the second observation was recorded as soaring for 2 minutes (Table 4).
Within the Sage Creek Rim MCP, at SCR1 one golden eagle was observed in flight on a single survey day for 2 minutes. Both flight minutes occurred within the 0–30 m height category, and the flight behavior for both minutes was recorded as gliding. At SCR2, six golden eagle observations were made across four survey days for a total of 9 flight minutes. Five of these flight minutes occurred within the 0–30 m height category, 3 minutes occurred within 30–150 m, and 1 minute occurred above 150 m. On one survey day, two golden eagles were observed together and both were recorded as gliding for 2 minutes (total of 4 minutes for both individuals). Another survey day one golden eagle was recorded as soaring for 1 minute and circle soaring for 1 minute. On the third survey day, one golden eagle was recorded as powered flight for 1 minute, and a second golden eagle observation (possibly the same individual) on the same day was recorded as powered flight for 1 minute. On the final survey day, one golden eagle was observed as gliding for 1 minute (Table 4).
The majority of golden eagle flight minutes recorded within Project site during the August 20 to November 9, 2012 survey period are not independent as most were generated by only a few eagles. In the Chokecherry WDA, 40% of all golden eagle flight minutes were associated with only 1 of 7 total observations (Table 3, 8 minutes of flight time at CC8 on September 7). Similarly, 45% of the golden eagle flight minutes in the Sierra Madre WDA occurred between just 3 of the 13 total observations (Table 4, 7 minutes of flight time at PG2 on August 21, 7 minutes of flight time at MH1 on August 27, and 6 minutes of flight time at PG5 on October 4).
Treatment of these data as independent observations will overstate the expected impacts to eagles. In the case of the data described in the paragraph above, treating the 28 minutes of observed eagle use as independent is the equivalent of stating that 28 eagles were observed in flight for one minute each. This assumption of independence is not valid for these data and should be accounted for in future planning efforts and analysis of potential Project impacts to eagles.
COMPARISON TO PREVIOUS SURVEY RESULTS
As a result of PCW’s re-design efforts, golden eagle use in the WDAs during the August 20 to November 9, 2012 survey period was substantially lower than the same period in 2011. Golden eagle use during the August 20 to November 9, 2012 survey period was 0.0022 flight minute per minute of survey compared with 0.0038 flight minute per minute of survey during the August to November 2011 survey period, a decrease in use of more than 42%. The reduction in golden eagle use estimates between the two survey periods are due to the establishment of Turbine No-Build Areas where high eagle-use was documented from 2011 survey data and demonstrates the avoidance and minimization benefits of PCW’s re-design efforts. In PCW’s Eagle Conservation Plan Supplement submitted to the Service on September 26, 2012, it was demonstrated that the establishment of the Turbine No-Build Areas would substantially reduce observed eagle use. The reduction in use observed during

August 20 through November 9, 2012, Eagle Summary Report Chokecherry and Sierra Madre Wind Energy Project
8 SWCA
the survey period included in this report is consistent with the findings presented in the September 26, 2012, Eagle Conservation Plan Supplement.
Overall use for bald eagle during the August 20 to November 9, 2012 survey period was 0.00007 flight minute per minute of survey compared to 0.0008 during the August to November 2011 survey period, a reduction of more than 91%. This reduction in use between the two survey periods also demonstrates the avoidance and minimization value of PCW’s Project re-design that includes Turbine No-Build Areas.
Golden eagle use for the Chokecherry WDA during the August 20 to November 9, 2012 survey period was calculated as 0.0015 flight minute per survey minute compared with 0.0037 during the August to November 2011 survey period, a 60% decrease in use resulting from PCW’s identification of Turbine No-Build Areas in multiple eagle use areas that were identified during 2008–2009, 2011, and 2012 survey efforts.
No bald eagles were observed in the Chokecherry WDA during the August 20 to November 9, 2012 survey period, compared with bald eagle use of 0.0003 flight minute per survey minute during the August to November 2011 survey period.
Golden eagle use for the Sierra Madre WDA during the August 20 to November 9, 2012 survey period was 0.0029 flight minute per survey minute compared with 0.0038 during the August to November 2011 survey period, a 24% decrease in use resulting from PCW’s identification of Turbine No-Build Areas in multiple eagle use areas that were identified during 2008–2009, 2011, and 2012 survey efforts.
Bald eagle use for the Sierra Madre WDA during the August 20 to November 9, 2012 survey period was 0.0001 flight minute per minute of survey compared with 0.0012 during the August to November 2011 survey period, a 91% decrease in use resulting from PCW’s identification of Turbine No-Build Areas in multiple eagle use areas that were identified during 2008–2009, 2011, and 2012 survey efforts.

August 20 through November 9, 2012, Eagle Summary Report Chokecherry and Sierra Madre Wind Energy Project
9 SWCA
Table 1. Number of Survey Minutes, Days, Individuals, Golden Eagle Flight Minutes, and Height Categories for all Survey Locations in the Chokecherry WDA.
MCP Location Survey Minutes
Number of Individual
Eagles
Golden Eagle Flight
Minutes
Minutes within 0–
30 m
Minutes within
30–150 m (RSZ)
Minutes above 150 m
Nevins Ridge CC1 720 0 0 0 0 0 CC2 720 0 0 0 0 0 CC3 698 1 2 1 1 0 CC4 720 2 4 2 2 0 CC5 720 0 0 0 0 0 CC6 716 2 4 1 1 2 CC7 780 0 0 0 0 0 CC8 720 2 8 0 0 8 CC9 720 0 0 0 0 0
Coal Mine Draw
CMD1 780 0 0 0 0 0 CMD2 720 0 0 0 0 0
Hogback HB1 720 0 0 0 0 0 HB2 720 0 0 0 0 0
Smith Rim SR1 720 1 2 0 0 2 SR2 720 0 0 0 0 0
Upper Hugus Draw
UH1 762 0 0 0 0 0 UH2 720 0 0 0 0 0
Upper Iron Springs
UI1 720 0 0 0 0 0 UI2 720 0 0 0 0 0
Total – 13,816 8 20 4 4 12

August 20 through November 9, 2012, Eagle Summary Report Chokecherry and Sierra Madre Wind Energy Project
10 SWCA
Table 2. Number of Survey Minutes, Days, Individuals, Golden Eagle Flight Minutes, and Height Categories for all Survey Locations in the Sierra Madre WDA.
MCP Location Survey Minutes
Number of Individual
Eagles
Golden Eagle Flight
Minutes
Minutes within 0–30 m
Minutes within 30–150
m (RSZ)
Minutes above 150 m
Sage Creek Basin
CB1 780 0 0 0 0 0 CB2 720 0 0 0 0 0 CB3 600 0 0 0 0 0 CB4 840 0 0 0 0 0
Upper Miller Hill
MH1 720 2 7 1 4 2 MH2 720 0 0 0 0 0 MH3 780 0 0 0 0 0 MH4 720 0 0 0 0 0 MH5 780 0 0 0 0 0 MH6 720 1 4 2 2 0
Lower Miller Hill
PG1 720 1 2 2 0 0 PG2 720 2 8 1 1 6 PG3 720 1 4 0 0 4 PG4 840 0 0 0 0 0 PG5 780 2 8 0 2 6 PG6 600 0 0 0 0 0 PG7 720 0 0 0 0 0 PG8 840 0 0 0 0 0 PG9 600 0 0 0 0 0
Sage Creek Rim
SCR1 720 1 2 0 2 0 SCR2 720 6 9 5 3 1
Total – 15,360 16 44 11 14 19

August 20 through November 9, 2012, Eagle Summary Report Chokecherry and Sierra Madre Wind Energy Project
11 SWCA
Table 3. Summary of Golden Eagle Observations in the Chokecherry WDA.
Date and Time of
Observation Location
Number of Golden Eagle
Observed
Golden Eagle Observations per
Survey Minute
Golden Eagle Flight
Minutes
Flight Minutes in RSZ
Flight Behavior (minutes)
9/7/2012 15:33 15:45
CC8 2 0.0028
2 (1st Obs.) 6 (2nd Obs.)
0
1st Obs. Soaring (2)
2nd Obs.
Display (1) Gliding (1) Soaring (4)
9/26/2012 15:35 CC4 1 0.0028 1 1
Gliding/ Powered Flight
(1) 09/27/2012
15:24 CC6 1 0.0028
2 0 Soaring (2)
10/2/2012 10:23 CC6 1 2 1 Gliding (1)
Soaring (1) 10/11/2012
12:47 SR1 1 0.0014 2 0 Soaring (2)
10/25/2012 17:22 CC3 1 0.0014 2 1
Gliding (1) Powered Flight
(1) 11/1/2012
15:48 CC4 1 0.0028 3 1 Gliding (3)

August 20 through November 9, 2012, Eagle Summary Report Chokecherry and Sierra Madre Wind Energy Project
12 SWCA
Table 4. Summary of Golden Eagle Observations in the Sierra Madre WDA.
Date and Time of
Observation Location
Number of Golden Eagle
Observed
Golden Eagle Observations per Survey Minute
Golden Eagle Flight
Minutes
Flight Minutes in RSZ
Flight Behavior (minutes)
8/21/2012 13:10 PG2 1 0.0028 7 1 Circle Soaring (2)
Soaring (5) 8/22/2012
12:08 SCR1 1 0.0014 2 2 Gliding (2)
08/24/2012 9:13
10:07 MH1 2 0.0028
4 (1st Obs.) 3 (2nd Obs.)
4
1st Obs. Circle Soaring (3)
Soaring (1)
2nd Obs. Circle Soaring (2) Powered Flight (1)
Possibly the same
individual
8/28/2012 11:56 PG3 1 0.0014 4 0 Circle Soaring (4)
9/7/2012 7:51 SCR2 2 (paired
flight) 0.0083 4 0 Gliding (4)
10/4/2012 12:21 PG5 1 0.0026 6 0 Circle Soaring (4)
Soaring (2) 10/12/2012
10:41 SCR2 1 0.0083 2 2 Circle Soaring (1) Soaring (1)
10/15/2012 17:19 PG2 1 0.0028 1 0 Powered Flight (1)
10/16/2012 8:46 PG1 1 0.0014 2 0 Powered Flight (2)
10/19/2012 17:07 17:24
SCR2 2 0.0083 2 1
1st Obs. Powered Flight (1)
2nd Obs.
Powered Flight (1)
Likely the same individual
10/31/2012 13:35 SCR2 1 0.0083 1 0 Gliding (1)
11/6/2012 09:07 MH6 1 0.0014 4 2
Gliding (2) Hovering (1)
Powered Flight (1) 11/8/2012
15:04 PG5 1 0.0026 2 2 Soaring (2)

Appendix A:
August 20-November 9, 2012
800-meter Raptor Survey Protocols Chokecherry and Sierra Madre Wind Energy Project

This page intentionally left blank

August 20-November 9, 2012, 800-meter Raptor Survey Protocols
Chokecherry and Sierra Madre Wind Energy Project
Prepared for:
Power Company of Wyoming, LLC 555 17th Street, Suite 2400
Denver, CO 80202
Prepared by:
SWCA Environmental Consultants 295 Interlocken Blvd., Suite 300
Broomfield, CO 80021 (303) 487-1183 / Fax (303) 487-1245
August 31, 2012

This page intentionally left blank

Appendix A: August 20-November 9, 2012 800-meter Raptor Survey Protocols
1 SWCA
Introduction
The Power Company of Wyoming LLC (PCW) recently initiated revisions to the methodologies currently used to survey for raptors at the Chokecherry and Sierra Madre Wind Energy Project (Project). Based on conversations with U.S. Fish and Wildlife Service (Service) personnel, and in an effort to collect data that are appropriate for use in the Service’s model that predicts the potential fatality rate of eagles for wind energy projects (hereafter, the Service’s model), raptor survey protocols were revised for the fall 2012 season and for future raptor survey efforts. These survey methodology revisions are fully compliant with the recommendations for raptor surveys set forth by the Service in their Draft Eagle Conservation Plan Guidance (Draft ECP Guidance), the Eagle Conservation Plan Guidance Module 1 – Land-based Wind Energy Technical Appendices (Technical Appendices; as received from Kevin Kritz, Service Region 6, on August 4, 2012), and the Land-Based Wind Energy Guidelines, while still maintaining expansive coverage of the Project site.
Year Two and Year Three 4,000-meter-radius long-watch raptor surveys were fully compliant with the recommendations set forth by the Service’s Draft ECP Guidance (Service 2011) and Land-Based Wind Energy Guidelines (Service 2012a), the Bureau of Land Management’s (BLM’s) Wildlife Survey Protocols for Wind Energy Development (BLM 2008), and the Wyoming Game and Fish Department’s (WGFD’s) Wildlife Protection Recommendations for Wind Energy Development (WGFD 2010). These surveys were successful in identifying concentrated raptor use areas across the Project that could be used to design avoidance areas in order to minimize avian impacts. Additionally, 4,000-meter data were instructive in showing the Project site is not a strong migratory corridor for raptors, and the flight paths digitized from these data were used to identify high eagle-use areas as recommended by the Service’s Technical Appendices (Service 2012b).
Because the Service’s model requires data from 800-meter point count survey efforts, the 4,000-meter data were truncated to include only those observations that occurred within 800 meters (Figure 1). However, due to the 4,000-meter raptor count locations being placed on promenades, ridgelines, and in areas where there was an expectation of high raptor use, estimates of use, and therefore risk calculations that were developed for use across the entire Project site, were overstated due to many of these data being collected in identified high-use areas. Because use estimates were being driven upwards for the Project by many of the data being collected in high-use areas, unrealistic projections of eagle risk were being generated by the Service’s model. This in part facilitated the revision to survey protocols.
800-meter Raptor Survey Protocols
The revised raptor count protocols follow the 800-meter radius point count methodology recommended by the Service’s Technical Appendices (Service 2012b), and are also in accordance with the aforementioned guidance documents produced by the Service, BLM, and WGFD. PCW also sought consultation with Dr. Joshua Millspaugh (Professor of Wildlife Management, University of Missouri) to ensure the development of a rigorous sampling design that would result in the collection of data appropriate for the analysis methods and fatality model currently being used by the Service.

Appendix A: August 20-November 9, 2012 800-meter Raptor Survey Protocols
2 SWCA
Figure 1. All 800-meter raptor count locations and survey perimeters on the Project site.

Appendix A: August 20-November 9, 2012 800-meter Raptor Survey Protocols
3 SWCA
Based upon agency guidance and logistical considerations, the revised protocols were designed to include 40, 800-meter raptor count locations throughout areas of the Project site where turbine development was likely (Figure 1). Locations were selected using a spatially balanced random selection process with the number of 800-meter raptor count locations per area determined by the relative turbine density in the different areas of the Project. Raptor count locations were selected such that no overlap occurs between survey locations or with the avoidance areas that PCW has committed to as part of the Project Eagle Conservation Plan (ECP). Once the initial 800-meter raptor count locations were selected, some minimal micrositing of the locations was conducted to ensure full visibility of the survey areas and safe and consistent accessibility on the part of field personnel. Coordinates for each of the final 800-meter raptor survey locations are listed in Table 1. Landmarks and lathe stakes were located within each survey location perimeter to provide distance references for field personnel completing survey efforts. When the 800-meter radius survey areas of the new 40 point count locations are combined with the 800-meter radius survey areas of the Year Two and Year Three sites, 34.7% of the probable development areas are covered by raptor count surveys, which is greater than the 30% recommendation made by the Service (Service 2012b).
Table 1. Names and Coordinates for 2012 – 2013 800-meter Raptor Count Locations.
Location Easting Northing Location Easting Northing CB1 326414 4597515 MH4 305024 4594675 CB2 321985 4595451 MH5 309573 4590571 CB3 323462 4597428 MH6 306043 4597131 CB4 329306 4599449 PG1 313663 4594801 CC1 316611 4621251 PG2 311358 4598224 CC2 315166 4616447 PG3 307172 4603361 CC3 318351 4619090 PG4 314434 4597259 CC4 314539 4621971 PG5 313730 4599682 CC5 317418 4614741 PG6 312721 4603547 CC6 319335 4621702 PG7 310058 4595825 CC7 313825 4618366 PG8 311832 4594006 CC8 314807 4614119 PG9 311187 4600886 CC9 319294 4617332 SCR1 333505 4598194 CMD1 334482 4612363 SCR2 332597 4596408 CMD2 331648 4614732 SR1 323560 4617658 HB1 323818 4620014 SR2 327318 4618336 HB2 326781 4620243 UH1 328912 4615606 MH1 302291 4600564 UH2 327099 4615081 MH2 305677 4599125 UI1 323987 4612091 MH3 307684 4592030 UI2 327702 4610001
Surveys will be conducted at each raptor count location for two hours per guidance in the Technical Appendices (Service 2012b). Two avian technicians will each survey two locations a day for a total of 20 locations per week. Each location will be surveyed bi-weekly. A schedule for all 40 raptor count locations was designed to provide survey coverage across all daylight hours for each of the 40 sites. The schedule was also designed such that the four

Appendix A: August 20-November 9, 2012 800-meter Raptor Survey Protocols
4 SWCA
raptor count surveys conducted on any given day are separated temporally and spatially to provide independence of any observations that are made.
Avian technicians are equipped with binoculars, spotting scopes, laser rangefinders, and aerial maps to assist with accurate detection and documentation of all raptors observed within the 800-meter survey area. Each aerial map is displayed with relevant landforms occurring in the area, locations of lathe stakes, and concentric rings at each 200-meter interval to facilitate accurate distance estimation (Attachment 1). Each raptor flight path is recorded by technicians on the provided aerial maps. Additional data collected include species, number of individuals per observation, age, sex, behavior, bearing to bird, distance to bird, heading of bird, altitude of bird, the beginning and ending time for each observation, and hourly weather data (Attachment 2).
At present, the 800-meter raptor counts are scheduled to continue bi-weekly at each location through the fall migration period (November 15). Surveys are tentatively slated to occur once per month at each location during the winter season (December 2012 through March 2013) due to accessibility and safety concerns. The end of winter surveys in March 2013 will complete three full years of data collection for the Project. Consultations are ongoing with Service personnel to determine the scope of potential survey efforts beyond March 2013.
References
Bureau of Land Management (BLM). 2008. Wildlife Survey Protocols for Wind Energy Development.
U.S. Fish and Wildlife Service (Service). 2011. Draft Eagle Conservation Plan Guidance. Available online at http://www.fws.gov/windenergy/. Accessed December 2011.
———. 2012a. Land Based Wind Energy Guidelines. Wind Turbine Guidelines Advisory Committee. U.S. Fish and Wildlife Service, Department of the Interior, Washington D.C. Available online at http://www.fws.gov/windenergy/docs/WEG_final.pdf. Accessed August 2012.
———. 2012b. Eagle Conservation Plan Guidance Module 1 – Land-based Wind Energy Technical Appendices. Received from Kevin Kritz, Service Region 6, on August 4, 2012.
Wyoming Game and Fish Department (WGFD). 2010. Wildlife Protection Recommendations for Wind Energy Development in Wyoming. Wyoming Game and Fish Commission Approved November 17, 2010. Wyoming Game and Fish Department, Cheyenne, WY.

Appendix A: August 20-November 9, 2012 800-meter Raptor Survey Protocols
SWCA
ATTACHMENT 1 Example Aerial Map Used to Map Flight Paths during 800-meter Raptor
Count Surveys

This page intentionally left blank

Appendix A: August 20-November 9, 2012 800-meter Raptor Survey Protocols
A1-1 SWCA
Aerial map example.

This page intentionally left blank

Appendix A: August 20-November 9, 2012 800-meter Raptor Survey Protocols
SWCA
ATTACHMENT 2 Data Sheets Used to Collect Data during 800-meter Raptor Count Surveys

This page intentionally left blank

PCW 2011 Raptor Survey
Field Observer:
Survey Location:
Start time:
End time:
Date:
Page: ____ of _____
Target
# Obs
# Species
# Birds
Age Sex Behav Bearing
to Bird (°) Distance
to Bird (m) Angle of Bird (°)
Heading of Bird
0- 30
30-150
150+ Time Begin
Time End

PCW 2011 Raptor Survey Notes
Field Observer:
Survey Pt:
Date:
Page: _____ of _____
Other species and Notes:
Weather Conditions
Wind
Time Sky Dir Spd Temp (°F)
Incidental Species Observations

November 12, 2012, through March 29, 2013, Eagle Summary Report
Chokecherry and Sierra Madre Wind Energy Project
Prepared for:
Power Company of Wyoming, LLC 555 17th Street, Suite 2400 Denver, Colorado 80202
Prepared by:
SWCA Environmental Consultants 295 Interlocken Blvd., Suite 300
Broomfield, Colorado 80021 (303) 487-1183 / Fax (303) 487-1245
May 2013

This page intentionally left blank

November 12, 2012, through March 29, 2013,Eagle Summary Report Chokecherry and Sierra Madre Wind Energy Project
ii SWCA
EXECUTIVE SUMMARY
Between November 12, 2012, and March 29, 2013, SWCA Environmental Consultants performed raptor count surveys as part of Power Company of Wyoming, LLC’s (PCW’s) ongoing avian survey program at the Chokecherry and Sierra Madre Wind Energy Project (Project) site. The survey period captures winter eagle use, spring migration, and early nesting activities within the Project site. This report documents use during these eagle use periods.
For this survey period, 86 minutes of golden eagle (Aquila chrysaetos) use were recorded within the Project site during 30,523 survey minutes (508.72 hours) for 0.0028 flight minute per minute of survey. Of the recorded eagle flight minutes, 59.3% were outside the Rotor Swept Zone (RSZ). By altitudinal classification, 24.4% of the golden eagle flight minutes were below the RSZ (0 to 30 meters above ground), 40.7% of the golden eagle flight minutes were within the RSZ (30 to 150 meters), and 34.9% of the golden eagle flight minutes were above the RSZ (above 150 meters).
For the Chokecherry Wind Development Area (WDA), 31 minutes of golden eagle use were recorded during 16,003 survey minutes (266.72 hours) for 0.0019 flight minute per minute of survey. In total, 268 survey sessions were conducted during which 12 golden eagle observations were recorded during eight of the sessions.1 Observation times ranged between 1 minute and 4 minutes, rounded up to the nearest whole minute. Of the recorded use in the Chokecherry WDA, 64.5% occurred outside the RSZ.
For the Sierra Madre WDA, 55 minutes of golden eagle use were recorded during 14,520 survey minutes (242.00 hours) for 0.0038 flight minute per minute of survey. In total, 242 survey sessions were conducted during which 17 golden eagle observations were recorded during 13 of the sessions2. Observation times ranged between 1 minute and 8 minutes, rounded up to the nearest whole minute. More than 56% of all use within the Sierra Madre WDA occurred outside the RSZ.
During the survey period, there were no observations of bald eagles (Haliaeetus leucocephalus).
1 Two observations were possibly of the same golden eagle as the observations were made during the same session at SR1 within 45 minutes of each other. 2 Two observations were likely of the same juvenile golden eagle as the observations were made during the same session at CB4 and in the same general location.

November 12, 2012, through March 29, 2013,Eagle Summary Report Chokecherry and Sierra Madre Wind Energy Project
iii SWCA
TABLE OF CONTENTS
Page EXECUTIVE SUMMARY ........................................................................................................ ii INTRODUCTION AND PROJECT DESCRIPTION ............................................................... 1 RESULTS AND DISCUSSION ................................................................................................ 4
Discussion of Chokecherry Use Observations ....................................................................... 5 Discussion of Sierra Madre Use Observations ....................................................................... 6
COMPARISON TO PREVIOUS RESULTS ............................................................................ 8
LIST OF FIGURES
Figure Page 1 Minimum Convex Polygons, 800-meter raptor count locations and survey perimeters
for Chokecherry. .................................................................................................................. 2 2 Minimum Convex Polygons, 800-meter raptor count locations and survey perimeters
for Sierra Madre. .................................................................................................................. 3
LIST OF TABLES
Table Page 1 Number of Survey Minutes, Days, Individuals, Golden Eagle Flight Minutes, and
Height Categories for all Survey Locations in the Chokecherry WDA. ........................... 10 2 Number of Survey Minutes, Days, Individuals, Golden Eagle Flight Minutes, and
Height Categories for all Survey Locations in the Sierra Madre WDA. ........................... 11 3 Summary of Golden Eagle Observations in the Chokecherry WDA. ............................... 12 4 Summary of Golden Eagle Observations in the Sierra Madre WDA. ............................... 13 Appendices Appendix A: Revised 2012-2013 800-meter Raptor Survey Protocols

November 12, 2012, through March 29, 2013,Eagle Summary Report Chokecherry and Sierra Madre Wind Energy Project
1 SWCA
INTRODUCTION AND PROJECT DESCRIPTION
Surveys described in this report are part of the avian survey program directed towards identifying eagle and raptor use across the Chokecherry and Sierra Madre Wind Energy Project (Project) site. The survey data will be used for modeling eagle collision risk and developing avoidance measures and Best Management Practices to reduce potential Project impacts to eagles, to the extent practicable. All protocols and survey methodologies used to assess avian species in the Project site during surveys in 2011, 2012, and 2013 were developed in consultation with the U.S. Fish and Wildlife Service (Service), and are in accordance with recommendations made by the Service, the Bureau of Land Management (BLM), and the Wyoming Game and Fish Department (WGFD). Appendix A contains the protocols used to collect eagle use data for the period of this report.
This report summarizes the data from the November 12, 2012 to March 29, 2013 raptor counts and captures winter eagle use, spring migration, and early nesting activities within the Project site. It is one of four reports covering 12 consecutive calendars months from August 2012 to August 2013. Report 1 covers the period of August 20 to November 9, 2012; this report covers the period of November 12, 2012, to March 29, 2013. Subsequent reports will roughly correspond to 1) incubation, nesting, and chick rearing periods in spring and early summer; and 2) fledging and summer use.
In 2012, based on the extensive avian data that have been collected for the Project, Power Company of Wyoming, LLC (PCW) substantially re-designed the Project and identified Turbine No-Build Areas. These designated Turbine No-Build Areas have relatively higher eagle use than other areas of the Project and PCW has committed to not build turbines in these areas. This will substantially contribute to avoiding and minimizing collision risk to eagles. Next, to assess use by eagles and other raptors in the remaining potential wind development areas (WDAs), surveys were initiated during August 2012 at 40, 800-meter (m) survey locations across the probable turbine footprint outside of the Turbine No-Build Areas. After further consultation with the Service, the survey program was increased to 60, 800-m survey locations (Figures 1 and 2) for surveys occurring from mid-November 2012 through August 2013. The increased survey locations achieve coverage of 30% of the probable turbine locations for the Project as recommended by the Service. The addition of 20 survey locations also allowed the inclusion of seven sites that were previously surveyed in 2011 and early 2012 for further analysis.
Selection of the 60, 800-m survey locations was achieved using a spatially balanced sampling design used to capture the variability in habitat conditions, terrain features, and turbine numbers and densities. Minimum convex polygons3 (MCPs) were placed around potential turbine construction areas in the Project site that are separated by the Turbine No-Build Areas established by PCW (Figures 1 and 2). MCPs were evaluated for differences in habitat characteristics, forage potential, and topography. While differences in habitat characteristics,
3 MCPs were generated using the ArcGIS Spatial Analyst minimum bounding geometry function with the minimum convex hull option selected.

November 12, 2012, through March 29, 2013,Eagle Summary Report Chokecherry and Sierra Madre Wind Energy Project
2 SWCA
Figure 1.Minimum Convex Polygons, 800-meter raptor count locations and survey perimeters for Chokecherry.

November 12, 2012, through March 29, 2013,Eagle Summary Report Chokecherry and Sierra Madre Wind Energy Project
3 SWCA
Figure 2. Minimum Convex Polygons, 800-meter raptor count locations and survey perimeters for Sierra Madre.

November 12, 2012, through March 29, 2013,Eagle Summary Report Chokecherry and Sierra Madre Wind Energy Project
4 SWCA
forage potential, and topography occur among the 10 discrete MCPs, within each MCP these factors are similar and additional stratification beyond the MCP level was not necessary. Using Geostatistical Analyst tools in ArcGIS, spatially balanced survey locations were sequentially selected in a manner that is consistent with the recommendations made by the Service while ensuring that no overlap occurs between survey locations. Total number of sampling locations per MCP was based on the relative surface area, number of turbines, and turbine densities in each MCP.
Raptor surveys documented in this report occurred from November 12, 2012, through March 29, 2013. Surveys occurred at 60 survey locations across the Project site, with 31 survey locations in the Chokecherry WDA and 29 survey locations in the Sierra Madre WDA (Figures 1 and 2). Surveys were designed to occur at each of the 60 survey locations for 1 hour per survey date in accordance with guidance from the Service. Three avian technicians each surveyed two survey locations per day resulting in surveys of six survey locations per day and 60 survey locations in a 10-day period. The schedule was designed and implemented to provide survey coverage across all daylight hours for each of the 60 survey locations. The schedule was also designed such that the six raptor count surveys conducted on any given day were separated temporally and spatially to increase the likelihood of independence of any observations made.
Each survey location was scheduled to be surveyed twice per month; however, inclement winter weather and associated safety concerns occasionally limited the technicians’ ability to successfully complete surveys. The majority of the 60 survey locations were visited nine times during the survey period. A few were visited 10 times and two survey locations on Upper Miller Hill (the highest elevation point within the Project site) were only visited five times due to extreme and dangerous winter conditions and deep snow. While the relatively mild winter allowed vehicle or all-terrain vehicle access to most survey locations, the more extreme survey locations required snow-machines to access. However, as shown in the data, except for one golden eagle (Aquila chrysaetos) observation at MH8 (behavior recorded as powered flight), there were no other eagle observations on Upper Miller Hill during the survey period. Therefore, notwithstanding the inability to reach all survey locations nine times as planned, the data collected are consistent with the Service’s recommendations for eagle use data.
Surveys were completed across all daylight hours in accordance with the Service’s recommendations. Each raptor flight path was recorded by technicians on aerial maps. Additional data collected included species, number of individuals per observation, age, sex, behavior, azimuth to bird, distance to bird, heading of bird, altitude of bird, the beginning and ending time for each observation, interactions with other birds, and hourly weather data among other variables. Appendix A to this report contains the detailed protocols used to collect the data.
RESULTS AND DISCUSSION
During the November 12, 2012 to March 29, 2013 survey period, 510 individual surveys were conducted across both WDAs for a total of 30,523 survey minutes (508.72 hours; Tables 1 and 2). Generally, survey minutes were evenly distributed across the 60 survey locations but

November 12, 2012, through March 29, 2013,Eagle Summary Report Chokecherry and Sierra Madre Wind Energy Project
5 SWCA
varied slightly at some survey locations due to safety and accessibility issues caused by inclement weather.
During the November 12, 2012 to March 29, 2013 survey period, golden eagles were observed in flight for a total of 86 minutes (Tables 1 and 2). Overall use for golden eagle during this survey period was 0.0028 flight minute per minute of survey. This use value is the total use without consideration of flight heights and proportion of time in the Rotor Swept Zone (RSZ). Use in the Chokecherry WDA during this survey period was 0.0019 flight minute per minute of survey while use in the Sierra Madre WDA was 0.0038 flight minute per minute of survey. No bald eagles (Haliaeetus leucocephalus) were detected during the November 12, 2012 to March 29, 2013 survey period.
All eagle flight minutes recorded during the November 12, 2012 to March 29, 2013 survey period were subdivided into altitudinal categories as recorded during field surveys (below RSZ = 0–30 m, within RSZ = 30–150 m, above RSZ = above 150 m) to determine the proportion of time eagles flew through the RSZ (30–150 m) and therefore at risk of collision. These altitudinal categories were developed to reflect the actual turbine heights that will be used for the Project. Of the 86 total golden eagle flight minutes, 21 minutes (24.4%) were recorded within the 0–30 m bin, 35 minutes (40.7%) were recorded within the 30–150 m bin, and 30 minutes (34.9%) were recorded above 150 m (Tables 1 and 2). When considering observed flight heights, total use across the Project site in the RSZ where collisions could occur was 0.0011 minute of flight time per minute of survey, a decrease of nearly 60% compared to total flight minutes.
Results and Discussion of Chokecherry Use Observations
Surveys in the Chokecherry WDA were conducted at 31 locations for a total of 16,003 minutes during the November 12, 2012 to March 29, 2013 survey period. During this survey period, golden eagles were observed in flight at eight of the 31 survey locations for a total of 31 minutes (Table 1). Golden eagle use for the Chokecherry WDA during this survey period was calculated as 0.0019 flight minute per survey minute.
Nine of the 31 golden eagle flight minutes (29%) occurred within the 0–30 m altitudinal bin, 11 minutes (35.5%) occurred within the 30–150 m bin, and the remaining 11 minutes (35.5%) occurred above 150 m (Table 1). In the Chokecherry WDA, 64.5% of all use occurred outside of the RSZ where eagles are not at risk for collision.
The eight sites in the Chokecherry WDA with golden eagle observations occurred within five of the MCPs: Nevins Ridge, Hogback, Smith Rim, Upper Hugus, and Upper Iron Springs (Figure 1). Survey locations within the Coal Mine Draw MCP all had zero eagle observations during the November 12, 2012 to March 29, 2013 survey period. Within the Nevins Ridge MCP, golden eagles were observed at CC2, CC7, and CC13; in the Hogback MCP, a golden eagle was observed at HB3; in the Smith Rim MCP, golden eagles were observed at SR1; in the Upper Hugus MCP, a golden eagle was observed at UH4; and in the Upper Iron Springs MCP, golden eagles were observed at UI1 and UI2 (Table 1).

November 12, 2012, through March 29, 2013,Eagle Summary Report Chokecherry and Sierra Madre Wind Energy Project
6 SWCA
Within the Nevins Ridge MCP, at CC2 one golden eagle was observed on one survey date for a total of 2 flight minutes; both minutes occurred above 150 m. Over the course of the 2 flight minutes, this individual’s behavior was recorded as soaring. At CC7, two golden eagles were observed flying together on one survey date for a total of 6 flight minutes. One flight minute occurred in the 0–30 m height category, 1 minute occurred in the 30–150 m height category, and 4 minutes were recorded above 150 m. Both individuals’ behavior was recorded circle soaring for 5 minutes and soaring for 1 minute. At CC13, two golden eagles were observed flying together on one survey date for a total of 10 flight minutes. Two of the flight minutes occurred in the 0–30 m height category, 6 minutes occurred in the 30–150 m height category, and 2 minutes occurred above 150 m. Both eagles’ behavior was recorded as gliding for 6 minutes and soaring for 4 minutes (Table 3). It should be recognized that the majority of golden eagle flight minutes recorded in the Nevins Ridge MCP are not independent as most were generated by a few eagles using an area for an extended time.
Within the Hogback MCP in the Severson Flats development area, at HB3 one golden eagle was observed on one survey date for a total of 3 flight minutes, all of which occurred above 150 m. All 3 flight minutes for this observation were recorded as circle soaring (Table 3).
Within the Smith Rim MCP in the Severson Flats development area, at SR1 two golden eagle observations were made on a single day for a total of 4 flight minutes. It is possible that these observations are of the same individual as the observations occurred in the same general location within the 800-m survey perimeter within 45 minutes of each other. One flight minute occurred in the 0–30 m height category and 3 minutes occurred in the 30–150 m height category. The behavior for both observations was recorded as powered flight (Table 3).
Within the Upper Hugus MCP in the Severson Flats development area, at UH4 one golden eagle was observed on one survey date for a total of 1 flight minute, which occurred in the 30–150 m height category. The behavior for this observation was recorded as soaring (Table 3).
Within the Iron Springs MCP, at UI1 one golden eagle was observed on one survey date for a total of 1 flight minute, which occurred in the 0–30 m height category. The behavior for this observation was recorded as powered flight. At UI2, two golden eagles were observed flying together on a single day for a total of 4 flight minutes. All 4 flight minutes occurred in the 0–30 m height category, and the behavior was recorded as powered flight for all 4 minutes (Table 3).
Results and Discussion of Sierra Madre Use Observations
In the Sierra Madre WDA, surveys were conducted for 14,520 minutes during the November 12, 2012 to March 29, 2013 survey period. During this survey period, golden eagles were observed in flight at 10 of 29 survey locations for a total of 55 minutes (Table 2). Golden eagle use for the Sierra Madre WDA during this period was 0.0038 flight minute per survey.
Twelve of the 55 golden eagle flight minutes (21.8%) occurred within 0–30 m height category, 24 minutes (43.6%) occurred within 30–150 m, and the remaining 19 minutes

November 12, 2012, through March 29, 2013,Eagle Summary Report Chokecherry and Sierra Madre Wind Energy Project
7 SWCA
(34.6%) occurred above 150 m (Table 2). In the Sierra Madre WDA, more than 56% of all use occurred outside of the RSZ where eagles are not at risk for collision.
The 10 sites with eagle observations in the Sierra Madre WDA occurred within three of the MCPs: Sage Creek Basin, Upper Miller Hill, and Lower Miller Hill (Figure 2). Survey locations within the Sage Creek Rim MCP all had zero eagle observations during the November 12, 2012 to March 29, 2013 survey period. Within the Sage Creek Basin MCP, golden eagles were observed at CB1, CB2, CB4, and CB6. Within the Upper Miller Hill MCP, only one golden eagle was observed at MH8. Within the Lower Miller Hill MCP, golden eagles were observed at PG3, PG4, PG6, RM14, and RM15 (Table 2).
Within the Sage Creek Basin MCP, at CB1 two golden eagle observations were made on two separate days for a total of 5 flight minutes. Three flight minutes occurred within the 30–150 m height category and 2 minutes were above 150 m. One observation was recorded as gliding for 2 minutes, soaring for 1 minute, and powered flight for 1 minute. The second observation was recorded as powered flight for 1 minute. At CB2, one golden eagle was recorded on a single date for a total of 2 flight minutes, both of which occurred above 150 m. Both flight minutes for this observation were recorded as gliding. At CB4, two golden eagle observations were made on a single day for a total of 4 flight minutes. It is likely that these observations are of the same individual as both observations were recorded as juveniles and occurred in the same general location within the 800-m survey perimeter within 1 hour of each other. One flight minute was recorded in the 0–30 m height category, 1 minute was in the 30–150 m height category, and 2 minutes were above 150 m. One observation was recorded as hovering for 1 minute and powered flight for 1 minute. The second observation was recorded as gliding for 1 minute and powered flight for 1 minute. At CB6, two golden eagle observations were made on two separate days for a total of 6 flight minutes. One minute occurred in the 0–30 m height category, 1 minute occurred in the 30–150 m height category, and 4 minutes were above 150 m. One eagle observation was recorded as gliding for 1 minute and powered flight for 1 minute. The second observation was recorded as circle soaring for 4 minutes (Table 4).
In the Upper Miller Hill MCP, at MH8 one golden eagle was observed on a single date for a total of 2 flight minutes. One minute occurred in the 0–30 m height category and 1 minute occurred in the 30–150 m height category. Both minutes were recorded as powered flight (Table 4).
In the Lower Miller Hill MCP, at PG3, two golden eagles were observed flying together on one survey date for a total of 10 flight minutes. Four minutes occurred in the 30–150 m height category and 6 minutes were above 150 m. All 10 flight minutes were recorded as circle soaring. At PG4, two golden eagles were observed flying together on one survey date for a total of 7 flight minutes. Four flight minutes occurred in the 30–150 m height category and 3 minutes were above 150 m. Four minutes were recorded as soaring and 3 minutes were recorded as circle soaring. At PG6, one golden eagle was observed on a single date for a total of 2 flight minutes. Both flight minutes occurred in the 30–150 m height category and were recorded as powered flight. At RM14, one golden eagle was observed on a single date for a total of 8 flight minutes. Three minutes occurred in the 0–30 m height category and 5 minutes occurred in the 30–150 m height category. All 8 minutes were recorded as soaring. At RM15, three golden eagle observations were made on two separate survey days for a total of 9 flight

November 12, 2012, through March 29, 2013,Eagle Summary Report Chokecherry and Sierra Madre Wind Energy Project
8 SWCA
minutes. Six minutes occurred in the 0–30 m height category and 3 occurred within the 30–150 m height category. One golden eagle observation was recorded as powered flight for 1 minute; the second observation was recorded as gliding/powered flight for 1 minute; and the third observation was recorded as gliding for 1 minute and powered flight for 6 minutes (Table 4).
The majority of golden eagle flight minutes recorded within the Project site during the November 12, 2012 to March 29, 2013 survey period are not independent as most were generated by only a few eagles. Over half of the golden eagle flight minutes in the Chokecherry WDA occurred between just two of the eight total observations (Table 3, 10 minutes of flight time at CC13 on November 28 and 6 minutes at CC7 on February 11). Similarly, nearly 60% of the golden eagle flight minutes in the Sierra Madre WDA occurred during just 4 of the 14 total observations (Table 4, 10 minutes of flight time at PG3 on March 28, 8 minutes of flight time at RM14 on December 6, 7 minutes of flight time at RM15 on December 4, and 7 minutes of flight time at PG4 on November 29).
Treatment of these data as independent observations will overstate the expected impacts to eagles. In the case of the data described in the paragraph above, treating the 50 minutes of observed eagle use as independent is the equivalent of stating that 50 eagles were observed in flight for one minute each. This assumption of independence is not valid for these data and should be accounted for in future planning efforts and analysis of potential Project impacts to eagles.
COMPARISON TO PREVIOUS RESULTS
As a result of PCW’s Project re-design, golden eagle use in the WDAs was substantially lower during the November 12, 2012 to March 29, 2013 survey period than the same period in 2011-2012. Golden eagle use during the November 12, 2012 to March 29, 2013 survey period was 0.0028 flight minute per minute of survey compared with 0.0060 flight minute per minute of survey during the November 2011 to March 2012 survey period, a decrease in use of more than 53%. The reduction in golden eagle use estimates between the two survey periods are due to the establishment of Turbine No-Build Areas where high eagle use was documented from 2011–2012 survey data and demonstrates the avoidance and minimization benefits of PCW’s Project re-design. In PCW’s Eagle Conservation Plan Supplement submitted to the Service on September 26, 2012, it was demonstrated that the establishment of the Turbine No-Build Areas would substantially reduce observed eagle use. The reduction in use observed during the survey period included in this report is consistent with the findings presented in the September 26, 2012, Eagle Conservation Plan Supplement.
No bald eagle use was recorded during the November 12, 2012 to March 29, 2013 survey period compared to 0.0004 flight minute per minute of survey observed during the November 2011 to March 2012 survey period. This reduction in use between the two survey periods also demonstrates the avoidance and minimization value of PCW’s Project re-design as the observations of bald eagles in 2011-2012 were made within the Turbine No-Build Areas.
Golden eagle use for the Chokecherry WDA during the November 12, 2012 to March 29, 2013 survey period was calculated as 0.0019 flight minute per survey minute compared with

November 12, 2012, through March 29, 2013,Eagle Summary Report Chokecherry and Sierra Madre Wind Energy Project
9 SWCA
0.0062 during the November 2011 to March 2012 survey period, a 69% decrease in use resulting from PCW’s identification of Turbine No-Build Areas in multiple eagle use areas that were identified during the 2008–2009, 2011, and 2012 survey programs.
No bald eagles were observed in the Chokecherry WDA during the November 12, 2012 to March 29, 2013 survey period, compared with bald eagle use of 0.0005 flight minute per survey minute during the November 2011 to March 2012 survey period.
Golden eagle use for the Sierra Madre WDA during the November 12, 2012 to March 29, 2013 survey period was 0.0038 flight minute per survey minute compared with 0.0060 during the November 2011 to March 2012 survey period, a 37% decrease in use resulting from PCW’s identification of Turbine No-Build Areas in multiple eagle use areas that were identified during 2008–2009, 2011, and 2012 survey efforts.
No bald eagles were observed in the Sierra Madre WDA during either the November 12, 2012 to March 29, 2013 survey period or the November 2011 to March 2012 survey period .
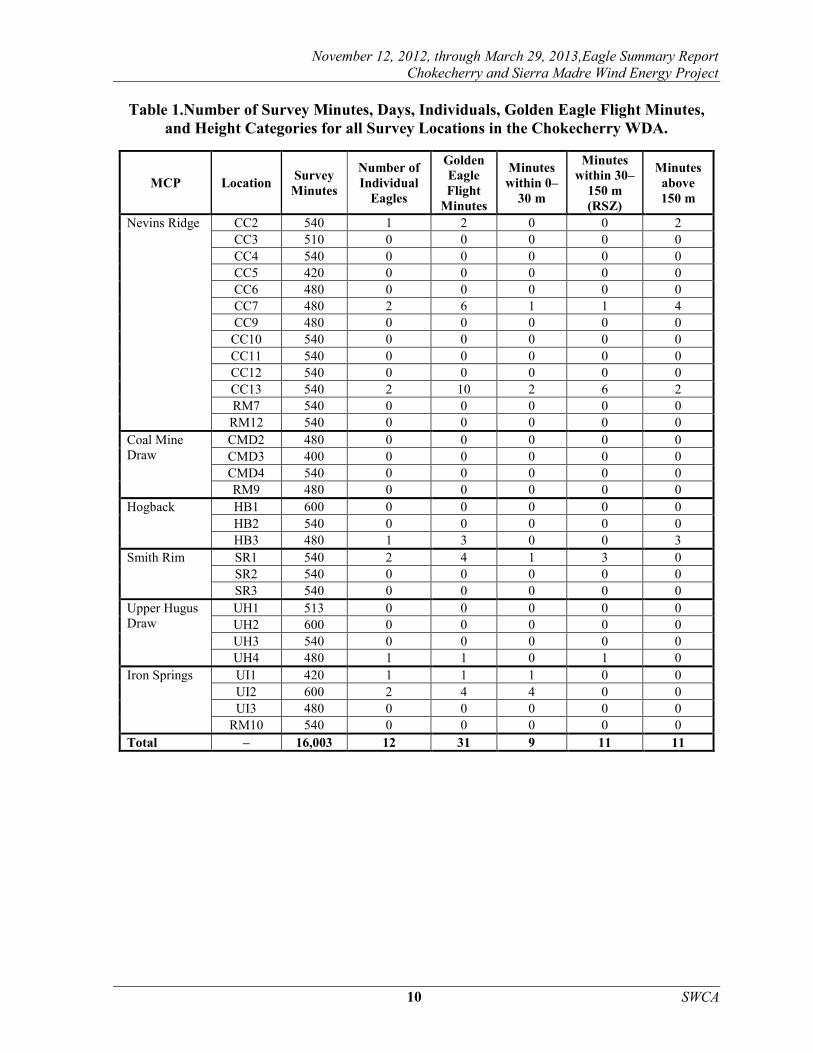
November 12, 2012, through March 29, 2013,Eagle Summary Report Chokecherry and Sierra Madre Wind Energy Project
10 SWCA
Table 1.Number of Survey Minutes, Days, Individuals, Golden Eagle Flight Minutes, and Height Categories for all Survey Locations in the Chokecherry WDA.
MCP Location Survey Minutes
Number of Individual
Eagles
Golden Eagle Flight
Minutes
Minutes within 0–
30 m
Minutes within 30–
150 m (RSZ)
Minutes above 150 m
Nevins Ridge CC2 540 1 2 0 0 2 CC3 510 0 0 0 0 0 CC4 540 0 0 0 0 0 CC5 420 0 0 0 0 0 CC6 480 0 0 0 0 0 CC7 480 2 6 1 1 4 CC9 480 0 0 0 0 0
CC10 540 0 0 0 0 0 CC11 540 0 0 0 0 0 CC12 540 0 0 0 0 0 CC13 540 2 10 2 6 2 RM7 540 0 0 0 0 0
RM12 540 0 0 0 0 0 Coal Mine Draw
CMD2 480 0 0 0 0 0 CMD3 400 0 0 0 0 0 CMD4 540 0 0 0 0 0 RM9 480 0 0 0 0 0
Hogback HB1 600 0 0 0 0 0 HB2 540 0 0 0 0 0 HB3 480 1 3 0 0 3
Smith Rim SR1 540 2 4 1 3 0 SR2 540 0 0 0 0 0 SR3 540 0 0 0 0 0
Upper Hugus Draw
UH1 513 0 0 0 0 0 UH2 600 0 0 0 0 0 UH3 540 0 0 0 0 0 UH4 480 1 1 0 1 0
Iron Springs UI1 420 1 1 1 0 0 UI2 600 2 4 4 0 0 UI3 480 0 0 0 0 0
RM10 540 0 0 0 0 0 Total – 16,003 12 31 9 11 11

November 12, 2012, through March 29, 2013,Eagle Summary Report Chokecherry and Sierra Madre Wind Energy Project
11 SWCA
Table 2.Number of Survey Minutes, Days, Individuals, Golden Eagle Flight Minutes, and Height Categories for all Survey Locations in the Sierra Madre WDA.
MCP Location Survey Minutes
Number of Individual
Eagles
Golden Eagle Flight
Minutes
Minutes within 0–30 m
Minutes within 30–
150 m (RSZ)
Minutes above 150 m
Sage Creek Basin
CB1 540 2 5 0 3 2 CB2 420 1 2 0 0 2 CB4 540 2 4 1 1 2 CB5 540 0 0 0 0 0 CB6 480 2 6 1 1 4 RM2 540 0 0 0 0 0
Upper Miller Hill
MH1 300 0 0 0 0 0 MH2 480 0 0 0 0 0 MH3 480 0 0 0 0 0 MH4 300 0 0 0 0 0 MH5 480 0 0 0 0 0 MH6 540 0 0 0 0 0 MH7 480 0 0 0 0 0 MH8 540 1 2 1 1 0
Lower Miller Hill
PG1 540 0 0 0 0 0 PG2 540 0 0 0 0 0 PG3 540 2 10 0 4 6 PG4 540 2 7 0 4 3 PG5 540 0 0 0 0 0 PG6 540 1 2 0 2 0 PG7 480 0 0 0 0 0 PG8 480 0 0 0 0 0 PG9 480 0 0 0 0 0
PG10 540 0 0 0 0 0 RM14 480 1 8 3 5 0 RM15 600 3 9 6 3 0
Sage Creek Rim
SCR1 540 0 0 0 0 0 SCR2 480 0 0 0 0 0 SCR3 540 0 0 0 0 0
Total – 14,520 17 55 12 24 19

November 12, 2012, through March 29, 2013,Eagle Summary Report Chokecherry and Sierra Madre Wind Energy Project
12 SWCA
Table 3. Summary of Golden Eagle Observations in the Chokecherry WDA.
Date and Time of
Observation Location
Number of Golden Eagle
Observed
Golden Eagle Observations per Survey
Minute
Golden Eagle Flight
Minutes
Flight Minutes in RSZ
Flight Behavior (minutes)
11/18/2012 12:57 CC2 1 0.0019 2 0 Soaring (2)
11/28/2012 16:06 CC13 2 (paired
flight) 0.0037 10 6 Gliding (6) Soaring (4)
12/20/2012 15:28 UI2 2 (paired
flight) 0.0033 4 0 Powered Flight (4)
1/8/2013 9:27 UI1 1 0.0024 1 0 Powered Flight (1)
1/16/2013 15:40 UH4 1 0.0021 1 1 Soaring (1)
2/11/2013 13:05 CC7 2 0.0042
1 (1st Obs.)
5 (2nd Obs.)
1 Circle Soaring (5) Soaring (1)
2/26/2013 16:31 17:14
SR1 2 0.0037
3 (1st Obs.)
1 (2nd Obs.)
3
Powered Flight (4)
Possibly the same individual
3/7/2013 13:29 HB3 1 0.0021 3 0 Circle Soaring (3)

November 12, 2012, through March 29, 2013,Eagle Summary Report Chokecherry and Sierra Madre Wind Energy Project
13 SWCA
Table 4.Summary of Golden Eagle Observations in the Sierra Madre WDA.
Date and Time of
Observation Location
Number of Golden Eagle
Observed
Golden Eagle Observations per
Survey Minute
Golden Eagle Flight
Minutes
Flight Minutes in RSZ
Flight Behavior (minutes)
11/12/2012 15:18 PG6 1 0.0019 2 2 Powered Flight (2)
11/15/2012 11:30 RM15 1 0.005 1 0 Powered Flight (1)
11/16/2012 9:17 CB2 1 0.0024 2 0 Gliding (2)
11/29/2012 12:00 PG4 2 (Paired
Flight) 0.0037 7 4 Soaring (4) Circle Soaring (3)
12/4/2012 9:30 RM15 1
0.005 1 0 Gliding/Powered
Flight (1) 12/4/2012
9:32 RM15 1 7 3 Gliding (1) Powered Flight (6)
12/6/2012 14:22 CB6 1 0.0042 2 1 Gliding (1)
Powered Flight (1) 12/6/2012
14:42 RM14 1 0.0021 8 5 Soaring (8)
12/11/2012 10:30 11:27
CB4 2 0.0037
2 (1st Obs.)
2 (2nd Obs.)
1
1st Obs. Hovering (1)
Powered Flight (1) Diving(1)
2nd Obs.
Gliding (1) Powered Flight (1)
Likely the same
individual
1/8/2013 14:25 MH8 1 0.0019 2 1 Powered Flight (2)
2/5/2013 12:30 CB1 1 0.0037 4 2
Gliding (2) Soaring (1)
Powered Flight (1) 2/15/2013
10:40 CB6 1 0.0042 4 0 Circle Soaring (4)
2/19/2013 9:13 CB1 1 0.0037 1 1 Powered Flight (1)
3/28/2013 10:30 PG3 2 (Paired
Flight) 0.0037 10 4 Circle Soaring (10)

This page intentionally left blank

Appendix A:
Revised 2012-2013 800-meter Raptor Survey Protocols Chokecherry and Sierra Madre Wind Energy Project

This page intentionally left blank

Revised 2012-2013 800-meter Raptor Survey Protocols
Chokecherry and Sierra Madre Wind Energy Project
Prepared for:
Power Company of Wyoming, LLC 555 17th Street, Suite 2400
Denver, CO 80202
Prepared by:
SWCA Environmental Consultants 295 Interlocken Blvd., Suite 300
Broomfield, CO 80021 (303) 487-1183 / Fax (303) 487-1245
November 2012

This page intentionally left blank

Appendix A: Revised 2012-2013 800-meter Raptor Survey Protocols
1 SWCA
The Power Company of Wyoming (PCW) recently initiated revisions to the methodologies currently used to survey for raptors at their Chokecherry and Sierra Madre Wind Energy Project (Project). Based on conversations with U.S. Fish and Wildlife Service (Service) personnel, and in an effort to collect data that are appropriate for use in the Service’s model that predicts the potential fatality rate of eagles for wind energy projects (hereafter, the Service’s model), raptor survey protocols were revised for the fall 2012 season and for future raptor survey efforts. On August 31, 2012, PCW provided the Service with a revised protocol for conducting eagle and raptor surveys at 40 800-meter point count survey sites throughout the Project. PCW began surveying the 40 locations at the beginning of the autumn 2012 survey season and it is anticipated that those survey efforts will continue through October 2012 at which time the revised protocols discussed in this document will be initiated. On September 28, 2012, the Service issued a letter recommending slight modifications to the August 31, 2012 protocols. This revised protocol addresses the comments made by the Service and specific responses to each comment made are provided in Attachment 1.
These survey methodology revisions are fully consistent with the recommendations for raptor surveys set forth by the Service in their Draft Eagle Conservation Plan Guidance (Draft ECP Guidance), the Eagle Conservation Plan Guidance Module 1 – Land-based Wind Energy Technical Appendices (Technical Appendices; as received from Kevin Kritz, Service Region 6, on August 4, 2012), and the Land-Based Wind Energy Guidelines, while still maintaining expansive coverage of the Project Site.
Year Two and Year Three long-watch raptor surveys were fully consistent with the recommendations set forth by the Service’s Draft ECP Guidance (Service 2011) and Land-Based Wind Energy Guidelines (Service 2012a), the Bureau of Land Management’s (BLM’s) Wildlife Survey Protocols for Wind Energy Development (BLM 2008), and the Wyoming Game and Fish Department’s (WGFD’s) Wildlife Protection Recommendations for Wind Energy Development (WGFD 2010). These surveys were very successful in identifying concentrated raptor use areas across the Project that could be used to design avoidance areas to minimize avian impacts. Additionally, long-watch survey data were instructive in showing the Project Site is not a strong migratory corridor for raptors, and the flight paths digitized from these data were used to identify high eagle use areas as recommended by the Service’s Technical Appendices (Service 2012b).
The revised raptor count protocols follow the 800-meter radius point count methodology recommended by the Service’s Technical Appendices (Service 2012b), and are also in accordance with the aforementioned guidance documents produced by the Service, BLM, and WGFD. PCW also sought consultation with Dr. Joshua Millspaugh (Professor of Wildlife Management, University of Missouri) to ensure the development of a rigorous sampling design that would result in the collection of data appropriate for the analysis methods and fatality model currently being used by the Service.
Based upon agency guidance and logistical considerations, the revised protocols were designed to include 60, 800-meter raptor count survey sites throughout the Chokecherry and Sierra Madre Wind Development Areas (WDAs) where turbine development is likely (Figures 1 and 2). Most of the 60 survey sites are identical to the original 40 sites identified in the August 31, 2012 protocols. However, some of those 40 sites were shifted slightly to

Appendix A: Revised 2012-2013 800-meter Raptor Survey Protocols
2 SWCA
accommodate the placement of the additional 20 survey sites and ensure that no overlap occurs between samples. Seven of the new sites correspond to raptor monitoring locations that were used in 2011 and spring 2012 survey efforts (RM2, RM7, RM9, RM10, RM12, RM14, and RM15). Efforts were made to resample as many of the previous sampling sites as possible. However, because of PCW’s Project re-design efforts identified in the Project Eagle Conservation Plan (ECP), many of the previous sampling locations are outside or on the very edge of the current development area and could not be included without violating the spatially balanced design that is critical to these protocols.
A spatially balanced sampling design was used to capture the variability in habitat conditions, terrain features, and turbine numbers and densities. Minimum convex polygons (MCPs) were placed around each of 10 discrete potential development areas that are separated by Turbine No-Build areas, topography, or other factors (Figures 1 and 2). MCPs were evaluated for differences in habitat characteristics, forage potential, and topography. While differences in habitat characteristics, forage potential, and topography occur among the 10 MCPs, within each MCP, these factors are similar and additional stratification beyond the MCP level was not necessary.
Using the “Create Spatially Balanced Points” tool in ArcGIS Geostatistical Analyst, 250 spatially balanced locations were generated within the MCPs. Using the spatially balanced points, survey sites were selected sequentially in a manner that was consistent with the recommendations made by the Service while ensuring that no overlap occurs between survey areas. Total number of sampling sites per MCP was based on the relative surface area and number of turbines in the MCP. Two primary selection criteria were used to select sampling sites. First, no overlap of sampling areas was permitted (sites had to be separated by more than 1,650 meters). Second, because of logistical considerations, sampling sites were required to be reasonably accessible from the existing road network and in a safe location. If a potential sampling location violated either of the selection criteria it was dropped and the next point was evaluated. Tables 1 and 2 provide the locations of each sampling site in the WDAs as well as information specific to the MCPs and sampling sites.
The first 36 survey sites that were selected correspond to locations that were identified in the August 31, 2012 protocols. These were sequentially selected using the spatially balanced points that were generated as part of the process described above while controlling for site overlap and logistical considerations for survey. Of the remaining 24 sites, 4 correspond with the original 40 sites with locations slightly shifted to avoid overlap with new sites, 7 correspond with the long-watch raptor monitoring sites that were surveyed in 2011 and spring/summer 2012, 3 were selected outside of the current probable turbine footprint, and 10 were selected using the remaining spatially balanced points. Some minimal micrositing of the new locations is anticipated to ensure maximum visibility of the survey areas as well as safe and consistent accessibility on the part of field personnel.

Appendix A: Revised 2012-2013 800-meter Raptor Survey Protocols
3 SWCA
Figure 1. Minimum Convex Polygons, 800-meter raptor count locations and survey perimeters for Chokecherry.

Appendix A: Revised 2012-2013 800-meter Raptor Survey Protocols
4 SWCA
Figure 2. Minimum Convex Polygons, 800-meter raptor count locations and survey perimeters for Sierra Madre.

Appendix A: Revised 2012-2013 800-meter Raptor Survey Protocols
5 SWCA
Table 1. Fall 2012-2013 Avian Monitoring Survey Locations for the Chokecherry WDA.
WDA MCP Site Name Survey Site Status Easting* Northing*
Chokecherry
Chokecherry
CC2 Original Fall 2012 Site 315166 4616447
CC3 Original Fall 2012 Site 318351 4619090
CC4 Original Fall 2012 Site 314539 4621971
CC5 Original Fall 2012 Site 317418 4614741
CC6 Original Fall 2012 Site 319335 4621702
CC7 Original Fall 2012 Site 313825 4618366
CC9 Original Fall 2012 Site 319294 4617332
CC10 New 2012 Survey Site 312770 4620262
CC11 New 2012 Survey Site 316501 4617656
CC12
New 2012 Survey Site, original CC1 site shifted north to eliminate overlap with RM7
317170 4622100
CC13
New 2012 Survey Site, original CC8 site shifted southeast to eliminate overlap with RM12
315993 4613871
RM7 2011-2012 Long-watch Site 315531 4620298
RM12 2011-2012 Long-watch Site 314228 4614294
Coal Mine Draw
CMD2 Original Fall 2012 Site 331648 4614732
CMD3 New 2012 Survey Site 330049 4612535
CMD4
New 2012 Survey Site, original CMD1 site shifted east to eliminate overlap with RM9
335437 4613524
RM9 2011-2012 Long-watch Site 332870 4612018
Hogback South
HB1 Original Fall 2012 Site 323818 4620014
HB2 Original Fall 2012 Site 326781 4620243
HB3 New 2012 Survey Site 328457 4621145
Smith Rim
SR1 Original Fall 2012 Site 323560 4617658
SR2 Original Fall 2012 Site 327318 4618336
SR3 New 2012 Survey Site 325362 4618367
Upper Hugus
UH1 Original Fall 2012 Site 328912 4615606
UH2 Original Fall 2012 Site 327099 4615081
UH3 New 2012 Survey Site 330772 4616091
UH4 New 2012 Survey Site 324853 4615321
Upper Iron Springs
UI1 Original Fall 2012 Site 323987 4612091
UI2 Original Fall 2012 Site 327702 4610001
UI3 New 2012 Survey Site 326242 4611221
RM10 2011-2012 Long-watch Site 325646 4609568 *UTM Zone 13, NAD83, Meters

Appendix A: Revised 2012-2013 800-meter Raptor Survey Protocols
6 SWCA
Table 2. Fall 2012-2013 Avian Monitoring Survey Locations for the Sierra Madre WDA.
WDA MCP Site Name Survey Site Status Easting* Northing*
Sierra Madre
Central Basin
CB1 Original Fall 2012 Site 326414 4597515
CB2 Original Fall 2012 Site 321986 4595452
CB4 Original Fall 2012 Site 329306 4599449
CB5 New 2012 Survey Site 327638 4599529
CB6
New 2012 Survey Site, original CB3 site shifted west to eliminate overlap with RM2
321942 4597660
RM2 2011-2012 Long-watch Site 323776 4597273
Miller Hill
MH1 Original Fall 2012 Site 302291 4600564
MH2 Original Fall 2012 Site 305677 4599125
MH3 Original Fall 2012 Site 307684 4592030
MH4 Original Fall 2012 Site 305024 4594675
MH5 Original Fall 2012 Site 309573 4590571
MH6 Original Fall 2012 Site 306043 4597131
MH7 New 2012 Survey Site 311561 4590443
MH8 New 2012 Survey Site 304412 4600385
Pine Grove
PG1 Original Fall 2012 Site 313663 4594801
PG2 Original Fall 2012 Site 311358 4598224
PG3 Original Fall 2012 Site 307172 4603361
PG4 Original Fall 2012 Site 314434 4597259
PG5 Original Fall 2012 Site 313730 4599682
PG6 Original Fall 2012 Site 312721 4603547
PG7 Original Fall 2012 Site 310058 4595825
PG8 Original Fall 2012 Site 311832 4594006
PG9 Original Fall 2012 Site 311187 4600886
PG10 New 2012 Survey Site 309753 4602508
RM14 2011-2012 Long-watch Site 309884 4599843
RM15 2011-2012 Long-watch Site 315948 4599668
Sage Creek Rim
SCR1 Original Fall 2012 Site 333505 4598194
SCR2 Original Fall 2012 Site 332596 4596407
SCR3 New 2012 Survey Site 330727 4595638 *UTM Zone 13, NAD83, Meters

Appendix A: Revised 2012-2013 800-meter Raptor Survey Protocols
7 SWCA
Landmarks will be identified and visible stakes will be placed around each survey location perimeter to provide distance references for field personnel completing survey efforts. The 800-meter radius survey areas of the new 60 point count locations provide coverage for approximately 35% of the probable turbine locations, which is greater than the 30% recommendation made by the Service (Service 2012b). Additionally, 46.7% of the raptor monitoring sites that were surveyed in 2011 will be resurveyed as part of the 60 point counts. Resurvey of 50% of all previous survey sites was not possible because many fall outside of the current project layout in Turbine No-Build areas and use of those sites would violate the spatially balanced study design in addition to sampling areas that are already known as high use areas for eagles and other raptors. Additionally, several sites that were only surveyed in spring/summer 2012 do not have a full year of data and would not be appropriate for comparison with ongoing and future data collection efforts. However, many of the 60 new survey sites overlap with areas previously surveyed as part of 2011 and 2012 raptor monitoring efforts. When these areas are included, 50.3% of the area surveyed as part of previous raptor monitoring efforts is within the perimeter of the 60 new point count survey sites.
Surveys will be conducted at each site for one hour per guidance in the ECP Technical Appendices (Service 2012b). Three avian technicians will each survey two locations per day for a total of 6 locations per day and 60 locations in a 10 day period. Each location will be surveyed twice per month. A schedule for all 60 raptor count locations was designed to provide survey coverage across all daylight hours for each of the 60 sites. The schedule was also designed such that the six raptor count surveys conducted on any given day are separated temporally and spatially to ensure independence of any observations that are made.
Avian technicians will be equipped with binoculars, spotting scopes, laser rangefinders, and aerial maps to assist with accurate detection and documentation of all raptors observed within the 800-meter survey area. Each aerial map is displayed with relevant landforms occurring in the area, locations of stakes, and concentric rings at each 200-meter interval to facilitate accurate distance estimation (Attachment 2). Each raptor flight path is recorded by technicians on the provided aerial maps. Additional data collected include species, number of individuals per observation, age, sex, behavior, bearing to bird, distance to bird, heading of bird, altitude of bird, the beginning and ending time for each observation, interactions with other birds, and hourly weather data among other variables (Attachment 3).
Surveys at the 60 800-meter raptor counts will begin in November 2012 and are scheduled to continue bi-weekly at each location through August of 2013. Surveys during winter months will be completed on the same schedule as the remainder of the year and efforts will be made to survey at least 50% of all locations twice per month during winter. However, winter surveys are subject to cancellation or delay based on weather conditions and safety of the field technicians.

Appendix A: Revised 2012-2013 800-meter Raptor Survey Protocols
8 SWCA
REFERENCES
Bureau of Land Management (BLM). 2008. Wildlife Survey Protocols for Wind Energy Development.
U.S. Fish and Wildlife Service (Service). 2011. Draft Eagle Conservation Plan Guidance. Available online at http://www.fws.gov/windenergy/. Accessed December 2011.
———. 2012a. Land Based Wind Energy Guidelines. Wind Turbine Guidelines Advisory Committee. U.S. Fish and Wildlife Service, Department of the Interior, Washington D.C. Available online at http://www.fws.gov/windenergy/docs/WEG_final.pdf. Accessed August 2012.
———. 2012b. Eagle Conservation Plan Guidance Module 1 – Land-based Wind Energy Technical Appendices. Received from Kevin Kritz, Service Region 6, on August 4, 2012.
Wyoming Game and Fish Department (WGFD). 2010. Wildlife Protection Recommendations for Wind Energy Development in Wyoming. Wyoming Game and Fish Commission Approved November 17, 2010. Wyoming Game and Fish Department, Cheyenne, WY.

Appendix A: Revised 2012-2013 800-meter Raptor Survey Protocols
SWCA
ATTACHMENT 1 Response to Survey Recommendations Made in the Service’s
September 28, 2012 Letter

This page intentionally left blank

SWCA
The following recommendations were made by the Service in the September 28, 2012 letter to Garry Miller (PCW) regarding Eagle Use Sampling Considerations and Recommendations for the proposed Chokecherry-Sierra Madre Wind Energy Development Project. A response is provided to document how each recommendation has been incorporated into the revised 800-meter point count survey protocols. Recommendations are presented in italics below.
1. We recommend focusing sampling efforts within the most recently proposed project
footprint in order to quantify eagle use in areas where turbines are planned for location. By collecting eagle and raptor use data in areas of likely development, we believe it will be easier to obtain a more reliable estimate of risk to eagles in these areas, from which more informed, site-specific, predictions can be made.
Response: The revised protocols and placement of the 60 point count sites are based on the most recent proposed Project footprint and probable turbine locations. The most recent Project footprint reflects PCW’s commitment to the Turbine No-Build areas identified in the Project ECP.
2. Although we recommend concentrating sampling effort within the project footprint as
stated above, we believe it also would be prudent to establish additional sample points outside of the currently proposed footprint in areas of potential development. Adding points in areas of possible alternative turbine layouts will provide data to assess the impact of those alternatives, which may be necessary if survey results identify areas of high eagle use within areas currently proposed for development. Without eagle use data outside of the proposed footprint, it would be difficult to show that the relocation of turbines outside of the currently proposed project footprint would avoid and minimize impacts to eagles. Without these data, the only likely alternatives would be a reduction in the total number of turbines, or a reduction in the spacing between turbines in areas where avian and raptors surveys were conducted. Response: Three of the 60 point count survey sites (RM15, HB3, and UH3) are placed outside of the most current probable turbine locations. Several additional locations (e.g., CMD2, HB2, RM10, SR2) have a substantial portion of their survey areas that fall outside of the current probable turbine locations. Each of these sites provides survey coverage in areas of the Project Site where turbines could be located if the current probable turbine location footprint changes.
3. We recommend resampling at least fifty percent of the raptor point counts from previous years: this will help distinguish between apparent changes in documented eagle use caused by different point locations and associated differences in detectability, versus actual changes in habitat use. This is an important consideration, because the number of eagles and their location on the landscape is likely to vary across years (e.g., not every nest is active every year), making it difficult to account for inter-annual variability, which might lead to inaccurate conclusions about the risk of eagle fatalities. For example, observing fewer eagles at a second set of survey points could be misinterpreted as an area of lower eagle use, when in fact the number of eagles and eagle use across the landscape decreased due to other factors. In this

SWCA
example, the use (and hence risk) might have been the same for all survey points, but sampling different points across years would lead to the erroneous conclusion. Resampling some points across years can reduce this uncertainty by creating an index or allow for scaling of observations across years.
Response: Nearly 50% (46.7%) of the raptor monitoring sites that were surveyed in 2011 will be resurveyed as part of the 60 point counts. Resurvey of 50% of previous survey sites is not possible because many fall outside of the current project layout in Turbine No-Build areas. Additionally, several sites that were only surveyed in spring/summer 2012 do not have a full year of data and would not be appropriate for comparison with ongoing and future data collection efforts. Many of the 60 new survey sites overlap with areas previously surveyed as part of 2012 raptor monitoring efforts. When those areas are included, 50.3% of the area surveyed as part of 2012 raptor monitoring efforts is within the perimeter of the 60 new point count survey sites.
4. Previous long-watch raptor surveys were based on an unlimited radius, and analysis
of data from these surveys suggests that the detectability of eagles dropped off after 600 to 800 meters. We recommend using a distance of no more than 800 meters for point counts intended to collect data on eagles and other large raptors. This recommendation is found in our draft Eagle Conservation Plan Guidance (Service 2012, Appendix C, p. 18) and in other literature (e.g., Strickland et al. 2011). While it is acceptable to collect data on eagles and other raptors beyond 800 meters (e.g., location, flight height, flight path)—since they may be useful to identify travel corridors and areas of eagle use—the collection of this information should not distract surveyors from collecting data within the 800-meter point count. In addition, because only those data collected within 800 meters will be used in the models to predict eagle fatalities, data collected at distances more than 800 meters should be separated from data collected within 800 meters.
Response: Previous long-watch raptor surveys recorded any eagle observed to help identify high use areas per the protocols developed collaboratively between the Service, BLM, and PCW. The analysis of detectability of eagles presented in the Service’s comments does not consider that the reason eagle use was higher within 800 meters of previously sampled sites is because those sites were placed on ridgelines and terrain features known to attract or concentrate eagle use, making the likelihood of observing an eagle within 800 meters of a survey site higher than if the point was placed randomly in the landscape where varying terrain features may or may not occur. The implementation of the previous surveys was extremely successful and resulted in the development of Turbine No-Build areas that will avoid impacts to eagles and other avian species in the majority of the high use areas that were identified. To be consistent with with the Service’s Draft ECP Guidance, the Service’s eagle risk model, and the recommendation made above, all surveys will be conducted using a distance of 800-meters.

SWCA
5. Based on recommendations in the draft Eagle Conservation Plan Guidance, the sampling goal should provide a “minimal spatial coverage of at least 30% of the project footprint” (i.e., the total area sampled in any given year should be thirty percent of the total project footprint) (Service 2012, Appendix C, p. 1 8). We recognize that even this level of effort will not provide specific information for seventy percent of the project area; however, it may be assumed that the information is representative of the remaining project area, provided the sample points are appropriately located (e.g., stratified and spatially balanced). To achieve the desired goal of at least 30 percent coverage of the Chokecherry Sierra Madre Proposed Project footprint, we calculate up to 70 survey points are needed, depending on how the project footprint is portrayed.
Response: Using the conceptual turbine footprint that PCW provided to the Service, 35% of all turbine locations fall within the 800-meter survey perimeters of the 60 point count sites. As stated above, the entirety of 3 sites and substantial portions of 3 others fall outside of the probable Project footprint in areas where turbines could be placed. These provide adequate coverage of areas outside of the current probable turbine footprint. When combined with the 800-meter radius surveyed areas from previous survey events (2011 and spring/summer 2012), 42% of probable turbine locations are included within the perimeter of 800-meter point count sites.
6. We recommend sample locations be stratified by features of the landscape that may
influence eagle and raptor activity, such as distinct geographic/topographic elements (e.g., escarpments), vegetation (if appropriate), and concentrated prey base. Doing so will allocate sampling points across the project in proportion to their occurrence on the landscape. A common sampling design in use today is the generalized random tessellation stratified sampling design (GRTS). We remain concerned that there is insufficient information about eagle habitat use associated with important eagle use areas including: active nests; concentrated prey base including grouse leks, prairie dog colonies, and reservoirs; as well as topographic features such as Miller Hill. Therefore, we recommend that some sample points be located near these important eagle use areas. Doing so would help with identifying additional avoidance areas or alleviating concerns for increased risk associated with these areas.
Response: The spatially balanced design that is discussed in the revised protocols above is reflective of the variability in habitat conditions, terrain features, and turbine numbers and densities. The revised protocols describe the methods used to select sites and the sampling strata and selection criteria that were used to place sites. The 60 sampling sites described in the revised protocols provide coverage in areas that provide some level of foraging, contain sage-grouse leks, and have variable topography that could influence eagle and raptor behavior. Site placement near active eagle nests is difficult because most nests have been avoided and are within the Turbine No-Build areas along the Bolten Rim or North Platte River corridor and, as seen in the data previously collected for the Project, active nests locations change each year.

SWCA
7. Based on recommendations in the Service’s Eagle Conservation Plan Guidance, count periods should be one to two hours long (Service 2012, Appendix C, p. 18). If longer survey periods are used (e.g., four to six hours), the surveys should be divided into smaller units such as one or two hour blocks (or the actual time of eagle observations recorded), so that the influence of time of day can be evaluated (e.g., in relation to when turbines are inactive). Response: Surveys will be conducted at each site for one hour per guidance in the ECP Technical Appendices (Service 2012b). As stated in the revised protocols, the survey methods follow the 800-meter radius point count methodology recommended by the Service’s Technical Appendices to the Draft ECP Guidance, and are consistent with other guidance documents produced by the Service, BLM, and WGFD.
8. We recommend the protocol include a representative distribution of sampling events across all daylight hours across all point locations and seasons. Collecting data “evenly” across time and space should reduce any potential bias associated with locations, seasons, and time of day. This may also make it possible to evaluate how time of day influences eagle use of the site or when eagles are more likely to use specific topographic features. In addition, surveys should include multiple sampling events in each season per point.
Response: As stated in the revised protocols, the survey methods follow the 800-meter radius point count methodology recommended by the Service’s Technical Appendices to the Draft ECP Guidance, and are consistent with other guidance documents produced by the Service, BLM, and WGFD. The sampling schedule will provide survey coverage across all daylight hours for each of the 60 sites. The schedule also makes certain that the six raptor count surveys conducted on any given day are separated temporally and spatially to ensure independence of any observations that are made.
9. We recommend locating survey sampling points at least 800 meters (0.5 mile) from
active eagle and ferruginous hawk nests to limit disturbance. It may be possible to reduce this distance if topographic features create a visual barrier between observers and the nest.
Response: Should an eagle or ferruginous hawk nest become active within 800 meters of a survey site, PCW will coordinate with the Service and BLM to evaluate the most appropriate methods to take to ensure that survey activities do not disrupt nesting. With PCW’s Turbine No-Build areas and Project re-design efforts, most eagle and raptor nests in the Project Site have been avoided by 800 meters or more. However, some survey sites are located within 800 meters of historically active nests. As stated above, sampling locations have been selected in a spatially balanced, stratified manner using methods recommended by the Service. Maintaining the sites that are located within 800 meters of historically active nests is necessary to maintain this spatially balanced design. Since Project survey efforts began in 2008, no active ferruginous hawk nests have been identified.

SWCA
10. We recommend data collection include identification of eagle species and their flight
minutes within the 800-meter point count. Additional data collection could include, but should not necessarily be limited to (in relative order of importance): age and sex (if possible), flight path, flight behavior (e.g., soaring, kiting), activity (e.g., territory defense, foraging), interactions with other birds, flight height, obvious prey items, time observed outside of the 800-meter point count, and time perched. It is acceptable to record detections beyond 800-meters as these can provide additional information about eagle and raptor use of the project area. However, collecting data beyond 800-meters should not detract from observations made within the 800-meter point count. Response: Only those observations occurring within 800 meters of the survey sites will be recorded. As described in the protocols and illustrated on the data collection forms in Attachment 3, data collection efforts will provide all of the information recommended by the Service.
11. We recommend collecting data on all raptors to the extent feasible; however, collecting data on other raptors should not preclude the collection of data on eagles. Response: Data on all raptors and other species of interest will be collected in a manner identical as that used for eagles unless those efforts interfere with data collection for eagles.
12. Based on eagle use data collected between April of 2011 and April of 2012, eagle activity relative to sampling effort appears to be higher in the winter and summer periods (Table 1). Higher eagle activity in the summer likely corresponds to the time during which adults are actively feeding young and when young are learning to fly. Higher eagle activity in the winter may be related to the presence of migrant eagles, or could be due to the location of survey points. Because data were not collected following the above recommendations during the summer of 2012, we recommend the collection of eagle and raptor use data continue through the 2013 nesting season (at least through August of 2013) to evaluate this potential season of higher use. Response: Data will be collected through August of 2013. Our interpretation of eagle use in winter and summer periods differs from the Service’s interpretation. The Service’s interpretation assumes that each minute of eagle use is independent and evenly distributed across the landscape. Based on the survey data, it is clear that most of the eagle minutes recorded across all seasons are not independent and that the simple statistic of flight minutes per survey minute does not consider that observations are not independent in space or time and therefore mischaracterizes seasonal use and risk. As an example, 72 of the 141 minutes (51%) of winter use observed in the Project Site occurred at two sites on two days. On December 8, 2011, 35 eagle flight minutes were recorded at RM11 and on March 9, 2012 37 minutes of eagle use were recorded at RM14. On both days, field technicians wrote on datasheets that the use was associated with 2-3 individuals who were using the area for a long period of time. If the three eagles at RM14 had not been observed on March 9, no winter use would

SWCA
have been observed within 800 meters of that sampling site. Similarly, if the use at RM11 would not have been observed on December 8, only 3 minutes of eagle use over would have been observed at that site during winter months and use would have been decreased by 95%. The observed activity on December 8 and March 9 is indicative of short duration, concentrated use by a few individuals rather than of high eagle use of the Project throughout the entire winter period. The data also indicate that for most of the Project Site there is no risk or very low risk to eagles during winter. Summer data are very similar to winter data. During summer 2011, only 71 eagle minutes were recorded. Nearly 60% of these minutes were associated with only 3 observations of individual circle soaring birds at RM14 and RM5. This indicates that the high use the Service cites is not from adults feeding young or young learning to fly. Rather, the behavior observed indicates that this is localized use by individual birds utilizing thermals created by warm summer temperatures.
13. In several locations, the document states that it was “fully compliant” with recommendations by the U.S. Fish and Wildlife Service (Service). First, it is important to understand that the draft Eagle Conservation Plan Guidance is voluntary; consequently we prefer to use the term “consistent with” rather than “compliant with” when describing recommendations found within the Eagle Conservation Plan Guidance. Second, we do not believe that the protocol provided by PCW is, in fact, consistent with the Eagle Conservation Plan Guidance for numerous reasons, one key reason being that the limited number of 800-meter survey points do not provide the recommended minimum 30 percent coverage of the project footprint. Additionally, we do not believe it is scientifically justifiable to combine survey points from multiple years in order to meet the minimum recommended standard of 30 percent coverage: the minimum 30 percent coverage should occur within each individual year. Response: The recommended changes have been made. The term “compliant” has been changed to “consistent”. As stated above, 35% of the probable turbine locations will be surveyed using the revised protocols.
14. The document makes a definitive statement about “unrealistic projections” concerning eagle risk. This statement is based on several assumptions, including that previous survey efforts correctly identified areas of high eagle use. One of the reasons for increasing the spatial coverage in 2012-2013 is to increase our confidence in understanding eagle and raptor use across the Project area. Because substantial uncertainty exists as a result of the limited amount of spatial and temporal survey coverage used to document impacts and relative risk to eagles, the Service believes our projections concerning risk to eagles are realistic and clearly demonstrate the need for increased coverage. In addition, our letter of August 10, 2012, identified numerous areas of potential high eagle use that are not currently included in the avoidance areas, such as the golden eagle nest in the southwest corner of Sierra Madre. Our letter also identified the presence of high density prey base, proximity of sage grouse leks and other habitat features that are used by eagles. Because these habitat features (and others) are not included in the proposed avoidance areas, the projections of risk and high eagle fatalities identified by the Service are possible.

SWCA
Response: The comments made above have been addressed in the revised protocols, the prey-base report submitted to the Service, and the Project ECP. We concur that within the context of the Service’s eagle fatality model, the revised protocols will help address uncertainties.
15. The data sheet attached to the protocol provided by PCW does not appear to have a means of recording flight path in data. It should be clear how flight path data will be collected on the existing data sheet, or additional datasheets should be included if there is more than one. Response: Attachment 2 contains an example figure that is used to record flight paths for eagles and other raptors. Additionally, multiple rows of data are recorded for each eagle observed which results in multiple spatial points per individual bird. Fitting a line between each point for each observed eagle provides another mechanism to create flight paths. The methods used to collect data are described in the revised protocols.

This page intentionally left blank

SWCA
ATTACHMENT 2 Example Aerial Map Used to Map Flight Paths during 800-meter Raptor
Count Surveys

This page intentionally left blank

A1-1 SWCA
Aerial map example. Numbers next to site markers indicate distance from raptor monitoring location to the site marker location. Concentric rings around raptor monitoring location indicate 200-meter distance intervals to aid in estimation of distance. Other features on the landscape (roads, rock cairns, etc.) are also noted on each map to aid in distance and location estimation.

This page intentionally left blank

SWCA
ATTACHMENT 3 Data Sheets Used to Collect Data during 800-meter Raptor Count Surveys

This page intentionally left blank

PCW 2012-2013 Raptor Survey
Field Observer:
Survey Location:
Start time:
End time:
Date:
Page: ____ of _____
Target
# Obs
# Species
# Birds
Age Sex Behav Bearing
to Bird (°) Distance
to Bird (m) Angle of Bird (°)
Heading of Bird
0- 30
30-150
150+ Time Begin
Time End

PCW 2012-2013 Raptor Survey Notes
Field Observer:
Survey Pt:
Date:
Page: _____ of _____
Other species and Notes.
Weather Conditions
Wind
Time Sky Dir Spd Temp (°F)
Incidental Species Observations for eagles and raptors note distance and bearing

April 1 through June 21, 2013, Eagle Summary Report
Chokecherry and Sierra Madre Wind Energy Project
Prepared for:
Power Company of Wyoming, LLC
555 17th Street, Suite 2400
Denver, Colorado 80202
Prepared by:
SWCA Environmental Consultants
295 Interlocken Blvd., Suite 300
Broomfield, Colorado 80021
(303) 487-1183 / Fax (303) 487-1245
July 2013

This page intentionally left blank

April 1 through June 21, 2013, Eagle Summary Report
Chokecherry and Sierra Madre Wind Energy Project
ii SWCA
EXECUTIVE SUMMARY
Between April 1 and June 21, 2013, SWCA Environmental Consultants performed raptor
count surveys as part of Power Company of Wyoming, LLC’s (PCW’s) ongoing avian survey
program at the Chokecherry and Sierra Madre Wind Energy Project (Project) site. The survey
period captures nesting, incubation and chick rearing periods within the Project site. This
report documents use during these eagle use periods.
For this survey period, 5 minutes of golden eagle (Aquila chrysaetos) use and 1 minute of
unknown eagle1 use were recorded within the Project site during 19,874 survey minutes
(331.23 hours) for 0.0003 flight minute per minute of survey2. Of the recorded eagle flight
minutes, 50.0% were outside the Rotor Swept Zone (RSZ). By altitudinal classification,
33.3% of the eagle flight minutes were below the RSZ (0 to 30 meters above ground), 50.0%
of the eagle flight minutes were within the RSZ (30 to 150 meters), and 16.7% of the eagle
flight minutes were above the RSZ (above 150 meters).
For the Chokecherry Wind Development Area (WDA), 1 minute of golden eagle use and 1
minute of unknown eagle use were recorded during 10,200 survey minutes (170.0 hours) for
0.0002 flight minute per minute of survey. In total, 170 survey sessions were conducted
during which 2 eagle observations were recorded during two of the sessions. The observation
time for each observation was one minute, rounded up to the nearest whole minute. Of the
recorded use in the Chokecherry WDA, 50% occurred outside the RSZ.
For the Sierra Madre WDA, 4 minutes of golden eagle use were recorded during 9,674 survey
minutes (161.23 hours) for 0.0004 flight minute per minute of survey. In total, 162 survey
sessions were conducted during which 2 golden eagle observations were recorded during two
of the sessions. Observation times ranged between 1 minute and 3 minutes, rounded up to the
nearest whole minute. Of the recorded use in the Sierra Madre WDA, 50% occurred outside
the RSZ.
During the survey period, there were no observations of bald eagles (Haliaeetus
leucocephalus).
1 This eagle observation was unable to be identified to species level due to the individual circling overhead at a
very high altitude. 2 For data analysis purposes, the single unknown eagle observation will be considered along with golden eagle
observations recorded during this survey period.

April 1 through June 21, 2013, Eagle Summary Report
Chokecherry and Sierra Madre Wind Energy Project
iii SWCA
TABLE OF CONTENTS
Page
EXECUTIVE SUMMARY ........................................................................................................ ii
INTRODUCTION AND PROJECT DESCRIPTION ............................................................... 1
RESULTS AND DISCUSSION ................................................................................................ 4
Discussion of Chokecherry Use Observations ....................................................................... 5
Discussion of Sierra Madre Use Observations ....................................................................... 6
COMPARISON TO PREVIOUS RESULTS ............................................................................ 6
LIST OF FIGURES
Figure Page
1 Minimum Convex Polygons, 800-meter raptor count locations and survey perimeters
for Chokecherry. .................................................................................................................. 2
2 Minimum Convex Polygons, 800-meter raptor count locations and survey perimeters
for Sierra Madre. .................................................................................................................. 3
LIST OF TABLES
Table Page
1 Number of Survey Minutes, Days, Individuals, Golden Eagle Flight Minutes, and
Height Categories for all Survey Locations in the Chokecherry WDA. ............................. 8
2 Number of Survey Minutes, Days, Individuals, Golden Eagle Flight Minutes, and
Height Categories for all Survey Locations in the Sierra Madre WDA. ............................. 9
3 Summary of Golden Eagle Observations in the Chokecherry WDA. ............................... 10
4 Summary of Golden Eagle Observations in the Sierra Madre WDA. ............................... 10
Appendices
Appendix A: Revised 2012-2013 800-meter Raptor Survey Protocols

April 1 through June 21, 2013, Eagle Summary Report
Chokecherry and Sierra Madre Wind Energy Project
1 SWCA
INTRODUCTION AND PROJECT DESCRIPTION
Surveys described in this report are part of the avian survey program directed towards
identifying eagle and raptor use across the Chokecherry and Sierra Madre Wind Energy
Project (Project) site. The survey data will be used for modeling eagle collision risk and
developing avoidance measures and Best Management Practices to reduce potential Project
impacts to eagles, to the extent practicable. All protocols and survey methodologies used to
assess avian species in the Project site during surveys in 2011, 2012, and 2013 were
developed in consultation with the U.S. Fish and Wildlife Service (Service), and are in
accordance with recommendations made by the Service, the Bureau of Land Management
(BLM), and the Wyoming Game and Fish Department (WGFD). Appendix A contains the
protocols used to collect eagle use data for the period of this report.
This report summarizes the data from the April 1 to June 21, 2013 raptor counts and captures
nesting, incubation and chick rearing periods within the Project site. It is one of four reports
covering 12 consecutive calendar months from August 2012 to August 2013. Report 1 covers
the period of August 20 to November 9, 2012; report 2 covers the period of November 12,
2012, to March 29, 2013; and this report covers the period of April 1 to June 21, 2013. The
final report will roughly correspond to fledging and summer use.
In 2012, based on the extensive avian data that have been collected for the Project, Power
Company of Wyoming, LLC (PCW) substantially re-designed the Project and identified
Turbine No-Build Areas. These designated Turbine No-Build Areas have relatively higher
eagle use than other areas of the Project and PCW has committed to not build turbines in these
areas. This will substantially contribute to avoiding and minimizing collision risk to eagles.
Next, to assess use by eagles and other raptors in the remaining potential wind development
areas (WDAs), surveys were initiated during August 2012 at 40, 800-meter (m) survey
locations across the probable turbine footprint outside of the Turbine No-Build Areas. After
further consultation with the Service, the survey program was increased to 60, 800-m survey
locations (Figures 1 and 2) for surveys occurring from mid-November 2012 through August
2013. The increased survey locations achieve coverage of 30% of the probable turbine
locations for the Project as recommended by the Service. The addition of 20 survey locations
also allowed the inclusion of seven sites that were previously surveyed in 2011 and early 2012
for further analysis.
Selection of the 60, 800-m survey locations was achieved using a spatially balanced sampling
design used to capture the variability in habitat conditions, terrain features, and turbine
numbers and densities. Minimum convex polygons3 (MCPs) were placed around potential
turbine construction areas in the Project site that are separated by the Turbine No-Build Areas
established by PCW (Figures 1 and 2). MCPs were evaluated for differences in habitat
characteristics, forage potential, and topography. While differences in habitat characteristics,
3 MCPs were generated using the ArcGIS Spatial Analyst minimum bounding geometry function with the
minimum convex hull option selected.

April 1 through June 21, 2013, Eagle Summary Report
Chokecherry and Sierra Madre Wind Energy Project
2 SWCA
Figure 1.Minimum Convex Polygons, 800-meter raptor count locations and survey perimeters for Chokecherry.

April 1 through June 21, 2013, Eagle Summary Report
Chokecherry and Sierra Madre Wind Energy Project
3 SWCA
Figure 2. Minimum Convex Polygons, 800-meter raptor count locations and survey perimeters for Sierra Madre.

April 1 through June 21, 2013, Eagle Summary Report
Chokecherry and Sierra Madre Wind Energy Project
4 SWCA
forage potential, and topography occur among the 10 discrete MCPs, within each MCP these
factors are similar and additional stratification beyond the MCP level was not necessary.
Using Geostatistical Analyst tools in ArcGIS, spatially balanced survey locations were
sequentially selected in a manner that is consistent with the recommendations made by the
Service while ensuring that no overlap occurs between survey locations. Total number of
sampling locations per MCP was based on the relative surface area, number of turbines, and
turbine densities in each MCP.
Raptor surveys documented in this report occurred from April 1 through June 21, 2013.
Surveys occurred at 60 survey locations across the Project site, with 31 survey locations in the
Chokecherry WDA and 29 survey locations in the Sierra Madre WDA (Figures 1 and 2).
Surveys were designed to occur at each of the 60 survey locations for 1 hour per survey date
in accordance with guidance from the Service. Three avian technicians each surveyed two
survey locations per day resulting in surveys of six survey locations per day and 60 survey
locations in a 10-day period. The schedule was designed and implemented to provide survey
coverage across all daylight hours for each of the 60 survey locations. The schedule was also
designed such that the six raptor count surveys conducted on any given day were separated
temporally and spatially to increase the likelihood of independence of any observations made.
Each survey location was scheduled to be surveyed twice per month; however, inclement
weather and associated safety concerns occasionally limited the technicians’ ability to
successfully complete surveys. The majority of the 60 survey locations were visited five to six
times during the survey period. All sites were scheduled to be visited six times during this
survey period; however, an intense late winter storm in early April caused the cancellation of
a full week’s surveys due to safety and accessibility concerns.
Surveys were completed across all daylight hours in accordance with the Service’s
recommendations. Each raptor flight path was recorded by technicians on aerial maps.
Additional data collected included species, number of individuals per observation, age, sex,
behavior, azimuth to bird, distance to bird, heading of bird, altitude of bird, the beginning and
ending time for each observation, interactions with other birds, and hourly weather data
among other variables. Appendix A to this report contains the detailed protocols used to
collect the data.
RESULTS AND DISCUSSION
During the April 1 to June 21, 2013 survey period, 322 individual surveys were conducted
across both WDAs for a total of 19,874 survey minutes (331.23 hours; Tables 1 and 2).
Generally, survey minutes were evenly distributed across the 60 survey locations but varied
slightly at some survey locations due to safety and accessibility issues caused by inclement
weather.
During the April 1 to June 21, 2013 survey period, three golden eagles (Aquila chrysaetos)
and an unknown eagle were observed in flight for a total of 6 minutes (Tables 1 and 2).
Overall eagle use during this survey period was 0.0003 flight minute per minute of survey.
This use value is the total use without consideration of flight heights and proportion of time in
the Rotor Swept Zone (RSZ). Use in the Chokecherry WDA during this survey period was

April 1 through June 21, 2013, Eagle Summary Report
Chokecherry and Sierra Madre Wind Energy Project
5 SWCA
0.0002 flight minute per minute of survey while use in the Sierra Madre WDA was 0.0004
flight minute per minute of survey. No bald eagles (Haliaeetus leucocephalus) were detected
during the April 1 to June 21, 2013 survey period.
All eagle flight minutes recorded during the April 1 to June 21, 2013 survey period were
subdivided into altitudinal categories as recorded during field surveys (below RSZ = 0–30 m,
within RSZ = 30–150 m, above RSZ = above 150 m) to determine the proportion of time
eagles flew through the RSZ (30–150 m) and therefore at risk of collision. These altitudinal
categories were developed to reflect the actual turbine heights that will be used for the
Project. Of the 6 total eagle flight minutes, 2 minutes (33.3%) were recorded within the 0–30
m bin, 3 minutes (50%) were recorded within the 30–150 m bin, and 1 minute (16.7%) was
recorded above 150 m (Tables 1 and 2). When considering observed flight heights, total use
across the Project site in the RSZ where collisions could occur was 0.0002 minute of flight
time per minute of survey, a decrease of nearly 33.3% compared to total flight minutes.
Results and Discussion of Chokecherry Use Observations
Surveys in the Chokecherry WDA were conducted at 31 locations for a total of 10,200
minutes during the April 1 to June 21, 2013 survey period. During this survey period, eagles
were observed in flight at two of the 31 survey locations for a total of 2 minutes (Table 1).
Eagle use for the Chokecherry WDA during this survey period was calculated as 0.0002 flight
minute per survey minute.
None of the eagle flight minutes occurred within the 0–30 m altitudinal bin, 1 minute (50%)
occurred within the 30–150 m bin, and 1 minute (50%) occurred above 150 m (Table 1). In
the Chokecherry WDA, 50% of all use occurred outside of the RSZ where eagles are not at
risk for collision.
The two sites in the Chokecherry WDA with eagle observations occurred within two of the
MCPs: Nevins Ridge and Hogback (Figure 1). Survey locations within the Smith Rim, Upper
Hugus, Coal Mine Draw, and Upper Iron Springs MCPs all had zero eagle observations
during the April 1 to June 21, 2013 survey period. Within the Nevins Ridge MCP, a golden
eagle was observed at CC3; and in the Hogback MCP, an unknown eagle was observed at
HB2 (Table 1).
Within the Nevins Ridge MCP, at CC3 one golden eagle was observed on one survey date for
a total of 1 flight minute, which occurred in the 30–150 m height category. Over the course of
the 1 flight minute, this individual’s behavior was recorded as soaring.
Within the Hogback MCP, at HB2 one unknown eagle was observed on one survey date for a
total of 1 flight minute, which occurred above 150 m. This individual was not able to be
identified to species level due to the high altitude of flight and the short observation time.
Over the course of the 1flight minute, this individual’s behavior was recorded as both soaring
and gliding.

April 1 through June 21, 2013, Eagle Summary Report
Chokecherry and Sierra Madre Wind Energy Project
6 SWCA
Results and Discussion of Sierra Madre Use Observations
In the Sierra Madre WDA, surveys were conducted for 9,674 minutes during the April 1 to
June 21, 2013 survey period. During this survey period, golden eagles were observed in flight
at two of 29 survey locations for a total of 4 minutes (Table 2). Golden eagle use for the
Sierra Madre WDA during this period was 0.0004 flight minute per survey.
Two of the 4 golden eagle flight minutes (50%) occurred within 0–30 m height category, 2
minutes (50%) occurred within 30–150 m, and 0 minutes occurred above 150 m (Table 2). In
the Sierra Madre WDA, 50% of all use occurred outside of the RSZ where eagles are not at
risk for collision.
The two sites with eagle observations in the Sierra Madre WDA occurred within two of the
MCPs: Lower Miller Hill and Sage Creek Basin (Figure 2). Survey locations within the Upper
Miller Hill and Sage Creek Rim MCPs all had zero eagle observations during the April 1 to
June 21, 2013 survey period. Within the Lower Miller Hill MCP, one golden eagle was
observed at RM14. Within the Sage Creek Basin MCP, only one golden eagle was observed at
CB1 (Table 2).
Within the Sage Creek Basin MCP, at CB1 one golden eagle observation was made on one
survey date for a total of 3 flight minutes. One flight minute occurred within the 0–30 m
height category, and 2 flight minutes occurred within the 30–150 m height category. Over the
course of the three flight minutes, this individual’s behavior was recorded as gliding and
powered flight (Table 4).
Within the Lower Miller Hill MCP, at RM14 one golden eagle was observed on a single date
for a total of 1 flight minute. This flight minute occurred in the 0–30 m height category, and
the individual’s behavior was recorded as foraging (Table 4).
The majority of golden eagle flight minutes recorded within the Sierra Madre WDA during
the April 1 to June 21, 2013 survey period are not independent as 75% were generated by a
single eagle on one survey date (Table 4, 3 minutes of flight time at CB1 on April 1).
Treatment of these data as independent observations will overstate the expected impacts to
eagles. In the case of the data described in the paragraph above, treating the 3 minutes of
observed golden eagle use as independent is the equivalent of stating that three golden eagles
were observed in flight for one minute each. This assumption of independence is not valid for
these data and should be accounted for in future planning efforts and analysis of potential
Project impacts to eagles.
COMPARISON TO PREVIOUS RESULTS
As a result of PCW’s Project re-design, eagle use in the WDAs was substantially lower during
the April 1 to June 21, 2013 survey period than the same periods in 2011 and 2012. Eagle use
during the April 1 to June 21, 2013 survey period was 0.0003 flight minute per minute of
survey compared with 0.0048 during the April to June 2011 survey period and 0.0047 during
the April to June 2012 survey period, a decrease in use of more than 93% from both 2011 and

April 1 through June 21, 2013, Eagle Summary Report
Chokecherry and Sierra Madre Wind Energy Project
7 SWCA
2012. The reduction in eagle use estimates between the survey periods are due to the
establishment of Turbine No-Build Areas where high eagle use was documented from 2011–
2012 survey data and demonstrates the avoidance and minimization benefits of PCW’s
Project re-design. In PCW’s Eagle Conservation Plan Supplement submitted to the Service on
September 26, 2012, it was demonstrated that the establishment of the Turbine No-Build
Areas would substantially reduce observed eagle use. The reduction in use observed during
the survey period included in this report is consistent with the findings presented in the
September 26, 2012, Eagle Conservation Plan Supplement.
No bald eagle use was recorded during the April 1 to June 21, 2013 survey period compared
to 0.0002 flight minute per minute of survey observed during the April to June 2011 survey
period, and 0.0017 during the April to June 2012 survey period. This reduction in use between
survey periods also demonstrates the avoidance and minimization value of PCW’s Project re-
design as the observations of bald eagles in 2011–2012 were made within the Turbine No-
Build Areas.
Eagle use for the Chokecherry WDA during the April 1 to June 21, 2013 survey period was
calculated as 0.0002 flight minute per survey minute compared with 0.0063 during the April
to June 2011 survey period and 0.0017 during the April to June 2012 survey period. This
represents a 97% and 88% decrease in use, respectively, resulting from PCW’s identification
of Turbine No-Build Areas in multiple eagle use areas that were identified during the 2008–
2009, 2011, and 2012 survey programs.
No bald eagles were observed in the Chokecherry WDA during the April 1 to June 21, 2013
survey period, compared with bald eagle use of 0.0005 flight minute per survey minute during
the April to June 2011 survey period and no bald eagle use during the April to June 2012
survey period.
Golden eagle use for the Sierra Madre WDA during the April 1 to June 21, 2013 survey
period was 0.0004 flight minute per survey minute compared with 0.0032 during the April to
June 2011 survey period and 0.0077 during the April to June 2012 survey period. This
represents an 87% and 95% decrease in use, respectively, resulting from PCW’s identification
of Turbine No-Build Areas in multiple eagle use areas that were identified during 2008–2009,
2011, and 2012 survey efforts.
No bald eagles were observed in the Sierra Madre WDA during either the April 1 to June 21,
2013 survey period or the April to June 2011 survey period; however, bald eagle use during
the April to June 2012 survey period was 0.0033 flight minute per survey minute.

April 1 through June 21, 2013, Eagle Summary Report
Chokecherry and Sierra Madre Wind Energy Project
8 SWCA
Table 1. Number of Survey Minutes, Days, Individuals, Golden and Unknown Eagle
Flight Minutes, and Height Categories for all Survey Locations in the Chokecherry
WDA.
MCP Location Survey
Minutes
Number of
Individual
Eagles
Golden and
Unknown
Eagle
Flight
Minutes
Minutes
within
0-30 m
Minutes
within
30-150 m
(RSZ)
Minutes
above
150 m
Nevins Ridge CC2 360 0 0 0 0 0
CC3 360 1 1 0 1 0
CC4 300 0 0 0 0 0
CC5 300 0 0 0 0 0
CC6 300 0 0 0 0 0
CC7 360 0 0 0 0 0
CC9 360 0 0 0 0 0
CC10 360 0 0 0 0 0
CC11 360 0 0 0 0 0
CC12 300 0 0 0 0 0
CC13 300 0 0 0 0 0
RM7 300 0 0 0 0 0
RM12 300 0 0 0 0 0
Coal Mine
Draw
CMD2 360 0 0 0 0 0
CMD3 360 0 0 0 0 0
CMD4 360 0 0 0 0 0
RM9 360 0 0 0 0 0
Hogback HB1 300 0 0 0 0 0
HB2 300 1 1 0 0 1
HB3 300 0 0 0 0 0
Smith Rim SR1 300 0 0 0 0 0
SR2 360 0 0 0 0 0
SR3 300 0 0 0 0 0
Upper Hugus
Draw
UH1 300 0 0 0 0 0
UH2 300 0 0 0 0 0
UH3 360 0 0 0 0 0
UH4 360 0 0 0 0 0
Iron Springs UI1 300 0 0 0 0 0
UI2 360 0 0 0 0 0
UI3 360 0 0 0 0 0
RM10 300 0 0 0 0 0
Total – 10,200 2 2 0 1 1

April 1 through June 21, 2013, Eagle Summary Report
Chokecherry and Sierra Madre Wind Energy Project
9 SWCA
Table 2. Number of Survey Minutes, Days, Individuals, Golden Eagle Flight Minutes,
and Height Categories for all Survey Locations in the Sierra Madre WDA.
MCP Location Survey
Minutes
Number of
Individual
Eagles
Golden
Eagle
Flight
Minutes
Minutes
within 0-
30 m
Minutes
within
30-150 m
(RSZ)
Minutes
above 150
m
Sage Creek
Basin
CB1 300 1 3 1 2 0
CB2 270 0 0 0 0 0
CB4 360 0 0 0 0 0
CB5 360 0 0 0 0 0
CB6 360 0 0 0 0 0
RM2 300 0 0 0 0 0
Upper Miller
Hill
MH1 360 0 0 0 0 0
MH2 360 0 0 0 0 0
MH3 360 0 0 0 0 0
MH4 300 0 0 0 0 0
MH5 300 0 0 0 0 0
MH6 360 0 0 0 0 0
MH7 360 0 0 0 0 0
MH8 300 0 0 0 0 0
Lower Miller
Hill
PG1 360 0 0 0 0 0
PG2 300 0 0 0 0 0
PG3 360 0 0 0 0 0
PG4 360 0 0 0 0 0
PG5 360 0 0 0 0 0
PG6 300 0 0 0 0 0
PG7 360 0 0 0 0 0
PG8 300 0 0 0 0 0
PG9 300 0 0 0 0 0
PG10 300 0 0 0 0 0
RM14 360 1 1 1 0 0
RM15 360 0 0 0 0 0
Sage Creek
Rim
SCR1 360 0 0 0 0 0
SCR2 360 0 0 0 0 0
SCR3 284 0 0 0 0 0
Total – 9,674 2 4 2 2 0

April 1 through June 21, 2013, Eagle Summary Report
Chokecherry and Sierra Madre Wind Energy Project
10 SWCA
Table 3. Summary of Golden and Unknown Eagle Observations in the Chokecherry WDA.
Date and
Time of
Observation
Location
Number of
Golden and
Unknown
Eagles
Observed
Golden and
Unknown Eagle
Observations
per Survey
Minute
Golden and
Unknown
Eagle Flight
Minutes
Flight
Minutes in
RSZ
Flight
Behavior
(minutes)
04/23/2013
18:05 CC3 1 0.0028 1 1 Soaring (1)
4/30/2013
17:54 HB2 1 0.0033 1 0
Soaring (0.5)
Gliding (0.5)
Table 4. Summary of Golden Eagle Observations in the Sierra Madre WDA.
Date and
Time of
Observation
Location
Number of
Golden
Eagle
Observed
Golden Eagle
Observations
per Survey
Minute
Golden
Eagle Flight
Minutes
Flight
Minutes
in RSZ
Flight Behavior
(minutes)
4/1/2013
17:58 CB1 1 0.0033 3 2
Gliding (1)
Powered Flight (2)
5/23/2013
16:49 RM14 1 0.0028 1 0 Foraging (1)

Appendix A:
Revised 2012-2013 800-meter Raptor Survey Protocols
Chokecherry and Sierra Madre Wind Energy Project

This page intentionally left blank

Revised 2012-2013 800-meter Raptor Survey Protocols
Chokecherry and Sierra Madre Wind Energy Project
Prepared for:
Power Company of Wyoming, LLC
555 17th Street, Suite 2400
Denver, CO 80202
Prepared by:
SWCA Environmental Consultants
295 Interlocken Blvd., Suite 300
Broomfield, CO 80021
(303) 487-1183 / Fax (303) 487-1245
November 2012

This page intentionally left blank

Appendix A: Revised 2012-2013 800-meter Raptor Survey Protocols
1 SWCA
The Power Company of Wyoming (PCW) recently initiated revisions to the methodologies
currently used to survey for raptors at their Chokecherry and Sierra Madre Wind Energy
Project (Project). Based on conversations with U.S. Fish and Wildlife Service (Service)
personnel, and in an effort to collect data that are appropriate for use in the Service’s model
that predicts the potential fatality rate of eagles for wind energy projects (hereafter, the
Service’s model), raptor survey protocols were revised for the fall 2012 season and for future
raptor survey efforts. On August 31, 2012, PCW provided the Service with a revised protocol
for conducting eagle and raptor surveys at 40 800-meter point count survey sites throughout
the Project. PCW began surveying the 40 locations at the beginning of the autumn 2012
survey season and it is anticipated that those survey efforts will continue through October
2012 at which time the revised protocols discussed in this document will be initiated. On
September 28, 2012, the Service issued a letter recommending slight modifications to the
August 31, 2012 protocols. This revised protocol addresses the comments made by the
Service and specific responses to each comment made are provided in Attachment 1.
These survey methodology revisions are fully consistent with the recommendations for raptor
surveys set forth by the Service in their Draft Eagle Conservation Plan Guidance (Draft ECP
Guidance), the Eagle Conservation Plan Guidance Module 1 – Land-based Wind Energy
Technical Appendices (Technical Appendices; as received from Kevin Kritz, Service Region
6, on August 4, 2012), and the Land-Based Wind Energy Guidelines, while still maintaining
expansive coverage of the Project Site.
Year Two and Year Three long-watch raptor surveys were fully consistent with the
recommendations set forth by the Service’s Draft ECP Guidance (Service 2011) and Land-
Based Wind Energy Guidelines (Service 2012a), the Bureau of Land Management’s (BLM’s)
Wildlife Survey Protocols for Wind Energy Development (BLM 2008), and the Wyoming
Game and Fish Department’s (WGFD’s) Wildlife Protection Recommendations for Wind
Energy Development (WGFD 2010). These surveys were very successful in identifying
concentrated raptor use areas across the Project that could be used to design avoidance areas
to minimize avian impacts. Additionally, long-watch survey data were instructive in showing
the Project Site is not a strong migratory corridor for raptors, and the flight paths digitized
from these data were used to identify high eagle use areas as recommended by the Service’s
Technical Appendices (Service 2012b).
The revised raptor count protocols follow the 800-meter radius point count methodology
recommended by the Service’s Technical Appendices (Service 2012b), and are also in
accordance with the aforementioned guidance documents produced by the Service, BLM, and
WGFD. PCW also sought consultation with Dr. Joshua Millspaugh (Professor of Wildlife
Management, University of Missouri) to ensure the development of a rigorous sampling
design that would result in the collection of data appropriate for the analysis methods and
fatality model currently being used by the Service.
Based upon agency guidance and logistical considerations, the revised protocols were
designed to include 60, 800-meter raptor count survey sites throughout the Chokecherry and
Sierra Madre Wind Development Areas (WDAs) where turbine development is likely
(Figures 1 and 2). Most of the 60 survey sites are identical to the original 40 sites identified in
the August 31, 2012 protocols. However, some of those 40 sites were shifted slightly to

Appendix A: Revised 2012-2013 800-meter Raptor Survey Protocols
2 SWCA
accommodate the placement of the additional 20 survey sites and ensure that no overlap
occurs between samples. Seven of the new sites correspond to raptor monitoring locations that
were used in 2011 and spring 2012 survey efforts (RM2, RM7, RM9, RM10, RM12, RM14,
and RM15). Efforts were made to resample as many of the previous sampling sites as
possible. However, because of PCW’s Project re-design efforts identified in the Project Eagle
Conservation Plan (ECP), many of the previous sampling locations are outside or on the very
edge of the current development area and could not be included without violating the spatially
balanced design that is critical to these protocols.
A spatially balanced sampling design was used to capture the variability in habitat conditions,
terrain features, and turbine numbers and densities. Minimum convex polygons (MCPs) were
placed around each of 10 discrete potential development areas that are separated by Turbine
No-Build areas, topography, or other factors (Figures 1 and 2). MCPs were evaluated for
differences in habitat characteristics, forage potential, and topography. While differences in
habitat characteristics, forage potential, and topography occur among the 10 MCPs, within
each MCP, these factors are similar and additional stratification beyond the MCP level was
not necessary.
Using the “Create Spatially Balanced Points” tool in ArcGIS Geostatistical Analyst, 250
spatially balanced locations were generated within the MCPs. Using the spatially balanced
points, survey sites were selected sequentially in a manner that was consistent with the
recommendations made by the Service while ensuring that no overlap occurs between survey
areas. Total number of sampling sites per MCP was based on the relative surface area and
number of turbines in the MCP. Two primary selection criteria were used to select sampling
sites. First, no overlap of sampling areas was permitted (sites had to be separated by more
than 1,650 meters). Second, because of logistical considerations, sampling sites were
required to be reasonably accessible from the existing road network and in a safe location. If
a potential sampling location violated either of the selection criteria it was dropped and the
next point was evaluated. Tables 1 and 2 provide the locations of each sampling site in the
WDAs as well as information specific to the MCPs and sampling sites.
The first 36 survey sites that were selected correspond to locations that were identified in the
August 31, 2012 protocols. These were sequentially selected using the spatially balanced
points that were generated as part of the process described above while controlling for site
overlap and logistical considerations for survey. Of the remaining 24 sites, 4 correspond with
the original 40 sites with locations slightly shifted to avoid overlap with new sites, 7
correspond with the long-watch raptor monitoring sites that were surveyed in 2011 and
spring/summer 2012, 3 were selected outside of the current probable turbine footprint, and 10
were selected using the remaining spatially balanced points. Some minimal micrositing of the
new locations is anticipated to ensure maximum visibility of the survey areas as well as safe
and consistent accessibility on the part of field personnel.

Appendix A: Revised 2012-2013 800-meter Raptor Survey Protocols
3 SWCA
Figure 1. Minimum Convex Polygons, 800-meter raptor count locations and survey perimeters for Chokecherry.

Appendix A: Revised 2012-2013 800-meter Raptor Survey Protocols
4 SWCA
Figure 2. Minimum Convex Polygons, 800-meter raptor count locations and survey perimeters for Sierra Madre.

Appendix A: Revised 2012-2013 800-meter Raptor Survey Protocols
5
Table 1. Fall 2012-2013 Avian Monitoring Survey Locations for the Chokecherry WDA.
WDA MCP Site Name Survey Site Status Easting* Northing*
Chokecherry
Chokecherry
CC2 Original Fall 2012 Site 315166 4616447
CC3 Original Fall 2012 Site 318351 4619090
CC4 Original Fall 2012 Site 314539 4621971
CC5 Original Fall 2012 Site 317418 4614741
CC6 Original Fall 2012 Site 319335 4621702
CC7 Original Fall 2012 Site 313825 4618366
CC9 Original Fall 2012 Site 319294 4617332
CC10 New 2012 Survey Site 312770 4620262
CC11 New 2012 Survey Site 316501 4617656
CC12
New 2012 Survey Site,
original CC1 site shifted
north to eliminate overlap
with RM7
317170 4622100
CC13
New 2012 Survey Site,
original CC8 site shifted
southeast to eliminate overlap
with RM12
315993 4613871
RM7 2011-2012 Long-watch Site 315531 4620298
RM12 2011-2012 Long-watch Site 314228 4614294
Coal Mine Draw
CMD2 Original Fall 2012 Site 331648 4614732
CMD3 New 2012 Survey Site 330049 4612535
CMD4
New 2012 Survey Site,
original CMD1 site shifted
east to eliminate overlap with
RM9
335437 4613524
RM9 2011-2012 Long-watch Site 332870 4612018
Hogback South
HB1 Original Fall 2012 Site 323818 4620014
HB2 Original Fall 2012 Site 326781 4620243
HB3 New 2012 Survey Site 328457 4621145
Smith Rim
SR1 Original Fall 2012 Site 323560 4617658
SR2 Original Fall 2012 Site 327318 4618336
SR3 New 2012 Survey Site 325362 4618367
Upper Hugus
UH1 Original Fall 2012 Site 328912 4615606
UH2 Original Fall 2012 Site 327099 4615081
UH3 New 2012 Survey Site 330772 4616091
UH4 New 2012 Survey Site 324853 4615321
Upper Iron Springs
UI1 Original Fall 2012 Site 323987 4612091
UI2 Original Fall 2012 Site 327702 4610001
UI3 New 2012 Survey Site 326242 4611221
RM10 2011-2012 Long-watch Site 325646 4609568
*UTM Zone 13, NAD83, Meters

Appendix A: Revised 2012-2013 800-meter Raptor Survey Protocols
6
Table 2. Fall 2012-2013 Avian Monitoring Survey Locations for the Sierra Madre WDA.
WDA MCP Site Name Survey Site Status Easting* Northing*
Sierra Madre
Central Basin
CB1 Original Fall 2012 Site 326414 4597515
CB2 Original Fall 2012 Site 321986 4595452
CB4 Original Fall 2012 Site 329306 4599449
CB5 New 2012 Survey Site 327638 4599529
CB6
New 2012 Survey Site,
original CB3 site shifted west
to eliminate overlap with
RM2
321942 4597660
RM2 2011-2012 Long-watch Site 323776 4597273
Miller Hill
MH1 Original Fall 2012 Site 302291 4600564
MH2 Original Fall 2012 Site 305677 4599125
MH3 Original Fall 2012 Site 307684 4592030
MH4 Original Fall 2012 Site 305024 4594675
MH5 Original Fall 2012 Site 309573 4590571
MH6 Original Fall 2012 Site 306043 4597131
MH7 New 2012 Survey Site 311561 4590443
MH8 New 2012 Survey Site 304412 4600385
Pine Grove
PG1 Original Fall 2012 Site 313663 4594801
PG2 Original Fall 2012 Site 311358 4598224
PG3 Original Fall 2012 Site 307172 4603361
PG4 Original Fall 2012 Site 314434 4597259
PG5 Original Fall 2012 Site 313730 4599682
PG6 Original Fall 2012 Site 312721 4603547
PG7 Original Fall 2012 Site 310058 4595825
PG8 Original Fall 2012 Site 311832 4594006
PG9 Original Fall 2012 Site 311187 4600886
PG10 New 2012 Survey Site 309753 4602508
RM14 2011-2012 Long-watch Site 309884 4599843
RM15 2011-2012 Long-watch Site 315948 4599668
Sage Creek Rim
SCR1 Original Fall 2012 Site 333505 4598194
SCR2 Original Fall 2012 Site 332596 4596407
SCR3 New 2012 Survey Site 330727 4595638
*UTM Zone 13, NAD83, Meters

Appendix A: Revised 2012-2013 800-meter Raptor Survey Protocols
7
Landmarks will be identified and visible stakes will be placed around each survey location
perimeter to provide distance references for field personnel completing survey efforts. The
800-meter radius survey areas of the new 60 point count locations provide coverage for
approximately 35% of the probable turbine locations, which is greater than the 30%
recommendation made by the Service (Service 2012b). Additionally, 46.7% of the raptor
monitoring sites that were surveyed in 2011 will be resurveyed as part of the 60 point counts.
Resurvey of 50% of all previous survey sites was not possible because many fall outside of
the current project layout in Turbine No-Build areas and use of those sites would violate the
spatially balanced study design in addition to sampling areas that are already known as high
use areas for eagles and other raptors. Additionally, several sites that were only surveyed in
spring/summer 2012 do not have a full year of data and would not be appropriate for
comparison with ongoing and future data collection efforts. However, many of the 60 new
survey sites overlap with areas previously surveyed as part of 2011 and 2012 raptor
monitoring efforts. When these areas are included, 50.3% of the area surveyed as part of
previous raptor monitoring efforts is within the perimeter of the 60 new point count survey
sites.
Surveys will be conducted at each site for one hour per guidance in the ECP Technical
Appendices (Service 2012b). Three avian technicians will each survey two locations per day
for a total of 6 locations per day and 60 locations in a 10 day period. Each location will be
surveyed twice per month. A schedule for all 60 raptor count locations was designed to
provide survey coverage across all daylight hours for each of the 60 sites. The schedule was
also designed such that the six raptor count surveys conducted on any given day are separated
temporally and spatially to ensure independence of any observations that are made.
Avian technicians will be equipped with binoculars, spotting scopes, laser rangefinders, and
aerial maps to assist with accurate detection and documentation of all raptors observed within
the 800-meter survey area. Each aerial map is displayed with relevant landforms occurring in
the area, locations of stakes, and concentric rings at each 200-meter interval to facilitate
accurate distance estimation (Attachment 2). Each raptor flight path is recorded by technicians
on the provided aerial maps. Additional data collected include species, number of individuals
per observation, age, sex, behavior, bearing to bird, distance to bird, heading of bird, altitude
of bird, the beginning and ending time for each observation, interactions with other birds, and
hourly weather data among other variables (Attachment 3).
Surveys at the 60 800-meter raptor counts will begin in November 2012 and are scheduled to
continue bi-weekly at each location through August of 2013. Surveys during winter months
will be completed on the same schedule as the remainder of the year and efforts will be made
to survey at least 50% of all locations twice per month during winter. However, winter
surveys are subject to cancellation or delay based on weather conditions and safety of the field
technicians.

Appendix A: Revised 2012-2013 800-meter Raptor Survey Protocols
8
REFERENCES
Bureau of Land Management (BLM). 2008. Wildlife Survey Protocols for Wind Energy
Development.
U.S. Fish and Wildlife Service (Service). 2011. Draft Eagle Conservation Plan Guidance.
Available online at http://www.fws.gov/windenergy/. Accessed December 2011.
———. 2012a. Land Based Wind Energy Guidelines. Wind Turbine Guidelines Advisory
Committee. U.S. Fish and Wildlife Service, Department of the Interior, Washington D.C.
Available online at http://www.fws.gov/windenergy/docs/WEG_final.pdf. Accessed
August 2012.
———. 2012b. Eagle Conservation Plan Guidance Module 1 – Land-based Wind Energy
Technical Appendices. Received from Kevin Kritz, Service Region 6, on August 4, 2012.
Wyoming Game and Fish Department (WGFD). 2010. Wildlife Protection Recommendations
for Wind Energy Development in Wyoming. Wyoming Game and Fish Commission
Approved November 17, 2010. Wyoming Game and Fish Department, Cheyenne, WY.

Appendix A: Revised 2012-2013 800-meter Raptor Survey Protocols
SWCA
ATTACHMENT 1
Response to Survey Recommendations Made in the Service’s
September 28, 2012 Letter

This page intentionally left blank

SWCA
The following recommendations were made by the Service in the September 28, 2012 letter to
Garry Miller (PCW) regarding Eagle Use Sampling Considerations and Recommendations for
the proposed Chokecherry-Sierra Madre Wind Energy Development Project. A response is
provided to document how each recommendation has been incorporated into the revised 800-
meter point count survey protocols. Recommendations are presented in italics below.
1. We recommend focusing sampling efforts within the most recently proposed project
footprint in order to quantify eagle use in areas where turbines are planned for
location. By collecting eagle and raptor use data in areas of likely development, we
believe it will be easier to obtain a more reliable estimate of risk to eagles in these
areas, from which more informed, site-specific, predictions can be made.
Response: The revised protocols and placement of the 60 point count sites are based
on the most recent proposed Project footprint and probable turbine locations. The
most recent Project footprint reflects PCW’s commitment to the Turbine No-Build
areas identified in the Project ECP.
2. Although we recommend concentrating sampling effort within the project footprint as
stated above, we believe it also would be prudent to establish additional sample points
outside of the currently proposed footprint in areas of potential development. Adding
points in areas of possible alternative turbine layouts will provide data to assess the
impact of those alternatives, which may be necessary if survey results identify areas of
high eagle use within areas currently proposed for development. Without eagle use
data outside of the proposed footprint, it would be difficult to show that the relocation
of turbines outside of the currently proposed project footprint would avoid and
minimize impacts to eagles. Without these data, the only likely alternatives would be a
reduction in the total number of turbines, or a reduction in the spacing between
turbines in areas where avian and raptors surveys were conducted.
Response: Three of the 60 point count survey sites (RM15, HB3, and UH3) are placed
outside of the most current probable turbine locations. Several additional locations
(e.g., CMD2, HB2, RM10, SR2) have a substantial portion of their survey areas that
fall outside of the current probable turbine locations. Each of these sites provides
survey coverage in areas of the Project Site where turbines could be located if the
current probable turbine location footprint changes.
3. We recommend resampling at least fifty percent of the raptor point counts from
previous years: this will help distinguish between apparent changes in documented
eagle use caused by different point locations and associated differences in
detectability, versus actual changes in habitat use. This is an important consideration,
because the number of eagles and their location on the landscape is likely to vary
across years (e.g., not every nest is active every year), making it difficult to account
for inter-annual variability, which might lead to inaccurate conclusions about the risk
of eagle fatalities. For example, observing fewer eagles at a second set of survey
points could be misinterpreted as an area of lower eagle use, when in fact the number
of eagles and eagle use across the landscape decreased due to other factors. In this

SWCA
example, the use (and hence risk) might have been the same for all survey points, but
sampling different points across years would lead to the erroneous conclusion.
Resampling some points across years can reduce this uncertainty by creating an index
or allow for scaling of observations across years.
Response: Nearly 50% (46.7%) of the raptor monitoring sites that were surveyed in
2011 will be resurveyed as part of the 60 point counts. Resurvey of 50% of previous
survey sites is not possible because many fall outside of the current project layout in
Turbine No-Build areas. Additionally, several sites that were only surveyed in
spring/summer 2012 do not have a full year of data and would not be appropriate for
comparison with ongoing and future data collection efforts. Many of the 60 new
survey sites overlap with areas previously surveyed as part of 2012 raptor monitoring
efforts. When those areas are included, 50.3% of the area surveyed as part of 2012
raptor monitoring efforts is within the perimeter of the 60 new point count survey
sites.
4. Previous long-watch raptor surveys were based on an unlimited radius, and analysis
of data from these surveys suggests that the detectability of eagles dropped off after
600 to 800 meters. We recommend using a distance of no more than 800 meters for
point counts intended to collect data on eagles and other large raptors. This
recommendation is found in our draft Eagle Conservation Plan Guidance (Service
2012, Appendix C, p. 18) and in other literature (e.g., Strickland et al. 2011). While it
is acceptable to collect data on eagles and other raptors beyond 800 meters (e.g.,
location, flight height, flight path)—since they may be useful to identify travel
corridors and areas of eagle use—the collection of this information should not distract
surveyors from collecting data within the 800-meter point count. In addition, because
only those data collected within 800 meters will be used in the models to predict eagle
fatalities, data collected at distances more than 800 meters should be separated from
data collected within 800 meters.
Response: Previous long-watch raptor surveys recorded any eagle observed to help
identify high use areas per the protocols developed collaboratively between the
Service, BLM, and PCW. The analysis of detectability of eagles presented in the
Service’s comments does not consider that the reason eagle use was higher within 800
meters of previously sampled sites is because those sites were placed on ridgelines and
terrain features known to attract or concentrate eagle use, making the likelihood of
observing an eagle within 800 meters of a survey site higher than if the point was
placed randomly in the landscape where varying terrain features may or may not
occur. The implementation of the previous surveys was extremely successful and
resulted in the development of Turbine No-Build areas that will avoid impacts to
eagles and other avian species in the majority of the high use areas that were
identified. To be consistent with the Service’s Draft ECP Guidance, the Service’s
eagle risk model, and the recommendation made above, all surveys will be conducted
using a distance of 800-meters.

SWCA
5. Based on recommendations in the draft Eagle Conservation Plan Guidance, the
sampling goal should provide a “minimal spatial coverage of at least 30% of the
project footprint” (i.e., the total area sampled in any given year should be thirty
percent of the total project footprint) (Service 2012, Appendix C, p. 1 8). We recognize
that even this level of effort will not provide specific information for seventy percent of
the project area; however, it may be assumed that the information is representative of
the remaining project area, provided the sample points are appropriately located
(e.g., stratified and spatially balanced). To achieve the desired goal of at least 30
percent coverage of the Chokecherry Sierra Madre Proposed Project footprint, we
calculate up to 70 survey points are needed, depending on how the project footprint is
portrayed.
Response: Using the conceptual turbine footprint that PCW provided to the Service,
35% of all turbine locations fall within the 800-meter survey perimeters of the 60
point count sites. As stated above, the entirety of 3 sites and substantial portions of 3
others fall outside of the probable Project footprint in areas where turbines could be
placed. These provide adequate coverage of areas outside of the current probable
turbine footprint. When combined with the 800-meter radius surveyed areas from
previous survey events (2011 and spring/summer 2012), 42% of probable turbine
locations are included within the perimeter of 800-meter point count sites.
6. We recommend sample locations be stratified by features of the landscape that may
influence eagle and raptor activity, such as distinct geographic/topographic elements
(e.g., escarpments), vegetation (if appropriate), and concentrated prey base. Doing so
will allocate sampling points across the project in proportion to their occurrence on
the landscape. A common sampling design in use today is the generalized random
tessellation stratified sampling design (GRTS). We remain concerned that there is
insufficient information about eagle habitat use associated with important eagle use
areas including: active nests; concentrated prey base including grouse leks, prairie
dog colonies, and reservoirs; as well as topographic features such as Miller Hill.
Therefore, we recommend that some sample points be located near these important
eagle use areas. Doing so would help with identifying additional avoidance areas or
alleviating concerns for increased risk associated with these areas.
Response: The spatially balanced design that is discussed in the revised protocols
above is reflective of the variability in habitat conditions, terrain features, and turbine
numbers and densities. The revised protocols describe the methods used to select sites
and the sampling strata and selection criteria that were used to place sites. The 60
sampling sites described in the revised protocols provide coverage in areas that
provide some level of foraging, contain sage-grouse leks, and have variable
topography that could influence eagle and raptor behavior. Site placement near active
eagle nests is difficult because most nests have been avoided and are within the
Turbine No-Build areas along the Bolten Rim or North Platte River corridor and, as
seen in the data previously collected for the Project, active nests locations change each
year.

SWCA
7. Based on recommendations in the Service’s Eagle Conservation Plan Guidance, count
periods should be one to two hours long (Service 2012, Appendix C, p. 18). If longer
survey periods are used (e.g., four to six hours), the surveys should be divided into
smaller units such as one or two hour blocks (or the actual time of eagle observations
recorded), so that the influence of time of day can be evaluated (e.g., in relation to
when turbines are inactive).
Response: Surveys will be conducted at each site for one hour per guidance in the
ECP Technical Appendices (Service 2012b). As stated in the revised protocols, the
survey methods follow the 800-meter radius point count methodology recommended
by the Service’s Technical Appendices to the Draft ECP Guidance, and are consistent
with other guidance documents produced by the Service, BLM, and WGFD.
8. We recommend the protocol include a representative distribution of sampling events
across all daylight hours across all point locations and seasons. Collecting data
“evenly” across time and space should reduce any potential bias associated with
locations, seasons, and time of day. This may also make it possible to evaluate how
time of day influences eagle use of the site or when eagles are more likely to use
specific topographic features. In addition, surveys should include multiple sampling
events in each season per point.
Response: As stated in the revised protocols, the survey methods follow the 800-
meter radius point count methodology recommended by the Service’s Technical
Appendices to the Draft ECP Guidance, and are consistent with other guidance
documents produced by the Service, BLM, and WGFD. The sampling schedule will
provide survey coverage across all daylight hours for each of the 60 sites. The
schedule also makes certain that the six raptor count surveys conducted on any given
day are separated temporally and spatially to ensure independence of any observations
that are made.
9. We recommend locating survey sampling points at least 800 meters (0.5 mile) from
active eagle and ferruginous hawk nests to limit disturbance. It may be possible to
reduce this distance if topographic features create a visual barrier between observers
and the nest.
Response: Should an eagle or ferruginous hawk nest become active within 800 meters
of a survey site, PCW will coordinate with the Service and BLM to evaluate the most
appropriate methods to take to ensure that survey activities do not disrupt nesting.
With PCW’s Turbine No-Build areas and Project re-design efforts, most eagle and
raptor nests in the Project Site have been avoided by 800 meters or more. However,
some survey sites are located within 800 meters of historically active nests. As stated
above, sampling locations have been selected in a spatially balanced, stratified manner
using methods recommended by the Service. Maintaining the sites that are located
within 800 meters of historically active nests is necessary to maintain this spatially
balanced design. Since Project survey efforts began in 2008, no active ferruginous
hawk nests have been identified.

SWCA
10. We recommend data collection include identification of eagle species and their flight
minutes within the 800-meter point count. Additional data collection could include,
but should not necessarily be limited to (in relative order of importance): age and sex
(if possible), flight path, flight behavior (e.g., soaring, kiting), activity (e.g., territory
defense, foraging), interactions with other birds, flight height, obvious prey items, time
observed outside of the 800-meter point count, and time perched. It is acceptable to
record detections beyond 800-meters as these can provide additional information
about eagle and raptor use of the project area. However, collecting data beyond 800-
meters should not detract from observations made within the 800-meter point count.
Response: Only those observations occurring within 800 meters of the survey sites
will be recorded. As described in the protocols and illustrated on the data collection
forms in Attachment 3, data collection efforts will provide all of the information
recommended by the Service.
11. We recommend collecting data on all raptors to the extent feasible; however,
collecting data on other raptors should not preclude the collection of data on eagles.
Response: Data on all raptors and other species of interest will be collected in a
manner identical as that used for eagles unless those efforts interfere with data
collection for eagles.
12. Based on eagle use data collected between April of 2011 and April of 2012, eagle
activity relative to sampling effort appears to be higher in the winter and summer
periods (Table 1). Higher eagle activity in the summer likely corresponds to the time
during which adults are actively feeding young and when young are learning to fly.
Higher eagle activity in the winter may be related to the presence of migrant eagles,
or could be due to the location of survey points. Because data were not collected
following the above recommendations during the summer of 2012, we recommend the
collection of eagle and raptor use data continue through the 2013 nesting season (at
least through August of 2013) to evaluate this potential season of higher use.
Response: Data will be collected through August of 2013. Our interpretation of eagle
use in winter and summer periods differs from the Service’s interpretation. The
Service’s interpretation assumes that each minute of eagle use is independent and
evenly distributed across the landscape. Based on the survey data, it is clear that most
of the eagle minutes recorded across all seasons are not independent and that the
simple statistic of flight minutes per survey minute does not consider that observations
are not independent in space or time and therefore mischaracterizes seasonal use and
risk. As an example, 72 of the 141 minutes (51%) of winter use observed in the
Project Site occurred at two sites on two days. On December 8, 2011, 35 eagle flight
minutes were recorded at RM11 and on March 9, 2012 37 minutes of eagle use were
recorded at RM14. On both days, field technicians wrote on datasheets that the use
was associated with 2-3 individuals who were using the area for a long period of time.
If the three eagles at RM14 had not been observed on March 9, no winter use would

SWCA
have been observed within 800 meters of that sampling site. Similarly, if the use at
RM11 would not have been observed on December 8, only 3 minutes of eagle use
over would have been observed at that site during winter months and use would have
been decreased by 95%. The observed activity on December 8 and March 9 is
indicative of short duration, concentrated use by a few individuals rather than of high
eagle use of the Project throughout the entire winter period. The data also indicate
that for most of the Project Site there is no risk or very low risk to eagles during
winter. Summer data are very similar to winter data. During summer 2011, only 71
eagle minutes were recorded. Nearly 60% of these minutes were associated with only
3 observations of individual circle soaring birds at RM14 and RM5. This indicates
that the high use the Service cites is not from adults feeding young or young learning
to fly. Rather, the behavior observed indicates that this is localized use by individual
birds utilizing thermals created by warm summer temperatures.
13. In several locations, the document states that it was “fully compliant” with
recommendations by the U.S. Fish and Wildlife Service (Service). First, it is important
to understand that the draft Eagle Conservation Plan Guidance is voluntary;
consequently we prefer to use the term “consistent with” rather than “compliant
with” when describing recommendations found within the Eagle Conservation Plan
Guidance. Second, we do not believe that the protocol provided by PCW is, in fact,
consistent with the Eagle Conservation Plan Guidance for numerous reasons, one key
reason being that the limited number of 800-meter survey points do not provide the
recommended minimum 30 percent coverage of the project footprint. Additionally, we
do not believe it is scientifically justifiable to combine survey points from multiple
years in order to meet the minimum recommended standard of 30 percent coverage:
the minimum 30 percent coverage should occur within each individual year.
Response: The recommended changes have been made. The term “compliant” has
been changed to “consistent”. As stated above, 35% of the probable turbine locations
will be surveyed using the revised protocols.
14. The document makes a definitive statement about “unrealistic projections”
concerning eagle risk. This statement is based on several assumptions, including that
previous survey efforts correctly identified areas of high eagle use. One of the reasons
for increasing the spatial coverage in 2012-2013 is to increase our confidence in
understanding eagle and raptor use across the Project area. Because substantial
uncertainty exists as a result of the limited amount of spatial and temporal survey
coverage used to document impacts and relative risk to eagles, the Service believes
our projections concerning risk to eagles are realistic and clearly demonstrate the
need for increased coverage. In addition, our letter of August 10, 2012, identified
numerous areas of potential high eagle use that are not currently included in the
avoidance areas, such as the golden eagle nest in the southwest corner of Sierra
Madre. Our letter also identified the presence of high density prey base, proximity of
sage grouse leks and other habitat features that are used by eagles. Because these
habitat features (and others) are not included in the proposed avoidance areas, the
projections of risk and high eagle fatalities identified by the Service are possible.

SWCA
Response: The comments made above have been addressed in the revised protocols,
the prey-base report submitted to the Service, and the Project ECP. We concur that
within the context of the Service’s eagle fatality model, the revised protocols will help
address uncertainties.
15. The data sheet attached to the protocol provided by PCW does not appear to have a
means of recording flight path in data. It should be clear how flight path data will be
collected on the existing data sheet, or additional datasheets should be included if
there is more than one.
Response: Attachment 2 contains an example figure that is used to record flight paths
for eagles and other raptors. Additionally, multiple rows of data are recorded for each
eagle observed which results in multiple spatial points per individual bird. Fitting a
line between each point for each observed eagle provides another mechanism to create
flight paths. The methods used to collect data are described in the revised protocols.

This page intentionally left blank

SWCA
ATTACHMENT 2
Example Aerial Map Used to Map Flight Paths during 800-meter Raptor
Count Surveys

This page intentionally left blank

A1-1 SWCA
Aerial map example. Numbers next to site markers indicate distance from raptor monitoring
location to the site marker location. Concentric rings around raptor monitoring location
indicate 200-meter distance intervals to aid in estimation of distance. Other features on the
landscape (roads, rock cairns, etc.) are also noted on each map to aid in distance and location
estimation.

This page intentionally left blank

SWCA
ATTACHMENT 3
Data Sheets Used to Collect Data during 800-meter Raptor Count Surveys

This page intentionally left blank

PCW 2012-2013 Raptor Survey
Field Observer:
Survey Location:
Start time:
End time:
Date:
Page: ____ of _____
Target
# Obs
# Species
# Birds
Age Sex Behav Bearing
to Bird (°) Distance
to Bird (m) Angle of Bird (°)
Heading of Bird
0- 30
30-150
150+ Time Begin
Time End

PCW 2012-2013 Raptor Survey Notes
Field Observer: Survey Pt:
Date:
Page:
_____ of _____
Other species and Notes.
Weather Conditions
Wind
Time Sky Dir Spd Temp (°F)
Incidental Species Observations for eagles and raptors note distance and bearing

June 24 through August 30, 2013, Eagle Summary Report
Chokecherry and Sierra Madre Wind Energy Project
Prepared for:
Power Company of Wyoming, LLC 555 17th Street, Suite 2400 Denver, Colorado 80202
Prepared by:
SWCA Environmental Consultants 295 Interlocken Blvd., Suite 300
Broomfield, Colorado 80021 (303) 487-1183 / Fax (303) 487-1245
September 2013

This page intentionally left blank

June 24 through August 30, 2013, Eagle Summary Report Chokecherry and Sierra Madre Wind Energy Project
ii SWCA
EXECUTIVE SUMMARY
Between June 24 and August 30, 2013, SWCA Environmental Consultants performed raptor count surveys as part of Power Company of Wyoming LLC’s (PCW’s) ongoing avian survey program at the Chokecherry and Sierra Madre Wind Energy Project (Project) site. The survey period captures fledging and summer use periods within the Project site. This report documents use during these eagle use periods.
For this survey period, 9 minutes of golden eagle (Aquila chrysaetos) use were recorded within the Project site during 18,000 survey minutes (300.0 hours) for 0.0005 flight minute per minute of survey. Of the recorded golden eagle flight minutes, 66.7% were outside the Rotor Swept Zone (RSZ). By altitudinal classification, 66.7% of the golden eagle flight minutes were below the RSZ (0 to 30 meters above ground), 33.3% of the golden eagle flight minutes were within the RSZ (30 to 150 meters), and 0 golden eagle flight minutes were recorded above the RSZ (above 150 meters).
For the Chokecherry Wind Development Area (WDA), 5 minutes of golden eagle use were recorded during 9,300 survey minutes (155.0 hours) for 0.0005 flight minute per minute of survey. In total, 155 survey sessions were conducted during which four golden eagle observations were recorded during four of the sessions. Observation times ranged between 1 minute and 2 minutes, rounded up to the nearest whole minute. Of the recorded use in the Chokecherry WDA, 80% occurred outside the RSZ.
For the Sierra Madre WDA, 4 minutes of golden eagle use were recorded during 8,700 survey minutes (145.0 hours) for 0.0005 flight minute per minute of survey. In total, 145 survey sessions were conducted during which three golden eagle observations were recorded during three of the sessions. Observation times ranged between 1 minute and 2 minutes, rounded up to the nearest whole minute. Of the recorded use in the Sierra Madre WDA, 50% occurred outside the RSZ.
During the survey period, there were no observations of bald eagles (Haliaeetus leucocephalus).

June 24 through August 30, 2013, Eagle Summary Report Chokecherry and Sierra Madre Wind Energy Project
iii SWCA
TABLE OF CONTENTS
Page EXECUTIVE SUMMARY ........................................................................................................ ii INTRODUCTION AND PROJECT DESCRIPTION ............................................................... 1 RESULTS AND DISCUSSION ................................................................................................ 4
Discussion of Chokecherry Use Observations ....................................................................... 5 Discussion of Sierra Madre Use Observations ....................................................................... 6
COMPARISON TO PREVIOUS RESULTS ............................................................................ 6
LIST OF FIGURES
Figure Page 1 Minimum Convex Polygons, 800-meter raptor count locations and survey perimeters
for Chokecherry. .................................................................................................................. 2 2 Minimum Convex Polygons, 800-meter raptor count locations and survey perimeters
for Sierra Madre. .................................................................................................................. 3
LIST OF TABLES
Table Page 1 Number of Survey Minutes, Days, Individuals, Golden Eagle Flight Minutes, and
Height Categories for all Survey Locations in the Chokecherry WDA. ............................. 8 2 Number of Survey Minutes, Days, Individuals, Golden Eagle Flight Minutes, and
Height Categories for all Survey Locations in the Sierra Madre WDA. ............................. 9 3 Summary of Golden Eagle Observations in the Chokecherry WDA. ............................... 10 4 Summary of Golden Eagle Observations in the Sierra Madre WDA. ............................... 10 Appendices Appendix A: Revised 2012-2013 800-meter Raptor Survey Protocols

June 24 through August 30, 2013, Eagle Summary Report Chokecherry and Sierra Madre Wind Energy Project
1 SWCA
INTRODUCTION AND PROJECT DESCRIPTION
Surveys described in this report are part of the avian survey program directed towards identifying eagle and raptor use across the Chokecherry and Sierra Madre Wind Energy Project (Project) site. The survey data will be used for modeling eagle collision risk and developing avoidance measures and Best Management Practices to reduce potential Project impacts to eagles, to the extent practicable. All protocols and survey methodologies used to assess avian species in the Project site during surveys in 2011, 2012, and 2013 were developed in consultation with the U.S. Fish and Wildlife Service (Service), and are in accordance with recommendations made by the Service, the Bureau of Land Management (BLM), and the Wyoming Game and Fish Department (WGFD). Appendix A contains the protocols used to collect eagle use data for the period of this report.
This report summarizes the data from the June 24 to August 30, 2013 raptor counts and captures fledging and summer use periods within the Project site. It is the final of four reports covering 12 consecutive calendar months from August 2012 to August 2013. Report 1 covers the period of August 20 to November 9, 2012; report 2 covers the period of November 12, 2012, to March 29, 2013; and report 3 covers the period of April 1 to June 21, 2013.
In 2012, based on the extensive avian data that have been collected for the Project, Power Company of Wyoming, LLC (PCW) substantially re-designed the Project and identified Turbine No-Build Areas. These designated Turbine No-Build Areas have relatively higher eagle use than other areas of the Project and PCW has committed to not build turbines in these areas. This will substantially contribute to avoiding and minimizing collision risk to eagles. Next, to assess use by eagles and other raptors in the remaining potential wind development areas (WDAs), surveys were initiated during August 2012 at 40, 800-meter (m) survey locations across the probable turbine footprint outside of the Turbine No-Build Areas. After further consultation with the Service, the survey program was increased to 60, 800-m survey locations (Figures 1 and 2) for surveys occurring from mid-November 2012 through August 2013. The increased survey locations achieve coverage of 30% of the probable turbine locations for the Project as recommended by the Service. The addition of 20 survey locations also allowed the inclusion of seven sites that were previously surveyed in 2011 and early 2012 for further analysis.
Selection of the 60, 800-m survey locations was achieved using a spatially balanced sampling design used to capture the variability in habitat conditions, terrain features, and turbine numbers and densities. Minimum convex polygons1 (MCPs) were placed around potential turbine construction areas in the Project site that are separated by the Turbine No-Build Areas established by PCW (Figures 1 and 2). MCPs were evaluated for differences in habitat characteristics, forage potential, and topography. While differences in habitat characteristics,
1 MCPs were generated using the ArcGIS Spatial Analyst minimum bounding geometry function with the minimum convex hull option selected.

June 24 through August 30, 2013, Eagle Summary Report Chokecherry and Sierra Madre Wind Energy Project
2 SWCA
Figure 1.Minimum Convex Polygons, 800-meter raptor count locations and survey perimeters for Chokecherry.

June 24 through August 30, 2013, Eagle Summary Report Chokecherry and Sierra Madre Wind Energy Project
3 SWCA
Figure 2. Minimum Convex Polygons, 800-meter raptor count locations and survey perimeters for Sierra Madre.

June 24 through August 30, 2013, Eagle Summary Report Chokecherry and Sierra Madre Wind Energy Project
4 SWCA
forage potential, and topography occur among the 10 discrete MCPs, within each MCP these factors are similar and additional stratification beyond the MCP level was not necessary. Using Geostatistical Analyst tools in ArcGIS, spatially balanced survey locations were sequentially selected in a manner that is consistent with the recommendations made by the Service while ensuring that no overlap occurs between survey locations. Total number of sampling locations per MCP was based on the relative surface area, number of turbines, and turbine densities in each MCP.
Raptor surveys documented in this report occurred from June 24 through August 30, 2013. Surveys occurred at 60 survey locations across the Project site, with 31 survey locations in the Chokecherry WDA and 29 survey locations in the Sierra Madre WDA (Figures 1 and 2). Surveys were designed to occur at each of the 60 survey locations for 1 hour per survey date in accordance with guidance from the Service. Three avian technicians each surveyed two survey locations per day resulting in surveys of six survey locations per day and 60 survey locations in a 10-day period. The schedule was designed and implemented to provide survey coverage across all daylight hours for each of the 60 survey locations. The schedule was also designed such that the six raptor count surveys conducted on any given day were separated temporally and spatially to increase the likelihood of independence of any observations made.
Each survey location was scheduled to be surveyed twice per month. The majority of the 60 survey locations were visited five times during the survey period, with only a slight variation at two of the survey locations.
Surveys were completed across all daylight hours in accordance with the Service’s recommendations. Each raptor flight path was recorded by technicians on aerial maps. Additional data collected included species, number of individuals per observation, age, sex, behavior, azimuth to bird, distance to bird, heading of bird, altitude of bird, the beginning and ending time for each observation, interactions with other birds, and hourly weather data among other variables. Appendix A to this report contains the detailed protocols used to collect the data.
RESULTS AND DISCUSSION
During the June 24 to August 30, 2013 survey period, 300 individual surveys were conducted across both WDAs for a total of 18,000 survey minutes (300.0 hours; Tables 1 and 2). Generally, survey minutes were evenly distributed across the 60 survey locations, with only a slight variation at two of the survey locations in the Sage Creek Rim survey area.
During the June 24 to August 30, 2013 survey period, seven golden eagles (Aquila chrysaetos) were observed in flight for a total of 9 minutes (Tables 1 and 2). Overall golden eagle use during this survey period was 0.0005 flight minute per minute of survey. This use value is the total use without consideration of flight heights and proportion of time in the Rotor Swept Zone (RSZ). Use in both the Chokecherry and Sierra Madre WDAs during this survey period was 0.0005 flight minute per minute of survey. No bald eagles (Haliaeetus leucocephalus) were detected during the June 24 to August 30, 2013 survey period.

June 24 through August 30, 2013, Eagle Summary Report Chokecherry and Sierra Madre Wind Energy Project
5 SWCA
All golden eagle flight minutes recorded during the June 24 to August 30, 2013 survey period were subdivided into altitudinal categories as recorded during field surveys (below RSZ = 0–30 m, within RSZ = 30–150 m, above RSZ = above 150 m) to determine the proportion of time eagles flew through the RSZ (30–150 m) and therefore at risk of collision. These altitudinal categories were developed to reflect the actual turbine heights that will be used for the Project. Of the 9 total golden eagle flight minutes, 6 minutes (66.7%) were recorded within the 0–30 m bin, 3 minutes (33.3%) were recorded within the 30–150 m bin, and 0 minutes were recorded above 150 m (Tables 1 and 2). When considering observed flight heights, total use across the Project site in the RSZ where collisions could occur was 0.0002 minute of flight time per minute of survey, a decrease of nearly 60.0% compared to total flight minutes.
Results and Discussion of Chokecherry Use Observations
Surveys in the Chokecherry WDA were conducted at 31 locations for a total of 9,700 minutes during the June 24 to August 30, 2013 survey period. During this survey period, golden eagles were observed in flight at four of the 31 survey locations for a total of 5 minutes (Table 1). Golden eagle use for the Chokecherry WDA during this survey period was calculated as 0.0005 flight minute per survey minute.
Four of the golden eagle flight minutes occurred within the 0–30 m altitudinal bin (80%), 1 minute (20%) occurred within the 30–150 m bin, and 0 minutes occurred above 150 m (Table 1). In the Chokecherry WDA, 80% of all use occurred outside of the RSZ where eagles are not at risk for collision.
The four sites in the Chokecherry WDA with golden eagle observations occurred within two of the MCPs: Nevins Ridge and Coal Mine Draw (Figure 1). Survey locations within the Hogback, Smith Rim, Upper Hugus, and Upper Iron Springs MCPs all had zero eagle observations during the June 24 to August 30, 2013 survey period. Within the Nevins Ridge MCP, a golden eagle was observed at CC3, CC5, and CC13; and in the Coal Mine Draw MCP, a golden eagle was observed at CMD3 (Table 1).
Within the Nevins Ridge MCP, at CC3 one golden eagle was observed on one survey date for a total of 1 flight minute, which occurred in the 0–30 m height category. Over the course of the 1 flight minute, this individual’s behavior was recorded as powered flight and soaring. At CC5 one golden eagle was observed on one survey date for a total of 1 flight minute, which occurred in the 30–150 m height category. Over the course of the 1 flight minute, this individual’s behavior was recorded as soaring and gliding. At CC13 one golden eagle was observed on one survey date for a total of 2 flight minutes, which occurred in the 0–30 m height category. Over the course of the two flight minutes, this individual’s behavior was recorded as gliding and powered flight.
Within the Coal Mine Draw MCP, at CMD3 one golden eagle was observed on one survey date for a total of 1 flight minute, which occurred in the 0–30 m height category. Over the course of the 1flight minute, this individual’s behavior was recorded as powered flight.

June 24 through August 30, 2013, Eagle Summary Report Chokecherry and Sierra Madre Wind Energy Project
6 SWCA
Results and Discussion of Sierra Madre Use Observations
In the Sierra Madre WDA, surveys were conducted for 8,700 minutes during the June 24 to August 30, 2013 survey period. During this survey period, golden eagles were observed in flight at three of 29 survey locations for a total of 4 minutes (Table 2). Golden eagle use for the Sierra Madre WDA during this period was 0.0005 flight minute per survey.
Two of the 4 golden eagle flight minutes (50%) occurred within 0–30 m height category, 2 minutes (50%) occurred within 30–150 m, and 0 minutes occurred above 150 m (Table 2). In the Sierra Madre WDA, 50% of all use occurred outside of the RSZ where eagles are not at risk for collision.
The three sites with eagle observations in the Sierra Madre WDA occurred within two of the MCPs: Sage Creek Basin and Lower Miller Hill (Figure 2). Survey locations within the Upper Miller Hill and Sage Creek Rim MCPs all had zero eagle observations during the June 24 to August 30, 2013 survey period. Within the Sage Creek Basin MCP, only one golden eagle was observed at RM2. Within the Lower Miller Hill MCP, a golden eagle was observed at RM14 and RM15 (Table 2).
Within the Sage Creek Basin MCP, at RM2 one golden eagle observation was made on one survey date for a total of 1 flight minute, which occurred in the 30–150 m height category. Over the course of the 1 flight minute, this individual’s behavior was recorded as powered flight (Table 4).
Within the Lower Miller Hill MCP, at RM14 one golden eagle was observed on one survey date for a total of 1 flight minute, which occurred in the 30–150 m height category. Over the course of the 1 flight minute, this individual’s behavior was recorded as circle soaring. At RM15 one golden eagle was observed on one survey date for a total of 2 flight minutes, which occurred in the 0–30 m height category. Over the course of the 2 flight minutes, this individual’s behavior was recorded as powered flight and soaring.
COMPARISON TO PREVIOUS RESULTS
As a result of PCW’s Project re-design, eagle use in the WDAs was substantially lower during the June 24 to August 30, 2013 survey period than similar periods in 2011 and 2012. Golden eagle use during the June 24 to August 30, 2013 survey period was 0.0005 flight minute per minute of survey compared with 0.0059 during the July to August 2011 survey period and 0.0032 during the July 2012 survey period, a decrease in use of more than 91% and 84% from 2011 and 2012, respectively. The reduction in golden eagle use estimates between the survey periods are due to the establishment of Turbine No-Build Areas where areas of relatively high eagle use were documented from 2011–2012 survey data. This reduction demonstrates the avoidance and minimization benefits of PCW’s Project re-design and avoidance and minimization efforts. In PCW’s Eagle Conservation Plan Supplement submitted to the Service on September 26, 2012, it was demonstrated that the establishment of the Turbine No-Build Areas would substantially reduce observed eagle use. The reduction in use observed during the survey period included in this report is consistent with the findings presented in the September 26, 2012, Eagle Conservation Plan Supplement.

June 24 through August 30, 2013, Eagle Summary Report Chokecherry and Sierra Madre Wind Energy Project
7 SWCA
No bald eagle use was recorded during the June 24 to August 30, 2013 survey period, the July to August 2011 survey period, or the July 2012 survey period.
Golden eagle use for the Chokecherry WDA during the June 24 to August 30, 2013 survey period was calculated as 0.0005 flight minute per survey minute compared with 0.0036 during the July to August 2011 survey period. This represents an 86% decrease in use resulting from PCW’s identification of Turbine No-Build Areas in multiple eagle use areas that were identified during the 2008–2009, 2011, and 2012 survey programs. No golden eagle use was recorded in the Chokecherry WDA during the July 2012 survey period.
No bald eagles were observed in the Chokecherry WDA during the June 24 to August 30, 2013 survey period, the July to August 2011 survey period, or the July 2012 survey period.
Golden eagle use for the Sierra Madre WDA during the June 24 to August 30, 2013 survey period was 0.0005 flight minute per survey minute compared with 0.0085 during the July to August 2011 survey period and 0.0063 during the July 2012 survey period. This represents a 94% and 92% decrease in use, respectively, resulting from PCW’s identification of Turbine No-Build Areas in multiple eagle use areas that were identified during 2008–2009, 2011, and 2012 survey efforts.
No bald eagles were observed in the Sierra Madre WDA during the June 24 to August 30, 2013 survey period, the July to August 2011 survey period, or the July 2012 survey period.

June 24 through August 30, 2013, Eagle Summary Report Chokecherry and Sierra Madre Wind Energy Project
8 SWCA
Table 1. Number of Survey Minutes, Days, Individuals, Golden and Unknown Eagle Flight Minutes, and Height Categories for all Survey Locations in the Chokecherry
WDA.
MCP Location Survey Minutes
Number of Individual
Eagles
Golden Eagle Flight
Minutes
Minutes within 0-30 m
Minutes within
30-150 m (RSZ)
Minutes above 150 m
Nevins Ridge CC2 300 0 0 0 0 0 CC3 300 1 1 1 0 0 CC4 300 0 0 0 0 0 CC5 300 1 1 0 1 0 CC6 300 0 0 0 0 0 CC7 300 0 0 0 0 0 CC9 300 0 0 0 0 0
CC10 300 0 0 0 0 0 CC11 300 0 0 0 0 0 CC12 300 0 0 0 0 0 CC13 300 1 2 2 0 0 RM7 300 0 0 0 0 0
RM12 300 0 0 0 0 0 Coal Mine Draw
CMD2 300 0 0 0 0 0 CMD3 300 1 1 1 0 0 CMD4 300 0 0 0 0 0 RM9 300 0 0 0 0 0
Hogback HB1 300 0 0 0 0 0 HB2 300 0 0 0 0 0 HB3 300 0 0 0 0 0
Smith Rim SR1 300 0 0 0 0 0 SR2 300 0 0 0 0 0 SR3 300 0 0 0 0 0
Upper Hugus Draw
UH1 300 0 0 0 0 0 UH2 300 0 0 0 0 0 UH3 300 0 0 0 0 0 UH4 300 0 0 0 0 0
Upper Iron Springs
UI1 300 0 0 0 0 0 UI2 300 0 0 0 0 0 UI3 300 0 0 0 0 0
RM10 300 0 0 0 0 0 Total – 9,300 4 5 4 1 0

June 24 through August 30, 2013, Eagle Summary Report Chokecherry and Sierra Madre Wind Energy Project
9 SWCA
Table 2. Number of Survey Minutes, Days, Individuals, Golden Eagle Flight Minutes, and Height Categories for all Survey Locations in the Sierra Madre WDA.
MCP Location Survey Minutes
Number of Individual
Eagles
Golden Eagle Flight
Minutes
Minutes within 0-
30 m
Minutes within
30-150 m (RSZ)
Minutes above 150
m
Sage Creek Basin
CB1 300 0 0 0 0 0 CB2 300 0 0 0 0 0 CB4 300 0 0 0 0 0 CB5 300 0 0 0 0 0 CB6 300 0 0 0 0 0 RM2 300 1 1 0 1 0
Upper Miller Hill
MH1 300 0 0 0 0 0 MH2 300 0 0 0 0 0 MH3 300 0 0 0 0 0 MH4 300 0 0 0 0 0 MH5 300 0 0 0 0 0 MH6 300 0 0 0 0 0 MH7 300 0 0 0 0 0 MH8 300 0 0 0 0 0
Lower Miller Hill
PG1 300 0 0 0 0 0 PG2 300 0 0 0 0 0 PG3 300 0 0 0 0 0 PG4 300 0 0 0 0 0 PG5 300 0 0 0 0 0 PG6 300 0 0 0 0 0 PG7 300 0 0 0 0 0 PG8 300 0 0 0 0 0 PG9 300 0 0 0 0 0
PG10 300 0 0 0 0 0 RM14 300 1 1 0 1 0 RM15 300 1 2 2 0 0
Sage Creek Rim
SCR1 240 0 0 0 0 0 SCR2 300 0 0 0 0 0 SCR3 360 0 0 0 0 0
Total – 8,700 3 4 2 2 0

June 24 through August 30, 2013, Eagle Summary Report Chokecherry and Sierra Madre Wind Energy Project
10 SWCA
Table 3. Summary of Golden and Unknown Eagle Observations in the Chokecherry WDA.
Date and Time of
Observation Location
Number of Golden Eagles
Observed
Golden Eagle Observations per Survey
Minute
Golden Eagle Flight
Minutes
Flight Minutes in RSZ
Flight Behavior (minutes)
7/2/2013 19:00 CC3 1 0.0033 1 0 Powered Flight (0.5)
Soaring (0.5) 7/9/2013
13:57 CC5 1 0.0033 1 1 Soaring (0.5) Gliding (0.5)
7/13/2013 7:54 CC13 1 0.0033 2 0 Gliding (1)
Powered Flight (1)
8/2/2013 9:15 CMD3 1 0.0033 1 0 Powered Flight (1)
Table 4. Summary of Golden Eagle Observations in the Sierra Madre WDA.
Date and Time of
Observation Location
Number of Golden Eagle
Observed
Golden Eagle Observations per Survey
Minute
Golden Eagle Flight
Minutes
Flight Minutes in RSZ
Flight Behavior (minutes)
7/1/2013 17:00 RM15 1 0.0033 2 0 Powered Flight (1)
Soaring (1) 7/9/2013
9:50 RM2 1 0.0033 1 1 Powered Flight (1)
7/29/2013 12:34 RM14 1 0.0033 1 1 Circle Soaring (1)

Appendix A:
Revised 2012-2013 800-meter Raptor Survey Protocols Chokecherry and Sierra Madre Wind Energy Project

This page intentionally left blank

Revised 2012-2013 800-meter Raptor Survey Protocols
Chokecherry and Sierra Madre Wind Energy Project
Prepared for:
Power Company of Wyoming, LLC 555 17th Street, Suite 2400
Denver, CO 80202
Prepared by:
SWCA Environmental Consultants 295 Interlocken Blvd., Suite 300
Broomfield, CO 80021 (303) 487-1183 / Fax (303) 487-1245
November 2012

This page intentionally left blank

Appendix A: Revised 2012-2013 800-meter Raptor Survey Protocols
1 SWCA
The Power Company of Wyoming (PCW) recently initiated revisions to the methodologies currently used to survey for raptors at their Chokecherry and Sierra Madre Wind Energy Project (Project). Based on conversations with U.S. Fish and Wildlife Service (Service) personnel, and in an effort to collect data that are appropriate for use in the Service’s model that predicts the potential fatality rate of eagles for wind energy projects (hereafter, the Service’s model), raptor survey protocols were revised for the fall 2012 season and for future raptor survey efforts. On August 31, 2012, PCW provided the Service with a revised protocol for conducting eagle and raptor surveys at 40 800-meter point count survey sites throughout the Project. PCW began surveying the 40 locations at the beginning of the autumn 2012 survey season and it is anticipated that those survey efforts will continue through October 2012 at which time the revised protocols discussed in this document will be initiated. On September 28, 2012, the Service issued a letter recommending slight modifications to the August 31, 2012 protocols. This revised protocol addresses the comments made by the Service and specific responses to each comment made are provided in Attachment 1.
These survey methodology revisions are fully consistent with the recommendations for raptor surveys set forth by the Service in their Draft Eagle Conservation Plan Guidance (Draft ECP Guidance), the Eagle Conservation Plan Guidance Module 1 – Land-based Wind Energy Technical Appendices (Technical Appendices; as received from Kevin Kritz, Service Region 6, on August 4, 2012), and the Land-Based Wind Energy Guidelines, while still maintaining expansive coverage of the Project Site.
Year Two and Year Three long-watch raptor surveys were fully consistent with the recommendations set forth by the Service’s Draft ECP Guidance (Service 2011) and Land-Based Wind Energy Guidelines (Service 2012a), the Bureau of Land Management’s (BLM’s) Wildlife Survey Protocols for Wind Energy Development (BLM 2008), and the Wyoming Game and Fish Department’s (WGFD’s) Wildlife Protection Recommendations for Wind Energy Development (WGFD 2010). These surveys were very successful in identifying concentrated raptor use areas across the Project that could be used to design avoidance areas to minimize avian impacts. Additionally, long-watch survey data were instructive in showing the Project Site is not a strong migratory corridor for raptors, and the flight paths digitized from these data were used to identify high eagle use areas as recommended by the Service’s Technical Appendices (Service 2012b).
The revised raptor count protocols follow the 800-meter radius point count methodology recommended by the Service’s Technical Appendices (Service 2012b), and are also in accordance with the aforementioned guidance documents produced by the Service, BLM, and WGFD. PCW also sought consultation with Dr. Joshua Millspaugh (Professor of Wildlife Management, University of Missouri) to ensure the development of a rigorous sampling design that would result in the collection of data appropriate for the analysis methods and fatality model currently being used by the Service.
Based upon agency guidance and logistical considerations, the revised protocols were designed to include 60, 800-meter raptor count survey sites throughout the Chokecherry and Sierra Madre Wind Development Areas (WDAs) where turbine development is likely (Figures 1 and 2). Most of the 60 survey sites are identical to the original 40 sites identified in the August 31, 2012 protocols. However, some of those 40 sites were shifted slightly to

Appendix A: Revised 2012-2013 800-meter Raptor Survey Protocols
2 SWCA
accommodate the placement of the additional 20 survey sites and ensure that no overlap occurs between samples. Seven of the new sites correspond to raptor monitoring locations that were used in 2011 and spring 2012 survey efforts (RM2, RM7, RM9, RM10, RM12, RM14, and RM15). Efforts were made to resample as many of the previous sampling sites as possible. However, because of PCW’s Project re-design efforts identified in the Project Eagle Conservation Plan (ECP), many of the previous sampling locations are outside or on the very edge of the current development area and could not be included without violating the spatially balanced design that is critical to these protocols.
A spatially balanced sampling design was used to capture the variability in habitat conditions, terrain features, and turbine numbers and densities. Minimum convex polygons (MCPs) were placed around each of 10 discrete potential development areas that are separated by Turbine No-Build areas, topography, or other factors (Figures 1 and 2). MCPs were evaluated for differences in habitat characteristics, forage potential, and topography. While differences in habitat characteristics, forage potential, and topography occur among the 10 MCPs, within each MCP, these factors are similar and additional stratification beyond the MCP level was not necessary.
Using the “Create Spatially Balanced Points” tool in ArcGIS Geostatistical Analyst, 250 spatially balanced locations were generated within the MCPs. Using the spatially balanced points, survey sites were selected sequentially in a manner that was consistent with the recommendations made by the Service while ensuring that no overlap occurs between survey areas. Total number of sampling sites per MCP was based on the relative surface area and number of turbines in the MCP. Two primary selection criteria were used to select sampling sites. First, no overlap of sampling areas was permitted (sites had to be separated by more than 1,650 meters). Second, because of logistical considerations, sampling sites were required to be reasonably accessible from the existing road network and in a safe location. If a potential sampling location violated either of the selection criteria it was dropped and the next point was evaluated. Tables 1 and 2 provide the locations of each sampling site in the WDAs as well as information specific to the MCPs and sampling sites.
The first 36 survey sites that were selected correspond to locations that were identified in the August 31, 2012 protocols. These were sequentially selected using the spatially balanced points that were generated as part of the process described above while controlling for site overlap and logistical considerations for survey. Of the remaining 24 sites, 4 correspond with the original 40 sites with locations slightly shifted to avoid overlap with new sites, 7 correspond with the long-watch raptor monitoring sites that were surveyed in 2011 and spring/summer 2012, 3 were selected outside of the current probable turbine footprint, and 10 were selected using the remaining spatially balanced points. Some minimal micrositing of the new locations is anticipated to ensure maximum visibility of the survey areas as well as safe and consistent accessibility on the part of field personnel.

Appendix A: Revised 2012-2013 800-meter Raptor Survey Protocols
3 SWCA
Figure 1. Minimum Convex Polygons, 800-meter raptor count locations and survey perimeters for Chokecherry.

Appendix A: Revised 2012-2013 800-meter Raptor Survey Protocols
4 SWCA
Figure 2. Minimum Convex Polygons, 800-meter raptor count locations and survey perimeters for Sierra Madre.

Appendix A: Revised 2012-2013 800-meter Raptor Survey Protocols
5 SWCA
Table 1. Fall 2012-2013 Avian Monitoring Survey Locations for the Chokecherry WDA.
WDA MCP Site Name Survey Site Status Easting* Northing*
Chokecherry
Chokecherry
CC2 Original Fall 2012 Site 315166 4616447
CC3 Original Fall 2012 Site 318351 4619090
CC4 Original Fall 2012 Site 314539 4621971
CC5 Original Fall 2012 Site 317418 4614741
CC6 Original Fall 2012 Site 319335 4621702
CC7 Original Fall 2012 Site 313825 4618366
CC9 Original Fall 2012 Site 319294 4617332
CC10 New 2012 Survey Site 312770 4620262
CC11 New 2012 Survey Site 316501 4617656
CC12
New 2012 Survey Site, original CC1 site shifted north to eliminate overlap with RM7
317170 4622100
CC13
New 2012 Survey Site, original CC8 site shifted southeast to eliminate overlap with RM12
315993 4613871
RM7 2011-2012 Long-watch Site 315531 4620298
RM12 2011-2012 Long-watch Site 314228 4614294
Coal Mine Draw
CMD2 Original Fall 2012 Site 331648 4614732
CMD3 New 2012 Survey Site 330049 4612535
CMD4
New 2012 Survey Site, original CMD1 site shifted east to eliminate overlap with RM9
335437 4613524
RM9 2011-2012 Long-watch Site 332870 4612018
Hogback South
HB1 Original Fall 2012 Site 323818 4620014
HB2 Original Fall 2012 Site 326781 4620243
HB3 New 2012 Survey Site 328457 4621145
Smith Rim
SR1 Original Fall 2012 Site 323560 4617658
SR2 Original Fall 2012 Site 327318 4618336
SR3 New 2012 Survey Site 325362 4618367
Upper Hugus
UH1 Original Fall 2012 Site 328912 4615606
UH2 Original Fall 2012 Site 327099 4615081
UH3 New 2012 Survey Site 330772 4616091
UH4 New 2012 Survey Site 324853 4615321
Upper Iron Springs
UI1 Original Fall 2012 Site 323987 4612091
UI2 Original Fall 2012 Site 327702 4610001
UI3 New 2012 Survey Site 326242 4611221
RM10 2011-2012 Long-watch Site 325646 4609568 *UTM Zone 13, NAD83, Meters

Appendix A: Revised 2012-2013 800-meter Raptor Survey Protocols
6 SWCA
Table 2. Fall 2012-2013 Avian Monitoring Survey Locations for the Sierra Madre WDA.
WDA MCP Site Name Survey Site Status Easting* Northing*
Sierra Madre
Central Basin
CB1 Original Fall 2012 Site 326414 4597515
CB2 Original Fall 2012 Site 321986 4595452
CB4 Original Fall 2012 Site 329306 4599449
CB5 New 2012 Survey Site 327638 4599529
CB6
New 2012 Survey Site, original CB3 site shifted west to eliminate overlap with RM2
321942 4597660
RM2 2011-2012 Long-watch Site 323776 4597273
Miller Hill
MH1 Original Fall 2012 Site 302291 4600564
MH2 Original Fall 2012 Site 305677 4599125
MH3 Original Fall 2012 Site 307684 4592030
MH4 Original Fall 2012 Site 305024 4594675
MH5 Original Fall 2012 Site 309573 4590571
MH6 Original Fall 2012 Site 306043 4597131
MH7 New 2012 Survey Site 311561 4590443
MH8 New 2012 Survey Site 304412 4600385
Pine Grove
PG1 Original Fall 2012 Site 313663 4594801
PG2 Original Fall 2012 Site 311358 4598224
PG3 Original Fall 2012 Site 307172 4603361
PG4 Original Fall 2012 Site 314434 4597259
PG5 Original Fall 2012 Site 313730 4599682
PG6 Original Fall 2012 Site 312721 4603547
PG7 Original Fall 2012 Site 310058 4595825
PG8 Original Fall 2012 Site 311832 4594006
PG9 Original Fall 2012 Site 311187 4600886
PG10 New 2012 Survey Site 309753 4602508
RM14 2011-2012 Long-watch Site 309884 4599843
RM15 2011-2012 Long-watch Site 315948 4599668
Sage Creek Rim
SCR1 Original Fall 2012 Site 333505 4598194
SCR2 Original Fall 2012 Site 332596 4596407
SCR3 New 2012 Survey Site 330727 4595638 *UTM Zone 13, NAD83, Meters

Appendix A: Revised 2012-2013 800-meter Raptor Survey Protocols
7 SWCA
Landmarks will be identified and visible stakes will be placed around each survey location perimeter to provide distance references for field personnel completing survey efforts. The 800-meter radius survey areas of the new 60 point count locations provide coverage for approximately 35% of the probable turbine locations, which is greater than the 30% recommendation made by the Service (Service 2012b). Additionally, 46.7% of the raptor monitoring sites that were surveyed in 2011 will be resurveyed as part of the 60 point counts. Resurvey of 50% of all previous survey sites was not possible because many fall outside of the current project layout in Turbine No-Build areas and use of those sites would violate the spatially balanced study design in addition to sampling areas that are already known as high use areas for eagles and other raptors. Additionally, several sites that were only surveyed in spring/summer 2012 do not have a full year of data and would not be appropriate for comparison with ongoing and future data collection efforts. However, many of the 60 new survey sites overlap with areas previously surveyed as part of 2011 and 2012 raptor monitoring efforts. When these areas are included, 50.3% of the area surveyed as part of previous raptor monitoring efforts is within the perimeter of the 60 new point count survey sites.
Surveys will be conducted at each site for one hour per guidance in the ECP Technical Appendices (Service 2012b). Three avian technicians will each survey two locations per day for a total of 6 locations per day and 60 locations in a 10 day period. Each location will be surveyed twice per month. A schedule for all 60 raptor count locations was designed to provide survey coverage across all daylight hours for each of the 60 sites. The schedule was also designed such that the six raptor count surveys conducted on any given day are separated temporally and spatially to ensure independence of any observations that are made.
Avian technicians will be equipped with binoculars, spotting scopes, laser rangefinders, and aerial maps to assist with accurate detection and documentation of all raptors observed within the 800-meter survey area. Each aerial map is displayed with relevant landforms occurring in the area, locations of stakes, and concentric rings at each 200-meter interval to facilitate accurate distance estimation (Attachment 2). Each raptor flight path is recorded by technicians on the provided aerial maps. Additional data collected include species, number of individuals per observation, age, sex, behavior, bearing to bird, distance to bird, heading of bird, altitude of bird, the beginning and ending time for each observation, interactions with other birds, and hourly weather data among other variables (Attachment 3).
Surveys at the 60 800-meter raptor counts will begin in November 2012 and are scheduled to continue bi-weekly at each location through August of 2013. Surveys during winter months will be completed on the same schedule as the remainder of the year and efforts will be made to survey at least 50% of all locations twice per month during winter. However, winter surveys are subject to cancellation or delay based on weather conditions and safety of the field technicians.

Appendix A: Revised 2012-2013 800-meter Raptor Survey Protocols
8 SWCA
REFERENCES
Bureau of Land Management (BLM). 2008. Wildlife Survey Protocols for Wind Energy Development.
U.S. Fish and Wildlife Service (Service). 2011. Draft Eagle Conservation Plan Guidance. Available online at http://www.fws.gov/windenergy/. Accessed December 2011.
———. 2012a. Land Based Wind Energy Guidelines. Wind Turbine Guidelines Advisory Committee. U.S. Fish and Wildlife Service, Department of the Interior, Washington D.C. Available online at http://www.fws.gov/windenergy/docs/WEG_final.pdf. Accessed August 2012.
———. 2012b. Eagle Conservation Plan Guidance Module 1 – Land-based Wind Energy Technical Appendices. Received from Kevin Kritz, Service Region 6, on August 4, 2012.
Wyoming Game and Fish Department (WGFD). 2010. Wildlife Protection Recommendations for Wind Energy Development in Wyoming. Wyoming Game and Fish Commission Approved November 17, 2010. Wyoming Game and Fish Department, Cheyenne, WY.

Appendix A: Revised 2012-2013 800-meter Raptor Survey Protocols
SWCA
ATTACHMENT 1 Response to Survey Recommendations Made in the Service’s
September 28, 2012 Letter

This page intentionally left blank

SWCA
The following recommendations were made by the Service in the September 28, 2012 letter to Garry Miller (PCW) regarding Eagle Use Sampling Considerations and Recommendations for the proposed Chokecherry-Sierra Madre Wind Energy Development Project. A response is provided to document how each recommendation has been incorporated into the revised 800-meter point count survey protocols. Recommendations are presented in italics below.
1. We recommend focusing sampling efforts within the most recently proposed project
footprint in order to quantify eagle use in areas where turbines are planned for location. By collecting eagle and raptor use data in areas of likely development, we believe it will be easier to obtain a more reliable estimate of risk to eagles in these areas, from which more informed, site-specific, predictions can be made.
Response: The revised protocols and placement of the 60 point count sites are based on the most recent proposed Project footprint and probable turbine locations. The most recent Project footprint reflects PCW’s commitment to the Turbine No-Build areas identified in the Project ECP.
2. Although we recommend concentrating sampling effort within the project footprint as
stated above, we believe it also would be prudent to establish additional sample points outside of the currently proposed footprint in areas of potential development. Adding points in areas of possible alternative turbine layouts will provide data to assess the impact of those alternatives, which may be necessary if survey results identify areas of high eagle use within areas currently proposed for development. Without eagle use data outside of the proposed footprint, it would be difficult to show that the relocation of turbines outside of the currently proposed project footprint would avoid and minimize impacts to eagles. Without these data, the only likely alternatives would be a reduction in the total number of turbines, or a reduction in the spacing between turbines in areas where avian and raptors surveys were conducted. Response: Three of the 60 point count survey sites (RM15, HB3, and UH3) are placed outside of the most current probable turbine locations. Several additional locations (e.g., CMD2, HB2, RM10, SR2) have a substantial portion of their survey areas that fall outside of the current probable turbine locations. Each of these sites provides survey coverage in areas of the Project Site where turbines could be located if the current probable turbine location footprint changes.
3. We recommend resampling at least fifty percent of the raptor point counts from previous years: this will help distinguish between apparent changes in documented eagle use caused by different point locations and associated differences in detectability, versus actual changes in habitat use. This is an important consideration, because the number of eagles and their location on the landscape is likely to vary across years (e.g., not every nest is active every year), making it difficult to account for inter-annual variability, which might lead to inaccurate conclusions about the risk of eagle fatalities. For example, observing fewer eagles at a second set of survey points could be misinterpreted as an area of lower eagle use, when in fact the number of eagles and eagle use across the landscape decreased due to other factors. In this

SWCA
example, the use (and hence risk) might have been the same for all survey points, but sampling different points across years would lead to the erroneous conclusion. Resampling some points across years can reduce this uncertainty by creating an index or allow for scaling of observations across years.
Response: Nearly 50% (46.7%) of the raptor monitoring sites that were surveyed in 2011 will be resurveyed as part of the 60 point counts. Resurvey of 50% of previous survey sites is not possible because many fall outside of the current project layout in Turbine No-Build areas. Additionally, several sites that were only surveyed in spring/summer 2012 do not have a full year of data and would not be appropriate for comparison with ongoing and future data collection efforts. Many of the 60 new survey sites overlap with areas previously surveyed as part of 2012 raptor monitoring efforts. When those areas are included, 50.3% of the area surveyed as part of 2012 raptor monitoring efforts is within the perimeter of the 60 new point count survey sites.
4. Previous long-watch raptor surveys were based on an unlimited radius, and analysis
of data from these surveys suggests that the detectability of eagles dropped off after 600 to 800 meters. We recommend using a distance of no more than 800 meters for point counts intended to collect data on eagles and other large raptors. This recommendation is found in our draft Eagle Conservation Plan Guidance (Service 2012, Appendix C, p. 18) and in other literature (e.g., Strickland et al. 2011). While it is acceptable to collect data on eagles and other raptors beyond 800 meters (e.g., location, flight height, flight path)—since they may be useful to identify travel corridors and areas of eagle use—the collection of this information should not distract surveyors from collecting data within the 800-meter point count. In addition, because only those data collected within 800 meters will be used in the models to predict eagle fatalities, data collected at distances more than 800 meters should be separated from data collected within 800 meters.
Response: Previous long-watch raptor surveys recorded any eagle observed to help identify high use areas per the protocols developed collaboratively between the Service, BLM, and PCW. The analysis of detectability of eagles presented in the Service’s comments does not consider that the reason eagle use was higher within 800 meters of previously sampled sites is because those sites were placed on ridgelines and terrain features known to attract or concentrate eagle use, making the likelihood of observing an eagle within 800 meters of a survey site higher than if the point was placed randomly in the landscape where varying terrain features may or may not occur. The implementation of the previous surveys was extremely successful and resulted in the development of Turbine No-Build areas that will avoid impacts to eagles and other avian species in the majority of the high use areas that were identified. To be consistent with the Service’s Draft ECP Guidance, the Service’s eagle risk model, and the recommendation made above, all surveys will be conducted using a distance of 800-meters.

SWCA
5. Based on recommendations in the draft Eagle Conservation Plan Guidance, the sampling goal should provide a “minimal spatial coverage of at least 30% of the project footprint” (i.e., the total area sampled in any given year should be thirty percent of the total project footprint) (Service 2012, Appendix C, p. 1 8). We recognize that even this level of effort will not provide specific information for seventy percent of the project area; however, it may be assumed that the information is representative of the remaining project area, provided the sample points are appropriately located (e.g., stratified and spatially balanced). To achieve the desired goal of at least 30 percent coverage of the Chokecherry Sierra Madre Proposed Project footprint, we calculate up to 70 survey points are needed, depending on how the project footprint is portrayed.
Response: Using the conceptual turbine footprint that PCW provided to the Service, 35% of all turbine locations fall within the 800-meter survey perimeters of the 60 point count sites. As stated above, the entirety of 3 sites and substantial portions of 3 others fall outside of the probable Project footprint in areas where turbines could be placed. These provide adequate coverage of areas outside of the current probable turbine footprint. When combined with the 800-meter radius surveyed areas from previous survey events (2011 and spring/summer 2012), 42% of probable turbine locations are included within the perimeter of 800-meter point count sites.
6. We recommend sample locations be stratified by features of the landscape that may
influence eagle and raptor activity, such as distinct geographic/topographic elements (e.g., escarpments), vegetation (if appropriate), and concentrated prey base. Doing so will allocate sampling points across the project in proportion to their occurrence on the landscape. A common sampling design in use today is the generalized random tessellation stratified sampling design (GRTS). We remain concerned that there is insufficient information about eagle habitat use associated with important eagle use areas including: active nests; concentrated prey base including grouse leks, prairie dog colonies, and reservoirs; as well as topographic features such as Miller Hill. Therefore, we recommend that some sample points be located near these important eagle use areas. Doing so would help with identifying additional avoidance areas or alleviating concerns for increased risk associated with these areas.
Response: The spatially balanced design that is discussed in the revised protocols above is reflective of the variability in habitat conditions, terrain features, and turbine numbers and densities. The revised protocols describe the methods used to select sites and the sampling strata and selection criteria that were used to place sites. The 60 sampling sites described in the revised protocols provide coverage in areas that provide some level of foraging, contain sage-grouse leks, and have variable topography that could influence eagle and raptor behavior. Site placement near active eagle nests is difficult because most nests have been avoided and are within the Turbine No-Build areas along the Bolten Rim or North Platte River corridor and, as seen in the data previously collected for the Project, active nests locations change each year.

SWCA
7. Based on recommendations in the Service’s Eagle Conservation Plan Guidance, count periods should be one to two hours long (Service 2012, Appendix C, p. 18). If longer survey periods are used (e.g., four to six hours), the surveys should be divided into smaller units such as one or two hour blocks (or the actual time of eagle observations recorded), so that the influence of time of day can be evaluated (e.g., in relation to when turbines are inactive). Response: Surveys will be conducted at each site for one hour per guidance in the ECP Technical Appendices (Service 2012b). As stated in the revised protocols, the survey methods follow the 800-meter radius point count methodology recommended by the Service’s Technical Appendices to the Draft ECP Guidance, and are consistent with other guidance documents produced by the Service, BLM, and WGFD.
8. We recommend the protocol include a representative distribution of sampling events across all daylight hours across all point locations and seasons. Collecting data “evenly” across time and space should reduce any potential bias associated with locations, seasons, and time of day. This may also make it possible to evaluate how time of day influences eagle use of the site or when eagles are more likely to use specific topographic features. In addition, surveys should include multiple sampling events in each season per point.
Response: As stated in the revised protocols, the survey methods follow the 800-meter radius point count methodology recommended by the Service’s Technical Appendices to the Draft ECP Guidance, and are consistent with other guidance documents produced by the Service, BLM, and WGFD. The sampling schedule will provide survey coverage across all daylight hours for each of the 60 sites. The schedule also makes certain that the six raptor count surveys conducted on any given day are separated temporally and spatially to ensure independence of any observations that are made.
9. We recommend locating survey sampling points at least 800 meters (0.5 mile) from
active eagle and ferruginous hawk nests to limit disturbance. It may be possible to reduce this distance if topographic features create a visual barrier between observers and the nest.
Response: Should an eagle or ferruginous hawk nest become active within 800 meters of a survey site, PCW will coordinate with the Service and BLM to evaluate the most appropriate methods to take to ensure that survey activities do not disrupt nesting. With PCW’s Turbine No-Build areas and Project re-design efforts, most eagle and raptor nests in the Project Site have been avoided by 800 meters or more. However, some survey sites are located within 800 meters of historically active nests. As stated above, sampling locations have been selected in a spatially balanced, stratified manner using methods recommended by the Service. Maintaining the sites that are located within 800 meters of historically active nests is necessary to maintain this spatially balanced design. Since Project survey efforts began in 2008, no active ferruginous hawk nests have been identified.

SWCA
10. We recommend data collection include identification of eagle species and their flight
minutes within the 800-meter point count. Additional data collection could include, but should not necessarily be limited to (in relative order of importance): age and sex (if possible), flight path, flight behavior (e.g., soaring, kiting), activity (e.g., territory defense, foraging), interactions with other birds, flight height, obvious prey items, time observed outside of the 800-meter point count, and time perched. It is acceptable to record detections beyond 800-meters as these can provide additional information about eagle and raptor use of the project area. However, collecting data beyond 800-meters should not detract from observations made within the 800-meter point count. Response: Only those observations occurring within 800 meters of the survey sites will be recorded. As described in the protocols and illustrated on the data collection forms in Attachment 3, data collection efforts will provide all of the information recommended by the Service.
11. We recommend collecting data on all raptors to the extent feasible; however, collecting data on other raptors should not preclude the collection of data on eagles. Response: Data on all raptors and other species of interest will be collected in a manner identical as that used for eagles unless those efforts interfere with data collection for eagles.
12. Based on eagle use data collected between April of 2011 and April of 2012, eagle activity relative to sampling effort appears to be higher in the winter and summer periods (Table 1). Higher eagle activity in the summer likely corresponds to the time during which adults are actively feeding young and when young are learning to fly. Higher eagle activity in the winter may be related to the presence of migrant eagles, or could be due to the location of survey points. Because data were not collected following the above recommendations during the summer of 2012, we recommend the collection of eagle and raptor use data continue through the 2013 nesting season (at least through August of 2013) to evaluate this potential season of higher use. Response: Data will be collected through August of 2013. Our interpretation of eagle use in winter and summer periods differs from the Service’s interpretation. The Service’s interpretation assumes that each minute of eagle use is independent and evenly distributed across the landscape. Based on the survey data, it is clear that most of the eagle minutes recorded across all seasons are not independent and that the simple statistic of flight minutes per survey minute does not consider that observations are not independent in space or time and therefore mischaracterizes seasonal use and risk. As an example, 72 of the 141 minutes (51%) of winter use observed in the Project Site occurred at two sites on two days. On December 8, 2011, 35 eagle flight minutes were recorded at RM11 and on March 9, 2012 37 minutes of eagle use were recorded at RM14. On both days, field technicians wrote on datasheets that the use was associated with 2-3 individuals who were using the area for a long period of time. If the three eagles at RM14 had not been observed on March 9, no winter use would

SWCA
have been observed within 800 meters of that sampling site. Similarly, if the use at RM11 would not have been observed on December 8, only 3 minutes of eagle use over would have been observed at that site during winter months and use would have been decreased by 95%. The observed activity on December 8 and March 9 is indicative of short duration, concentrated use by a few individuals rather than of high eagle use of the Project throughout the entire winter period. The data also indicate that for most of the Project Site there is no risk or very low risk to eagles during winter. Summer data are very similar to winter data. During summer 2011, only 71 eagle minutes were recorded. Nearly 60% of these minutes were associated with only 3 observations of individual circle soaring birds at RM14 and RM5. This indicates that the high use the Service cites is not from adults feeding young or young learning to fly. Rather, the behavior observed indicates that this is localized use by individual birds utilizing thermals created by warm summer temperatures.
13. In several locations, the document states that it was “fully compliant” with recommendations by the U.S. Fish and Wildlife Service (Service). First, it is important to understand that the draft Eagle Conservation Plan Guidance is voluntary; consequently we prefer to use the term “consistent with” rather than “compliant with” when describing recommendations found within the Eagle Conservation Plan Guidance. Second, we do not believe that the protocol provided by PCW is, in fact, consistent with the Eagle Conservation Plan Guidance for numerous reasons, one key reason being that the limited number of 800-meter survey points do not provide the recommended minimum 30 percent coverage of the project footprint. Additionally, we do not believe it is scientifically justifiable to combine survey points from multiple years in order to meet the minimum recommended standard of 30 percent coverage: the minimum 30 percent coverage should occur within each individual year. Response: The recommended changes have been made. The term “compliant” has been changed to “consistent”. As stated above, 35% of the probable turbine locations will be surveyed using the revised protocols.
14. The document makes a definitive statement about “unrealistic projections” concerning eagle risk. This statement is based on several assumptions, including that previous survey efforts correctly identified areas of high eagle use. One of the reasons for increasing the spatial coverage in 2012-2013 is to increase our confidence in understanding eagle and raptor use across the Project area. Because substantial uncertainty exists as a result of the limited amount of spatial and temporal survey coverage used to document impacts and relative risk to eagles, the Service believes our projections concerning risk to eagles are realistic and clearly demonstrate the need for increased coverage. In addition, our letter of August 10, 2012, identified numerous areas of potential high eagle use that are not currently included in the avoidance areas, such as the golden eagle nest in the southwest corner of Sierra Madre. Our letter also identified the presence of high density prey base, proximity of sage grouse leks and other habitat features that are used by eagles. Because these habitat features (and others) are not included in the proposed avoidance areas, the projections of risk and high eagle fatalities identified by the Service are possible.

SWCA
Response: The comments made above have been addressed in the revised protocols, the prey-base report submitted to the Service, and the Project ECP. We concur that within the context of the Service’s eagle fatality model, the revised protocols will help address uncertainties.
15. The data sheet attached to the protocol provided by PCW does not appear to have a means of recording flight path in data. It should be clear how flight path data will be collected on the existing data sheet, or additional datasheets should be included if there is more than one. Response: Attachment 2 contains an example figure that is used to record flight paths for eagles and other raptors. Additionally, multiple rows of data are recorded for each eagle observed which results in multiple spatial points per individual bird. Fitting a line between each point for each observed eagle provides another mechanism to create flight paths. The methods used to collect data are described in the revised protocols.

This page intentionally left blank

SWCA
ATTACHMENT 2 Example Aerial Map Used to Map Flight Paths during 800-meter Raptor
Count Surveys

This page intentionally left blank

A1-1 SWCA
Aerial map example. Numbers next to site markers indicate distance from raptor monitoring location to the site marker location. Concentric rings around raptor monitoring location indicate 200-meter distance intervals to aid in estimation of distance. Other features on the landscape (roads, rock cairns, etc.) are also noted on each map to aid in distance and location estimation.

SWCA
ATTACHMENT 3 Data Sheets Used to Collect Data during 800-meter Raptor Count Surveys

This page intentionally left blank

PCW 2012-2013 Raptor Survey
Field Observer:
Survey Location:
Start time:
End time:
Date:
Page: ____ of _____
Target
# Obs
# Species
# Birds
Age Sex Behav Bearing
to Bird (°) Distance
to Bird (m) Angle of Bird (°)
Heading of Bird
0- 30
30-150
150+ Time Begin
Time End

PCW 2012-2013 Raptor Survey Notes
Field Observer:
Survey Pt:
Date:
Page: _____ of _____
Other species and Notes.
Weather Conditions
Wind
Time Sky Dir Spd Temp (°F)
Incidental Species Observations for eagles and raptors note distance and bearing