APLE Phosphorus Model - Chesapeake Bay
25
APLE Phosphorus Model Alisha Spears Mulkey Graduate Research Assistant Univ. Maryland, College Park Advisor: Frank Coale
Transcript of APLE Phosphorus Model - Chesapeake Bay

APLE Phosphorus Model
Alisha Spears Mulkey Graduate Research AssistantUniv. Maryland, College Park
Advisor: Frank Coale
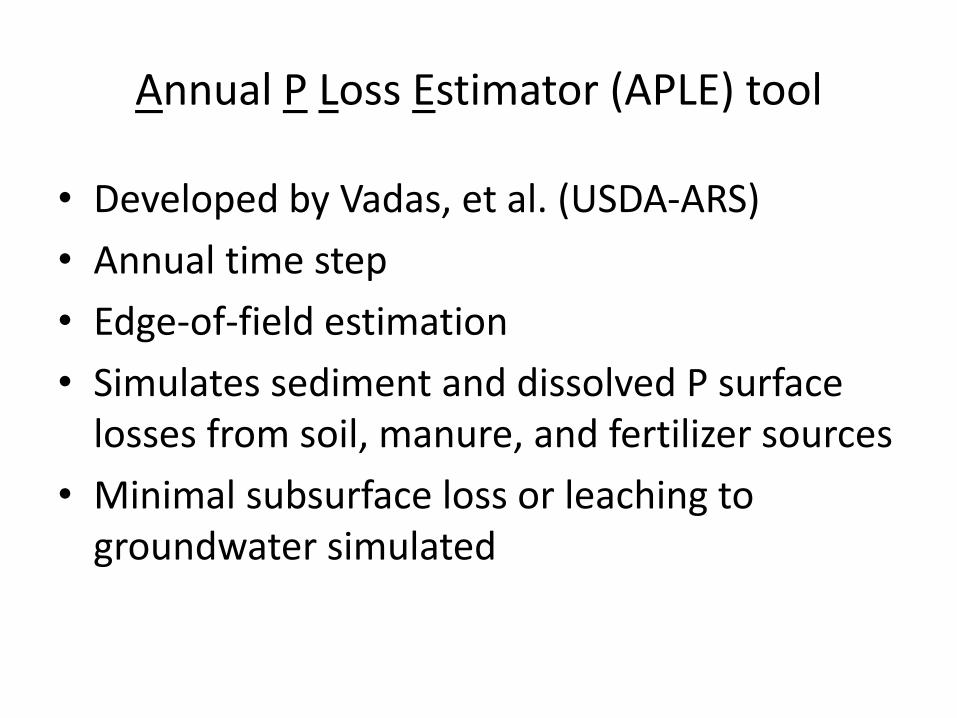
Annual P Loss Estimator (APLE) tool
• Developed by Vadas, et al. (USDA-ARS)
• Annual time step
• Edge-of-field estimation
• Simulates sediment and dissolved P surface losses from soil, manure, and fertilizer sources
• Minimal subsurface loss or leaching to groundwater simulated

Diagram of APLE Nutrient Sources and Soil Pools
FertilizerManure
Organic PStable PActive P
Labile P
soil surface
Equations to estimate Manure runoff P, Fertilizer runoff P, Sediment P loss, and Dissolved Soil P runoff
(Adapted from Vadas, et al. 2007)

Nutrient Application Assumptions
• Application rates are user-defined by season
• Fertilizer
• Manure
– solid or liquid forms (user-defined)
– Direct excretion of manure (i.e. pasture) is considered a separate manure source
– Proportioned as water-extractable P (WEP) and non-WEP
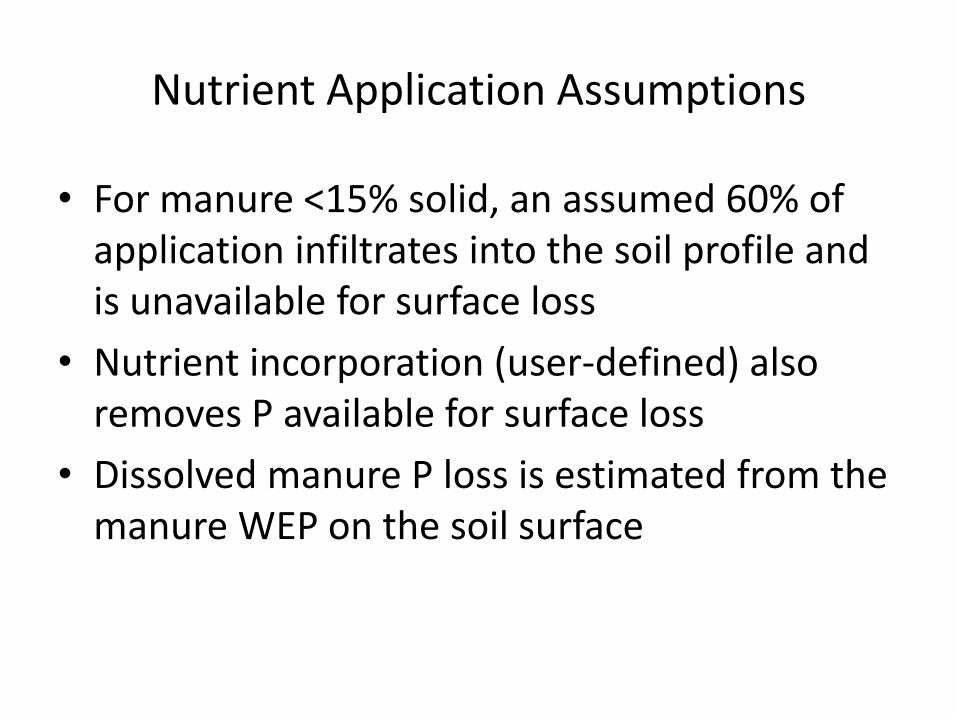
Nutrient Application Assumptions
• For manure <15% solid, an assumed 60% of application infiltrates into the soil profile and is unavailable for surface loss
• Nutrient incorporation (user-defined) also removes P available for surface loss
• Dissolved manure P loss is estimated from the manure WEP on the soil surface

Manure and Fertilizer Surface Runoff
Available WEP on
Surface
P on surface
P applied
Dissolved P in
Surface Runoff
-
Availability factor
Fertilizer: 100%
Manure: % WEP +
% Non-WEP
mineralized
P incorporation and infiltration
Runoff
Precipitation X Distribution Factor
X
X

Diagram of APLE Nutrient Sources and Soil Pools
FertilizerManure
Organic PStable PActive P
Labile P
100%
5%
95%
soil surface
Considers both WEP and stable forms with relationships to simulate decomposition rate based on season and application
Equations to estimate Manure runoff P, Fertilizer runoff P, Sediment P loss, and Dissolved Soil P runoff
(Adapted from Vadas, et al. 2007)

APLE Soil Pools
• Soil pool simulation is largely an evolution of the EPIC/SWAT soil routines
• Pools are initialized from soil test P, % clay, and % OM
• Soil pools can simulate two soil depths, especially a stratified top layer due to pasture or no-till
• Labile P is easily exchangeable P available for plant uptake or runoff
• Active P is more stable and less easily desorbed, but in equilibrium with Labile pool

Sediment P Loss
Sediment P Loss (kg/ha) = Eroded sediment * Soil Total P * P Enrichment Ratio
• Eroded sediment = soil loss due to erosion
• Soil Total P = total P content of all soil pools
• P Enrichment Ratio = ratio of total P in eroded soil versus surface soil

Dissolved Soil P Loss
Dissolved Soil Runoff P (kg/ha) = Soil Labile P * 0.005 * Annual Runoff * 10-6
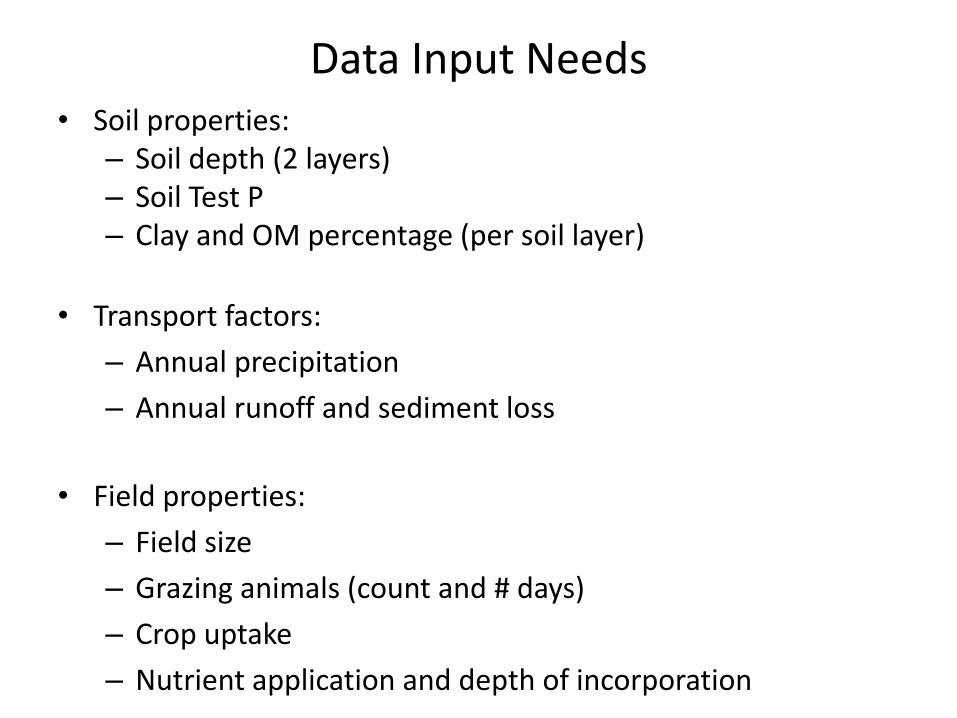
Data Input Needs• Soil properties:
– Soil depth (2 layers)– Soil Test P– Clay and OM percentage (per soil layer)
• Transport factors:
– Annual precipitation
– Annual runoff and sediment loss
• Field properties:
– Field size
– Grazing animals (count and # days)
– Crop uptake
– Nutrient application and depth of incorporation

APLE Output

Model Validation
• P loss in runoff
– Measured data from 28 crop studies from 13 states, Australia, and Ireland; 14 pasture studies from 5 states, Australia, and New Zealand
• Soil P dynamics
– Measured data from 19 studies monitoring changes in soil P from 1 to 25 years
• Under all scenarios, the model was notcalibrated differently

APLE P Loss Validation:
Surface Runoff
y = 1.03 x 0.03r² = 0.85
0
5
10
15
20
25
30
35
0 10 20 30
Es
tim
ate
d P
Lo
ss
(k
g/h
a)
Measured P loss (kg/ha)

APLE Soil P Validation
y = 1.02 x + 3.30
r² = 0.96
0
100
200
300
400
500
600
700
800
0 200 400 600 800
Pe
rdic
ted
So
il P
(m
g/k
g)
Measured Mehlich 3 P (mg/kg)

Current Research Objectives
• The objective of my research is to evaluate, identify, and improve the mechanics and representation of soil P as simulated in the Chesapeake Bay Watershed Model
• Primary areas of consideration:– Nutrient cycling within soil pools
– Fate and transport mechanisms
– Edge-of-field (EOF) base targets for cropland and pasture

Status
• Using data from HSPF and Scenario Builder to estimate average EOF targets for three landuses (hwm, lwm, pas) at the county scale
• Estimations are model calibration period of 1992-2005
• Currently running initial scenarios for hwm1992 to confirm model codes
• Gathering and organizing data for other years

ReferencesModel Development and Validation:Vadas, P.A., P.J.A. Kleinman, and A.N. Sharpley. 2004. A simple
method to predict dissolved phosphorus in runoff from surface-applied manures. J. Environ. Qual. 33:749-756.
Vadas, P.A., B.E. Haggard, and W.J. Gburek. 2005a. Predicting dissolved phosphorus in runoff from manured field plots. J. Environ. Qual. 34:1347-1353.
Vadas, P.A., P.J.A. Kleinman, A.N. Sharpley, and B.L. Turner. 2005b. Relating soil phosphorus to dissolved phosphorus in runoff: A single extraction coefficient for water quality modeling. J. Environ. Qual. 34:572-580.
Vadas, P.A. 2006. Distribution of phosphorus in manure slurry and its infiltration after application to soils. J. Environ. Qual. 35:542-547.
Vadas, P.A., W.J. Gburek, A.N. Sharpley, P.J.A. Kleinman, P.A. Moore, M.L. Cabrera, and R.D. Harmel. 2007. A model for phosphorus transformation and runoff loss for surface-applied manures. J. Environ. Qual. 36:324-332.
ReferencesVadas, P.A., L.B. Owens, and A.N. Sharpley. 2008. An empirical model for
dissolved phosphorus in runoff from surface-applied fertilizers. Agric. Ecosys. Environ. 127:59-65.
Vadas, P.A., and M.J. White. 2010. Validating Soil Phosphorus Routines in the Swat Model. Trans. ASABE 53:1469-1476.
Soil Pools (Epic/SWAT):Sharpley, A.N., C.A. Jones, C. Gray, and C.V. Cole. 1984. A Simplified Soil and
Plant Phosphorus Model .2. Prediction of Labile, Organic, and SorbedPhosphorus. Soil Sci. Soc. Am. J. 48:805-809.
Vadas, P.A., T. Krogstad, and A.N. Sharpley. 2006. Modeling phosphorus transfer between labile and nonlabile soil pools: Updating the EPIC model. Soil Sci. Soc. Am. J. 70:736-743.
Leaching Studies:Nelson, N.O., and J.E. Parsons. 2006. Modification and validation of GLEAMS
for prediction of phosphorus leaching in waste-amended soils. Trans. ASABE 49:1395-1407.
Nelson, N.O., J.E. Parsons, and R.L. Mikkelsen. 2005. Field-scale evaluation of phosphorus leaching in acid sandy soils receiving swine waste. J. Environ. Qual. 34:2024-2035.

EXTRAS

Scale in Phase 5 - Nutrients
BMP Factor
Land Acre Factor
Regional Factor
Edge of Stream
Expected loads from one acre that
reach 100 cfs stream or tidal waters
Edge of Stream
60-100 sq miles
In Stream Concentrations
Gains/Losses
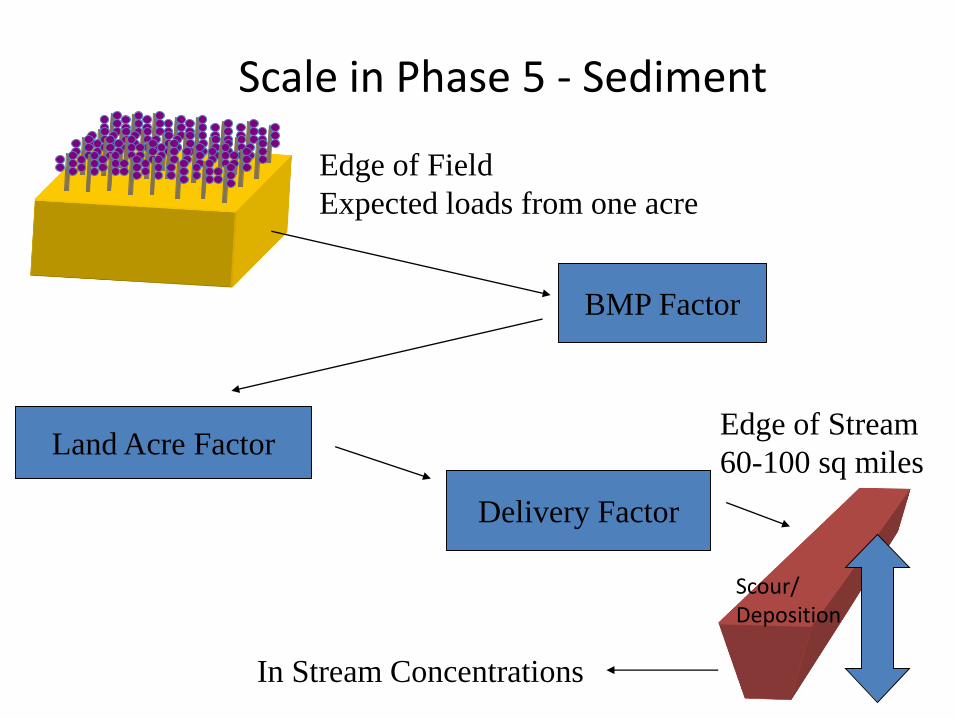
Scale in Phase 5 - Sediment
BMP Factor
Land Acre Factor
Delivery Factor
Edge of Field
Expected loads from one acre
Edge of Stream
60-100 sq miles
In Stream Concentrations
Scour/Deposition
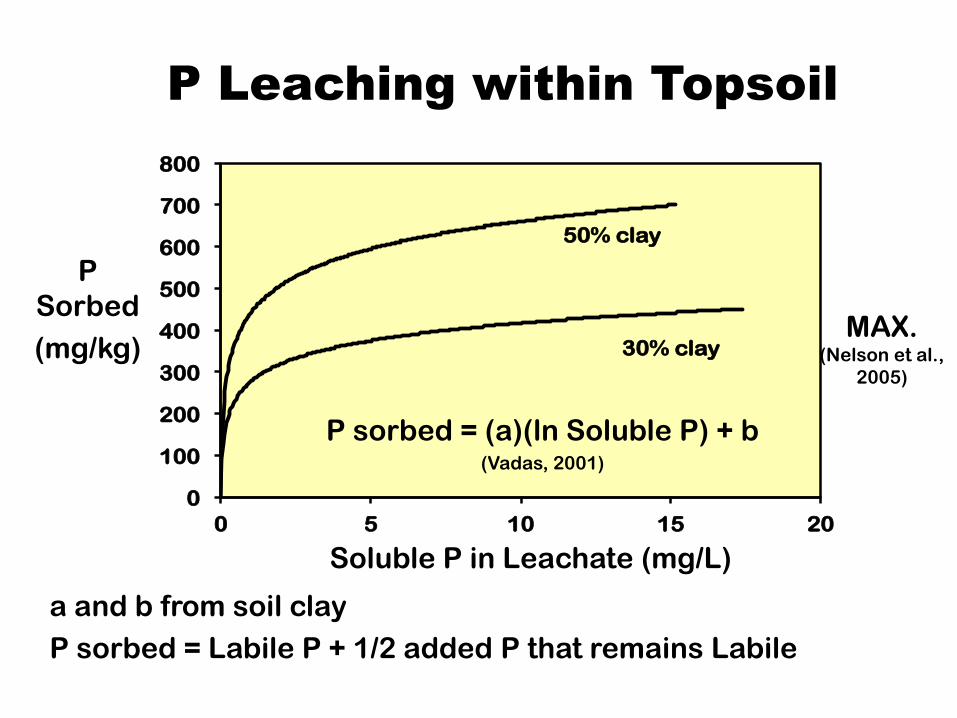
P Leaching within Topsoil
P
Sorbed
(mg/kg)
Soluble P in Leachate (mg/L)
50% clay
30% clay
0
100
200
300
400
500
600
700
800
0 5 10 15 20
P sorbed = (a)(ln Soluble P) + b(Vadas, 2001)
a and b from soil clay
P sorbed = Labile P + 1/2 added P that remains Labile
MAX. (Nelson et al.,
2005)
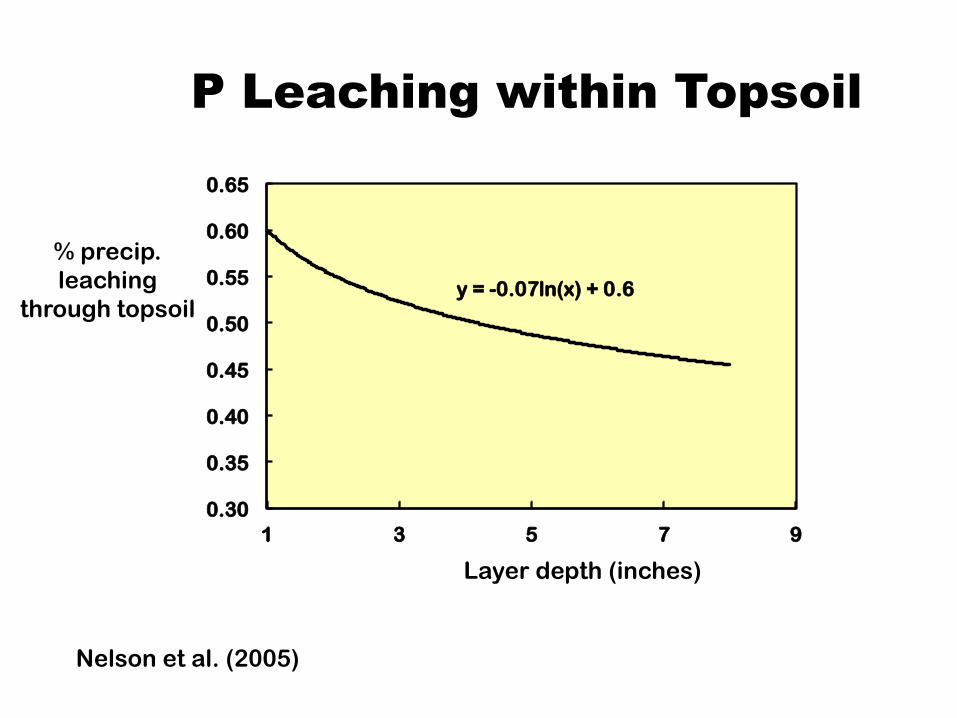
P Leaching within Topsoil
% precip.
leaching
through topsoily = -0.07ln(x) + 0.6
0.30
0.35
0.40
0.45
0.50
0.55
0.60
0.65
1 3 5 7 9
Layer depth (inches)
Nelson et al. (2005)

Grazing Animals Manure Generation: APLE vs. Scenario Builder
Animal Type
Daily Fecal Production
(kg)
Fecal Total P content (kg/kg)
Lactating Dairy Cow
8.9 0.0088
Dairy Heifer
3.7 0.0054
Dairy Dry Cow
4.9 0.0061
Dairy Calf 1.4 0.0054
Beef Cow 6.6 0.0067
Beef Calf 2.7 0.0092
Animal Type and AU count
Daily Fecal Production (lbs) per AU
Daily Fecal Production(kg) per animal
Fecal TPcontent (kg/kg)
Beef (1.14) 58 23.10 0.000726
Dairy (0.74) 86 52.76 0.000499
other cattle (2.08)
64.39 14.05 0.000454
Other animals to consider?• Horses• Goats • Sheeps and Lambs