API 4000â„¢ LC/MS/MS System Hardware Manual - AB Sciex
110
Hardware Manual AB SCIEX API 4000™ LC/MS/MS System Part Number: 5005565 A April 2010
Transcript of API 4000â„¢ LC/MS/MS System Hardware Manual - AB Sciex

Hardware Manual
AB SCIEX API 4000™ LC/MS/MS SystemPart Number: 5005565 A
April 2010

This document is provided to customers who have purchased AB SCIEX equipment to use in the operation of such AB SCIEX equipment. This document is copyright protected and any reproduction of this document or any part of this document is strictly prohibited, except as AB SCIEX may authorize in writing.
Equipment that may be described in this document is protected under one or more patents filed in the United States, Canada, and other countries. Additional patents are pending.
Software that may be described in this document is furnished under a license agreement. It is against the law to copy, modify, or distribute the software on any medium, except as specifically allowed in the license agreement. Furthermore, the license agreement may prohibit the software from being disassembled, reverse engineered, or decompiled for any purpose.
Portions of this document may make reference to other manufacturers and/or their products, which may contain parts whose names are registered as trademarks and/or function as trademarks of their respective owners. Any such usage is intended only to designate those manufacturers' products as supplied by AB SCIEX for incorporation into its equipment and does not imply any right and/or license to use or permit others to use such manufacturers' and/or their product names as trademarks.
AB SCIEX makes no warranties or representations as to the fitness of this equipment for any particular purpose and assumes no responsibility or contingent liability, including indirect or consequential damages, for any use to which the purchaser may put the equipment described herein, or for any adverse circumstances arising therefrom.
For research use only. Not for use in diagnostic procedures.
The trademarks mentioned herein are the property of AB Sciex Pte. Ltd. or their respective owners.AB SCIEX™ is being used under license.
AB SCIEX
71 Four Valley Dr., Concord, Ontario, Canada. L4K 4V8.
AB SCIEX LP is ISO 9001 registered.
© 2010 AB SCIEX.
Printed in Canada.

Table of ContentsAbout This Manual . . . . . . . . . . . . . . . . . . . . . . . . . . . . . . . . . . . . . . . . . 5
How This Manual Is Organized . . . . . . . . . . . . . . . . . . . . . . . . . . . . 10Technical Support . . . . . . . . . . . . . . . . . . . . . . . . . . . . . . . . . . . . . . . 11
Introduction to the System. . . . . . . . . . . . . . . . . . . . . . . . . . . . . . . . . . 13The Triple Quadrupole Mass Spectrometer . . . . . . . . . . . . . . . . . . . 13
Principles of MS . . . . . . . . . . . . . . . . . . . . . . . . . . . . . . . . . . . . . 14Principles of MS/MS . . . . . . . . . . . . . . . . . . . . . . . . . . . . . . . . . 15Data System . . . . . . . . . . . . . . . . . . . . . . . . . . . . . . . . . . . . . . . . 17
Work Process Flow. . . . . . . . . . . . . . . . . . . . . . . . . . . . . . . . . . . . . . 18Setting Up Instrument-Specific Parameters . . . . . . . . . . . . . . . . 19Setting Up Compound-Specific Parameters . . . . . . . . . . . . . . . . 19Setting Up Source-Specific Parameters . . . . . . . . . . . . . . . . . . . 19
Further Reading . . . . . . . . . . . . . . . . . . . . . . . . . . . . . . . . . . . . . . . . 20Hardware Overview . . . . . . . . . . . . . . . . . . . . . . . . . . . . . . . . . . . . . . . 23
Sample Introduction System. . . . . . . . . . . . . . . . . . . . . . . . . . . . . . . 23LC Pump or Syringe . . . . . . . . . . . . . . . . . . . . . . . . . . . . . . . . . . 23TurboIonSpray® Probe. . . . . . . . . . . . . . . . . . . . . . . . . . . . . . . . 24APCI Probe . . . . . . . . . . . . . . . . . . . . . . . . . . . . . . . . . . . . . . . . . 24Turbo V™ Source Housing . . . . . . . . . . . . . . . . . . . . . . . . . . . . 25Ion Source Probe Adjustments . . . . . . . . . . . . . . . . . . . . . . . . . . 26Ion Source Interlocks . . . . . . . . . . . . . . . . . . . . . . . . . . . . . . . . . 26Source Exhaust System. . . . . . . . . . . . . . . . . . . . . . . . . . . . . . . . 27Gas and Vacuum Panel . . . . . . . . . . . . . . . . . . . . . . . . . . . . . . . . 28
Vacuum System . . . . . . . . . . . . . . . . . . . . . . . . . . . . . . . . . . . . . . . . 29Vacuum Interface . . . . . . . . . . . . . . . . . . . . . . . . . . . . . . . . . . . . 29Vacuum Control System. . . . . . . . . . . . . . . . . . . . . . . . . . . . . . . 32
Ion Path Chamber . . . . . . . . . . . . . . . . . . . . . . . . . . . . . . . . . . . . . . . 42Power Distribution Module . . . . . . . . . . . . . . . . . . . . . . . . . . . . . . . 47
AC Power Distribution and Main Power Switch . . . . . . . . . . . . 47DC Power Distribution . . . . . . . . . . . . . . . . . . . . . . . . . . . . . . . . 47Control Panel . . . . . . . . . . . . . . . . . . . . . . . . . . . . . . . . . . . . . . . 47
System Electronics Box . . . . . . . . . . . . . . . . . . . . . . . . . . . . . . . . . . 48
3

Table of Contents API 4000™ LC/MS/MS System Hardware Manual
Data System . . . . . . . . . . . . . . . . . . . . . . . . . . . . . . . . . . . . . . . . . . . 49Communication Ports . . . . . . . . . . . . . . . . . . . . . . . . . . . . . . . . . 49Interface Connection Panel . . . . . . . . . . . . . . . . . . . . . . . . . . . . . 49Software . . . . . . . . . . . . . . . . . . . . . . . . . . . . . . . . . . . . . . . . . . . 50Operating System . . . . . . . . . . . . . . . . . . . . . . . . . . . . . . . . . . . . 51
Starting Up the System. . . . . . . . . . . . . . . . . . . . . . . . . . . . . . . . . . . . . 53Turning On the Instrument . . . . . . . . . . . . . . . . . . . . . . . . . . . . . . . . 53Warming Up the Instrument . . . . . . . . . . . . . . . . . . . . . . . . . . . . . . . 54
Preparing the Turbo V™ Source . . . . . . . . . . . . . . . . . . . . . . . . . . . . 55Principles of Sample Introduction . . . . . . . . . . . . . . . . . . . . . . . . . . 55Ionization Process . . . . . . . . . . . . . . . . . . . . . . . . . . . . . . . . . . . . . . . 55
TurboIonSpray® Ion Source . . . . . . . . . . . . . . . . . . . . . . . . . . . . 55APCI . . . . . . . . . . . . . . . . . . . . . . . . . . . . . . . . . . . . . . . . . . . . . . 57
Choosing an Ion Source Probe . . . . . . . . . . . . . . . . . . . . . . . . . . . . . 60TurboIonSpray® Probe Features. . . . . . . . . . . . . . . . . . . . . . . . . 60APCI Probe Features . . . . . . . . . . . . . . . . . . . . . . . . . . . . . . . . . 60
Installing the Turbo V™ Source. . . . . . . . . . . . . . . . . . . . . . . . . . . . 61Installing the Turbo V™ Source Housing and Probe . . . . . . . . . 61Ventilation . . . . . . . . . . . . . . . . . . . . . . . . . . . . . . . . . . . . . . . . . 63
Preparing the TurboIonSpray® Probe. . . . . . . . . . . . . . . . . . . . . . . . 64TurboIonSpray® Probe Components . . . . . . . . . . . . . . . . . . . . . 64Inlet Description . . . . . . . . . . . . . . . . . . . . . . . . . . . . . . . . . . . . . 64Ion Source Probe Adjustments . . . . . . . . . . . . . . . . . . . . . . . . . . 65Specifications . . . . . . . . . . . . . . . . . . . . . . . . . . . . . . . . . . . . . . . 66Optimizing the TurboIonSpray® Probe . . . . . . . . . . . . . . . . . . . 66Operating Tips . . . . . . . . . . . . . . . . . . . . . . . . . . . . . . . . . . . . . . 69
Preparing the APCI Probe. . . . . . . . . . . . . . . . . . . . . . . . . . . . . . . . . 70APCI Probe Components . . . . . . . . . . . . . . . . . . . . . . . . . . . . . . 70Inlet Description . . . . . . . . . . . . . . . . . . . . . . . . . . . . . . . . . . . . . 70Ion Source Probe Adjustments . . . . . . . . . . . . . . . . . . . . . . . . . . 71Specifications . . . . . . . . . . . . . . . . . . . . . . . . . . . . . . . . . . . . . . . 72Optimizing the APCI Probe . . . . . . . . . . . . . . . . . . . . . . . . . . . . 72
Controlling the Turbo V™ Source Temperature . . . . . . . . . . . . . . . 76Maintaining the Turbo V™ Source . . . . . . . . . . . . . . . . . . . . . . . . . 76
Removing and Replacing the Turbo V™ Source Housing. . . . . 76Adjusting the Corona Discharge Needle . . . . . . . . . . . . . . . . . . 77Replacing the Corona Discharge Needle . . . . . . . . . . . . . . . . . . 77
Shutting Down the System . . . . . . . . . . . . . . . . . . . . . . . . . . . . . . . . . . 79Appendix A: PPG Exact Mass Table . . . . . . . . . . . . . . . . . . . . . . . . . 83Appendix B: Generic Parameters . . . . . . . . . . . . . . . . . . . . . . . . . . . . 87Appendix C: Consumables. . . . . . . . . . . . . . . . . . . . . . . . . . . . . . . . . . 89Glossary . . . . . . . . . . . . . . . . . . . . . . . . . . . . . . . . . . . . . . . . . . . . . . . . . 91Index. . . . . . . . . . . . . . . . . . . . . . . . . . . . . . . . . . . . . . . . . . . . . . . . . . . 111
4
About This ManualThe API 4000™ LC/MS/MS System Hardware Manual is targeted to operators who are familiar with mass spectrometry but are new to the API 4000™ LC/MS/MS system. This manual contains the instructions required to start up and operate the components of the API 4000 system. This manual is not designed to instruct operators on procedures for the repair and servicing of the instrument. If the instrument needs repair or servicing, contact an AB SCIEX Field Service Employee. Note that the photographs in this manual may not reflect your instrument exactly, and that all instrument locations specified in this manual are stated when viewing the instrument from the front.
Additional operational information is available in the online Help and in the Analyst® Software Operator’s Manual. Information on configuring peripheral devices is available in the online Help and in the Peripheral Devices Setup Manual.Any person using an AB SCIEX mass spectrometer system should be fully trained in its safe operation as well as in laboratory procedures. All warnings should be followed implicitly as failure to do so could result in serious injury. Within the scope of this manual, the following conventions are used:
WARNING! Indicates an operation that may cause personal injury if precautions are not followed.
WARNING! All standard safety precautions regarding high voltages, vacuum systems, and electrostatic discharge must be followed to prevent personal injury or damage to the instrument.
WARNING! If hazardous, biohazardous, or radioactive materials are injected into the instrument, all appropriate safety precautions should be taken. If these materials have been used, the instrument should be handled according to the material safety regulations in the country of use (for example, WHMIS).
WARNING! Indicates that the probes and source housing may reach high temperatures. Follow the stated procedures to avoid injury.
5

About This Manual API 4000™ LC/MS/MS System Hardware Manual
CAUTION! Indicates an operation that may cause damage to the instrument if precautions are not followed.
NOTE: Emphasizes significant information in a procedure or description.
How This Manual Is OrganizedThis API 4000™ LC/MS/MS System Hardware Manual is organized as follows:
Introduction to the SystemThis section provides a general introduction to the API 4000 system and the AB SCIEX triple quadrupole mass spectrometer. This section includes an overview of liquid chromatography, mass spectrometry (MS), and mass spectrometry/mass spectrometry (MS/MS). The principles of sample introduction are also discussed.
Hardware OverviewThis section provides a detailed description of the sample introduction system, gas and vacuum panel, vacuum system, and ion path chamber. The electronics of the API 4000 system and software—power distribution system, system electronics box, and data system—are also documented.
Starting Up the SystemThis section provides step-by-step procedures for starting up the API 4000 system after an overnight shutdown or an extended shutdown.
Preparing the Turbo V™ SourceThis section provides a detailed description of the procedures required for setting up and using the TurboIonSpray® ion source and APCI ion source. This section includes a detailed explanation of sample introduction theory as well as procedures for maintaining the ion sources.
Shutting Down Your SystemThis section provides step-by-step procedures for shutting down the API 4000 system overnight or completely.
AppendicesAppendix A - PPG Exact Mass TableProvides a list of the default parameters for the API 4000 system.Appendix B - Generic ParametersProvides a list of the exact monoisotopic masses and charged species (positive and negative) observed with the PPG (polypropylene glycol) calibration solutions.Appendix C - ConsumablesProvides a list of consumable parts for the API 4000 system.
6
API 4000™ LC/MS/MS System Hardware Manual About This Manual
GlossaryProvides a list of API 4000 LC/MS/MS system and related mass spectrometry terminology used in this manual.
Technical SupportAB SCIEX and its representatives maintain a staff of fully-trained service and technical specialists strategically located throughout the world. They can answer hardware or software questions pertaining to the instrument.For technical support and other information please contact your Field Service Employee or consult the AB SCIEX web site at www.absciex.com.
7

About This Manual API 4000™ LC/MS/MS System Hardware Manual
8

1
Introduction to the SystemA mass spectrometer is an instrument that measures the masses of electrically charged molecules, or ions. Mass spectrometry (MS) is an analytical technique that is used for the identification of unknown compounds, the quantitation of known compounds, and the elucidation of structural information and chemical properties of molecules. Once ions are in the mass spectrometer, they are sorted according to their mass-to-charge ratio (m/z). A detector converts the signal to electrical current. The magnitude of the electrical signal as a function of m/z is converted by the data system into a mass spectrum.Liquid chromatography (LC) separates the components of a sample mixture before introducing them to the mass spectrometer. The amount of separation is determined by the LC conditions, type of sample, and complexity of the matrix.
WARNING! If you need to move the system, contact a Field Service Employee to assist you. Risk of personal injury or instrument damage.
The Triple Quadrupole Mass SpectrometerThe AB SCIEX API 4000™ LC/MS/MS system uses the TurboIonSpray® probe and the atmospheric pressure chemical ionization (APCI) probe to produce ions from liquid samples. The term LC/MS/MS, applied to the triple quadrupole series, is a generic label for the combined analytical processes of liquid separation and subsequent mass spectrometric analysis. The instrument is configured to perform complex MS/MS analysis, but it can, for less rigorous analytical requirements, perform single MS (LC/MS) scans.The API 4000 LC/MS/MS system allows all modes of MS/MS operation for full characterization of biopharmaceutical compounds and the specificity needed for new drug development. For pharmaceutical and pharmakinetic samples, MS/MS has the sensitivity and specificity required to analyze hundreds of samples per day without extensive sample preparation.For peptides and proteins, molecular weights can be determined with accuracies better than 0.01% at 200 kDa.The major components of the API 4000 system are shown in the following figure.
13

Introduction to the System API 4000™ LC/MS/MS System Hardware Manual
API 4000™ system components with pump
Principles of MSIn single quadrupole mode, the API 4000 system separates ions representative of the sample molecular components based on their m/z ratio. Ions of a unique m/z ratio are separated by the API single mass filter quadrupole and counted to provide mass spectra for the sample.The mass filter quadrupole consists of four cylindrical rods mounted in a ceramic collar surrounding the ion path. Fixing the ratio of RF to DC voltages applied to the quadrupole rods determines the mass of the ions entering the quadrupole.Ions of a unique m/z ratio pass unobstructed through the quadrupole as a function of the quadrupole power supply (QPS) voltages applied. Ions of different m/z ratios have unstable oscillations which increase in amplitude until they collide with the quadrupole rods and are removed from the ion stream.A sample mixture containing, for example, three molecules, R, M, and N, is introduced into the ion source. Soft ionization in the ion source generates R+, M+, and N+ ions (quasi-molecular ions formed typically by attaching one or more protons in the positive mode, or by removing one or more protons or attaching an electron in the negative mode).
Isolation of mixture R, M, and N
Additional structural information can sometimes be obtained by fragmenting the “precursor” ion in a primary collision region between the orifice and the skimmer. This process is often referred to as collision-induced mass spectrometry (CID/MS).
14

API 4000™ LC/MS/MS System Hardware Manual Introduction to the System
Isolation of product ions from a sample using orifice-skimmer technique
The ions generated in the ion source are drawn through a curtain of dry inert gas into the ion optics housed inside the vacuum chamber. The mass filter quadrupole in the vacuum chamber selectively filters the ions based on their m/z ratio. The filtered ions are focused to the detector. As ions collide with the detector, they produce a pulse of electrons. The electron pulse is collected and converted to a digital signal to provide an ion count as a function of ion mass. The acquired data is relayed to the computer where it can be displayed as either full mass spectra, intensity of single or multiple ions versus time, or total ion current versus time.
Principles of MS/MSIn triple quadrupole mode, the API 4000 system uses two identical mass filter quadrupoles (Q1 and Q3) separated by a collision cell, which encloses an RF-only quadrupole (Q2). The fundamental principle of MS/MS is illustrated in the figure “Isolation of product ions from a mixture of R, M and N” on page 15. A sample mixture containing, for example, three molecules, R, M, and N, is introduced into the ion source. Soft ionization in the ion source generates R+, M+, and N+ ions (quasi-molecular ions formed typically by attaching one or more protons in the positive mode, or by removing one or more protons or attaching an electron in the negative mode).
Isolation of product ions from a mixture of R, M and N
In a product ion scan, the first mass filter, Q1, separates or filters ions according to their m/z ratio and allows only one ion to enter the collision cell (M+). The M+ ion enters Q2 where it is fragmented by collision with neutral gas molecules in a process referred to as collisionally activated dissociation (CAD). The fragment ions generated are then passed into Q3 and filtered to provide a spectrum. The ions created by the source are referred to as precursor ions, the collision products are referred to as product, or fragment, ions.
15

Introduction to the System API 4000™ LC/MS/MS System Hardware Manual
In a precursor ion scan, the second mass analyzer (Q3) is fixed to the fragment mass of interest and the first mass analyzer (Q1) is scanned over a range. The resulting mass spectrum will display the masses of all the compounds that produced the specified fragment mass.In a neutral loss scan, both mass analyzers (Q1 and Q3) are scanned with a constant mass difference between them. The resulting mass spectrum will display the mass of the compounds that have undergone the specified loss. This type of scan is useful in identifying compounds from similar functional groups.The fragment ions are filtered in Q3 before they are collected at the detector. As ions collide with the detector, they produce a pulse of electrons. The pulse is converted to a digital signal which is counted to provide an ion count. The acquired data is relayed to the computer where it can be displayed as either full mass spectra, intensity of single or multiple ions versus time, or total ion current versus time.The technique of MS/MS is well suited to mixture analysis because the characteristic fragment ion spectra can be obtained for each component in a mixture without interference from the other components, assuming that the ions have a unique m/z ratio. This analysis can also be used for targeted analysis by monitoring specific precursor/product ions with Q1 and Q3 respectively while the sample is eluting. This type of analysis is more specific than single MS, which only discriminates on the basis of molecular weight.The MS/MS technique is well suited to structural elucidation studies. The same fragmentation pattern that provides identification of a compound in a complex mixture can also reveal pertinent information regarding the structure of all their precursors.Additional structural information can sometimes be obtained by fragmenting the “precursor” ion in a primary collision region between the sampling orifice skimmer. The “fragment” ions, that is, a second generation fragment ion spectrum, provide structural information on both the original precursor ions and the first generation fragment ions.
Isolation of second generation product ions from mixture M
The triple quadrupole instruments contain the same components as the single quadrupole instruments with the addition of a second mass filter (Q3). The high pressure region is the same, but the high vacuum region contains the Q1 prefilter (stubbies) and the Q1 and Q3 mass filter quadrupoles that are separated on the rail by the collision cell. The collision cell is a ceramic housing enclosing the Q2 RF-only quadrupole, which, when pressurized with CAD gas, provides a local high pressure region for ion fragmentation.Ions pass through the same path as in the single quadrupole instrument until they reach the Q2 RF-only quadrupole, which is contained in the collision cell. The selected ions arrive at Q2, while those rejected eventually collide with the rods and are lost.The Q2 RF-only quadrupole is separated from the Q1 and Q3 mass filters by the interquad lenses IQ2 and IQ3 (or ST3, depending on the triple quadrupole series). Q2 has no mass
16

API 4000™ LC/MS/MS System Hardware Manual Introduction to the System
filtering capabilities; it operates in total ion mode. If no CAD gas is present to fragment the sample ions, Q2 transports the ions directly into Q3. If CAD gas is present, then the ions which enter Q2 collide with the neutral CAD gas molecules. If pressurized, the voltage drop between the entrance lenses and Q2 provides the ions with the energy which induces fragmentation when the ions collide with CAD gas molecules. Through the energetic collisions, the ion translational energy is converted into internal energy which fractures bonds causing ion fragmentation. After collision, the unfragmented precursor ions and the fragmented ions are transported to Q3, where they are filtered again.When operating in MS/MS mode, the Q3 mass filter is physically and functionally identical to Q1. The ions, including a mixture of precursor and fragment ions, enter Q3 where they are filtered according to mass. In single MS operating mode (Q1 scan type), Q3 acts as an ion transporter (like a Q0 or RF-only quadrupole) with no filtering action. Terms used to describe this operation are “total ion mode,” “RF-only mode,” and “AC-only mode.”
API 4000™ mass filter rail
Data SystemThe application software requires a Windows computer. See the Analyst® Software Laboratory Director’s Guide to Security and Regulatory Compliance for further information on hardware and operating system requirements. The computer with the associated system software works with the system controller and associated firmware to control the instrument and data acquisition routines. The system controller is a computer which controls the operation of the main console equipment. When operating the instrument, the acquired data is relayed to the system software where it can be displayed as either full mass spectra, intensity of single or multiple ions versus time, or total ion current versus time.
17
Introduction to the System API 4000™ LC/MS/MS System Hardware Manual
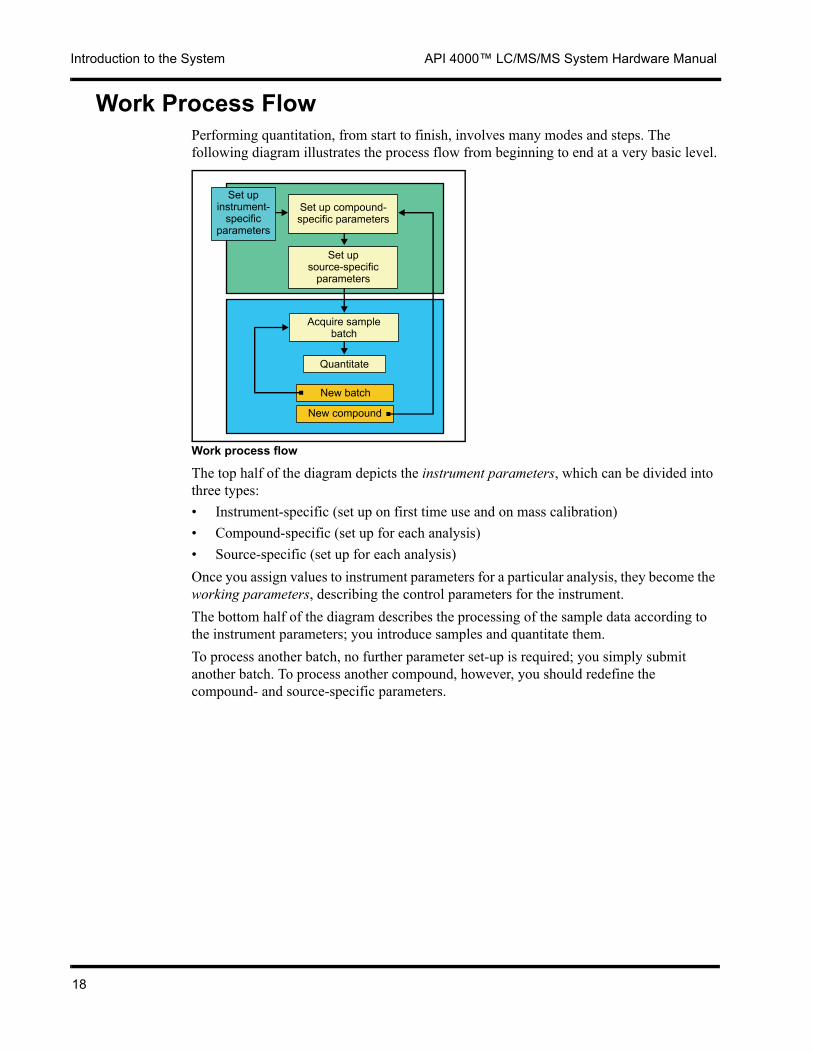
Work Process FlowPerforming quantitation, from start to finish, involves many modes and steps. The following diagram illustrates the process flow from beginning to end at a very basic level.
Work process flow
The top half of the diagram depicts the instrument parameters, which can be divided into three types:• Instrument-specific (set up on first time use and on mass calibration)• Compound-specific (set up for each analysis)• Source-specific (set up for each analysis)Once you assign values to instrument parameters for a particular analysis, they become the working parameters, describing the control parameters for the instrument.The bottom half of the diagram describes the processing of the sample data according to the instrument parameters; you introduce samples and quantitate them.To process another batch, no further parameter set-up is required; you simply submit another batch. To process another compound, however, you should redefine the compound- and source-specific parameters.
18
API 4000™ LC/MS/MS System Hardware Manual Introduction to the System
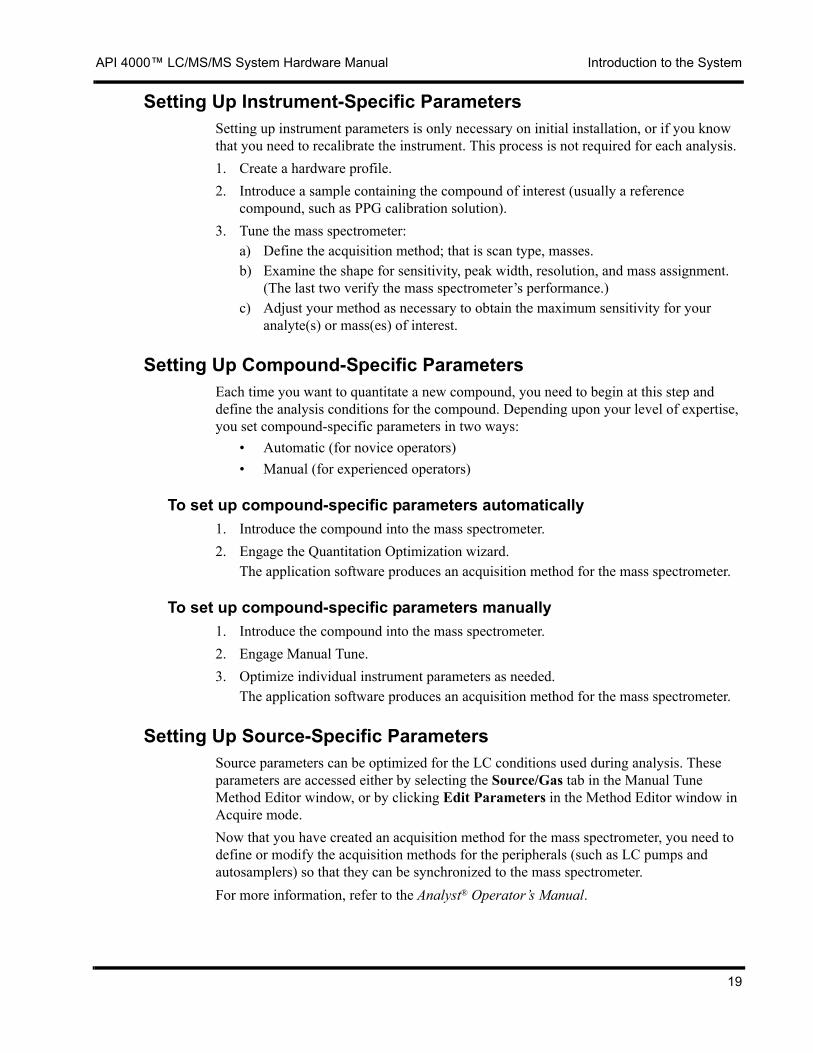
Setting Up Instrument-Specific ParametersSetting up instrument parameters is only necessary on initial installation, or if you know that you need to recalibrate the instrument. This process is not required for each analysis.1. Create a hardware profile.2. Introduce a sample containing the compound of interest (usually a reference
compound, such as PPG calibration solution).3. Tune the mass spectrometer:
a) Define the acquisition method; that is scan type, masses.b) Examine the shape for sensitivity, peak width, resolution, and mass assignment.
(The last two verify the mass spectrometer’s performance.)c) Adjust your method as necessary to obtain the maximum sensitivity for your
analyte(s) or mass(es) of interest.
Setting Up Compound-Specific ParametersEach time you want to quantitate a new compound, you need to begin at this step and define the analysis conditions for the compound. Depending upon your level of expertise, you set compound-specific parameters in two ways:
• Automatic (for novice operators)• Manual (for experienced operators)
To set up compound-specific parameters automatically1. Introduce the compound into the mass spectrometer.2. Engage the Quantitation Optimization wizard.
The application software produces an acquisition method for the mass spectrometer.
To set up compound-specific parameters manually1. Introduce the compound into the mass spectrometer.2. Engage Manual Tune.3. Optimize individual instrument parameters as needed.
The application software produces an acquisition method for the mass spectrometer.
Setting Up Source-Specific ParametersSource parameters can be optimized for the LC conditions used during analysis. These parameters are accessed either by selecting the Source/Gas tab in the Manual Tune Method Editor window, or by clicking Edit Parameters in the Method Editor window in Acquire mode.Now that you have created an acquisition method for the mass spectrometer, you need to define or modify the acquisition methods for the peripherals (such as LC pumps and autosamplers) so that they can be synchronized to the mass spectrometer.For more information, refer to the Analyst® Operator’s Manual.
19
Introduction to the System API 4000™ LC/MS/MS System Hardware Manual
Further Reading
BooksW.M.A. Niessen and J. van der Greef, Liquid Chromatography—Mass Spectrometry: Principles and Applications, Marcel Dekker, Inc., 1992.This book is a good basic reference for mass spectrometry. It includes what mass spectrometry is, and how it works, as well as a good introduction to applications.Richard B. Cole, Electrospray Ionization Mass Spectrometry, John Wiley & Sons, Inc., 1997.This book presents an assemblage of articles by leading researchers in the field of ESI-MS who discuss the different approaches to the understanding and exploitation of ESI-MS.This book is ideal for advanced users.Lloyd R. Snyder, Joseph J. Kirkland, Joseph L. Glajch, Practical HPLC Method Development, John Wiley & Sons, Inc., 1997.Although this is a book on HPLC, the authors have added information on mass spectrometry as a detector for HPLC into the second edition. An easy introduction for those with a pure wet-chemistry background.Ross Willoughby, Edward Sheehan, Samuel Mitrovitch, A Global View of LC/MS: How To Solve Your Most Challenging Analytical Problems, Global View Publishing, 1998.This guide is meant to be a primary resource for problem-solving. It includes useful information on learning, acquiring equipment, and making the right experimental choices in LC/MS.J.R. Chapman, Practical Organic Mass Spectrometry, John Wiley & Sons, Inc., 1998.This volume provides a comprehensive survey of current techniques for the use of mass spectrometry in organic chemical and biochemical analysis. Every aspect of modern instrumentation and technique is discussed.
Journal ArticlesMichael P. Balogh, “The commercialization of LC-MS During 1987 - 1997: A Review of Ten Successful Years.” LC.GC, 16(2), 1998.This title is a review of high pressure liquid chromatography (HPLC) and its commercialization. A good source for viewing the whole picture of the development of liquid chromatography-mass spectrometry.S.S. Medley, “Energetic Ion Mass Analysis Using a Radio-Frequency Quadrupole Filter.” Revue of Scientific Instruments, 49(8), 1978.This paper describes the method of using a radio-frequency quadrupole filter in mass spectrometry.
20

API 4000™ LC/MS/MS System Hardware Manual Introduction to the System
World Wide Web Siteswww.asms.orgWeb site of the American Society for Mass Spectrometry. Contains links to academic, government and association sites on the subject, as well as information on the organization itself.www.csms.inter.ab.caWeb site of the Canadian Society for Mass Spectrometry. Contains information about Canadian meetings of interest and links to the web sites of other national associations for mass spectrometry.www.chemistry.gatech.edu/stms/This site is the Usenet newsgroup on scientific techniques in mass spectrometry.www.chemistry.wustl.edu/˜msf/This Washington University Mass Spectrometry Resource site contains a tutorial on methods for mass spectrometry.www.lcms.comThis is the Internet site of Chem-Space Associates. It is designed to facilitate growth, education, efficiency, and interactive discussion. There are separate areas for newcomers and practitioners. A search engine is provided.
21

Introduction to the System API 4000™ LC/MS/MS System Hardware Manual
22

2
Hardware OverviewThe API 4000™ LC/MS/MS system consists of a table-top mounted instrument, a computer, and a printer. The operator controls the API 4000 system through the software loaded on the computer. The software runs on a Windows operating system.
WARNING! If you need to move the system, contact a Field Service Employee to assist you. Risk of personal injury or instrument damage.
Sample Introduction SystemThe sample introduction system for the API 4000 system uses removable probes mounted one at a time through the top of a Turbo V™ source housing. This system requires only two or three mechanical adjustments. It provides excellent performance through high sensitivity and low chemical noise.The following sections provide an overview of the hardware in the sample introduction system.
LC Pump or SyringeThe liquid sample stream is pumped to the ion source probe by an optional external pump or syringe drive. Flow rates are determined by the inlet requirements, the chromatography, or the volume of sample available. If introduced by an LC pump, the sample may be injected through a loop injector (flow injection analysis or FIA) or by a separation column (LC/MS). Samples must be sufficiently prefiltered so that the capillary tubing in the inlets is not blocked by particles, precipitated samples, or salts.Because there are many optional pumps, autosamplers, and syringe configurations, they are not all described here. For additional information about a particular pump, autosampler or syringe configurations, see the Peripheral Devices Setup Manual for your particular unit(s).
23

Hardware Overview API 4000™ LC/MS/MS System Hardware Manual
TurboIonSpray® Probe
TurboIonSpray® probe
The TurboIonSpray® probe is a type of removable ion source. It converts a liquid sample into gas phase ions. Samples introduced through the TurboIonSpray probe tip are nebulized by a jet of gas from a high-voltage sprayer, creating a mist of small highly-charged droplets. The TurboIonSpray probe is located centrally with two turbo heaters that spray heated dry gas placed at a 45° angle to each side. The combination of IonSpray effluent and the heated dry gas from the turbo sprayer are projected at a 90° angle to the orifice.The ions in the droplets evaporate from the droplet surface in the ion source by a process called “ion evaporation.” The interaction between the IonSpray and the heated dry gas increases the rate of solvent evaporation from droplets, resulting in an increased ion signal.The probe uses a heater and a computerized temperature control circuit board. The TurboIonSpray probe uses the same source of gas to create the spray and heater gas for the turbo spray.Typically, the TurboIonSpray probe is used at sample flow rates from 40 to 1000 μL/min. When operated in IonSpray mode (no turbo gas or heat) flow rates can go down to 5 μL/min (infusion).
APCI Probe
APCI probe
The atmospheric pressure chemical ionization (APCI) probe is a type of removable ion source. It produces ions by nebulizing the liquid sample in a heated tube, causing the
24
API 4000™ LC/MS/MS System Hardware Manual Hardware Overview
finely dispersed sample drops to vaporize. This process leaves the molecular constituents of the sample intact. The molecules are ionized through a process called atmospheric pressure chemical ionization (APCI) induced by a corona discharge needle as they pass through the ion source housing into the orifice in the curtain plate.The probe uses a heater and a computerized temperature control circuit board. The APCI probe uses nebulizer gas to create the spray, which travels from the heated tube into the path of the corona discharge needle mounted on the end of the probe.Typically, the APCI probe is used at sample flow rates from 50 to 2000 μL/min.
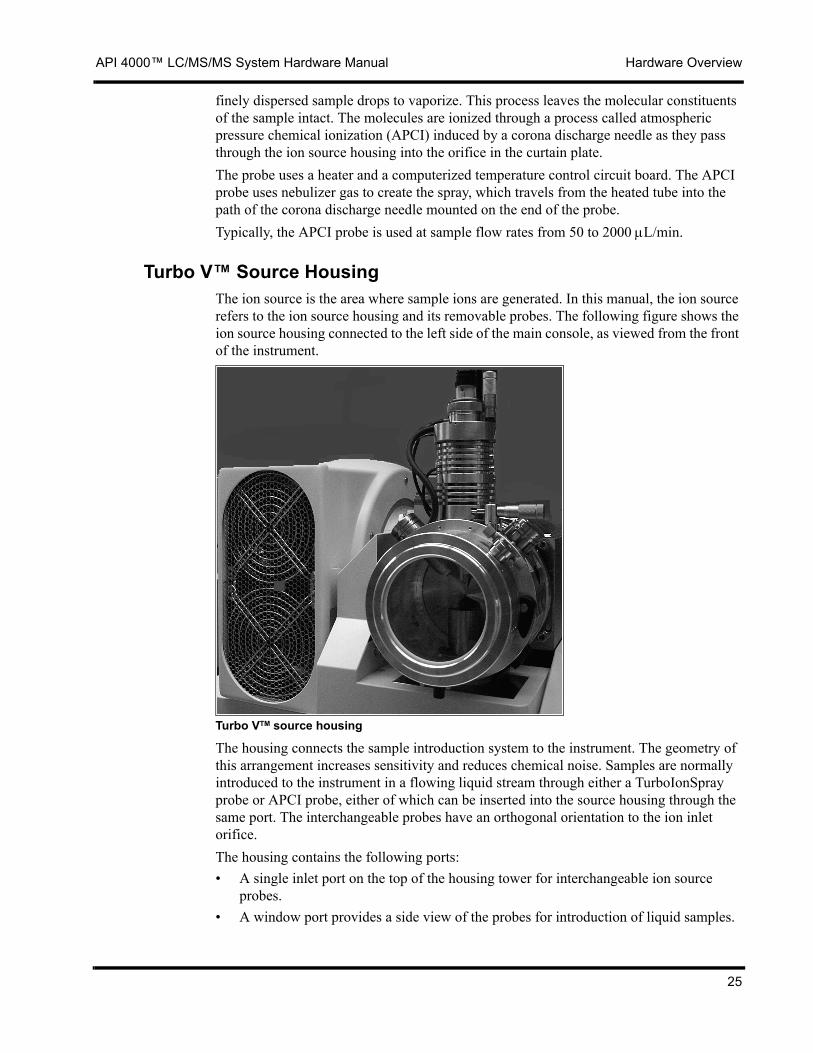
Turbo V™ Source HousingThe ion source is the area where sample ions are generated. In this manual, the ion source refers to the ion source housing and its removable probes. The following figure shows the ion source housing connected to the left side of the main console, as viewed from the front of the instrument.
Turbo VTM source housing
The housing connects the sample introduction system to the instrument. The geometry of this arrangement increases sensitivity and reduces chemical noise. Samples are normally introduced to the instrument in a flowing liquid stream through either a TurboIonSpray probe or APCI probe, either of which can be inserted into the source housing through the same port. The interchangeable probes have an orthogonal orientation to the ion inlet orifice.The housing contains the following ports:• A single inlet port on the top of the housing tower for interchangeable ion source
probes.• A window port provides a side view of the probes for introduction of liquid samples.
25

Hardware Overview API 4000™ LC/MS/MS System Hardware Manual
• A drain port on the bottom.• A pressure relief port on the side.Tempered glass windows on the side and at the end of the housing lets the operator see the probes and nebulized stream in the interior of the housing.The source housing mounts onto the front end of the vacuum chamber and is held in position by two metal rods that are rotated with locking arms. The ion source probes and the source housing can be quickly and easily removed without tools to provide convenient access to the vacuum interface. If a valid ion source probe is not properly installed in the source housing, or the source housing itself is not properly installed, an interlock disables the instrument’s high-voltage power supply.Gas, high voltage, and electrical connections to the installed ion source probe enter through the front plate of the interface and connect internally through the source housing. A sample splitter is attached to the right side of the source housing when facing the housing window. When an ion source probe is inserted into the housing, all electrical and gas connections are made. Only the sample line from the splitter needs to be connected manually to the probe. The probe can be adjusted vertically and horizontally for optimal performance.A passive, positive-pressure exhaust system exhausts ion source gases through a drain port without introducing chemical noise. The drain port connects through a drain chamber and a source exhaust pump to a drain vessel and a customer-supplied exhaust ventilation system.
Ion Source Probe AdjustmentsA micrometer scale on top of the housing tower allows a y-axis adjustment (up to 13 mm). Another micrometer scale on the side of the housing tower allows an x-axis adjustment (up to 10 mm). A black collar mounted in the handle of the ion source probe raises and lowers the sample tube in relation to the nebulizing jet to produce an optimal signal.
Ion Source InterlocksThe different ion source probes, such as the APCI probe or the TurboIonSpray probe, have different identifying resistor values, which indicate to the temperature controller module which probe is installed. This allows the temperature controller module to set the temperature for the probe in use.The system controller controls the source exhaust system, a safety feature that isolates the sample vapors and exhaust products from the laboratory environment.If the source housing is not installed, the instrument’s high-voltage power supply is disabled. If the instrument senses a gas fault then the high voltage is turned off.
26

API 4000™ LC/MS/MS System Hardware Manual Hardware Overview
Source Exhaust System
WARNING! Ensure proper operation of the laboratory exhaust system prior to performing analytical measurements with this instrument.
All ion sources produce both sample and solvent vapors. These vapors are a potential hazard to the laboratory environment. The source exhaust system is designed to safely remove and allow for the appropriate handling of the ion source exhaust products.The ion source housing operates at slightly above atmospheric pressure due to the entrance of the Curtain Gas™ supply and the probe gas into the housing. The slightly positive gas pressure tends to move waste gases through the exit port of the housing into the drain chamber that is mounted under the housing. Waste liquids from the housing also drain into this chamber. The chamber output is connected to the source exhaust pump in the front bulkhead assembly.
API 4000™ instrument source exhaust system
The source exhaust pump is a venturi system that uses a flow of gas through a venturi tube to draw the vapors and liquid from the drain chamber. Clean compressed air from an external source is needed to drive the source exhaust gas flow. The flow of source exhaust gas and effluent create a negative pressure on the input side of the pump, drawing air into the drain chamber to dilute the gases.The effluent output of the source exhaust pump connects through a fitting on the gas and vacuum panel and a drain line to a 10-liter (3-gallon) drain vessel. The drain vessel can be
27

Hardware Overview API 4000™ LC/MS/MS System Hardware Manual
placed under a fume hood, or the gas output hose from the lid of the vessel can be loosely coupled to an exhaust vent system, to remove the exhaust gases from the laboratory.
WARNING! Take all necessary precautions to ensure the safe disposal of the source exhaust gas.
The TurboIonSpray probe and the APCI probe ion sources produce a large volume of exhaust products because both use heat and additional volumes of gas to produce ions. As a result, the use of the source exhaust system is an essential component of the two ion sources. When either the TurboIonSpray probe or the APCI probes are installed, the firmware will not enable the instrument electronics unless the source exhaust system is operating.
WARNING! You must ensure that the source exhaust system is properly connected, particularly if samples containing toxic or highly volatile chemicals or solvents are being analyzed. A minimum 20% positive oxygen flow into the laboratory is also recommended.
A pressure switch mounted on the source exhaust pump measures the pressure in the source exhaust line. If the pressure in the line rises above the set point while a probe is installed, the instrument’s high-voltage power supply is disabled.
Gas and Vacuum PanelThe gas and vacuum panel is located at the back left side of the instrument (closest to the ion source). Gas inputs to the instrument and exhaust outputs from the instrument are connected through this panel.
Gas and vacuum panel
The gas and vacuum panel has the following connections:
28
API 4000™ LC/MS/MS System Hardware Manual Hardware Overview
Curtain Gas™ Supply and CAD Gas SupplyThe Curtain Gas supply and CAD gas supply require an input of UHP nitrogen (99.999%) (or approved nitrogen gas generators with impurities that are known not to negatively impact performances) with a maximum input pressure of 60 psig and flows up to 5 L/min.
Gas 1/Gas 2Gas 1 and Gas 2 require an input of zero air with an input pressure of 100 psig (105 psig maximum) and flows up to 17 L/min. Nebulizer and sheath gas are derived from this input. These gases are used for TurboIonSpray probe nebulizer gas and heater gas, or APCI probe nebulizer gas.
Source Exhaust SupplyThe source exhaust supply requires a regulated input of clean, dry, hydrocarbon-free air at 50 psig (60 psig maximum) and flows up to 6 L/min for the source exhaust pump.
Backing Pump The backing pump must be connected to a roughing pump for pumping down both the turbo pumps and the interface region.
Interface PumpSome instruments will have an interface pump manifold that must be connected to a second roughing pump.
Exhaust Waste OutThe effluent line must be connected to a drain vessel. The drain vessel can be placed under a fume hood, or a positive-flow vent can be loosely coupled to the short vent hose on the vessel. For loose coupling, the small-diameter vent hose on the vessel can be inserted into a large-diameter house exhaust pipe so that air is drawn along with the exhaust waste.
CAUTION! Do not connect the vent fitting on the drain vessel directly to a positive-flow vent. The additional vacuum could trip the source exhaust pump pressure switch, which indicates that the source exhaust pump is working when it is not, and enable the instrument electronics.
Vacuum SystemThe vacuum system consists of the vacuum interface, vacuum control system, and vacuum chamber. The vacuum interface includes the Curtain Gas plate, orifice plate, and skimmer cone. The vacuum control system includes the turbo pumps, vacuum gauge, solenoid gas controller, and analog gas controllers. The vacuum chamber or ion path chamber includes quadrupoles, the collision cell, and the channel electron multiplier (CEM) detector system.
Vacuum InterfaceThe vacuum interface separates the low-pressure vacuum chamber from the atmospheric pressure in the ion source. The purpose of the vacuum interface is to allow the transfer of
29
Hardware Overview API 4000™ LC/MS/MS System Hardware Manual
ions from the ion source to the mass spectrometer while restricting sample, solvent, and ambient air from entering the vacuum chamber. This is accomplished using a Curtain Gas flow of heated, dry nitrogen.
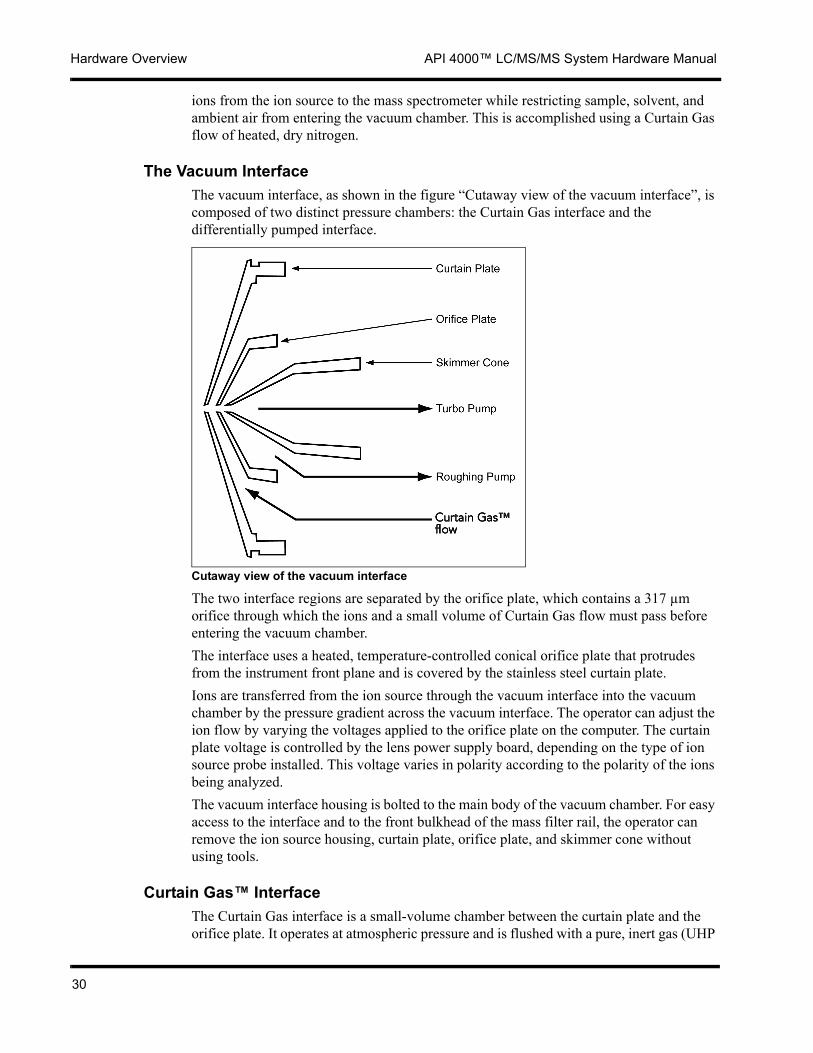
The Vacuum InterfaceThe vacuum interface, as shown in the figure “Cutaway view of the vacuum interface”, is composed of two distinct pressure chambers: the Curtain Gas interface and the differentially pumped interface.
Cutaway view of the vacuum interface
The two interface regions are separated by the orifice plate, which contains a 317 µm orifice through which the ions and a small volume of Curtain Gas flow must pass before entering the vacuum chamber.The interface uses a heated, temperature-controlled conical orifice plate that protrudes from the instrument front plane and is covered by the stainless steel curtain plate.Ions are transferred from the ion source through the vacuum interface into the vacuum chamber by the pressure gradient across the vacuum interface. The operator can adjust the ion flow by varying the voltages applied to the orifice plate on the computer. The curtain plate voltage is controlled by the lens power supply board, depending on the type of ion source probe installed. This voltage varies in polarity according to the polarity of the ions being analyzed.The vacuum interface housing is bolted to the main body of the vacuum chamber. For easy access to the interface and to the front bulkhead of the mass filter rail, the operator can remove the ion source housing, curtain plate, orifice plate, and skimmer cone without using tools.
Curtain Gas™ InterfaceThe Curtain Gas interface is a small-volume chamber between the curtain plate and the orifice plate. It operates at atmospheric pressure and is flushed with a pure, inert gas (UHP
30

API 4000™ LC/MS/MS System Hardware Manual Hardware Overview
purity 99.999% nitrogen), or approved nitrogen gas generators with impurities that are known not to negatively impact performances. The following figure shows the curtain plate removed.
Front view of the vacuum interface
Approximately 600 mL/min of gas passes through the orifice into the differentially pumped interface, while the remaining gas flows back into the ion source housing through the aperture in the curtain plate.The Curtain Gas interface provides a region for ion declustering. In the interface, sample ions collide with the gas molecules. The collision energy assists in breaking ion clusters and separating the sample ions from the solvent molecules. The controlled inert atmosphere in the interface helps to retain the stable ion-molecule products from the ion source.The Curtain Gas supply flow rate is set from the computer and is physically controlled by an analog gas flow controller. The gas line is connected to the Curtain Gas interface through a quick coupling on the vacuum interface.To protect the sensitive components of the instrument, the Curtain Gas flow is interlocked to the pumping system and ion optics. If the Curtain Gas supply pressure drops below 20 psig, the system controller disables the high-voltage supplies, sets the ion optic voltage to zero, and goes into fault mode. When the gas flow is restored, the system controller automatically clears all faults and enables the high-voltage supplies.
Differentially Pumped InterfaceThe differentially pumped interface is the first low pressure stage in the transition from the atmospheric pressure ion source to the low-pressure vacuum chamber. The pressure in the interface is maintained below 2 torr by the roughing pump, which is located outside the main console.Curtain Gas flow and ions are drawn from the Curtain Gas interface into the differentially pumped region by the pressure differential across the orifice plate. The ions are further drawn through the differentially pumped interface region by the voltage difference
31

Hardware Overview API 4000™ LC/MS/MS System Hardware Manual
between the orifice plate and the skimmer cone. The ions enter the vacuum chamber through the aperture in the skimmer cone.A vacuum line connects the roughing pump to the port underneath the differentially pumped interface. The pump is interlocked with the ion optics and the pumping system by a pressure switch connected to the vacuum port. If the pressure in the interface rises sharply, the switch trips, notifying the system controller of a roughing pump fault.In the event of a roughing pump fault, the system controller disables the high-voltage power supplies, sets the ion optic voltages to zero, and turns off the turbo pumps (turbomolecular pumps) until pressure in the differentially pumped interface is restored.
Entrance OpticsThe entrance optics consist of the stainless steel curtain plate and the ceramic orifice plate. The voltages applied to these elements control the ion flow through the vacuum interface. The operator controls the voltage applied to the orifice plate from the computer. The curtain plate voltage is set automatically, depending on the type of probe installed; through the software, the operator sets the polarity according to the polarity of the ions being analyzed.The following table lists the curtain plate and orifice plate functions.
The power supplies used to generate the voltages applied to the curtain plate and orifice plate are located on the lens power supply board inside the system electronics box.
Vacuum Control SystemThe vacuum system is controlled transparently by the system controller. When the instrument is switched on, the system controller automatically attempts to pump down the vacuum chamber. Only after reaching a stable operating pressure will the system controller enable the instrument’s analytical components.
Entrance optics functions
Optic Element Function
Curtain Plate • Separates the sample flow from the Curtain Gas™ flow.
• Has a 2 mm opening.• Is electrically isolated from the vacuum
housing so that the ions are not constrained to pass through ground potential at this point.
• Voltage is set by the lens power supply according to the type of probe installed:TurboIonSpray® probe—500 VAPCI probe—1000 V
Orifice Plate • Provides a division between atmosphere and the approximately 1 torr pressure of the differentially pumped interface.
• Contains the 317 µm orifice.• Is electrically isolated.
32
API 4000™ LC/MS/MS System Hardware Manual Hardware Overview
The pressure inside the vacuum chamber is monitored using a triode vacuum gauge. The system controller continually monitors the vacuum gauge output and several physical interlocks to determine the vacuum status. If the vacuum integrity is breached, the system controller will shut down the instrument’s high voltages until the vacuum operating conditions are regained.
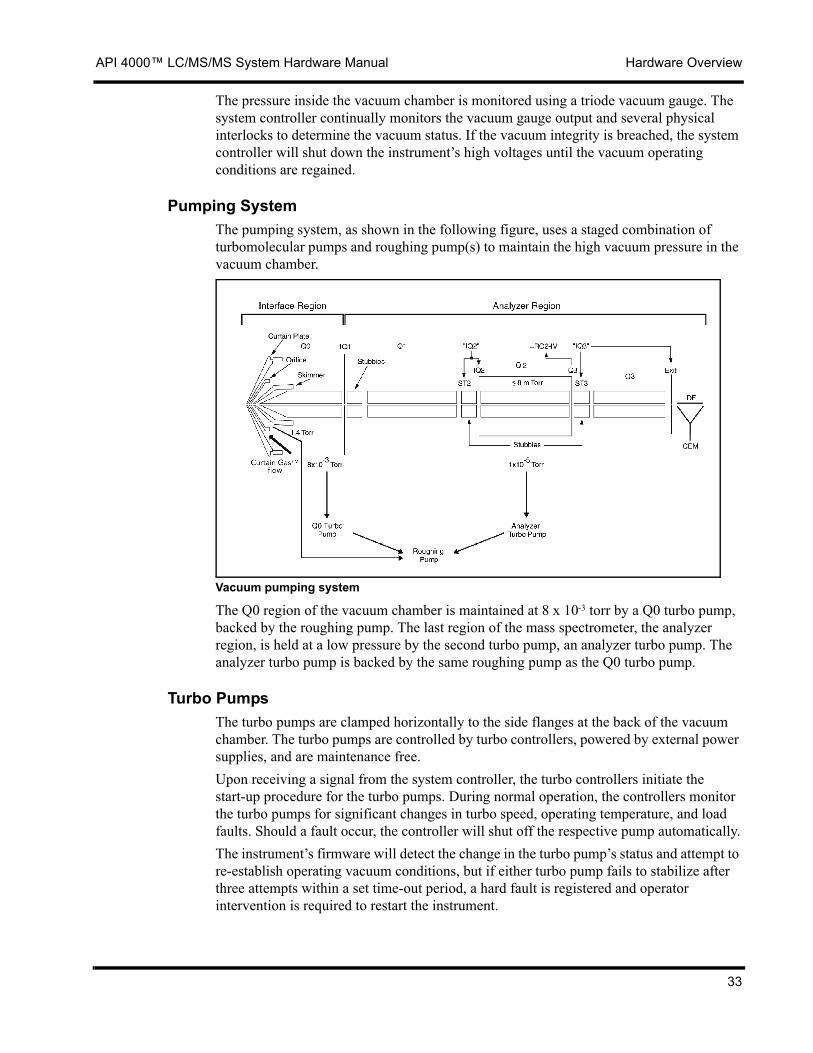
Pumping SystemThe pumping system, as shown in the following figure, uses a staged combination of turbomolecular pumps and roughing pump(s) to maintain the high vacuum pressure in the vacuum chamber.
Vacuum pumping system
The Q0 region of the vacuum chamber is maintained at 8 x 10⁻³ torr by a Q0 turbo pump, backed by the roughing pump. The last region of the mass spectrometer, the analyzer region, is held at a low pressure by the second turbo pump, an analyzer turbo pump. The analyzer turbo pump is backed by the same roughing pump as the Q0 turbo pump.
Turbo PumpsThe turbo pumps are clamped horizontally to the side flanges at the back of the vacuum chamber. The turbo pumps are controlled by turbo controllers, powered by external power supplies, and are maintenance free.Upon receiving a signal from the system controller, the turbo controllers initiate the start-up procedure for the turbo pumps. During normal operation, the controllers monitor the turbo pumps for significant changes in turbo speed, operating temperature, and load faults. Should a fault occur, the controller will shut off the respective pump automatically.The instrument’s firmware will detect the change in the turbo pump’s status and attempt to re-establish operating vacuum conditions, but if either turbo pump fails to stabilize after three attempts within a set time-out period, a hard fault is registered and operator intervention is required to restart the instrument.
33

Hardware Overview API 4000™ LC/MS/MS System Hardware Manual
Roughing PumpThe second stage of the pumping system utilizes an external roughing pump to back both turbo pumps. The roughing pump is connected to the exhaust of both turbo pumps, and maintains the interface pressure below 2 torr.
Roughing pumps are housed outside the main console of the instrument and are not controlled by either system firmware or the computer. Each pump requires its own external 207-242 VAC, 50/60 Hz power source and is operated manually using a switch mounted on the pump.The operational status of the roughing pump is monitored using pressure switch interlocks. The pump must maintain a pressure low enough to satisfy the interlocks before the system controller can initiate the turbo pumps. If the pressure in the pump’s intake line rises sufficiently to trip an interlock, the system controller will disable the turbo pumps and the ion optic power supplies.The roughing pump features an anti-suckback valve and a gas ballast valve, which are described in their own sections.A mist eliminator with oil return is included with rotary vane roughing pumps. These pumps require periodic maintenance that includes changing the pump oil and, if a mist eliminator is installed, replacing the mist eliminator filter.
WARNING! If hazardous, biohazardous, or radioactive materials are injected into the instrument, all appropriate safety precautions should be taken when handling the pump oil and coalescing filters. The pump oil will be contaminated and should be handled according to material safety regulations in the country of use (for example, WHMIS).
Interface VacuumVacuum for the interface is developed by the external roughing pump. An outlet on the gas and vacuum panel is internally connected to the vacuum flange on the bottom of the vacuum interface. From the interface, the roughing pump pumps Curtain Gas flow, which is drawn through the orifice by the pressure difference between the Curtain Gas interface and the differentially pumped interface.
Gas Ballast ValveSome roughing pumps come with a manually controlled gas ballast valve to eliminate water vapor and other condensable gases which limit the pump’s performance and life expectancy. When opened, the gas ballast valve permits a controlled volume of air into the pump chamber. This lowers the partial pressure of condensable vapors in the pump and causes the pump temperature to rise. Both these factors hinder condensation.Given the controlled, dry atmosphere in the vacuum interface and the vacuum chamber, condensation is seldom a problem. However, operating a roughing pump with the gas ballast valve open raises the pump’s ultimate pressure, and with the rotary vane pumps increases the amount of pump oil in the exhaust.
CAUTION! Under normal instrument operating conditions, the roughing pump(s) should be operated with the gas ballast valve closed.
34

API 4000™ LC/MS/MS System Hardware Manual Hardware Overview
On the rotary vane pumps, there is an adjustable gas ballast valve, which is controlled by the black knob on the top of the oil casing. It is closed when set to zero.
Mist EliminatorA mist eliminator is included so a rotary vane roughing pump can exhaust into a closed environment. The mist eliminator filters pump oil mist from the pump exhaust.A mist eliminator with an oil return system is used on instruments that ship in a single roughing pump configuration. The oil return system traps the minute amounts of oil that pass through the filter and returns them to the roughing pump through a fitting that is installed on the roughing pump’s gas ballast valve.
WARNING! If the instrument is operated in a closed environment, or if it is not vented to an external vent system, it is highly recommended that a mist eliminator be installed on the roughing pump’s exhaust port to prevent the emission of oil vapors into the environment.
If the oil return line or gas ballast valve becomes blocked, the oil will collect in the mist eliminator filter. Trapped oil will be visible in the sight glass window located on the side of the mist eliminator. If this occurs, the mist eliminator filter, oil return line, and gas ballast valve should be inspected for blockages by a Field Service Employee.
Vacuum GaugeA triode vacuum gauge is used to monitor the pressure inside the vacuum chamber. The gauge is connected directly to a port on the back of the vacuum chamber between the turbo pumps. The vacuum gauge is controlled by the vacuum gauge controller.
Triode vacuum gauge
The vacuum gauge produces and measures an ion current that is proportional to the pressure inside the vacuum chamber. Electrons that are produced by a controlled current
35

Hardware Overview API 4000™ LC/MS/MS System Hardware Manual
flowing through the filament inside the vacuum gauge accelerate towards the grid electrode that is held at a potential of +150 V. The electrons collide with gas molecules inside the vacuum gauge tube creating positive ions that are attracted to the collector electrode.By regulating the electron emission current from the gauge filament, the pressure inside the vacuum chamber can be directly determined from the ion current measured at the collector.
Vacuum Gauge ControllerThe vacuum gauge controller is a printed circuit board located inside the system electronics box. It performs the following functions:• Enables power to the vacuum gauge filament in response to the Gauge Enable signal
from the system controller. This occurs 50 seconds after the turbo pumps reach normal operating speeds. The gauge will be shut off if the pressure rises above 1 x 10⁻³.
• Regulates the voltage applied to the vacuum gauge filament to ensure a consistent electron emission current of 0.1 mA.
• Informs the system controller when the pressure has fallen below 1 x 10⁻⁴ and to therefore shut off the CAD gas.
• Provides the Vacuum Ready signal to the system controller when the pressure reaches 2 x 10⁻⁵ torr, to enable the ion path voltages.
• Monitors the ion current signal at the vacuum gauge collector to ensure that the pressure inside the vacuum chamber remains below 6 x 10⁻⁵ torr.
If the pressure inside the vacuum chamber rises above 6 x 10⁻⁵ torr, the vacuum gauge controller sends a digital signal to the system controller, which then initiates the Vacuum Off sequence, disabling power to the high-voltage power supplies and the turbo pumps and setting the ion path voltages to zero. The system controller also instructs the vacuum gauge controller to turn off the vacuum gauge in order to protect the filament. The system controller will attempt to recover the vacuum integrity automatically, without operator input.
Gas Control SystemThe following gases are required for the instrument:• TurboIonSpray nebulizer gas or APCI nebulizer gas (Gas 1)• TurboIonSpray heater gas (Gas 2)• Sheath gas• Gas for Curtain Gas interface• Collisionally activated dissociation (CAD) gas (from Curtain Gas supply)NOTE: Gas 1,Gas 2, and the Sheath gas are all connected to the same source at the gas and vacuum panel.When the instrument has reached stable operating pressure, the operator sets the gas flows from the computer. When the instrument is either pumping down or venting, the gas flows are controlled by the system controller independently of the software setting at the computer. The gas flows are physically controlled by the gas flow controllers, which are mounted on a bracket at the back of the instrument.
36
API 4000™ LC/MS/MS System Hardware Manual Hardware Overview
Solenoid Gas Flow ControllerThe solenoid gas flow controller controls the instrument’s CAD gas flows to the collision cell. Four solenoid valves are connected in series. The valves work on a “go/no go” basis; the valves are either open, allowing a set volume of gas to flow, or they are closed. By selectively setting the valves, you can set the gas flow rate incrementally over a predetermined range. Given that there are four valves, there are 16 (24) possible flow rates for the CAD gas.
Analog Gas Flow ControllersAnalog gas flow controllers are used to control the flow of Gas 1 (nebulizer gas) and Gas 2 (heater gas) to the ion source probe, and the flow of gas to the Curtain Gas interface. Each controller circuit works by sensing the pressure in the volume of gas between a variable jet inlet and a fixed orifice outlet. It continually adjusts the pressure by varying the inlet to match the sensed pressure with the set point pressure. If the pressure is too high, the inlet closes, allowing the pressure to drop. If the pressure is too low, the inlet opens to raise the pressure. As the measured pressure reaches the required set point, the analog valve closes to the point where it is open just enough to keep the flow through the controller the same as the flow through the orifice, keeping the pressure constant at the outlet.
CAD Gas FlowThe CAD gas is the target gas in the collision cell. Collisions between the ions speeding along the ion path and the CAD gas molecules in the collision cell provide the energy for ion dissociation.The CAD gas is tapped from the Curtain Gas input, and pressure is relieved through an orifice into the backing pump exhaust manifold. The gas is then directed through the solenoid gas flow controller to the face plate at the right end of the vacuum chamber. The CAD gas is routed along the mass filter rail and fed to the collision cell through the hollow locating pin that locates the Q2 rod set.
CAD Gas RestrictorOn instruments that ship with a single roughing pump, a restrictor valve is located on the inlet line to the solenoid gas flow controller. The CAD gas restrictor valve compensates for a higher CAD gas source pressure in the single pump configuration and ensures that instrument-to-instrument variations in CAD gas response are minimized. The CAD gas restrictor valve is set in the factory, and should only be adjusted by a trained AB SCIEX Field Service Employee.
Curtain Gas™ FlowThe Curtain Gas supply is used to isolate the ion source from the vacuum chamber. The gas acts, as its name suggests, like a curtain restricting the flow of air, sample, and solvent into the vacuum chamber.Gas from the gas and vacuum panel is routed to the input of the Curtain Gas supply analog flow controller. The output line of the controller is connected to the Curtain Gas interface through the vacuum interface housing.
37

Hardware Overview API 4000™ LC/MS/MS System Hardware Manual
The flow is interlocked with the vacuum control system and the ion optics by a pressure switch connected to the analog gas flow controller’s intake manifold.
Gas 1 (Nebulizer Gas) and Gas 2 (Heater Gas)Gas 1 and Gas 2 are from the same source. Gas 1 is used as nebulizer gas for the nebulizer probe, and Gas 2 is used as heater gas for the two TurboIonSpray heaters. Both gases are used to cool the upper parts of the nebulizer and turbo assemblies prior to reaching the heaters.Gas 1 and Gas 2 are fed to the analog gas flow controller’s intake manifold from the external gas supply through the gas and vacuum panel. From the controller’s outlets, the gas is fed to the ion source through gas connections on the interface and ion source housing face plates.
Sheath GasSheath gas is tapped from the input side of the Gas 1/Gas 2 controller and fed through an orifice which provides a constant fixed flow of 2 L/min. This is fed to the source housing through gas connections on the interface and housing face plates. Sheath gas is used to cool the nebulizer assembly and exits into the housing near the tip of the nebulizer assembly and axial to it.
Gas Control SequenceWhen the vacuum chamber pressure is stable below the Vacuum Ready set point of 2 x 10⁻⁵ torr, the operator controls the gas flows from the computer. However, when the instrument is pumping down, the nebulizer, heater, curtain, and CAD gas flow rates are set by the system controller independent of the software setting at the computer. By overriding the software’s gas flow controller settings, the system controller ensures the consistent, predictable behavior of the instrument during pumpdown. During shutdown, powering off the system closes the CAD gas solenoids. The instrument will vent through the orifice in about ten minutes, and the CAD gas is also shut off.While the instrument pumps down, the CAD gas is set to its maximum flow (that is, all four solenoid valves are open), the nebulizer and heater gas flows are set to zero, and the Curtain Gas flow is set to approximately half its maximum value. In the pump-down sequence (described later in this chapter), the vacuum gauge controller informs the system controller when the vacuum pressure surpasses 1 x 10⁻⁴ torr. Upon reaching 1 x 10⁻⁴ torr the system controller shuts off the CAD gas to allow the pressure to drop. Once the Vacuum Ready set point of 2 x 10⁻⁵ torr is reached, the system controller releases gas control to the operator.
Safety InterlocksThe vacuum control system has safety interlocks to protect the instrument’s sensitive electronic components. These interlocks prevent the instrument’s normal operation if certain operating parameters that are outside the direct control of the system circuitry are not maintained.The Curtain Gas pressure interlock and roughing pump status switch directly affect the pumping sequence. When an interlock is triggered, the Vacuum Off sequence is initiated. The turbo pumps are disabled and the ion optic voltages are set to zero. When the interlocks are recovered, the system will automatically attempt the pump-down sequence.
38
API 4000™ LC/MS/MS System Hardware Manual Hardware Overview
A set of interlocks prevents the instrument from switching to analysis mode if a valid ion source is not properly installed. These interlocks do not affect the pumping system.
Curtain Gas™ interlockCurtain Gas flow is essential to the consistent and safe operation of the instrument. Without a significant supply of gas through the Curtain Gas interface, the vacuum chamber would draw ambient air from the ion source, the moisture and composition of which would negatively affect the operation of the instrument. Even though small amounts of gas flow enter the vacuum chamber with the sample, the operation of the instrument is not affected because the quantity and composition is controlled.The Curtain Gas flow between the gas cylinder and the analog valves is triggered if the pressure drops below a setting of 10 psig. If the interlock is tripped, the Vacuum Off sequence is initiated and the turbo pumps and ion optic voltages are disabled. The instrument automatically attempts to pump down when the Curtain Gas flow interlock is satisfied.
Roughing Pump Status SwitchPressure switches attached to the vacuum lines inside the instrument indicate the pump’s operational status. If the pressure rises in either vacuum line, an interlock switch initiates the Vacuum Off sequence. The turbo pumps and the ion optics are then disabled. The instrument will automatically attempt to pump down once the vacuum pressure in the line is regained and the pressure switch interlock is deactivated.
Vacuum Control SequenceOn power up, the instrument goes directly into pump-down mode. The pump-down sequence is controlled by the firmware, independently of the computer. This means that, once initiated, the pump-down sequence is transparent to the operator.When a stable operating vacuum pressure is established and the required safety interlocks are satisfied, the instrument switches directly to analysis mode. The instrument is now ready to perform an analysis. In the analysis mode, the operator controls the ion path voltages, gas flows, and other operating parameters from the computer.
Pump-Down SequenceWhen the operator switches on the instrument power, the pump-down sequence is initiated. Before attempting to initiate the turbo pumps, the status of the system interlocks and fault conditions, including the vacuum gauge and turbo pump status, are evaluated. The proper setting of the Curtain Gas supply and the roughing pump’s interlocks are verified and, when the initial conditions are correct, the control sequence initiates the turbo pumps.The status of the turbo pumps is monitored by the firmware control circuitry. If the turbo pumps do not reach normal operating mode within a specified time-out period, the sequence triggers a turbo transition fault. The system attempts to start the pumps three times, and if the pumps fail to stabilize after these three attempts, the firmware controller registers a hard fault and aborts the pump-down sequence.The turbo pumps switch to normal operating mode when they reach their rated speed. Power to the vacuum gauge filament is enabled 50 seconds after both turbo pumps have
39

Hardware Overview API 4000™ LC/MS/MS System Hardware Manual
reached their normal status. The vacuum gauge output is not monitored until 10 seconds after the gauge has been enabled. This delay allows the gauge output to stabilize before it is used as a variable in the pump-down sequence.When the vacuum chamber pressure, as measured by the vacuum gauge, drops below 1 x 10⁻⁴ torr, the vacuum gauge controller signals the system controller that the vacuum chamber is ready. The CAD gas is turned off and the system continues to pump down. At 2 x 10⁻⁵ torr, the system vacuum is ready and, if the ion source interlocks are satisfied, the sequence switches the instrument to analysis mode. In analysis mode, the instrument is ready to perform mass analyses. The gas flows are under software control and the system electronics are enabled.Should the vacuum pressure not reach a level below 2 x 10⁻⁵ torr within a preset time period, a vacuum time-out fault is registered. As a result, the Vacuum Off sequence is initiated.During operation, the vacuum control firmware continues to monitor the vacuum pressure, system interlocks, and turbo pump status. If a turbo pump failure, vacuum interlock fault, or vacuum over-pressure fault is detected, the Vacuum Off sequence is initiated.
40

API 4000™ LC/MS/MS System Hardware Manual Hardware Overview
Pumpdown sequence
Vacuum Off SequenceWhen the Vacuum Off sequence is initiated, the turbo pumps, ion optics, and vacuum gauge are disabled, and the gas flows are set to the values in the vacuum-off state. The sequence then cycles to the beginning of the pump-down sequence in readiness for the next time the instrument is pumped down.
41

Hardware Overview API 4000™ LC/MS/MS System Hardware Manual
Ion Path ChamberThe vacuum chamber houses the quadrupole rod sets, most of the ion optics, the collision cell, and the channel electron multiplier (CEM), or ion detector. The quadrupoles, collision cell, and associated ion optics are assembled on a mass filter rail and inserted into the vacuum chamber as a single unit. The CEM, or ion detector, which is housed in the CEM module, is installed inside the vacuum chamber after the mass filter rail is in position.A seal formed by the front bulkhead on the mass filter rail divides the Q0 region and the main vacuum region.The Q0 region contains the Q0 rod set. It is located between the vacuum interface and the front bulkhead on the mass filter rail. This region is maintained at approximately 8 x 10⁻³ torr by a Q0 turbo pump.The high vacuum region contains the remaining rod sets and associated ion optics. The Q2 quadrupole rod set is contained in the collision cell, which forms part of the high vacuum region. The Q1 and Q3 mass filter quadrupoles are located on either side of the collision cell and are maintained at approximately 1 x 10⁻⁵ torr by an analyzer turbo pump.NOTE: The vacuum chamber is safety interlocked so that, if the pressure inside the high vacuum region reaches 6 x 10⁻⁵ torr or greater, all ion path voltages are set to zero.
Mass Filter RailThe quadrupole rod sets and ion optics are installed, aligned and wired on a mass filter rail that is inserted into the vacuum chamber. The front end of the mass filter rail is supported by the front bulkhead. The other end of the mass filter rail is bolted to the rear flange that seals the detector end of the vacuum chamber.
Mass filter rail
The collision cell gas line and all internal wires are routed along the mass filter rail. The external ion optic and collision cell gas connections are made through vacuum connections on the rear flange.Vacuum feedthroughs are used to connect the radio frequency (RF) and direct current (DC) voltages for the Q1 and Q3 quadrupoles through the bottom of the vacuum chamber. The leads are connected after the mass filter rail has been installed.
42

API 4000™ LC/MS/MS System Hardware Manual Hardware Overview
QuadrupolesThe quadrupole rod sets are mounted on the mass filter rail inside the vacuum chamber. Q1 and Q3 are DC and RF mass filters that selectively filter ions based on their mass-to-charge ratio (m/z). Q0 and Q2 are RF-only quadrupoles that have no filtering effect.
Mass FiltersA quadrupole mass filter consists of four cylindrical rods to which precise DC and RF voltages can be applied. The Q1 and Q3 rods are enclosed by ceramic collars and positioned accurately on the mass filter rail using locating pins.The quadrupole mass filters have the very high mechanical precision necessary for achieving high transmission and high resolution. The quadrupole mass filters normally operate at a constant mass width that is independent of the ion mass. Hence, the resolution in this mode of operation is directly proportional to the mass being observed.Q3 is also capable of being operated in total ion mode in which only RF voltage is applied to the quadrupole rods (other terms are RF-only mode and AC-only mode). This essentially allows ions of all masses present in Q3 to be transmitted to the ion detector.
RF-Only Quadrupoles (Q0 & Q2) and StubbiesAn RF-only quadrupole is similar in construction to a quadrupole mass filter but is only capable of being operated in the total ion mode (only RF voltage is applied to the rods). Q0 is mounted in the front bulkhead of the mass filter rail. The Q0 rod set focuses and transfers ions from the vacuum interface to the stubbies and into the high vacuum region and the Q1 mass filter. To optimize ion transfer, both Q0 and the stubbies are electrically connected to the Q1 RF voltage. The RF voltage applied to Q0 and the stubbies is a consistent fraction of the RF voltage applied to Q1.Q2 is housed inside the collision cell, which is mounted between Q1 and Q3 on the mass filter rail. It transmits ions through the collision cell into Q3. Similar to Q0, the Q2 RF voltage is capacitively coupled to the Q3 RF voltage. The Q2 RF voltage is ramped in a constant ratio with Q3 in order to optimize the conditions for the transmission of ions into Q3. Q2 is an integral part of the collision cell.
Vacuum FeedthroughsThe amplified RF and DC voltages for the quadrupole mass filters are connected through the bottom of the vacuum chamber via vacuum feedthroughs. There are four feedthroughs: two for Q1 and two for Q3. Each feedthrough carries the combined RF and DC voltages for one pair of opposing quadrupole rods.The feedthroughs are installed through punch-outs in the tops of the quadrupole mass filter coil boxes into designated holes in the bottom of the vacuum chamber. One end of each feedthrough lead is connected to the respective interconnect circuit board inside the vacuum chamber; the other end to a sleeve in the respective coil box.
Collision CellThe collision cell is a ceramic housing pressurized with collision cell gas (CAD gas) when using MS/MS. The housing contains Q2 and is closed at either end by interquad lenses.
43
Hardware Overview API 4000™ LC/MS/MS System Hardware Manual
Ions enter Q2 and collide with the CAD gas molecules in the cell. The collisions provide the energy needed to dissociate precursor ions into fragment (product) ions. All ions in the collision cell are transferred to Q3 where the precursor or fragment ions can be selectively filtered and transferred to the CEM, or ion detector, for counting.CAD gas is fed through a vacuum fitting on the end flange of the vacuum chamber. The CAD gas line is then routed along the mass filter rail and fed through a hollow locating pin in the top of the collision cell.CAD gas is clean N2 gas that has been fed through a solenoid gas flow controller to the collision cell. The operator controls the gas flow through the computer.
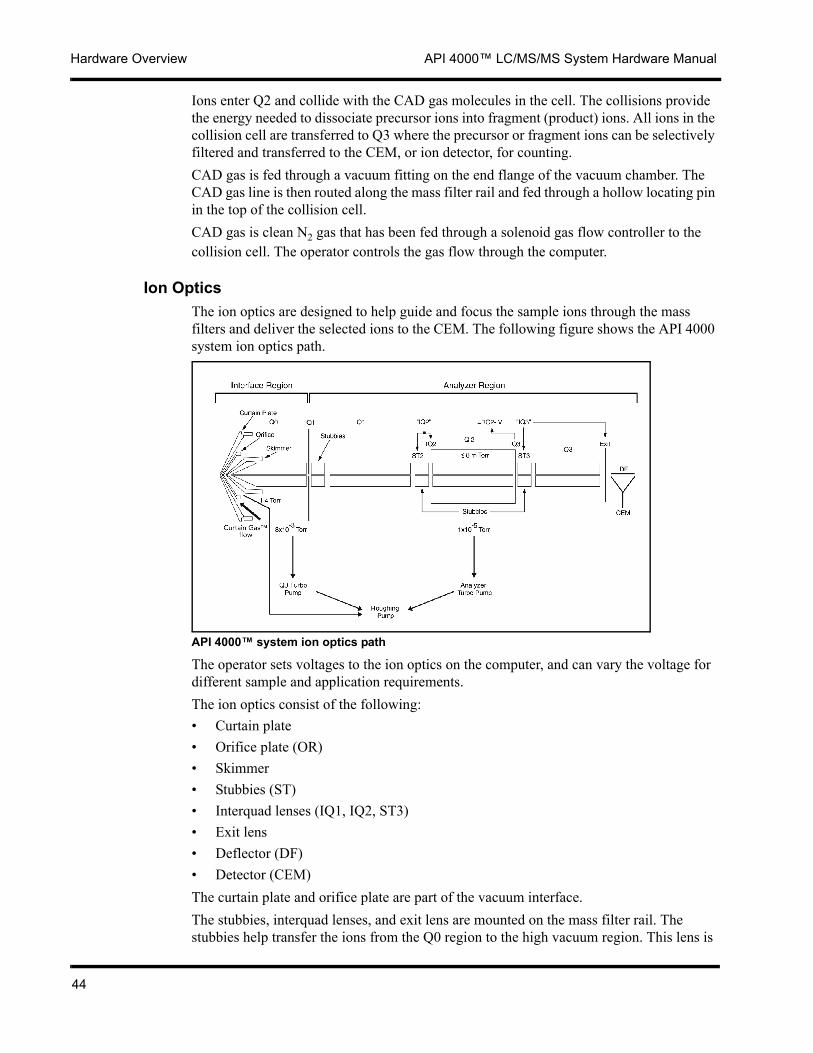
Ion OpticsThe ion optics are designed to help guide and focus the sample ions through the mass filters and deliver the selected ions to the CEM. The following figure shows the API 4000 system ion optics path.
API 4000™ system ion optics path
The operator sets voltages to the ion optics on the computer, and can vary the voltage for different sample and application requirements.The ion optics consist of the following:• Curtain plate• Orifice plate (OR)• Skimmer• Stubbies (ST)• Interquad lenses (IQ1, IQ2, ST3)• Exit lens• Deflector (DF)• Detector (CEM)The curtain plate and orifice plate are part of the vacuum interface.The stubbies, interquad lenses, and exit lens are mounted on the mass filter rail. The stubbies help transfer the ions from the Q0 region to the high vacuum region. This lens is
44

API 4000™ LC/MS/MS System Hardware Manual Hardware Overview
actually a shortened version of an RF-only quadrupole. The interquad lenses help transmit ions into the respective quadrupoles, while the exit lens and deflector help improve the collection efficiency of the CEM. The deflector, CEM, and support electronics are contained in a separate module that attaches to the front of the vacuum chamber at the CEM (ion detector) end of the instrument.
Ion Detector and Signal HandlingIons are drawn from the mass filters into the CEM, which is a continuous dynode device. When struck by an ion, the CEM emits an electron pulse. The electron pulses are drawn by a potential gradient across the CEM and relayed to the signal handling board.On the signal handling board, the CEM signal is converted to a digital signal. The digital signal is processed (counted) at the system controller in the system electronics box to provide an absolute ion count.
CEM/Signal Handling Board ModuleThe CEM module is mounted on a vacuum flange and installed in the vacuum chamber after the mass filter rail. The module contains the CEM, deflector, and signal handling board. Voltage connections from the signal handling board to the CEM are made through the vacuum flange with vacuum feedthroughs on the flange.
CEM and DeflectorIons exiting the mass filters are drawn into the channel electron multiplier (CEM) by the CEM horn voltage applied to the entrance of the CEM.
Channel electron multiplier module
The deflector aids in the efficiency of collecting the ions. The voltage applied to the deflector concentrates the electrical field from the CEM horn across the ion path, forcing the ions into the CEM horn.
45

Hardware Overview API 4000™ LC/MS/MS System Hardware Manual
The CEM horn voltage is fixed depending on the polarity of the ions being analyzed. For positive ions, the voltage is -6000 V; for negative ions, it is fixed at +4000 V. The operator can set the deflector voltage from -400 V to +400 V from the computer.Each ion that strikes the CEM creates an electron pulse that is drawn down the CEM by a potential gradient created along the CEM. The cumulative signal of electron pulses represents the total count of ions.The potential gradient is created with a second CEM voltage, the bias voltage. The voltage applied to the end of the CEM opposite the horn is typically set between 1800 V and 3000 V more positive than the horn voltage. The operator sets the CEM voltage relative to the CEM horn voltage from the computer. The actual voltage applied to the end of the CEM is the combined horn and bias voltage. If, in negative ion mode, the on-screen CEM (bias) voltage is set to 2400 V, the actual CEM voltage applied relative to ground would be 6400 V (4000 V, the fixed horn voltage, plus 2400 V).Actual CEM voltage = Horn voltage (float) + on-screen CEM (bias) voltage setting.The bias voltage is an important factor in the consistent operation of the instrument. It must be high enough to ensure that the gain from each ion strike is minimized. Minimizing the signal gain ensures a one-to-one correspondence between ion strikes and electron pulses. The CEM is said to operate in pulse or saturated mode when the gain is maximized. However, if the bias voltage is set higher than necessary, the operating life of the CEM is significantly reduced.The optimal CEM bias voltage is set to ensure a balance between CEM efficiency and operating life. The CEM voltage is the minimum voltage to ensure that the CEM is safely operating in the pulse mode.
CAUTION! To maximize the operating life of the CEM, follow the optimization procedure to determine the most efficient operating bias voltage. Do not run the CEM at a bias voltage above the optimal value or expose the CEM to ion currents above 1 million counts per second for extended periods of time.
Both the CEM horn and the bias CEM voltages are supplied by the high-voltage (HV) power supply board inside the system electronics board.
Signal Handling BoardThe signal handling board has two distinct functions:• Converts the low-level CEM output pulses to digital levels for transmission to the
system controller.• Acts as a conduit for the CEM high-voltage power.
In pulse counting mode, the CEM responds to each ion strike by producing an output pulse of electrons, or charge. This charge produces a negative pulse that is amplified and passed on to the discriminator circuit. The discriminator circuit sets the threshold level so that low voltage pulses (typically less than 100 mV) are eliminated as background noise. An ion strike must produce a pulse amplitude greater than 100 mV to produce a digital signal pulse that can be counted as an ion strike. At the system controller, the digital pulses can be counted to provide an absolute ion count.
46
API 4000™ LC/MS/MS System Hardware Manual Hardware Overview
Power Distribution ModuleThe power distribution module is the interface between the external mains power input and the instrument’s electronics. The module supplies all of the power required for the operation of the mass spectrometer.Two separate 15A, 207-242 VAC, 50/60 Hz single-phase power sources are required for the instrument’s main console and the externally mounted roughing pump. Standard wall outlets are required to power the computer, printer, and other accessories.NOTE: An optional line adjustment transformer (LAT) P/N WC014179 can be purchased to provide the correct line voltage to the instrument and roughing pump(s), as described in the API 4000™ System Site Planning Guide.All operating voltages for the instrument are generated from the mains power input. The power is subdivided at the AC distribution board and distributed by cables to the main console equipment.
AC Power Distribution and Main Power SwitchThe AC distribution board is the instrument’s main power distribution center. AC power enters the main console by cable and is fed through a filter to the main power switch on the power distribution panel. The switch doubles as a circuit breaker that trips, disabling power to the instrument, if there is a power surge. When the power switch is On, power is directed straight to the AC distribution board where it is divided and connected by cables to the following equipment on the main console:• Main DC power supply• Turbo pump power supplies/controllers• System electronics box (card cage) cooling blowers• Heater transformer
DC Power DistributionThe DC power supply converts the AC input power from the AC distribution board into three DC voltages: +6.5 V, -18 V and +24 V. The DC voltages are supplied to the motherboard that forms the backplane of the system electronics box (card cage). There, the DC voltages are made available to the modules that comprise the system electronics box and the main module equipment.
Control PanelThe control panel, as shown in the following figure, encloses the power distribution module and is located at the right side of the instrument.
47

Hardware Overview API 4000™ LC/MS/MS System Hardware Manual
Control panel
The warning on the control panel reads as follows: For protection against fire hazard, replace only with same type and rating of fuse.The control panel contains the main power switch and two indicator/reset buttons. The Vacuum Status button (green) and the Fault button (red) indicate the vacuum status on the system controller board. When triggered together (that is, simultaneously pushed and released), the buttons reset the two microprocessors on the system controller. This is similar to rebooting a computer. NOTE: Resetting the instrument using the Vacuum Status and Fault buttons will interrupt any scans in progress and cause the loss of any unsaved working parameter files.When the operational vacuum conditions are satisfied and the instrument is in analysis mode, the Vacuum Status button is illuminated and the Fault button is extinguished. The Fault button flashes when a vacuum fault is detected. In pump-down mode, the buttons indicate the status of the pump-down sequence.
System Electronics BoxThe system electronics box (card cage) houses the following printed circuit boards:• System controller• Ion path DACs and vacuum gauge controller• Lens power supply• High-voltage (HV) power supply• Quadrupole power supply (QPS) exciter• Q1 amplifier• Q3 amplifier
Spare Output
APCI
Card Cage Blower
Spare Output (see
48

API 4000™ LC/MS/MS System Hardware Manual Hardware Overview
These boards are contained in individual modules to reduce potential electromagnetic radiation and susceptibility problems. Each module plugs in to the common motherboard that forms the back of the system electronics box. Together the modules control the instrument and convert the input power into the precise RF and DC voltages that drive the mass filters and supporting ion optics.
Data SystemThis section describes the data system, including the API 4000 system communication ports, system software, and operating system.
Communication PortsThe API 4000 system can communicate to the computer through an IEEE-488 communications port. Control, data acquisition, and data display are provided by the computer. In addition, the API 4000 system can communicate to an external device, such as an autosampler, through an RS-232 port and an AUX I/O port.
Interface Connection PanelThe external power supply, the IEEE-488 connection to the applications computer, the AUX I/O, and the RS-232 connections are made through the interface connection panel welded on the back right side of the chassis.
Interface connection panel
IEEE-488 BusThe computer is connected to the API 4000 system controller through a IEEE-488 communications link. A cable connects the IEEE-488 port on the API 4000 system to the GPIB interface card in the computer. The computer is the master device and the API 4000 system controller is the slave device with talk/listen attributes. The computer sends commands to the instrument and the instrument sends analytical results and machine
49

Hardware Overview API 4000™ LC/MS/MS System Hardware Manual
status to the computer. The supplied IEEE-488 cable is 2 m (6 ft) long. Up to 15 devices can be attached to an IEEE-488 bus.
RS-232 BusThe API 4000 system can connect to an optional externally controlled device, such as an autosampler, through an RS-232 communications link.The instrument uses a DB25 connector for the RS-232 link. Only the Transmit Data, Receive Data, Request to Send, and Clear to Send signals are normally used.
AUX I/O BusThe API 4000 system can connect to an optional device such as an autosampler or pump through an auxiliary interface input/output (AUX I/O) bus. This connection may be used to synchronize the instrument with the device.The instrument uses a DB25 connector for the AUX I/O link.
SoftwareSystem software enables the operator to control the API 4000 system and other devices, such as autosamplers, pumps, column ovens, and valves. The interface allows the operator to perform all the activities necessary to analyze a sample. The operator can configure the API 4000 system and its external devices to perform the following tasks:• Calibrate the instrument• Tune and optimize the system to specific analytes or masses• Acquire samples• Perform qualitative analysis• Perform quantitative analysis• Print reportsThe operator can perform a full array of activities and use customization options to tailor the system to provide the level of performance needed.System processes are divided into five main areas, known as modules. A module is a separate functional area that allows the operator to perform a range of activities that all relate to a certain main task. For example, in the Configure module, the operator can perform activities such as configuring devices and configuring tuning options.The five modules are:• Configure (performs hardware and security configuration, uses the Report Template
Editor)• Tune (calibrates and optimizes)• Acquire (uses the Method Editor and Batch Editor)• Explore (displays data as graphs, spectrograms, and chromatograms)• Quantitate (performs quantitative analysis and qualitative analysis)The operator can switch from one module to another without having to close a mode or lose work in the current module.
50

API 4000™ LC/MS/MS System Hardware Manual Hardware Overview
Operating SystemThe application software runs on a Windows operating system. Please refer to the Analyst® Software Operator’s Manual or the release notes contained on the software CD for current computer hardware and operating system requirements.
51

Hardware Overview API 4000™ LC/MS/MS System Hardware Manual
52

3
Starting Up the SystemFor optimum performance, the power to the API 4000™ LC/MS/MS system should be left on at all times to maintain the high vacuum conditions required for operation. The instrument remains in a “warmed-up” state so that operation can begin immediately. If the instrument is already on and warmed up (the green status light on the right side panel is on and not flashing), you can proceed to “Preparing the Turbo V™ Source” on page 55. If the instrument is not on, follow the procedures in this chapter.
Turning On the InstrumentThe instrument power is usually turned off when the vacuum or electrical components are serviced. When first powered up, the instrument, under control of the system firmware, goes into pump-down mode and attempts to start the turbomolecular pumps and bring the vacuum chamber to the operating pressure. This process is transparent and does not require operator intervention. While the system is pumping down, the ion optics, CEM, and ion source voltages are disabled. When the necessary vacuum conditions are reached and the safety interlocks are satisfied, the instrument switches to analysis mode and the operating voltages are enabled.Certain conditions outside the direct control of the instrument firmware must be satisfied before the turbo pumps will be initiated. The Curtain Gas flow must be turned on at the source, and the roughing pump(s) must be turned on manually. Interlocks (pressure switches) monitored by the firmware detect if the Curtain Gas flow and the roughing pump(s) are switched on. If the interlocks are not satisfied, the turbo pumps are not initiated.
CAUTION! If the instrument’s turbo pumps have not been used in the last thirty days it is strongly recommended that you contact your AB SCIEX Field Service Employee. The instrument should be “soft started” by an AB SCIEX Field Service Employee or else damage to the pumps may occur.
To start up the instrument1. Place the vent connection on the rear flange and tighten, if removed.2. Turn on the roughing pump(s) and wait five minutes before proceeding with step 3.
53

Starting Up the System API 4000™ LC/MS/MS System Hardware Manual
NOTE: The roughing pump has its own power toggle switch and must be turned on manually. The roughing pump is not controlled remotely by the system controller.
3. Ensure that the Curtain Gas flow is flowing to the instrument. The pressure should be regulated to 60 psig.
4. Check that the instrument’s main power supply cord is plugged in to the electrical connections panel.
5. Turn on the instrument’s main power switch.6. Turn on the computer.NOTE: Should the ion source be removed, the system electronics will be disabled, interrupting any data acquisition tasks. The turbo pumps and the vacuum system will not be affected.
Warming Up the InstrumentThe mass filters must be adequately warmed up before proper performance can be achieved. If the power has been off for more than five minutes, the instrument should have a warm-up for approximately one hour after the operating vacuum conditions are established. If the instrument has been off for an extended period of time (for example, overnight), a warm-up period of four hours is recommended.
54

4
Preparing the Turbo V™ SourceThe ion source is the area where sample ions are generated. In this manual, ion source refers to the chamber and one of two ion source probes (TurboIonSpray® probe or APCI probe). The ion source is located at the left end of the main console as viewed from the front of the instrument.
Principles of Sample IntroductionThe liquid sample stream is pumped to the ion source by a pump or a syringe drive. Flow rates are determined by the inlet requirements or are dictated by the chromatography or the volume of the sample available. If introduced by an LC pump, the sample may be injected through a loop injector (flow injection analysis or FIA) or by a separation column (LC/MS).The specific requirements of the sample inlet and ion source are:• To quantitatively transfer the liquid sample to the ion source inlet without loss and
with minimal dead volume.• To generate gas phase ions that are representative of the molecular composition of the
sample with minimal fragmentation.It is important for the instrument operator to apply appropriate analytical procedures and practices so that external dead volumes are minimized. Proper procedures help ensure chromatographic integrity and analytical reproducibility. It is also important that samples are sufficiently prefiltered so that the capillary tubing in the inlets is not blocked by particles, precipitated samples, or salts.
Ionization ProcessSamples are normally introduced to the instrument in a flowing liquid stream through a TurboIonSpray® ion source or APCI ion source. The ion source probe produces gas phase ions that are subjected to mass spectrographic analysis by the instrument.
TurboIonSpray® Ion SourceThe TurboIonSpray probe is a variant of the IonSpray™ source. It utilizes an IonSpray inlet with an additional turbo sprayer to blow hot, dry ultrahigh purity (UHP) nitrogen.
55
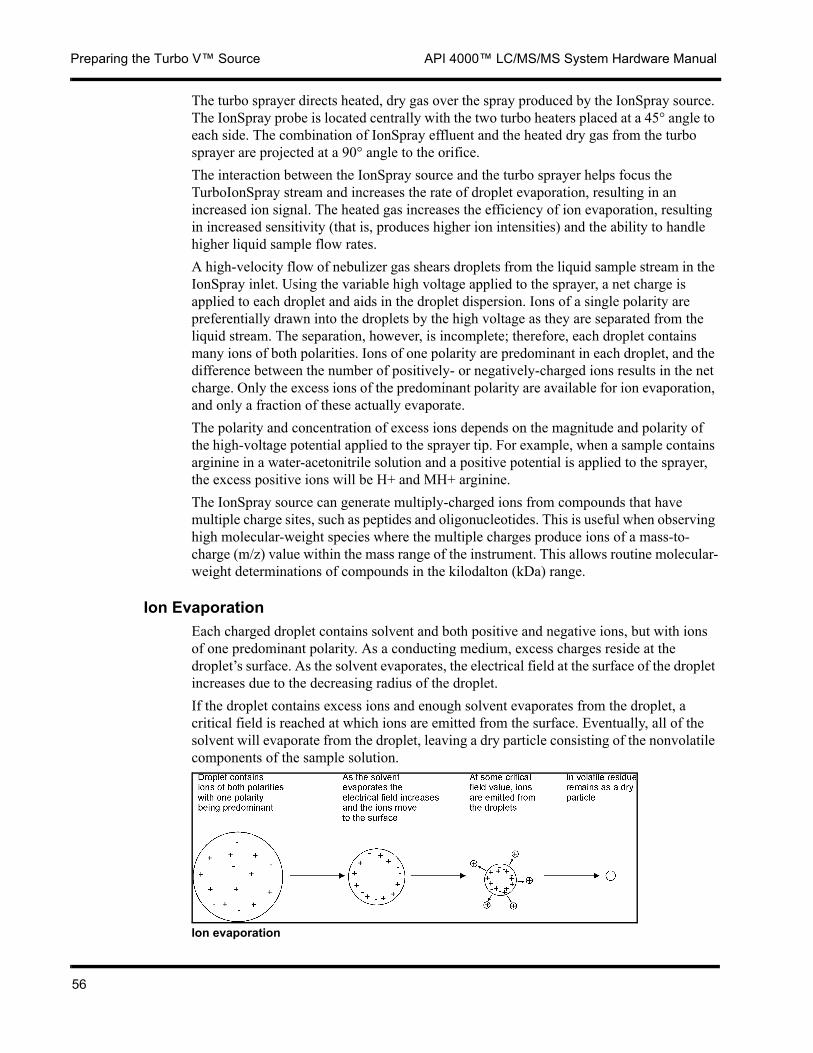
Preparing the Turbo V™ Source API 4000™ LC/MS/MS System Hardware Manual
The turbo sprayer directs heated, dry gas over the spray produced by the IonSpray source. The IonSpray probe is located centrally with the two turbo heaters placed at a 45° angle to each side. The combination of IonSpray effluent and the heated dry gas from the turbo sprayer are projected at a 90° angle to the orifice.The interaction between the IonSpray source and the turbo sprayer helps focus the TurboIonSpray stream and increases the rate of droplet evaporation, resulting in an increased ion signal. The heated gas increases the efficiency of ion evaporation, resulting in increased sensitivity (that is, produces higher ion intensities) and the ability to handle higher liquid sample flow rates.A high-velocity flow of nebulizer gas shears droplets from the liquid sample stream in the IonSpray inlet. Using the variable high voltage applied to the sprayer, a net charge is applied to each droplet and aids in the droplet dispersion. Ions of a single polarity are preferentially drawn into the droplets by the high voltage as they are separated from the liquid stream. The separation, however, is incomplete; therefore, each droplet contains many ions of both polarities. Ions of one polarity are predominant in each droplet, and the difference between the number of positively- or negatively-charged ions results in the net charge. Only the excess ions of the predominant polarity are available for ion evaporation, and only a fraction of these actually evaporate.The polarity and concentration of excess ions depends on the magnitude and polarity of the high-voltage potential applied to the sprayer tip. For example, when a sample contains arginine in a water-acetonitrile solution and a positive potential is applied to the sprayer, the excess positive ions will be H+ and MH+ arginine.The IonSpray source can generate multiply-charged ions from compounds that have multiple charge sites, such as peptides and oligonucleotides. This is useful when observing high molecular-weight species where the multiple charges produce ions of a mass-to-charge (m/z) value within the mass range of the instrument. This allows routine molecular-weight determinations of compounds in the kilodalton (kDa) range.
Ion EvaporationEach charged droplet contains solvent and both positive and negative ions, but with ions of one predominant polarity. As a conducting medium, excess charges reside at the droplet’s surface. As the solvent evaporates, the electrical field at the surface of the droplet increases due to the decreasing radius of the droplet.If the droplet contains excess ions and enough solvent evaporates from the droplet, a critical field is reached at which ions are emitted from the surface. Eventually, all of the solvent will evaporate from the droplet, leaving a dry particle consisting of the nonvolatile components of the sample solution.
Ion evaporation
56

API 4000™ LC/MS/MS System Hardware Manual Preparing the Turbo V™ Source
Only compounds that ionize in the liquid solvent can be generated as gas phase ions in the ion source. The efficiency and rate of ion generation depends on the solvation energies of the specific ions. Ions with lower solvation energies are more likely to evaporate than ions with higher solvation energies.Given that the solvation energies for most organic molecules are unknown, the sensitivities of any given organic ion to ion evaporation is difficult to predict. The importance of solvation energy is evident because surfactants that concentrate at the surface of a liquid can be detected very sensitively.
APCIThe basis for past incompatibilities in linking liquid chromatography (LC) with mass spectrometry (MS) arise from difficulties converting relatively involatile molecules in solution in a liquid into a molecular gas without inducing excessive decomposition. The APCI probe process of gently nebulizing the sample into finely dispersed small droplets in a heated ceramic tube ensures the rapid vaporization of the sample so that the sample molecules are not decomposed. The ceramic tube is heated by a 300 W element.
APCI reaction flow diagram
The above diagram shows the reaction flow of the atmospheric pressure chemical ionization (APCI) process for reactant positive ions (the proton hydrates, H3O+[H2O]n). This sequence is derived from experimental results summarized by Huertas and Fontan (Huertas, M.L. and J. Fontan 1975 “Evolution Times of Tropospheric Positive Ions,” Atmospheric Environ. 9, 1018.).
H O2
NO H O2 N2 O2
N2
O2+
N2+
N4+
H O2+
H O2
H O2
H O2 H O2
NO+
H O3+
O2++NO (H O)2
(H O)2
H O2
H O2
+NO (H O)2
+NO (H O)2
2
3
H O2
H O2
(H O)2H O3+
(H O)2H O3+
2
O2+
(H O)2 2
H O2
H O2
e -
(H O)2H O3+
n
H O2
57

Preparing the Turbo V™ Source API 4000™ LC/MS/MS System Hardware Manual
The major primary ions N2+, O2
+, H2O+, and NO+ are formed by the electron impact of corona-created electrons on the major neutral components of air. Although NO is normally not a major constituent of clean, ambient air, the concentration of this species in the source is enhanced due to neutral reactions initiated by the corona discharge.Samples that are introduced through the APCI probe are sprayed, with the aid of a nebulizing gas, into the heated ceramic tube. Within the tube, the finely dispersed droplets of sample and solvent undergo a rapid vaporization with minimal thermal decomposition. The gentle vaporization preserves the molecular identity of the sample.The gaseous sample and solvent molecules pass into the Turbo V source housing where the ionization by APCI is induced by a corona discharge needle attached to the end of the ceramic tube. The sample molecules are ionized by colliding with the reagent ions created by the ionization of mobile phase solvent molecules. The vaporized solvent molecules ionize to produce the reagent ions [X+H]+ in the positive mode and [X-H]- in the negative mode. It is these reagent ions that produce stable sample ions when they collide with the sample molecules.
Atmospheric pressure chemical ionization (APCI)
The sample molecules are ionized through a process of proton transfer in the positive mode and by either electron transfer or proton transfer in the negative mode. The energy for the APCI ionization process is collision dominated because of the relatively high (atmospheric) pressure of the API source.NOTE: For reverse phase applications, the reagent ions consist of protonated solvent molecules in the positive mode and solvated oxygen ions in the negative mode. With favorable thermodynamics, the addition of modifiers changes the reagent ion composition. For example, the addition of acetate buffers or modifiers can make the acetate ion, [CH3COO]-, the primary reagent in the negative mode. Ammonium modifiers may make protonated ammonia [NH4]+ the primary reagent in the positive mode.Through collisions, an equilibrium distribution of certain ions (for example, protonated water cluster ions) is maintained. The likelihood of premature fragmentation of the sample ions in the ion source is reduced given the moderating influence of solvent clusters on the reagent ions and the relatively high gas pressure in the source. As a result, the ionization process yields primarily molecular product ions for mass analysis in the mass spectrometer.
58
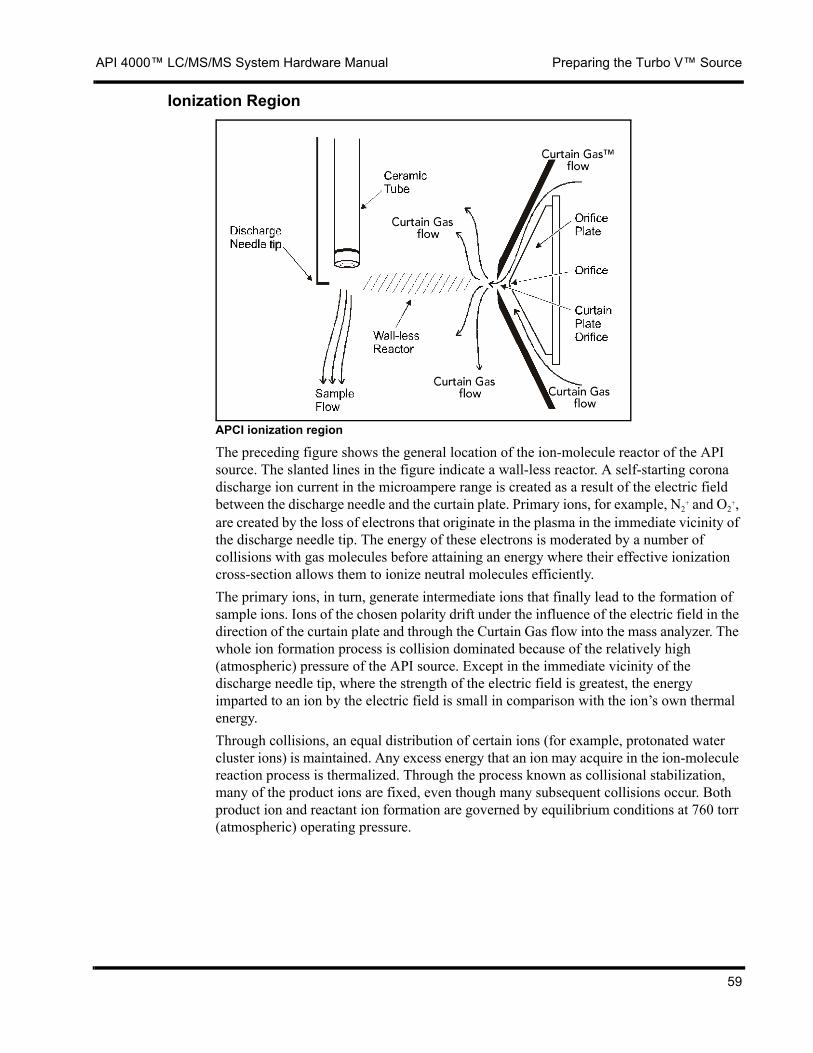
API 4000™ LC/MS/MS System Hardware Manual Preparing the Turbo V™ Source
Ionization Region
APCI ionization region
The preceding figure shows the general location of the ion-molecule reactor of the API source. The slanted lines in the figure indicate a wall-less reactor. A self-starting corona discharge ion current in the microampere range is created as a result of the electric field between the discharge needle and the curtain plate. Primary ions, for example, N2
+ and O2+,
are created by the loss of electrons that originate in the plasma in the immediate vicinity of the discharge needle tip. The energy of these electrons is moderated by a number of collisions with gas molecules before attaining an energy where their effective ionization cross-section allows them to ionize neutral molecules efficiently.The primary ions, in turn, generate intermediate ions that finally lead to the formation of sample ions. Ions of the chosen polarity drift under the influence of the electric field in the direction of the curtain plate and through the Curtain Gas flow into the mass analyzer. The whole ion formation process is collision dominated because of the relatively high (atmospheric) pressure of the API source. Except in the immediate vicinity of the discharge needle tip, where the strength of the electric field is greatest, the energy imparted to an ion by the electric field is small in comparison with the ion’s own thermal energy.Through collisions, an equal distribution of certain ions (for example, protonated water cluster ions) is maintained. Any excess energy that an ion may acquire in the ion-molecule reaction process is thermalized. Through the process known as collisional stabilization, many of the product ions are fixed, even though many subsequent collisions occur. Both product ion and reactant ion formation are governed by equilibrium conditions at 760 torr (atmospheric) operating pressure.
59

Preparing the Turbo V™ Source API 4000™ LC/MS/MS System Hardware Manual
NOTE: The API source functions as a wall-less reactor since the ions that pass from the source to the vacuum chamber and eventually to the CEM ion detector never experience collisions with a wall—only collisions with other molecules. Ions are also formed outside the designated API source, but are not detected and are eventually neutralized by interacting with a wall surface.The temperature of the probe is an important factor for APCI probe operation. The temperature must be set high enough to ensure a rapid evaporation. At a sufficiently high operating temperature, the droplets are vaporized quickly so that organic molecules are desorbed from the droplets with minimal thermal degradation. If, however, the temperature is set too low, the evaporation process is slower and pyrolysis, or decomposition, may occur before vaporization is complete. To preserve the molecular identity, the temperature of the probe must be set to ensure rapid evaporation. Operating the APCI probe at temperatures above the optimal temperature may cause thermal decomposition of the sample.
Choosing an Ion Source ProbeConsider the following features of the TurboIonSpray probe and APCI probe when choosing an ion source probe.
TurboIonSpray® Probe FeaturesThe following list outlines the features of the TurboIonSpray probe:• Able to function as conventional IonSpray source when the heater is turned off.• Able to function with flow rates from 40 to 1000 µL/min.• Able to vaporize 100% aqueous to 100% organic solvents.The TurboIonSpray probe is ideally suited for LC/MS/MS analyses. The sensitivity gains that are achieved with this technique are both flow rate and analyte dependent.In the conventional IonSpray source, sensitivity decreases with increased flow rate whereas the TurboIonSpray probe increases ionization efficiency, especially at higher flow rates. This results in improved sensitivity. Sensitivity is compound dependent, and compounds with extremely high polarity and low surface activity usually show the greatest sensitivity increases. The TurboIonSpray technique is mild enough to be used with labile compounds, such as peptides, proteins, and thermally labile pharmaceuticals.NOTE: The difference between conventional IonSpray and TurboIonSpray systems is that, with the TurboIonSpray source the ionization of the sample is achieved with additional heater gas that is delivered to aid in the desolvation of the spray. The TurboIonSpray heater will operate only if a minimum gas flow is established. Typically, the TurboIonSpray probe is used at higher flow rates (greater than 40 µL/min).
APCI Probe FeaturesThe following list outlines the features of the APCI probe:• Able to function with flow rates up to 2000 µL/min and can handle the entire flow
from a wide bore column without splitting.• Able to vaporize a 100% aqueous mobile phase.• Able to handle volatile mobile phase buffers.
60

API 4000™ LC/MS/MS System Hardware Manual Preparing the Turbo V™ Source
• Able to vaporize volatile and labile compounds with minimal thermal decomposition.The APCI probe is ideally suited for creating simple APCI spectra for MS/MS experiments. It is also good for rapid sample introduction by flow injection with or without a liquid chromatograph (LC) column.The APCI probe and TurboIonSpray probe have different identifying resistor values, which indicate to the temperature controller module which probe type is installed. This allows the temperature controller module to set the temperature for the probe in use.
Installing the Turbo V™ SourceAs shown in the following figure, the Turbo V™ source housing mounts to the front end of the vacuum chamber and is held in position by two locking arms.
Mounting the Turbo VTM source housing
Tempered glass windows located on the side and at the end of the housing allows you to observe the ion source probe. The probe is inserted and secured into the top of the housing. Both the ion source probe and housing can be quickly and easily removed without tools to allow access to the vacuum interface.
Installing the Turbo V™ Source Housing and Probe
To install the Turbo VTM source housing and probe1. Place the Turbo V source housing straight in against the vacuum interface, ensuring
that the two metal rods on the housing insert into the vacuum interface.2. Rotate the two black locking arms on either side of the housing downwards to secure
the housing.
Black locking arm
61
Preparing the Turbo V™ Source API 4000™ LC/MS/MS System Hardware Manual
3. To install the probe, carefully insert the probe in the middle orifice located inside the tower and align the knobs on the ion source probe with the tower at the top of the housing.
4. Gently push down on the ion source probe to ensure that the contacts are properly engaged with those in the tower. If the probe is aligned properly then the exhaust will turn off. Otherwise, turn the probe slightly until the exhausts shuts off.
CAUTION! To avoid damaging the probe, do not allow the protruding electrode tip in the probe to touch any part of the source housing. The same applies to the corona discharge needle.
5. Turn the bronze retaining ring over the probe, push it down to engage its threads with the threads on the source tower, and then screw the ring down all the way. The micrometer knob on the top of the housing tower is used to adjust the y-axis setting. (For more information on probe height, see “Optimizing the TurboIonSpray® Probe” on page 66, or “Optimizing the APCI Probe” on page 72.)
6. Attach the sample inlet line from the splitter located at the front right of the source housing (when facing the source glass window) to the top of the probe.
WARNING! Do not bypass the splitter connection. The splitter provides safety grounding between the instrument and the sample introduction device.
62

API 4000™ LC/MS/MS System Hardware Manual Preparing the Turbo V™ Source
Ventilation
WARNING! Failure to provide proper ventilation of the ion source can result in hazardous vapors being released into the laboratory environment.
The ion source requires that the source exhaust system be properly connected and functioning.
Source exhaust system
A regulated input of clean, dry, oil free air at 50 psig with flows up to 6 L/min for the source exhaust pump is required. The source exhaust pump is used to vent solvent vapors which can develop in the Turbo V source housing. It is highly recommended that these vapors be passed into a drain vessel and then vented from the output hose on the lid of the drain vessel to a fume hood, or outside port.When the instrument is switched on, the system software must be running before the source exhaust pump will activate. The pump will remain on after the system software stops running. When the instrument is in standby mode, the source exhaust pump is automatically shut off.
63

Preparing the Turbo V™ Source API 4000™ LC/MS/MS System Hardware Manual
Preparing the TurboIonSpray® ProbeThe TurboIonSpray probe has the same ionization capabilities as an IonSpray source, although the probe is capable of operating more efficiently over a wider range of liquid flow rates, without post-column splitting. The TurboIonSpray probe’s typical applications include using 2 mm ID columns operating at 200 µL/min with no split for the analysis of small polar analytes. Higher liquid flow rates and larger ID LC columns are also compatible with the probe. The TurboIonSpray probe accepts flows from 5 to 3000 µL/min from 100% aqueous to 100% organic solvent compositions, such as acetonitrile, without splitting. This allows the use of 1 mm, 2 mm, and 4.6 mm analytical columns.
TurboIonSpray® Probe ComponentsThe TurboIonSpray probe is compatible with the Turbo V source housing of the API 4000™ LC/MS/MS system.
TurboIonSpray® probe
Operation of the TurboIonSpray probe requires that the source exhaust system of the API 4000 system be on and operating to specification. If the source exhaust system is not working properly, the instrument power supplies are disabled.The ion source consists of a TurboIonSpray probe with built-in ceramic heater to provide turbo spray. The temperature is controlled by the computer adjustable temperature control board (part of the main console).
Inlet DescriptionThe TurboIonSpray probe consists of an IonSpray probe with a turbo (heater gas) spray, as shown in the following figure.
Black collar
Bronze retaining ring
Electrode tip
64

API 4000™ LC/MS/MS System Hardware Manual Preparing the Turbo V™ Source
TurboIonSpray® source schematic
All electrical and gas connections are made through the Turbo V source housing. This includes Gas 1 as nebulizer gas, Gas 2 as turbo gas, a high-voltage connection, heater element and temperature sensors, and electrical interlock connections. The micrometer head allows the probe to be adjusted vertically up to 13 mm for optimum performance. Only the sample line from the splitter mounted at the front left of the source housing needs to be connected manually to the probe.The turbo heater temperature is set using the application software through the TEM parameter. The TEM parameter value and the actual value of the heater temperature is the same (for example, TEM 350 is equal to 350 °C at the heater). The TurboIonSpray probe temperature, which is set using the application software, is maintained by the temperature control board (TCB) mounted inside the main console. The TCB adjusts the flow of power to the heater element as a function of the difference between the actual heater temperature and the temperature setting. The probe temperature is monitored by a thermocouple connected directly to the heater element that maintains the temperature within ±5 °C of the TEM setting. The operating temperature for the probe is up to approximately 750 °C. NOTE: The temperature is controlled by monitoring the output of a thermocouple connected to the heater that is embedded into the ceramic tube. At the temperature control board, the thermocouple output is compared with the temperature setting, and the difference determines the power flow to the heater.The operating temperature should be adjusted relative to LC mobile phase composition, analyte, and flow rate. In general, the heat that allows the liquid spray to reach dryness just before reaching the curtain plate will provide optimal performance.
Ion Source Probe AdjustmentsA micrometer scale on top of the source housing allows a y-axis adjustment (up to 13 mm). Another micrometer scale on the side of the source housing allows an x-axis adjustment (up to 10 mm). A black collar mounted in the handle of the ion source probe raises and lowers the sample tube in relation to the nebulizing jet to produce an optimal signal.Turbo gas flows of approximately 8 L/min are considered optimum for conditions where heat is required. Ionization efficiency is improved with the input of heat for all liquid flow rates. However, at lower flow rates (less than 20 µL/min) the gains are small. Heat input
65
Preparing the Turbo V™ Source API 4000™ LC/MS/MS System Hardware Manual
may be desirable under low flow conditions because of enhancing in-source (orifice-skimmer) fragmentation. Temperatures as low as 80 to 100 °C have proven useful for enhancing this capability (phosphopeptide mapping for instance) when operating at low flow rates.
Specifications
Temperature Range• Turbo temperature from room temperature to 750 °C
Liquid Chromatography (LC)• Interfaces to any liquid chromatography system at a flow range of 5 to 3000 µL/min.
IonSpray Nebulizer Gas (Gas 1)• Zero grade air at 100 psig ±5 psig
TurboIonSpray® Heater Gas (Gas 2)• Zero grade air at 100 psig ±5 psig
Consumable PartsSee “Appendix C: Consumables” for a list of parts for the API 4000 system.
Optimizing the TurboIonSpray® ProbeThe following section outlines the practical considerations when optimizing TurboIonSpray probe performance. It is intended to provide the information necessary to aid the operator in quantifying the separate operating parameters.TurboIonSpray performance depends on the following factors:• Sprayer position in relation to the orifice• Nebulizer tip position in relation to the nebulizing jet• Nebulizer gas• Heater gas flow and temperature• Solvent compositionOptimum performance on standard compounds is relatively easy to achieve and only a little adjusting or tuning is required once the probe is optimized. With experience, the operator will develop a personal optimization method that works best. In general, once the probe is installed and optimum factors have been determined, little or no readjustment of the values is necessary on a day-to-day basis. If the probe is removed, it is recommended that it be re-optimized after it is reinstalled.
66

API 4000™ LC/MS/MS System Hardware Manual Preparing the Turbo V™ Source
CAUTION! For tuning purposes, a compound with a known molecular ion should be introduced either by continuous infusion or flow injection. Infusion is preferred because it provides a continuous flow of sample. The tuning compound should have characteristics similar to the sample to be analyzed during normal operation and should be introduced at the same liquid flow rate.
CAUTION! If the TurboIonSpray voltage is set too high, a blue glow can be seen at the tip of the TurboIonSpray probe indicating a corona discharge. This will result in decreased sensitivity and stability of the ion signal.
CAUTION! If the instrument is to be left unattended while in operation, ensure that LC shut-off is in use to prevent flooding of the Turbo V source housing.
Optimizing the TurboIonSpray® Probe PositionThe position of the TurboIonSpray probe relative to the orifice in the curtain plate and the position of the sample tube relative to the nebulizing jet are important factors in optimizing TurboIonSpray probe performance. The position of the sprayer affects sensitivity and signal stability and should always be moved in small increments.Looking through the window of the Turbo V source housing provides the best view of the spray trajectory. At lower flow rates, the probe could be adjusted to its lowest position. Higher flow rates will require that the probe be positioned to be higher than the orifice. The curtain plate orifice should remain clear of solvent or solvent drops at all times.Changing from low solvent flow rates (5 µL/min) to high solvent flow rates (3000 µL/min) may require that the TurboIonSpray probe be repositioned higher to ensure proper evaporation of droplets and efficient ionization for sampling through the orifice of the mass spectrometer. This may also require a temperature adjustment.Also, as the aqueous composition of the carrier solvent increases at high flow rates (3000 µL/min), the spray becomes more visible. Refer to the table below for recommended starting settings for the TurboIonSpray source.
Parameter optimization for TurboIonSpray® probe
Parameter Typical values Operational range
LC flow 5 to 50 µL/min 200 µL/min 1000 µL/min 5 to 3000 µL/min
Gas 1—nebulizer gas 15 to 25 psig 40 to 60 psig 40 to 60 psig 0 to 90 psig
Gas 2— turbo gas 0 to 20 psig 40 to 60 psig 40 to 60 psig 0 to 90 psig
Temperature* 100 to 200 oC 425 to 650 oC 550 to 750 oC Up to 750 oC
DP** 70 V 70 V 80 V 5 to 400 V
Curtain Gas™ flow 10 to 15 psig 20 to 30 psig 25 to 35 psig 10 to 50 psig
Probe vertical y-axis position
10 to 13 mm 0 to 2 mm 0 mm 0 to 13 mm
Probe horizontal x-axis position
5 to 8 mm 5 to 8 mm 5 to 8 mm 0 to 10 mm
67

Preparing the Turbo V™ Source API 4000™ LC/MS/MS System Hardware Manual
Multiply charged proteins and peptides introduced at a few microliters per minute usually require the sprayer to be much higher than the curtain plate orifice.
To optimize the TurboIonSpray® probe position1. Start with the probe in the middle location of the x-axis (setting of 5) and at the
highest position on the y-axis (setting of 0).2. Infuse or inject the analyte of interest.3. Using small increments, move the probe up and down, left and right until optimal
sensitivity is achieved.4. Adjust the black collar on the handle of the ion source to move the electrode tube with
respect to the nebulizer tube. Typically, a 0.5 to 1.0 mm protrusion of the electrode from the nebulizer tube will ensure stable and optimum operating conditions.NOTE: Optimization needs to be done if the combination of analyte, flow rate, and composition changes. However, the optimal settings will remain constant for any given combination of the above.
To optimize the TurboIonSpray® probe voltage1. Infuse or inject the analyte of interest.2. Increase the voltage by small increments (100 V at a time).3. Once performance reaches a plateau, voltage has been optimized.
Higher flow rates will require a flow injection optimization of this voltage.NOTE: It is usually best to use the lowest voltage that provides the best sensitivity.Positive mode, single-charged compounds usually require a high probe voltage, from 4000 to 5500 V. Negative mode compounds usually require a lower voltage, from -3000 to -4500 V.
Optimizing TurboIonSpray® Probe Nebulizer and Heater Gas FlowOptimize nebulizer gas (Gas 1) for best signal stability and sensitivity. Typically, the software provides a pressure of 40 to 60 psig.The heater gas (Gas 2) aids in the evaporation of solvent, which helps to increase the ionization of the sample. However, too high a temperature can cause premature vaporization of the solvent at the TurboIonSpray probe tip, especially if the probe is set too low (setting of 5 to 13 mm), which will result in signal instability and a high chemical background noise. Similarly, a high heater gas flow could produce a noisy or unstable signal. Typically a value of 30 to 50 psig is used for Gas 2.
* Optimum temperature values depend on the compound and mobile phase composition (higher aqueous content requires higher temperature).**DP value is compound dependent.
Parameter optimization for TurboIonSpray® probe
Parameter Typical values Operational range
68

API 4000™ LC/MS/MS System Hardware Manual Preparing the Turbo V™ Source
Optimizing Turbo Temperature and Solvent CompositionThe quantity and type of sample affects the optimal TurboIonSpray temperature. At higher flow rates the optimal temperature increases. A more significant factor is the composition of the solvent. As the organic content of the solvent increases, the optimal probe temperature should decrease. With solvents consisting of 100% methanol or acetonitrile, the probe performance may optimize as low as 500 °C. Aqueous solvents consisting of 100% water at flows of approximately 1000 µL/min require a maximum probe temperature of 750 °C. Normal optimization is usually performed in increments of 50 °C.The TurboIonSpray probe is normally used with sample flow rates of 40 to 1000 µL/min. The heat is used to increase the rate of evaporation and this improves ionization efficiency resulting in increased sensitivity. See the table “Parameter optimization for TurboIonSpray® probe” on page 67 for recommended temperatures.
CAUTION! The TurboIonSpray probe should not be operated at temperatures greater than 750 oC.
WARNING! Do not remove the probe from the source housing or the housing from the instrument while either is hot. Allow at least 10 minutes for it to cool.
Commonly used solvents and modifiers are acetonitrile, methanol, propanol, water, acetic acid, formic acid, ammonium formate, and ammonium acetate. The modifiers such as TEA, sodium phosphate, TFA, and dodecyl sodium sulfate are not commonly used because they complicate the spectrum with their ion mixtures and cluster combinations. They may also suppress the strength of the target compound’s ion signal. The standard concentration of ammonium formate or ammonium acetate is from 2 to 10 mmol/L for positive ions and 2 to 50 mmol/L for negative ions. The concentration of the organic acids is 0.1 to 0.5% by volume.
Operating Tips• When running the TurboIonSpray probe, set the Curtain Gas™ flow to the highest rate
possible without affecting sample sensitivity and stability. This will help prevent penetration of the liquid stream into the orifice, which can produce a noisy signal.
• Place the sprayer tip as far as possible from the orifice plate (y-axis) to prevent contamination of the orifice.
• Adjust the source parameters and sprayer position to increase the overall signal-to-noise ratio.
• The higher the liquid flow or the higher the aqueous composition of the solvent, the higher the temperature required. However, too high a temperature can cause thermal degradation of the compound.
69

Preparing the Turbo V™ Source API 4000™ LC/MS/MS System Hardware Manual
Preparing the APCI ProbeThe APCI probe offers an alternative method of introducing samples to the API 4000 system. The APCI probe generates ions representative of the molecular composition of the sample. Where the TurboIonSpray probe produces ions by the process of ion evaporation, the APCI probe vaporizes the sample prior to inducing ionization by a process called atmospheric pressure chemical ionization (APCI). This process is induced by a corona discharge needle as the ions pass through the ion source chamber to the interface region. This process leaves the molecular constituents of the sample intact.The APCI probe can accept the entire effluent from as low as 50 µL/min to a wide bore column (2000 µL/min) without splitting. The rapid desolvation and vaporization of the droplets and entrained analyte minimizes thermal decomposition and preserves molecular identity for ionization by the corona discharge needle. Buffers are readily tolerated by the source without significant contamination and the flash vaporization of the sprayed effluent allows up to 100% water to be used without difficulty. Overall, the APCI probe is a stable inlet that is used extensively for high-throughput analyses of complex and dirty samples since it is less sensitive to ion suppression effects.
APCI Probe ComponentsThe APCI probe is compatible with the Turbo V source housing of the API 4000 instrument.
APCI probe
The operation of the APCI probe requires that the source exhaust system of the API 4000 instrument operates to specification. If the source exhaust system is not working properly, the instrument power supplies are disabled.The APCI probe consists of a probe with built-in heater and individually-mounted corona discharge needle. The temperature is controlled by a computer adjustable temperature control board (part of the main console).
Inlet DescriptionThe sprayer probe consists of 0.012" OD stainless steel tubing and sprayer surrounded by a flow of nebulizer gas. The liquid sample flow is pumped through the sprayer where it is
Black collarElectrode tip
Bronze retaining ring
70

API 4000™ LC/MS/MS System Hardware Manual Preparing the Turbo V™ Source
nebulized into a ceramic tube with an embedded heater. When the liquid sample is pumped into the ceramic tube, the sample and solvent are vaporized. The spray then flows through the ceramic tube into the ionization region in the Turbo V source housing.All electrical and gas connections are made through the source housing. This includes Gas 1 for the nebulizer, a needle current connection, the heater element and temperature sensors, and electrical interlock connections.
APCI schematic
The probe can be adjusted vertically and horizontally for optimum performance. Only the sample line from the splitter mounted at the front left of the source housing needs to be connected manually to the probe.The liquid sample is introduced through a fitting on the probe handle (top) from where it flows through stainless steel tubing to the tip of the sprayer. A high-velocity jet of nebulizer gas (Gas 1) flows coaxially over the sprayer to disperse the sample as a mist of fine droplets. The sample mist flows through the ceramic vaporization tube into the reaction region of the ion source past the corona discharge needle where the sample molecules are ionized.
Ion Source Probe AdjustmentsA micrometer scale on top of the source housing allows a y-axis adjustment (up to 13 mm). Another micrometer scale on the side of the source housing allows an x-axis adjustment (up to 10 mm). A black collar mounted in the handle of the ion source probe raises and lowers the sample tube in relation to the nebulizing jet to produce an optimal signal. The nebulizer tip is inside the ceramic tube and cannot be seen when the probe is in its operating position.The probe temperature is maintained by a heater embedded into the length of the ceramic tube. The power to the heater, and as a direct result the heater temperature, is controlled by the temperature control board, which is part of the main console. The temperature control board adjusts the flow of power to the ceramic heater as a function of the difference between the actual heater temperature and the temperature setting on the applications software. The probe temperature is monitored by a thermocouple connected directly to the heater element. NOTE: The temperature is controlled by monitoring the output of a thermocouple connected to the heater embedded in the ceramic tube. At the temperature control board, the thermocouple output is compared with the temperature setting, and the difference determines the power flow to the heater.
71
Preparing the Turbo V™ Source API 4000™ LC/MS/MS System Hardware Manual
The temperature of the ceramic tube determines the rate of sample vaporization and, consequently, the degree of thermal decomposition in the sample. The actual temperature of the sample and solvent does not exceed the vaporization temperature. In other words, there is no significant superheating of the liquid sample. However, increasing the temperature increases the rate of vaporization, which induces the thermal decomposition of sample ions.
Corona Discharge CharacteristicsThe corona discharge in the APCI ion source is formed by three major electric fields and fluid flow elements:• Corona discharge needle• Curtain plate • Orifice lensThe purpose of the corona discharge is to ionize the trace species or sample gas. Primary ions, which are formed as a result of the discharge, are converted by collisional processes to final ion-molecule reaction products.The operator has the ability to set the Corona Discharge setting at the computer by adjusting the value of the needle current (NC).
Specifications
Temperature Range• APCI temperature from 100 to 750 °C
Liquid Chromatography (LC)• Interfaces to any liquid chromatography system at a flow range of 200 to 2000 µL/min
IonSpray™ Source Nebulizer Gas (Gas 1)• Zero grade air at 100 psig ±5 psig
Consumable PartsSee “Appendix C: Consumables” for a list of parts for the API 4000 system.
Optimizing the APCI Probe
CAUTION! If the instrument is to be left unattended while in operation, ensure that LC shut-off is in use to prevent flooding of the Turbo V source housing.
Optimization of the APCI probe should begin with a warm-up stage to allow the probe to heat prior to initiating the liquid sample flow. The 30-minute warm-up eliminates the possibility that solvent vapors may condense in a cold probe.
72

API 4000™ LC/MS/MS System Hardware Manual Preparing the Turbo V™ Source
To warm up the APCI probe1. On the computer, set the Curtain Gas flow value to 10 psig.
It is suggested that you operate the APCI with Curtain Gas flow rate to the highest value possible without signal loss.
2. Set the nebulizer gas (Gas 1) to 20 psig.3. In the Working Parameters file, set the heater temperature (TEM) to 400 oC.
CAUTION! The ceramic heater needs to be warmed slowly to avoid thermal shock to the heating element.
4. Let the APCI probe warm up for 30 minutes.5. Connect the LC solvent line from the injector or autosampler to the LC connection on
the probe. Turn on the pump.It takes approximately 10 minutes before the APCI probe reaches a temperature at which the solvent mist is cleared from the source housing.
Several parameters impact the performance of the APCI probe. Optimize the performance while injecting a known compound (reserpine is recommended), and monitor the signal of the known ion. Adjust the following parameters to maximize the signal-to-noise ratio as shown in the following table.
Parameter optimization for the APCI probe
Parameter Nominal value Operational range
LC Flow 1000 µL/min 200 to 2000 µL/min
NC 2 µA (positive),-2 µA (negative)
1 to 5 µA (positive),-1 to -5 µA (negative)
Gas 1 30 to 50 psig 0 to 90 psig
Temperature* 400 oC 100 to 750 oC
DP 60 V (positive),-60 V (negative)
±0 to 400 V
Curtain Gas™ flow 25 to 35 psig 10 to 50 psig
Probe vertical y-axis position 5 mm Scale 0 to 13 mm
Probe horizontal x-axis position 4 mm 0 to 10 mm
*Temperature value is compound-dependent.
73
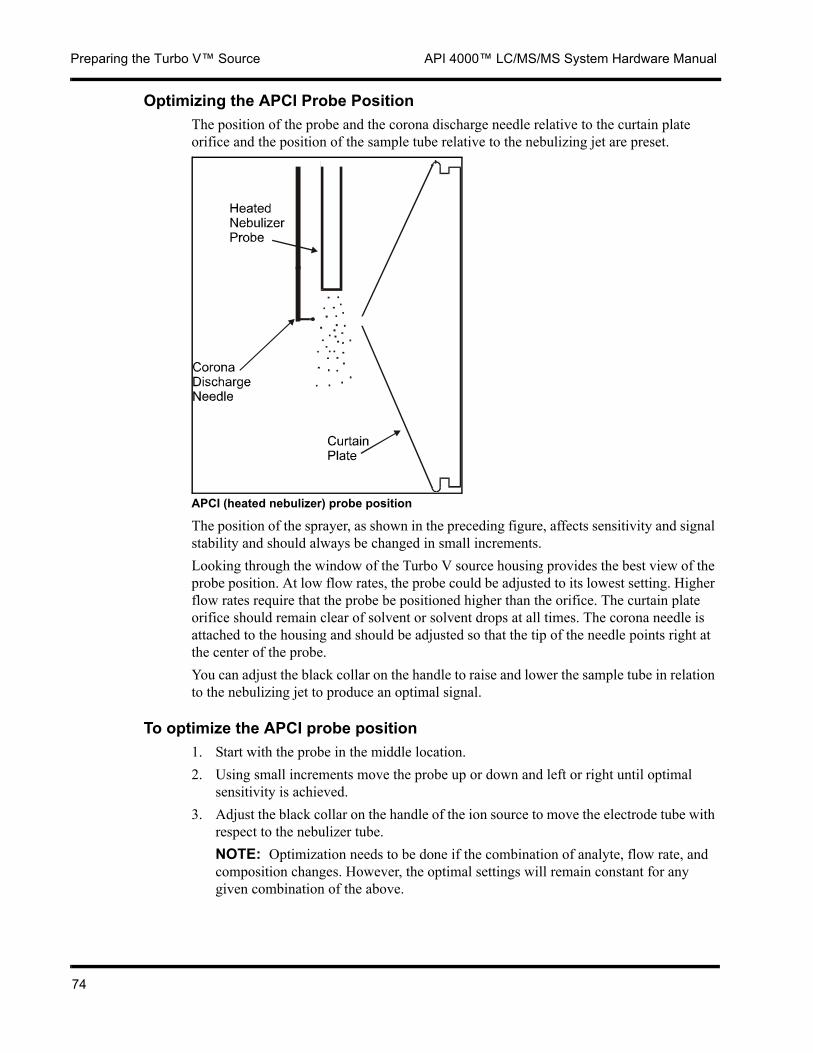
Preparing the Turbo V™ Source API 4000™ LC/MS/MS System Hardware Manual
Optimizing the APCI Probe PositionThe position of the probe and the corona discharge needle relative to the curtain plate orifice and the position of the sample tube relative to the nebulizing jet are preset.
APCI (heated nebulizer) probe position
The position of the sprayer, as shown in the preceding figure, affects sensitivity and signal stability and should always be changed in small increments.Looking through the window of the Turbo V source housing provides the best view of the probe position. At low flow rates, the probe could be adjusted to its lowest setting. Higher flow rates require that the probe be positioned higher than the orifice. The curtain plate orifice should remain clear of solvent or solvent drops at all times. The corona needle is attached to the housing and should be adjusted so that the tip of the needle points right at the center of the probe.You can adjust the black collar on the handle to raise and lower the sample tube in relation to the nebulizing jet to produce an optimal signal.
To optimize the APCI probe position1. Start with the probe in the middle location.2. Using small increments move the probe up or down and left or right until optimal
sensitivity is achieved.3. Adjust the black collar on the handle of the ion source to move the electrode tube with
respect to the nebulizer tube.NOTE: Optimization needs to be done if the combination of analyte, flow rate, and composition changes. However, the optimal settings will remain constant for any given combination of the above.
74
API 4000™ LC/MS/MS System Hardware Manual Preparing the Turbo V™ Source
Optimizing the Needle Current (NC)The needle current (NC) applied to the corona discharge needle usually optimizes over a broad range (that is, 1 to 5 µA in positive mode). To optimize, start at a value of one and increase until you achieve the best signal-to-noise ratio. If no changes in signal are observed when increasing the current, it is best to leave the current at the lowest setting that provides the best sensitivity (for example, 2 µA).NOTE: The corona needle does not need to be adjusted separately, but verify that it is centered when changing from one probe to another.
Optimizing Probe Temperature and Solvent CompositionThe quantity and type of solvent affects the optimal APCI probe temperature. At higher flow rates the optimal temperature increases. A more significant factor is the composition of the solvent. As the organic content of the solvent increases, the optimal probe temperature should decrease. With solvents consisting of 100% methanol or acetonitrile, the probe performance may optimize at a temperature as low as 400 °C, at flow rates of 1000 µL/min. Aqueous solvents consisting of 100% water set at flows of approximately 2000 µL/min require a minimum probe temperature of 700 °C. Normal optimization is usually performed in increments of 50 °C.The APCI probe is normally used with sample flow rates of 1000 µL/min but may be used with flows from 50 to 2000 µL/min. Heat is used to vaporize the sample and solvent sprayed into the Turbo V source housing. If the temperature is set too low, the vaporization will be incomplete and large, visible droplets are expelled into the housing. However, setting the temperature too high induces thermal degradation of the sample. The optimal temperature is the lowest setting that ensures the complete vaporization of the sample.
CAUTION! The APCI probe should not be operated at temperatures greater than 750 oC.
WARNING! Do not remove the probe from the source housing or the housing from the instrument while either is hot. Allow at least 10 minutes for it to cool.
Commonly used solvents and modifiers are acetonitrile, methanol, propanol, water, acetic acid, formic acid, ammonium formate, and ammonium acetate. Modifiers such as TEA, sodium phosphate, TFA, and dodecyl sodium sulfate are not commonly used because they complicate the spectrum with their ion mixtures and cluster combinations. They may also suppress the strength of the target compound ion signal. The standard concentration of ammonium formate or ammonium acetate is from 2 to 10 mmol/L for positive ions and 2 to 50 mmol/L for negative ions. The concentration of the organic acids is 0.1 to 0.5% by volume.
WARNING! The source exhaust pump must be vented through the backing pump exhaust manifold to either an external fume hood or an external exhaust source.
75
Preparing the Turbo V™ Source API 4000™ LC/MS/MS System Hardware Manual
Controlling the Turbo V™ Source TemperatureThe temperature controller monitors and maintains the temperature of the ceramic heater in both the APCI and TurboIonSpray probes. A thermal sensor, embedded in the ceramic tube that contains the heating element, senses the actual heater temperature and transmits it to the temperature controller board.The operating temperature range for the probes is up to 750 °C.
CAUTION! When using the APCI probe, do not set the temperature control board above 750 °C.
WARNING! Do not remove the probe from the source housing or the housing from the instrument while either is hot. Allow at least 10 minutes for it to cool.
Maintaining the Turbo V™ SourceCAUTION! Before using any cleaning or decontamination methods, except those specified by the manufacturer, operators should check with the manufacturer that the proposed method will not damage the equipment.
NOTE: Periodic supply gas leakage tests should be performed, along with general maintenance inspection by the operator to ensure safe operation of the instrument.
Removing and Replacing the Turbo V™ Source HousingUse procedures in this section to remove and replace the probe and the Turbo V source housing.
WARNING! Do not remove the probe from the source housing or the housing from the instrument while either is hot. Allow at least 10 minutes for it to cool.
To remove the ion source probe and Turbo V™ source housing1. Finish or abort any ongoing scans.2. Shut down the sample flow to the ion source probe.3. Unscrew the sample inlet line from the ion source probe, and then remove the sample
inlet line.4. Unscrew the bronze retaining ring.5. Gently pull the ion source probe straight up out of the housing. Do not allow the tip of
the probe to touch anything as you remove it or store it. Place the probe aside in a safe area.
6. Unscrew the inlet line that connects the external sample pump to the fitting on the grounding tee, and then remove the sample inlet line.
7. Rotate the two black locking arms upward to loosen the housing.8. Pull the Turbo V source housing straight away from the vacuum chamber.
76

API 4000™ LC/MS/MS System Hardware Manual Preparing the Turbo V™ Source
To replace the ion source probe and Turbo VTM source housing1. Line the Turbo V source housing up with the vacuum chamber and push into place.2. Rotate the two black locking arms downward to secure the housing.3. Connect the sample inlet line to the fitting on the front right of the housing.4. Slide the ion source probe straight down into the housing, taking care not to allow the
tip of the probe to touch anything.5. Tighten the bronze retaining ring.6. Attach the sample inlet line to the ion source probe.
Adjusting the Corona Discharge NeedleWhen using the APCI source, ensure that the corona discharge needle is pointing towards the orifice.
WARNING! Follow this procedure to avoid contact with the high voltages applied to the corona discharge needle and the curtain plate.
To adjust the corona discharge needle1. Loosen the bronze retaining ring.2. Use a slotted screwdriver to adjust the screw on the top of the needle.3. Look through the glass window to ensure that the needle is aligned with the tip facing
the orifice.
If further adjustment is needed1. Remove the Turbo V source housing as described in “Removing and Replacing the
Turbo V™ Source Housing” on page 76.2. Turn the housing so that the back is facing towards you.3. Turn the needle so that the tip is pointing towards you.
You can now replace the source housing.
Replacing the Corona Discharge NeedleCare must be taken to ensure your safety from the high voltages applied to the ion source probe.
WARNING! Follow this procedure to avoid contact with the high voltages applied to the corona discharge needle and the curtain plate.
To replace the corona discharge needle1. Finish or abort any ongoing scans.2. Allow sufficient time for the probe to cool down, then remove the sample tubing, ion
source probe, and Turbo V housing as described in “Removing and Replacing the Turbo V™ Source Housing” on page 76.
77

Preparing the Turbo V™ Source API 4000™ LC/MS/MS System Hardware Manual
3. Unscrew the plastic screw at the top of the needle while holding the needle. 4. Gently remove the needle through the exhaust socket.5. Insert the new corona discharge needle through the exhaust socket.6. Slide the needle into the holding tube and turn the nut at the top of the needle until a
firm connection is made.You can now reassemble the source housing, insert the ion source probe, and begin optimization procedures.
78

5
Shutting Down the SystemThe power to the API 4000™ LC/MS/MS system is typically left on to maintain the high vacuum conditions required for operation. The instrument also remains in a “warmed-up” state so that operation can begin immediately. The instrument power is usually only turned off when service on the vacuum or electrical components is required. This procedure should be followed before performing any maintenance on the instrument. When followed, the potential for exposure to the instrument’s high operating voltages will be minimized.
To shut down the instrument1. Complete any ongoing scans or select the Abort Sample command from the Acquire
menu.2. Shut off the sample flow to the instrument.
CAUTION! The sample flow must be shut off before shutting down the instrument
3. Close the software.4. Shut off the main power switch to the instrument. The switch is located on the
bulkhead on the right side of the chassis. Leave the roughing pump running.NOTE: When the main power switch is turned off, the turbo pump continues to rotate without power for a few minutes and continues to provide vacuum to the vacuum chamber. If, during this time, the roughing pump is powered down, the pressure in the vacuum line between the roughing pump and the turbo pump increases. The increase in back pressure can create an incorrect load on the turbo pump bearings and can cause a catastrophic failure of the turbo pumps.
CAUTION! To prevent damage to the turbo pumps, leave the roughing pump(s) running for a minimum of fifteen minutes after shutting off the instrument’s main power switch to allow the turbo pumps to spin down gradually. This prevents the build-up of pressure in the vacuum lines from the turbo pumps to the roughing pump(s).
5. Shut off the roughing pump(s). The pump is located outside the main console. The power switch is located above the power supply input attachment.
79

Shutting Down the System API 4000™ LC/MS/MS System Hardware Manual
NOTE: The roughing pump has its own power toggle switch and must be turned off manually. It is not controlled remotely by the system controller.
CAUTION! If the instrument is to be shut down for any length of time, it is recommended that the vacuum chamber be vented to prevent the roughing pump exhaust from being sucked back into the vacuum chamber following instrument shutdown. (To vent the vacuum chamber, follow step 7.)
80

API 4000™ LC/MS/MS System Hardware Manual Shutting Down the System
CAUTION! If the vacuum chamber is not going to be vented while the instrument is shut down, it is recommended that the roughing pump(s) remain on to prevent pump exhaust from being sucked back into the vacuum chamber. (If you do not vent the vacuum chamber, skip step 7.)
6. Unplug the main power supply to the instrument from the bulkhead at the rear right side of the chassis.
7. Let the instrument vent naturally through the orifice for 10 minutes to reach atmospheric pressure.
81

Shutting Down the System API 4000™ LC/MS/MS System Hardware Manual
82

A
Appendix A: PPG Exact Mass TableThen following table contains the exact monoisotopic masses and charged species (positive and negative) observed with the PPG (polypropylene glycol) calibration solutions. The masses and ions were calculated using the formula M = H[OC3H6]nOH, while the positive ion MS/MS fragments used the formula [OC3H6]n(H+). In all calculations, H = 1.007825, O = 15.99491, C = 12.00000, and N = 14.00307. NOTE: When performing calibration with the PPG solutions, ensure that the correct isotope peak is used.
n Exact Mass (M) (M = NH4)+ MS/MS
Fragments (M = 2NH4)2+ (M = COOH)-
1 76.052 94.087 59.0 56.061 121.050
2 134.094 152.129 117.1 85.082 179.092
3 192.136 210.171 175.1 114.102 237.134
4 250.178 268.212 233.2 143.123 295.176
5 308.220 326.254 291.2 172.144 353.218
6 366.262 384.296 349.2 201.165 411.259
7 424.304 442.338 407.3 230.186 469.301
8 482.346 500.380 465.3 259.207 527.343
9 540.388 558.422 523.4 288.228 585.385
10 598.430 616.464 581.4 317.249 643.427
11 656.471 674.506 639.4 346.270 701.469
12 714.513 732.548 697.5 375.291 759.511
13 772.555 790.590 755.5 404.312 817.552
14 830.597 848.631 813.6 433.333 875.594
15 888.639 906.673 871.6 462.354 933.636
16 946.681 964.715 929.7 491.373 991.678
17 1004.723 1022.757 987.7 520.396 1049.720
18 1062.765 1080.799 1045.7 549.417 1107.762
19 1120.807 1138.841 1103.8 578.438 1165.804
20 1178.849 1196.883 1161.8 607.459 1223.845
21 1236.890 1254.925 1219.9 636.480 1281.887
83

Appendix A: PPG Exact Mass Table API 4000™ LC/MS/MS System Hardware Manual
22 1294.932 1312.967 1277.9 665.501 1339.929
23 1352.974 1371.009 1335.9 694.521 1397.971
24 1411.016 1429.050 1394.0 723.542 1456.013
25 1469.058 1487.092 1452.0 752.563 1514.055
26 1527.100 1545.134 1510.1 781.584 1572.097
27 1585.142 1603.176 1568.1 810.605 1630.138
28 1643.184 1661.218 1626.2 839.626 1688.180
29 1701.226 1719.260 1684.2 868.647 1746.222
30 1759.268 1777.302 1742.2 897.668 1804.264
31 1817.309 1835.344 1800.3 926.689 1862.306
32 1875.351 1893.386 1858.3 955.710 1920.348
33 1933.393 1951.428 1916.4 984.731 1978.390
34 1991.435 2009.469 1974.4 1013.752 2036.431
35 2049.477 2067.511 2032.5 1042.773 2094.473
36 2107.519 2125.553 2090.5 1071.794 2152.515
37 2165.561 2183.595 2148.5 1100.815 2210.557
38 2223.603 2241.637 2206.6 1129.836 2268.599
39 2281.645 2299.679 2264.6 1158.857 2326.641
40 2339.687 2357.721 2322.7 1187.878 2384.683
41 2397.728 2415.783 2380.7 1216.899 2442.724
42 2455.770 2473.805 2438.7 1245.920 2500.766
43 2513.812 2531.847 2496.8 1274.940 2558.808
44 2571.854 2589.888 2554.8 1303.961 2616.850
45 2629.896 2647.930 2612.9 1332.982 2674.892
46 2687.938 2705.972 2670.9 1362.003 2732.934
47 2745.980 2764.014 2729.0 1391.024 2790.976
48 2804.022 2822.056 2787.0 1420.045 2849.017
49 2862.064 2880.098 2845.0 1449.066 2907.059
50 2920.106 2938.140 2903.1 1478.087 2965.101
51 2978.147 2996.182 2961.1 1507.108 3023.143
52 3036.189 3054.224 3019.2 1536.129 3081.185
53 3094.231 3112.266 3077.2 1565.150 3139.227
54 3152.273 3170.307 3135.2 1594.171 3197.269
55 3210.315 3228.349 3193.3 1623.192 3255.311
56 3268.357 3286.391 3251.3 1652.213 3313.352
57 3326.399 3344.433 3309.4 1681.234 3371.394
58 3384.441 3402.475 3367.4 1710.255 3429.436
59 3442.483 3460.517 3425.5 1739.276 3487.478
60 3500.525 3518.559 3483.5 1768.297 3545.5202
61 3558.566 3576.601 3541.5 1797.318 3603.562
62 3616.608 3634.643 3599.6 1826.339 3661.604
n Exact Mass (M) (M = NH4)+ MS/MS
Fragments (M = 2NH4)2+ (M = COOH)-
84

API 4000™ LC/MS/MS System Hardware Manual Appendix A: PPG Exact Mass Table
63 3674.650 3692.685 3657.6 1855.359 3719.645
64 3732.692 3750.726 3715.7 1884.380 3777.687
65 3790.734 3808.768 3773.7 1913.401 3835.729
66 3848.776 3866.810 3831.7 1942.422 3893.771
67 3906.818 3924.852 3889.8 1971.443 3951.813
68 3964.860 3982.894 3947.8 2000464 4009.855
69 4022.902 4040.936 4005.9 2029.485 4067.897
70 4080.944 4098.978 4063.9 2058.506 4125.938
71 4138.985 4157.020 4122.0 2087.527 4183.980
72 4197.027 4215.062 4180.0 2116.548 4242.022
73 4255.069 4273.104 4238.0 2145.569 4300.064
74 4313.111 4331.145 4296.1 2174.590 4358.106
75 4371.153 4389.187 4354.1 2203.611 4416.148
76 4429.195 4447.229 4412.2 2232.632 4474.190
77 4487.237 4505.271 4470.2 2261.653 4532.231
78 4545.279 4563.313 4528.3 2290.674 4590.273
79 4603.321 4621.355 4586.3 2319.695 4648.315
80 4661.363 4679.397 4644.3 2348.716 4706.357
81 4719.404 4737.439 4702.4 2377.737 4764.399
82 4777.446 4795.481 4760.4 2406.758 4822.441
n Exact Mass (M) (M = NH4)+ MS/MS
Fragments (M = 2NH4)2+ (M = COOH)-
85

Appendix A: PPG Exact Mass Table API 4000™ LC/MS/MS System Hardware Manual
86

B
Appendix B: Generic ParametersThe first figure in each cell is a typical value. Below this is the range of possible values.
Parameter ID
AccessID
Positive Ion Mode Negative Ion ModeQ1 Q3 MS/MS Q1 Q3 MS/MS
CUR CUR 20 20 20 20 20 2010 to 50 10 to 50 10 to 50 10 to 50 10 to 50 10 to 50
CAD CAD 0 1 4 0 1 40 to 12 2 to 12
IS(1) IS 1000 1000 1000 -1000 -1000 -10000 to 5500 0 to 5500 0 to 5500 -4500 to 0 -4500 to 0 -4500 to 0
IS(2) IS 1500 1500 1500 -1500 -1500 -15000 to 5500 0 to 5500 0 to 5500 -4500 to 0 -4500 to 0 -4500 to 0
IS(3) IS 5000 5000 5000 -4200 -4200 -42000 to 5500 0 to 5500 0 to 5500 -4500 to 0 -4500 to 0 -4500 to 0
NC(4)(5) NC 3 3 3 -3 -3 -30 to 5 0 to 5 0 to 5 -5 to 0 -5 to 0 -5 to 0
TEM TEM 350 350 350 350 350 3500 to 800 0 to 800 0 to 800 0 to 800 0 to 800 0 to 800
OR DP 20 20 20 -20 -20 -20DP = OR 0 to 400 0 to 400 0 to 400 -400 to 0 -400 to 0 -400 to 0
Q0 EP -10 -10 -10 10 10 10EP = Q0 -15 to -2 -15 to -2 -15 to -2 2 to 15 2 to 15 2 to 15
IQ1 IQ1 Q0 + (-1) Q0 + (-1) Q0 + (-1) Q0 + 1 Q0 + 1 Q0 + 1IQ1 = Q0 + offset
ST ST Q0 + (-5) Q0 + (-5) Q0 + (-5) Q0 + 5 Q0 + 5 Q0 + 5ST = Q0 + offsetRO1 IE1 1 n/a 1 -1 n/a -1IE1 = Q0 - RO1 0.5 to 2 0.5 to 2 -2 to -0.5 -2 to -0.5RO1 IE1 n/a Q0 + (-1) n/a n/a Q0 + 1 n/aIE1 = Q0 + offsetIQ2 IQ2 Q0+ (-8) Q0+ (-8) Q0+ (-8) Q0 + 8 Q0 + 8 Q0 + 8
IQ2 = Q0 + offset
87
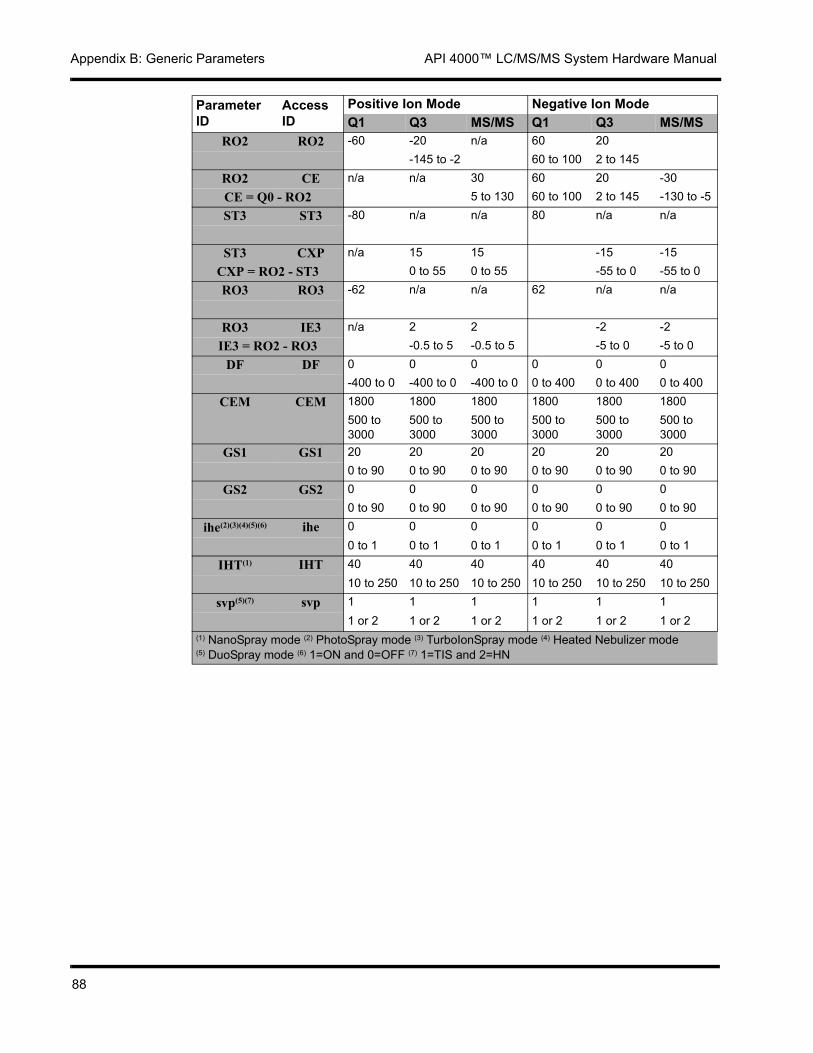
Appendix B: Generic Parameters API 4000™ LC/MS/MS System Hardware Manual
RO2 RO2 -60 -20 n/a 60 20-145 to -2 60 to 100 2 to 145
RO2 CE n/a n/a 30 60 20 -30CE = Q0 - RO2 5 to 130 60 to 100 2 to 145 -130 to -5ST3 ST3 -80 n/a n/a 80 n/a n/a
ST3 CXP n/a 15 15 -15 -15CXP = RO2 - ST3 0 to 55 0 to 55 -55 to 0 -55 to 0RO3 RO3 -62 n/a n/a 62 n/a n/a
RO3 IE3 n/a 2 2 -2 -2IE3 = RO2 - RO3 -0.5 to 5 -0.5 to 5 -5 to 0 -5 to 0
DF DF 0 0 0 0 0 0-400 to 0 -400 to 0 -400 to 0 0 to 400 0 to 400 0 to 400
CEM CEM 1800 1800 1800 1800 1800 1800500 to 3000
500 to 3000
500 to 3000
500 to 3000
500 to 3000
500 to 3000
GS1 GS1 20 20 20 20 20 200 to 90 0 to 90 0 to 90 0 to 90 0 to 90 0 to 90
GS2 GS2 0 0 0 0 0 00 to 90 0 to 90 0 to 90 0 to 90 0 to 90 0 to 90
ihe(2)(3)(4)(5)(6) ihe 0 0 0 0 0 00 to 1 0 to 1 0 to 1 0 to 1 0 to 1 0 to 1
IHT(1) IHT 40 40 40 40 40 4010 to 250 10 to 250 10 to 250 10 to 250 10 to 250 10 to 250
svp(5)(7) svp 1 1 1 1 1 11 or 2 1 or 2 1 or 2 1 or 2 1 or 2 1 or 2
(1) NanoSpray mode (2) PhotoSpray mode (3) TurboIonSpray mode (4) Heated Nebulizer mode (5) DuoSpray mode (6) 1=ON and 0=OFF (7) 1=TIS and 2=HN
Parameter ID
AccessID
Positive Ion Mode Negative Ion ModeQ1 Q3 MS/MS Q1 Q3 MS/MS
88

C
Appendix C: ConsumablesThe following is a list of consumables for the API 4000™ LC/MS/MS system:Item Part No. Description1 014629 Tool, Swab, Anti-Static Foam2 016492 Cap, Tubing Fused Sil 0.16 OD3 011559 Fitting, 10-32 Union, 1/16 Tubing4 012627 Fitting, Rheflex 1/165 012637 Ferrule, Rheflex 1/166 016316 Tube, 1/16 OX x .005 Bore8 011555 Tube, Teflon 1/16 x .007" ID9 019670 Tool, Swab, Anti-Static Foam11 010998 Chem, Oil - Roughing Pumps, 1 Liter12 021199 Fuse, 1.0 A - 250 V, 5 x 20 mm SB13 021181 Filter, Air 252 x 32214 013629 Fuse, 10 A - 250 VDC FB, 5 x 20 mm15 010848 Fuse, .5 A - 250 V, SLWBLW Glass16 021199 Fuse, 1.0 A - 250 V, 5 x 20 mm SB17 010352 Fuse, 4 A - 250 V, 5 x 20 Slo-Blo18 018786 Fitting, Union .15 mm Bore19 015968 Fitting, Union 1/16, .010 ORIF20 010615 Syringe, Gas Tight, 1.0 ml21 024676 Syringe, Gas Tight, 10 ul22 010613 Needle, Syringe Removable23 010616 Needle, Syringe, Luer Hub, 2"24 025388 Electrode, N 25 025392 Electrode, T26 017809 O-ring, 5.3 ID x 1.77 W VITON
89

Appendix C: Consumables API 4000™ LC/MS/MS System Hardware Manual
90

API 4000™ LC/MS/MS System Hardware Manual Glossary
GlossaryAccuracy (Quantitation)
Ratio of calculated concentration to known concentration. Useful only for QC or standard sample data. Used as a check on the “goodness of fit” of the regression curve.
Accurate MassThe ability to measure the m/z value of an ion with high precision. A typical target precision is 5 parts per million or better. The accurate mass of an ion can be used to determine the elemental composition of that ion. See Mass.
Acquisition QueueA list of validated data acquisition batches queued for processing.
Acquisition TypeThe Acquisition type indicates how the mass spectrometer method synchronizes with the injection system. Possible values include:• Manual Sync: Operator closes a contact manually.• No sync: No synchronization signal. The mass spectrometer starts as soon as the
method is downloaded and verification is complete.• LC sync: The mass spectrometer waits for an external Read Trigger signal from the
Autosampler to start scanning.• Injection manifold sync: Similar to LC sync, but start is initiated by a contact on a
manual injection valve.
A/D Converter (ADC)For analog-to-digital converter. A device that converts an analog signal (usually a voltage) to a digital signal so it can be processed and stored.
ADC DataData stream read from an analog-to-digital converter (ADC), for example the NI 6032E. This device has two analog channels that can be connected to external equipment such as a UV detector.
Air CushionThe volume of air drawn up by the autosampler before the sample. The air cushion is used to prevent mixing of the flush buffer and the sample.
Analysis ResultsThe total analytical output from the processing of a batch of data files. Includes: displays, printouts, and exports of statistics from the results table; displays and printouts of calibration curves; and displays and printouts of peak displays.
91
Glossary API 4000™ LC/MS/MS System Hardware Manual
AnalyteElement, molecule, or compound of interest to the analyst and for which quantitation or structural analysis is going to be obtained.
Analyte Peak DescriptorA peak descriptor created to extract the data for an analyte so it can be quantified. The descriptor by which a compound descriptor is named.
APCI ProbeCombined sample introduction and ionization device used for APCI. A corona discharge creates reagent ions from the LC solvent. The ions then ionize the analyte molecules.
Area ThresholdThe minimum distance between a series of points to be considered a peak. Used to help the application software determine peaks.
ASCII FilesThere are two types of ASCII, or text, files:• Delimited ASCII file: Text file that uses a specified delimiter (such as colon,
backslash, or semicolon) to separate fields of information.• Formatted ASCII file: Text file that is formatted in the manner that the given
component is to be published. This type of file does not separate data fields with delimiters. A formatted ASCII file is typically imported to a word processor that can be used to further format the data.
Atmospheric Pressure Chemical Ionization (APCI)Chemical ionization performed at atmospheric pressure using ambient air or solvent vapor as the reagent gas.
Atmospheric Pressure Ionization (API)Any ionization technique that is performed at atmospheric pressure rather than in vacuum. Examples are Electrospray, IonSpray and atmospheric pressure chemical ionization (APCI).
AttachedAccessing an instrument station remotely is called attaching. When you are attached you can only view the instrument status and sample queue.
Automatic MethodA fully-functional method that was created within the Automatic Wizard. This type of method is intended to be used on batches containing different compounds in every sample (that is, for integration only) and has therefore not undergone peak verification. For this reason, it may have more trouble finding the correct peak.
92

API 4000™ LC/MS/MS System Hardware Manual Glossary
Automatic TuningA process to adjust the instrument parameters automatically based on the operator-specified tuning criteria to ensure the instrument performance.
AutosamplerDevice used to automatically inject samples into an LC or LC/MS system.
Base Peak ChromatogramChromatographic plot that displays the intensity of the most intense ion within a scan versus scan number or time.
BatchA collection of samples with a specified set, method, and location.
Bunched PointA predetermined number of grouped points used to prevent the application software from identifying baseline noise as peak. It also helps to compensate for over-sampling by reducing the number of data points.
Bunching FactorNumber of points to be grouped together and considered a single point for the purpose of peak-finding. Eight to twelve points per peak is optimum. Bunching is used to find the peak, but all points are considered for integration (finding the area of the peak).
CAD GasGas introduced into a collision cell to induce fragmentation. See Collision Activated Dissociation (or Decomposition) (CAD).
Calculated ConcentrationThe concentration of an analyte calculated from a calibration curve. For standard samples this is also known as the back-calculated value. Used for standard and QC samples to determine the accuracy.
Calculated Concentration UnitsThe units of measure of the analyte in question after quantitation. The calculated concentration unit might be different than the concentration unit if the analyte had to be modified (that is, solvent added) so that quantitation could take place.
CalibrationThe process of calibrating the mass scale of a mass spectrometer using a compound or mixture that has peaks with accurately known mass. An automated procedure acquires spectra from a calibration standard for each quadrupole and produces Q1 and Q3 calibration tables.
93

Glossary API 4000™ LC/MS/MS System Hardware Manual
Calibration/Calibration CurveCalibration is the process of obtaining a calibration curve for an analyte so the concentration of the analyte in unknown samples may be determined (Quantitation).The Calibration Curve is the plot of analyte response versus known concentration and is obtained by analyzing a set of standard samples and measuring the response. The curve may use the response for the sample (height or area) or the ratio of the response to that of an internal standard.
CentroidThe process of converting mass spectral data from a form in which the peak shape can be viewed (profile) to a single value representing the m/z and intensity of the peak. Results in a data compression with loss of the peak shape information.
Channel Electron Multiplier (CEM)Type of ion detector used in AB SCIEX and API instruments. It amplifies ion signals by producing a cascade of electrons, utilizing a continuous dynode (horn-shaped channel) construction.
Chemical Ionization (CI)Ionization of neutral analyte molecules by the transfer of a charged species (proton, electron, or larger ion) from excess reagent ions to the analyte. Reagent ions are created from a reagent gas.
ChromatographyThe process of separating a mixture into individual components by selectively retaining them in a chromatographic column. The mixture is introduced in a mobile phase (gas or liquid) and passes over a stationary phase (usually a liquid held on a solid support or placed on the inside wall of a capillary). Common variants are LC (liquid chromatography) and GC (gas chromatography).
Collision Induced Dissociation (CID)Process whereby a mass-selected ion is excited and caused to fragment by collision with a target gas in the reaction cell, especially in MS/MS. CID should not be confused with CAD (see Collision Activated Dissociation) where the dissociation takes place in the orifice-skimmer region.
Collision Activated Dissociation (or Decomposition) (CAD)An ion/neutral process wherein a (fast) projectile ion dissociates as a result of interaction with a target neutral species. Same as Collision Induced Dissociation (CID). The initial ion is known as the precursor ion (detected in Q1) and the ions formed as product ions (detected in Q3). The product ion spectrum can provide information about the structure of the precursor.
Collision CellRegion of a mass spectrometer containing the collision gas. In a triple quadrupole, the collision cell is a quadrupole operated so that all ions are transmitted.
94

API 4000™ LC/MS/MS System Hardware Manual Glossary
Combinatorial ChemistryAutomatic chemical synthesis either in a mixture or as discrete compounds (also known as parallel synthesis). A means of producing a large number of chemicals that can be tested for biological activity or other properties.
Concentration UnitsThe units of measure of the analyte in question before quantitation.
Counted PeriodA counted period is specified by a number of cycles. See Period.
Curtain Gas™ flowAn ultra high purity N2 (nitrogen) gas barrier that aids in ion declustering and keeps non-ionized species out of the orifice and analyzer region of API mass spectrometers.
CycleOne cycle consists of running each experiment in a period once (that is, the time it takes to execute each experiment in a period). See also Period and Experiment.
DAD (LC)Diode Array Detector (DAD). See Photo Diode Array Detector (PDA).
Data Dependent ExperimentA process in which the mass spectrometer actions can be varied from scan to scan based on data acquired in a previous scan. For example, the mass spectrometer may operate in full scan mode but automatically switch to MS/MS mode when a peak is detected.
Detection LimitThe ability of the application software to detect the presence of an analyte. Typically defined as the number of times the analyte response must exceed the noise (standard deviation of any background signal). A value of 3x the noise is common. Also, a performance criterion used to verify how well an instrument is working. It can roughly be described as the smallest amount of an element or molecule that can be reliably (statistically) measured.
Dilution FactorA value indicating how much a particular sample has been diluted so that the concentration will appear lower. An additional multiplicand in the calculation of Calculated Concentration. It is also used to compute the concentration of standards that determine the regression curve.
DynodeA component of channel electron multipliers (CEM); the structure used to amplify an ion signal. In other multipliers there can be several discrete dynodes.
95

Glossary API 4000™ LC/MS/MS System Hardware Manual
ElectrospraySoft API technique, also known as Ion Evaporation. Functions by producing a mist of charged droplets containing analyte ions. The ions are ejected as the solvent evaporates and the droplets shrink.
Elemental CompositionThe type and number of atoms that make up the analyte, for example, C2H6O indicates two carbon atoms, six hydrogen atoms, and one oxygen atom. Note that this doesn’t indicate the arrangement of the atoms, which determines the chemistry: C2H6O can be ethyl alcohol (C2H5OH) or dimethyl ether (CH3OCH3). Given the accurate mass, the application software can determine the combinations of atoms that could generate this mass within a given tolerance.
EluteThe appearance of an analyte from a chromatographic column. See Chromatography.
Equilibration TimeThe time required for an LC column to stabilize after the solvent composition has been changed, for example, at the end of a gradient when the initial conditions are restored.
Excess VolumeThe extra volume of sample drawn up during an autosampler sampling operation. In the Fixed Loop Mode, the sample volume drawn up is already ten times the loop volume. The excess volume is then added to that volume.
Expected Retention Time (RT)The anticipated time of the peak for the analyte in question. This parameter is used when the analyte is expected to peak slightly earlier or slightly later than usual.
ExperimentA sequence of measurements for the mass spectrometer that are all of the same scan type. One or more experiments can be grouped to make a cycle. One or more cycles comprise a period. See also Cycle and Period.
Exponential Adjusted RatioThe ratio of the height of the precursor ion above its start point to the height of the product ion above the same point. This ratio must be greater than the set value for the product peak to be skimmed.
96

API 4000™ LC/MS/MS System Hardware Manual Glossary
Exponential Peak RatioThe ratio of the baseline-corrected height of the precursor peak to the baseline-corrected height of the product peak. Used to determine whether an exponential skim line will be used to calculate the area of a product peak eluting on the trailing edge of a precursor peak.This ratio must be greater than the set value for the product peak to be skimmed. To disable exponential skimming throughout a run, you can set this parameter to its maximum value (1 x 10⁶).
Exponential Valley RatioThe ratio of the baseline-corrected height of the product peak to the height of the valley between the precursor and product peaks above the baseline. Used to determine whether an exponential skim line will be used to calculate the area of a product peak eluting on the trailing edge of a precursor peak.This ratio must be less than the set value for the product peak to be skimmed.
Extracted Ion Chromatogram (XIC)An ion chromatogram created by taking intensity values at a single, discrete mass value or a mass range, from a series of mass spectral scans. It indicates the behavior of a given mass or mass range as a function of time.
Flow Injection Analysis (FIA)A method of acquiring data that does not use a chromatographic column, such as Liquid Chromatograph (LC) to separate components; for example, a syringe pump. Its primary advantage over LC is speed, but it lacks the ability to separate mixtures.
Flush SpeedThe speed at which the autosampler flush syringe picks up buffer from the buffer reservoir and ejects it through the sample needle.
Flush VolumeThe volume of flush liquid used for each cycle during the pre- and post-injection flush operation of an autosampler.
Full ScanA method of running a mass spectrometer so that the intensities of ions in a given range of masses are acquired. This method is used to obtain maximum information about a sample (as opposed to a targeted analysis whereby only specific masses are acquired).
97

Glossary API 4000™ LC/MS/MS System Hardware Manual
Good Laboratory Practises (GLP)Good Laboratory Practises (GLP) is a set of guidelines that many analytical laboratories follow to ensure that the data quality is high and the results can be used elsewhere. One aspect of GLP is that all information necessary to reacquire or reprocess a sample be saved with the data file.When GLP guidelines are used in conjunction with computerized labs, they are referred to as Good Automated Laboratory Practises (GALP).
GradientVarying the composition (mixture of solvents) flowing through an LC column over time so that separation is quicker and peak shape is retained.
Gilson Serial Input/Output Channel (GSIOC)Proprietary name for Gilson RS-485 interface used to communicate between Gilson devices.
Hardware ProfileA logical representation of the devices and instruments used in a system and their associated configuration parameters.
HistogramA graph of the frequency distribution of masses found in each scan. The horizontal axis represents the scans over time and the vertical axis represents the number of specific masses found in each scan.
Inject Delay TimeThe autosampler delay time between loading the sample loop and injecting the sample. The LC pumps will remain in the standby condition until the delay time is up. It is a useful parameter when the pump does not have an equilibration step.
Injection VolumeThe volume of sample injected by the autosampler syringe.
Instrument Station (IS)A computer that has a mass spectrometer connected to it.
IntegrateIn Quantitation, the process of determining the height and area of a given peak of interest.
Internal StandardA compound that is added at a known concentration to every sample in a quantitation batch. Quantitation is based on the ratio of the analyte response to the internal standard response. Overcomes variation in the MS response.
98
API 4000™ LC/MS/MS System Hardware Manual Glossary
IonSpray™ SourceA variant of an Electrospray that uses a Nebulizer gas to improve the formation of droplets. Useful at higher flows and higher aqueous contents.
IsotopeA form of an atom that has additional neutrons compared to the normal form, for example, 13C has one more neutron than 12C. The extra neutron(s) affect the mass of the atom but do not change the chemistry. Isotopes occur in nature and can be stable or radioactive. The mass spectra of organic molecules show groups of peaks with a spacing of 1 amu because of the incorporation of 13C in place of 12C. This spacing can be used to reveal the charge state; since the MS actually measures mass-to-charge the spacing is 1 amu if the charge state is one, 0.5 if the charge state is 2, 0.33 if the charge state is 3, etc.
Liquid Chromatography/Mass Spectrometry (LC/MS)The combination of a liquid chromatography system with a mass spectrometer.
Laboratory Information Management System (LIMS)A database tailored to the needs of chemical analysis laboratories. Widely used to maintain sample logs, generate lists of samples for analysis, and to store and process results.
Liquid Chromatography (LC)A method of separating analytes in solution, including organic and nonorganic compounds, in which the stationary and mobile phases are both liquids. The stationary phase is normally supported by a solid packing material.
LC ColumnName given to a tube containing the stationary phase for LC. Widely available in standardized diameters: 4.6, 2.1, 1, 0.5, 0.32, and 0.18 mm.
Lock MassA mass peak in a spectrum that corresponds to a compound of known mass (mass standard). Used post-acquisition to adjust the mass calibration for the scan so that other mass peaks may be accurately measured.
Logged InYou are logged in to an instrument when you have used your user ID and password to access an instrument directly from the instrument station. When you access the instrument station remotely, you are attached to the instrument.
Loop ModeThe Loop Mode is a flag that specifies whether the autosampler sample injection loop should be filled completely with sample or not.
99

Glossary API 4000™ LC/MS/MS System Hardware Manual
Manual TuningThe user adjusts the values of instrument parameters interactively during data acquisition in order to optimize the peak shape and sensitivity of the mass spectrometer.
MassMass spectrometer users measure mass in a variety of ways:• Exact mass: The mass of an ion calculated according to the number of atoms in the
molecule and the exact mass values for each atom, e.g. H (hydrogen) = 1.0078246, C (carbon) = 12.00000, O (oxygen) = 15.99419, etc.
• Nominal mass: The mass calculated by rounding the mass of each element to the nearest integer, e.g. H = 1, O = 16, etc.
• Mono-isotopic mass: The mass calculated using the mass of the most abundant isotope of each element present. For organic ions the most abundant isotope is also the isotope of lowest mass. In very large molecules the peak corresponding to the mono-isotopic mass may be small or invisible.
• Average mass: The mass calculated using the isotopically weighted mass of the elements, for example, carbon has two stable isotopes with masses of 12.000000 (98.9%) and 13.010000 (1.1%); the average mass of carbon is taken as 12.011. The difference between the mono-isotopic and average mass increases as the mass of the molecule increases.
• Accurate mass: The mass measured by the mass spectrometer when operated to achieve the best accuracy. This generally requires a high resolution instrument and an internal mass standard (reference compound).
Mass ChromatogramChromatographic display obtained by plotting the intensity of an ion (m/z value) or summed range of ions versus the time or scan number.
Mass DefectThe difference between the exact and nominal (nearest integer) mass of an ion. Used in peak hopping mode to adjust values entered as integers to masses that will cause the mass spectrometer to detect the tops of the mass peaks. Requires some knowledge of the type of compound being analyzed (also known as mass deficiency). See Mass.
Mass Range TableThe Mass Range is a set of mass values to be scanned by each quadrupole. For continuous scans it is defined as a triplet (Start Mass, Stop Mass, Step). For zero-width scans it is defined as Mass Point values.Each quadrupole (Q1 and Q3) has its own set of Mass Ranges to be scanned.
Mass Spectrometer (MS)An instrument in which ions are analyzed according to their mass-to-charge (m/z) ratio and in which the number of ions at a given mass value (intensity) is determined electrically. Also used to measure the mass values of the ions (see Accurate Mass).
100

API 4000™ LC/MS/MS System Hardware Manual Glossary
Mass SpectrumObtained when ions are separated according to the mass-to-charge (m/z) ratios of the ionic species present. This plot is a graphical representation of measured abundance information versus m/z.
Mass-to-Charge Ratio (m/z)The quantity actually measured by a mass spectrometer. A compound with a mass of 1000 and a single charge has the same mass-to-charge ratio as a compound with a mass of 2000 with two charges. The mass can be calculated if the number of charges can be determined.
MatrixHost material in which the analyte resides. Can be: solvent, digestant (usually acids), concomitants, impurities; elements, molecules, compound(s), and so on, in the sample that are not of interest to the analyst.
Multiple Channel Acquisition (MCA)Simultaneously acquires MS data from more than one channel.
Multiple Ion (MI)Mode of operating a mass spectrometer so that a number of individual ions are monitored and the intensities recorded (see Full Scan). Used for target compound analysis. See also Single Ion Mode (SIM).
Microtitre PlateAnother name for a “96-well plate” — a popular format of autosampler rack containing twelve columns and eight rows.
Multiple Reaction Monitoring (MRM)Mode of operating an MS/MS system such as a triple quadrupole so that an ion of given mass (a precursor) must fragment (dissociate) to give a product ion of specific mass in order for a response to be detected. Very specific analysis for target compounds.
MS MethodMass Spectrometer (MS) method. A data file or data acquisition method consists of one or more periods (see Period). A period spans a definite time duration. Each period consists of one or more experiments (see Experiment). For a data file that has two experiments, for example, the mass spectrometer alternates between them. For example, the first, third, fifth, and so on, spectra returned from the instrument will be experiment 1; the second, fourth, sixth, etc. will be experiment 2. Each experiment can consist of several mass ranges or Q1/Q3 pairs. A scan (see Scan) is a single mass spectrum returned by the instrument. Each experiment is acquired as a number of scans. In the example method above, experiment 1 consists of scans 1, 3, 5, 7, etc. and experiment 2 consists of scans 2, 4, 6, 8, and so on.
101

Glossary API 4000™ LC/MS/MS System Hardware Manual
MS/MSType of mass spectrometry in which there are two separate mass analyzer regions. Capable of operating in the normal, full scan and MI modes (using either analyzer), and in combined experiments where one mass (precursor) is selected in the first analyzer (Q1), fragmented in the collision cell, and the product ions analyzed by the second analyzer (Q3).
MWMolecular Weight
m/zMass-to-Charge Ratio
Needle LevelDetermines how far the autosampler needle goes into the sample vial. The value corresponds to a percentage of the total distance from the shoulder (top) of the sample vial to the bottom of the sample holder. For example, 0% is at the bottom of the sample vial and 99% is at the shoulder of the vial.
Neutral LossA mode of operating an MS/MS instrument so that the mass of the two analyzers differs by a constant value. A response will be observed if the ion selected by the first analyzer fragments by losing or gaining the mass difference.
Noise ThresholdThe minimum distance between two points to be considered the start of, or part of, a peak. Used to help the application software determine which points are noise and which are part of a peak.
Open Database Connectivity (ODBC)A general-purpose interface for database access. It is not tailored to any specific database so that a database created in any of several programs will have a similar application programming interface. ODBC is used for importing and exporting batch files.
OptimizationThe process of optimizing instrument parameters (for example, by trying various settings, you find the best settings for the nebulizer gas, curtain gas, orifice, focusing ring, and so on) so that instrument readings are accurate and consistent.
Parameters Scanned with MassMass spectrometer tuning parameters that are to be varied depending on the mass being detected.
102

API 4000™ LC/MS/MS System Hardware Manual Glossary
Photo Diode Array Detector (PDA)A common detection system for LC. Measures the ultraviolet adsorption spectrum of eluting compounds. A UV detector that monitors one or more specific wavelengths. Also known as Diode Array Detector (DAD).
Peak HoppingMode of operating a mass spectrometer in which large steps (for example, 1 amu) are made rather than smaller steps (for example, 0.1 amu). Has the advantage of speed since less data steps are made, but with the loss of peak shape information. See also Mass Defect.
Pending QueueA list of data acquisition batches that have not cleared the validation checks and are pending.
Performance QualificationA process of ongoing instrument performance control and verification that requires the use of analytical methods similar to those used for the analysis of unknown samples.
PeriodAn analysis that is performed for a specific length of time or number of cycles. A period consists of one or more cycles or sequential groups of experiments performed during a period. A period cannot be defined inside another period. See also Experiment and Cycle.
PolarityDetermines the polarity of the ions created by the ion source and detected by the analyzer. Switching the parameter between positive and negative requires the instrument power supplies to switch polarity.
Post-Inject FlushesThe number of flush cycles performed by the autosampler after the sample is injected.
Precursor IonAny ion (including negatively and doubly charged ions) that gives fragments. See Collision Activated Dissociation (or Decomposition) (CAD), Product Ion, and Collision Cell.
Pre-Inject FlushesThe number of autosampler flush cycles before sample is injected.
Product IonThe electrically charged ion resulting from CAD of a particular precursor ion. The reaction need not necessarily involve fragmentation, just a change in the number of the charges carried. All fragment ions are product ions, but not all product ions are fragment ions.
103

Glossary API 4000™ LC/MS/MS System Hardware Manual
PublishTo send the contents of a pane, window, or workspace to a delimited or formatted ASCII file. This file can later be used in other applications.
Q1/Q3 Mass Calibration TableContains pairs of DAC and mass peak values, used to calibrate the Q1/Q3 quadrupole. The Acquisition Method Editor can only read the values in this table. Another component, namely Tune, is able to modify the entries in this table. The Q1/Q3 Mass Calibration Table is contained in a file. The Mass Spectrometer Method Editor displays the name of the file and allows the user to select another file that stores a Q1/Q3 Mass Calibration Table.
Q1/Q3 Resolution TableDefines resolution offsets for the Q1/Q3 quadrupole.
Quadrupole AnalyzerAn array of four metal-coated rods arranged at the corners of a square and connected to RF and DC power supplies. At an appropriate RF/DC ratio, ions with a single m/z value are transmitted by the array and can be detected, while all others are lost or deflected.
Quality Control (Quantitation)A sample added to a batch to estimate the data quality and accuracy of unknown samples in the batch. The QC sample has a known concentration but is treated as an unknown so that the measured concentration can be compared to the actual value.
Quantitative MethodA recipe for telling the software the retention time and masses for the compounds being introduced.
Quantitative OptimizationQuantitative Optimization automatically generates and optimizes a data acquisition method for quantitative analysis. This includes determining the mass (or masses) to be measured as well as the parameters that give the best response.
Reagent GasGas used in CI or APCI to create reagent ions that then ionize the analyte.
Regression Fit (Quantitation)Specifies the type of regression analysis to be applied to the data. Choices include linear, linear through zero, quadratic, mean response factor, and none.
Regression Weighting (Quantitation)Specifies the weighting to be applied to the data for regression calculation. Choices include 1/x, 1/x2, 1/y, 1/y2, and none.
104

API 4000™ LC/MS/MS System Hardware Manual Glossary
Relative Retention Time (Quantitation)Analyte Retention Time divided by Internal Standard Retention Time. Used to correct excessive peak shifts.
Replicate InjectionsThe number of injection cycles to be repeated in an autosampler injection step.
Representative Sample (Quantitation)The sample upon which the method is to be based.
ResolutionThe ability of a device (mass spectrometer or chromatograph) to separate closely spaced components.
In MS, usually based on peak width, that is, , where M = mass and ΔM = full width at half height.
Results FileA summary of the information obtained from a series of data files in a format that pertains to the user’s problem at hand, that is, not simply raw spectral intensities.
Retention Time (RT)The time of appearance (elution) of a component from a chromatographic system. Can be measured as the point with highest intensity or as the apex of a parabola fitted to the three highest points of the analyte peak.
Retention Time (RT) WindowAmount of time allowed on either side of the retention time for peak-finding. For example, you might use an RT Window of 30 seconds to add 15 seconds on to each end of the expected retention time. Therefore, if a peak expected at 55 minutes appears at 60 minutes, it would still be found by the software.
SampleA sample is a quantity of a substance that is introduced into the mass spectrometer for analysis. A sample may contain several component elements, including a solvent.
Sample Dependent ExperimentThe ability to vary an analytical method for individual samples. The analytical parameters are known before the sample is injected. A data-dependent experiment where the parameters are determined during the analysis. Can involve the use of a template method for all samples with the parameters being adjusted as required.
Sample DetailsDetails of a single sample in the Queue.
MMΔ
105
Glossary API 4000™ LC/MS/MS System Hardware Manual
Sample SpeedThe speed at which the autosampler syringe picks up and dispenses.
Sample TypeThere are six sample types:• blank• standard• QC• solvent• double-blank• unknown
ScanA single mass spectrum returned from the instrument. Each experiment consists of a number of scans.
Scan SpeedThe rate at which spectra can be acquired. Often used to indicate the duration of a scan (that is, the time taken to scan a given mass range or monitor each ion in a series once).
Scan Type (Quadrupole Analyzer)A means of operating the instrument that implies the configuration of the quadrupoles, that is, the resolution for each of the quadrupoles and which quadrupole is analyzing and which is tracking. Additional information on scan types is available in the Help.
ScriptRelatively simple program that is used to analyze data files. For example, Visual Basic or Java scripts do this.
Selected Ion Monitoring (SIM)Mode of operation of a mass spectrometer in which the ion currents at one (or several) selected m/z values are recorded, rather than the entire mass spectrum. See also Multiple Ion (MI).
Semi-Automatic MethodA fully functional method created within the Batch Editor. This type of method does not have a representative sample associated with it (because it was created pre-acquisition and therefore does not have the sample peaks verified). This type of method is useful for speeding up the quantitation process, but you are more likely to need to reintegrate samples than when using a full method (since it may have more trouble finding the correct peak).
SensitivityThe degree of signal response to a given sample input.
106

API 4000™ LC/MS/MS System Hardware Manual Glossary
Separation Height RatioThe ratio of the height of the valley between peaks to the height of the smaller peak. Used to determine whether the peaks are separate or overlapped. If the ratio is less than or equal to the value in this field, the peaks are considered separate; if not, they are considered overlapped.
Separation Width RatioThe ratio of the distance between the end of the first peak and the start of the second peak to the width of the second peak at its base. Used to determine whether peaks are separate or overlapped. If the ratio is greater than the value in this field, the peaks are considered separate; if not, they are considered overlapped.
SetA single sample or multiple samples with the same acquisition and quantitative methods.
Single Ion Mode (SIM)A mode of running a mass spectrometer so that only certain expected masses are acquired (contrast with Full Scan).
Single Quadrupole AnalysisSingle quadrupole analysis detects a single compound, which is the only one that resonates at the frequency required to pass through the spectrometer. Single quadrupole analysis is generally used when the existence of another compound of the same mass (in the same sample) is extremely unlikely.
SmoothTo flatten jagged areas on a peak. Smoothing eliminates the noise created by mini-peaks on a larger peak. When a peak is smoothed, the area stays roughly the same (the height changes but so does the width). Smoothing is done gradually so that each smooth would slightly flatten the jagged areas, thus several smoothings might be necessary to achieve the desired result.
Standard Operating Procedure (SOP)A prescription that describes in detail the steps that must be followed to acquire and process a particular set of samples or operate the instrument.
Specific, SpecificityThe ability of an analytical technique to distinguish between different analytes. MS is far more specific than UV detection; LC is far more specific than FIA.
Standby ModeWhen the instrument is not in use and is put into a low energy state to conserve gases and electricity.
107

Glossary API 4000™ LC/MS/MS System Hardware Manual
Standard SampleA sample that contains a known concentration of analyte. Used to generate a calibration curve. Compound or mixture of known masses used to calibrate a mass spectrometer or as a lock mass.
TemplateA set of instructions that describes how the application software will print or publish a given pane, window, or workspace. Includes header and footer formatting and contents as well as file type (for publishing).
Template MethodAn acquisition method in which the mass values are undefined. The masses are supplied at the time the sample is to be acquired.
Time PeriodA specified length of time.
Total Ion Current (TIC)A measure of the number of ions entering a mass spectrometer.
Total Ion Chromatogram (TIC)A chromatographic display generated by plotting the intensity of all ions in a scan versus time or scan number.
Triple Quadrupole AnalysisTriple quadrupole analysis first detects a single compound (as with the single quadrupole); it then splits the compound to determine the mass of the compound's two parts. Triple quadrupole analysis, also known as Multiple Reaction Monitoring (MRM), is used to increase the sensitivity of the analysis so that compounds having the same mass can be distinguished from one another.
TurboIonSpray® SourceA variant of IonSpray source in which heating is used to further increase the allowable flow rate and aqueous content.
UltraViolet (UV)Frequently used to refer to a type of detector common in LC.
ViewerA simple program used to view the results of an analysis of a series of data files. Viewers will be specific to the problem at hand and may run either as a standalone application or as Java applets embedded in a Web page.
108

API 4000™ LC/MS/MS System Hardware Manual Glossary
Warm-up TimeThe time that the system takes to stabilize after it has been idle for some time.
Web-based Information Management System (WIMS)The Web-based version of a Laboratory Information Management System (LIMS).
Working ParametersContains the values of the mass spectrometer parameters used in a particular experiment. Working parameter files are accessed and maintained by the Tune component of the software.
WorkspaceThe preferences, settings, and locations of open windows and files that are in use are defined as a workspace.
109

Glossary API 4000™ LC/MS/MS System Hardware Manual
110
API 4000™ LC/MS/MS System Hardware Manual Index
IndexAAC power distribution 47adjusting the ion source probe
APCI 71TIS 65
analog gas flow controller 37APCI probe
components 70features 60inlet description 70optimizing 72optimizing position 74optimizing voltage 75overview 24preparing 70replacing 77warming up 73
AUX I/O bus 50
Bbacking pump exhaust 29books, references 20bus
AUX I/O 50IEEE-488 49RS-232 50
CCAD gas
flow 37supply 29
CAD process 15CEM 45choosing an ion source probe 60collision cell 43collisionally activated
dissociation 15communications ports 49components
APCI probe 70TIS probe 64
compound-specific parameters, setting 19
consumables 89control panel 47control sequence, gas 38controller, vacuum gauge 36controlling, ion source
temperature 76corona discharge characteristics
72curtain gas
flow 37interlocks 39supply 29
curtain plate 44
Ddata system 17, 49DC power distribution 47deflector 44, 45detector 44differentially pumped interface 31
Eelectronics box 48eliminator, mist 35elucidation, structural 16entrance optics 32exhaust
backing pump 29waste out 29
exit lens 44
Ffeatures
APCI probe 60TIS probe 60
feedthroughs, vacuum 43fragmenting
precursor ions 14product ions 15
Ggas
ballast valve 34control sequence 38control system 36curtain 29curtain interface 30source exhaust 29vacuum panel 28
Gas 1/Gas 2 29gas flow
CAD 37curtain 37nebulizer 38
gas flow controlleranalog 37solenoid 37
generic parametersAPI 4000 87
Hhardware
APCI probe 24ion source housing 25ion source probe adjustment 26LC pump 23overview 23sample introduction system 23TIS probe 24
IIEEE-488 bus 49inlet description
APCI probe 70TIS probe 64
installingion source 61ion source housing 61
instrument, warming up 54instrument-specific parameters,
setting 19interface
connections 49
111

Index API 4000™ LC/MS/MS System Hardware Manual
differentially pumped 31gas curtain 30vacuum 29, 34
interlockscurtain gas 39ion source 26safety 38
interquad lenses 16, 44ion count 16ion detector 45ion optics 44ion path chamber 42ion source
choosing probe 60housing 25installing 61interlocks 26preparing 55probe adjustment 26, 65, 71
ionization process 55ions
fragmentation 16precursor 16product 16
Jjournals, references 20
LLC pump 23lens, exit 44lenses, interquad 16, 44liquid chromatography, overview
13
Mmaintaining, ion source probe 76mass filter rail 42mass filters 43mass spectrometry
overview 13principles 14single quadrupole 14triple quadrupole 13, 15, 16
mist eliminator 35
Nnebulizer gas flow 38
Ooperating system 51operating tips, TIS 69optics, entrance 32optimizing
APCI probe 72APCI probe position 74APCI probe voltage 75probe temperature 75solvent composition 69, 75TIS gas flow 68TIS probe 66TIS probe position 67turbo temperature 69
orifice plate 44overview, hardware 23
Pparameters
compound-specific 18instrument-specific 18
parts, consumable 89power distribution
AC 47DC 47
power distribution module 47PPG Exact Mass Table 83precursor ions, fragmenting 14preparing
APCI probe 70ion sources 55TIS probe 64
principles, mass spectrometry 14probe components
APCI 70TIS 64
product ions, fragmenting 15pump
roughing 34turbo 33
pump-down sequence 39pumping system 33
Qquadrupoles
overview 43RF-only 16, 43single 14
Rreferences
books 20journals 20web sites 21
removingion source housing 76ion source probe 76
replacing APCI probe 77RF-only
quadrupoles 16quadrupoles and stubbies 43
roughing pump 34RS-232 bus 50
Ssafety interlocks 38sample introduction
principles 55system 23
sequencepump-down 39vacuum control 39vacuum off 41
setting parameterscompound-specific 19instrument-specific 19source-specific 19
signal handling board 45, 46software 50solenoid gas flow controller 37solvent composition, optimizing
69source exhaust supply 29source exhaust system 27source-specific parameters,
setting 19structural elucidation 16stubbies 43, 44support, technical 11
112
API 4000™ LC/MS/MS System Hardware Manual Index
syringe, for sample introduction 23
system electronics box 48system, data 17, 49
Ttables, PPG Exact Mass 83technical support 11TIS probe
components 64features 60inlet description 64operating tips 69optimizing 66optimizing the position of 67
turbo pumps 33turbo temperature, optimizing 69TurboIonSpray
optimizing probe position 67TurboIonSpray probe
components 64inlet description 64operating tips 69optimizing 66overview 24
turning on the instrument 53
Vvacuum control sequence 39vacuum control system 32vacuum feedthroughs 43vacuum gauge controller 36vacuum interface 29vacuum off sequence 41vacuum system 29valve, gas ballast 34ventilation 63
Wwarming up
APCI probe 73instrument 54
waste out exhaust 29web sites, references 21
113

Index API 4000™ LC/MS/MS System Hardware Manual
114